get to know your soils - what's newgarlicaustralia.asn.au/sites/default/files/garlic...
TRANSCRIPT
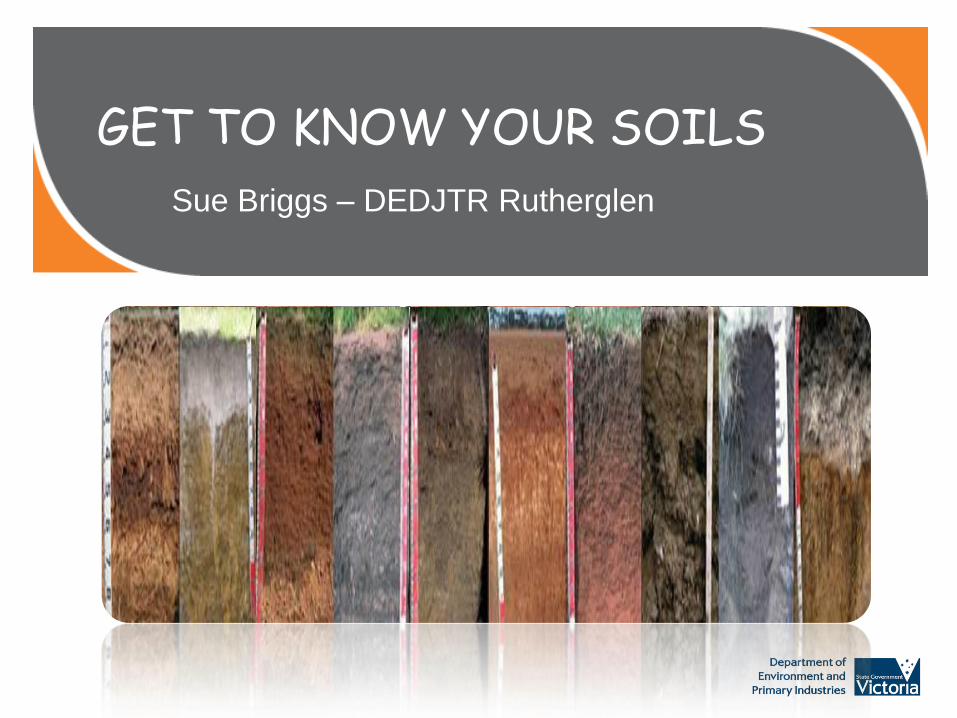
GET TO KNOW YOUR SOILS
Sue Briggs – DEDJTR Rutherglen
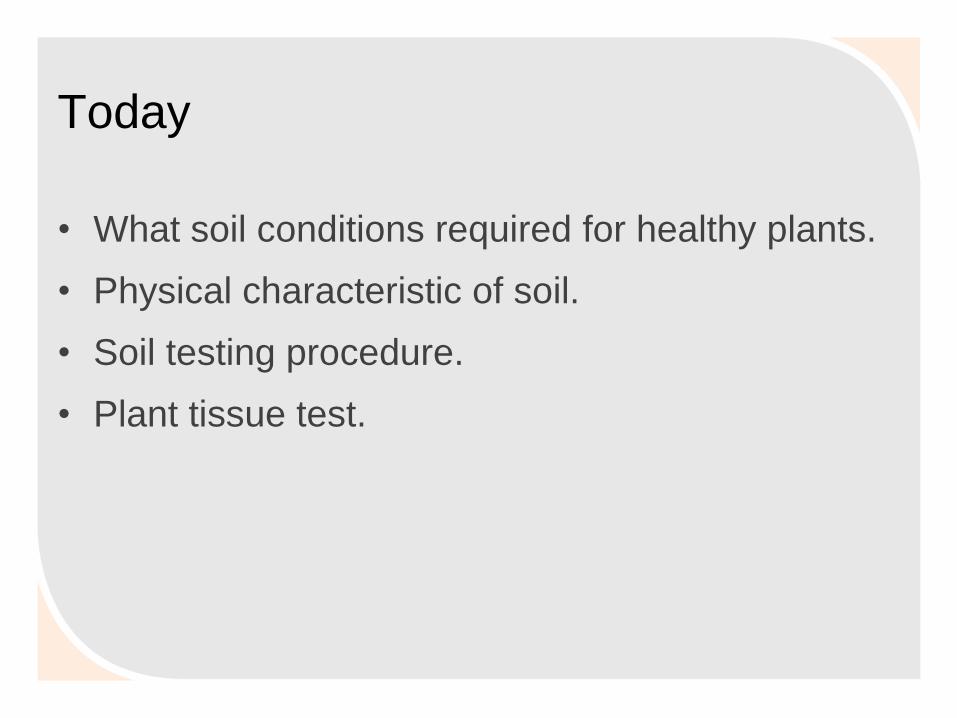
Today
• What soil conditions required for healthy plants.
• Physical characteristic of soil.
• Soil testing procedure.
• Plant tissue test.
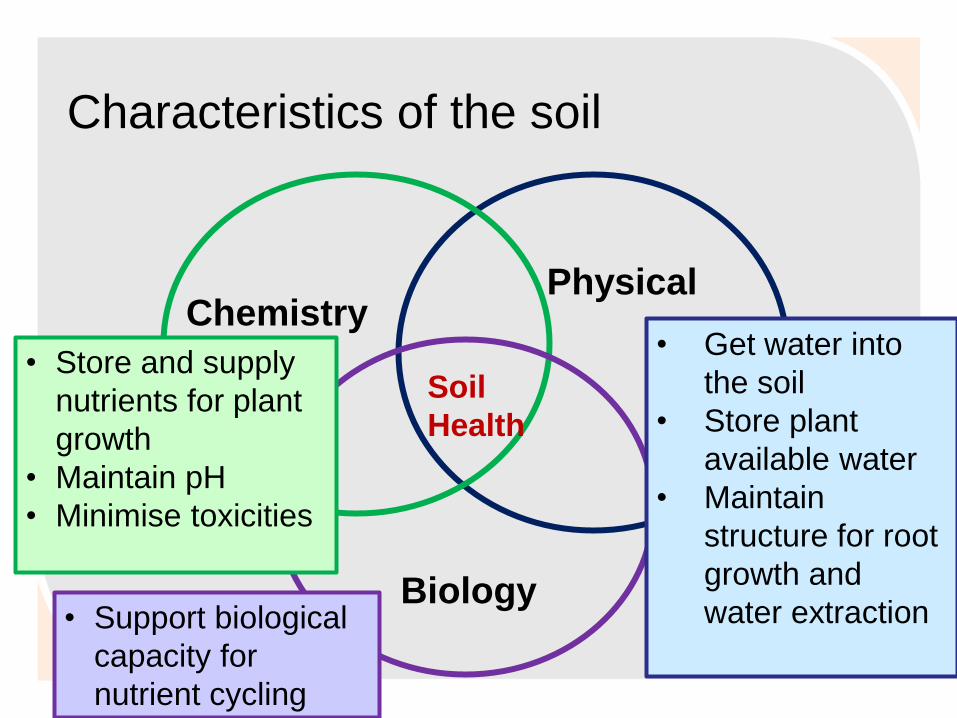
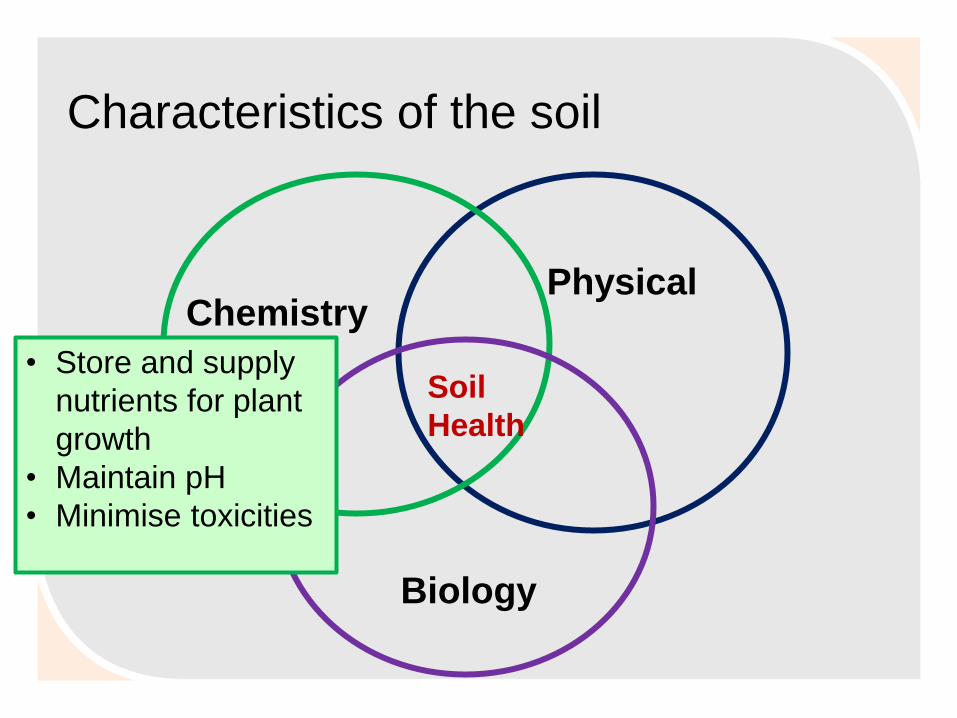
Characteristics of the soil
Chemistry • Get water into
the soil
• Store plant
available water
• Maintain
structure for root
growth and
water extraction
Biology
Soil
Health
Physical
• Store and supply
nutrients for plant
growth
• Maintain pH
• Minimise toxicities
• Support biological
capacity for
nutrient cycling
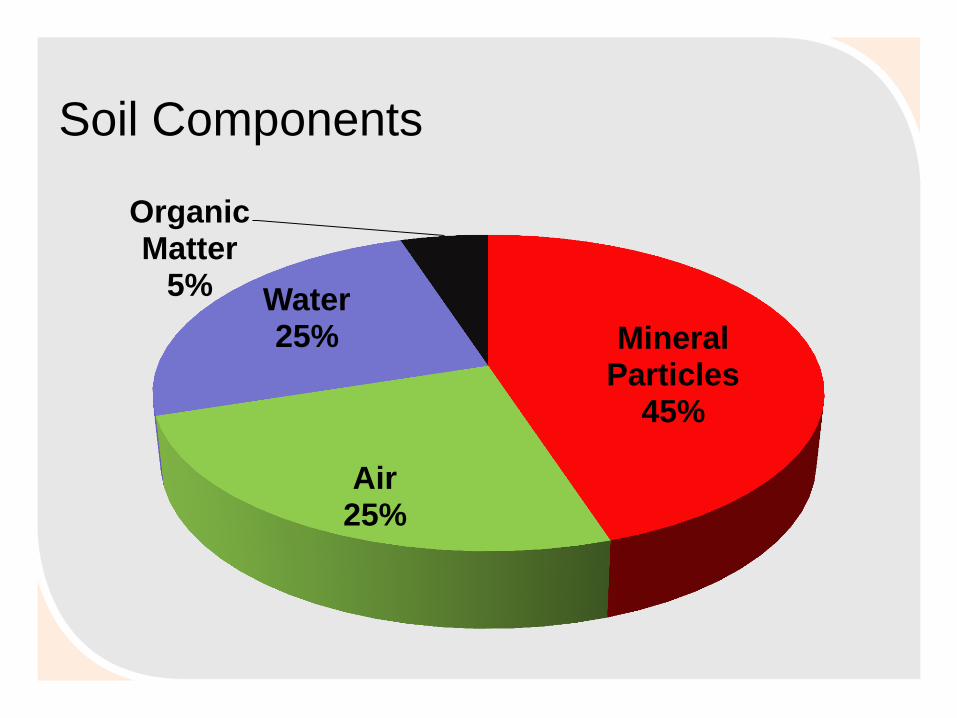
Soil Components
Mineral Particles
45%
Air 25%
Water 25%
Organic Matter
5%
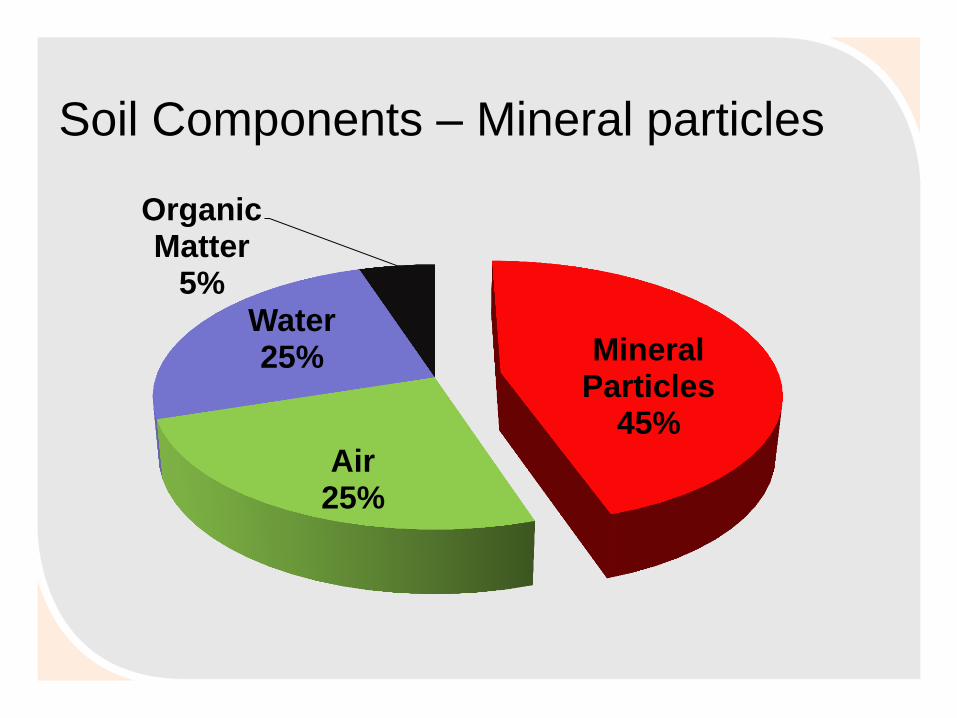
Soil Components – Mineral particles
Mineral Particles
45%
Air 25%
Water 25%
Organic Matter
5%
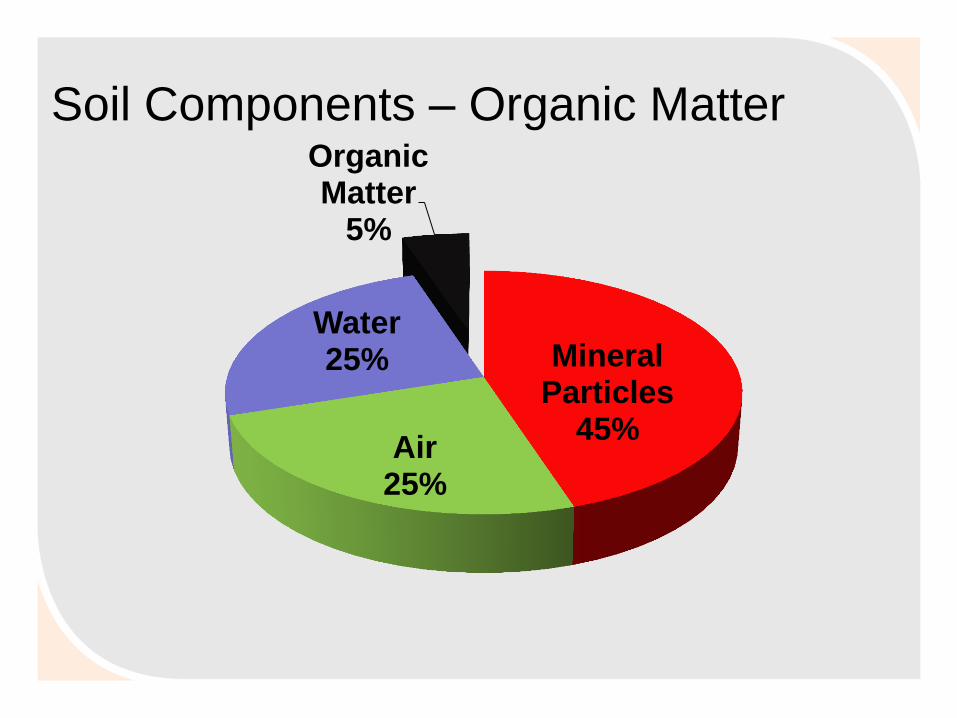
Soil Components – Organic Matter
Mineral Particles
45% Air
25%
Water 25%
Organic Matter
5%
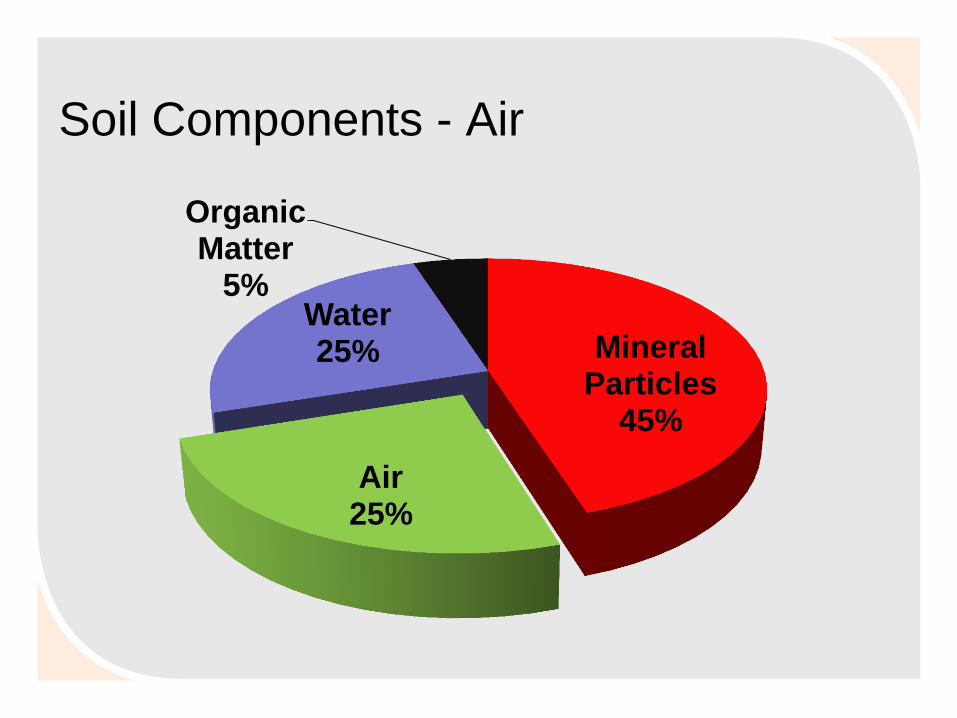
Soil Components - Air
Mineral Particles
45%
Air 25%
Water 25%
Organic Matter
5%
Australian soils
• Poor water storage capacity
• Salinity and sodicity
• Low nutrient availability
• Susceptibility to wind and water erosion
• Poor physical status of surface or sub soil
horizons
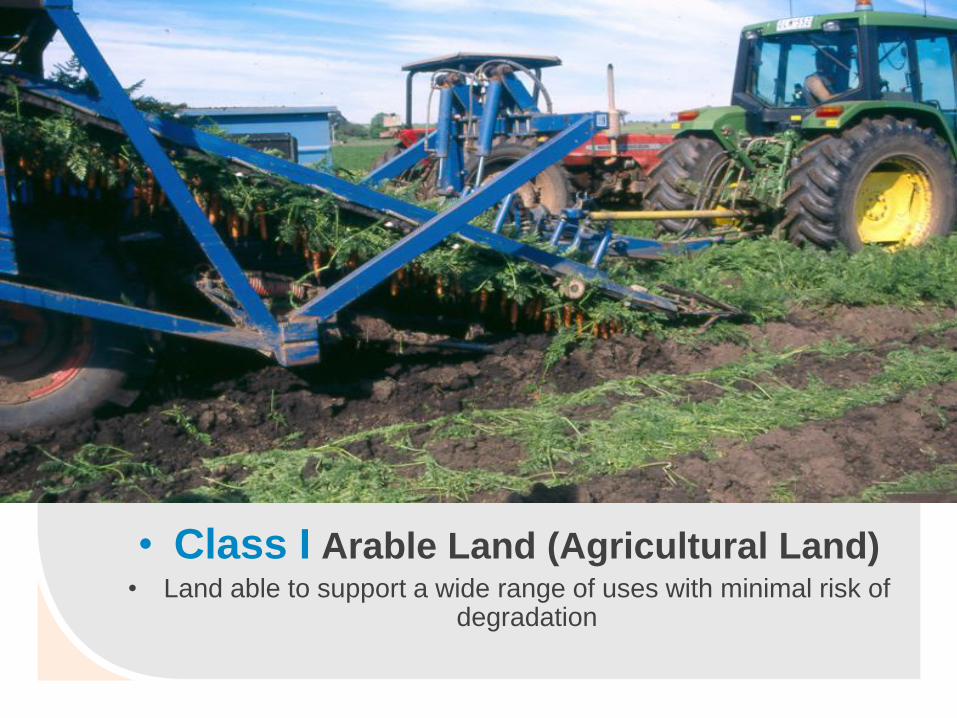
• Class I Arable Land (Agricultural Land) • Land able to support a wide range of uses with minimal risk of
degradation
Soil condition required for garlic
production
• Well drained soils
• Fertile soils (good levels of N,P,K,S)
• Soils high organic matter
• Prefer lighter soils (Sandy loam – loam) with OM
• Likes friable soil bed
• Prefers pH (CaCl2) between 5.5 – 7.5
• Any others!!!! (a lot of experts in the room)

Is this possible for my soil?
What should I look out for?
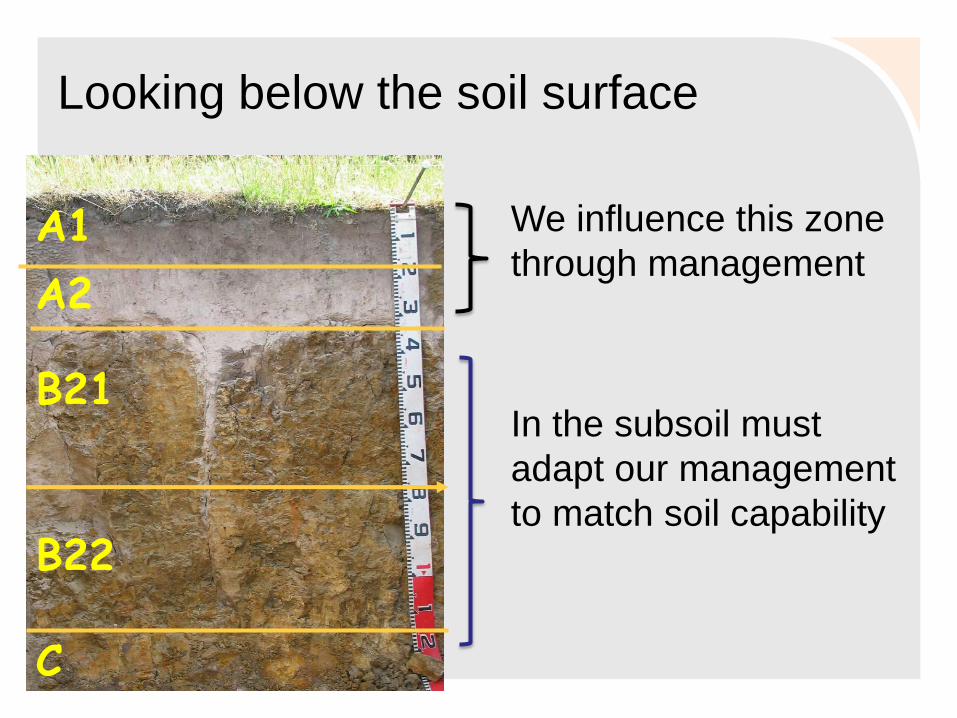
Looking below the soil surface
A1
A2
B21
B22
C
We influence this zone
through management
In the subsoil must
adapt our management
to match soil capability
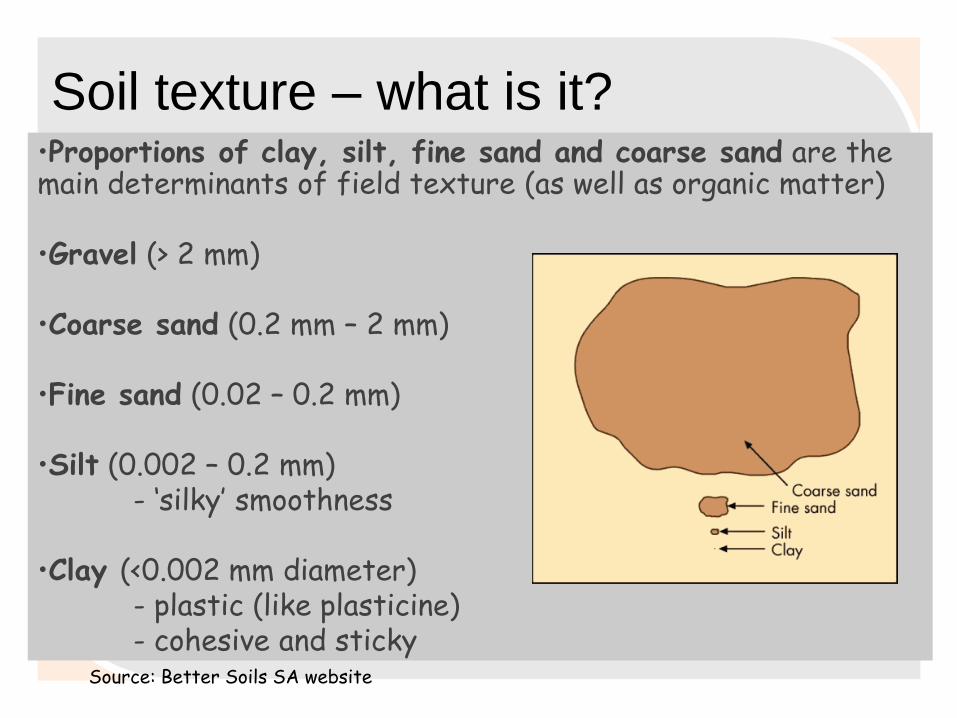
•Proportions of clay, silt, fine sand and coarse sand are the main determinants of field texture (as well as organic matter)
•Gravel (> 2 mm)
•Coarse sand (0.2 mm – 2 mm)
•Fine sand (0.02 – 0.2 mm)
•Silt (0.002 – 0.2 mm) - ‘silky’ smoothness
•Clay (<0.002 mm diameter) - plastic (like plasticine) - cohesive and sticky
Soil texture – what is it?
Source: Better Soils SA website
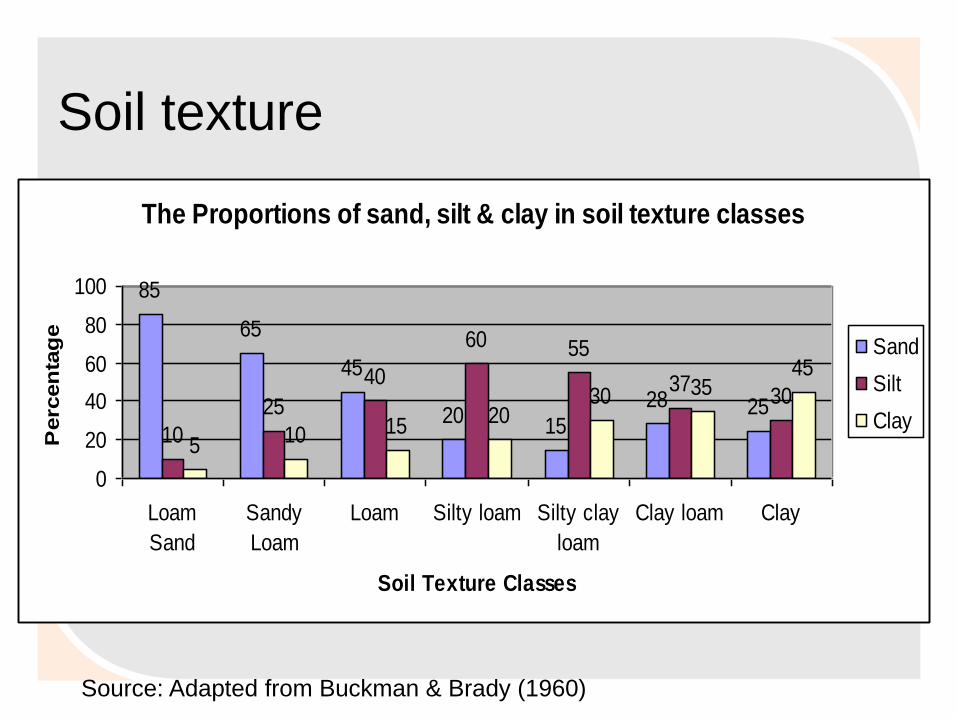
Soil texture
The Proportions of sand, silt & clay in soil texture classes
85
65
45
20 1528 25
10
25
40
60 55
3730
5 10 15 2030 35
45
0
20
40
60
80
100
Loam
Sand
Sandy
Loam
Loam Silty loam Silty clay
loam
Clay loam Clay
Soil Texture Classes
Perc
en
tag
e
Sand
Silt
Clay
Source: Adapted from Buckman & Brady (1960)
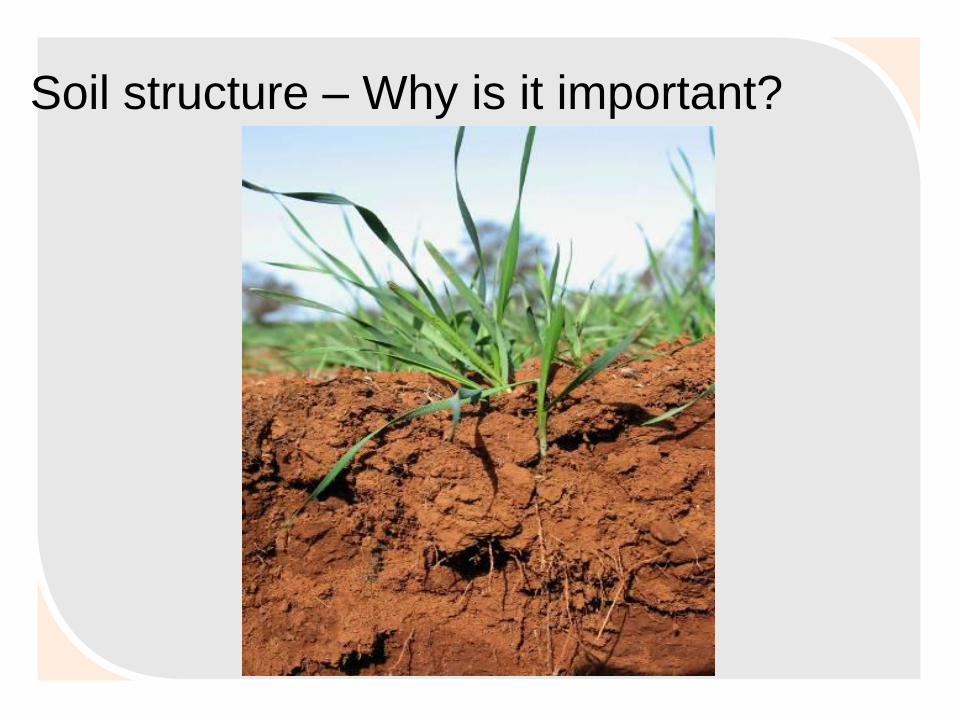
Soil structure – Why is it important?
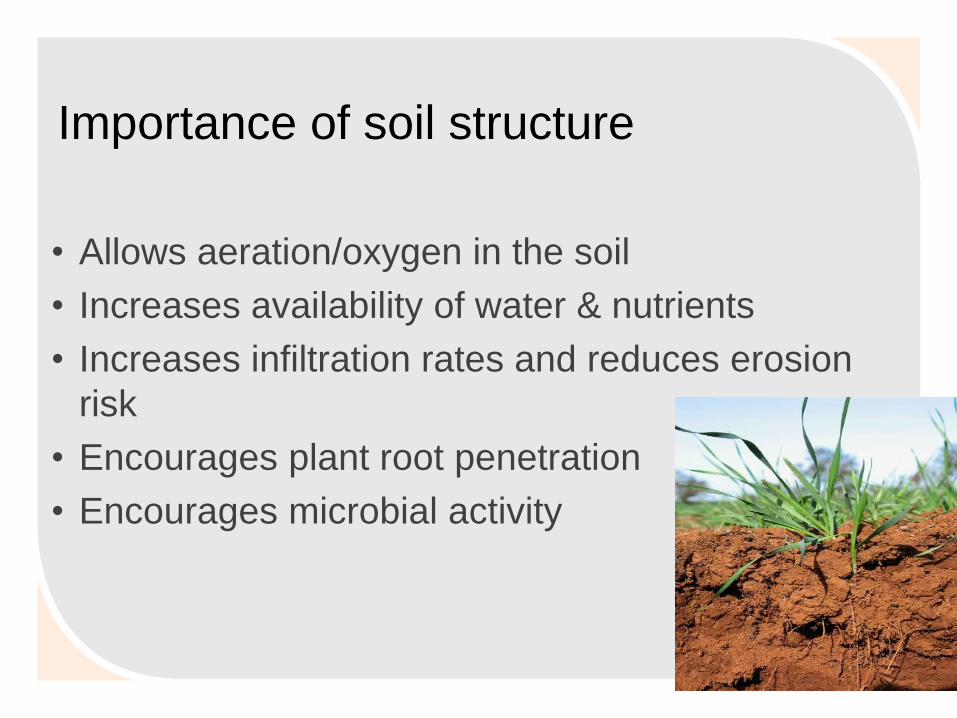
Importance of soil structure
• Allows aeration/oxygen in the soil
• Increases availability of water & nutrients
• Increases infiltration rates and reduces erosion
risk
• Encourages plant root penetration
• Encourages microbial activity
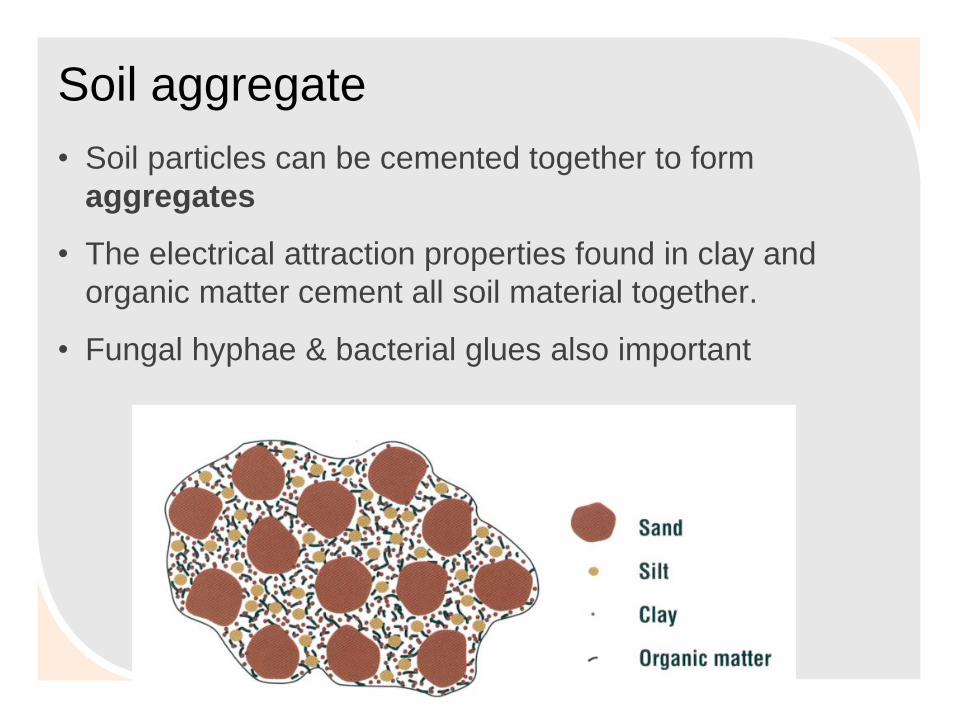
Soil aggregate • Soil particles can be cemented together to form
aggregates
• The electrical attraction properties found in clay and
organic matter cement all soil material together.
• Fungal hyphae & bacterial glues also important
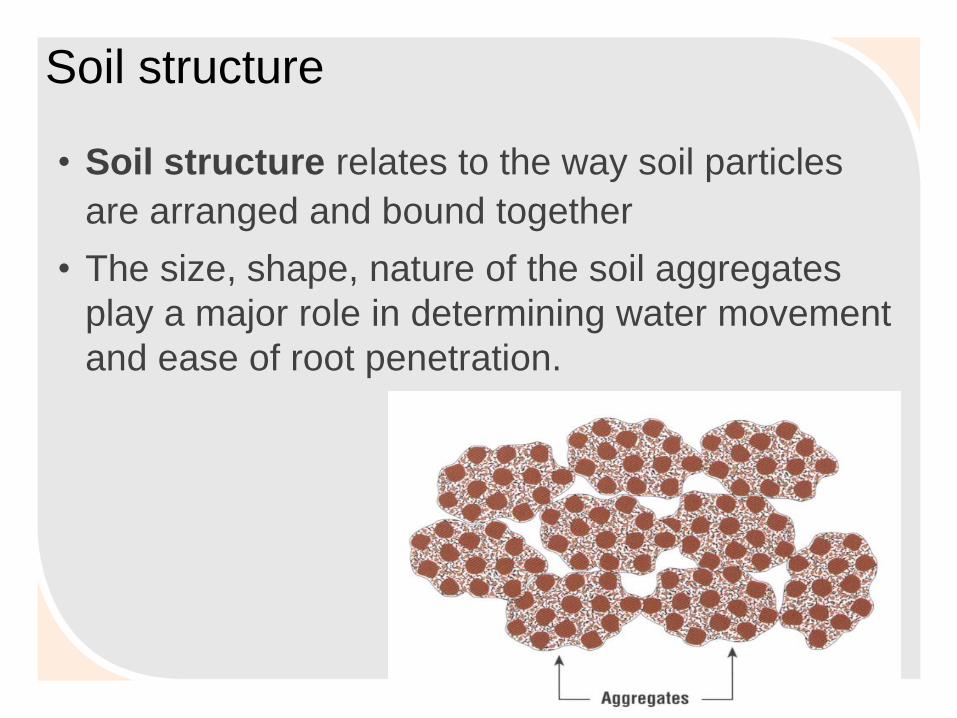
Soil structure • Soil structure relates to the way soil particles
are arranged and bound together
• The size, shape, nature of the soil aggregates
play a major role in determining water movement
and ease of root penetration.
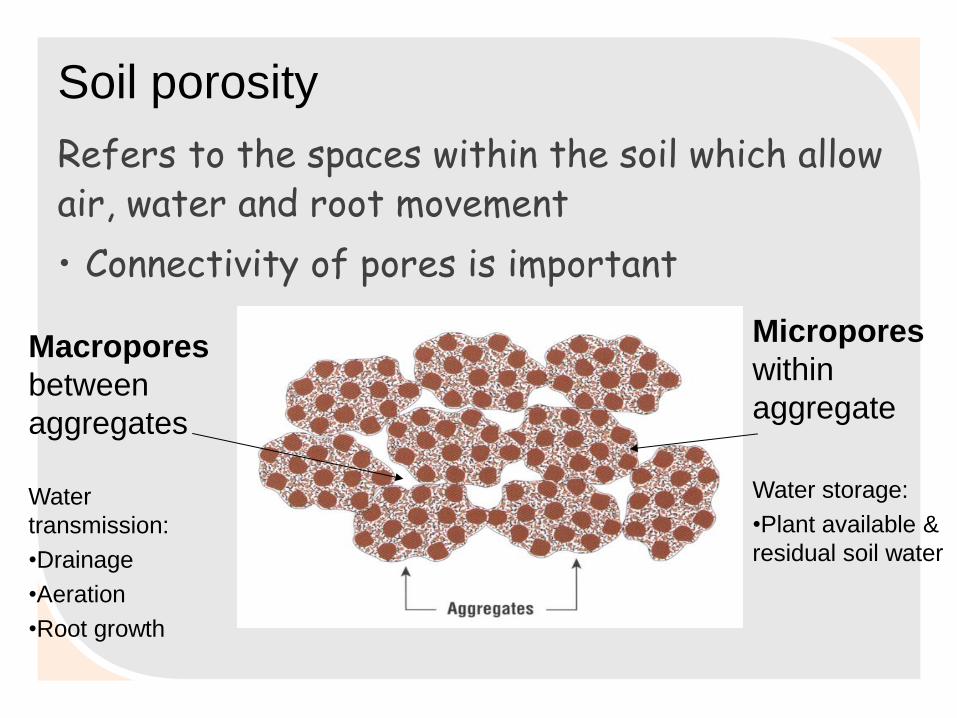
Soil porosity Refers to the spaces within the soil which allow air, water and root movement
• Connectivity of pores is important
Macropores
between
aggregates
Water
transmission:
•Drainage
•Aeration
•Root growth
Micropores
within
aggregate
Water storage:
•Plant available &
residual soil water
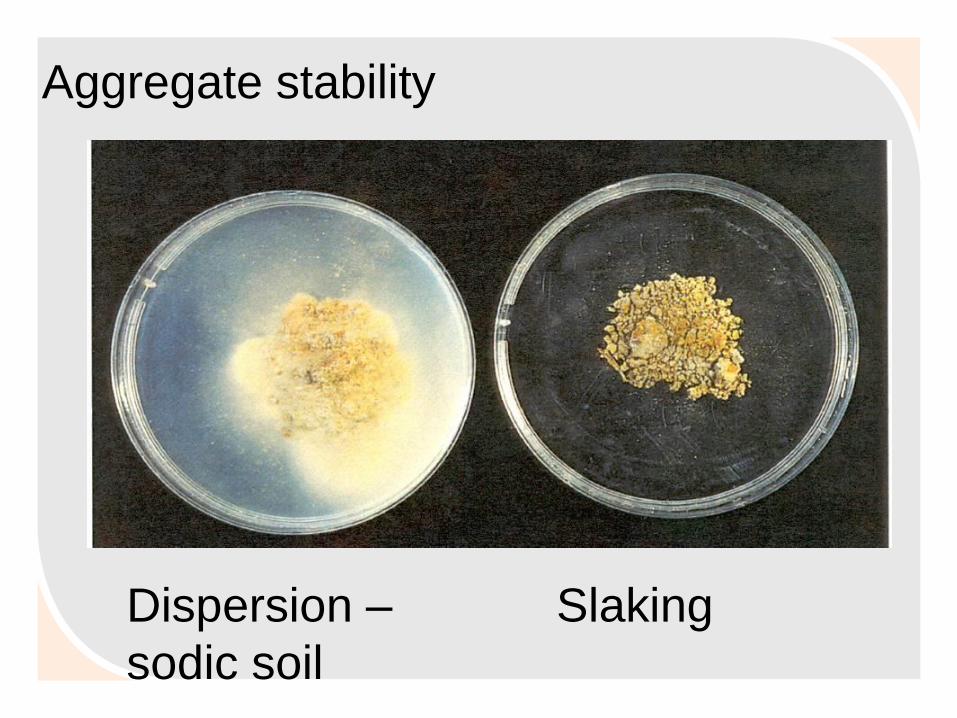
Dispersion –
sodic soil
Slaking
Aggregate stability
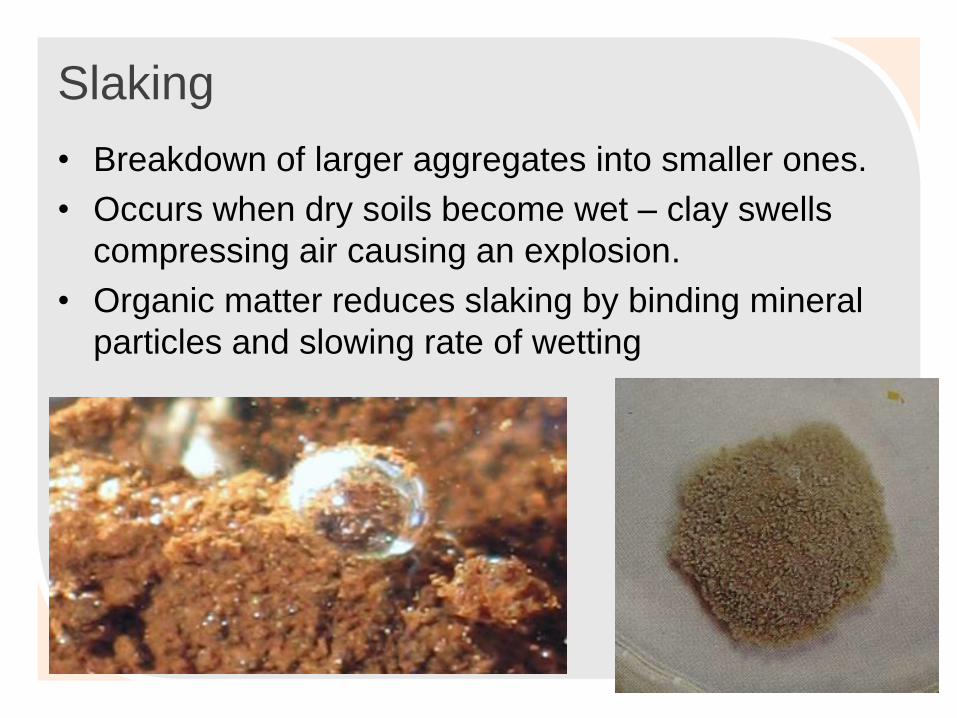
Slaking
• Breakdown of larger aggregates into smaller ones.
• Occurs when dry soils become wet – clay swells
compressing air causing an explosion.
• Organic matter reduces slaking by binding mineral
particles and slowing rate of wetting
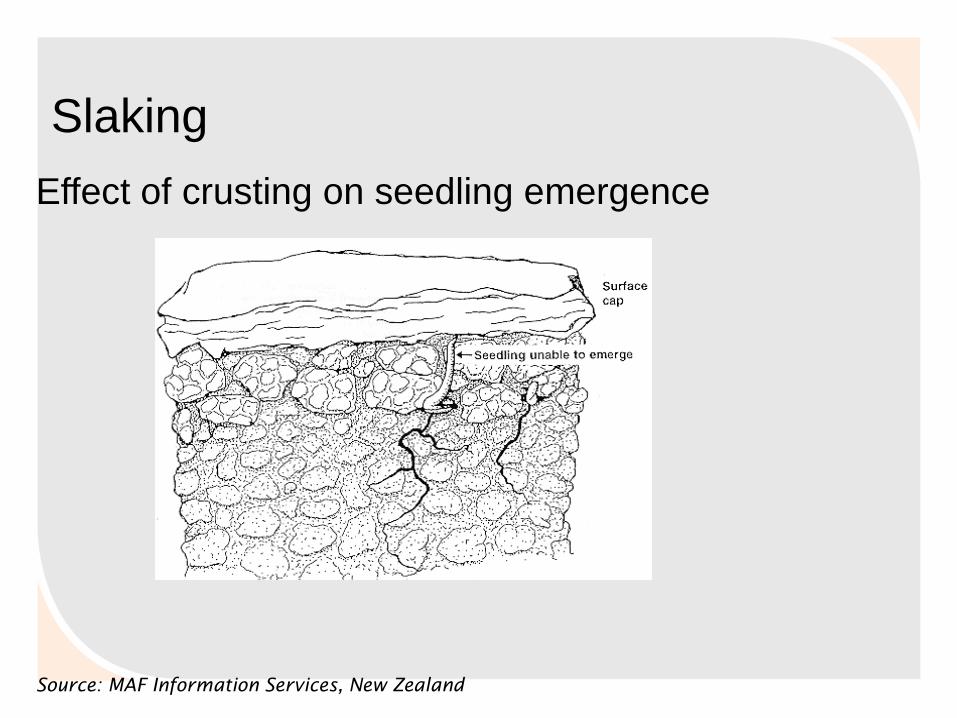
Slaking
Source: MAF Information Services, New Zealand
Effect of crusting on seedling emergence
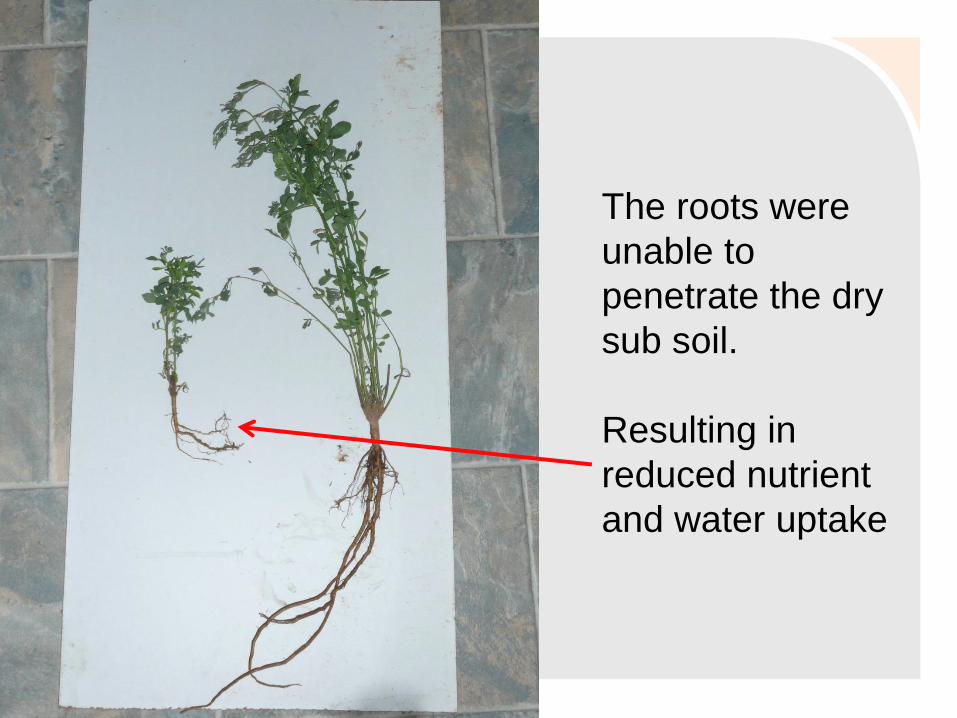
The roots were
unable to
penetrate the dry
sub soil.
Resulting in
reduced nutrient
and water uptake
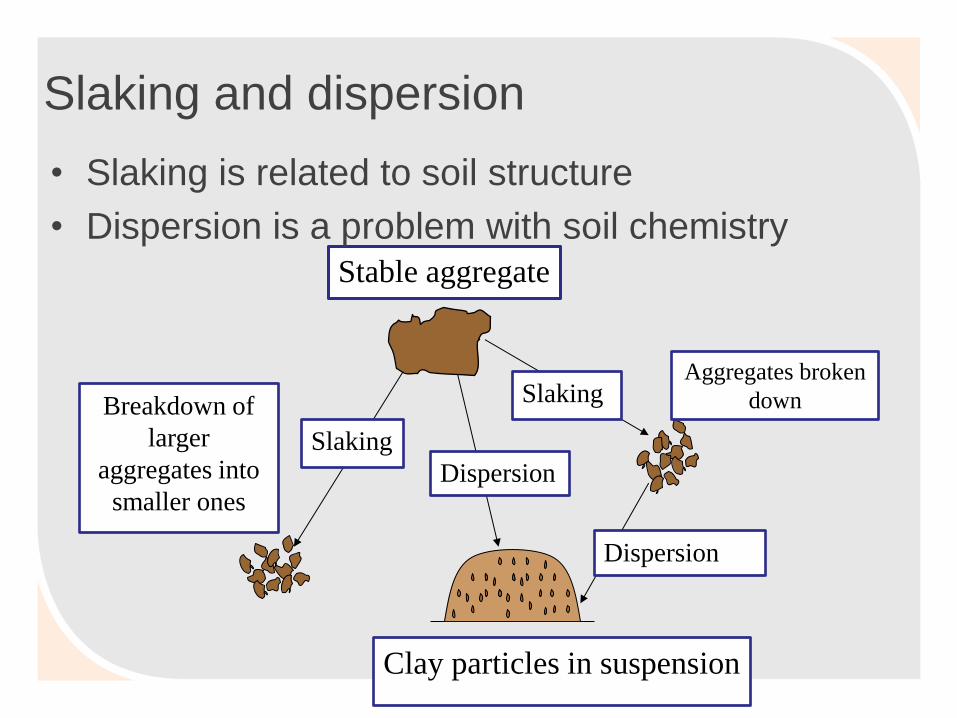
Slaking and dispersion
Slaking
Slaking
Stable aggregate
Dispersion
Dispersion
Aggregates broken
down
Clay particles in suspension
Breakdown of
larger
aggregates into
smaller ones
• Slaking is related to soil structure
• Dispersion is a problem with soil chemistry
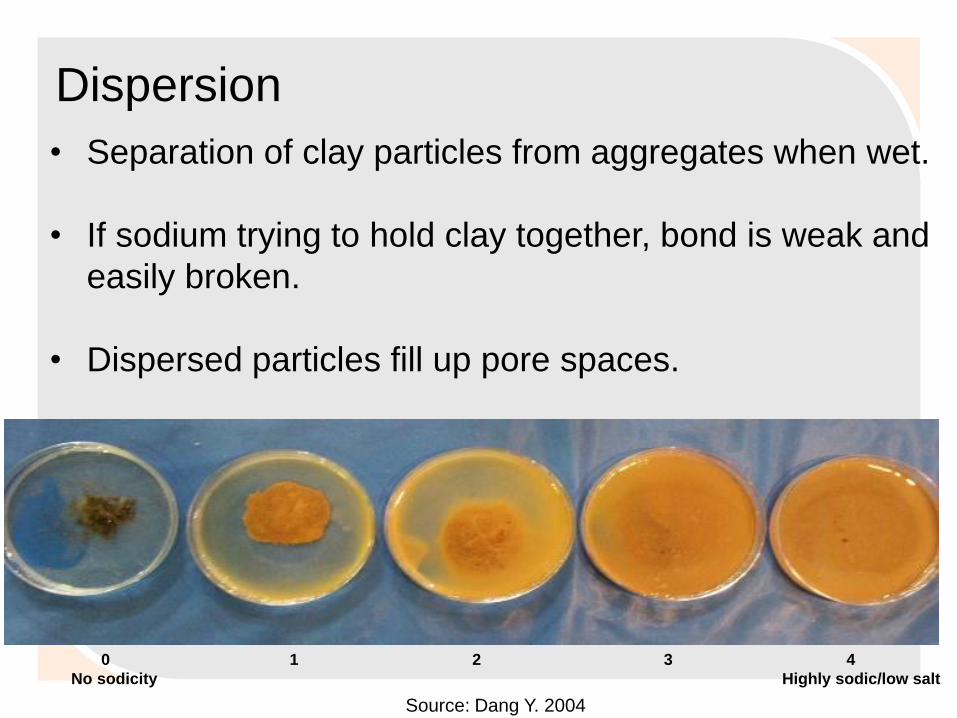
Dispersion
• Separation of clay particles from aggregates when wet.
• If sodium trying to hold clay together, bond is weak and
easily broken.
• Dispersed particles fill up pore spaces.
0 1 2 3 4
No sodicity Highly sodic/low salt
Source: Dang Y. 2004
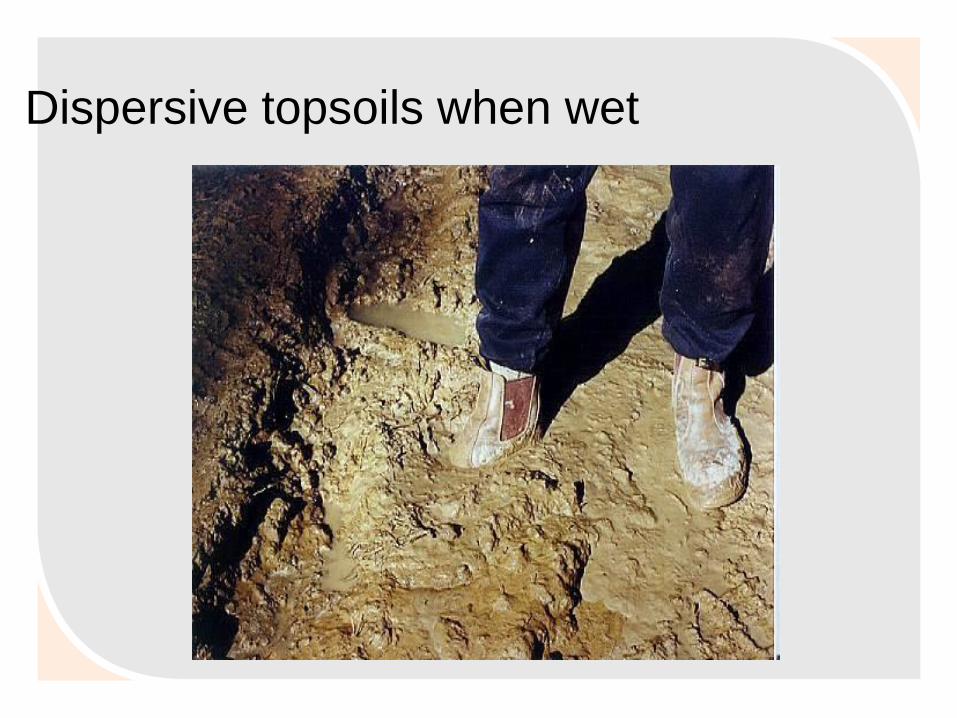
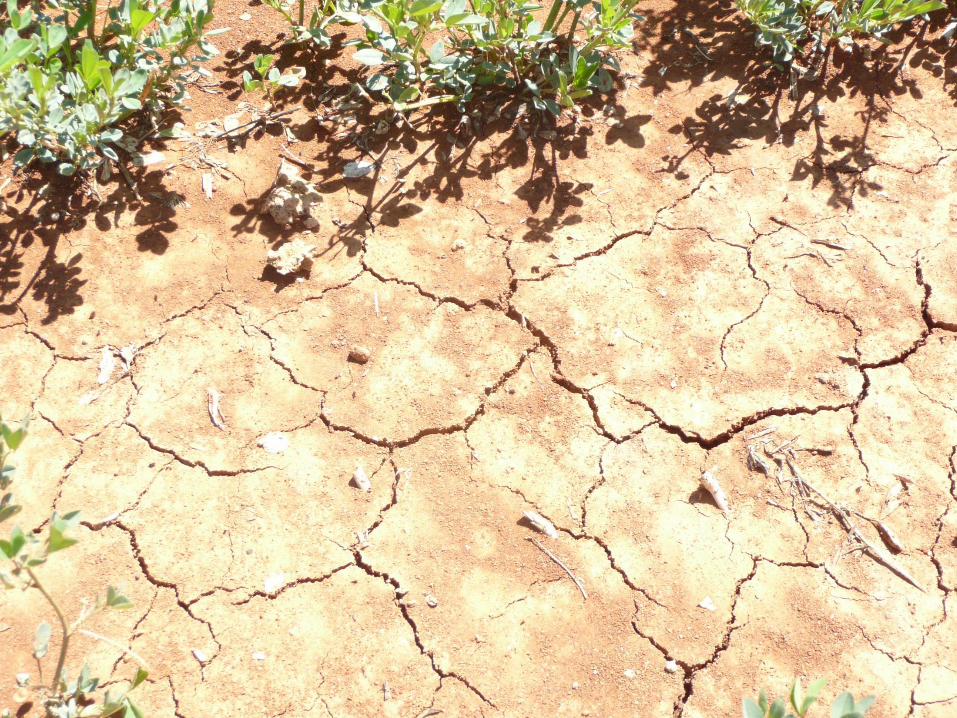
Dispersive topsoils when wet
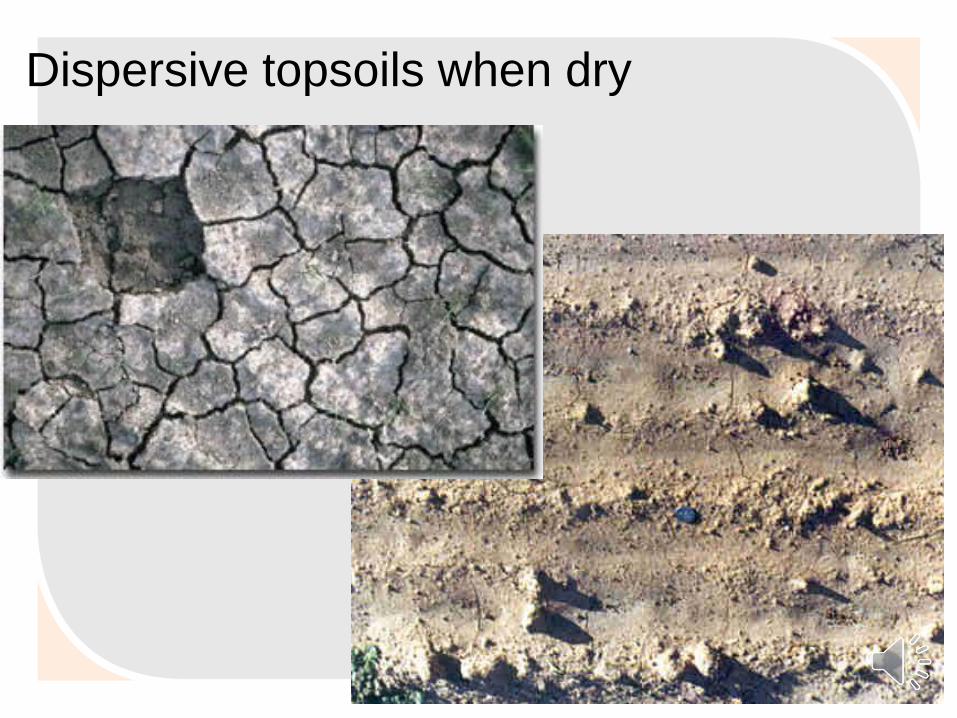
Dispersive topsoils when dry
Sodic soil
• Occurs when the clay particles are dominated by
sodium.
• Soils > 6% ESP (exchangeable sodium
percentage) usually disperse with rainfall
• Can occur naturally but irrigating with water high
in sodium and spreading of some manures can
increase the sodium levels in the soil.
• To improve these soil – use gypsum (Calcium
Sulphate) to flocculate the clay
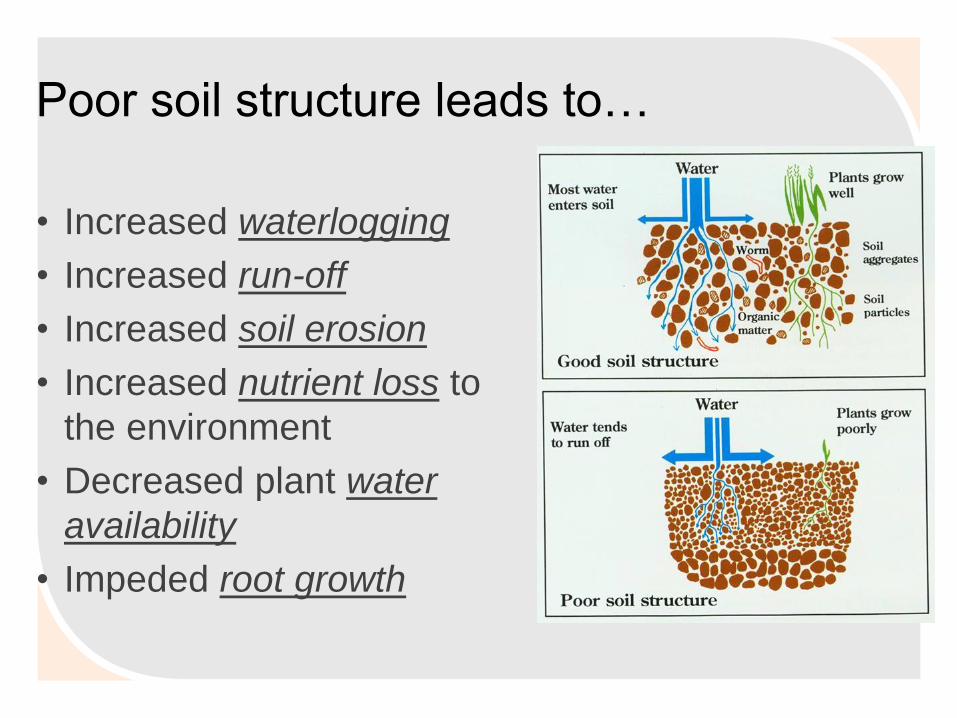
Poor soil structure leads to…
• Increased waterlogging
• Increased run-off
• Increased soil erosion
• Increased nutrient loss to
the environment
• Decreased plant water
availability
• Impeded root growth
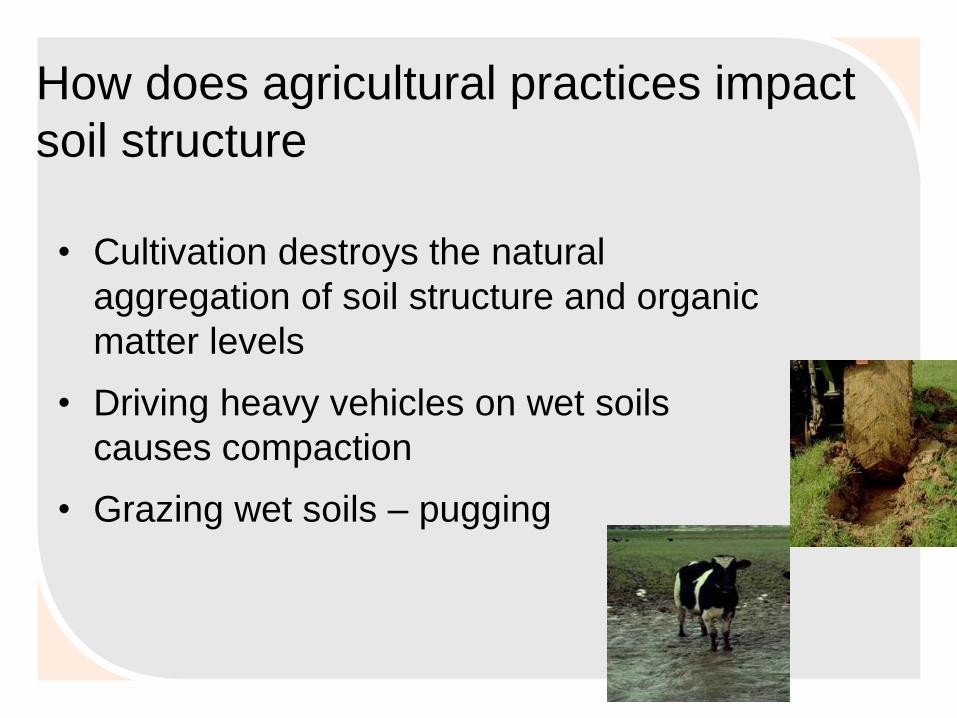
How does agricultural practices impact
soil structure
• Cultivation destroys the natural
aggregation of soil structure and organic
matter levels
• Driving heavy vehicles on wet soils
causes compaction
• Grazing wet soils – pugging
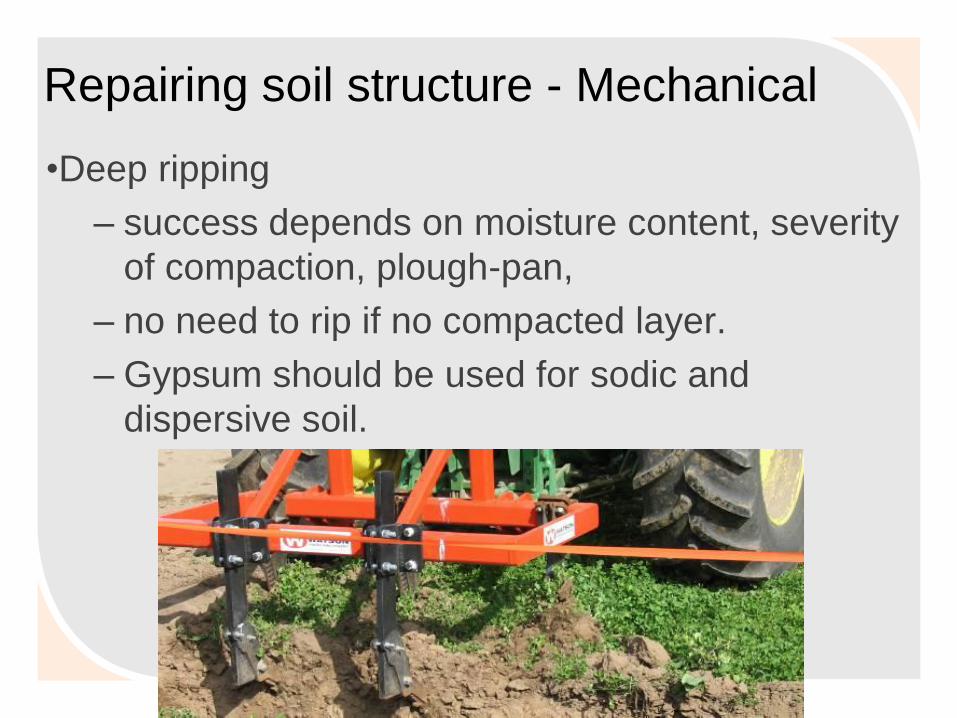
Repairing soil structure - Mechanical
•Deep ripping
– success depends on moisture content, severity
of compaction, plough-pan,
– no need to rip if no compacted layer.
– Gypsum should be used for sodic and
dispersive soil.
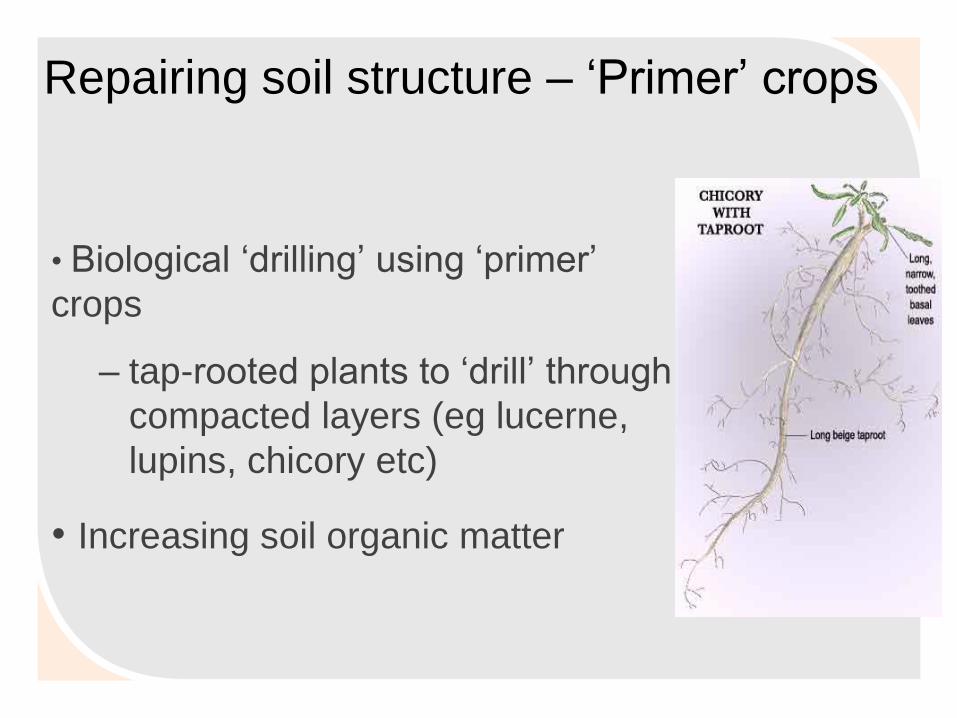
Repairing soil structure – ‘Primer’ crops
• Biological ‘drilling’ using ‘primer’
crops
– tap-rooted plants to ‘drill’ through
compacted layers (eg lucerne,
lupins, chicory etc)
• Increasing soil organic matter
Repairing soil structure –
Green Manure Crop
• Cost effect way to increase organic matter levels
• The stage the crop is turned in, can determine
the amount of organic matter or nutrient returned
to the soil.
• Legume crop such as vetch can supply between
50 – 140 kg N/ha at the time of cultivation.
• If left to mature – will contribute to OM and less
available N for the plant
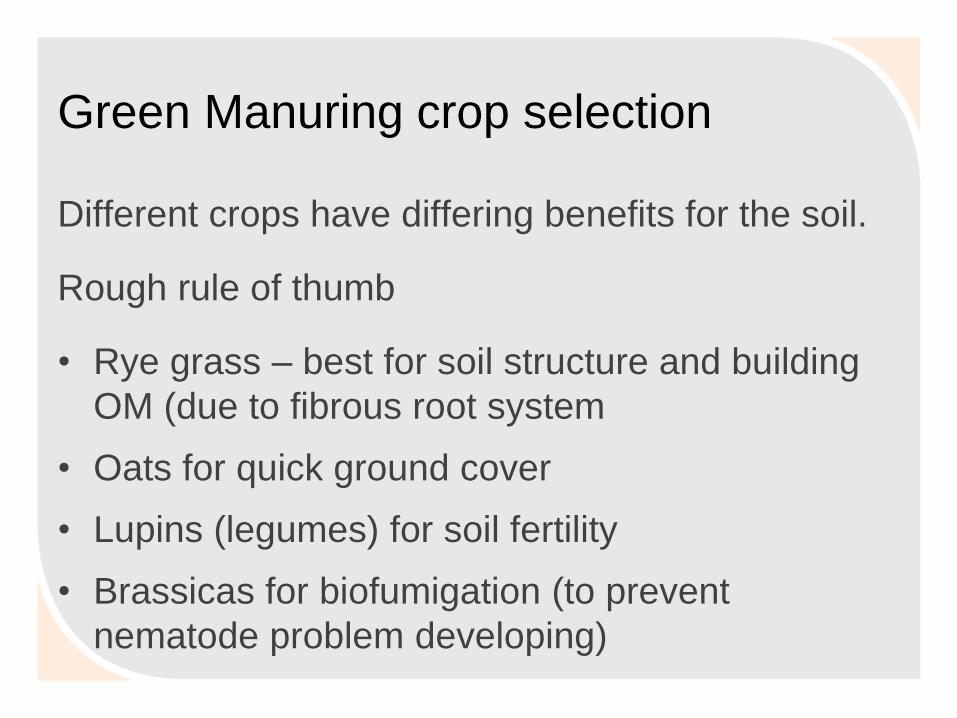
Green Manuring crop selection
Different crops have differing benefits for the soil.
Rough rule of thumb
• Rye grass – best for soil structure and building
OM (due to fibrous root system
• Oats for quick ground cover
• Lupins (legumes) for soil fertility
• Brassicas for biofumigation (to prevent
nematode problem developing)
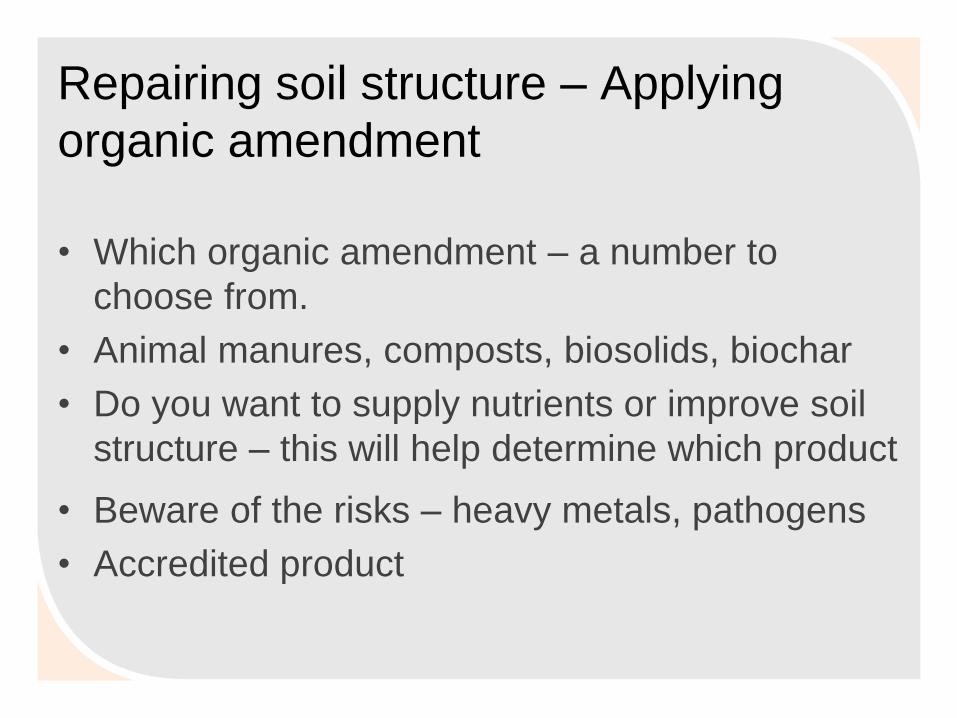
Repairing soil structure – Applying
organic amendment
• Which organic amendment – a number to
choose from.
• Animal manures, composts, biosolids, biochar
• Do you want to supply nutrients or improve soil
structure – this will help determine which product
• Beware of the risks – heavy metals, pathogens
• Accredited product
Characteristics of the soil
Chemistry
Biology
Soil
Health
Physical
• Store and supply
nutrients for plant
growth
• Maintain pH
• Minimise toxicities
Why soil test?
• Check on the fertility of the soil and better
determine or predict nutrient requirements;
– Fertiliser type and rate of nutrient required
– Lime requirement
– Gypsum requirement

Why soil test?
• With regular soil testing – may able to see trends
in the results
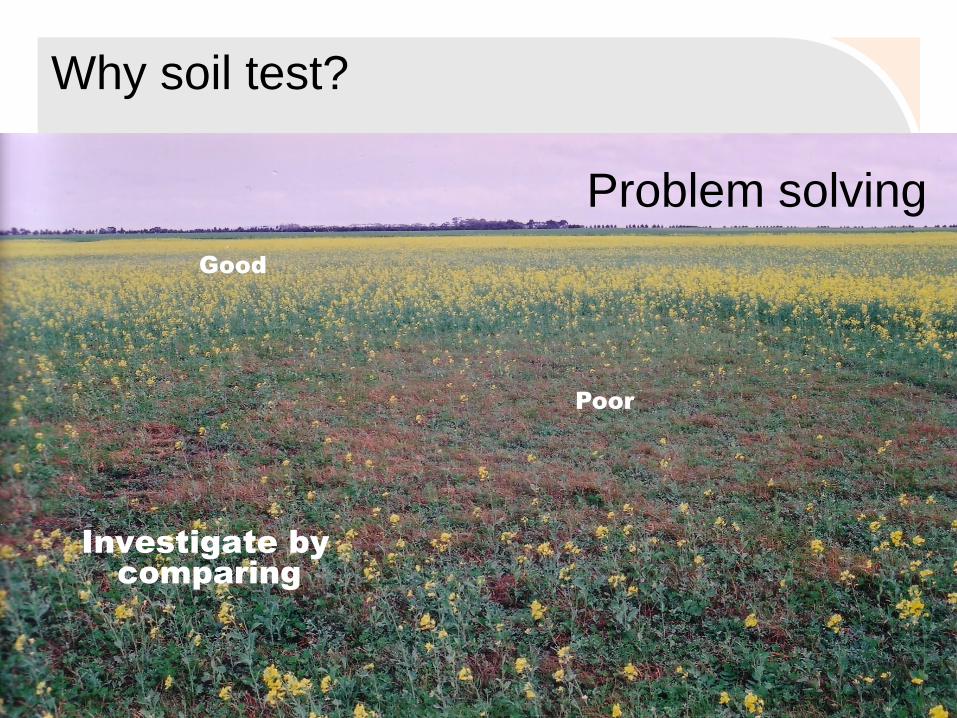
Why soil test?
Investigate by
comparing
Good
Poor
Problem solving
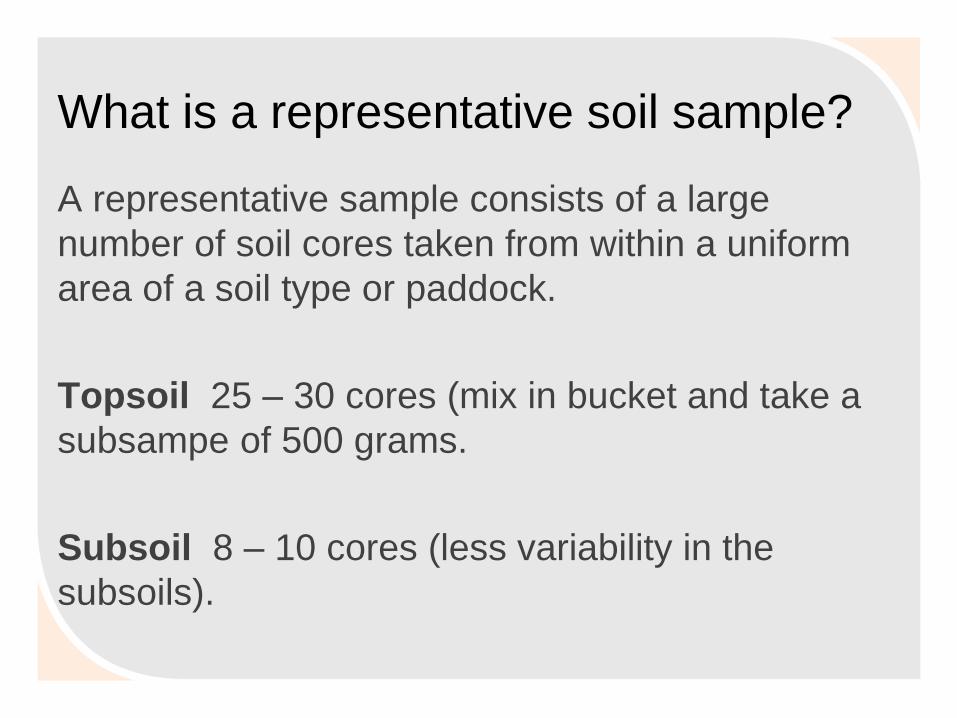
What is a representative soil sample?
A representative sample consists of a large
number of soil cores taken from within a uniform
area of a soil type or paddock.
Topsoil 25 – 30 cores (mix in bucket and take a
subsampe of 500 grams.
Subsoil 8 – 10 cores (less variability in the
subsoils).
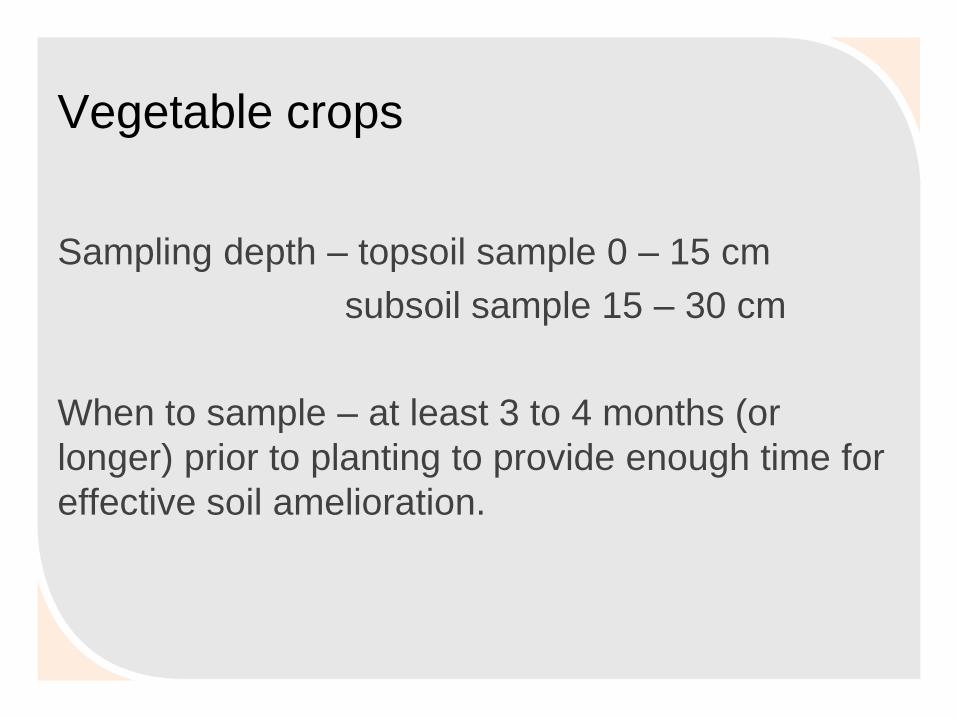
Vegetable crops
Sampling depth – topsoil sample 0 – 15 cm
subsoil sample 15 – 30 cm
When to sample – at least 3 to 4 months (or
longer) prior to planting to provide enough time for
effective soil amelioration.
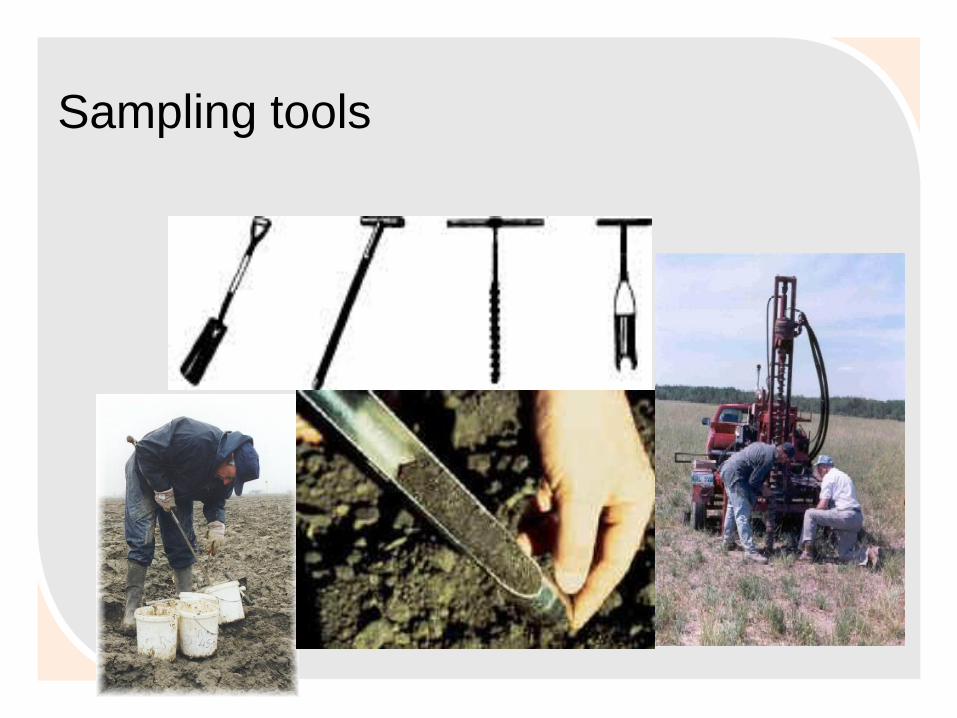
Sampling tools
Other tools
• GPS to mark soil testing area.
• Screw driver and bucket to remove and collect
soil form the sampler.
• Collection bag and soil analysis form.
Selecting areas for sampling
In selecting areas for the soil sample consider;
• Sample high and low yield areas separately.
• Don’t mix soil samples from different production
areas or have been farmed differently.
• Where different soil types occur within the same
paddock.
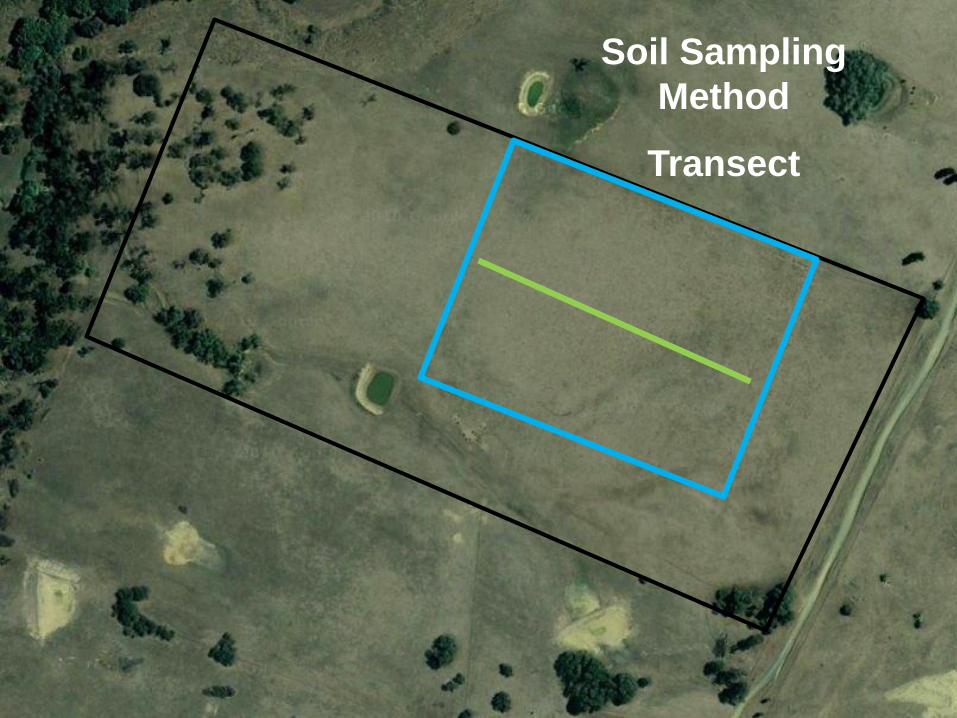
MONITOR Fertility
Soil Sampling
Method
Transect
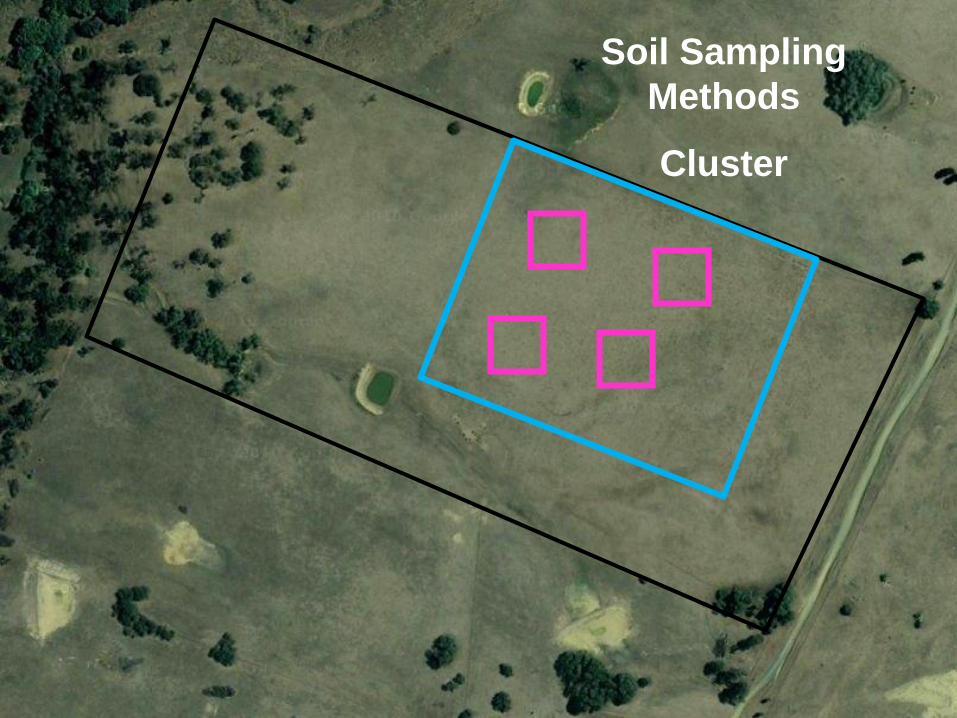
MONITOR Fertility
Soil Sampling
Methods
Cluster
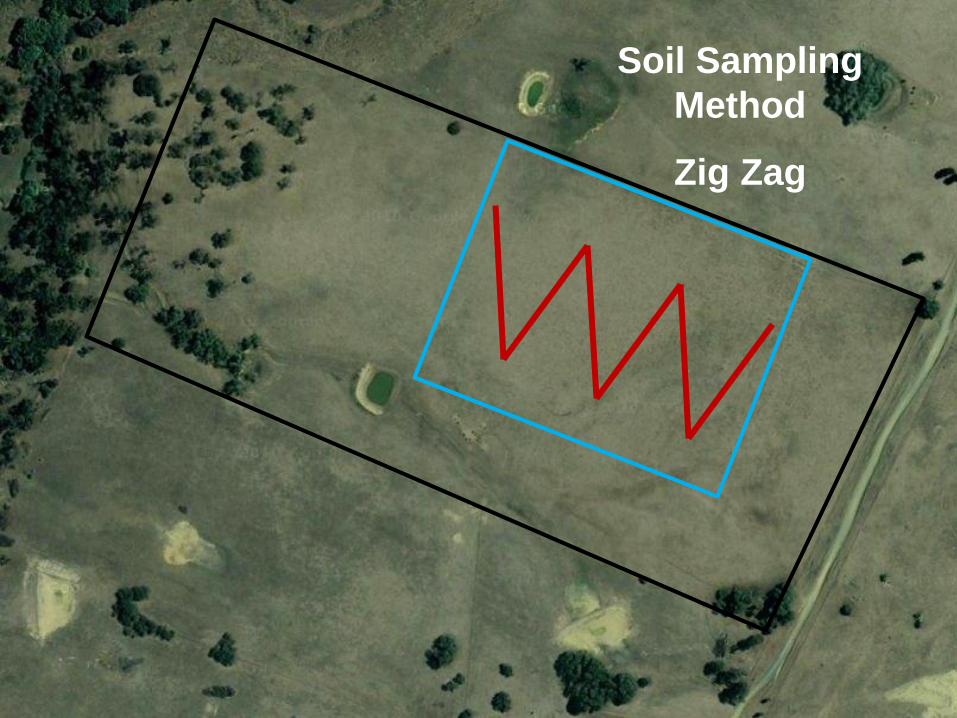
MONITOR Fertility
Soil Sampling
Method
Zig Zag
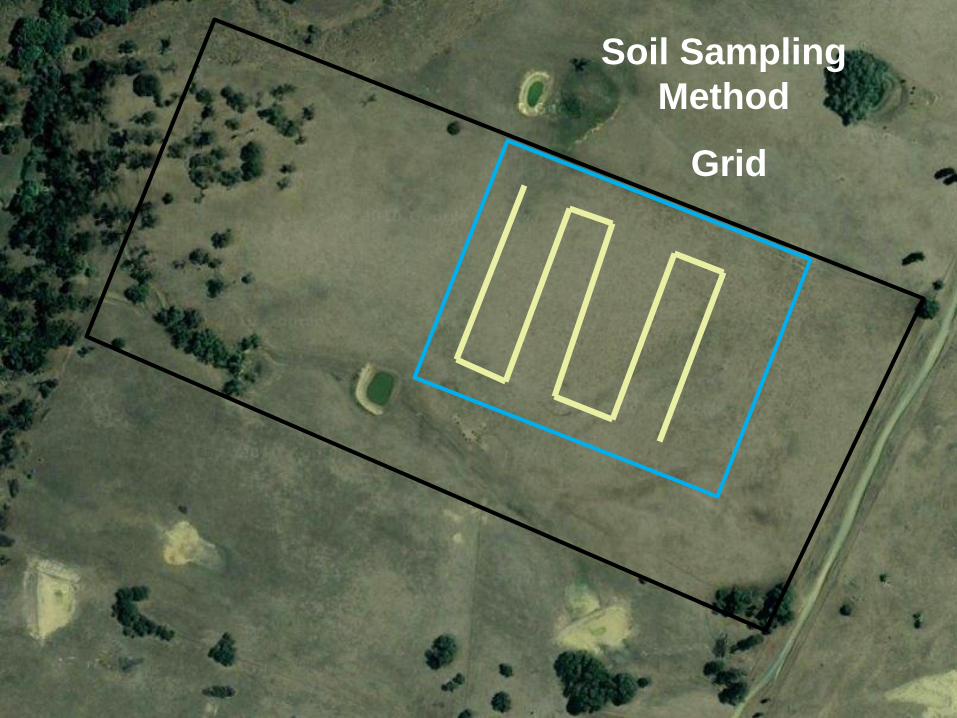
MONITOR Fertility
Soil Sampling
Method
Grid
Prepared seed beds
• Care must be taken when sampling in
permanent seed beds as it can potentially give
misleading results
• The main issue is knowing where fertiliser is
banded.
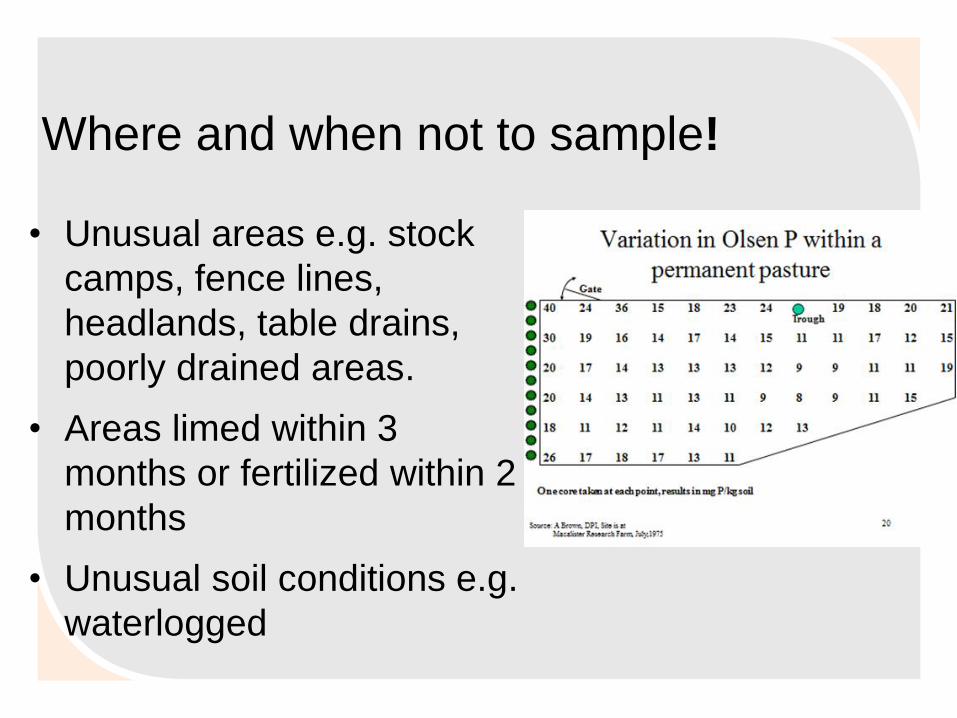
Where and when not to sample!
• Unusual areas e.g. stock
camps, fence lines,
headlands, table drains,
poorly drained areas.
• Areas limed within 3
months or fertilized within 2
months
• Unusual soil conditions e.g.
waterlogged
Sampling Protocol
• Remove leaves/thatch and other debris from soil
surface.
• Using corer take samples and place in clean
bucket.
• Mix thoroughly and take a sub sample (500g).
• Send to laboratory
Selecting a soil test laboratory
• NATA accredited - National Association of Testing Authorities
• ASPAC accredited – Australasian Soil & Plant Analysis Council - check website for which test
• Interpretations field calibrated
• Cost
• Turnaround time
• Quality of service - eg. back up?
Some rules for soil testing
• Make it REPEATABLE! – Same time of the year
• Do it regularly
• USE the SAME TEST (Colwell P or Olsen P?)
• PREFERABLY Use the same Lab or if changing transition by sending samples to the ‘old’ & ‘new’ Lab
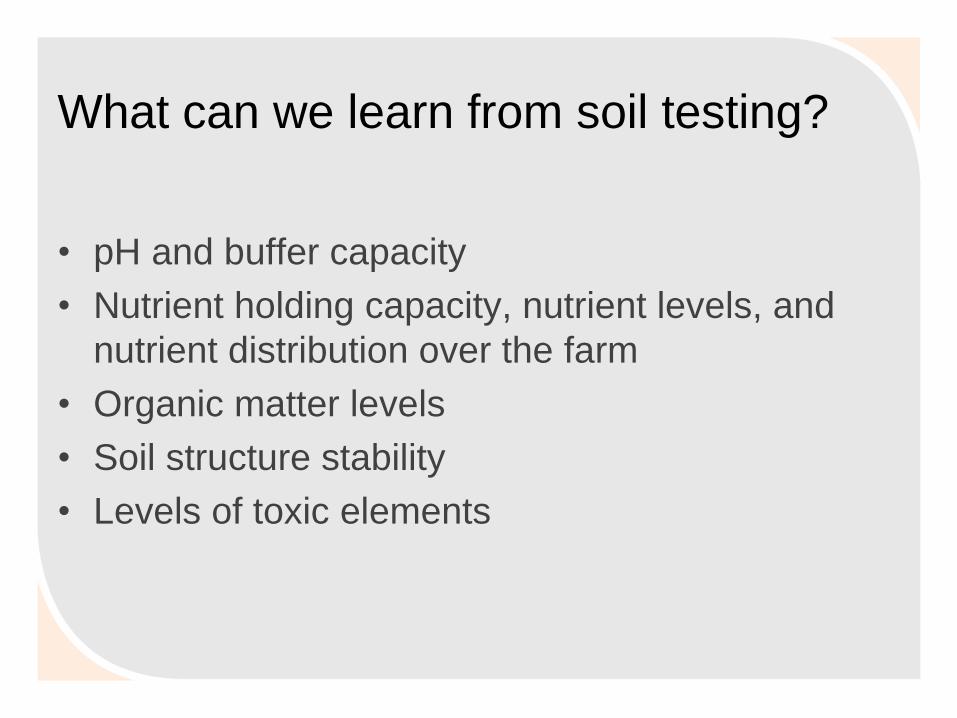
What can we learn from soil testing?
• pH and buffer capacity
• Nutrient holding capacity, nutrient levels, and
nutrient distribution over the farm
• Organic matter levels
• Soil structure stability
• Levels of toxic elements
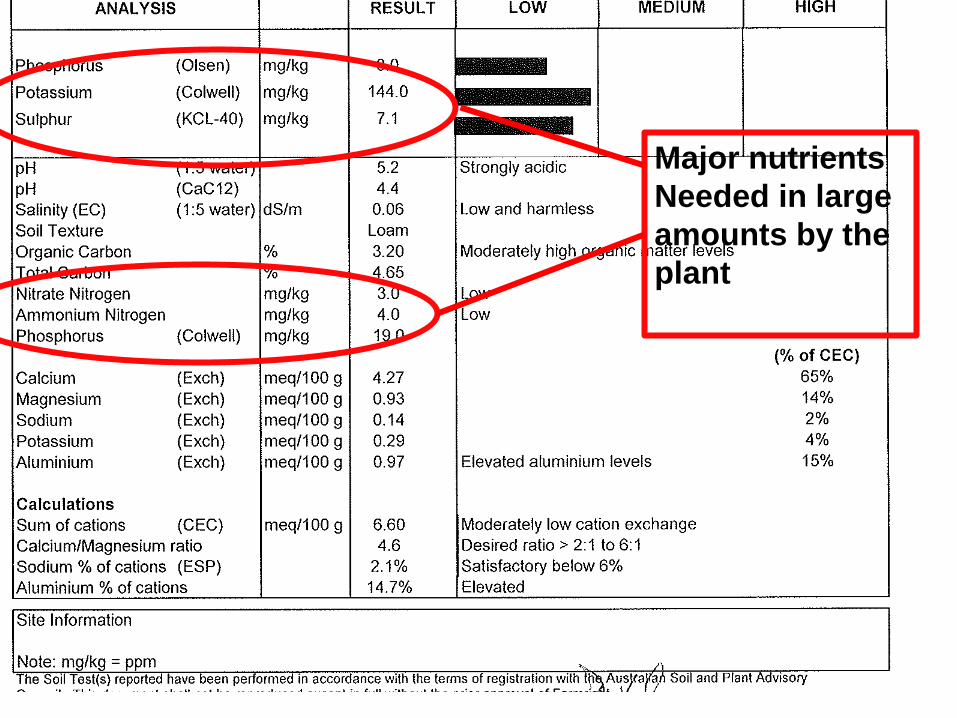
Major nutrients
Needed in large
amounts by the
plant
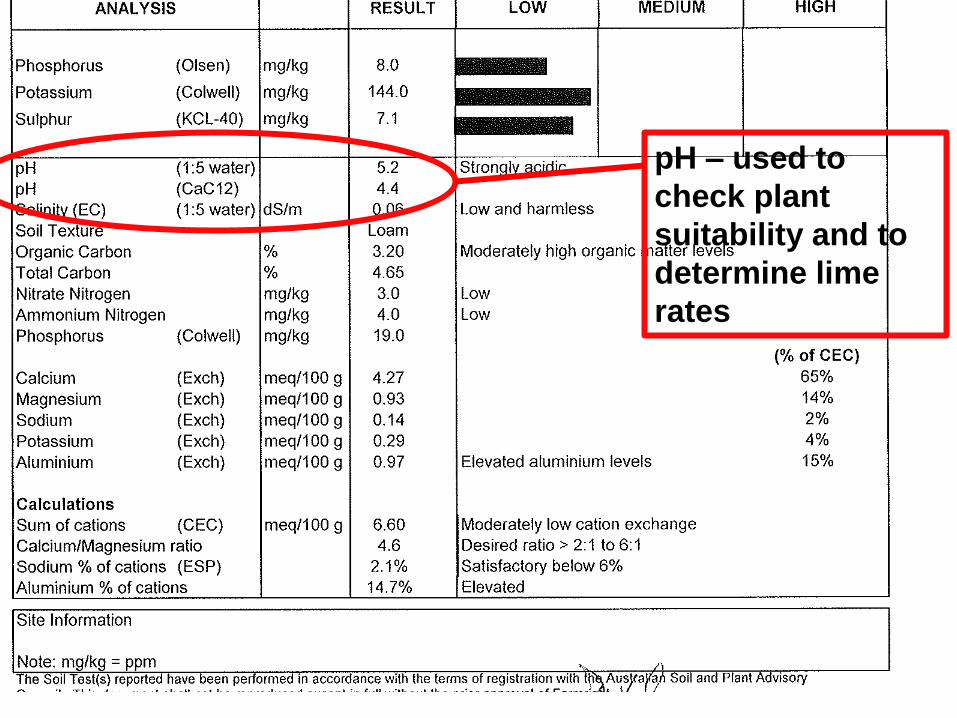
pH – used to
check plant
suitability and to
determine lime
rates
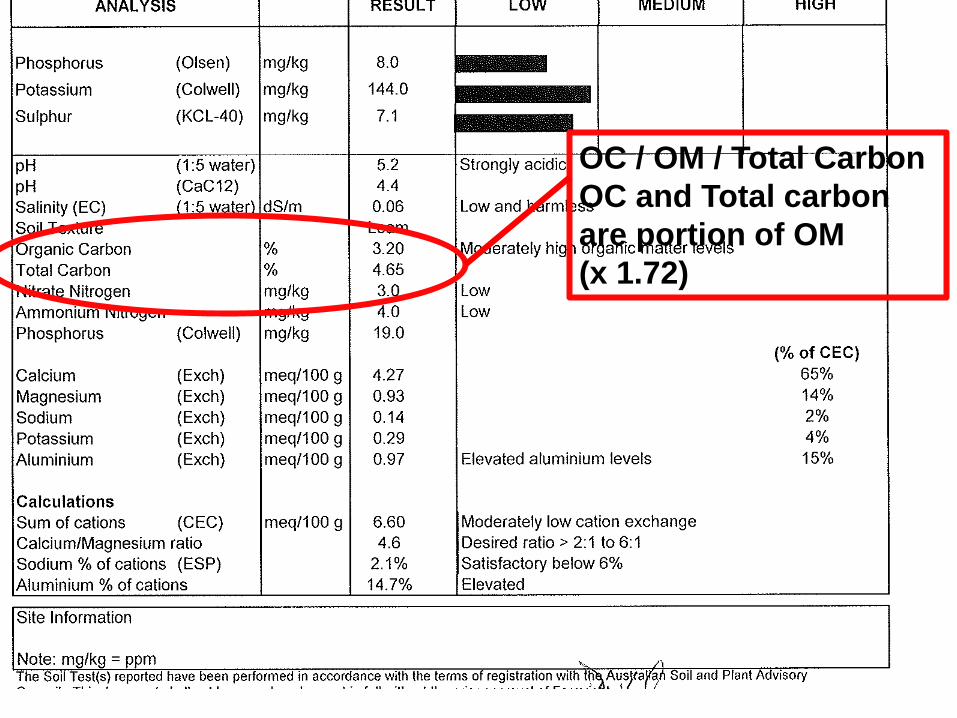
OC / OM / Total Carbon
OC and Total carbon
are portion of OM
(x 1.72)
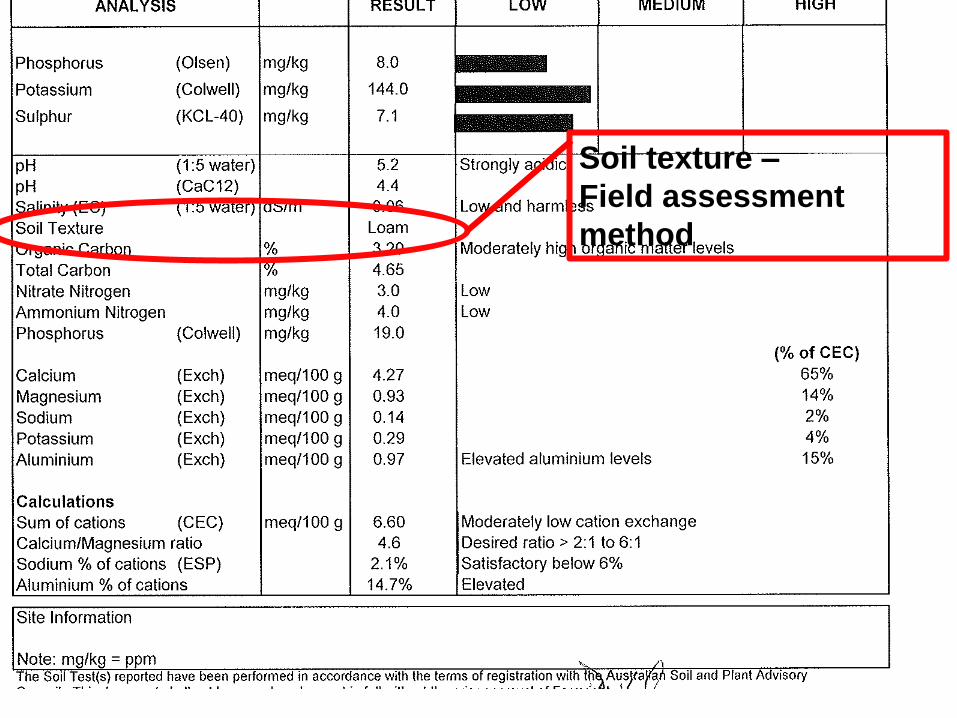
Soil texture –
Field assessment
method
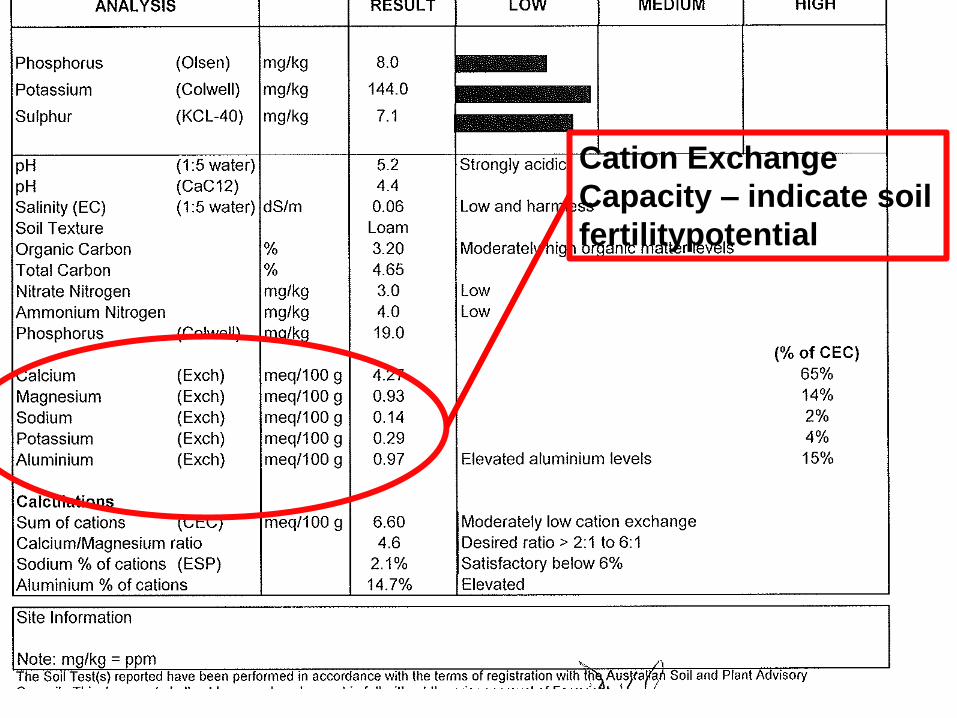
Cation Exchange
Capacity – indicate soil
fertilitypotential
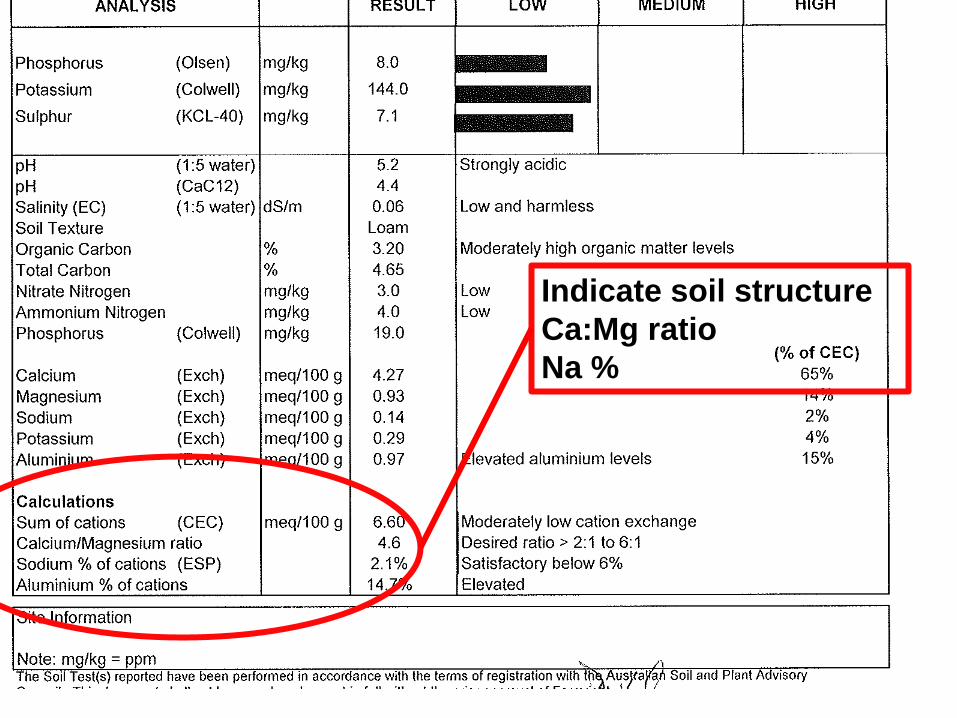
Indicate soil structure
Ca:Mg ratio
Na %
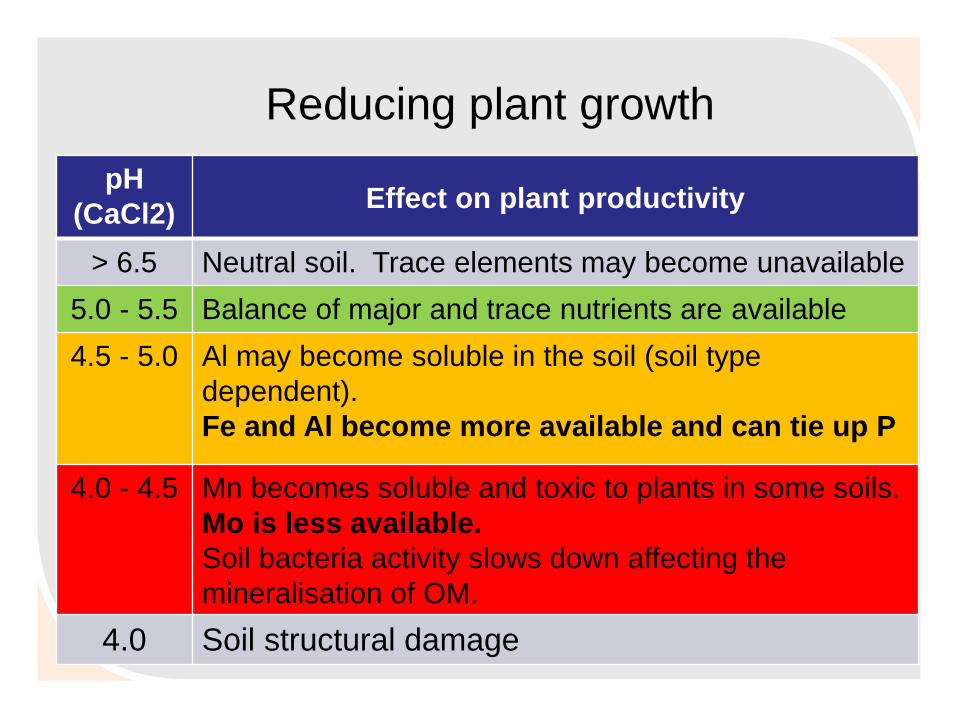
pH
(CaCl2) Effect on plant productivity
> 6.5 Neutral soil. Trace elements may become unavailable
5.0 - 5.5 Balance of major and trace nutrients are available
4.5 - 5.0 Al may become soluble in the soil (soil type
dependent).
Fe and Al become more available and can tie up P
4.0 - 4.5 Mn becomes soluble and toxic to plants in some soils.
Mo is less available.
Soil bacteria activity slows down affecting the
mineralisation of OM.
4.0 Soil structural damage
Reducing plant growth
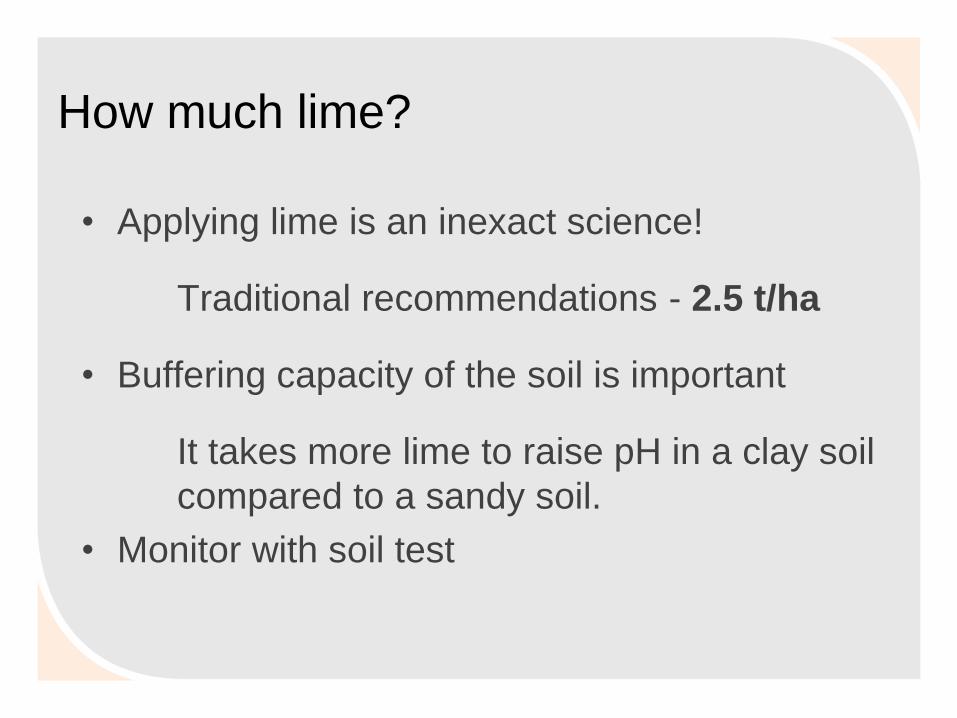
How much lime?
• Applying lime is an inexact science!
Traditional recommendations - 2.5 t/ha
• Buffering capacity of the soil is important
It takes more lime to raise pH in a clay soil
compared to a sandy soil.
• Monitor with soil test
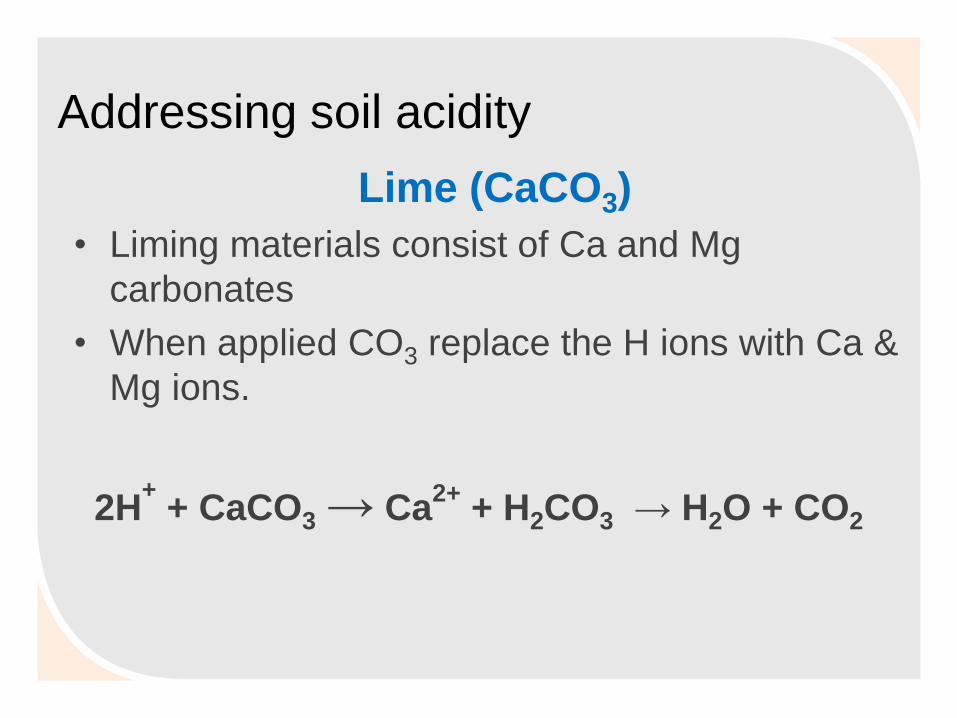
Addressing soil acidity
Lime (CaCO3)
• Liming materials consist of Ca and Mg
carbonates
• When applied CO3 replace the H ions with Ca &
Mg ions.
2H+ + CaCO3 → Ca
2+ + H2CO3 → H2O + CO2
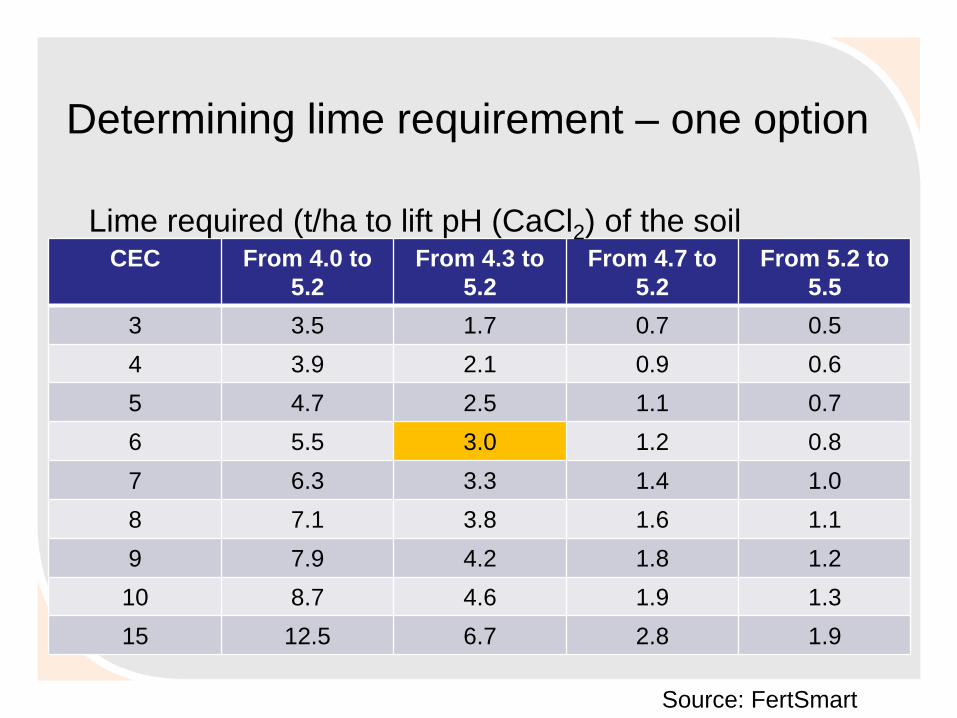
Determining lime requirement – one option
CEC From 4.0 to
5.2
From 4.3 to
5.2
From 4.7 to
5.2
From 5.2 to
5.5
3 3.5 1.7 0.7 0.5
4 3.9 2.1 0.9 0.6
5 4.7 2.5 1.1 0.7
6 5.5 3.0 1.2 0.8
7 6.3 3.3 1.4 1.0
8 7.1 3.8 1.6 1.1
9 7.9 4.2 1.8 1.2
10 8.7 4.6 1.9 1.3
15 12.5 6.7 2.8 1.9
Source: FertSmart
Lime required (t/ha to lift pH (CaCl2) of the soil
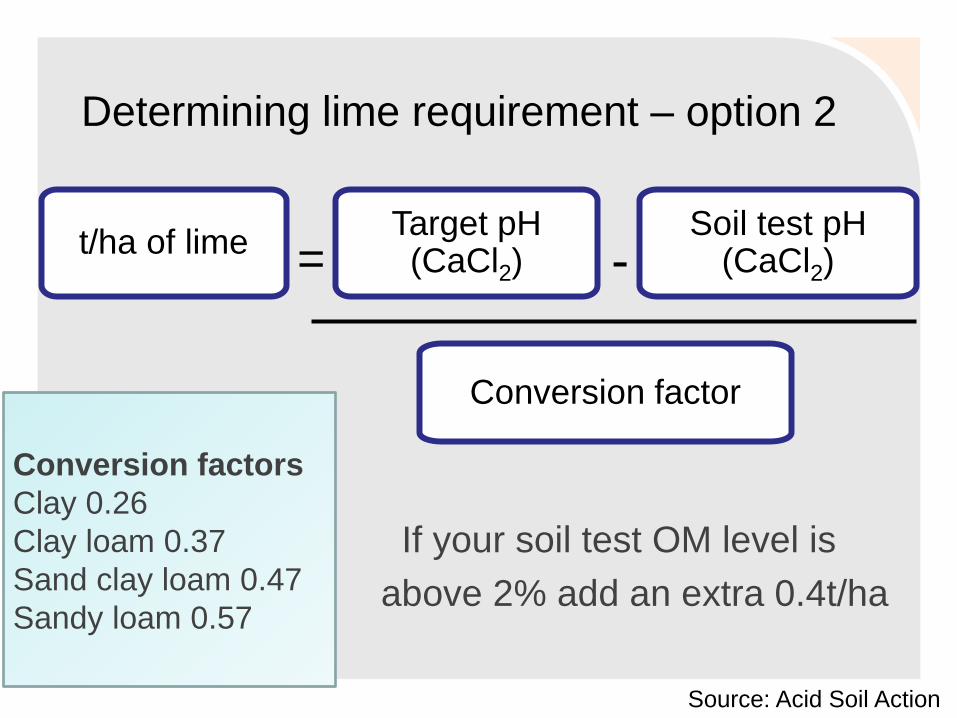
Determining lime requirement – option 2
If your soil test OM level is
above 2% add an extra 0.4t/ha
Conversion factors
Clay 0.26
Clay loam 0.37
Sand clay loam 0.47
Sandy loam 0.57
t/ha of lime Target pH (CaCl2)
Soil test pH (CaCl2) = -
Conversion factor
Source: Acid Soil Action
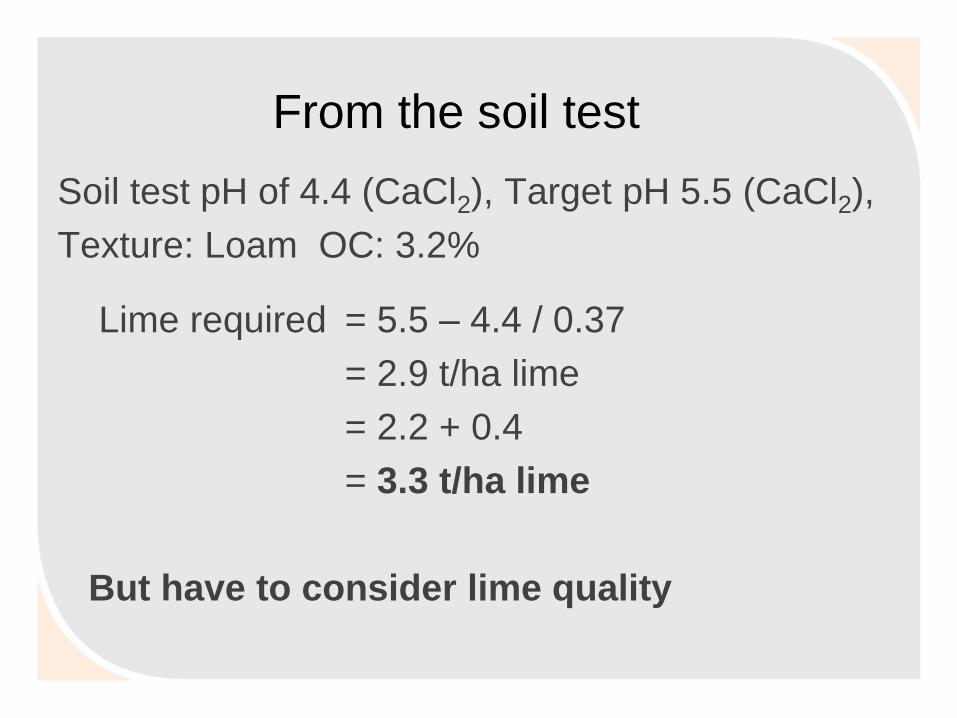
From the soil test
Soil test pH of 4.4 (CaCl2), Target pH 5.5 (CaCl2),
Texture: Loam OC: 3.2%
Lime required = 5.5 – 4.4 / 0.37
= 2.9 t/ha lime
= 2.2 + 0.4
= 3.3 t/ha lime
But have to consider lime quality
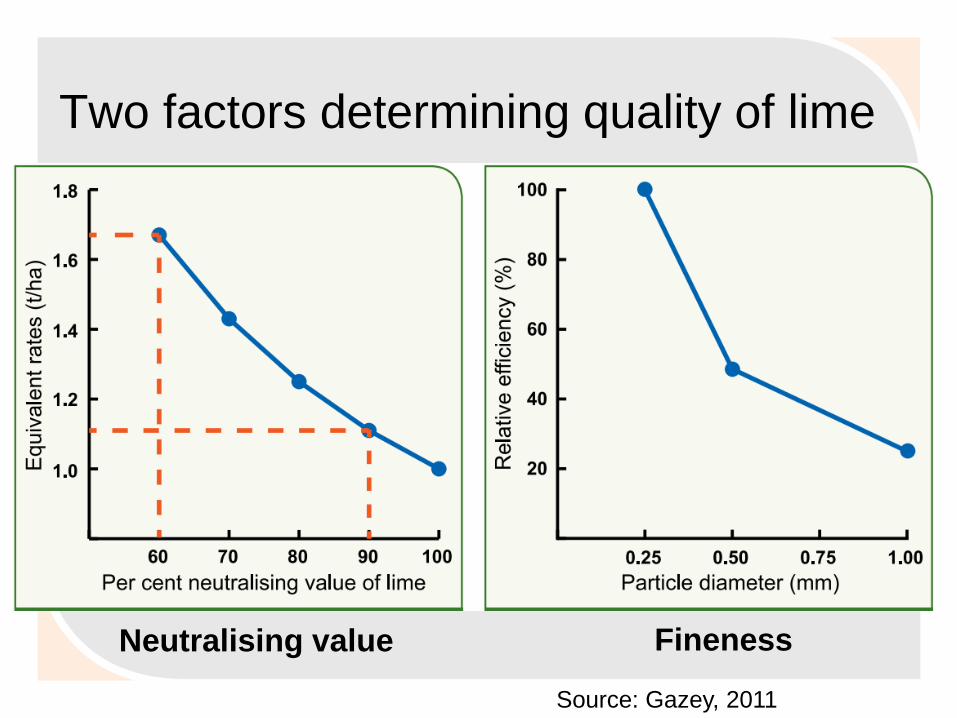
Two factors determining quality of lime
Source: Gazey, 2011
Neutralising value Fineness
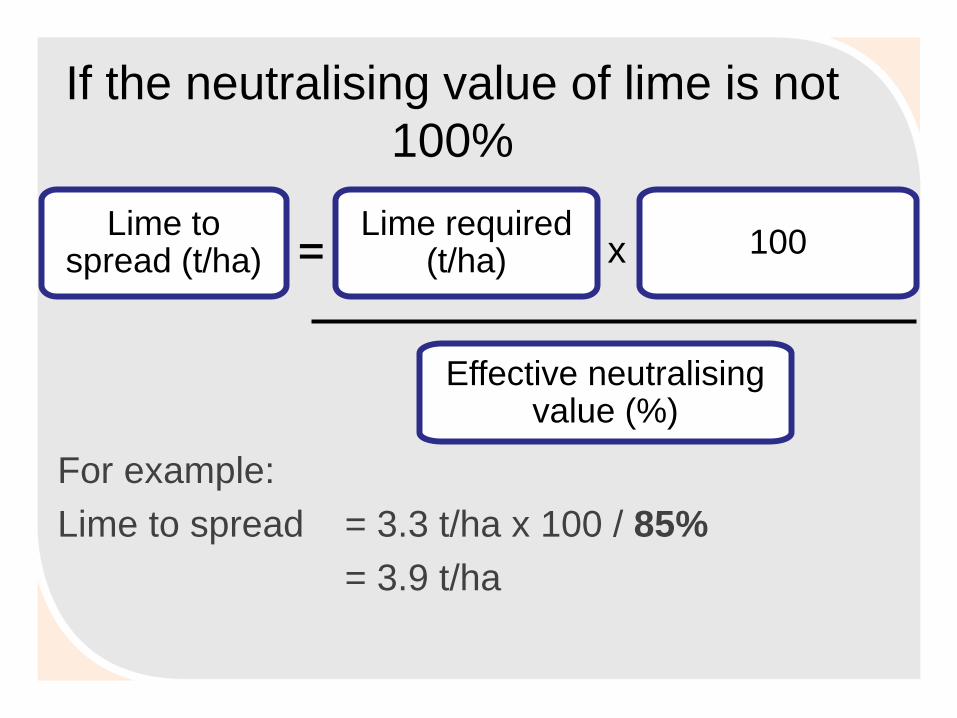
If the neutralising value of lime is not
100%
For example:
Lime to spread = 3.3 t/ha x 100 / 85%
= 3.9 t/ha
Lime to spread (t/ha)
Lime required (t/ha)
100
Effective neutralising value (%)
x
Plant tissue testing
• Research has found that using soil test to
determine trace nutrient deficiencies is very
inaccurate, especially on acid soils
• Diagnosing trace nutrients toxicities &
deficiencies
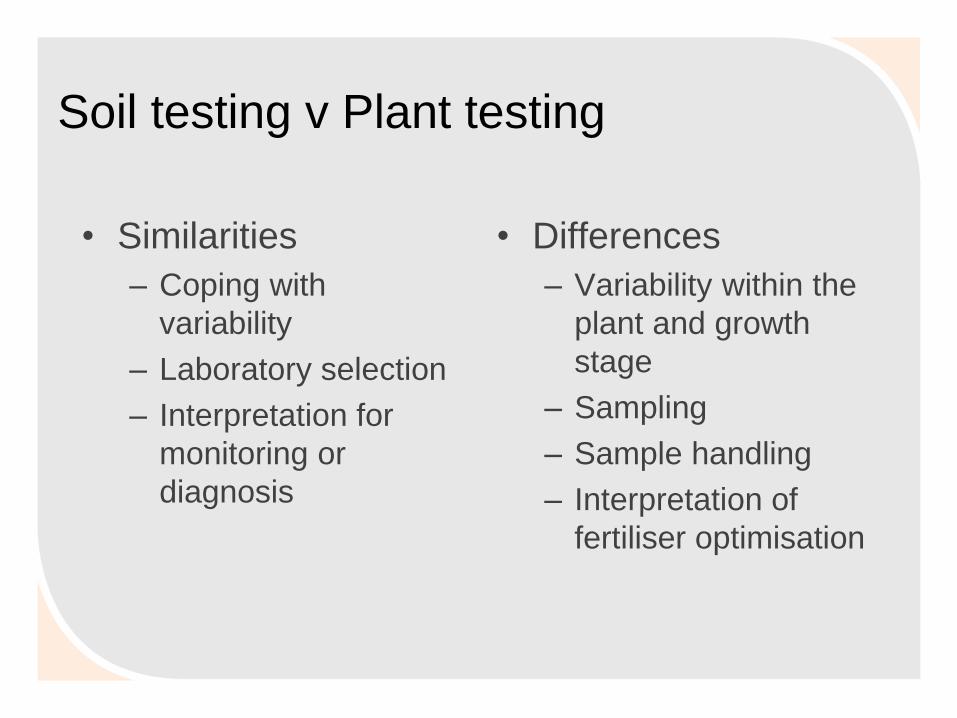
Soil testing v Plant testing
• Similarities
– Coping with
variability
– Laboratory selection
– Interpretation for
monitoring or
diagnosis
• Differences
– Variability within the
plant and growth
stage
– Sampling
– Sample handling
– Interpretation of
fertiliser optimisation
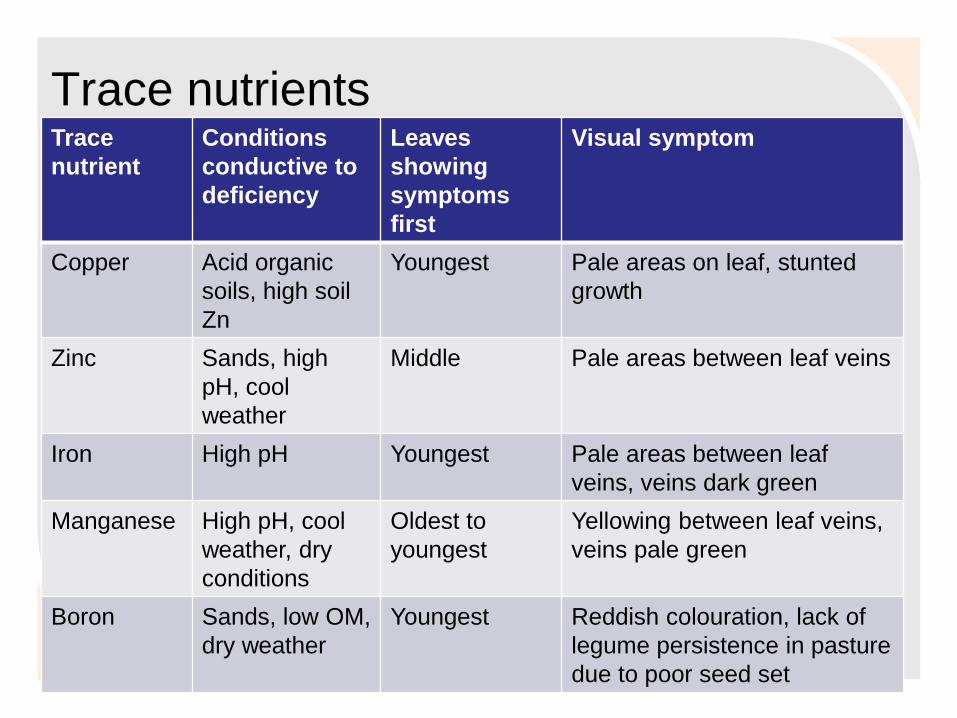
Trace nutrients Trace
nutrient
Conditions
conductive to
deficiency
Leaves
showing
symptoms
first
Visual symptom
Copper Acid organic
soils, high soil
Zn
Youngest Pale areas on leaf, stunted
growth
Zinc Sands, high
pH, cool
weather
Middle Pale areas between leaf veins
Iron High pH Youngest Pale areas between leaf
veins, veins dark green
Manganese High pH, cool
weather, dry
conditions
Oldest to
youngest
Yellowing between leaf veins,
veins pale green
Boron Sands, low OM,
dry weather
Youngest
Reddish colouration, lack of
legume persistence in pasture
due to poor seed set
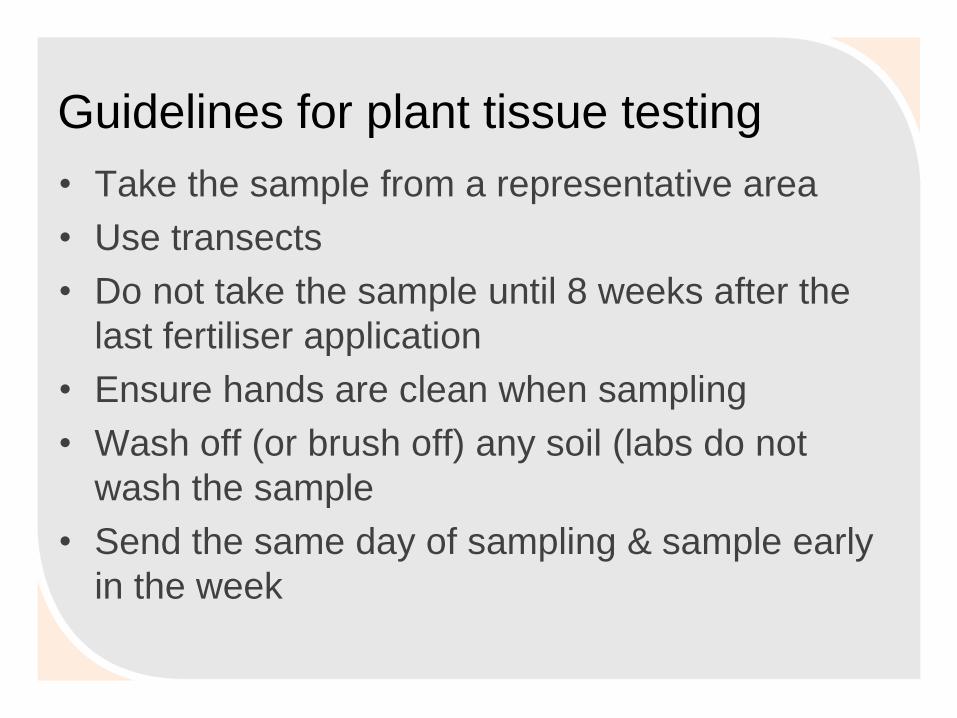
Guidelines for plant tissue testing
• Take the sample from a representative area
• Use transects
• Do not take the sample until 8 weeks after the
last fertiliser application
• Ensure hands are clean when sampling
• Wash off (or brush off) any soil (labs do not
wash the sample
• Send the same day of sampling & sample early
in the week
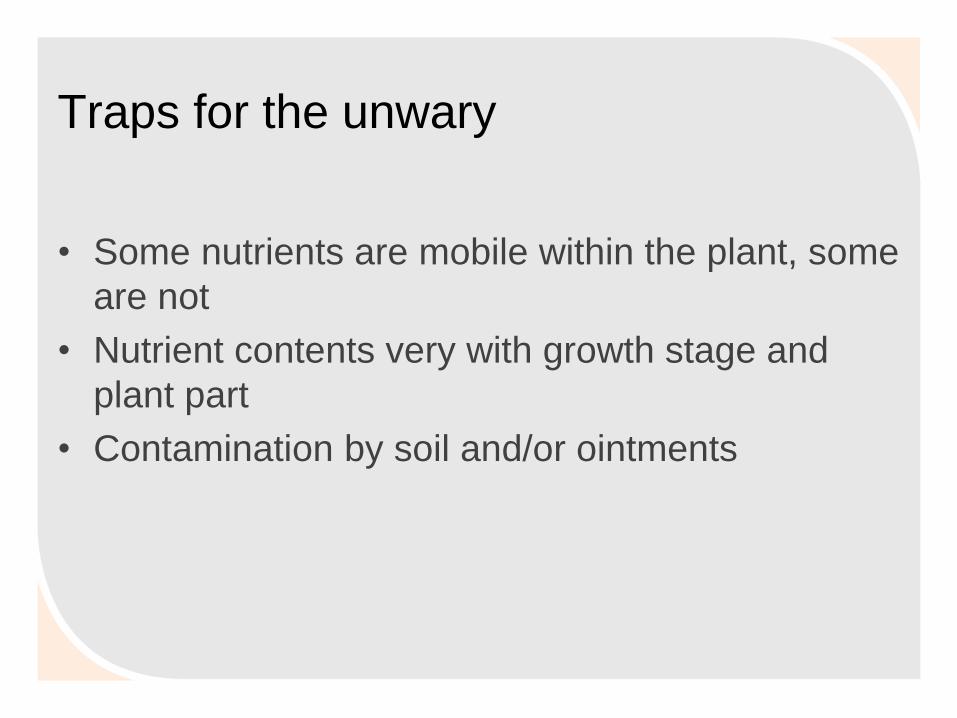
Traps for the unwary
• Some nutrients are mobile within the plant, some
are not
• Nutrient contents very with growth stage and
plant part
• Contamination by soil and/or ointments
79
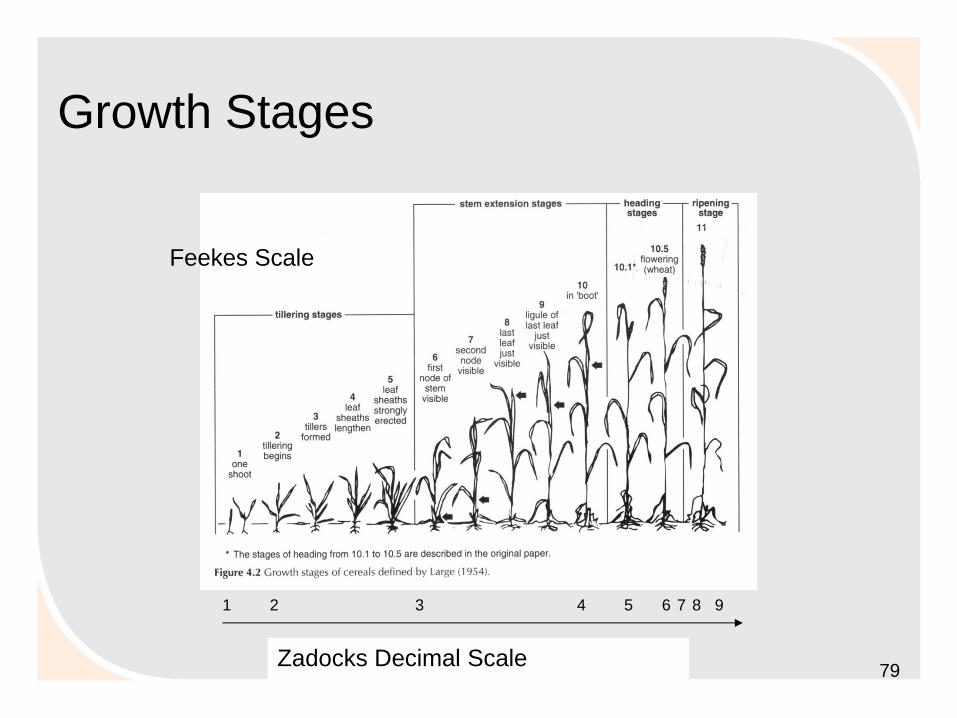
Growth Stages
Feekes Scale
Zadocks Decimal Scale
1 2 3 4 5 6 7 8 9
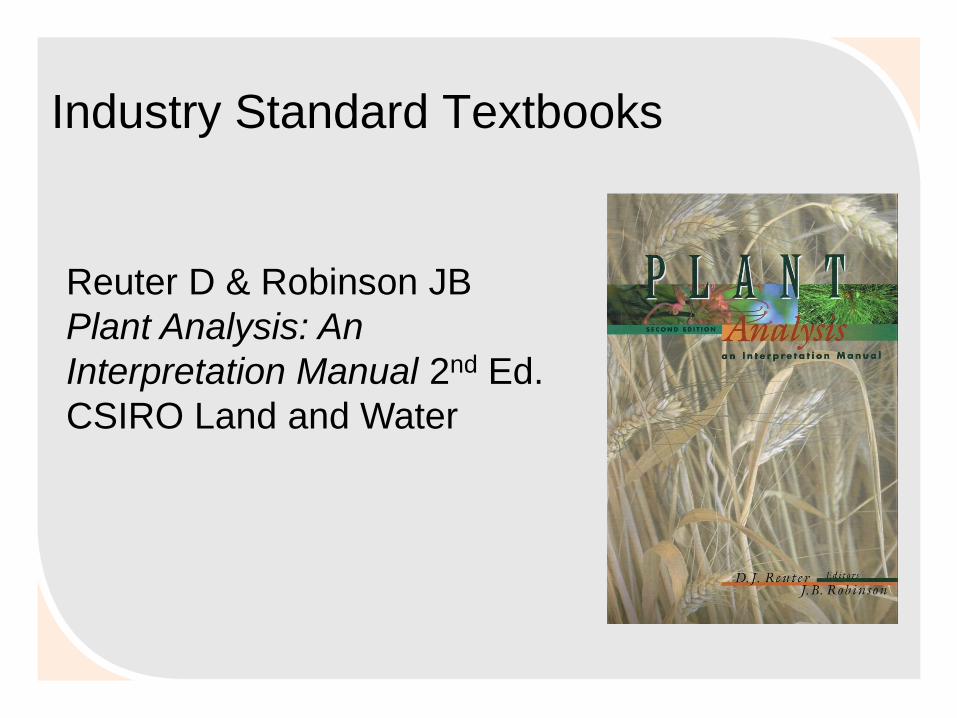
Industry Standard Textbooks
Reuter D & Robinson JB
Plant Analysis: An
Interpretation Manual 2nd Ed.
CSIRO Land and Water
How healthy is my soil? - In the field
observations
• Ground cover
• Root development and depth
• Soil colour and drainage
• Earthworm numbers can indicate biological activity
• Soil pH
• Soil structure and structural stability
• Water infiltration