geophysical surveys at khirbat faynan, an ancient mound site in
TRANSCRIPT
Hindawi Publishing CorporationInternational Journal of GeophysicsVolume 2012, Article ID 432823, 8 pagesdoi:10.1155/2012/432823
Research Article
Geophysical Surveys at Khirbat Faynan, an Ancient Mound Site inSouthern Jordan
Alexandre Novo,1 Matthew L. Vincent,2 and Thomas E. Levy2
1 Geostudi Astier, via A. Nicolodi 48, 57121 Livorno, Italy2 Department of Anthropology & California Institute for Telecommunications and Information Technology (Calit2),University of California, San Diego, CA 92093, USA
Correspondence should be addressed to Alexandre Novo, [email protected]
Received 16 April 2012; Accepted 4 July 2012
Academic Editor: Nicola Masini
Copyright © 2012 Alexandre Novo et al. This is an open access article distributed under the Creative Commons AttributionLicense, which permits unrestricted use, distribution, and reproduction in any medium, provided the original work is properlycited.
Faynan in Jordan contains the largest copper ore resource zone in the southern Levant (Israel, Jordan, Palestinian territories,Lebanon, Syria, and the Sinai Peninsula). Located 50 km southeast of the Dead Sea, it is home to one of the world’s best-preservedancient mining and metallurgy districts encompassing an area of ca. 400 km2. During the past three decades, archaeologists havecarried out numerous excavations and surveys recording hundreds of mines and sites related to metallurgical activities that span thepast 10 millennia. Khirbat Faynan (Biblical Punon), is situated in the main Faynan Valley and is the largest (ca. 15 ha) settlement sitein the region and has remained unexcavated until 2011. As Jordan’s most southern mound site with indications of widespreadancient architecture, we employed a suite of noninvasive geophysical survey methods to identify areas suitable for excavation.Earlier geophysical surveys were carried out in the Faynan region by our team in the late 1990s when only EMI (electromagneticinduction) proved successful, but with relatively poor resolution. As reported here, by 2011, improvements in data processingsoftware and 3D ERT (electrical resistivity tomography) sampling protocols made it possible to greatly improve the application ofnoninvasive geophysical surveying in this hyperarid zone.
1. Introduction
Improvements in processing software and sampling proto-cols for shallow geophysical prospecting make it a key toolfor initiating archaeological exploration. In terms of researchdesign, geophysics have increasingly become an essential partof the methodology for planning archaeological excavationin a number of unexplored regions around the world [1, 2].As part of a long-term archaeological study of the role ofmining and metallurgy in the evolution of societies fromthe Neolithic period (ca. 8000 BC–6000 BC) to Islamic times(7th c. CE–early 20th c. CE) in Jordan’s Faynan copper oredistrict, the University of California, San Diego (UCSD)Edom Lowlands Regional Archaeology Project (ELRAP)conducted intensive systematic surveys and large-scale exca-vations at sites spanning all these periods. From 2002–2010, the primary research focus was on the formative IronAge (ca. 1200–500 BCE) when the first historical state-level
societies evolved in this part of the eastern Mediterraneanand the ancient Near East’s first industrial revolution tookplace. Large-scale excavations were carried out at Khirbaten-Nahas (ca. 10 hectares), the largest copper ore processingand smelting site in the region (cf. [3]), smaller productionsites [4], fortresses [5], mining complexes [6], and other sitesmaking it possible to reconstruct the Iron Age “metallurgicallandscape” of this natural resource zone [7]. While it waspossible to reconstruct the network of ore exploitation, pro-cessing, and manufacture, the location and nature of politicaland economic center remains a mystery. Based on previoussurveys and research in the main Wadi Faynan valley, moreresearchers believe that a large (ca. 15 hectares) ancientmound site called Khirbat Faynan (known as Punon in theHebrew Bible and Phaino in late Roman/Byzantine texts)may have been that center during the Iron Age [8]. In 2011,the UCSD ELRAP team initiated the first multiyear large-scale excavation project at this site, the most southern ancient

2 International Journal of Geophysics
mound site in Jordan. To initially tackle the excavation of thissite, a geophysical survey was carried out that helped guidethe selection of the first excavation at the site.
Khirbat Faynan (Figure 1) is a multiperiod site locatedwhere Wadi Dana and Wadi Ghuwayr meet (becoming WadiFaynan) in the hyperarid Saharo-Arabian vegetation zone[9]. The site has a significant amount of well-preservedRoman and Byzantine ruins still visible. Previously, the Deut-sches Bergbau Museum under Andreas Hauptman and theCouncil for British Research in the Levant (CBRL) underGraeme Barker and colleagues surveyed the site [8, 10]. Tofacilitate a Paleoenvironmental study in the region, a smallsounding was made north of the site behind a large wallstructure called the “Barrage” [11, 12]. The site’s prominentposition next to the convergence of the two previouslymentioned wadis sets it apart in the landscape, and it is easyto postulate that it controlled the agricultural field systemsto the north and west, and access to the road leading fromthe copper-ore-rich lowlands to the highland plateau to theeast. While many have suggested the role of the “Khirbat” inthe region, there still lacks archaeological evidence to fullysupport these postulations. The 2011 ELRAP expedition wascodirected by Thomas Levy and Mohammad Najjar to beginto answer questions concerning the socioeconomic functionof the site during the Iron Age. With several significantperiods of occupation, it will require several seasons of exca-vation to fully articulate and understand the site. As partof this expedition, a geophysical survey of the site and itsimmediate surroundings was conducted in order to create ageological profile of the tell (Arabic : ancient mound site) andidentify primary candidates for excavation.
Full characterization of archaeological sites by conven-tional archaeological techniques can take years. Moreover,drilling and excavations, the most often applied methods forarchaeological assessment, are ground disturbing. Therefore,nondestructive geophysical techniques have been used todetect and map underground features in a fast and noninva-sive manner [13–16]. Among these techniques and based onprevious results in the same area [17], we decided to use EMI(electromagnetic induction) and ERT (electrical resistivitytomography). Electromagnetic techniques have been usedfor archaeological investigations of different sites [18, 19],including places with similar conditions in the Middle East[20, 21]. Similarly, resistivity surveying has commonly usedin noninvasive archaeological prospection [22, 23]. ERT isquite popular in archaeological investigations [24–27]. Thesuccess of the method depends on the difference between theresistivity properties of the potential archaeological targets(walls, roads, buildings, etc.) and the surrounding environ-ment [25]. In recent years, 3D ERT is being increasingly usedbecause it provides a three-dimensional view of the subsoilresistivity. Besides, this technology is considered well-suitedfor mapping Near Eastern tell sites [28].
The combination of EMI and ERT methods providesa flexible approach for planning archaeological excavations[29]. Our aim was to survey buried structures, especially IronAge ones, around the site. This paper shows the preliminaryresults of our archaeogeophysical investigations at KhirbatFaynan undertaken in 2011. After a brief description of the
Figure 1: Aerial view of Khirbat Faynan looking east showing theexcavation trench and excavators. Geophysical surveys were madearound the entire site. Scale, note that the trench is 40 m in lengthfrom west to east. Arrow indicates the location of 3D ERT survey(photo, UCSD Levantine Archaeology Lab).
Figure 2: Operator follows the string to ensure straight profiles onthe slopes of the site of Khirbat Faynan, Jordan. The instrument(photo, M. L. Vincent, UCSD Levantine Archaeology Lab) is kept ata constant distance from the ground surface.
area and past results of the ongoing project, we describe oursurvey strategies and data processing methods and offer anoverview of our findings to date.
2. Methodologies
Conditions around the site of Khirbat Faynan make someof the more successful techniques such as GPR (GroundPenetrating Radar) nearly impossible to employ. The groundsurface is generally covered with debris from earlier occupa-tion that would have to be cleared before any survey couldtake place. The process of clearing rocks would not only beexpensive in terms of time required to complete such a task,but would also be potentially invasive as it might put at riskexposed architecture which is not always immediately visibleamong the rock debris. It was decided that the next bestoptions were EMI and ERT, both being well suited for thedifficult terrain. These techniques allow for the characteriza-tion of the subsoil as well as the ability to detect anomaliesthat could be associated with buried structures or artifacts.
International Journal of Geophysics 3
3,390,700
3,390,750
3,390,800
3,390,850
3,390,900
3,390,950
3,391,000
3,391,050
3,391,100
3,391,150
3,391,200
3,391,250
3,391,300
738,
700
738,
750
738,
800
738,
850
738,
900
738,
950
739,
000
739,
050
739,
100
739,
150
739,
200
739,
250
739,
300
739,
350
739,
400
Con
duct
ivit
y (m
S/m
)
N
0
1
2
3
4
5
6
7
8
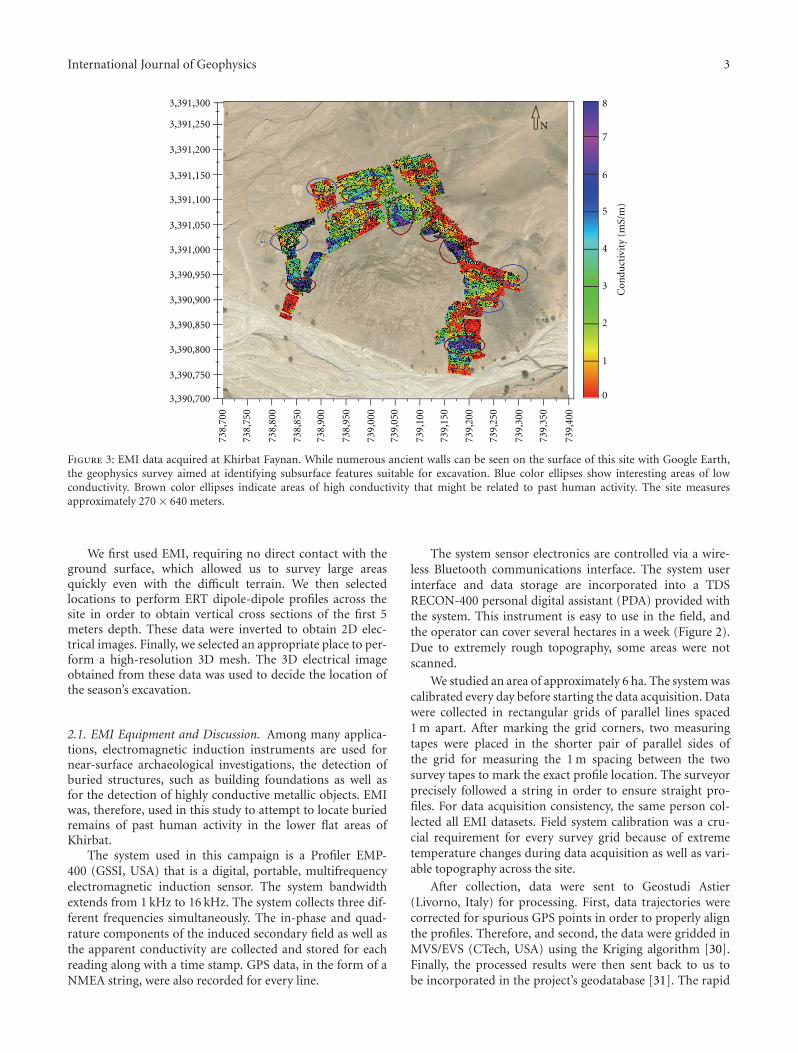
Figure 3: EMI data acquired at Khirbat Faynan. While numerous ancient walls can be seen on the surface of this site with Google Earth,the geophysics survey aimed at identifying subsurface features suitable for excavation. Blue color ellipses show interesting areas of lowconductivity. Brown color ellipses indicate areas of high conductivity that might be related to past human activity. The site measuresapproximately 270 × 640 meters.
We first used EMI, requiring no direct contact with theground surface, which allowed us to survey large areasquickly even with the difficult terrain. We then selectedlocations to perform ERT dipole-dipole profiles across thesite in order to obtain vertical cross sections of the first 5meters depth. These data were inverted to obtain 2D elec-trical images. Finally, we selected an appropriate place to per-form a high-resolution 3D mesh. The 3D electrical imageobtained from these data was used to decide the location ofthe season’s excavation.
2.1. EMI Equipment and Discussion. Among many applica-tions, electromagnetic induction instruments are used fornear-surface archaeological investigations, the detection ofburied structures, such as building foundations as well asfor the detection of highly conductive metallic objects. EMIwas, therefore, used in this study to attempt to locate buriedremains of past human activity in the lower flat areas ofKhirbat.
The system used in this campaign is a Profiler EMP-400 (GSSI, USA) that is a digital, portable, multifrequencyelectromagnetic induction sensor. The system bandwidthextends from 1 kHz to 16 kHz. The system collects three dif-ferent frequencies simultaneously. The in-phase and quad-rature components of the induced secondary field as well asthe apparent conductivity are collected and stored for eachreading along with a time stamp. GPS data, in the form of aNMEA string, were also recorded for every line.
The system sensor electronics are controlled via a wire-less Bluetooth communications interface. The system userinterface and data storage are incorporated into a TDSRECON-400 personal digital assistant (PDA) provided withthe system. This instrument is easy to use in the field, andthe operator can cover several hectares in a week (Figure 2).Due to extremely rough topography, some areas were notscanned.
We studied an area of approximately 6 ha. The system wascalibrated every day before starting the data acquisition. Datawere collected in rectangular grids of parallel lines spaced1 m apart. After marking the grid corners, two measuringtapes were placed in the shorter pair of parallel sides ofthe grid for measuring the 1 m spacing between the twosurvey tapes to mark the exact profile location. The surveyorprecisely followed a string in order to ensure straight pro-files. For data acquisition consistency, the same person col-lected all EMI datasets. Field system calibration was a cru-cial requirement for every survey grid because of extremetemperature changes during data acquisition as well as vari-able topography across the site.
After collection, data were sent to Geostudi Astier(Livorno, Italy) for processing. First, data trajectories werecorrected for spurious GPS points in order to properly alignthe profiles. Therefore, and second, the data were gridded inMVS/EVS (CTech, USA) using the Kriging algorithm [30].Finally, the processed results were then sent back to us tobe incorporated in the project’s geodatabase [31]. The rapid

4 International Journal of Geophysics
Wall ?
Set of walls and terraces“Paleo-River”
or deeper structure ?
310
305
300
295
290
285
280
275
270
0 10 20 30 40 50 60 70 80 90 100 110 120 130 140 150 160 170 180 210190 200
(m)(Resistivity)
10 31.6 100 316.2 1000
330
10
8
30
480
75
100
(ohm∗m)
Figure 4: 2D ERT line in the west side of the ancient mound.
Khirbat Faynan20113D ERT Horizontal slice
278.5 m Elev
875
5354
0 2 4 6 8 10
Meters
Resistivity (ohm∗m)
Figure 5: Semitransparent horizontal ERT slice at 1 m depth, overlaid on top of an aerial image of the excavation.

International Journal of Geophysics 5
0 1 2 3 4 5
875
Horizontal slice278.5 m Elev
Khirbat Faynan20113D ERT
Meters
5354
Resistivity (ohm∗m)
Figure 6: Walls found during the excavation superimposed on a horizontal ERT slide at 1 m depth.
processing allowed for minor adjustments to be made in thesurvey planning, prioritizing areas with greater potential andleaving areas where there was clearly no subsurface culturalremains.
2.2. ERT Equipment and Discussion. We used a Syscal Proresistivimeter (Iris Instruments, France) with 48 electrodesspaced by 0.5 meters. Four different sets of 2D ERT lines (24electrodes at 1 m separation each) were collected over 4 sides(north, south, east, and west) of the Khirbat Faynan mound.The main objective was to obtain vertical sections up to 6meters along the mound in order to investigate the differentlayers and distinguish cultural from natural layers.
Additionally, a small 3D ERT survey was collected inorder to facilitate excavation. The 3D ERT survey used a setof parallel 2D profiles with a separation of 0.5 m amongelectrodes. The surveyed area of 24 m × 5 m included 6 ERTprofiles. Both dipole-dipole and Wenner arrays were per-formed.
Data acquisition proved to be particularly challengingdue to the extremely dry soil, preventing electrical conduc-tivity, and abundance of rocks under the surface, impedingeasy introduction of the metal stakes into the ground. Whilethe later was not easily overcome, the former was improvedthrough a mixture of water, clay, and salt producing aremarkably conductive medium which could be poured overeach electrode.
After collection, data were sent to Geostudi Astier(Livorno, Italy) for inversion using ERTLab software (Multi-Phase Technologies LLC, USA and Geostudi Astier srl, Italy)
and generation of final maps within the software MVS/EVS(CTech, USA) and ArcMap 10 (ESRI, USA). The main pur-pose of the 3D ERT survey was to delineate buried stonewallsto guide archaeological excavations.
In our processing, full three-dimensional inversions ofapparent resistivities are performed using a specific custo-mized tool, derived from the ERTLab 3D inversion software,which uses a finite-element (FEM) approach to model thesubsoil by adopting mesh of hexahedrons to correctly incor-porate terrain topography [32]. Throughout the inversioniterations, the effect of non-Gaussian noise is appropriatelymanaged using a robust data weighting algorithm [33, 34].
This past season, new benchmarks were placed aroundand on top of the tell with an RTK GPS system to ensureprecise control of the surveying. Unlike EMI, the ERT hasno self-georeferencing system. Therefore, the ERT was geo-referenced using a reflectorless total station, which couldmeasure the precise position of the stakes with or without aprism. Each individual line was shot in its entirety in orderto provide redundancy when the lines were then matchedup during the postprocessing. Since GIS has been a majorcomponent of the ELRAP field recording system since 1999[35], there was already an infrastructure in place to relatethe geophysical data with the archaeological data. As part ofthis recording system, daily aerial photographs are taken doc-umenting the position of significant architectural features.Each photograph can be correlated with the daily elevationsto know exactly what the elevations of the exposed layers are.This enabled us to lay the 3D ERT slices that correspondedto each aerial photograph’s elevation in order to study therelationship of the geophysics with the archaeological record.
6 International Journal of Geophysics
Wall 1048Wall 1057
Wall 1126Wall 1032Wall 1125Wall 1031Wall 1049
0 1 2 3 40.5
Meters
280.28278.26
280.66279.81
280.53
279.82
280.95280.36
280.84280.42
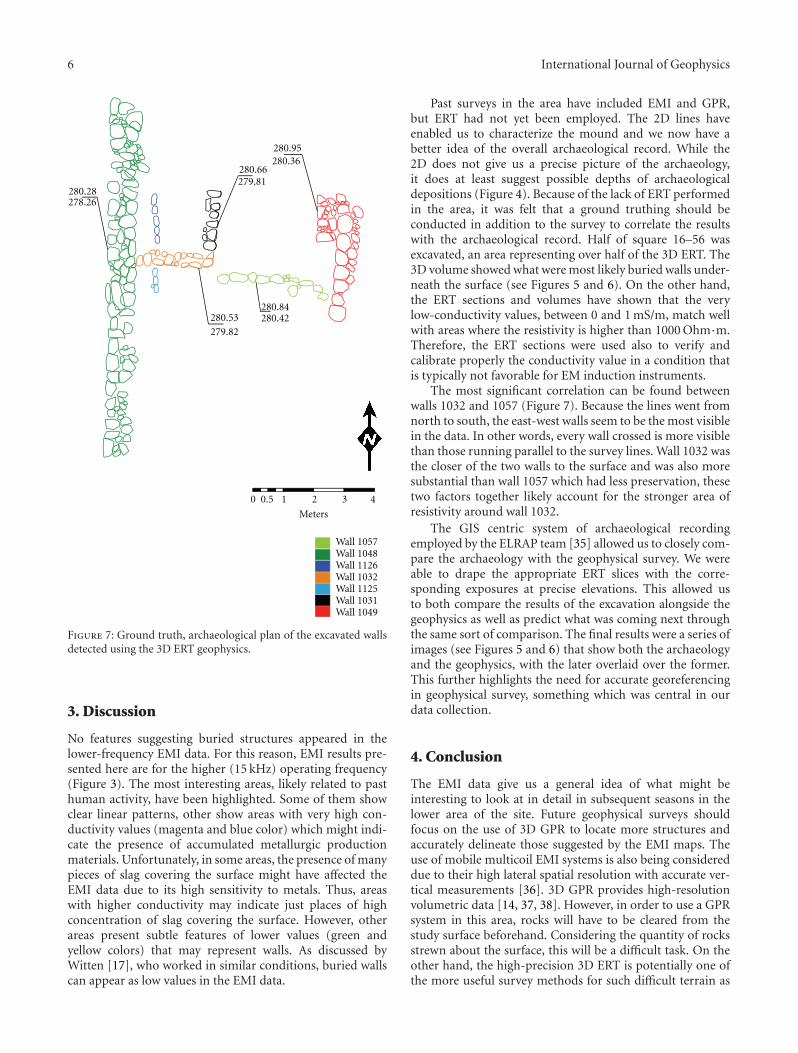
Figure 7: Ground truth, archaeological plan of the excavated wallsdetected using the 3D ERT geophysics.
3. Discussion
No features suggesting buried structures appeared in thelower-frequency EMI data. For this reason, EMI results pre-sented here are for the higher (15 kHz) operating frequency(Figure 3). The most interesting areas, likely related to pasthuman activity, have been highlighted. Some of them showclear linear patterns, other show areas with very high con-ductivity values (magenta and blue color) which might indi-cate the presence of accumulated metallurgic productionmaterials. Unfortunately, in some areas, the presence of manypieces of slag covering the surface might have affected theEMI data due to its high sensitivity to metals. Thus, areaswith higher conductivity may indicate just places of highconcentration of slag covering the surface. However, otherareas present subtle features of lower values (green andyellow colors) that may represent walls. As discussed byWitten [17], who worked in similar conditions, buried wallscan appear as low values in the EMI data.
Past surveys in the area have included EMI and GPR,but ERT had not yet been employed. The 2D lines haveenabled us to characterize the mound and we now have abetter idea of the overall archaeological record. While the2D does not give us a precise picture of the archaeology,it does at least suggest possible depths of archaeologicaldepositions (Figure 4). Because of the lack of ERT performedin the area, it was felt that a ground truthing should beconducted in addition to the survey to correlate the resultswith the archaeological record. Half of square 16–56 wasexcavated, an area representing over half of the 3D ERT. The3D volume showed what were most likely buried walls under-neath the surface (see Figures 5 and 6). On the other hand,the ERT sections and volumes have shown that the verylow-conductivity values, between 0 and 1 mS/m, match wellwith areas where the resistivity is higher than 1000 Ohm·m.Therefore, the ERT sections were used also to verify andcalibrate properly the conductivity value in a condition thatis typically not favorable for EM induction instruments.
The most significant correlation can be found betweenwalls 1032 and 1057 (Figure 7). Because the lines went fromnorth to south, the east-west walls seem to be the most visiblein the data. In other words, every wall crossed is more visiblethan those running parallel to the survey lines. Wall 1032 wasthe closer of the two walls to the surface and was also moresubstantial than wall 1057 which had less preservation, thesetwo factors together likely account for the stronger area ofresistivity around wall 1032.
The GIS centric system of archaeological recordingemployed by the ELRAP team [35] allowed us to closely com-pare the archaeology with the geophysical survey. We wereable to drape the appropriate ERT slices with the corre-sponding exposures at precise elevations. This allowed usto both compare the results of the excavation alongside thegeophysics as well as predict what was coming next throughthe same sort of comparison. The final results were a series ofimages (see Figures 5 and 6) that show both the archaeologyand the geophysics, with the later overlaid over the former.This further highlights the need for accurate georeferencingin geophysical survey, something which was central in ourdata collection.
4. Conclusion
The EMI data give us a general idea of what might beinteresting to look at in detail in subsequent seasons in thelower area of the site. Future geophysical surveys shouldfocus on the use of 3D GPR to locate more structures andaccurately delineate those suggested by the EMI maps. Theuse of mobile multicoil EMI systems is also being considereddue to their high lateral spatial resolution with accurate ver-tical measurements [36]. 3D GPR provides high-resolutionvolumetric data [14, 37, 38]. However, in order to use a GPRsystem in this area, rocks will have to be cleared from thestudy surface beforehand. Considering the quantity of rocksstrewn about the surface, this will be a difficult task. On theother hand, the high-precision 3D ERT is potentially one ofthe more useful survey methods for such difficult terrain as
International Journal of Geophysics 7
a rock-strewn tell. The time required to clean the surface ofrocks as well as sort out what was tumble and what was partof existing architecture, would have proved far too costly tomake it a viable technique for wide-area surveys. Indeed, the3D ERT is still expensive in terms of human hours requiredto employ it; however, the technique is much less disturbingwith high potential for excellent results.
The results from this season’s work suggest that 3D ERTis a useful method for geophysical survey in difficult con-ditions that prevent the use of GPR. However, future workshould include continued 3D ERT survey to conduct furthercorrelation between the data and the archaeological record.Likewise, continued use of EMI can be helpful in revealingpromising areas for more precise geophysical survey. Withnewer instruments, EMI is continuing to increase in preci-sion and could potentially become one of the more usefultools as precision becomes more like that of ERT or GPR.Until such a time, however, EMI surveys like ours do notappear to offer much beyond that of general characterizationof subsurface features. Southern Jordan continues to be anideal place for testing geophysical survey techniques in diffi-cult and harsh environments. The two techniques employedat Khirbat Faynan both resulted in success, each in their ownway. We found that EMI helped to guide us towards theregions that we wanted to investigate further with higher-precision survey tools. This saved us countless hours con-sidering the difficulty of employing the ERT versus that ofEMI. Ultimately, the two tools together offered the best geo-physical kit for our environment.
Acknowledgments
The authors are grateful to the Department of Antiquities(DOA) of Jordan for its help and interest in the 2011 ELRAPexpedition. In particular, Jehad Haroun, Khalil Hamdan,Qutaiba al-Dasouqi, and especially Abdelrahim Al Dwikatand Zouhair Zoubi who served as DOA representatives toour project. Thanks also to Barabara Porter (director) andChristopher Tuttle (associate director) of the AmericanCenter of Oriental Research (ACOR), Amman, for theirhelp and support. Members of most of the Bedouin tribesfrom the Qurayqira/Faynan villages worked on the project.Funding for this project came from: Research Opportunities(CSRO) Grant program; NSF grant EAR-Geophysics, 09-539; National Geographic Society (Grant no. 8974-11), theJerome and Miram Katzin Family Foundation, and theNorma and Reuben Kershaw Family Foundation. M. Vincentwas supported by the National Science Foundation IGERT(Integrative Graduate Education and Research): Training,Research and Education in Engineering for Cultural HeritageDiagnostics (NSF 0966375), where T. E. Levy serves as co-PI. A special thanks to Ramesh Rao, director, Calit2 SanDiego Division for his support of the ELRAP expedition.They deeply appreciate the hard work carried out by theundergraduate students enrolled in the UCSD Middle EastArchaeology Field School that forms part of the ELRAPresearch endeavor. The 2011 ELRAP expedition was directedby T. E. Levy and Mohammand Najjar. They thank M. Najjar
for his collegiality and interaction in the field. Thanks alsoto Gianfranco Morelli, Geostudi Astier, for help with dataprocessing.
References
[1] R. Slatt, W. C. King, J. Molyneux et al., “Tribute to Dr. AlanWitten,” Earth Scientist, pp. 9–23, 2005.
[2] A. J. Witten, Handbook of Geophysics and Archaeology, EquinoxPub, 2006.
[3] T. E. Levy, T. Higham, C. B. Ramsey et al., “High-precisionradiocarbon dating and historical biblical archaeology insouthern Jordan,” Proceedings of the National Academy ofSciences of the United States of America, vol. 105, no. 43, pp.16460–16465, 2008.
[4] E. Ben-Yosef, T. E. Levy, T. Higham, M. Najjar, and L. Tauxe,“The beginning of Iron Age copper production in the southernLevant: new evidence from Khirbat al-Jariya, Faynan, Jordan,”Antiquity, vol. 84, no. 325, pp. 724–746, 2010.
[5] E. Ben-Yosef, T. E. Levy, and M. Najjar, “Ras al-Miyah for-tresses: new discoveries at one of the gateways to the iron agecopper production district of Faynan, Jordan,” pp. 832–841,2009.
[6] E. Ben-Yosef, T. E. Levy, and M. Najjar, “New iron age copper-mine fields discovered in southern Jordan,” Near EasternArchaeology, vol. 72, no. 2, pp. 98–101, 2009.
[7] T. E. Levy, E. Ben-Yosef, and M. Najjar, “New perspectiveson iron age copper production and society in the FaynanRegion, Jordan,” in Eastern Mediterranean Metallurgy andMetalwork in the Second Millenium BC, V. Kassianidou, Ed.,Oxbox Books, Oxford, UK, 2012.
[8] G. Barker, D. D. Gilbertson, and D. J. Mattingly, Archaeologyand Desertification: The Wadi Faynan Landscape Survey,Southern Jordan, Oxbow, 2007.
[9] C. E. Cordova, Millennial Landscape Change in Jordan: Geoar-chaeology and Cultural Ecology, The University of ArizonaPress, 2007.
[10] A. Hauptmann, The Archaeometallurgy of Copper: Evidencefrom Faynan, Jordan, Springer, 2007.
[11] J. P. Grattan, D. D. Gilbertson, and C. O. Hunt, “The localand global dimensions of metalliferous pollution derived froma reconstruction of an eight thousand year record of coppersmelting and mining at a desert-mountain frontier in south-ern Jordan,” Journal of Archaeological Science, vol. 34, no. 1, pp.83–110, 2007.
[12] C. O. Hunt, D. D. Gilbertson, and H. A. El-Rishi, “An 8000-year history of landscape, climate, and copper exploitation inthe Middle East: the Wadi Faynan and the Wadi Dana NationalReserve in southern Jordan,” Journal of Archaeological Science,vol. 34, no. 8, pp. 1306–1338, 2007.
[13] B. W. Bevan, “Geophysical exploration for archaeology: anintroduction to geophysical exploration,” Midwest Archae-ological Center Special Report 1, U.S. Department of theInterior, National Park Service, Lincoln, Neb, USA, 1998.
[14] L. B. Conyers and D. Goodman, Ground-Penetrating Radar: AnIntroduction for Archaeologists, AltaMira Press, 1997.
[15] C. Gaffney, “Detecting trends in the prediction of the buriedpast: a review of geophysical techniques in archaeology,”Archaeometry, vol. 50, no. 2, pp. 313–336, 2008.
[16] K. L. Kvamme, “Geophysical surveys as landscape archaeol-ogy,” American Antiquity, vol. 68, no. 3, pp. 435–457, 2003.
8 International Journal of Geophysics
[17] A. J. Witten, T. E. Levy, R. B. Adams, and I. Won, “Geophysicalsurveys in the Jebel Hamrat Fidan, Jordan,” Geoarchaeology,vol. 15, no. 2, pp. 135–150, 2000.
[18] D. Simpson, A. Lehouck, M. Van Meirvenne, J. Bourgeois, E.Thoen, and J. Vervloet, “Geoarchaeological prospection of amedieval manor in the Dutch polders using an electromag-netic induction sensor in combination with soil augerings,”Geoarchaeology, vol. 23, no. 2, pp. 305–319, 2008.
[19] A. Tabbagh, “Applications and advantages of the Slingramelectromagnetic method for archaeological prospecting,” Geo-physics, vol. 51, no. 3, pp. 576–584, 1986.
[20] B. Frohlich and W. J. Lancaster, “Electromagnetic surveyingin current Middle Eastern archaeology: application andevaluation.,” Geophysics, vol. 51, no. 7, pp. 1414–1425, 1986.
[21] A. Witten, G. Calvert, B. Witten, and T. Levy, “Magnetic andelectromagnetic induction studies at archaeological sites inSouthwestern Jordan,” Journal of Environmental and Engineer-ing Geophysics, vol. 8, no. 3, pp. 209–215, 2003.
[22] M. Dabas, A. Hesse, and J. Tabbagh, “Experimental resistivitysurvey at Wroxeter archaeological site with a fast and lightrecording device,” Archaeological Prospection, vol. 7, no. 2, pp.107–118, 2000.
[23] I. Scollar, A. Tabbagh, A. Hesse, and I. Herzog, ArchaeologicalProspecting and Remote Sensing, Cambridge University Press,Cambridge, UK, 1990.
[24] M. Drahor, M. Berge, and O. Caner, “Integrated geophysicalsurveys for the subsurface mapping of buried structures underand surrounding of the Agios Voukolos Church in Izmir,Turkey,” Journal of Archaeological Science, vol. 38, no. 9, pp.2231–2242, 2001.
[25] S. Negri, G. Leucci, and F. Mazzone, “High resolution 3D ERTto help GPR data interpretation for researching archaeologicalitems in a geologically complex subsurface,” Journal of AppliedGeophysics, vol. 65, no. 3-4, pp. 111–120, 2008.
[26] G. N. Tsokas, P. I. Tsourlos, G. Vargemezis, and M. Novack,“Non-destructive electrical resistivity tomography for indoorinvestigation: the case of Kapnikarea Church in Athens,” Arch-aeological Prospection, vol. 15, no. 1, pp. 47–61, 2008.
[27] P. I. Tsourlos and G. N. Tsokas, “Non-destructive electricalresistivity tomography survey at the South Walls of the Acro-polis of Athens,” Archaeological Prospection, vol. 18, no. 3, pp.173–186, 2011.
[28] J. Casana, J. T. Herrmann, and A. Fogel, “Deep subsurfacegeophysical prospection at Tell Qarqur, Syria,” ArchaeologicalProspection, vol. 15, no. 3, pp. 207–225, 2008.
[29] A. Osella, M. de la Vega, and E. Lascano, “3D electrical imagingof an archaeological site using electrical and electromagneticmethods,” Geophysics, vol. 70, no. 4, pp. G101–G107, 2005.
[30] G. Matheron, “Principles of geostatistics,” Economic Geology,vol. 58, no. 8, pp. 1246–1266, 1963.
[31] T. E. Levy, M. Najjar, A. D. Gidding et al., “The 2011 EdomLowlands Regional Archaeology Project (ELRAP): Excavationsand Surveys in the Faynan Copper Ore District, Jordan,”Annual of the Department of Antiquities of Jordan.
[32] Z. Bing and S. A. Greenhalgh, “Finite element three-dimen-sional direct current resistivity modelling: accuracy and effi-ciency considerations,” Geophysical Journal International, vol.145, no. 3, pp. 679–688, 2001.
[33] D. J. LaBrecque, M. Miletto, W. Daily, A. Ramirez, and E.Owen, “The effects of noise on Occam’s inversion of resistivitytomography data,” Geophysics, vol. 61, no. 2, pp. 538–548,1996.
[34] G. Morelli and D. J. Labrecque, “Advances in ERT inversemodeling,” European Journal of Environmental and EngineeringGeophysics, vol. 1, no. 2, pp. 171–186, 1996.
[35] T. Levy, V. Petrovic, T. Wypych et al., On-Site Digital Archaeol-ogy 3.0 and Cyber-Archaeology: Into the Future of the Past–NewDevelopments, Delivery and the Creation of a Data Avalanche,Introduction to Cyber-Archaeology, Archaeopress, Oxford,UK, 2010.
[36] P. De Smedt, M. Van Meirvenne, E. Meerschman et al.,“Reconstructing palaeochannel morphology with a mobilemulticoil electromagnetic induction sensor,” Geomorphology,vol. 130, no. 3-4, pp. 136–141, 2011.
[37] J. Leckebusch, “Ground-penetrating radar: a modern three-dimensional prospection method,” Archaeological Prospection,vol. 10, no. 4, pp. 213–240, 2003.
[38] A. Novo, M. Grasmueck, D. Viggiano, and H. Lorenzo, “3DGPR in archaeology: what can be gained from dense dataacquisition and processing,” in Proceedings of the 12th Inter-national Conference on Ground Penetrating Radar, pp. 16–19,2008.

Submit your manuscripts athttp://www.hindawi.com
Hindawi Publishing Corporationhttp://www.hindawi.com Volume 2014
ClimatologyJournal of
EcologyInternational Journal of
Hindawi Publishing Corporationhttp://www.hindawi.com Volume 2014
EarthquakesJournal of
Hindawi Publishing Corporationhttp://www.hindawi.com Volume 2014
Hindawi Publishing Corporationhttp://www.hindawi.com
Applied &EnvironmentalSoil Science
Volume 2014
Mining
Hindawi Publishing Corporationhttp://www.hindawi.com Volume 2014
Journal of
Hindawi Publishing Corporation http://www.hindawi.com Volume 2014
International Journal of
Geophysics
OceanographyInternational Journal of
Hindawi Publishing Corporationhttp://www.hindawi.com Volume 2014
Journal of Computational Environmental SciencesHindawi Publishing Corporationhttp://www.hindawi.com Volume 2014
Journal ofPetroleum Engineering
Hindawi Publishing Corporationhttp://www.hindawi.com Volume 2014
GeochemistryHindawi Publishing Corporationhttp://www.hindawi.com Volume 2014
Journal of
Atmospheric SciencesInternational Journal of
Hindawi Publishing Corporationhttp://www.hindawi.com Volume 2014
OceanographyHindawi Publishing Corporationhttp://www.hindawi.com Volume 2014
Advances in
Hindawi Publishing Corporationhttp://www.hindawi.com Volume 2014
MineralogyInternational Journal of
Hindawi Publishing Corporationhttp://www.hindawi.com Volume 2014
MeteorologyAdvances in
The Scientific World JournalHindawi Publishing Corporation http://www.hindawi.com Volume 2014
Paleontology JournalHindawi Publishing Corporationhttp://www.hindawi.com Volume 2014
ScientificaHindawi Publishing Corporationhttp://www.hindawi.com Volume 2014
Hindawi Publishing Corporationhttp://www.hindawi.com Volume 2014
Geological ResearchJournal of
Hindawi Publishing Corporationhttp://www.hindawi.com Volume 2014
Geology Advances in