geoframe - odp legacyodplegacy.org/pdf/operations/engineering/logging_tools/geoframe... · geoframe...
TRANSCRIPT
GeoFrame
Description
♦ Viewing, manipulating, and interpreting 1D log data(resistivity, density, porosity, natural gamma radiation,acoustic velocity, magnetic susceptibility, etc.)
♦ Viewing, manipulating, and interpreting 2D log data,such as FMS images and resistivity-at-bit (RAB)images, including orientations of dipping beds andfractures
♦ Extensive seismic interpretation (IESX)♦ Comparison of core and log data
Applications
ODP Logging Services, Lamont-Doherty Earth Observatory, Rt. 9W, Palisades, NY 10964
GeoFrame is an industry-standard software packageproduced by Schlumberger GeoQuest for managing andanalyzing borehole and seismic data. It has been in use byODP Logging Services for several years for processing andinterpreting Formation MicroScanner (FMS) resistivityimages. Log data, sent by satellite from the ODP drillshipto Lamont-Doherty Earth Observatory are processed usingGeoFrame software. This includes depth adjustments so thatthere are no depth offsets between data from differentlogging runs, corrections specific to certain tools and logs,conversion of the data to a widely accessible format (ASCIIfor the conventional logs, GIF for the FMS images), andinclusion on the online ODP log database. More recently,the seismic interpretation applications (IESX) withinGeoFrame have been used for generating syntheticseismograms and interpreting seismic site surveys. WithinGeoFrame, data are stored in an Oracle database. Thesoftware is available on the JOIDES Resolution and at theODP log interpretation centers at New York, Leicester,Montpellier, Tokyo, and Aachen.
WellEdit is the main log viewing and editingapplication within GeoFrame. Here it is used todisplay natural gamma, resistivity, sonic velocity,and caliper logs.
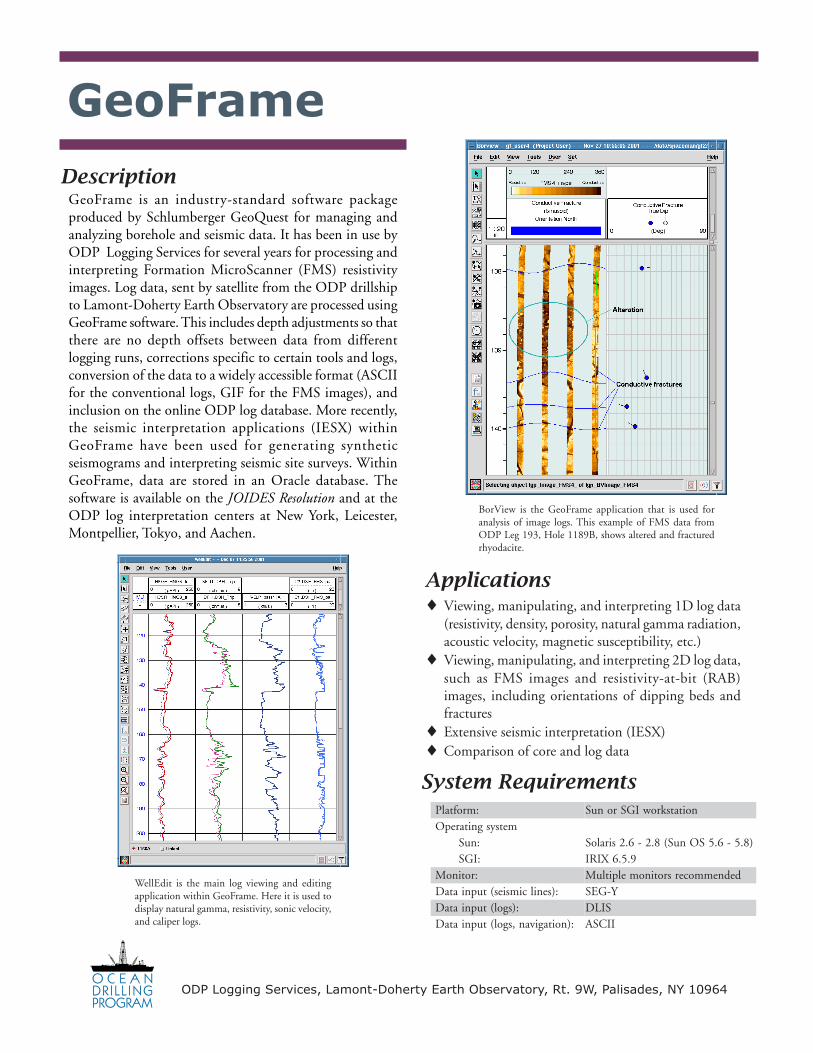
BorView is the GeoFrame application that is used foranalysis of image logs. This example of FMS data fromODP Leg 193, Hole 1189B, shows altered and fracturedrhyodacite.
System Requirements
:mroftalP noitatskrowIGSronuSmetsysgnitarepO
:nuS )8.5-6.5SOnuS(8.2-6.2siraloS:IGS 9.5.6XIRI:rotinoM dednemmocersrotinomelpitluM
:)senilcimsies(tupniataD Y-GES:)sgol(tupniataD SILD
:)noitagivan,sgol(tupniataD IICSA
IESX
Description
ODP Logging Services, Lamont-Doherty Earth Observatory, Rt. 9W, Palisades, NY 10964
ProceduresPrior to a drilling leg, the available seismic navigation andtrace (SEG-Y) data for the area are loaded into a GeoFrame/IESX project, along with the locations of existing andproposed sites. During the leg, density and acoustic velocitydata (from both core and downhole log measurements) areloaded into IESX, and used as input for the syntheticseismogram. The reflections in the “synthetic” are matchedto the reflections in the seismic section, so that the sectioncan be interpreted in terms of the actual formations. Post-cruise, IESX output can be exported to other applicationsand combined with other data types to producecomprehensive, integrated data sets.
IESX is a data integration package that allows the user tointegrate seismic, log, and physical properties data. It is partof Schlumberger GeoQuest’s GeoFrame software, and hasbeen in use by ODP, initially on a trial basis, since Leg 188.IESX has proven to be especially effective in the integrationof log and seismic data into a single coherent project. Someof the features of IESX that are most useful to ODP scientistsinclude: 1) basemap display of seismic lines and wells; 2)interactive 2-D visualization/interpretation of individual orintersecting seismic lines; 3) generation of syntheticseismograms from density and acoustic velocity data, andtheir superposition on seismic lines; 4) 3-D interactivevisualization of seismic lines and wells; and 5) basicmanipulation of the seismic data, such as gain control andfiltering. GeoFrame and IESX software are available for useby any ODP scientist at the ODP Log Analysis Centers
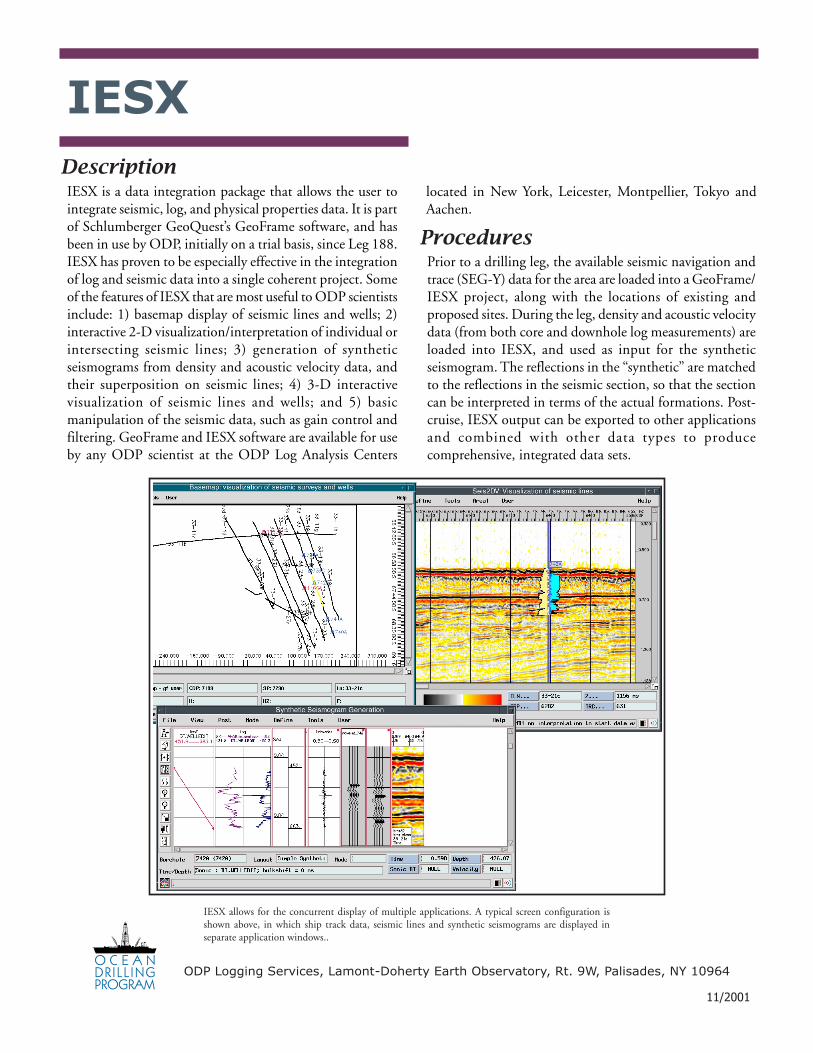
IESX allows for the concurrent display of multiple applications. A typical screen configuration isshown above, in which ship track data, seismic lines and synthetic seismograms are displayed inseparate application windows..
located in New York, Leicester, Montpellier, Tokyo andAachen.
11/2001