geo-resistivity surveys for faults identification · pdf filegeo-resistivity surveys for...
TRANSCRIPT
The 14th
World Conference on Earthquake Engineering October 12-17, 2008, Beijing, China
GEO-RESISTIVITY SURVEYS FOR FAULTS IDENTIFICATION IN GEOTECHNICAL DAMAGES AREA FROM YOGYAKARTA EARTHQUAKE
OF MAY 27, 2006
S.A. Rosyidi1,*
, S.B. Lesmana1, J. Wintolo
2, Z. Chik
3 and M.R. Taha
4
1Senior Lecturer, Dept. of Civil Engineering , Muhammadiyah University of Yogyakarta, Indonesia
2 SeniorLecturer, Dept. of Geology, Gadjah Mada University, Yogyakarta, Indonesia
3Assoc.Prof,
4Professor, Dept. of Civil & Structural Engineering , Universiti Kebangsaan Malaysia, Malaysia
*Email: [email protected]
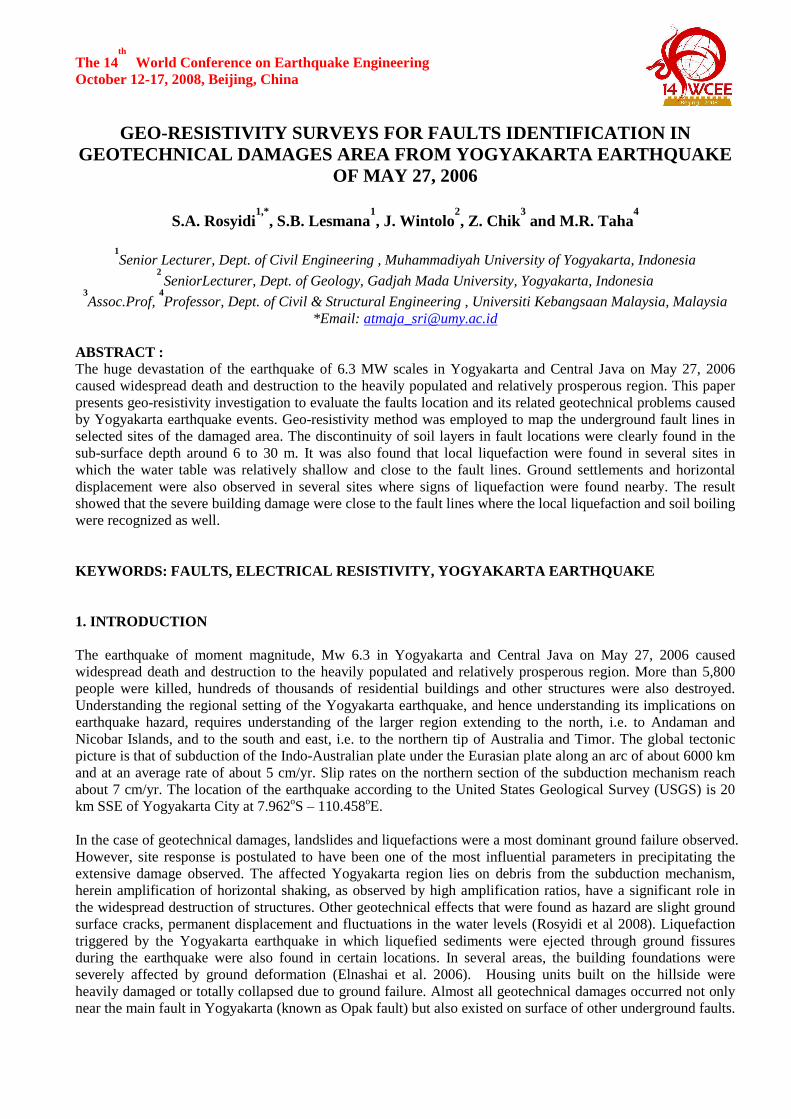
ABSTRACT : The huge devastation of the earthquake of 6.3 MW scales in Yogyakarta and Central Java on May 27, 2006 caused widespread death and destruction to the heavily populated and relatively prosperous region. This paper presents geo-resistivity investigation to evaluate the faults location and its related geotechnical problems caused by Yogyakarta earthquake events. Geo-resistivity method was employed to map the underground fault lines in selected sites of the damaged area. The discontinuity of soil layers in fault locations were clearly found in the sub-surface depth around 6 to 30 m. It was also found that local liquefaction were found in several sites in which the water table was relatively shallow and close to the fault lines. Ground settlements and horizontal displacement were also observed in several sites where signs of liquefaction were found nearby. The result showed that the severe building damage were close to the fault lines where the local liquefaction and soil boiling were recognized as well. KEYWORDS: FAULTS, ELECTRICAL RESISTIVITY, YOGYAKARTA EARTHQUAKE 1. INTRODUCTION The earthquake of moment magnitude, Mw 6.3 in Yogyakarta and Central Java on May 27, 2006 caused widespread death and destruction to the heavily populated and relatively prosperous region. More than 5,800 people were killed, hundreds of thousands of residential buildings and other structures were also destroyed. Understanding the regional setting of the Yogyakarta earthquake, and hence understanding its implications on earthquake hazard, requires understanding of the larger region extending to the north, i.e. to Andaman and Nicobar Islands, and to the south and east, i.e. to the northern tip of Australia and Timor. The global tectonic picture is that of subduction of the Indo-Australian plate under the Eurasian plate along an arc of about 6000 km and at an average rate of about 5 cm/yr. Slip rates on the northern section of the subduction mechanism reach about 7 cm/yr. The location of the earthquake according to the United States Geological Survey (USGS) is 20 km SSE of Yogyakarta City at 7.962oS – 110.458oE. In the case of geotechnical damages, landslides and liquefactions were a most dominant ground failure observed. However, site response is postulated to have been one of the most influential parameters in precipitating the extensive damage observed. The affected Yogyakarta region lies on debris from the subduction mechanism, herein amplification of horizontal shaking, as observed by high amplification ratios, have a significant role in the widespread destruction of structures. Other geotechnical effects that were found as hazard are slight ground surface cracks, permanent displacement and fluctuations in the water levels (Rosyidi et al 2008). Liquefaction triggered by the Yogyakarta earthquake in which liquefied sediments were ejected through ground fissures during the earthquake were also found in certain locations. In several areas, the building foundations were severely affected by ground deformation (Elnashai et al. 2006). Housing units built on the hillside were heavily damaged or totally collapsed due to ground failure. Almost all geotechnical damages occurred not only near the main fault in Yogyakarta (known as Opak fault) but also existed on surface of other underground faults.
The 14th
World Conference on Earthquake Engineering October 12-17, 2008, Beijing, China The underground faults have been difficult to identify due to the limited information from geological maps and deeper soil profiles. In order to observe the underground faults in the geotechnical damage area, integrated geophysical and soil investigation, i.e. geo-electric resistivity or (electrical resistivity sounding) and drilling test were conducted in selected area. The electrical resistivity is a method where electric current is applied to the ground and the difference in its potential produces geo-resistivity values. The method is now commonly used by engineers in geotechnical and underground works as a method to obtain information of the subsurface including the profiles and the geo-material index. This paper presents findings on underground faults identification by electrical resistivity technique and drilling tests. Three geological cross sections have been generated for identifying the underground faults in geotechnical damages area caused by the Yogyakarta earthquake. 3. RESEARCH METHODS 3.1 Location of Study The location of study was chosen in the Universitas Muhammadiyah Yogyakarta (UMY) campus in which almost 80 % of buildings sufferred medium severity caused by the earthquake. Rosyidi et al. (2008) conducted visual observations on structural and geotechnical damages in the UMY campus after the earthquake. Ground settlements, horizontal displacements and liquefactions around the campus were observed as shown in Figure 1. Furthermore, structural damages on campus buildings were also observed (Figure 2). Based on the rock formation and compilation of visual observation of the structural and geotechnical damages, a geological map which focused on the location of the study area (surrounding the Gamping district and UMY campus) was generated as shown in Figure 3. In the damaged area, some predicted underground cracks and faults were drawn with the direction of north to south (NS) located in the western of the UMY campus. A soil investigation using geo-resistivity and drilling test were carried out in this area.
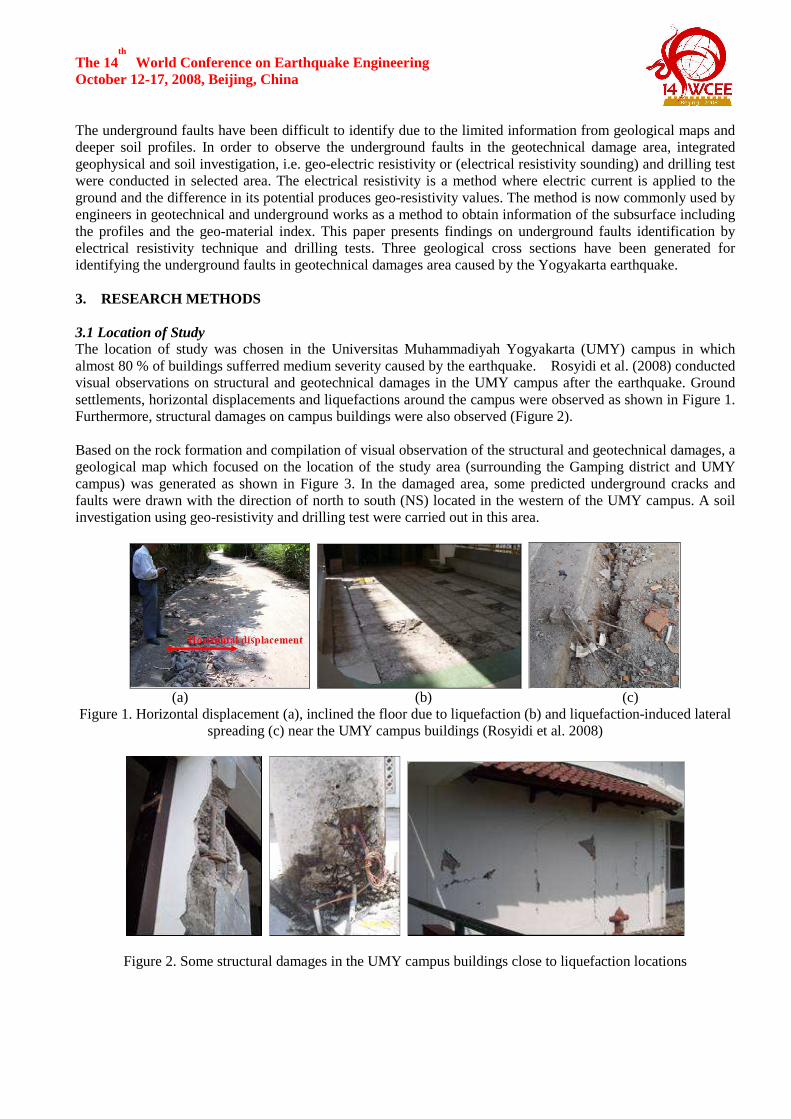
(a) (b) (c)
Figure 1. Horizontal displacement (a), inclined the floor due to liquefaction (b) and liquefaction-induced lateral spreading (c) near the UMY campus buildings (Rosyidi et al. 2008)
Figure 2. Some structural damages in the UMY campus buildings close to liquefaction locations
The 14th
World Conference on Earthquake Engineering October 12-17, 2008, Beijing, China
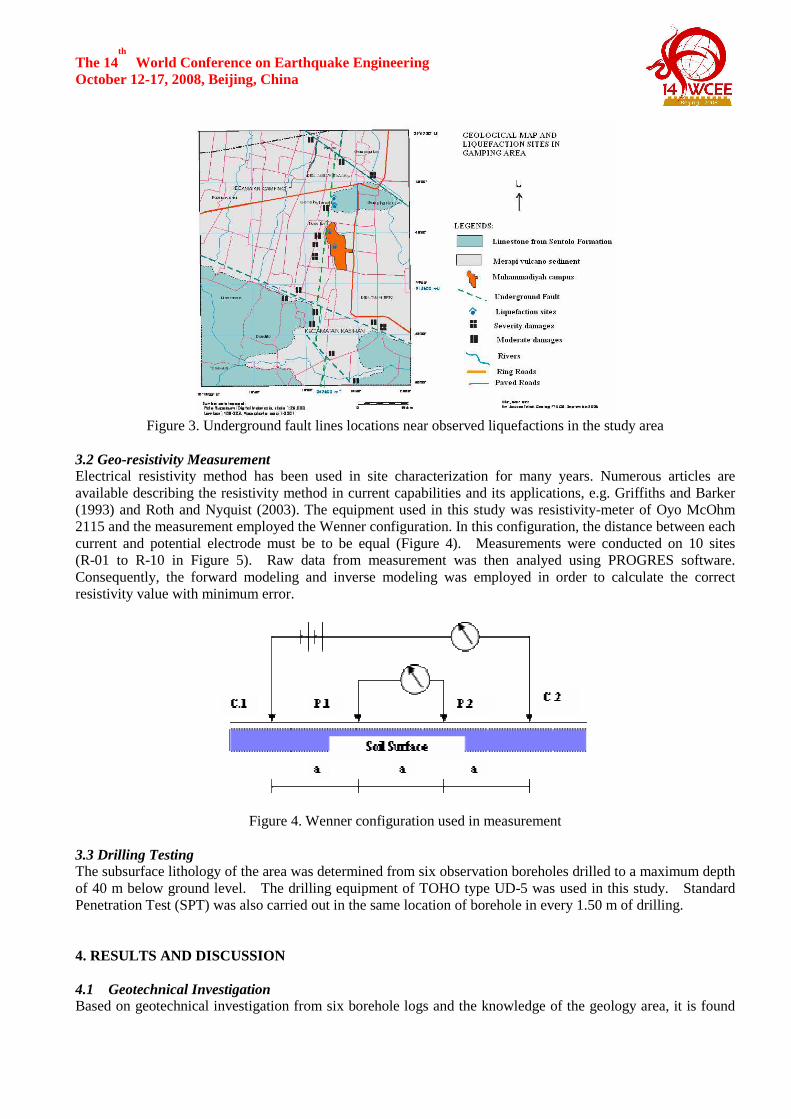
Figure 3. Underground fault lines locations near observed liquefactions in the study area
3.2 Geo-resistivity Measurement Electrical resistivity method has been used in site characterization for many years. Numerous articles are available describing the resistivity method in current capabilities and its applications, e.g. Griffiths and Barker (1993) and Roth and Nyquist (2003). The equipment used in this study was resistivity-meter of Oyo McOhm 2115 and the measurement employed the Wenner configuration. In this configuration, the distance between each current and potential electrode must be to be equal (Figure 4). Measurements were conducted on 10 sites (R-01 to R-10 in Figure 5). Raw data from measurement was then analyed using PROGRES software. Consequently, the forward modeling and inverse modeling was employed in order to calculate the correct resistivity value with minimum error.
Figure 4. Wenner configuration used in measurement 3.3 Drilling Testing The subsurface lithology of the area was determined from six observation boreholes drilled to a maximum depth of 40 m below ground level. The drilling equipment of TOHO type UD-5 was used in this study. Standard Penetration Test (SPT) was also carried out in the same location of borehole in every 1.50 m of drilling. 4. RESULTS AND DISCUSSION 4.1 Geotechnical Investigation Based on geotechnical investigation from six borehole logs and the knowledge of the geology area, it is found
The 14th
World Conference on Earthquake Engineering October 12-17, 2008, Beijing, China that the soil stratification in the study area is categorized as sedimentary sandy soil with variable layers of sands to gravel at the boundaries of the Sleman and Yogyakarta formation. These layers overlay the bedrock formation or basement which is found between 58 to 75 m (Figure 3). The lithology correlation from borehole logs is also summarized (Figure 6) as follows.
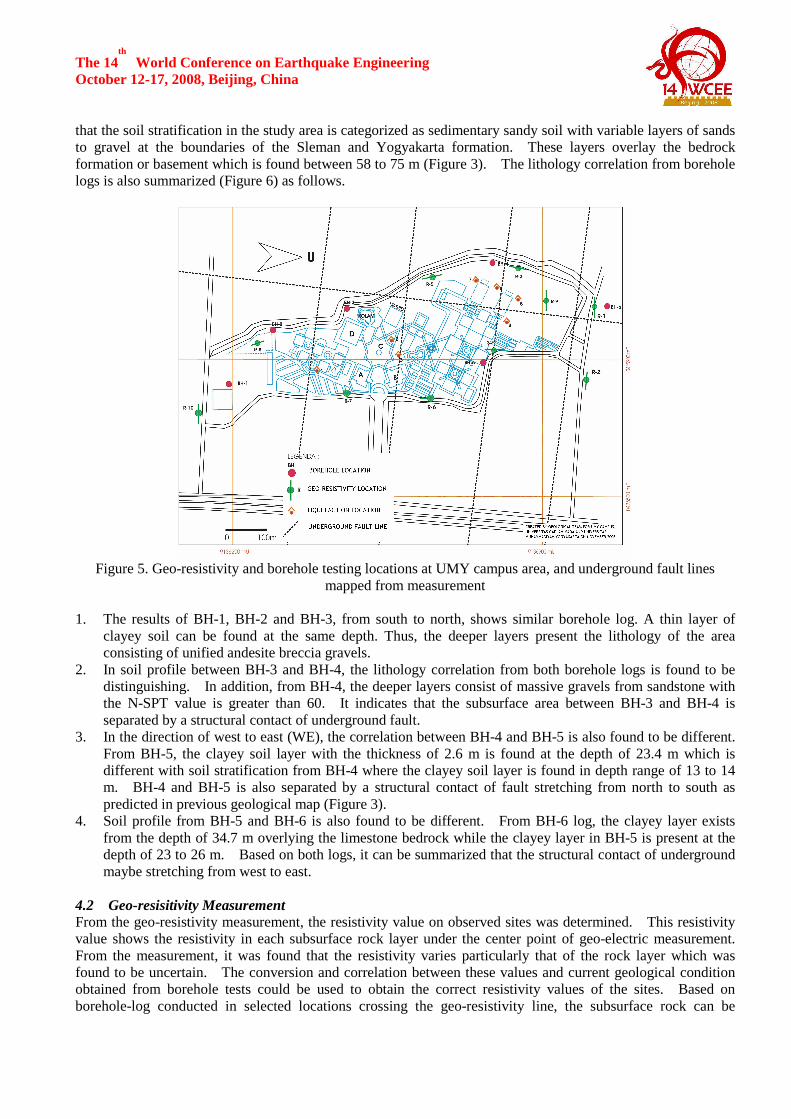
Figure 5. Geo-resistivity and borehole testing locations at UMY campus area, and underground fault lines
mapped from measurement 1. The results of BH-1, BH-2 and BH-3, from south to north, shows similar borehole log. A thin layer of
clayey soil can be found at the same depth. Thus, the deeper layers present the lithology of the area consisting of unified andesite breccia gravels.
2. In soil profile between BH-3 and BH-4, the lithology correlation from both borehole logs is found to be distinguishing. In addition, from BH-4, the deeper layers consist of massive gravels from sandstone with the N-SPT value is greater than 60. It indicates that the subsurface area between BH-3 and BH-4 is separated by a structural contact of underground fault.
3. In the direction of west to east (WE), the correlation between BH-4 and BH-5 is also found to be different. From BH-5, the clayey soil layer with the thickness of 2.6 m is found at the depth of 23.4 m which is different with soil stratification from BH-4 where the clayey soil layer is found in depth range of 13 to 14 m. BH-4 and BH-5 is also separated by a structural contact of fault stretching from north to south as predicted in previous geological map (Figure 3).
4. Soil profile from BH-5 and BH-6 is also found to be different. From BH-6 log, the clayey layer exists from the depth of 34.7 m overlying the limestone bedrock while the clayey layer in BH-5 is present at the depth of 23 to 26 m. Based on both logs, it can be summarized that the structural contact of underground maybe stretching from west to east.
4.2 Geo-resisitivity Measurement From the geo-resistivity measurement, the resistivity value on observed sites was determined. This resistivity value shows the resistivity in each subsurface rock layer under the center point of geo-electric measurement. From the measurement, it was found that the resistivity varies particularly that of the rock layer which was found to be uncertain. The conversion and correlation between these values and current geological condition obtained from borehole tests could be used to obtain the correct resistivity values of the sites. Based on borehole-log conducted in selected locations crossing the geo-resistivity line, the subsurface rock can be
The 14th
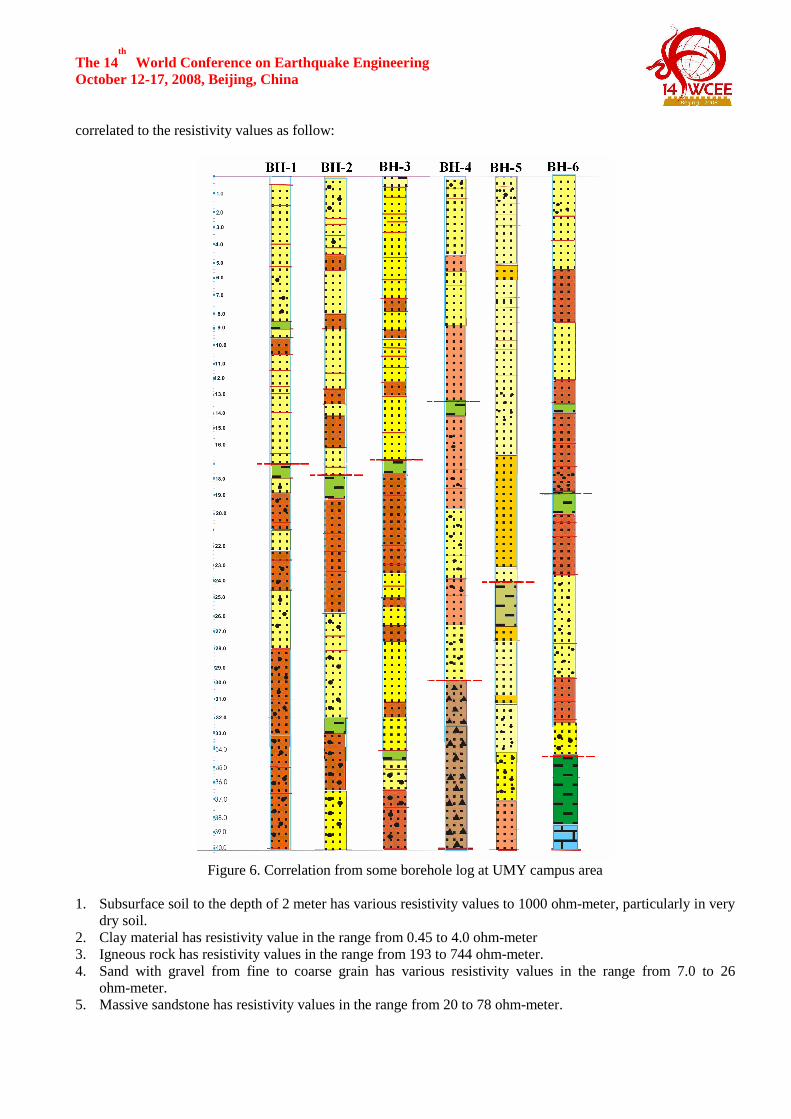
World Conference on Earthquake Engineering October 12-17, 2008, Beijing, China correlated to the resistivity values as follow:
Figure 6. Correlation from some borehole log at UMY campus area
1. Subsurface soil to the depth of 2 meter has various resistivity values to 1000 ohm-meter, particularly in very
dry soil. 2. Clay material has resistivity value in the range from 0.45 to 4.0 ohm-meter 3. Igneous rock has resistivity values in the range from 193 to 744 ohm-meter. 4. Sand with gravel from fine to coarse grain has various resistivity values in the range from 7.0 to 26
ohm-meter. 5. Massive sandstone has resistivity values in the range from 20 to 78 ohm-meter.
The 14th
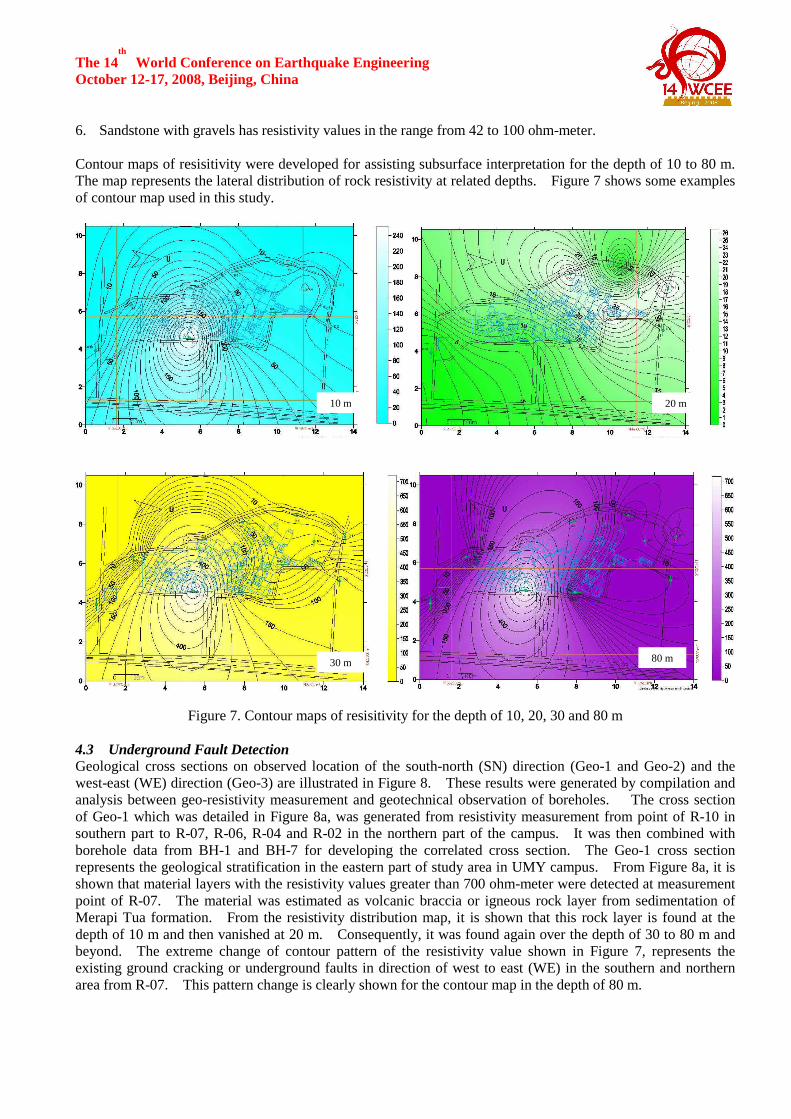
World Conference on Earthquake Engineering October 12-17, 2008, Beijing, China 6. Sandstone with gravels has resistivity values in the range from 42 to 100 ohm-meter. Contour maps of resisitivity were developed for assisting subsurface interpretation for the depth of 10 to 80 m. The map represents the lateral distribution of rock resistivity at related depths. Figure 7 shows some examples of contour map used in this study.
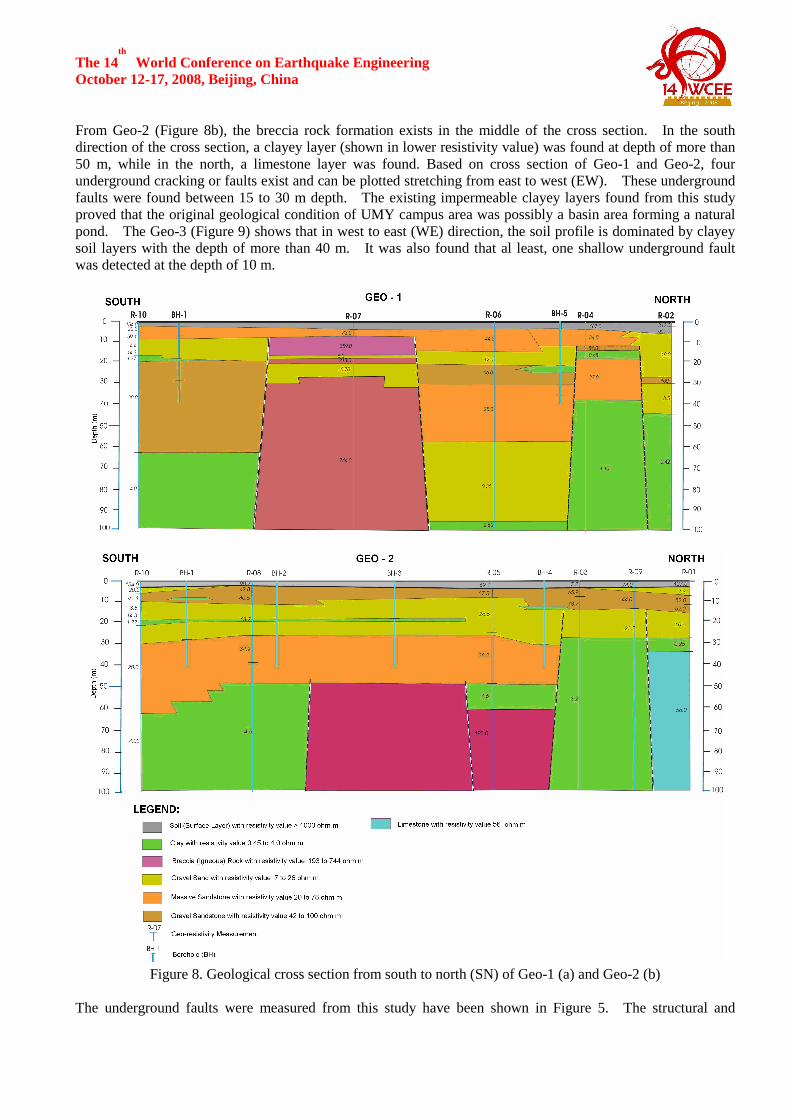
Figure 7. Contour maps of resisitivity for the depth of 10, 20, 30 and 80 m 4.3 Underground Fault Detection Geological cross sections on observed location of the south-north (SN) direction (Geo-1 and Geo-2) and the west-east (WE) direction (Geo-3) are illustrated in Figure 8. These results were generated by compilation and analysis between geo-resistivity measurement and geotechnical observation of boreholes. The cross section of Geo-1 which was detailed in Figure 8a, was generated from resistivity measurement from point of R-10 in southern part to R-07, R-06, R-04 and R-02 in the northern part of the campus. It was then combined with borehole data from BH-1 and BH-7 for developing the correlated cross section. The Geo-1 cross section represents the geological stratification in the eastern part of study area in UMY campus. From Figure 8a, it is shown that material layers with the resistivity values greater than 700 ohm-meter were detected at measurement point of R-07. The material was estimated as volcanic braccia or igneous rock layer from sedimentation of Merapi Tua formation. From the resistivity distribution map, it is shown that this rock layer is found at the depth of 10 m and then vanished at 20 m. Consequently, it was found again over the depth of 30 to 80 m and beyond. The extreme change of contour pattern of the resistivity value shown in Figure 7, represents the existing ground cracking or underground faults in direction of west to east (WE) in the southern and northern area from R-07. This pattern change is clearly shown for the contour map in the depth of 80 m.
10 m 20 m
30 m 80 m
The 14th
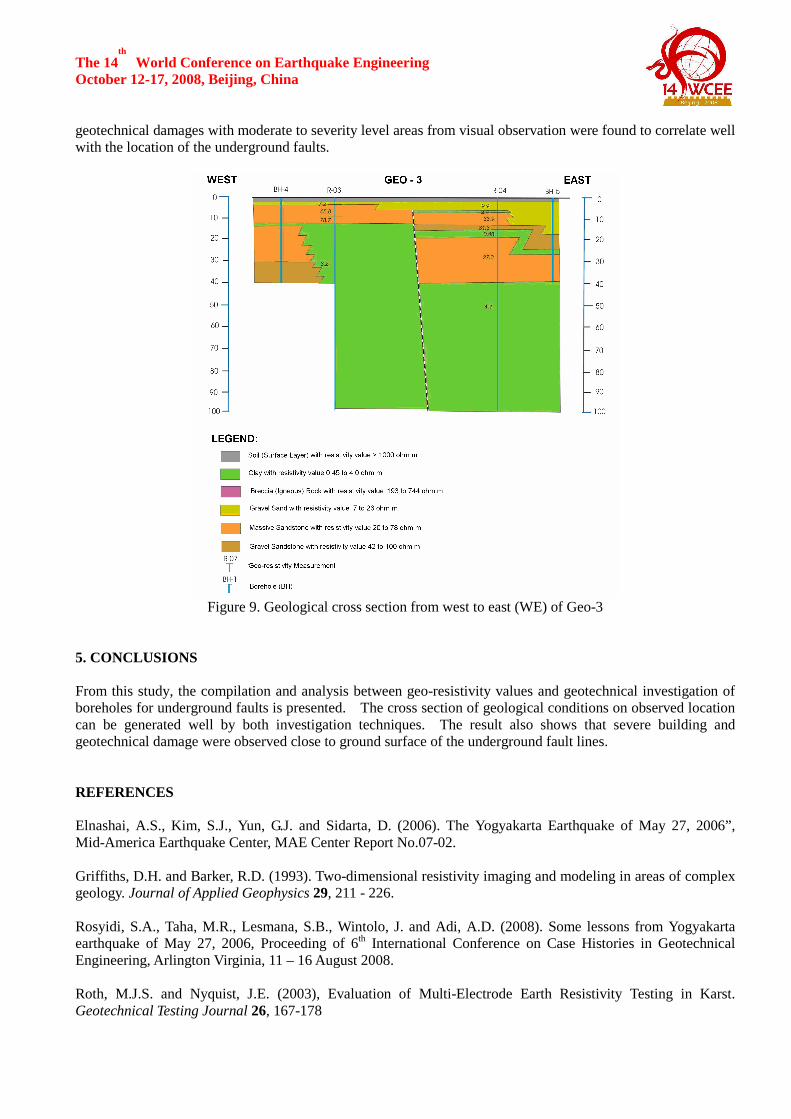
World Conference on Earthquake Engineering October 12-17, 2008, Beijing, China From Geo-2 (Figure 8b), the breccia rock formation exists in the middle of the cross section. In the south direction of the cross section, a clayey layer (shown in lower resistivity value) was found at depth of more than 50 m, while in the north, a limestone layer was found. Based on cross section of Geo-1 and Geo-2, four underground cracking or faults exist and can be plotted stretching from east to west (EW). These underground faults were found between 15 to 30 m depth. The existing impermeable clayey layers found from this study proved that the original geological condition of UMY campus area was possibly a basin area forming a natural pond. The Geo-3 (Figure 9) shows that in west to east (WE) direction, the soil profile is dominated by clayey soil layers with the depth of more than 40 m. It was also found that al least, one shallow underground fault was detected at the depth of 10 m.
Figure 8. Geological cross section from south to north (SN) of Geo-1 (a) and Geo-2 (b)
The underground faults were measured from this study have been shown in Figure 5. The structural and
The 14th
World Conference on Earthquake Engineering October 12-17, 2008, Beijing, China geotechnical damages with moderate to severity level areas from visual observation were found to correlate well with the location of the underground faults.
Figure 9. Geological cross section from west to east (WE) of Geo-3
5. CONCLUSIONS From this study, the compilation and analysis between geo-resistivity values and geotechnical investigation of boreholes for underground faults is presented. The cross section of geological conditions on observed location can be generated well by both investigation techniques. The result also shows that severe building and geotechnical damage were observed close to ground surface of the underground fault lines. REFERENCES Elnashai, A.S., Kim, S.J., Yun, G.J. and Sidarta, D. (2006). The Yogyakarta Earthquake of May 27, 2006”, Mid-America Earthquake Center, MAE Center Report No.07-02. Griffiths, D.H. and Barker, R.D. (1993). Two-dimensional resistivity imaging and modeling in areas of complex geology. Journal of Applied Geophysics 29, 211 - 226. Rosyidi, S.A., Taha, M.R., Lesmana, S.B., Wintolo, J. and Adi, A.D. (2008). Some lessons from Yogyakarta earthquake of May 27, 2006, Proceeding of 6th International Conference on Case Histories in Geotechnical Engineering, Arlington Virginia, 11 – 16 August 2008. Roth, M.J.S. and Nyquist, J.E. (2003), Evaluation of Multi-Electrode Earth Resistivity Testing in Karst. Geotechnical Testing Journal 26, 167-178