genotype×environment interactions for chilling tolerance of rice...
TRANSCRIPT
Gi
WJJa
Sb
c
d
e
f
a
ARRA
KRRCMG
1
iyv
AchmesnY
0d
Field Crops Research 117 (2010) 226–236
Contents lists available at ScienceDirect
Field Crops Research
journa l homepage: www.e lsev ier .com/ locate / fc r
enotype × environment interactions for chilling tolerance of rice recombinantnbred lines under different low temperature environments
enzhu Jianga, Joohyun Leea, Sang-Ho Chua, Tae-Ho Hama, Mi-Ok Wooa, Young-Il Choa,oong-Hyoun Chinb, Longzhi Hanc, Yingshi Xuand, Donglin Yuand, Furong Xue, Luyuan Daie,ong-Doo Yeaf, Hee-Jong Koha,∗
Department of Plant Science, Research Institute of Agriculture and Life Sciences, and Plant Genomics and Breeding Institute, Seoul National University, Sillim-Dong, Kwanak-gu,eoul 151-921, Republic of KoreaPlant Breeding, Genetics and Biotechnology, International Rice Research Institute, Los Banos, Laguna, DAPO BOX 7777, Manila, PhilippinesKey Laboratory of Crop Germplasm Resources and Biotechnology, Ministry of Agriculture, Institute of Crop Science, Chinese Academy of Agricultural Sciences, Beijing 100081, ChinaInstitute of Crop Science, Yanbian Academy of Agricultural Sciences, Longjing 133400, ChinaInstitute of Biotechnology and Germplasm Resources, Yunnan Academy of Agricultural Sciences, Kunming 650205, ChinaNational Institute of Crop Science, Rural Development Administration, Suwon 441-857, Republic of Korea
r t i c l e i n f o
rticle history:eceived 22 January 2010eceived in revised form 15 March 2010ccepted 15 March 2010
eywords:iceecombinant inbred lines
a b s t r a c t
Chilling injury is one of the major environmental stresses in rice cultivation in high-latitude and high-altitude regions. In this study, we cultivated a set of recombinant inbred lines (RILs) derived from Milyang23 (indica)/Tong 88-7 (japonica) crosses in Kunming (high-altitude location), Yanji (high-latitude loca-tion), Chuncheon (cold water irrigation), and Suwon (normal) to evaluate the genotype × environment(G × E) interactions for chilling tolerance. RILs were the most severely damaged under the natural chill-ing air temperatures in Kunming. Significant G × E interactions in all measured agronomic traits weredetected, and thus, the additive main effects and multiplicative interaction (AMMI) statistical model
hilling toleranceulti-locational screeningenotype × environment interaction
was applied to dissect the G × E interactions. The biplots of grand mean and IPCA1 (interaction principalcomponent axes) of chilling-related traits accounted for most of the total treatment sums of squares.The IPCA scores of spikelet fertility and phenotypic acceptability were relatively smaller in Chuncheonthan in Yanji and Kunming, implying that the screening for chilling tolerance with cold water irrigationin Chuncheon was more stable, whereas the Yanji and Kunming plantings were more sensitive to G × Einteractions for chilling tolerance. These results demonstrate that multi-locational screening should be
lopin
the best strategy for deve. Introduction
Low temperature is one of the major environmental constraintsn world rice production, causing yield losses of about 10% perear (Wu and Garg, 2003). Chilling injury can occur both in theegetative and reproductive stages, which ultimately causes yield
Abbreviations: AMMI, the additive main effects and multiplicative interaction;NOVA, analysis of variance; CL, culm length; C03, Chuncheon in 2003; C04, Chun-heon in 2004; DTH, days to heading; FSN, fertile spikelet number; GW, grain weight;2, broad sense heritability; IPCA, interaction principal component axes; K03, Kun-ing in 2003; K04, Kunming in 2004; PA, phenotypic acceptability; PE, panicle
xsertion; PL, panicle length; PN, panicle number; RIL, recombinant inbred line; SF,pikelet fertility; SN, spikelet number; SSD, single-seed decent; SSN, sterile spikeletumber; SS%, percentage of sum of square; S03, Suwon in 2003; S04, Suwon in 2004;03, Yanji in 2003; Y04, Yanji in 2004.∗ Corresponding author. Tel.: +82 2 8804541; fax: +82 2 8732056.
E-mail address: [email protected] (H.-J. Koh).
378-4290/$ – see front matter © 2010 Elsevier B.V. All rights reserved.oi:10.1016/j.fcr.2010.03.007
g widely adaptable chilling-tolerant varieties in rice.© 2010 Elsevier B.V. All rights reserved.
loss. In the vegetative growth stage, chilling stress causes low ger-mination rates, retarded seedling growth, leaf discoloration, andstunted vegetative growth with reduced height and tiller numbers.In the reproductive stage, chilling stress causes delayed heading,which extends the flowering period, incomplete panicle exertion,degeneration of spikelets, irregular maturity, sterility, and forma-tion of abnormal grains (Kaneda and Beachell, 1974; Takeoka et al.,1992). Because pollen development is severely affected by the lowtemperatures and abnormal pollen causes grain sterility and subse-quent yield loss, the microspore stage is highly sensitive to chillingstress (Suzuki, 1982; Nakamura et al., 2000; Farrell et al., 2006).
The critical air temperature inducing cold damage ranged from15 to 20 ◦C and varied depending on cultivars and duration of low
temperature (Satake, 1976). National Institute of Crop Sciences(NICS) summarized in 2004 that, in general, an air temperaturebelow 20 ◦C can induce chilling damages, and the critical tempera-ture varies for the different growth stages. For example, the criticaltemperature is 15 ◦C at the vegetative growth stage and 17 ◦C at the
W. Jiang et al. / Field Crops Research 117 (2010) 226–236 227
Table 1Experimental conditions in different environments.
Code Location Year Generation Sowing date (M/D) Planting date(M/D)
Plantingdensity (cm)
Water depth(cm)
Fertilization(N-P-K kg/ha)
Screeningmethods
S03 Suwon 2003 F6 4/27 5/30 30.0 × 15.0 5 110-80-80 ControlC03 Chuncheon 2003 F6 4/27 5/30 30.0 × 15.0 5 110-80-80 Cold waterY03 Yanji 2003 F6 4/25 5/27 30.0 × 15.0 5 140-60-70 Low air
temperatureK03 Kunming 2003 F6 3/20 5/9 17.5 × 10.0 10 140-14-20 Low air
temperatureS04 Suwon 2004 F7 4/27 5/30 30.0 × 15.0 5 110-80-80 ControlC04 Chuncheon 2004 F7 4/27 5/30 30.0 × 15.0 5 110-80-80 Cold waterY04 Yanji 2004 F7 4/25 5/27 30.0 × 15.0 5 140-60-70 Low air
rtrcsd
co2ttachgat
fctKmtt(watfetmpAwn
caabftaaafm
K04 Kunming 2004 F7 3/20 5/9
eproductive and heading stages. Farrell et al. (2006) reported thathe threshold nightly temperature for inducing cold damage in theeproductive stage is 15 ◦C for cold-sensitive varieties and 13 ◦C forold-tolerant varieties. A low nightly temperature induces spikeletterility, whereas a high daily temperature alleviates the chillingamage (Yoshida, 1981).
Since rice is cultivated in water, chilling stress can be induced byold water treatment, and this treatment has been used in studiesf rice chilling stresses (Satake et al., 1988; Shimono et al., 2002,007b, 2005; Farrell et al., 2006). Takamura et al. (1960) reportedhat water temperature was relatively more important than airemperature in the early growth stage. Shimono et al. (2004, 2007a)lso reported that growth and yield were affected more severely byold water temperature than by low air temperature in plants thatad not yet reached the mid-reproductive period. However, as sug-ested by Farrell et al. (2006), both cold air and cold water treatmentre effective in screening low temperature-tolerant genotypes inhe reproductive stage.
To screen chilling-tolerant rice effectively, the cold treatmentacilities must maintain low temperatures reliably. Thus, someountries have built cold treatment facilities and established coldreatment methods separately for their own purposes. In Southorea, cold water from the base of large storage dams is used toaintain a constant temperature of 17 ◦C. The water level is main-
ained at a 5-cm depth. The cold water treatment begins in theillering stages and continues until the grains are fully maturedYea, 1995; Lee, 2001; Oh et al., 2004; Shu et al., 2010). In Japan, coldater is obtained from aquifers cooled by electric cooling systems,
nd the fields are maintained at 19 ◦C. The water level is main-ained at a 20-cm depth, and the cold water treatment is appliedrom panicle initiation to the flowering stages (Nagano, 1998; Saitot al., 2001, 2004; Kuroki et al., 2007). In Australia, the facility main-ains a constant water temperature of 19 ◦C, and the cold water is
aintained at a 5-cm depth. Cold water treatment begins whenanicles initiate and continues to 50% heading (Farrell et al., 2004).lso, in Australia, they have an air temperature-controlled room inhich rice is grown at 27 ◦C during the day and at 13 ◦C during theight.
Even though screening for chilling tolerance in an artificiallyontrolled environment such as a phytotron or greenhouse (Andayand Mackill, 2003; Farrell et al., 2006; Shu et al., 2010) is availablend well established, it is obvious that field screening is more validecause temperature patterns during a rice-growing season differrom region to region and from year to year. Thus, naturally lowemperature areas such as Kunming (Yunnan Province, China), in
high-latitude area in a sub-tropical region (Dai et al., 2004; Xu etl., 2008), and sites such as Yanji (Jilin Province, northeast China)nd northern Japan in high-latitude areas are good places to screenor chilling tolerance (Quan et al., 2006; Shimono et al., 2007b). Theajor difficulty in field screening is the uncertainty of encountering
temperature17.5 × 10.0 10 140-14-20 Low air
temperature
low temperatures during cultivation. To minimize this problem,it is required to screen for chilling tolerance in various screeningfacilities over several years.
The relative performances of genotypes may vary in differentenvironments, known as the genotype × environment (G × E) inter-action. When G × E interactions are present in a genotype, it ismust be grown in a specific environment, whereas the lack of G × Einteractions allow a genotype to be adopted in a broader rangeof environments (Cooper and Byth, 1996). To date, a few studieson rice G × E interactions have been conducted for some abioticstresses such as drought tolerance (Kumar et al., 2007; BotwrightAcuna et al., 2008) through multi-locational tests. However, therehave been no reports on the analysis of G × E interactions for chill-ing tolerance in rice. The G × E interactions in chilling tolerancetraits can be evaluated using multi-locational screening of chillingtolerance.
The objectives of this study were to examine the chillingtolerances of recombinant inbred lines (RILs) under different envi-ronmental conditions and to investigate the G × E interactionpatterns in multi-locational screening of chilling tolerance.
2. Materials and methods
2.1. Plant materials
An RIL population (F6 in 2003 and F7 in 2004) consisting of 151lines was used in this study with parents, which was developedby single-seed descent (SSD) method from an F2 population of across between Milyang 23 and Tong 88-7 (Jiang et al., 2008). Oneof the parental varieties, Tong 88-7, a temperate japonica varietywhich was developed in northern China, is highly tolerant to lowtemperature (Han and Koh, 2000). The other parent, Milyang 23,is a Tongil-type rice variety and sensitive to chilling temperature.Tongil-type rice varieties have been developed by crossing indicawith japonica and then backcrossing that to indica two times. Thesevarieties exhibit high-yielding and several good characteristics, buthave relatively poor grain quality and high susceptibility to lowtemperatures (Chung and Heu, 1991).
2.2. Experimental locations and growth conditions
The RILs and two parents were cultivated in the years 2003(F6) and 2004 (F7) in four diverse environments, i.e., the Experi-mental Farm of Seoul National University (Suwon, Korea, 127◦36′E,37◦51′N, 74 m a.s.l.), the Chuncheon substation of the National
Institute of Crop Science, RDA (Chuncheon, Korea, 127◦2′E, 37◦16′N,36 m a.s.l.), Yanbian Academy of Agricultural Sciences (Yanji, China,the high-latitude area, 129◦24′E, 42◦46′N, 242 m a.s.l.), YunnanAcademy of Agricultural Sciences (Kunming, China, the high-altitude area, 102◦41′E, 25◦1′N, 1916 m a.s.l.).
228 W. Jiang et al. / Field Crops Research 117 (2010) 226–236
F raturea
lwvsLpCtmwTirGpo1mwcdM9ra
scored from 1 to 9 (1 for tolerant, 3 for moderately toler-
ig. 1. Daily maximum (upper), average (middle), and minimum (lower) air tempend 2004. The dotted lines indicate temperatures below 20 ◦C.
The details of experimental conditions during 2003–2004 at fourocations are listed in Table 1. The RILs, along with the parents,
ere seeded in plastic-tunnel seed-beds at the Seoul National Uni-ersity Experimental Farm in Suwon on April 27, 2003, and theeedlings were transplanted at a planting density of 30 cm × 15 cm.ikewise, the seedlings were transplanted at a density of one planter hill into the chilling tolerance screening nursery at Chuncheon.old water at 17 ◦C was used for irrigation from 20 days afterransplanting through the ripening stage, and the cold water was
aintained at a 5 cm depth. Each line was planted in a single rowith 15 cm spacing within rows and 30 cm spacing between rows.
he fertilizer was applied at the rate of 110-80-80 kg N-P-K ha−1
n Suwon and Chuncheon. In Yanji, the cold treatment was natu-ally conducted in the field due to low atmospheric temperatures.erminated seeds of the RILs were sown on April 25, 2003 in alastic-film house. They were transplanted into the paddy fieldn May 27. Each line was transplanted at a planting density of5 cm between plants and 30 cm between rows. The water level wasaintained at a 5 cm depth. A mixed commercial chemical fertilizeras applied at the rate of 140-60-70 kg N-P-K ha−1. In Kunming,
old treatment was naturally conducted in the field by low out-
oor temperatures. Seeds were sown in the seedling nursery onarch 20 and were transplanted with one seedling per hill on May. Each line was planted in a single row with 10 cm spacing withinows and 17.5 cm spacing between rows, and fertilizer was appliedt 140-14-20 kg N-P-K ha−1. The water level was maintained at a
s (◦C) at the experimental sites during the period from May to September in 2003
10 cm depth. All experiments were designed as complete blockdesigns with 8–12 plants per replication and three replicationsper location. Weeds, diseases, and insects were strictly controlledthroughout the entire rice growth periods in all experimental loca-tions. The meteorological information was recorded by the KoreanMeteorological Administration (http://www.kma.go.kr/index.jsp),the Kunming Meteorological Administration in China and the Yan-bian Meteorological Administration in China.
2.3. Phenotypic measurements
A total of 11 traits related to chilling tolerance were mea-sured across four locations and two years. Ten of them weregeneral agronomic traits including days to heading (DTH), culmlength (CL), panicle length (PL), panicle exsertion (PE), pani-cle number (PN), fertile grain number (FSN), sterile spikeletnumber (SSN), spikelet number (SN), spikelet fertility (SF), andgrain weight (GW). In addition, phenotypic acceptability (PA)was evaluated to represent overall chilling tolerance. PA was
ant, 5 for moderate, 7 for moderately susceptible, and 9 forsusceptible), where PA was estimated by visual evaluation ata maturity stage based on plant type, heading delay, panicleexsertion, and spikelet fertility compared to the control (NICS,2004).

W. Jiang et al. / Field Crops Research 117 (2010) 226–236 229
Table 2Average air temperature, rainfall, sun duration, and wind speed at four locations in the years 2003 and 2004.
2003 2004
Suwon Chuncheon Yanji Kunming Suwon Chuncheon Yanji Kunming
Average air temperature (◦C)May 18.8 18.2 14.7 21.3 17.0 17.3 14.6 18.9June 21.3 21.3 19.4 20.0 22.6 22.6 21.3 19.6July 23.8 23.7 19.6 21.9 24.8 24.7 21.1 20.3August 24.2 23.6 20.9 21.8 26.1 24.7 21.1 21.0September 21.0 19.8 15.8 18.4 21.3 20.4 15.8 18.4
Average 21.8 21.3 18.1 20.7 22.4 21.9 18.8 19.6
Rainfall (mm)May 85.5 125.5 21.9 85.9 125.2 135.0 80.2 112.3June 159.0 122.4 57.0 166.2 135.7 106.2 64.9 185.6July 341.9 340.9 139.7 155.3 382.0 532.8 129.0 225.6August 293.7 632.7 32.1 157.4 157.4 215.6 17.0 169.0September 271.5 313.5 22.1 100.1 183.4 193.6 42.4 194.2
Total 1151.6 1535.0 272.8 664.9 983.7 1183.2 333.5 886.7
Sun duration (h)May 230.6 244.8 198.9 203.2 189.0 160.5 189.6 196.8June 128.7 155.6 176.6 99.6 158.8 175.6 278.1 122.6July 117.4 136.5 95.0 156.2 94.5 89.9 129.0 151.1August 98.3 116.4 249.7 170.1 165.1 145.6 241.3 151.3September 126.8 126.2 199.8 117.6 172.1 176.9 217.7 127.1
Total 701.8 779.5 920.0 746.7 779.5 748.5 1055.7 748.9
Average wind speed (m/s)May 2.1 1.3 – 2.5 2.4 1.5 – 2.1June 2.1 1.2 1.7 2.1 2.0 1.3 1.6 1.7July 2.2 1.2 1.6 1.7 2.2 1.1 1.5 1.7
1.41.5
1.8
2
yrieghT(et
(epoiı
aic1
3
3
e
August 2.0 1.1 1.5September 1.8 1.1 1.4
Average 2.0 1.2 1.6
.4. Statistical analysis
A combined analysis of variance across four locations and twoears was performed on each trait using the SAS PROC GLM algo-ithm (SAS, 1999). The AMMI analysis based on the first twonteraction principal component axes (IPCAs) was used to cat-gorize the experimental environments into mega-environmentroups (Gauch, 2007) and to detect the homogenous sub-regionsaving similar G × E interaction patterns (Ebdon and Gauch, 2002).he AMMI analysis was conducted using MATMODEL Version 3.0Gauch, 2007). A full AMMI model (AMMI-F) was conducted forach trait. Biplots with the first two multiplicative terms were usedo summarize the G × E interaction patterns.
Variance components for estimating broad sense heritabilityh2) were estimated for a model, wherein all factors were consid-red random, using the REML option of the SAS PROC VARCOMProcedure (SAS, 1999). The broad sense heritability of each traitver the locations and years was estimated using the follow-ng method, suggested by Hill et al. (1998). h2 = ı2
g/(ı2g + ı2
gy/Y +2gl
/L + ı2gyl
/YL + ı2ε/YLR), where ı2
g , ı2gy, ı2
gl, ı2
gyland ı2
ε are vari-nce components for g, gy, gl, gly, and ε, respectively, and Y, L, Rndicate the year, location and replicate, respectively. Phenotypicorrelation of the traits was determined using SAS PROC CORR (SAS,999).
. Results
.1. Meteorological environments
The daily maximum, minimum, and average temperatures of thexperimental locations during the rice-growing periods (from May
2.3 1.3 1.5 1.52.1 1.2 1.3 1.5
2.2 1.3 1.5 1.7
to September) in the years 2003 and 2004 are presented in Fig. 1.The daily average temperatures were generally higher than 20 ◦Cfrom the tillering stage (mid-June) to the ripening stage (September1st) in both years in Suwon and Chuncheon. Thus, the experimentsconducted in Suwon were used as the control. In Chuncheon, thechilling damages were induced only by cold water irrigation treat-ment. However, low daily average temperatures were frequentlybelow 20 ◦C from the tillering to ripening stages in Yanji and Kun-ming. The diurnal temperature range was narrower in Kunmingthan in Yanji (Suppl. Table 1). The rainfall in the four experimen-tal environments was concentrated from May to September. Theamount of rainfall was highest in Chuncheon and was the lowestin Yanji. Yanji had the longest sun duration, while the other threelocations had similar sun durations to one another. The averagewind speed was similar in the three low temperature conditions(Table 2).
3.2. Chilling tolerance-related traits in the RILs
Eleven agronomic traits and the broad sense heritabilities (h2)for the RILs and their parents are summarized in Table 3. Detailedperformances of each trait in the four locations are described below.Data collected in Suwon were used as the control.
3.2.1. Days to heading (DTH)Milyang 23 headed later than Tong 88-7 in all four locations.
Milyang 23 showed delayed heading in low temperature locations,and the heading delay was most severe in Chuncheon, Yanji, andKunming, in that order. Tong 88-7 originated from Yanji showed aheading delay in Kunming but their DTH were shortened in Suwonand Chuncheon. In the RILs, the responses of DTH against low

230W
.Jianget
al./FieldCrops
Research
117(2010)
226–236Table 3Means and phenotypic variations in parents and RILs for days to heading (DTH), culm length (CL), panicle length (PL), panicle exsertion (PE), panicle number (PN), fertile spikelet number (FSN), sterile spikelet number (SSN),spikelet number (SN), spikelet fertility (SF), grain weight (GW), phenotypic acceptability (PA) in the years 2003 and 2004, and their broad sense heritabilities (h2).
Traits Location 2003 2004 h2
Parents RILs Parents RILs
Milyang 23 Tong 88-7 Diffa Mean Range Milyang 23 Tong 88-7 Diffa Mean Range
DTH Suwon 117d b 91c * 105d 85–126 115c 89d * 103c 86–128 91.6Chuncheon 124c 94c * 112c 88–128 125b 94c * 114b 91–136Yanji 130b 101b * 118b 97–137 128b 99b * 116b 96–130Kunming 143a 126a * 136a 113–155 139a 122a * 134a 114–155
CL Suwon 65.9a 74.7a * 80.6a 38.8–129.3 70.0a 75.7a * 85.5a 38.5–136.1 94.5Chuncheon 50.0b 63.8b * 66.4b 33.8–102.2 55.7b 63.9b * 69.2b 30.9–111.3Yanji 48.3b 74.2a * 61.2c 30.9–90.9 40.7c 76.7a * 65.7b 31.7–99.3Kunming 35.5c 61.3b * 49.1d 18.7–84.3 40.7c 66.7b * 51.7c 21.0–81.3
PL Suwon 27.2a 18.8a * 24.0a 17.8–30.5 30.9a 21.7a * 25.9a 17.7–34.9 79.6Chuncheon 22.9b 16.0b * 20.9b 13.7–27.3 22.1b 16.8b * 23.8b 17.1–31.9Yanji 23.2b 20.8a * 20.9b 14.9–26.4 20.3b 19.8a NS 21.4c 16.7–28.2Kunming 22.2b 16.3b * 19.8c 12.0–28.2 21.0b 17.3b * 21.3c 14.3–27.0
PE Suwon −0.1a 5.5a * 3.2a −8.3–14.7 −0.5a 7.7a * 5.1a −4.6–20.2 87.9Chuncheon −2.9b 4.5a * 1.5b −9.7–13.7 −4.1b 6.1a * 1.8b −7.7–14.9Yanji −7.4c 4.5a * −1.1c −9.5–10.5 −6.4c 4.3b * 0.2c −6.6–9.7Kunming −7.0c 2.1b * −0.8c −12.3–8.3 −10.0d 3.7b * −2.7d −12.0–8.0
PN Suwon 12a 9b * 13b 6–20 13a 10b * 12b 7–19 70.7Chuncheon 7b 8b NS 11c 5–21 7b 10b * 9c 6–16Yanji 14a 17a * 18a 9–31 10a 16a * 22a 5–37Kunming 11a 8b * 13b 4–38 – – * – –
FSN Suwon 159a 123b * 144a 42–264 192a 139b * 168a 43–309 62.6Chuncheon 46b 114c * 88b 1–201 46b 110c * 109b 6–230Yanji 26c 151a * 55c 0–215 18c 153a * 78c 0–176Kunming 27c 110c * 37d 0–168 20c 97d * 17d 0–148
SSN Suwon 36b 18b * 42a 3–146 31c 11b * 34a 6–165 65.9Chuncheon 103a 15b * 53b 6–261 84b 13b * 52b 4–239Yanji 114a 18b * 109d 10–301 115a 3c * 61c 3–196Kunming 107a 31a * 89c 8–244 114a 34a * 134d 33–255
SN Suwon 195a 141b * 186a 79–316 223a 150a * 202a 82–373 87.6Chuncheon 149b 129b NS 141c 67–315 130b 123b NS 162b 64–317Yanji 140b 169a * 164b 68–254 133b 156a * 139d 54–240Kunming 134b 141b NS 126d 15–290 134b 131b NS 151c 39–291
SF Suwon 81.4a 87.5a NS 81.1a 55.9–98.0 86.1a 92.5ab NS 85.2a 70.0–95.0 52.1Chuncheon 33.6b 88.5a * 61.7b 0.0–95.4 35.3b 89.5b * 67.9b 0.3–96.1Yanji 18.5c 89.6a * 34.7c 0.0–95.8 13.7c 98.2a * 57.5c 0.0–94.5Kunming 20.4c 78.2c * 27.0d 0.0–93.1 15.2c 74.1c * 25.7d 0.0–87.0
GW Suwon 26.2a 24.9a * 24.3a 18.1–30.8 26.3a 24.9a * 24.4a 18.9–33.3 61.1Chuncheon 24.9b 24.7a NS 23.9a 16.7–30.7 26.6a 24.7a NS 24.5a 13.8–31.6Yanji 17.5c 25.6a * 20.5b 10.2–28.8 16.3b 25.5a * 18.8b 14.7–32.1Kunming 23.7b 24.0a NS 20.9b 10.0–28.3 24.1a 24.0a NS 21.0b 10.0–30.0
PA Chuncheon 7a 1b * 5a 1–9 7a 1b * 5a 1–9 64.1Yanji 7a 1b * 5a 1–9 7a 1b * 5a 1–9Kunming 7a 1b * 5a 1–9 7a 1b * 5a 1–9
a * and NS signify a difference between Milyang 23 and Tong 88-7 at the 5% significance level and at the not significant level with an LSD test, respectively.b Means followed by the same letter within a given trait are not significantly different at the 5% level among locations with an LSD test.

W.Jiang
etal./Field
CropsR
esearch117
(2010)226–236
231Table 4Combined analysis of variance from GLM and AMMI analyses of variance for evaluated traits in the experimental environments and the proportion of the total variance attributable to the sources of variation.
Source Days to heading (day) Culm length (cm) Panicle length (cm) Panicle exsertion (cm) Panicle number (cm)
D.F. MSa SS%b D.F. MS SS% MS SS% MS SS% D.F. MS SS%
Total 1221 230 100 3671 474 100 14 100 27 100 3212 38 100Treatment 611 435** 95 1223 1361** 98 35** 89 70** 91 1070 103** 91Environment (E) 3 56,197** 61 7 192,054** 32 5223** 30 6913** 23 6 20,491** 52
Year (Y) 1 1043** – 1 12,247** 2 1030** 8 64** 1 1 196** 1Location (L) 3 56,197** 61 3 179,379** 98 4125** 91 6344** 92 3 18,442** 93Y × L 3 752** – 3 429** 0 68** 2 505** 7 2 1852** 6
Genotype (G) 152 549** 31 152 6100** 56 141** 50 291** 52 152 142** 20G × E interaction 456 44** 8 1064 194** 12 8** 20 20** 25 912 34** 29
Y × G 153 28NS – 152 188** 14 10** 17 25** 18 152 23** 11L × G 456 44** 8 456 258** 57 10** 54 26** 53 456 42** 61Y × L × G – – – 456 131** 29 6** 29 16** 30 304 29** 28
CV (%) 4 6 7 12 17
AMMI analysisG × E interaction 456 44** 100 1064 194** 100 8** 100 20** 100 912 34** 100
IPCA1 154 72** 55 158 396** 30 14** 26 31** 23 157 79** 40IPCA2 152 40** 30 156 320** 24 10** 18 29** 21 155 53** 26IPCA3 150 20NS 15 154 215** 16 9** 16 24** 17 153 37** 18IPCA4 – – – 152 126** 9 8** 14 18** 12 151 14** 7IPCA5 – – – 150 125** 9 7** 12 16** 11 149 12** 6IPCA6 – – – 148 85** 6 5** 9 14** 9 147 8** 4IPCA7 – – – 146 69** 5 4** 6 10** 7 – – –
Error 610 5 2448 14 2 2 11 3 9 2142 5 9
Source Fertile spikelet number Sterile spikelet number Spikelet number Spikelet fertility (%) Grain weight (g) Phenotypic acceptability
D.F. MS SS% MS SS% MS SS% MS SS% MS SS% D.F. MS SS%
Total 3671 4825 100 2998 100 3584 100 1043 100 18 100 2753 5 100Treatment 1223 12,729** 95 7902** 92 9395** 91 2758** 95 47** 95 917 13** 86Environment (E) 7 2,973,561** 53 1,390,878** 41 716,628** 17 696,775** 59 4955** 24 5 597** 8
Year (Y) 1 109,330** 1 3020** 0 76,147** 4 15,176** 1 71** 0 1 236** 25Location (L) 3 2,762,179** 95 1,155,466** 83 566,951** 85 635,934** 93 4647** 95 2 235** 49Y × L 3 102,052** 4 232,393** 17 73,530** 11 45,665** 7 238** 5 2 126** 26
Genotype (G) 152 21,563** 21 15,191** 24 42,202** 56 3460** 16 113** 30 152 24** 31G × E interaction 1064 3534** 24 3144** 35 2830** 26 803** 25 24** 44 760 10** 61
Y × G 152 3002** 12 2766** 13 2964** 15 785** 14 22** 13 152 11** 23L × G 456 6054** 70 4265** 58 4029** 61 1236** 66 35** 62 304 12** 51Y × L × G 456 2281** 24 2149** 29 1894** 29 398** 21 16** 29 304 6** 26
CV (%) 22 28 14 17 6 17
AMMI analysisG × E interaction 1064 3534** 100 3144** 100 2830** 100 803** 100 24** 100 760 10** 100
IPCA1 158 9325** 39 6308** 30 6701** 35 1600** 30 57** 35 156 23** 48IPCA2 156 4326** 18 4850** 23 3638** 19 1102** 20 45** 28 154 11** 24IPCA3 154 3018** 12 2875** 13 2824** 14 884** 16 26** 16 152 7** 15IPCA4 152 2683** 11 2584** 12 2232** 11 825** 15 16** 9 150 4** 7IPCA5 150 2307** 9 2347** 11 1615** 8 512** 9 10** 6 148 3** 5IPCA6 148 1509** 6 1905** 8 1444** 7 400** 7 5** 3 – – –IPCA7 146 1181** 5 849** 4 1074** 5 224** 4 5** 3 – – –
Error 2448 396 5 380 8 489 9 82 5 1 5 1835 1 14
NS, not significant.a Mean squares.b Percentage of sum of squares.** Significant at P < 0.01.
232 W. Jiang et al. / Field Crops Research 117 (2010) 226–236
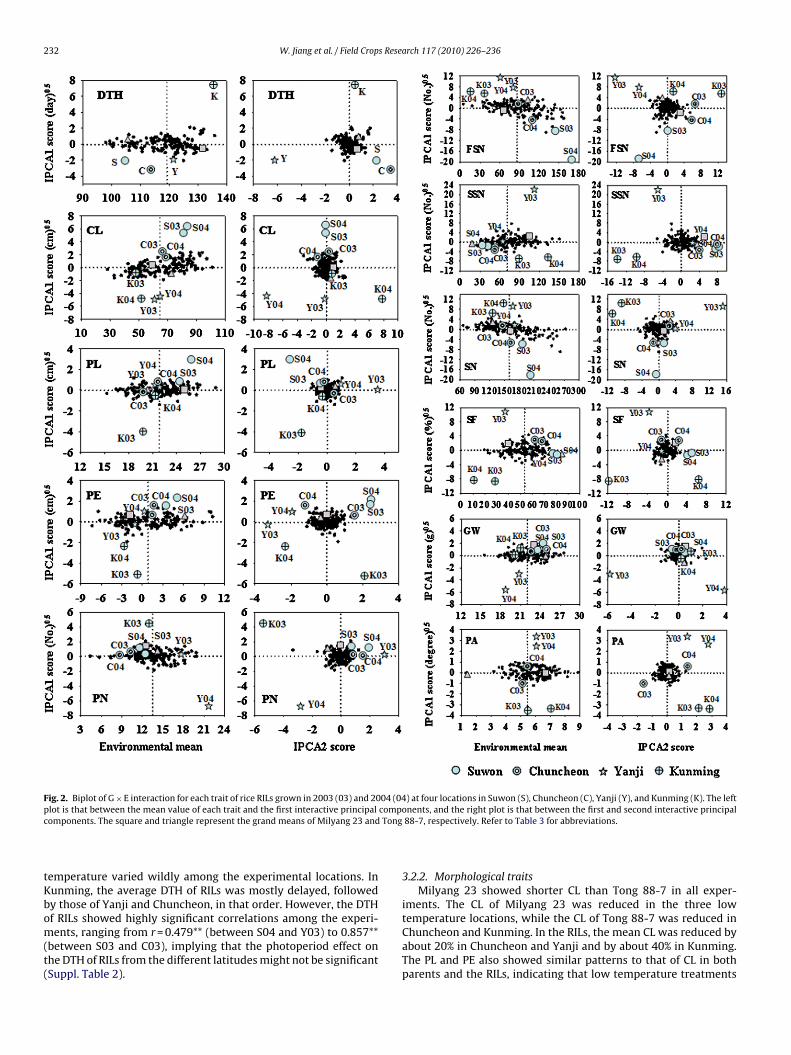
Fig. 2. Biplot of G × E interaction for each trait of rice RILs grown in 2003 (03) and 2004 (04) at four locations in Suwon (S), Chuncheon (C), Yanji (Y), and Kunming (K). The leftp compc Tong
tKbom(t(
lot is that between the mean value of each trait and the first interactive principalomponents. The square and triangle represent the grand means of Milyang 23 and
emperature varied wildly among the experimental locations. Inunming, the average DTH of RILs was mostly delayed, followedy those of Yanji and Chuncheon, in that order. However, the DTHf RILs showed highly significant correlations among the experi-
ents, ranging from r = 0.479** (between S04 and Y03) to 0.857**between S03 and C03), implying that the photoperiod effect onhe DTH of RILs from the different latitudes might not be significantSuppl. Table 2).
onents, and the right plot is that between the first and second interactive principal88-7, respectively. Refer to Table 3 for abbreviations.
3.2.2. Morphological traitsMilyang 23 showed shorter CL than Tong 88-7 in all exper-
iments. The CL of Milyang 23 was reduced in the three lowtemperature locations, while the CL of Tong 88-7 was reduced in
Chuncheon and Kunming. In the RILs, the mean CL was reduced byabout 20% in Chuncheon and Yanji and by about 40% in Kunming.The PL and PE also showed similar patterns to that of CL in bothparents and the RILs, indicating that low temperature treatments
W. Jiang et al. / Field Crops Research 117 (2010) 226–236 233
Table 5Correlation analysis between environmental covariates and the first IPCA1 axis for 11 traits.
Term Average temperature Minimum temperature Maximum temperature Daily range Rainfall Sun duration Day length
First-June 1,2a 2,11 1,4 5 1,3,4 1,5Mid-June 1,3,4 2 1,6,7,9,10End-June 5 2First-July 2,10 2,6,10 3,6,7,8Mid-July 2,6,7,8 2,6,7,8 8 3,4 1,6,7,8,9,10End-July 1,2,4,6,7,8 1,2,4,6,7,8 2,6,7,8 6First-August 1,2,6,7,8 1,2,6,7,8 1,2,6,7,8 10,11 9,11Mid-August 6,8 6,8,10 1,6,8 9,11 9,10,11 1,7,8End-August 6,8,10 6,10,11 1,8 9,10,11 9,10,11First-September 1,6,8 10 1 9,11 11Mid-September 6,10,11 9,10,11 6,7,10 7,9,10,11 7 7,9,10 7End-September 6,10 9,10 6,8 9,10,11 7
The nul tile spf
soYlnrv
3
t8wrYSo
7dYarh
Mtwa
3
r1cir
3
3
irdtit
a Only the traits which showed significant correlations with each term are listed.ength; 3 for panicle length; 4 for panicle exsersion; 5 for panicle number; 6 for ferertility; 10 for grain weight; 11 for phenotypic acceptability.
everely reduced CL, PL, and PE. The PN of Milyang 23 was reducednly in Chuncheon, while the PN of Tong 88-7 was the highest inanji. The mean PN of the RILs was the highest in Yanji and the
owest in Chuncheon, while the PN of the RILs in Kunming wasot significantly different from that in Suwon, suggesting that theesponses of PN to various low temperature environments wereariable.
.2.3. Grain number and spikelet fertilityMilyang 23 showed a higher FSN than Tong 88-7 in Suwon, but
he reduction of FSN was more severe in Milyang 23 than in Tong8-7 in three low temperature locations. In the RILs, the mean FSNas also reduced in Chuncheon, Yanji, and Kunming. The reduction
ates of FSN were 39% and 35% in C03 and C04, 62% and 54% in03 and Y04, and 74% and 90% in K03 and K04, respectively. TheN showed a response similar to that of FSN. The SSN showed anpposite pattern to that of FSN in all environments, as expected.
Tong 88-7 showed a high SF in four locations, ranging from4.1% in K04 to 98.2% in Y04. In Milyang 23, the SF was extremelyecreased by low temperature treatments, ranging from 13.7% in04 to 35.3% in C04. Milyang 23 showed much lower SF in Yanjind Kunming than in Chuncheon. In the RILs, the SF was severelyeduced by the low temperature treatments, where the SF was theighest in Chuncheon followed by those of Yanji and Kunming.
Tong 88-7 showed similar GW in the four locations, whileilyang 23 showed the lowest GW in Yanji but similar levels in
he other three locations. In the RILs, the GW in Yanji and Kunmingere similar and were lighter in Yanji and Kunming than in Suwon
nd Chuncheon.
.2.4. Phenotypic acceptability (PA)Differences in PA between the two parents were clear, as
eflected in their visual scores. The PA values of Tong 88-7 werein both years for all low temperature environments, while the
orresponding score for Milyang 23 was 7. Considerable variationn PA among the RILs was also observed in both years, with valuesanging from 1 to 9 in all low temperature environments.
.3. Analysis of variance and G × E interactions
.3.1. Analysis of variance (ANOVA)Four factors (location, year, genotype, and interaction) were
nvolved in the analysis of variance (ANOVA) (Table 4). The ANOVA
evealed highly significant G × E interactions as well as significantifferences among genotype, location, and year for all traits. Geno-ypic effects were larger on the DTH, CL, and PE than were the G × Enteraction effects. The dominant contributions of G × E interac-ions over the genotype variation were detected in the PN, FSN,merical trait code stands for each trait as follows: 1 for days to heading; 2 for culmikelet number; 7 for sterile spikelet number; 8 for spikelet number; 9 for spikelet
SSN, SF, GW, and PA traits. Particularly, the G × E interaction forthe PA accounted for 61% of sum of square (SS) and was two timeslarger than the main genotype effect (Table 4). The G × E interactioncomponents for all traits were mostly attributed to the G × L inter-action, followed by G × L × Y and G × Y in order. The percentage ofSS in trait-explaining G × E interactions ranged from 8% for DTH to61% for PA. The coefficient of variation (CV) across environmentsranged from 4% for DTH to 28% for SSN.
3.3.2. AMMI analysisFor the AMMI analysis of traits, AMMI-7 was used for all traits
except for DTH (AMMI-3), PA (AMMI-5), and PN (AMMI-6) (Table 4).AMMI bilinear terms were significant at the level of 0.1% for all ofthe traits except for DTH, in which the first two terms in the AMMI-3 model was significant. The first two IPCAs explained most of thevariance in the G × E interactions, ranging from 44% for PL and PEto 85% for DTH. The AMMI biplot composed of IPCA1 scores andthe means (adjusted means) of genotypes or environments pro-vided the pattern of G × E interaction for each trait (Fig. 2). Thecomponents of the biplot for each trait attributed most of the totaltreatment SS, which ranged from 68.7% for PA to 97.5% for DTH;thus, the biplot was suitable to interpret the G × E interactions andthe main effects. Milyang 23 and Tong 88-7 showed different G × Einteraction patterns for each trait. Milyang 23 showed the high-est absolute IPCA scores for SSN (2.9 of the IPCA1 score) and thelowest absolute value for PE (0.107); however, Tong 88-7 had thehighest IPCA scores for FSN (4.0) and the lowest absolute value forPE (0.064).
In the biplots based on the first two IPCAs, the spots of the RILswere located near the centers of both axes, while the environmentalspots were dispersed, revealing that G × E interaction effects weresmaller than the environmental effects (Fig. 2). The eight environ-ments, four locations for two years, for all traits were grouped byan AMMI biplot of IPCA1 scores and means into several distinctgroups that could be defined according to their locations (Fig. 2).For example, two groups of growing environments could be distin-guished for SF. Group one consisted of S03, S04, C03, C04, and Y04.This group had low negative or positive IPCA1 scores and 10–20%higher environmental means compared to that of the grand mean.The second group comprised K03, K04, and Y03, with high nega-tive or positive IPCA1 scores and environmental means lower thanthe grand mean. In most traits, the relatively low IPCA1 scores ofenvironmental effects were found in Suwon, whereas high IPCA1
scores were found in Kunming in both years. This pattern was moreclearly exhibited in SF, PA, and PE. In these traits, the IPCA1 envi-ronmental scores were generally increased in Suwon, Chuncheon,Yanji, and Kunming, in that order. The normal conditions in Suwonshowed a generally different pattern in all traits from those of the
234 W. Jiang et al. / Field Crops Research 117 (2010) 226–236
Table 6Correlational coefficients between agronomic traits in the recombinant inbred lines.
DTHa CL PL PE PN FSN SSN SN SF GW
CL 0.231**
PL 0.278** 0.603**
PE 0.053 0.737** 0.317**
PN −0.494** 0.116 0.046 0.079FSN −0.203* 0.529** 0.429** 0.476** −0.051SSN 0.333** 0.277** 0.427** 0.115 −0.121 0.200*
SN 0.338** 0.538** 0.558** 0.408** −0.107 0.809** 0.733**
SF −0.109 0.198* −0.038 0.275** 0.055 0.524** −0.670** −0.042GW −0.102 0.094 0.216** 0.001 0.073 0.013 −0.232** −0.126 0.264**
PA 0.244** −0.269** −0.066 −0.299** −0.198* −0.532** 0.437** −0.114 −0.798** −0.287**
tIastes
ifimtJfrorsGSnta
3
PpcwSnS
att5
4
oimeWt
a Refer to Table 3 for abbreviations.* Significant at P < 0.05.
** Significant at P < 0.01.
hree low temperature treatments. Chuncheon revealed the lowestPCA1 scores for most of the traits among the three low temper-ture environments, suggesting that the RIL response to chillingtress was relatively stable. IPCA1 scores for three low tempera-ure environments were quite diverse among the low temperaturenvironments, indicating that patterns and/or intensities of chillingtresses might differ.
To investigate the contribution of weather factors to the G × Enteractions, correlational analyses were conducted between therst IPCA axes and the various weather factors including dailyean temperature, minimum temperature, maximum tempera-
ure, diurnal temperature range, rainfall, and sun duration fromune to September (Table 5). The mean and minimum temperaturesrom the first of July to the end of September were significantly cor-elated with the IPCA1 scores in most of the traits. The IPCA1 scoresf FSN, SF, GW and PA were correlated with diurnal temperatureanges from the first of August to the end of September. Rainfall andun duration from August 1st to mid-September mainly affected the× E interaction of yield component traits such as PN, FSN, SSN,
N, GW, SF, and PA. The G × E interaction of DTH and yield compo-ent traits was significantly correlated with day length from Juneo August; however, no correlation was found between day lengthnd CL, PL, PE, or PN.
.4. Phenotypic correlations and broad sense heritability (h2)
The DTH was positively correlated with the CL, PL, SSN, SN, andA, and the FSF was negatively correlated with the PN. The SF wasositively correlated with the CL, PE, FSN, and GW and negativelyorrelated with the SSN and PA. The PA had positive correlationsith DTH and SSN and negative correlations with CL, PE, PN, FSN,
F, and GW. Unexpectedly, the correlation between DTH and SF wasot significant, indicating that a late heading date did not affect theF across environments (Table 6).
Broad sense heritability (h2) of agronomic traits estimatedcross locations and years was relatively large in the RILs althoughhe experimental environments were extremely diverse. The heri-abilities were estimated for the agronomic traits and ranged from2.1% for SF to 94.5% for CL (Table 3).
. Discussion
In this study, we conducted screening of the chilling tolerancef RILs in various environments including a cold water treatment
n Chuncheon, a naturally low temperature high-altitude environ-ent in Kunming, and a naturally low temperature high-latitudenvironment in Yanji, and performed two years of experiments.e were able to induce chilling injury in three low temperature
reatment locations and to study the responses against different
low temperature environments. The results showed that manyG × E interactions of chilling-related traits were correlated withtemperature factors such as daily average, minimum, maximum,and diurnal temperature range, implying that the damages thatoccurred in Chuncheon, Kunming, and Yanji were truly inducedby low temperature treatments (Table 5).
Even though the mean daily temperatures were similar inKunming and Yanji, the chilling damages were more severe inKunming in years 2003 and 2004, where the average daily temper-ature was maintained steadily low with little variation and diurnalchange during the rice-growing season. These results agree withthe reports by Shibata et al. (1970) and Board et al. (1980) that alarge diurnal temperature range is an important factor in reducingspikelet sterility in the booting and flowering stages.
Among the various agronomic traits evaluated in this study, theSF was severely damaged in Milyang 23, and the RILs and even theSF of Tong 88-7, the chilling-tolerant variety, was slightly reducedin Kunming (9% in 2003 and 18% in 2004), indicating that the SF canbe conveniently used as a criterion for the routine selection of chill-ing tolerance. As it is directly associated with yield potential, the SFhas been mainly used as the index for screening chilling tolerancefrom panicle initiation to the flowering stage (Satake and Koike,1983; Andaya and Mackill, 2003; Shimono et al., 2007a,b; Shu etal., 2010). As a complementary index for chilling tolerance, the PAscore can be used, representing the visual appearance of plants afterchilling treatment (Javier and Toledo, 2001; Lee, 2001; NICS, 2004).We detected highly significant differences in PA scores between theparents and among the RILs in the low temperature locations. ThePA scores of the parental lines were maintained consistently fromyear to year and from location to location (correlation betweenyears: r = 0.625** in Chuncheon; r = 0.747** in Yanji; r = 0.851** inKunming), and the broad sense heritability for PA was very high(h2 = 64.1%), suggesting that the PA can be used as a stable crite-rion to screen for the chilling tolerance of breeding lines. On theother hand, low temperature treatments also reduced the valuesof CL, PL, PE, FSN, SN, and GW, whereas they increased SSN in theRILs and their parents. These observations also indicated that thetreatments were successful for evaluating substantial differencesin chilling-related traits and are suitable for the further study ofthe main sources of variation using analysis of variance, as here, orfurther genetic analysis.
The multi-screening assessment of the G × E interactions forchilling tolerance should be considered for developing widelyadaptable chilling-tolerant lines of rice. The ANOVA revealedthat environments, genotypes and their interactions significantly
affected all measured traits. From the AMMI analysis for dissectingG × E interactions, we determined that the IPCA scores of the PAand SF in Chuncheon were relatively smaller than those in Kunmingand Yanji (Fig. 2), indicating that the G × E interaction was relativelylarger in Kunming and Yanji, whereas the low temperature treat-
s Resea
mscttaPwuy
5
catscsbilw
A
tRT
A
t
R
A
B
B
C
C
D
E
F
F
G
H
W. Jiang et al. / Field Crop
ent by cold water irrigation in Chuncheon was more stable forcreening chilling tolerance. By partitioning the G × E interactionomponents, the effect of the G × L interaction was revealed to con-ribute about half of the G × E interactions in all traits, suggestinghat the selection of superior lines in a certain location may not ben effective technique in other locations (Jain and Marshall, 1967;hakamas et al., 2008). On the other hand, the G × Y interactionas the lowest in Chuncheon due to screening of chilling tolerancender the controlled system of cold water irrigation, indicating thatearly variation of screening results would be lowest in Chuncheon.
. Conclusions
Through the AMMI analysis of the results of screening forhilling tolerance of rice RILs, the main effects and interactionsmong genotype, location, and environment were analyzed for 11raits related to chilling tolerance. For obtaining consistent results,creening for chilling tolerance using cold water irrigation at Chun-heon was considered to be the most appropriate. However, fortrong selection pressure for chilling tolerance, Kunming was theest location due to its relatively low average air temperature with
ts low diurnal fluctuation. These results demonstrate that multi-ocational screening should be the best strategy for developing
idely adaptable chilling-tolerant rice varieties.
cknowledgment
This research was supported by a grant (code #CG3111) fromhe Crop Functional Genomics Center of the 21st Century Frontieresearch Program funded by the Ministry of Education, Science andechnology, Republic of Korea.
ppendix A. Supplementary data
Supplementary data associated with this article can be found, inhe online version, at doi:10.1016/j.fcr.2010.03.007.
eferences
ndaya, V.C., Mackill, D.J., 2003. QTLs conferring cold tolerance at the booting stageof rice using recombinant inbred lines from a japonica x indica cross. Theor. Appl.Genet. 106, 1084–1090.
otwright Acuna, T.L., Lafitte, H.R., Wade, L.J., 2008. Genotype × environment inter-actions for grain yield of upland rice backcross lines in diverse hydrologicalenvironments. Field Crops Res. 108, 117–125.
oard, J.E., Peterson, M.L., Ng, E., 1980. Floret sterility in rice in a cool environment.Agron. J. 72, 483–487.
hung, G.S., Heu, M.H., 1991. Improvement of tongil-type rice cultivars fromindica/japonica hybridization in Korea. In: Bajaj, Y.P.S. (Ed.), Biotechnology inAgriculture and Forestry 14-Rice. Springer, Berlin Heidelberg, New York, pp.105–112.
ooper, M., Byth, D.E., 1996. Understanding plant adaptation to achieve systematicapplied crop improvement-A fundamental challenge. In: Cooper, M., Hammer,G.L. (Eds.), Plant Adaptation and Crop Improvement. CAB International in Asso-ciation with IRRI and ICRISAT, Wallingford, Oxford, UK, pp. 5–23.
ai, L., Lin, X.H., Ye, C.R., Ise, K., Saito, K., Kato, A., Xu, F.R., Yu, T.Q., Zhang, D.P.,2004. Identification of quantitative trait loci controlling cold tolerance at thereproductive stage in Yunnan landrace of rice, Kunmingxiaobaigu. Breed. Sci.54, 253–258.
bdon, J.S., Gauch Jr., H.G., 2002. Additive main effect and multiplicative interactionanalysis of national turfgrass performance traits. II. Cultivar recommendations.Crop Sci. 42, 497–506.
arrell, T.C., Fox, K.M., Williams, R., Fukai, S., 2004. Australia: new screening methodfor cold tolerance during the reproductive stage in rice. In: Fischer, T. (Ed.), Pro-ceedings of the 4th International Crop Science Congress. Brisbane, ConventionCentre, 26 September–1 October.
arrell, T.C., Fox, K.M., Williams, R.L., Fukai, S., 2006. Genotypic variation for cold
tolerance during reproductive development in rice: screening with cold air andcold water. Field Crops Res. 98, 178–194.auch Jr., H.G., 2007. MATMODEL Version 3.0: Open source software for AMMI andrelated analyses. Crop and Soil Sciences, Cornell University, Ithaca, NY, 14853.
an, L.Z., Koh, H.J., 2000. Genetic analysis of growth response to cold water irrigationin rice. Korean J. Crop Sci. 45, 26–31.
rch 117 (2010) 226–236 235
Hill, J., Becker, H.C., Tigerstedt, P.M.A., 1998. Quantitative and Ecological Aspects ofPlant Breeding. Chapman & Hall, London, pp. 275.
Jain, S.K., Marshall, D.R., 1967. Population studies in predominantly self-pollinatedspecies. X. Variation in natural populations of Avena fatua and A. barbata. Am.Nat. 101, 19–33.
Javier, E.L., Toledo, M.C., 2001. Finding genetic donors for cold tolerance the INGERgene pool. In: Fukai, S., Basnayake, J. (Eds.), ACIAR Proceedings 101; IncreasedLowland Rice Production in the Mekong Region. Australian Center for Interna-tional Agricultural Research, GPO Box 1571, Canberra, ACT 2601, pp. 147–151.
Jiang, W., Chu, S.H., Piao, R., Chin, J.H., Jin, Y.M., Lee, J., Qiao, Y., Han, L., Piao, Z., Koh,H.J., 2008. Fine mapping and candidate gene analysis of hwh1 and hwh2, a set ofcomplementary genes controlling hybrid breakdown in rice. Theor. Appl. Genet.116, 1117–1127.
Kaneda, C., Beachell, H.M., 1974. Response of indica-japonica rice hybrids to lowtemperatures. SABRO J. 1, 17–32.
Kumar, R., Venuprasad, R., Atlin, G.N., 2007. Genetic analysis of rainfed lowland ricedrought tolerance under naturally-occuring stress in eastern India: heritabilityand QTL effects. Field Crops Res. 103, 42–52.
Kuroki, M., Saito, K., Matsuba, S., Yokogami, N., Shimizu, H., Ando, I., Sato, Y., 2007. Aquantitative trait locus for cold tolerance at the booting stage on rice chromo-some 8. Theor. Appl. Genet. 115, 593–600.
Lee, M.H., 2001. Low temperature tolerance in rice: the Korean experience. In: Fukai,S., Basnayake, J. (Eds.), ACIAR Proceedings of the 101; Increased Lowland RiceProduction in the Mekong Region. Australian Center for International Agricul-tural Research, GPO Box 1571, Canberra, ACT 2601, pp. 138–146.
Nagano, K., 1998. Development of new breeding techniques for cold toleranceand breeding of new rice cultivars with highly cold tolerance, Hitomeboreand Jyoudeki. In: Proceedings of the International Workshop on Breeding andBiotechnology for Environmental Stress in Rice, pp. 143–148.
Nakamura, T., Chiba, M., Koike, S., Nishiyama, I., Satake, T., Shibata, M., 2000. Numberof pollen grains in rice cultivars with different cool-weather resistance at theyoung microspore stage. Plant Prod. Sci. 3, 299–305.
NICS (National Institute of Crop Science), 2004. Stress Tolerance Breeding of Rice inKorea. RDA, Korea.
Oh, C.S., Choi, Y.H., Lee, S.J., Yoon, D.B., Moon, H.P., Ahn, S.N., 2004. Mapping ofquantitative trait loci for cold tolerance in weedy rice. Breed. Sci. 54, 373–380.
Phakamas, N., Patanothai, A., Pannangpetch, K., Jogloy, S., Hoogenboom, G., 2008.Dynamic patterns of components of genotype × environment interaction for podyield of peanut over multiple years: a simulation approach. Field Crops Res. 106,9–21.
Quan, C.Z., Jin, C.H., Jin, J.H., Xu, S.J., 2006. Rice cold disaster and defensive technologyin Yanbian area. J. Agric. Sci. Yanbian Univ. 28, 172–176 (in Chinese, with Englishabstract).
Saito, K., Hayano-Saito, Y., Maruyama-Funatsuki, W., Sato, Y., Kato, A., 2004. Physicalmapping and putative candidate gene identification of a quantitative trait locusCtb1 for cold tolerance at the booting stage of rice. Theor. Appl. Genet. 109,515–522.
Saito, K., Miura, K., Nagano, K., Hayano-Saito, Y., Araki, H., Kato, A., 2001. Iden-tification of two closely linked quantitative trait loci for cold tolerance onchromosome 4 of rice and their association with anther length. Theor. Appl.Genet. 103, 862–868.
SAS Institute Inc., 1999. SAS/Stat User’s Guide, Version 8.2. SAS institute, Inc., Cary,NC, USA.
Satake, T., 1976. Sterility-type cold injury in paddy rice plants. In: Proceedings of theSymposium on Climate and Rice, IRRI, Los Banos, Philippines, pp. 281–300.
Satake, T., Koike, S., 1983. Sterility caused by cooling treatment at the floweringstage in rice plants. I. The stage and organ susceptible to cool temperature. Jpn.J. Crop Sci. 52, 207–214.
Satake, T., Lee, S.Y., Koike, S., Kariya, K., 1988. Male sterility caused by cooling treat-ment at the young microspore stage in rice plants. XXVIII. Prevention of coolinjury with the newly devised water management practices-effects of the tem-perature and depth of water before the critical stage. Jpn. J. Crop Sci. 57, 234–241.
Shibata, M., Sasaki, K., Shimazaki, Y., 1970. Effects of air-temperature andwater-temperature at each stage of the growth of lowland rice. I. Effect of air-temperature and water-temperature on the percentage of sterile grains. Jpn. J.Crop Sci. 39, 401–408 (in Japanese, with English abstract).
Shimono, H., Hasegawa, T., Fujimura, S., Iwama, K., 2004. Responses of leaf photo-synthesis and plant water status in rice to low water temperature at differentgrowth stages. Field Crops Res. 89, 71–83.
Shimono, H., Hasegawa, T., Iwama, K., 2002. Response of growth and grain yield inpaddy rice to cool water at different growth stages. Field Crops Res. 73, 67–79.
Shimono, H., Hasegawa, T., Kuwagata, T., Iwama, K., 2007a. Modeling the effectsof water temperature on rice growth and yield under a cool climate. II. Modelapplication. Agron. J. 99, 1338–1344.
Shimono, H., Hasegawa, T., Moriyama, M., Fujimura, S., Nagata, T., 2005. Modelingspikelet sterility induced by low temperature in rice. Agron. J. 97, 1524–1536.
Shimono, H., Okada, M., Kanda, E., Arakawa, I., 2007b. Low temperature-inducedsterility in rice: evidence for the effects of temperature before panicle initiation.Field Crops Res. 101, 221–231.
Shu, J.P., Jeung, J.U., Lee, J.I., Choi, Y.H., Yea, J.D., Virk, P.S., Mackill, D.J., Jena, K.K., 2010.Identification and analysis of QTLs controlling cold tolerance at the reproductivestage and validation of effective QTLs in cold-tolerant genotypes of rice (Oryzasativa L.). Theor. Appl. Genet. 120, 985–995.
Suzuki, S., 1982. Cold tolerance in rice plants with special reference to the floralcharacters. II. Relations between floral characters and the degree of cold toler-

2 s Rese
T
T
W
tification and mapping of quantitative trait loci for cold tolerance at the bootingstage in a japonica rice near-isogenic line. Plant Sci. 174, 340–347.
36 W. Jiang et al. / Field Crop
ance in segregating generations. Jpn. J. Breed. 32, 9–16 (in Japanese, with Englishabstract).
akamura, Y., Takeuchi, S., Hasegawa, H., 1960. Studies on the effects of soil temper-ature upon the growth of crop plants. III. Soil temperature and leaf emergence ofrice plant. VIII. Relation of temperature of several parts of rice plant to the rate
of leaf emergence. Proc. Crop Sci. Jpn. 29, 195–198 (in Japanese, with Englishsummary).akeoka, Y., AlMamun, A., Wada, G., Kaufman, B., 1992. Reproductive Adaptationsof Rice to Environmental Stress. Elsevier, Amsterdam, 250 pp.
u, R., Garg, A., 2003. Engineering rice plant with trehalose-producing genesimproves tolerance to drought, salt and low temperature. ISB news report, March
arch 117 (2010) 226–236
2003. Covering agricultural and environmental biotechnology developments.ISB News Report (February).
Xu, L.M., Zhou, L., Zeng, Y.W., Wang, F.M., Zhang, H.L., Shen, S.Q., Li, Z.C., 2008. Iden-
Yea, J.D., 1995. Response of rice varieties to cold water irrigation. Korean J. Crop Sci.40, 203–211 (in Korean, with English summary).
Yoshida, S., 1981. Fundamentals of Rice Crop Science. The International RiceResearch Institute, Los Banos, Philippines, pp. 69–83.