genotype and environment effects on rice (oryza sativa l.) grain arsenic concentration in bangladesh
TRANSCRIPT
REGULAR ARTICLE
Genotype and environment effects on rice (Oryza sativa L.)grain arsenic concentration in Bangladesh
Zia U. Ahmed & Golam M. Panaullah & Hugh Gauch Jr & Susan R. McCouch &
Wricha Tyagi & Mohammed S. Kabir & John Malcolm Duxbury
Received: 10 May 2010 /Accepted: 23 August 2010 /Published online: 18 September 2010# Springer Science+Business Media B.V. 2010
Abstract Genetic analysis of 38 rice varieties releasedby the Bangladesh Rice Research Institute (BRRI)identified 34 as indica, 2 as admixed between indicaand aus, and 4 as belonging to the aromatic/Group Vsubpopulation. Indica varieties developed for the two
major rice-growing seasons, the wet monsoon (aman)and the dry winter (boro), were not geneticallydifferentiated. The Additive Main Effect and Multipli-cative Interaction (AMMI) model was used to assessthe effect of genotype (G), environment (E) and
Plant Soil (2011) 338:367–382DOI 10.1007/s11104-010-0551-7
Responsible Editor: Jian Feng Ma.
Electronic supplementary material The online version of thisarticle (doi:10.1007/s11104-010-0551-7) containssupplementary material, which is available to authorized users.
Z. U. AhmedDepartment of Crop and Soil Sciences, Cornell University,1018 Bradfield Hall,Ithaca, NY 14853, USAe-mail: [email protected]
G. M. PanaullahCornell University USDA Food for Progress Program(Bangladesh),House 6, Road 6, Sector 3, Uttara,Dhaka 1230, Bangladeshe-mail: [email protected]
H. Gauch JrDepartment of Crop and Soil Sciences, Cornell University,519 Bradfield Hall,Ithaca, NY 14853, USAe-mail: [email protected]
S. R. McCouchDepartment of Plant Breeding and Genetics,Cornell University,162 Emerson Hall,Ithaca, NY 14853, USAe-mail: [email protected]
W. TyagiSchool of Crop Improvement,Central Agricultural University,Umiam, Meghalaya 793103, India
M. S. KabirBangladesh Rice Research Institute,Gazipur 1701, Bangladeshe-mail: [email protected]
J. M. Duxbury (*)Department of Crop and Soil Sciences, Cornell University,917 Bradfield Hall,Ithaca, NY 14853, USAe-mail: [email protected]
genotype-environment interaction (GEI) on grain arse-nic (As) concentration when these rice varieties weregrown at ten BRRI research stations located acrossdiverse agro-ecological zones in Bangladesh. G, E andGEI, significantly influenced grain As concentration inboth seasons. Overall, E accounted for 69%–80%, G9%–10% and GEI 10%–21% of the observed variabil-ity in grain As. One site, Satkhira had the highest meangrain As concentration and the largest interactionprinciple component analysis (IPCA) scores in bothseasons, indicating maximum interaction with geno-types. Site effects were more pronounced in the borothan in the aman season. The soil level of poorlycrystalline Fe-oxide (AOFe), the ratio of AOFe toassociated As, soil phosphate extractable As and soilpH were important sub-components of E controllingrice grain As concentration. Irrespective of environ-ment, the mean grain As concentration was signifi-cantly higher in the boro (0.290 mg As kg−1) than inthe aman (0.154 mg As kg−1) season (p<0.0001),though the reasons for this are unclear. Based on meangrain As concentration and stability across environ-ments, the variety BR3 is currently the best choice forthe boro season, while BR 23 and BRRI dhan 38 arethe best choices for the aman season. Popular varietiesBR 11 (aman) and BRRI dhan 28 and 29 (boro) hadgrain As concentrations close to the mean value andwere fairly stable across environments, while high-yielding, short-duration aman season varieties (BRRIdhan 32, 33 and 39) developed for intensified croppinghad relatively high grain As concentrations. Resultssuggest that genetic approaches to reducing As in ricegrain will require the introduction of novel geneticvariation and must be accompanied by appropriatemanagement strategies to reduce As availability anduptake by rice.
Keywords Rice grain arsenic . Low arsenic ricevarieties . Genotype-environment interaction (GEI) .
Main Effect andMultiplicative Interaction (AMMI)
Introduction
The development of rice production in the dry winterseason in Bangladesh, locally known as boro, usinggroundwater for irrigation coupled with Green Rev-olution high yielding rice varieties (HYVs) and use ofchemical fertilizers played a key role in tripling the
annual rice output in Bangladesh from about 9 milliontons in 1970–71 to more than 25 million tons by themid-1990’s (BBS 2004), making Bangladesh self-sufficient in this staple food grain (Baffes and Gautam1996). Today, boro season rice contributes about 50%of the total annual rice production (MOA 2008).Recent findings have shown elevated As concentra-tions in rice grain from many parts of Bangladesh (Luet al. 2009; Meharg and Rahman 2003; Williams et al.2006; Zavala and Duxbury 2008), indicating that ricecontributes to human exposure to As, in addition tothe well known problem of As ingestion throughdrinking water (BGS/DPHE 2000). The average dailyconsumption of rice by a Bangladeshi male adult ishigh, 453 g milled rice per person per day (BangladeshAgricultural Research Council, unpublished food andnutrition data, 2007), providing more than 70% of dailycalorie intake (Ninno and Dorosh 2001). Thus, con-taminated rice may represent a significant pathway ofAs consumption by humans, in addition to drinkingwater (Duxbury et al. 2003; Meharg and Rahman2003).
Large variations in grain As concentration ofBangladeshi rice varieties sampled from rice fieldshave been observed (Duxbury et al. 2003; Zavala andDuxbury 2008). Market basket surveys also revealedsimilar variability (Williams et al. 2005, 2006). Someof this variability has been explained by differences ingroundwater irrigation levels of As (Williams et al.2006) and baseline soil As concentrations (Lu et al.2009). A recent study indicated that variation in ricegrain As concentration in Bangladesh was largelycontrolled by rice genetics (Norton et al. 2009b), butexpansion of this work to India and China (Norton etal. 2009a) led to the conclusion that that environmentplayed a more important role than genetics. However,quantitative characterization of the relative impor-tance of rice genetics (G), growing environments (E)and GxE interactions (GEI) on rice grain As concen-trations has not been done. The characterization of Eis particularly important because As uptake by ricemainly depends on As availability rather than total Asin the soil (Sheppard 1992). Rice grain can accumu-late relatively large amounts of As even from soils notcontaminated by As (Daum et al. 2001). Soil factorsthat have been reported to regulate As bio-availabilityto plants include: pH and redox status (Marin et al.1993), clay content (Sheppard 1992), existence ofpoorly crystalline iron oxide (Bogdan and Schenk
368 Plant Soil (2011) 338:367–382
2009; Takahashi et al. 2004), and type and amount oforganic matter in soil (Mitchell and Barre 1995).These soil properties vary both at both local andregional scales in rice growing areas of Bangladesh(Brammer 2009).
The objectives of the present study were to (1)genetically classify and characterize diversity in ricevarieties released by the Bangladesh Rice ResearchInstitute (BRRI), (2) to understand the role of G, Eand GEI with respect to As concentration in rice grainof BRRI varieties grown in diverse soil environmentsin the two main rice growing seasons and (3) toidentify rice varieties with low grain As concentrationsuited to specific or broad growing environments inBangladesh.
Material and methods
Rice varieties and genetic classification
Twenty dry winter season (locally known as boro)and 18 wet monsoon season (locally known as aman)rice genotypes developed by the Bangladesh RiceResearch Institute (BRRI) were used in this study(Table 1). These HYVs have been developed forspecific environments and cropping systems in theboro (January to May) or aman (July to December)seasons. All 38 test varieties were evaluated with 30simple-sequence repeat (SSR) markers and geneticallyclassified to subpopulation based on clustering with acontrol set of 50 rice accessions whose sub-populationidentity was known (10 each of the temperate japonica,
tropical japonica, indica, aus and basmati/aromatic(Garris et al. 2005)) using a model based Bayesianapproach (Falush et al. 2003; Pritchard et al. 2000) andthe C.S. Chord distance method (Cavalli-Sforza andEdwards 1967).
Experimental sites
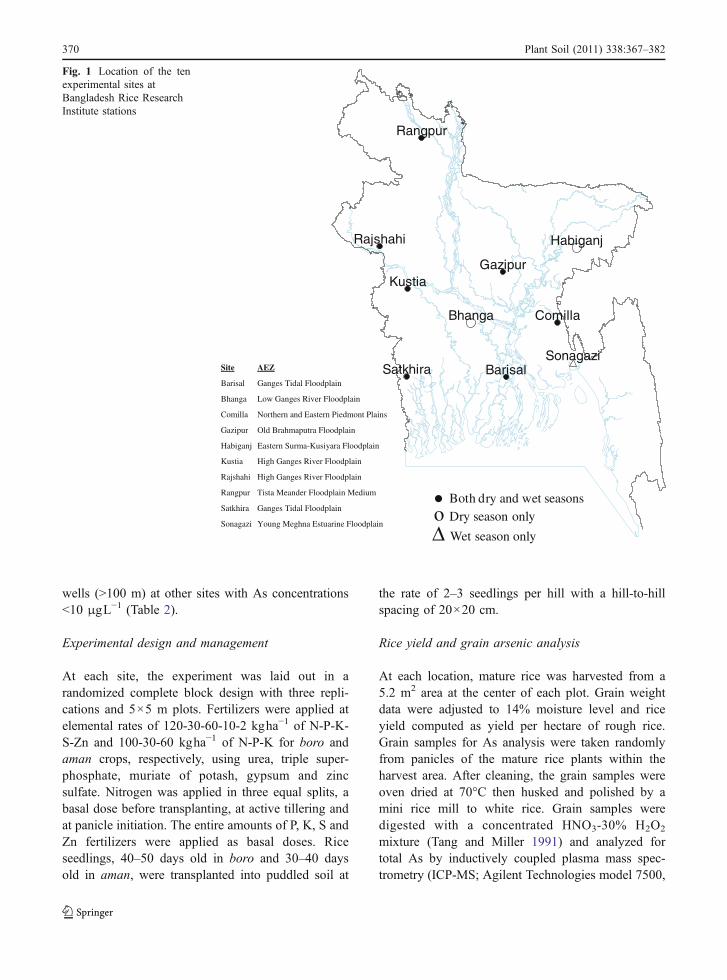
Rice grain samples were collected in 2004–2005 fromrice varietal evaluation trials at nine BRRI researchstations located at Barisal, Bhanga, Comilla, Gazipur,Habiganj, Rajshahi, Rangpur, Satkhira and Sonagazi,and at the Bangladesh Agricultural DevelopmentCorporation station in Kustia. The sites represent nineagro-ecological zones and the major rice growingenvironments in Bangladesh (Fig. 1). Boro (20genotypes) and aman (18 genotypes) rice varietieswere grown independently in their respective seasonsat all locations, except for BR3 that was grown inboth seasons. Rice was not grown at Bhanga andHabiganj in the aman season due to deep flooding norat Sonagazi in the boro season due to high soilsalinity in this dry season. Poor seed germinationprevented the growth of BR27 at Bhanga and Kustia,BR6 and BR27 at Rajshahi and BR9, BR18 andBR19 at Satkhira. In both seasons, the fields wereflood-irrigated to maintain 5–10 cm standing waterthroughout the growing season until water wasdrained one week before harvest. Groundwater fromshallow tubewells (STW’s; <100 m) containing 120and 234 μg As L−1 was used for irrigation at Bhangaand Satkhira, respectively. Irrigation was from asurface water canal at Barisal and from deep tube
Table 1 Rice varieties used
Season Genetic subpopulation Photosensitivity a Variety
Aman (Wet) Indica Low BR3b, BR25, BRRI dhan 31, BRRI dhan 32, and BRRI dhan 39
Moderate BR10, BR11, and BRRI dhan 30
Strong BR4, BR22, BR23, BRRI dhan 40, and BRRI dhan 41
Aromatic Strong BR5, BRRI dhan 34, BRRI dhan37, and BRRI dhan 38
Admixed Moderate BRRI dhan 33
Boro (Dry) Indica Low BR1, BR3b, BR06, BR07, BR08, BR09, BR12, BR14, BR15,BR16, BR17, BR18, BR19, BR26, BRRI dhan 27, BRRIdhan28, BRRI dhan 29, BRRI dhan 35 and BRRI Dhan 36
Admixed BR2
a BRRI (2004)b BR3 was grown in both aman and boro seasons
Plant Soil (2011) 338:367–382 369
wells (>100 m) at other sites with As concentrations<10 μgL−1 (Table 2).
Experimental design and management
At each site, the experiment was laid out in arandomized complete block design with three repli-cations and 5×5 m plots. Fertilizers were applied atelemental rates of 120-30-60-10-2 kgha−1 of N-P-K-S-Zn and 100-30-60 kgha−1 of N-P-K for boro andaman crops, respectively, using urea, triple super-phosphate, muriate of potash, gypsum and zincsulfate. Nitrogen was applied in three equal splits, abasal dose before transplanting, at active tillering andat panicle initiation. The entire amounts of P, K, S andZn fertilizers were applied as basal doses. Riceseedlings, 40–50 days old in boro and 30–40 daysold in aman, were transplanted into puddled soil at
the rate of 2–3 seedlings per hill with a hill-to-hillspacing of 20×20 cm.
Rice yield and grain arsenic analysis
At each location, mature rice was harvested from a5.2 m2 area at the center of each plot. Grain weightdata were adjusted to 14% moisture level and riceyield computed as yield per hectare of rough rice.Grain samples for As analysis were taken randomlyfrom panicles of the mature rice plants within theharvest area. After cleaning, the grain samples wereoven dried at 70°C then husked and polished by amini rice mill to white rice. Grain samples weredigested with a concentrated HNO3-30% H2O2
mixture (Tang and Miller 1991) and analyzed fortotal As by inductively coupled plasma mass spec-trometry (ICP-MS; Agilent Technologies model 7500,
KustiaGazipur
BarisalSatkhira
Comilla
Rajshahi
Rangpur
Bhanga
Habiganj
Sonagazi
• o Dry season only
Δ Wet season only
Site AEZ
Barisal Ganges Tidal Floodplain
Bhanga Low Ganges River Floodplain
Comilla Northern and Eastern Piedmont Plains
Gazipur Old Brahmaputra Floodplain
Habiganj Eastern Surma-Kusiyara Floodplain
Kustia High Ganges River Floodplain
Rajshahi High Ganges River Floodplain
Rangpur Tista Meander Floodplain Medium
Satkhira Ganges Tidal Floodplain
Sonagazi Young Meghna Estuarine Floodplain
Both dry and wet seasons
Fig. 1 Location of the tenexperimental sites atBangladesh Rice ResearchInstitute stations
370 Plant Soil (2011) 338:367–382
USA). Replicated reagent blanks and a NationalInstitute of Standards and Technology (NIST) certi-fied reference rice flour (SRM-1568a) were includedin each analytical batch for quality control. The rangeof recovery of total As from SRM-1568a was 91%–106% (Online Resource Table 2).
Soil sampling and analysis
At each site during harvest, composite soil samples(0–15 cm soil depth) were collected from five points(four from two diagonals and one from the intersec-tion point of the diagonals) within the harvest area.The soil samples were mixed, air-dried, and passedthrough a 2 mm sieve prior to chemical analysis. SoilpH was measured using a glass electrode and a soil:water ratio of 1:2.5. Soil organic C (SOC) wasdetermined by dry combustion using a Europa ScientificRoboprep C and N analyzer. Soil Fe parametersmeasured were total Fe (TFe) by HNO3-H2O2 digestion(USEPA 1990), poorly crystalline Fe-oxide (AOFe) byextraction with acidified ammonium-oxalate in thedark and total Fe oxide (CDFe) by extraction with
citrate-dithionite (Scheinost and Schwertmann 1999).Soil As parameters measured were total As (TAs) byHNO3-H2O2 digestion (USEPA 1990), ligand-exchangeable As (PAs) by Na- phosphate extractionand As associated with poorly crystalline Fe oxides(AOAs) by oxalate extraction (Loeppert et al. 2002).Total As in soil digests and extracts was determined byICP-MS and Fe was measured by ICP-atomic emissionspectroscopy (Spectro-CCD, USA). The recovery oftotal As from NIST certified reference soil SRM-2709ranged from 99%–100%.
Statistical analysis
To examine the effect of environment (E) andgenotype (G) on rice grain-As concentration, acombined analysis of variance (ANOVA) was per-formed using the general linear model (GLM).Locations and genotypes were considered as fixedeffects, while replications were random effects. Thesum of squares was first partitioned into genotype(G), environment (E) and genotype-environmentinteraction (GEI). Then, the Additive Main Effects
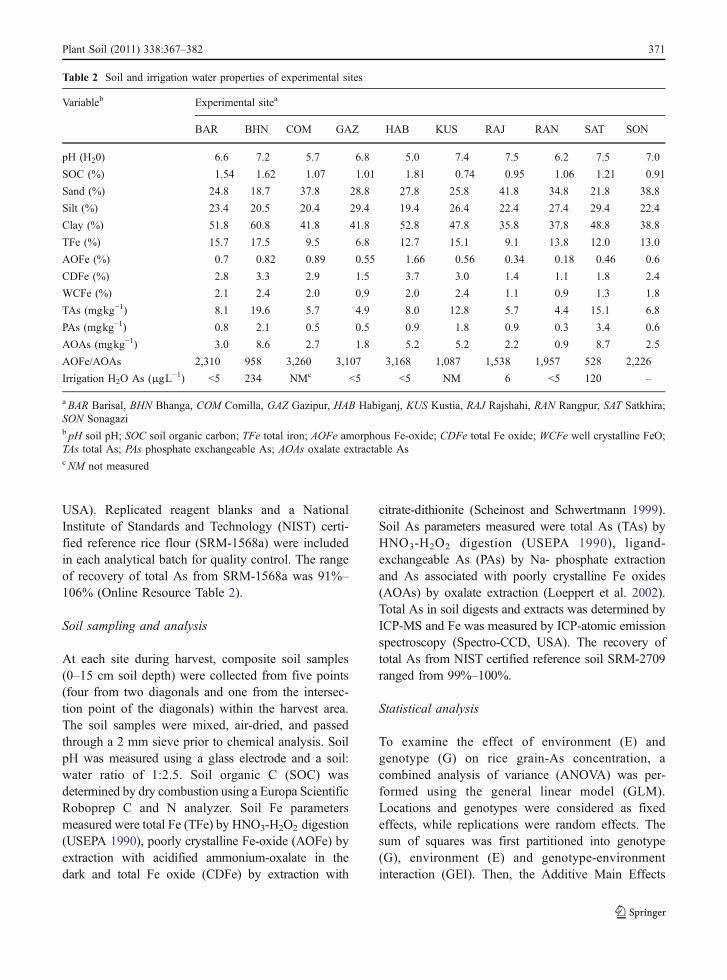
Table 2 Soil and irrigation water properties of experimental sites
Variableb Experimental sitea
BAR BHN COM GAZ HAB KUS RAJ RAN SAT SON
pH (H20) 6.6 7.2 5.7 6.8 5.0 7.4 7.5 6.2 7.5 7.0
SOC (%) 1.54 1.62 1.07 1.01 1.81 0.74 0.95 1.06 1.21 0.91
Sand (%) 24.8 18.7 37.8 28.8 27.8 25.8 41.8 34.8 21.8 38.8
Silt (%) 23.4 20.5 20.4 29.4 19.4 26.4 22.4 27.4 29.4 22.4
Clay (%) 51.8 60.8 41.8 41.8 52.8 47.8 35.8 37.8 48.8 38.8
TFe (%) 15.7 17.5 9.5 6.8 12.7 15.1 9.1 13.8 12.0 13.0
AOFe (%) 0.7 0.82 0.89 0.55 1.66 0.56 0.34 0.18 0.46 0.6
CDFe (%) 2.8 3.3 2.9 1.5 3.7 3.0 1.4 1.1 1.8 2.4
WCFe (%) 2.1 2.4 2.0 0.9 2.0 2.4 1.1 0.9 1.3 1.8
TAs (mgkg−1) 8.1 19.6 5.7 4.9 8.0 12.8 5.7 4.4 15.1 6.8
PAs (mgkg−1) 0.8 2.1 0.5 0.5 0.9 1.8 0.9 0.3 3.4 0.6
AOAs (mgkg−1) 3.0 8.6 2.7 1.8 5.2 5.2 2.2 0.9 8.7 2.5
AOFe/AOAs 2,310 958 3,260 3,107 3,168 1,087 1,538 1,957 528 2,226
Irrigation H2O As (μgL−1) <5 234 NMc <5 <5 NM 6 <5 120 –
aBAR Barisal, BHN Bhanga, COM Comilla, GAZ Gazipur, HAB Habiganj, KUS Kustia, RAJ Rajshahi, RAN Rangpur, SAT Satkhira;SON Sonagazib pH soil pH; SOC soil organic carbon; TFe total iron; AOFe amorphous Fe-oxide; CDFe total Fe oxide; WCFe well crystalline FeO;TAs total As; PAs phosphate exchangeable As; AOAs oxalate extractable AscNM not measured
Plant Soil (2011) 338:367–382 371
and Multiplicative Interaction (AMMI) model, thatcombines standard ANOVA for G and E withprincipal component (PC) analysis, was used todecompose the GEI into several interaction principalanalysis axes (IPCAs) (Crossa et al. 1990; Gauch1992.) The relative contribution (expressed in per-centage) of each component to the total variation wascomputed. MATMODEL software Version 3.0(Gauch 2007) was used for ANOVA and AMMIanalysis. A PC analysis was also done on thecorrelation matrix of soil variables. Correlationanalyses were conducted to test for linear relation-ships between the soil co-variables and the E mean ofgrain As.
Results
Genetic classification of rice varieties
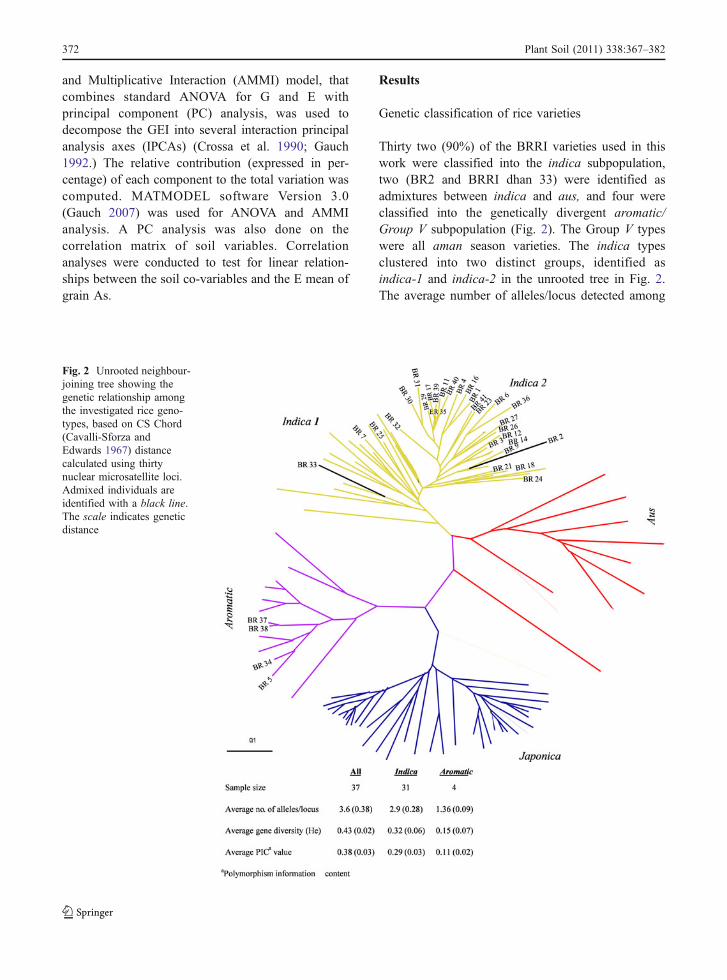
Thirty two (90%) of the BRRI varieties used in thiswork were classified into the indica subpopulation,two (BR2 and BRRI dhan 33) were identified asadmixtures between indica and aus, and four wereclassified into the genetically divergent aromatic/Group V subpopulation (Fig. 2). The Group V typeswere all aman season varieties. The indica typesclustered into two distinct groups, identified asindica-1 and indica-2 in the unrooted tree in Fig. 2.The average number of alleles/locus detected among
Fig. 2 Unrooted neighbour-joining tree showing thegenetic relationship amongthe investigated rice geno-types, based on CS Chord(Cavalli-Sforza andEdwards 1967) distancecalculated using thirtynuclear microsatellite loci.Admixed individuals areidentified with a black line.The scale indicates geneticdistance
372 Plant Soil (2011) 338:367–382
the 34 indica/aus cultivars was 3.6, the average genediversity (He) was 0.33 and the average polymor-phism information content (PIC) was 0.29. Previouslypublished estimates of diversity based on evaluationof 79 indica varieties by Garris et al. (2005) showedan average of 7.3 alleles/locus, average He of 0.55and average PIC value of 0.52. Similarly, the averagenumber of alleles/locus detected among the 4 aro-matic/Group V cultivars was 1.4, the average He was0.15 and the average polymorphism informationcontent (PIC) was 0.11. Previously published esti-mates of diversity based on evaluation of 19 aromat-ic/Group V varieties by Garris et al. (2005) showed anaverage of 3.4 alleles/locus, average He of 0.39 andaverage PIC value of 0.38. These results indicate thatthere is a great deal of genetic variation availablewithin the indica and aromatic/Group V gene poolsthat is not represented within the BRRI varieties.
Soil properties
Many of the physical and chemical properties of thesoils varied considerably (Table 2). Soil pH rangedfrom 5.0 at Habiganj to 7.5 at Satkhira. Soil total Asranged from 4.4 mgkg−1 at Rangpur to 19.6 mgkg−1
at Bhanga where high As groundwater was used forirrigation. Arsenic extracted by Na-phosphate rangedfrom 0.5 to 3.4 mgkg−1 and averaged only 11% oftotal As. The highest fraction of total As extracted byNa-phosphate (23%) was for the Satkhira soil. Theconcentrations of poorly crystalline Fe oxide rangedfrom 0.18% at Rangpur to 1.66% at Habiganj. The
amount of As associated with poorly crystalline Feoxide ranged from 0.9 to 8.7 mgkg−1 (20%–56% oftotal As) with the highest amount at Bhanga andSatkhira,. The ratio of Fe:As extracted by ammoniumoxalate varied six-fold from 3168 at Habiganj to 527at Satkhira.
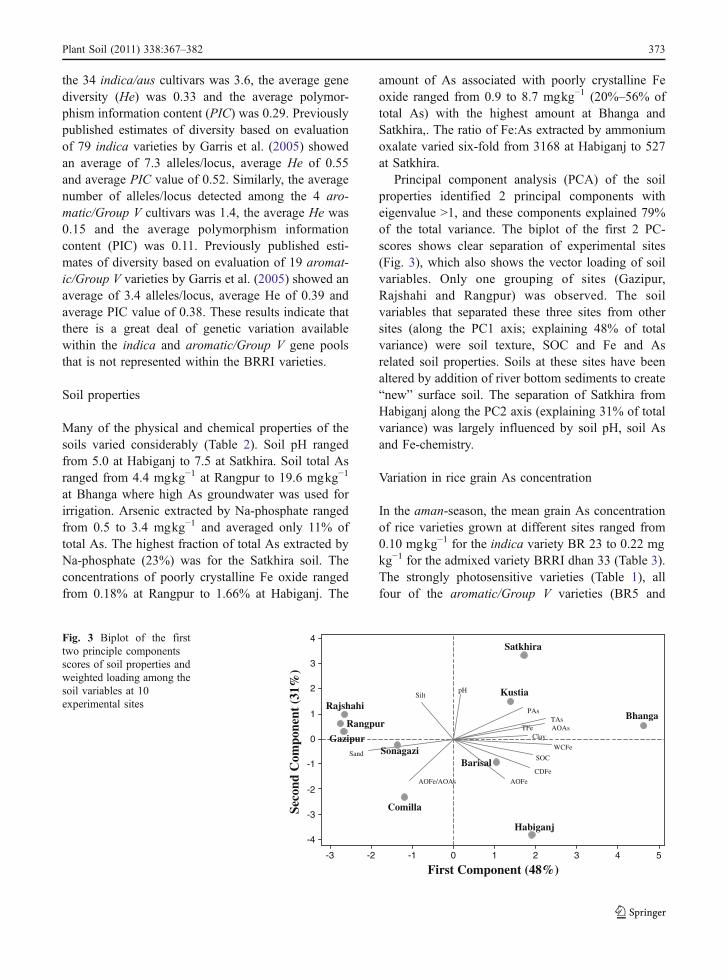
Principal component analysis (PCA) of the soilproperties identified 2 principal components witheigenvalue >1, and these components explained 79%of the total variance. The biplot of the first 2 PC-scores shows clear separation of experimental sites(Fig. 3), which also shows the vector loading of soilvariables. Only one grouping of sites (Gazipur,Rajshahi and Rangpur) was observed. The soilvariables that separated these three sites from othersites (along the PC1 axis; explaining 48% of totalvariance) were soil texture, SOC and Fe and Asrelated soil properties. Soils at these sites have beenaltered by addition of river bottom sediments to create“new” surface soil. The separation of Satkhira fromHabiganj along the PC2 axis (explaining 31% of totalvariance) was largely influenced by soil pH, soil Asand Fe-chemistry.
Variation in rice grain As concentration
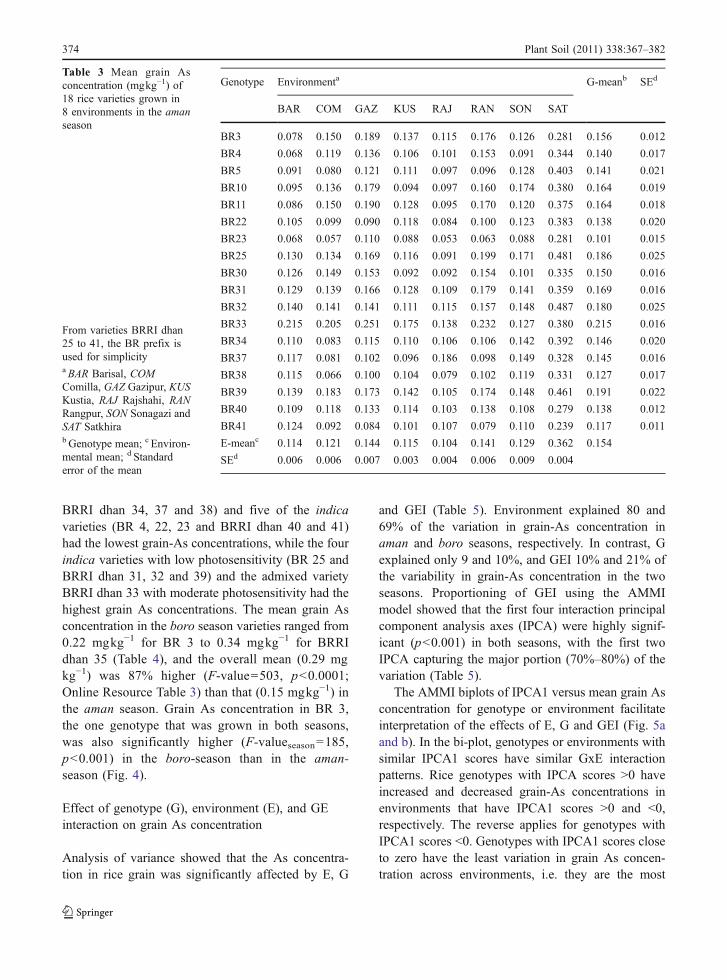
In the aman-season, the mean grain As concentrationof rice varieties grown at different sites ranged from0.10 mgkg−1 for the indica variety BR 23 to 0.22 mgkg−1 for the admixed variety BRRI dhan 33 (Table 3).The strongly photosensitive varieties (Table 1), allfour of the aromatic/Group V varieties (BR5 and
543210-1-2-3
4
3
2
1
0
-1
-2
-3
-4
First Component (48%)
Seco
nd C
ompo
nent
(31
%)
AOFe/AOAs
AOAs
PAsTAs
WCFe
CDFe
AOFe
TFeClay
Silt
SandSOC
pH
Rajshahi
Satkhira
Bhanga
Habiganj
Comilla
Kustia
BarisalSonagazi
Gazipur
Rangpur
Fig. 3 Biplot of the firsttwo principle componentsscores of soil properties andweighted loading among thesoil variables at 10experimental sites
Plant Soil (2011) 338:367–382 373
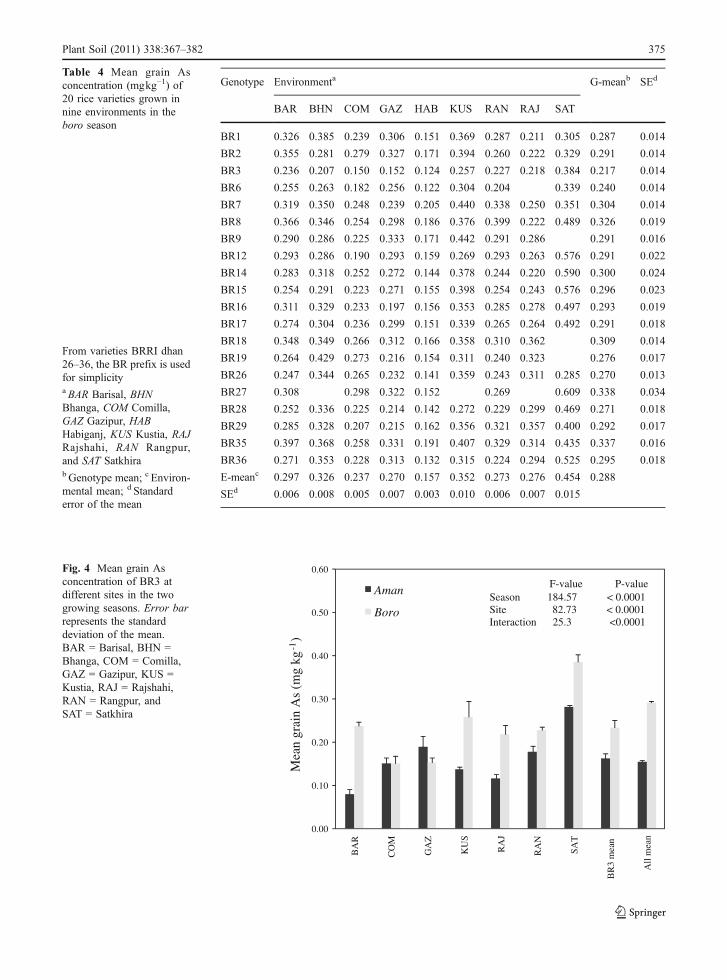
BRRI dhan 34, 37 and 38) and five of the indicavarieties (BR 4, 22, 23 and BRRI dhan 40 and 41)had the lowest grain-As concentrations, while the fourindica varieties with low photosensitivity (BR 25 andBRRI dhan 31, 32 and 39) and the admixed varietyBRRI dhan 33 with moderate photosensitivity had thehighest grain As concentrations. The mean grain Asconcentration in the boro season varieties ranged from0.22 mgkg−1 for BR 3 to 0.34 mgkg−1 for BRRIdhan 35 (Table 4), and the overall mean (0.29 mgkg−1) was 87% higher (F-value=503, p<0.0001;Online Resource Table 3) than that (0.15 mgkg−1) inthe aman season. Grain As concentration in BR 3,the one genotype that was grown in both seasons,was also significantly higher (F-valueseason=185,p<0.001) in the boro-season than in the aman-season (Fig. 4).
Effect of genotype (G), environment (E), and GEinteraction on grain As concentration
Analysis of variance showed that the As concentra-tion in rice grain was significantly affected by E, G
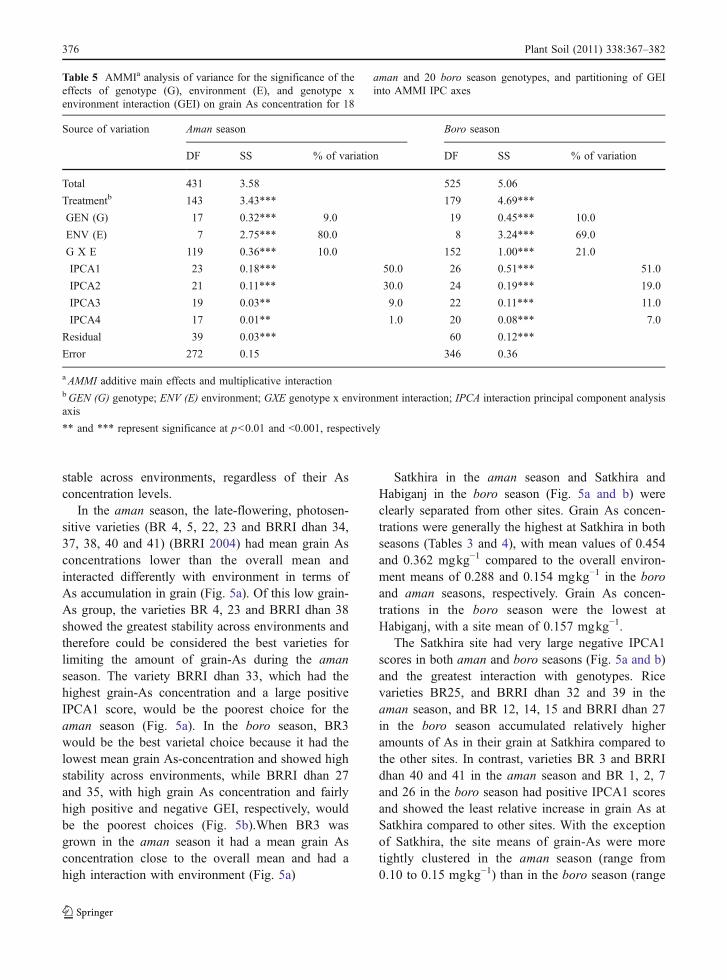
and GEI (Table 5). Environment explained 80 and69% of the variation in grain-As concentration inaman and boro seasons, respectively. In contrast, Gexplained only 9 and 10%, and GEI 10% and 21% ofthe variability in grain-As concentration in the twoseasons. Proportioning of GEI using the AMMImodel showed that the first four interaction principalcomponent analysis axes (IPCA) were highly signif-icant (p<0.001) in both seasons, with the first twoIPCA capturing the major portion (70%–80%) of thevariation (Table 5).
The AMMI biplots of IPCA1 versus mean grain Asconcentration for genotype or environment facilitateinterpretation of the effects of E, G and GEI (Fig. 5aand b). In the bi-plot, genotypes or environments withsimilar IPCA1 scores have similar GxE interactionpatterns. Rice genotypes with IPCA scores >0 haveincreased and decreased grain-As concentrations inenvironments that have IPCA1 scores >0 and <0,respectively. The reverse applies for genotypes withIPCA1 scores <0. Genotypes with IPCA1 scores closeto zero have the least variation in grain As concen-tration across environments, i.e. they are the most
Genotype Environmenta G-meanb SEd
BAR COM GAZ KUS RAJ RAN SON SAT
BR3 0.078 0.150 0.189 0.137 0.115 0.176 0.126 0.281 0.156 0.012
BR4 0.068 0.119 0.136 0.106 0.101 0.153 0.091 0.344 0.140 0.017
BR5 0.091 0.080 0.121 0.111 0.097 0.096 0.128 0.403 0.141 0.021
BR10 0.095 0.136 0.179 0.094 0.097 0.160 0.174 0.380 0.164 0.019
BR11 0.086 0.150 0.190 0.128 0.095 0.170 0.120 0.375 0.164 0.018
BR22 0.105 0.099 0.090 0.118 0.084 0.100 0.123 0.383 0.138 0.020
BR23 0.068 0.057 0.110 0.088 0.053 0.063 0.088 0.281 0.101 0.015
BR25 0.130 0.134 0.169 0.116 0.091 0.199 0.171 0.481 0.186 0.025
BR30 0.126 0.149 0.153 0.092 0.092 0.154 0.101 0.335 0.150 0.016
BR31 0.129 0.139 0.166 0.128 0.109 0.179 0.141 0.359 0.169 0.016
BR32 0.140 0.141 0.141 0.111 0.115 0.157 0.148 0.487 0.180 0.025
BR33 0.215 0.205 0.251 0.175 0.138 0.232 0.127 0.380 0.215 0.016
BR34 0.110 0.083 0.115 0.110 0.106 0.106 0.142 0.392 0.146 0.020
BR37 0.117 0.081 0.102 0.096 0.186 0.098 0.149 0.328 0.145 0.016
BR38 0.115 0.066 0.100 0.104 0.079 0.102 0.119 0.331 0.127 0.017
BR39 0.139 0.183 0.173 0.142 0.105 0.174 0.148 0.461 0.191 0.022
BR40 0.109 0.118 0.133 0.114 0.103 0.138 0.108 0.279 0.138 0.012
BR41 0.124 0.092 0.084 0.101 0.107 0.079 0.110 0.239 0.117 0.011
E-meanc 0.114 0.121 0.144 0.115 0.104 0.141 0.129 0.362 0.154
SEd 0.006 0.006 0.007 0.003 0.004 0.006 0.009 0.004
Table 3 Mean grain Asconcentration (mgkg−1) of18 rice varieties grown in8 environments in the amanseason
From varieties BRRI dhan25 to 41, the BR prefix isused for simplicityaBAR Barisal, COMComilla, GAZ Gazipur, KUSKustia, RAJ Rajshahi, RANRangpur, SON Sonagazi andSAT Satkhirab Genotype mean; c Environ-mental mean; d Standarderror of the mean
374 Plant Soil (2011) 338:367–382
Genotype Environmenta G-meanb SEd
BAR BHN COM GAZ HAB KUS RAN RAJ SAT
BR1 0.326 0.385 0.239 0.306 0.151 0.369 0.287 0.211 0.305 0.287 0.014
BR2 0.355 0.281 0.279 0.327 0.171 0.394 0.260 0.222 0.329 0.291 0.014
BR3 0.236 0.207 0.150 0.152 0.124 0.257 0.227 0.218 0.384 0.217 0.014
BR6 0.255 0.263 0.182 0.256 0.122 0.304 0.204 0.339 0.240 0.014
BR7 0.319 0.350 0.248 0.239 0.205 0.440 0.338 0.250 0.351 0.304 0.014
BR8 0.366 0.346 0.254 0.298 0.186 0.376 0.399 0.222 0.489 0.326 0.019
BR9 0.290 0.286 0.225 0.333 0.171 0.442 0.291 0.286 0.291 0.016
BR12 0.293 0.286 0.190 0.293 0.159 0.269 0.293 0.263 0.576 0.291 0.022
BR14 0.283 0.318 0.252 0.272 0.144 0.378 0.244 0.220 0.590 0.300 0.024
BR15 0.254 0.291 0.223 0.271 0.155 0.398 0.254 0.243 0.576 0.296 0.023
BR16 0.311 0.329 0.233 0.197 0.156 0.353 0.285 0.278 0.497 0.293 0.019
BR17 0.274 0.304 0.236 0.299 0.151 0.339 0.265 0.264 0.492 0.291 0.018
BR18 0.348 0.349 0.266 0.312 0.166 0.358 0.310 0.362 0.309 0.014
BR19 0.264 0.429 0.273 0.216 0.154 0.311 0.240 0.323 0.276 0.017
BR26 0.247 0.344 0.265 0.232 0.141 0.359 0.243 0.311 0.285 0.270 0.013
BR27 0.308 0.298 0.322 0.152 0.269 0.609 0.338 0.034
BR28 0.252 0.336 0.225 0.214 0.142 0.272 0.229 0.299 0.469 0.271 0.018
BR29 0.285 0.328 0.207 0.215 0.162 0.356 0.321 0.357 0.400 0.292 0.017
BR35 0.397 0.368 0.258 0.331 0.191 0.407 0.329 0.314 0.435 0.337 0.016
BR36 0.271 0.353 0.228 0.313 0.132 0.315 0.224 0.294 0.525 0.295 0.018
E-meanc 0.297 0.326 0.237 0.270 0.157 0.352 0.273 0.276 0.454 0.288
SEd 0.006 0.008 0.005 0.007 0.003 0.010 0.006 0.007 0.015
Table 4 Mean grain Asconcentration (mgkg−1) of20 rice varieties grown innine environments in theboro season
From varieties BRRI dhan26–36, the BR prefix is usedfor simplicityaBAR Barisal, BHNBhanga, COM Comilla,GAZ Gazipur, HABHabiganj, KUS Kustia, RAJRajshahi, RAN Rangpur,and SAT Satkhirab Genotype mean; c Environ-mental mean; d Standarderror of the mean
0.00
0.10
0.20
0.30
0.40
0.50
0.60
BA
R
CO
M
GA
Z
KU
S
RA
J
RA
N
SAT
BR
3 m
ean
All
mea
n
Mea
n gr
ain
As
(mg
kg-1
)
Aman
Boro
F-value P-valueSeason 184.57 < 0.0001Site 82.73 < 0.0001Interaction 25.3 <0.0001
Fig. 4 Mean grain Asconcentration of BR3 atdifferent sites in the twogrowing seasons. Error barrepresents the standarddeviation of the mean.BAR = Barisal, BHN =Bhanga, COM = Comilla,GAZ = Gazipur, KUS =Kustia, RAJ = Rajshahi,RAN = Rangpur, andSAT = Satkhira
Plant Soil (2011) 338:367–382 375
stable across environments, regardless of their Asconcentration levels.
In the aman season, the late-flowering, photosen-sitive varieties (BR 4, 5, 22, 23 and BRRI dhan 34,37, 38, 40 and 41) (BRRI 2004) had mean grain Asconcentrations lower than the overall mean andinteracted differently with environment in terms ofAs accumulation in grain (Fig. 5a). Of this low grain-As group, the varieties BR 4, 23 and BRRI dhan 38showed the greatest stability across environments andtherefore could be considered the best varieties forlimiting the amount of grain-As during the amanseason. The variety BRRI dhan 33, which had thehighest grain-As concentration and a large positiveIPCA1 score, would be the poorest choice for theaman season (Fig. 5a). In the boro season, BR3would be the best varietal choice because it had thelowest mean grain As-concentration and showed highstability across environments, while BRRI dhan 27and 35, with high grain As concentration and fairlyhigh positive and negative GEI, respectively, wouldbe the poorest choices (Fig. 5b).When BR3 wasgrown in the aman season it had a mean grain Asconcentration close to the overall mean and had ahigh interaction with environment (Fig. 5a)
Satkhira in the aman season and Satkhira andHabiganj in the boro season (Fig. 5a and b) wereclearly separated from other sites. Grain As concen-trations were generally the highest at Satkhira in bothseasons (Tables 3 and 4), with mean values of 0.454and 0.362 mgkg−1 compared to the overall environ-ment means of 0.288 and 0.154 mgkg−1 in the boroand aman seasons, respectively. Grain As concen-trations in the boro season were the lowest atHabiganj, with a site mean of 0.157 mgkg−1.
The Satkhira site had very large negative IPCA1scores in both aman and boro seasons (Fig. 5a and b)and the greatest interaction with genotypes. Ricevarieties BR25, and BRRI dhan 32 and 39 in theaman season, and BR 12, 14, 15 and BRRI dhan 27in the boro season accumulated relatively higheramounts of As in their grain at Satkhira compared tothe other sites. In contrast, varieties BR 3 and BRRIdhan 40 and 41 in the aman season and BR 1, 2, 7and 26 in the boro season had positive IPCA1 scoresand showed the least relative increase in grain As atSatkhira compared to other sites. With the exceptionof Satkhira, the site means of grain-As were moretightly clustered in the aman season (range from0.10 to 0.15 mgkg−1) than in the boro season (range
Table 5 AMMIa analysis of variance for the significance of the effects of genotype (G), environment (E), and genotype xenvironment interaction (GEI) on grain As concentration for 18 aman and 20 boro season genotypes, and partitioning of GEI intoAMMI IPC axes
Source of variation Aman season Boro season
DF SS % of variation DF SS % of variation
Total 431 3.58 525 5.06
Treatmentb 143 3.43*** 179 4.69***
GEN (G) 17 0.32*** 9.0 19 0.45*** 10.0
ENV (E) 7 2.75*** 80.0 8 3.24*** 69.0
G X E 119 0.36*** 10.0 152 1.00*** 21.0
IPCA1 23 0.18*** 50.0 26 0.51*** 51.0
IPCA2 21 0.11*** 30.0 24 0.19*** 19.0
IPCA3 19 0.03** 9.0 22 0.11*** 11.0
IPCA4 17 0.01** 1.0 20 0.08*** 7.0
Residual 39 0.03*** 60 0.12***
Error 272 0.15 346 0.36
aAMMI additive main effects and multiplicative interactionbGEN (G) genotype; ENV (E) environment; GXE genotype x environment interaction; IPCA interaction principal component analysisaxis
** and *** represent significance at p<0.01 and <0.001, respectively
Table 5 AMMIa analysis of variance for the significance of theeffects of genotype (G), environment (E), and genotype xenvironment interaction (GEI) on grain As concentration for 18
aman and 20 boro season genotypes, and partitioning of GEIinto AMMI IPC axes
376 Plant Soil (2011) 338:367–382
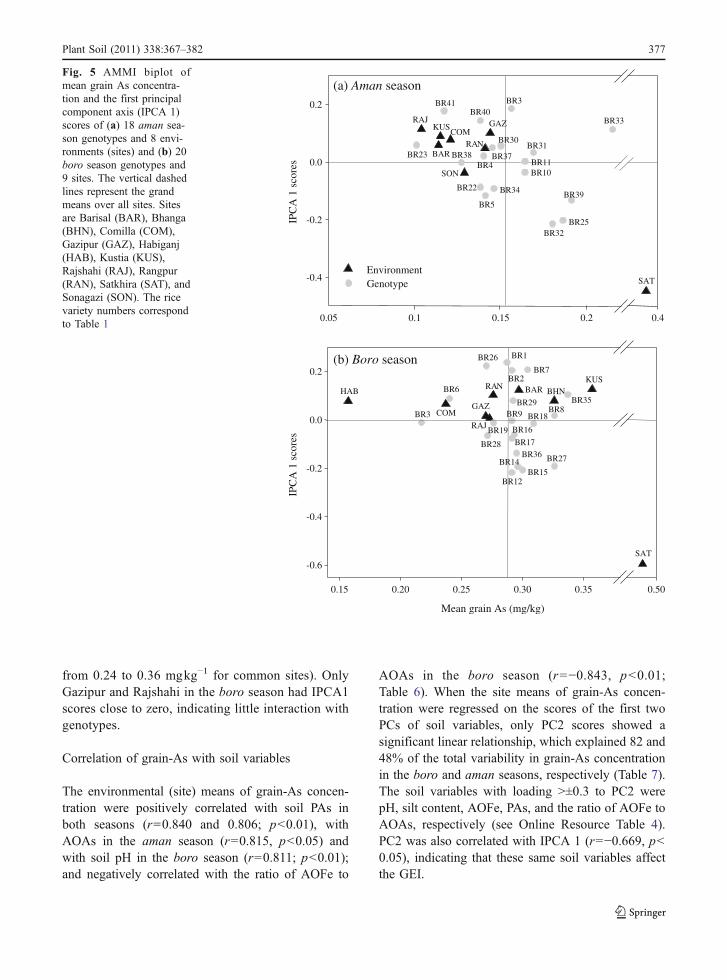
from 0.24 to 0.36 mgkg−1 for common sites). OnlyGazipur and Rajshahi in the boro season had IPCA1scores close to zero, indicating little interaction withgenotypes.
Correlation of grain-As with soil variables
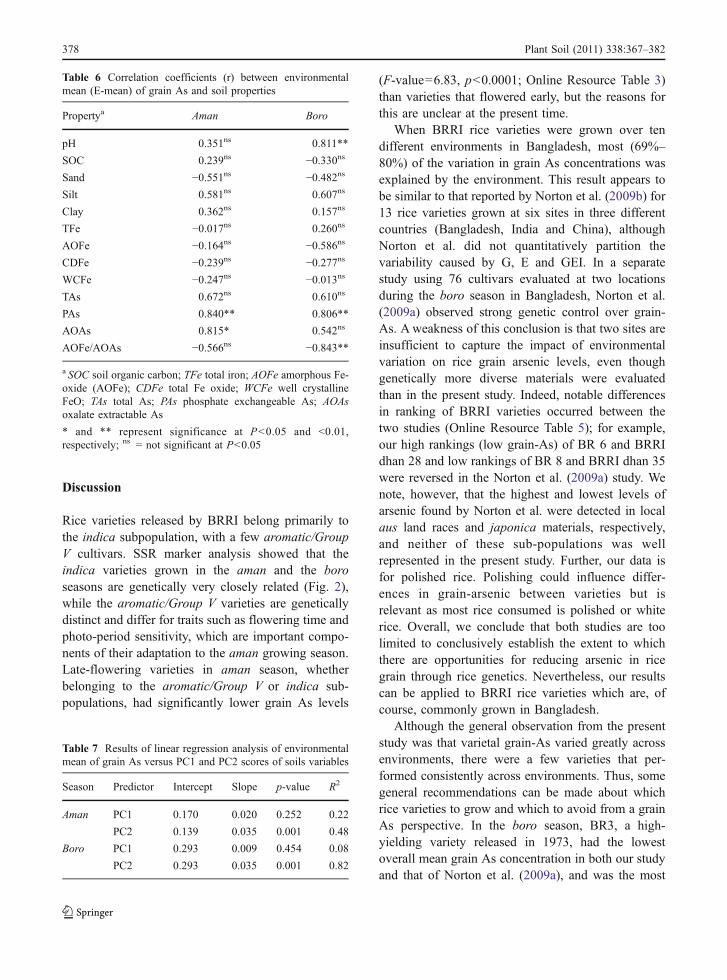
The environmental (site) means of grain-As concen-tration were positively correlated with soil PAs inboth seasons (r=0.840 and 0.806; p<0.01), withAOAs in the aman season (r=0.815, p<0.05) andwith soil pH in the boro season (r=0.811; p<0.01);and negatively correlated with the ratio of AOFe to
AOAs in the boro season (r=−0.843, p<0.01;Table 6). When the site means of grain-As concen-tration were regressed on the scores of the first twoPCs of soil variables, only PC2 scores showed asignificant linear relationship, which explained 82 and48% of the total variability in grain-As concentrationin the boro and aman seasons, respectively (Table 7).The soil variables with loading >±0.3 to PC2 werepH, silt content, AOFe, PAs, and the ratio of AOFe toAOAs, respectively (see Online Resource Table 4).PC2 was also correlated with IPCA 1 (r=−0.669, p<0.05), indicating that these same soil variables affectthe GEI.
IPC
A 1
sco
res
EnvironmentGenotype
0.1 0.2 0.4
-0.4
-0.2
0.0
0.2
BAR
COMGAZKUS
RAJ
RAN
SAT
SON
BR3
BR4
BR5
BR10BR11
BR22
BR23
BR25
BR30BR31
BR32
BR33
BR34
BR37BR38
BR39
BR40BR41
(a) Aman season
0.150.05
0.15 0.20 0.25 0.30 0.35 0.50
-0.6
-0.4
-0.2
0.0
0.2
BAR BHN
COMGAZ
HABKUS
RAJ
RAN
SAT
BR1
BR2
BR3
BR6
BR7
BR8BR9
BR12
BR14BR15
BR16
BR17
BR18
BR19
BR26
BR27
BR28
BR29 BR35
BR36
IPC
A 1
sco
res
Mean grain As (mg/kg)
(b) Boro season
Fig. 5 AMMI biplot ofmean grain As concentra-tion and the first principalcomponent axis (IPCA 1)scores of (a) 18 aman sea-son genotypes and 8 envi-ronments (sites) and (b) 20boro season genotypes and9 sites. The vertical dashedlines represent the grandmeans over all sites. Sitesare Barisal (BAR), Bhanga(BHN), Comilla (COM),Gazipur (GAZ), Habiganj(HAB), Kustia (KUS),Rajshahi (RAJ), Rangpur(RAN), Satkhira (SAT), andSonagazi (SON). The ricevariety numbers correspondto Table 1
Plant Soil (2011) 338:367–382 377
Discussion
Rice varieties released by BRRI belong primarily tothe indica subpopulation, with a few aromatic/GroupV cultivars. SSR marker analysis showed that theindica varieties grown in the aman and the boroseasons are genetically very closely related (Fig. 2),while the aromatic/Group V varieties are geneticallydistinct and differ for traits such as flowering time andphoto-period sensitivity, which are important compo-nents of their adaptation to the aman growing season.Late-flowering varieties in aman season, whetherbelonging to the aromatic/Group V or indica sub-populations, had significantly lower grain As levels
(F-value=6.83, p<0.0001; Online Resource Table 3)than varieties that flowered early, but the reasons forthis are unclear at the present time.
When BRRI rice varieties were grown over tendifferent environments in Bangladesh, most (69%–80%) of the variation in grain As concentrations wasexplained by the environment. This result appears tobe similar to that reported by Norton et al. (2009b) for13 rice varieties grown at six sites in three differentcountries (Bangladesh, India and China), althoughNorton et al. did not quantitatively partition thevariability caused by G, E and GEI. In a separatestudy using 76 cultivars evaluated at two locationsduring the boro season in Bangladesh, Norton et al.(2009a) observed strong genetic control over grain-As. Aweakness of this conclusion is that two sites areinsufficient to capture the impact of environmentalvariation on rice grain arsenic levels, even thoughgenetically more diverse materials were evaluatedthan in the present study. Indeed, notable differencesin ranking of BRRI varieties occurred between thetwo studies (Online Resource Table 5); for example,our high rankings (low grain-As) of BR 6 and BRRIdhan 28 and low rankings of BR 8 and BRRI dhan 35were reversed in the Norton et al. (2009a) study. Wenote, however, that the highest and lowest levels ofarsenic found by Norton et al. were detected in localaus land races and japonica materials, respectively,and neither of these sub-populations was wellrepresented in the present study. Further, our data isfor polished rice. Polishing could influence differ-ences in grain-arsenic between varieties but isrelevant as most rice consumed is polished or whiterice. Overall, we conclude that both studies are toolimited to conclusively establish the extent to whichthere are opportunities for reducing arsenic in ricegrain through rice genetics. Nevertheless, our resultscan be applied to BRRI rice varieties which are, ofcourse, commonly grown in Bangladesh.
Although the general observation from the presentstudy was that varietal grain-As varied greatly acrossenvironments, there were a few varieties that per-formed consistently across environments. Thus, somegeneral recommendations can be made about whichrice varieties to grow and which to avoid from a grainAs perspective. In the boro season, BR3, a high-yielding variety released in 1973, had the lowestoverall mean grain As concentration in both our studyand that of Norton et al. (2009a), and was the most
Table 6 Correlation coefficients (r) between environmentalmean (E-mean) of grain As and soil properties
Propertya Aman Boro
pH 0.351ns 0.811**
SOC 0.239ns −0.330ns
Sand −0.551ns −0.482ns
Silt 0.581ns 0.607ns
Clay 0.362ns 0.157ns
TFe −0.017ns 0.260ns
AOFe −0.164ns −0.586ns
CDFe −0.239ns −0.277ns
WCFe −0.247ns −0.013ns
TAs 0.672ns 0.610ns
PAs 0.840** 0.806**
AOAs 0.815* 0.542ns
AOFe/AOAs −0.566ns −0.843**
a SOC soil organic carbon; TFe total iron; AOFe amorphous Fe-oxide (AOFe); CDFe total Fe oxide; WCFe well crystallineFeO; TAs total As; PAs phosphate exchangeable As; AOAsoxalate extractable As
* and ** represent significance at P<0.05 and <0.01,respectively; ns = not significant at P<0.05
Table 7 Results of linear regression analysis of environmentalmean of grain As versus PC1 and PC2 scores of soils variables
Season Predictor Intercept Slope p-value R2
Aman PC1 0.170 0.020 0.252 0.22
PC2 0.139 0.035 0.001 0.48
Boro PC1 0.293 0.009 0.454 0.08
PC2 0.293 0.035 0.001 0.82
378 Plant Soil (2011) 338:367–382
stable across environments. This variety can berecommended as a low grain arsenic variety for theboro season. BR3 was formerly a popular variety,being cultivated on 19% of the boro production areain 1990 (Hossain et al. 2006). However, its use hasdeclined substantially since the release of BRRI dahn28 and 29 in 1994, both of which have high yield,good grain quality and shorter maturity. In 2000,BRRI dahn 28 and 29 occupied 11 and 9%,respectively, of the boro area (Hossain et al. 2006),and their extent has likely increased since then.Changing from BRRI dahn 28 and 29 to BR3 wouldreduce grain arsenic by an average of 21%–26%.Unfortunately, other studies have shown that both BR3 and BRRI dhan 29 are susceptible to As toxicity,while BRRI dhan 28 is less vulnerable (Ahmed 2009;Biswas 2009). The variety BRRI dhan 47, which hadrelatively low grain As concentrations in the study byNorton et al. (2009a) and in a pot study with soilsfrom a farmer’s field that varied in arsenic levels(Biswas 2009), may also prove to be a good choicefor farmers, as it is tolerant of high soil As (Panaullahand Duxbury, personal communication).
The most popular BRRI variety in the aman seasonis BR11, which has the highest yield potential(6.5 Mgha−1; Online Resource Table 1) of all of theBRRI aman season varieties. This variety wasreleased in 1980 and occupied 42% of the rice areain 2000. In our study, it had an average grain Asconcentration of 0.164 mgkg−1 and a mean siteweighted ranking of 12th out of the 18 varietiesgrown. The variety BR 23, had the lowest grain Asconcentration at 0.101 mgkg−1, and is a stronglyphoto-period sensitive variety with salinity tolerancethat is also recommended for late planting (typicallycaused by flooding). It is, however, somewhatvulnerable to As toxicity (Panaullah and Duxbury,personal communication). BRRI dhan 41, also a salttolerant variety, had the second lowest mean grain As,0.117 mgkg−1, and the highest mean grain yield(4.1 Mgha−1) in the study year, so it would be a goodchoice for the aman season, provided that it is notoverly vulnerable to As toxicity. Unfortunately, all ofthe high-yielding, short duration rice varieties whichwere bred to promote crop intensification (BRRI dhan32, 33 and 39) had relatively high mean grain Asconcentrations (0.17–0.22 mgkg−1).
Making varietal recommendations is complicatedby farmers preferences for agronomic performance
and grain yield potential, and by consumer prefer-ences for rice grain quality characteristics. For thesereasons, not all BRRI varieties are widely grown inBangladesh, and varieties demonstrated to accumulatelow levels of grain-As may not be popular orcommercially viable. For varieties which performeddifferently across environments, extensive evaluationacross years and environments would be needed toguide choices for specific locations. Moreover, giventhe narrow genetic base of current BRRI varieties, aplant breeding program to reduce rice grain As shouldexplore a wider gene pool than has currently beenexploited in the BRRI breeding program.
Mechanistic explanations for G, E and GEI effectson As concentration in rice grain would greatly aiddevelopment of sound strategies for reducing humanexposure to As. The dominance of environment orsite in controlling grain As concentration in BRRIvarieties suggests that As levels and speciation in soilsolution coupled with soil solution chemistry areimportant factors controlling As uptake by roots andultimately levels in rice grain. Poorly crystalline Feoxide (AOFe) concentration, total As and plantavailable P were soil variables contributing to amultiple regression prediction of As concentrationsin rice grain and straw (Bogdan and Schenk 2009).We also found that measures of AOFe and soil Aswere correlated with the environmental mean of grainAs concentration (Table 6), although in our casesignificant relationships were found with phosphateextractable As (both seasons), AOAs (aman season)and the ratio of AOFe/AOAs (the ratio of poorlycrystalline Fe oxide to As associated with thisfraction) in the boro season. Soil pH, which has astrong effect on adsorption of arsenate but only asmall effect on adsorption of arsenite on Fe oxides(Dixit and Hering 2003), was also correlated withgrain As in the boro season. A possible explanationfor the relevance of the AOFe/AOAs ratio is thatincomplete reduction of amorphous Fe oxides (vanBodegom et al. 2003) would leave residual adsorptioncapacity for inorganic As species and phosphate. Thecapacity for readsorption of solubilized As couldreasonably be expected to increase with increasinglevels of AOFe and a widening ratio of AOFe/AOAs.
The extent of formation of Fe-oxide precipitates onrice roots and in rhizosphere soil may also be animportant factor as this leads to adsorption of As fromsoil solution (Hossain et al. 2009; Liu et al. 2004,
Plant Soil (2011) 338:367–382 379
2006) and reduces As uptake by rice (Mei et al. 2009;Ultra et al. 2009). Because rice varieties differ in theirrelease of oxygen to the rhizosphere (Mei et al. 2009),there could be a genetic interaction with Fe availabil-ity across sites that contributes to GEI. Arsenate,rather than arsenite, is the main species adsorbed onFe-oxide root precipitates (Liu et al. 2006), which is apositive factor as arsenate adsorption will be greaterthan that of arsenite in the acidic pH environment ofthe rice rhizosphere (Begg et al. 1994; Dixit andHering 2003).
Several soil chemical factors that could affect Asuptake by rice, especially phosphate and silicate,were not measured in the present study. Phosphatecompetes with arsenate (Meharg and Macnair 1992)and silicate competes with arsenite (Ma et al. 2008)for uptake by roots. Phosphate also competes withinorganic As species for adsorption sites (Wauchopeand McDowell 1984) and its effects on As uptakecan be either positive or negative, presumablydepending on the levels and species of each in soilsolution. Concentrations of As in rice were found todecrease with increasing soil solution Si concentra-tion (Bogdan and Schenk 2008) and silicon fertil-ization (Li et al. 2009) in studies where soil Siavailability appeared to be low. Temporal variabilityin inorganic As speciation in rice fields has beenobserved over the growing season with arsenatebeing the main form initially but with arsenitedominating as soils are reduced (Panaullah et al.2009; van Geen et al. 2006), so the importance ofcompetition with phosphate and silicate will also betemporally dynamic. Rice plants show genetic differ-ences in Si uptake depending on the expression levels ofthe Lsi1 and Lsi2 transporter genes (Ma et al. 2007),which could also lead to genetic differences in Asuptake. Understanding how these genes are expressedunder different environmental conditions could also beimportant to limiting the uptake of As by rice.
As in previous studies (Duxbury et al. 2003;Williams et al. 2005), we found that grain As washigher in the boro than the aman season; in our casethe overall mean was almost twice as high (0.288versus 0.154 mgkg−1). This same pattern was foundwith BR 3, the only variety grown in both seasons(Fig. 4). It has been suggested that the seasonaldifferences in grain As concentration could be causedby irrigation of boro rice with As contaminatedgroundwater (Duxbury et al. 2003; Williams et al.
2006), however this explanation does not fullyexplain the differences observed in the present studybecause irrigation water contained negligible levels ofAs at five of the seven sites where this was measured(Table 2). Inputs of As through irrigation water mayhave contributed directly, or indirectly through buildup of As in soil, to high grain As at the Satkhira andBhanga sites where irrigation water contained 120and 234 μg As L−1, respectively. Lower levels ofgrain-As in varieties grown during the aman seasoncould also be due to a dilution of soil solution-As byAs-free rainwater. Interestingly, BR3 which had thelowest mean grain-As concentration and the greateststability across environments in the boro season, hada mean grain-As concentration close to the overallmean and was highly variable across sites in the amanseason. This result suggests that (i) there are impor-tant genetic differences between BR3 and amanseason varieties that have lower grain-As than BR3,and (ii) interactions between genetics and non-soilenvironmental factors, such as temperature and light,affect As uptake and/or utilization by rice.
The myriad of soil chemical and genetic factorsthat could contribute to As solubility in soils, itsuptake by rice roots and translocation within ricemake understanding of GEI difficult. Greater knowl-edge of soil solution chemistry under field conditionsmay provide clues to GEI questions that remainunanswered. Breeding programs for the developmentof varieties with low plant As uptake need to becoupled with tolerance to As toxicity and willprobably have limited success unless soil conditionsare favorable for expression of genetic potentials.Growing rice in a more oxic environment, e.g.,growing on raised beds instead of the traditionalpractice of growing on flat flooded fields, offers anopportunity to reduce both As toxicity and Asconcentrations in grain and straw (Duxbury andPanaullah 2007), and is consistent with a growingglobal need to reduce the amount of water used in ricecultivation. This approach does, however, requireconsiderable change in the mindset of both farmersand scientists towards rice production practices.
Acknowledgements Support from BRRI, including KhandakerAminul Kabir for help with sample collection and processing andfunding from US-AID Bangladesh are sincerely appreciated. Dr.Michael A Rutzke USDA-Federal Nutrition Laboratory, Ithaca,NY is acknowledged for his assistance with As analysis by ICP-MS.
380 Plant Soil (2011) 338:367–382
References
Ahmed ZU (2009) Arsenic contamination in groundwater andsoils: spatial variability and its effect on arsenic uptake,speciation, growth and yield of rice. PhD Dissertation,Cornell University, USA
Baffes J, Gautam M (1996) Is growth in Bangladesh’s riceproduction sustainable? Policy Research Working PaperNo. 1666, World Bank, Washington DC
BBS (2004) Statistical Yearbook of Bangladesh, pp 144 and691
Begg CBM, Kirk GJD, Mackenzie AF, Neue HU (1994) Root-induced iron oxidation and pH changes in the lowland ricerhizosphere. New Phytol 128:469–477
BGS/DPHE (2000) Executive summary of the main report ofPhase I, Groundwater Studies of Arsenic Contamination inBangladesh, British Geological Survey andMott MacDonald(UK) for the Government of Bangladesh, Ministry of LocalGovernment, Rural Development and Cooperatives, Depart-ment of Public Health Engineering, and Department forInternational Development (UK)
Biswas MHR (2009) Response of rice varieties and vegetablescrops to different level of soil arsenic. PhD Dissertation,Bangabandhu Sheikh Mujibur Rahman AgriculturalUniversity, Bangladesh
Bogdan K, Schenk MK (2008) Arsenic in rice (Oryza sativa L.)related to dynamics of arsenic and silicic acid in paddysoils. Environ Sci Technol 42:7885–7890
Bogdan K, Schenk MK (2009) Evaluation of soil characteristicspotentially affecting arsenic concentration in paddy rice(Oryza sativa L.). Environ Pollut 157:2617–2621
Brammer H (2009) Mitigation of arsenic contamination inirrigated paddy soils in South and South-east Asia.Environ Int 35:856–863
BRRI (2004) Adhunik Dhanar Chus (in Bengali), BangladeshRice Research Institute Plant Breeding Division. Gazipur1701. Bangladesh
Cavalli-Sforza LL, Edwards AWF (1967) Phylogenetic analysis:models and estimation procedures. Evolution 21:550–570
Crossa J, Gauch HG, Zobel R (1990) Additive main effects andmultiplicative interaction analysis of two Internationalmaize cultivar trials. Crop Sci 30:493–500
Daum D, Bogdan K, Schenk MK, Merkel D (2001) Influence ofthe field water management on accumulation of arsenic andcadmium in paddy rice. Dev Plant Soil Sci 92:290–291
Dixit S, Hering JG (2003) Comparison of arsenic (V) and arsenic(III) sorption onto iron oxide minerals: implications forarsenic mobility. Environ Sci Technol 37:4182–4189
Duxbury JM, Panaullah GM (2007) Remediation of arsenic foragriculture sustainability, food security and health inBangladesh. FAO Water working paper, Food and Agri-culture Organization of the United Nations (FAO). Rome,Italy
Duxbury JM, Mayer AB, Lauren JG, Hassan N (2003) Foodchain aspects of arsenic contamination in Bangladesh:effects on quality and productivity of rice. J Environ SciHealth A Tox/Hazard Subst Environ Eng 38:61–69
Falush D, Stephens M, Pritchard JK (2003) Inference ofpopulation structure: extensions to linked loci and corre-lated allele frequencies. Genetics 164:1567–1587
Garris AJ, Tai TH, Coburn J, Kresovich S, McCouch S (2005)Genetic structure and diversity in Oryza sativa L. Genetics169:1631–1638
Gauch HG (1992) Statistical analysis of regional yield trials:AMMI analysis of factorial designs. Elsevier, Netherlands
Gauch HG (2007) MATMODEL Version 3.0: Open sourcesoftware for AMMI and related analyses. Crop and SoilSciences, Cornell University, Ithaca, NY 14853
Hossain M, Bose ML, Mustafi BAA (2006) Adoption andproductivity impact of modern rice varieties in Bangla-desh. Dev Econ 44:149–166
Hossain MB, Jahiruddin M, Loeppert RH, Panaullah GM,Islam MR, Duxbury JM (2009) The effects of iron plaqueand phosphorus on yield and arsenic accumulation in rice.Plant Soil 317:167–176
Li RY, Stroud JL, Ma JF, McGrath SP, Zhao J (2009)Mitigation of arsenic accumulation in rice with watermanagement and silicon fertilization. Environ Sci Technol43:889–893
Liu WJ, Zhu YG, Smith FA, Smith E (2004) Do iron plaqueand genotypes affect arsenate uptake and translocation byrice seedlings (Oryza sativa L.) grown in solution culture?J Exp Bot 55:1707–1713
Liu WJ, Zhu YG, Hu Y, Williams PN, Gault A, Meharg A,Charnock JM, Smith FA (2006) Arsenic sequestration iniron plaque, its accumulation and speciation in mature riceplants (Oryza sativa L.). Environ Sci Technol 40:5730–5736
Loeppert RH, Jain A, El-Haleem MAA, Biswas BK (2002)Quantity and speciation of arsenic in soils by chemicalextraction. Biogeochemistry of environmentally importantelements. American Chemical Society, Washington DC,pp 42–56
Lu Y, Adomako EE, Solaiman ARM, Islam MR, Deacon C,Williams PN, Rahman GKMM, Meharg AA (2009)Baseline soil variation is a major factor in arsenicaccumulation in Bengal Delta paddy rice. Environ SciTechnol 43:1724–1729
Ma JF, Yamaji N, Tamai K, Mitani N (2007) Genotypicdifference in silicon uptake and expression of silicontransporter genes in rice. Plant Physiol 145:919
Ma JF, Yamaji N, Mitani N, Xu XY, Su YH, McGrath SP, ZhaoFJ (2008) Transporters of arsenite in rice and their role inarsenic accumulation in rice grain. Proc Natl Acad Sci105:9931–9935
Marin AR, Masscheleyn PH, Patrick WH (1993) Soil redox-pHstability of arsenic species and its influence on arsenicuptake by rice. Plant Soil 152:245–253
Meharg AA, Macnair MR (1992) Suppression of the highaffinity phosphate uptake system: a mechanism of arsenatetolerance in Holcus lanatus L. J Exp Bot 43:519–524
Meharg AA, Rahman MM (2003) Arsenic contamination ofBangladesh paddy field soils: implications for ricecontribution to arsenic consumption. Environ Sci Technol37:229–234
Mei XQ,Ye ZH,WongMH (2009) The relationship of root porosityand radial oxygen loss on arsenic tolerance and uptake in ricegrains and straw. Environ Pollut 157:2550–2557
Mitchell P, Barre D (1995) The nature and significance ofpublic exposure to arsenic: a review of its relevance toSouth West England. Environ Geochem Health 17:57–82
Plant Soil (2011) 338:367–382 381
MOA (2008) Government of the People’s Republic ofBangladesh. [Online] http://www.moa.gov.bd/statistics/statistics.htm
Ninno C, Dorosh PA (2001) Averting a food crisis: privateimports and public targeted distribution in Bangladeshafter the 1998 Flood. Agric Econ 25:337–346
Norton GJ, Islam MR, Deacon CM, Zhao F-J, Stroud JL,McGrath SP, Islam S, Jahiruddin M, Feldmann J, PriceAH, Meharg AA (2009a) Identification of low Inorganicand total grain arsenic rice cultivars from Bangladesh.Environ Sci Technol 43:6070–6075
Norton GJ, Duan G, Dasgupta T, Islam MR, Lei M, Zhu Y,Deacon CM, Moran AC, Islam S, Zhao F-J, Stroud JL,McGrath SP, Feldmann J, Price AH, Meharg AA (2009b)Environmental and genetic control of arsenic accumulationand speciation in rice grain: comparing a range of commoncultivars crown in contaminated sites across Bangladesh,China, and India. Environ Sci Technol 43:8381–8386
Panaullah GM, Alam T, Hossain MB, Loeppert RH, Lauren JG,Meisner CA, Ahmed ZU, Duxbury JM (2009) Arsenictoxicity to rice (Oryza sativa L.) in Bangladesh. Plant Soil317:31–39
Pritchard JK, Stephens M, Donnelly P (2000) Inference ofpopulation structure using multilocus genotype data.Genetics 155:945–959
Scheinost AC, Schwertmann U (1999) Color identification ofiron oxides and hydroxysulfates: use and limitations. SoilSci Soc Am J 63:1463–1471
Sheppard SC (1992) Summary of phytotoxic levels of soilarsenic. Water Air Soil Pollut 64:539–550
Takahashi Y, Minamikawa R, Hattori KH, Kurishima K, KihouN, Yuita K (2004) Arsenic behavior in paddy fields duringthe cycle of flooded and non-flooded periods. Environ SciTechnol 38:1038–1044
Tang T, Miller DM (1991) Growth and tissue composition ofrice grown in soil treated with inorganic copper, nickel,and arsenic. Commun Soil Sci Plant Anal 22:2037–2046
Ultra VU, Nakayama A, Tanaka S, Kang Y, Sakurai K, IwasakiK (2009) Potential for the alleviation of arsenic toxicity inpaddy rice using amorphous iron-(hydr) oxide amend-ments. Soil Sci Plant Nutr 55:160–169
USEPA (1990) Method 3052: SW-846, Test methods forevaluating solid wastes, physical/chemical methods.USEPA, Washington, DC, Office of Solid waste andEmergency Response
van Bodegom PM, van Reeven J, Denier HAC, van der Gon H(2003) Prediction of reducible soil iron content from ironextraction data. Biogeochemistry 64:231–245
van Geen A, Zheng Y, Cheng Z, He Y, Dhar RK, Garnier JM,Rose J, Seddique A, Hoque MA, Ahmed KM (2006)Impact of irrigating rice paddies with groundwatercontaining arsenic in Bangladesh. Sci Total Environ367:769–777
Wauchope RD, McDowell LL (1984) Adsorption of phosphate,arsenate, methane arsonate and cacodylate by lake andstream sediments: comparison with soils. Environ SciTechnol 13:499–504
Williams PN, Price AH, Raab A, Hossain SA, Feldmann J,Meharg AA (2005) Variation in arsenic speciation andconcentration in paddy rice related to dietary exposure.Environ Sci Technol 39:5531–5540
Williams PN, IslamMR, Adomako EE, Raab A, Hossain SA, ZhuYG, Meharg AA (2006) Increase in rice grain arsenic forregions of Bangladesh irrigating paddies with elevatedarsenic in groundwaters. Environ Sci Technol 40:4903–4908
Zavala YJ, Duxbury JM (2008) Arsenic in rice: I. Estimatingnormal levels of total arsenic in rice grain. Environ SciTechnol 42:3856–3860
382 Plant Soil (2011) 338:367–382