genome sequencing - · pdf filecenter&for&biological&sequence&analysis...
TRANSCRIPT

Center for Biological Sequence AnalysisDepartment of Systems Biology
Genome SequencingFirst, ‘next-generation’, and ‘third generation’
Dave Ussery
Workshop on Comparative GenomicsKing Mongkut's University of Technology ThonburiBangkok, Thailand
1rst Talk for Tuesday21 June, 2011
Tuesday, 21 June, 2011

Comparative Genomics Workshop, KMUTT, Bangkok, Thailand 21 June, 2011 2
Tuesday, 21 June, 2011

Comparative Genomics Workshop, KMUTT, Bangkok, Thailand 21 June, 2011 3
Tuesday, 21 June, 2011

Comparative Genomics Workshop, KMUTT, Bangkok, Thailand 21 June, 2011 4
http://www.cbs.dtu.dk/staff/dave/Thailand_CMG2011.php
Tuesday, 21 June, 2011

(i) Four reaction tubes are set up, each containing single stranded DNA sample (cloned in M13 phage) to be sequenced, all the four dNTPs, an oligonucleotide sequencing primer (radioactively labelled) and an enzyme for DNA synthesis (DNA polymerase I = sequenase). Each tube also contains a small amount (much smaller amount relative to four dNTPs) of one of the four ddNTP, bringing about termination at a specific base-adenine (A), cytosine (C), guanine (G) and thymine (T).(ii) The fragments, generated by random incorporation of ddNTP leading to termination of reaction, are then separated by electrophoresis on a high resolution polyacrylamide gel. This is done f r all the four reaction mixtures on adjoining lanes in the gel. (iii) The gel' is used for autoradiography so that the position of different bands in each lane can be visualized. (iv) The bands on autoradiogram can be used for getting the DNA sequence as shown in.
An Autiograph of a Sangers sequencing Gel
5
‘First Generation’ sequencing
Tuesday, 21 June, 2011

Comparative Genomics Workshop, KMUTT, Bangkok, Thailand 21 June, 2011
Figure 1. The Sanger sequencing reaction. Single stranded DNA is amplified in the presence of fluorescently labelled ddNTPs that serve to terminate the reaction and label all the fragments of DNA produced. The fragments of DNA are then separated via polyacrylamide gel electrophoresis and the sequence read using a laser beam and computer.
6
‘First Generation’ sequencing
Tuesday, 21 June, 2011

Comparative Genomics Workshop, KMUTT, Bangkok, Thailand 21 June, 2011
1. “First Human Genome”$3,000,000,000 + 15 years
2. Celera genome (a.k.a. J. Craig Venter)$100,000,000 + 0.75 years (9 months)
3. Jim Watson’s genome $900,000 + 0.17 years (2 months)
4. John Doe's genome $1,000 + 0.0002 years (0.1 day)
5. "next next-generation" machines
•Helicos Biosystems machine can sequence human genome in 1 hour (2009).
•Pacific Biosciences machine can sequence human genome in 4 minutes (2010).
•Omni Molecular Recognizer Application - human genome less than $1, <1 minute.7
Tuesday, 21 June, 2011
SOU
RCE:
NCB
I; G
RAPH
ICS
BY N
. SPE
NCE
R &
W. F
ERN
AN
DES
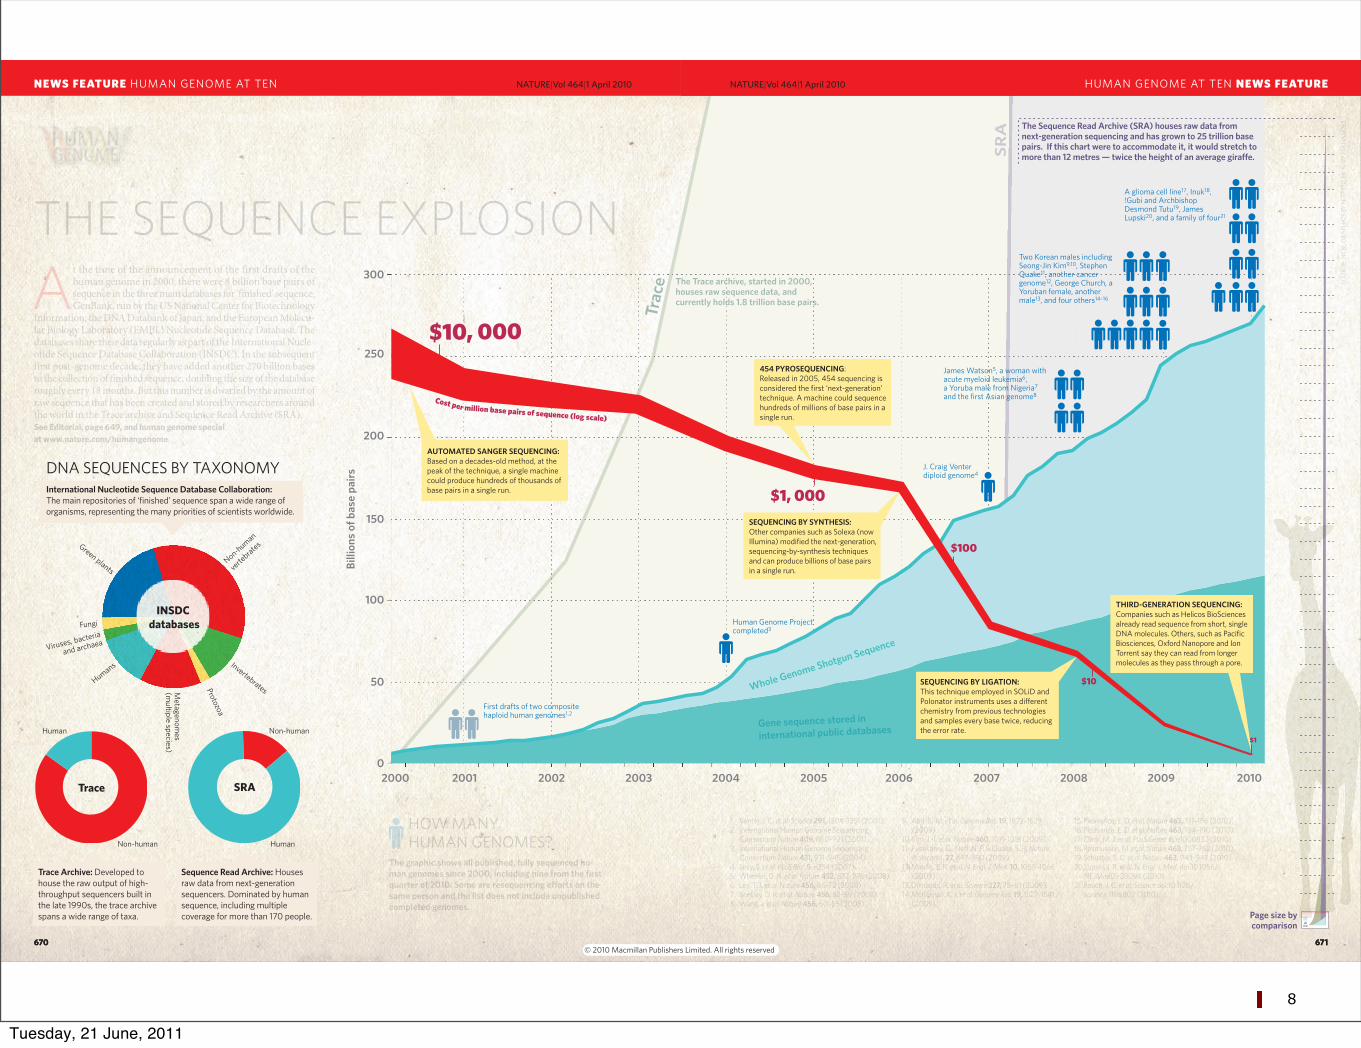
At the time of the announcement of the first drafts of the human genome in 2000, there were 8 billion base pairs of sequence in the three main databases for ‘finished’ sequence: GenBank, run by the US National Center for Biotechnology
Information; the DNA Databank of Japan; and the European Molecu-lar Biology Laboratory (EMBL) Nucleotide Sequence Database. The databases share their data regularly as part of the International Nucle-otide Sequence Database Collaboration (INSDC). In the subsequent first post-genome decade, they have added another 270 billion bases to the collection of finished sequence, doubling the size of the database roughly every 18 months. But this number is dwarfed by the amount of raw sequence that has been created and stored by researchers around the world in the Trace archive and Sequence Read Archive (SRA). See Editorial, page 649, and human genome special at www.nature.com/humangenome
1. Venter, J. C. et al. Science 291, 1304–1351 (2001). 2. International Human Genome Sequencing
Consortium Nature 409, 860–921 (2001). 3. International Human Genome Sequencing
Consortium Nature 431, 931–945 (2004).4. Levy, S. et al. PLoS Biol. 5, e254 (2007). 5. Wheeler, D. A. et al. Nature 452, 872–876 (2008).6. Ley, T. J. et al. Nature 456, 66–72 (2008). 7. Bentley, D. R. et al. Nature 456, 53–59 (2008). 8. Wang, J. et al. Nature 456, 60–65 (2008).
9. Ahn, S.-M. et al. Genome Res. 19, 1622–1629 (2009).
10. Kim, J.-I. et al. Nature 460, 1011–1015 (2009). 11. Pushkarev, D., Neff, N. F. & Quake, S. R. Nature
Biotechnol. 27, 847–850 (2009). 12. Mardis, E. R. et al. N. Engl. J. Med. 10, 1058–1066
(2009).13. Drmanac, R. et al. Science 327, 78–81 (2009).14. McKernan, K. J. et al. Genome Res. 19, 1527–1541
(2009).
15. Pleasance, E. D. et al. Nature 463, 191–196 (2010). 16. Pleasance, E. D. et al. Nature 463, 184–190 (2010). 17. Clark, M. J. et al. PLoS Genet. 6, e1000832 (2010).18. Rasmussen, M. et al. Nature 463, 757–762 (2010).19. Schuster, S. C. et al. Nature 463, 943–947 (2010). 20. Lupski, J. R. et al. N. Engl. J. Med. doi:10.1056/
NEJMoa0908094 (2010). 21. Roach, J. C. et al. Science doi:10.1126/
science.1186802 (2010).
The graphic shows all published, fully sequenced hu-man genomes since 2000, including nine from the first quarter of 2010. Some are resequencing e!orts on the same person and the list does not include unpublished completed genomes.
HOW MANY HUMAN GENOMES?
THE SEQUENCE EXPLOSION
670
Vol 464|1 April 2010
670
NATURE|Vol 464|1 April 2010
671
Vol 464|1 April 2010
671
NATURE|Vol 464|1 April 2010 HUMAN GENOME AT TEN NEWS FEATURENEWS FEATURE HUMAN GENOME AT TEN
© 20 Macmillan Publishers Limited. All rights reserved10
8
Tuesday, 21 June, 2011
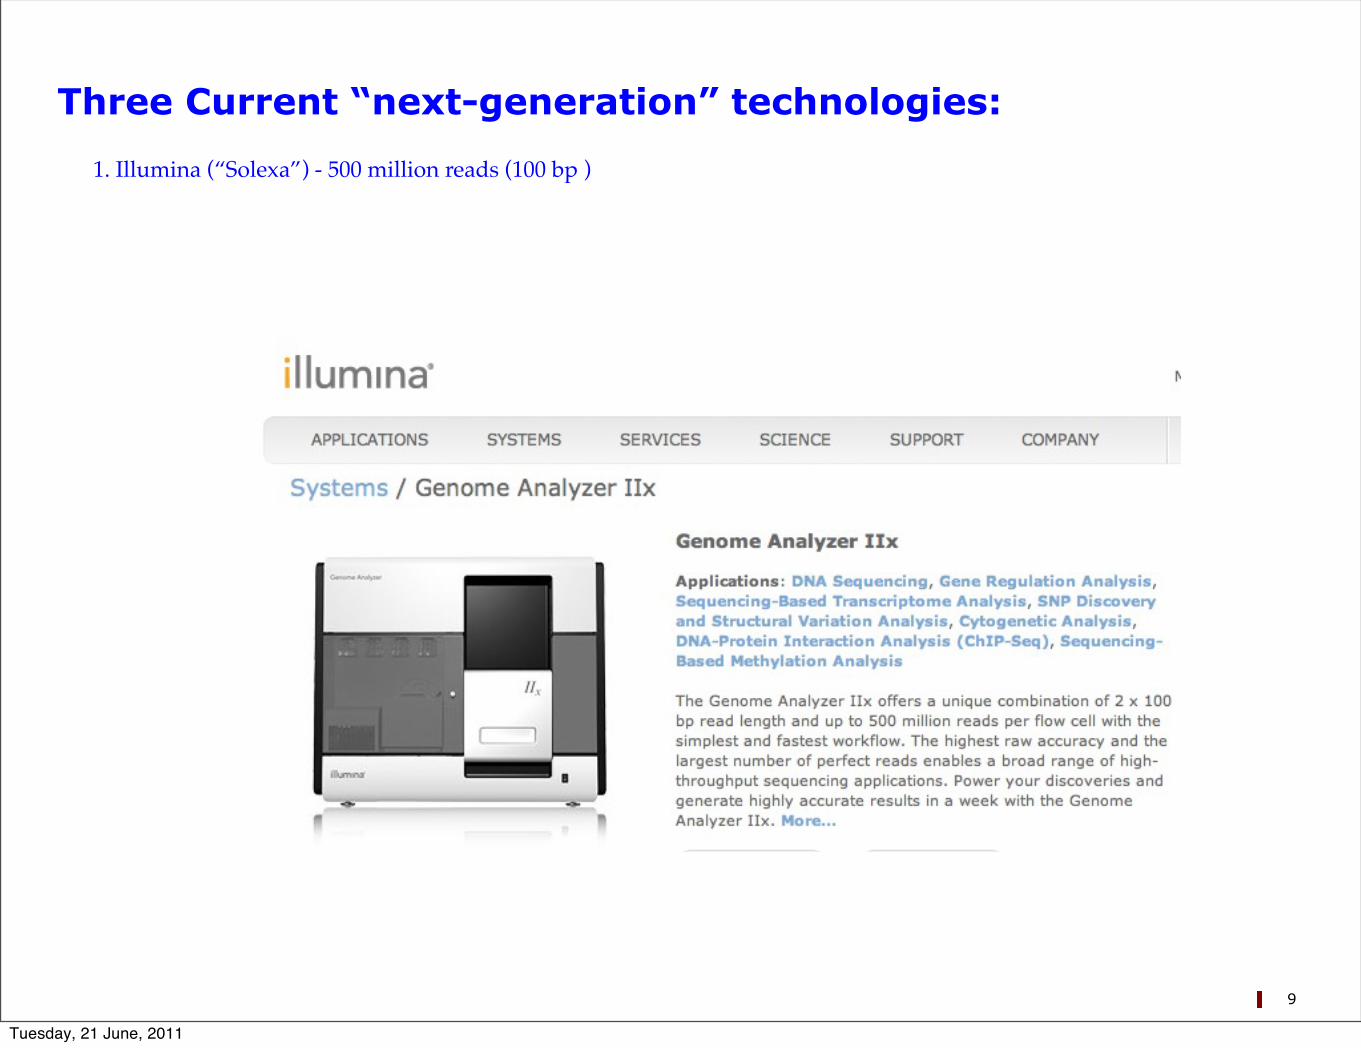
Three Current “next-generation” technologies:
1. Illumina (“Solexa”) - 500 million reads (100 bp )
9
Tuesday, 21 June, 2011

2. Roche 454
10
Three Current “next-generation” technologies:
1. Illumina (“Solexa”) - 500 million reads (100 bp )
Tuesday, 21 June, 2011

Applied Biosystems® SOLiD™ 4 System
SPECIFICATION SHEET
See the DifferenceThe SOLiD™ 4 System enables you to obtain more high-quality sequence at a lower cost per run. New optimized reagents and algorithms provide more uniform coverage across the genome and result in higher throughput and accuracy for all applications. Accelerate your time to results with automated workflows, intelligent barcoding designs, and the broadest portfolio of application-specific kits and analysis tools. With the SOLID™ 4 System, you have the throughput and accuracy to cost-effectively discover causative variation—you have the Quality Genome.
Key Benefits
Higher accuracy—detection of causative variation enabled at lower coverage and cost per sample
Scalable throughput on a single platform—80–100 GB of mappable sequence per run
Automated workflow—80% reduction in hands-on time and increased reproducibility in yield allow for significant time and labor savings
True paired-end sequencing—bidirectional sequencing facilitates detection of genetic alterations as well as splice variants and fusion transcripts with lower sample input
Robust multiplexing kits—intelligent barcode strategy enables accurate assignment without introduction of bias
Sample-to-results application support—additional application-specific kits and flexible analysis framework for optimized end-to-end application-specific workflows
Unrivaled support—over 800 dedicated service and support specialists as well as a catalog of in-depth chemistry and bioinformatics courses available
Experience Peace of Mind The SOLiD™ System’s open slide format and flexible bead densities continue to yield increases in throughput on the same platform with minor upgrades. The SOLiD™ 4 System can generate up to 100 Gb of mappable sequence or greater than 1.4 billion reads per run. Discover the peace of mind provided by the confidence that you will benefit from future technology advances without the purchase of a new system.
SOLiD™ 4S Y S T E M S E Q U E N C I N G
3. ABI SOLiD
~100 Gbp per run!
35 bp reads
11
2. Roche 454
Three Current “next-generation” technologies:
1. Illumina (“Solexa”) - 500 million reads (100 bp )
Tuesday, 21 June, 2011

Heather E. Peckham1, Stephen F. McLaughlin1, Jingwei N. Ni2, Michael D. Rhodes2, Joel A. Malek1, Kevin J. McKernan1 and Alan P. Blanchard1
1. Applied Biosystems, 500 Cummings Center, Beverly, MA 019152. Applied Biosystems, 850 Lincoln Centre Dr, Foster City, CA 94404
SOLiD™ Sequencing and 2-Base Encoding
ABSTRACTThe next generation of DNA sequencing platforms produces sequencing reads with increased depth of coverage but reduced read length and lower per-base accuracy than data from Sanger-based DNA sequencing. New approaches are needed to overcome these issues and provide accurate mutation discovery and consensus sequences. 2-Base encoding is uniquely enabled by the ligation-based sequencing protocol used in the SOLiD™system (a massively parallel sequencing technology based on ligation of oligonucleotides). Sequencing is carried out via sequential rounds of ligation with high fidelity and high read quality. In this system there are 16 dinucleotide combinations with 4 fluorescent dyes, each dye corresponding to a probe pool of 4 dinucleotides per pool. Using this dinucleotide, 4-dye encoding scheme in conjunction with a sequencing assay that samples every base, each base is effectively probed in two different reactions. The double interrogation of each base causes a SNP to result in a two-color change while a measurement error results in a single color change. In addition, only one-third of all possible two-color combinations are considered valid and result in a base change. 2-Base encoding rules (a single mismatch is a measurement error, only one-third of adjacent mismatches are valid) significantly reduce the raw error rate (30 bp reads have a 45x reduction in raw measurement errors) and this benefit increases 3/2 as the read length is increased. The reduction in raw error rate enabled by 2-base encoding translates into more accurate alignment of short reads, polymorphism discovery and consensus calling.
What is 2-Base Encoding?The SOLiD Sequencing System uses probes with dual base encoding.
Figure 1. Each probe consists of 8 bases. As shown, the first 3 bases are degenerate (n), and the last 3 are universal (z), withthe 4th and 5th bases as the two bases being interrogated. Thus,a single color observation only limits the potential dinucleotide to being four out of the 16 possible dinucleotides. As seen above, a green signal represents a AC, CA, TG or GT.
Double InterrogationUsing this dinucleotide, 4-dye encoding scheme in conjunction with a sequencing assay that samples every base, each base is effectively probed in two different reactions.
Figure 2 demonstrates the principle of double interrogation. Each color measurement represents four possible dinucleotidecombinations. For example, the first measured blue represents ‘AA’ and the third blue represents ‘CC’.
Poster Number 2624
Color SpaceIn order to use 2-base encoding the concept of color space must be used. Instead of using a nucleotide-based reference sequence, a color space reference sequence is used. As color space and base space both consist of four elements (four colors represented as 0, 1, 2, or 3 and A, C, G or T, respectively) existing algorithms can be used for alignment and consensus calling of color space. As will be demonstrated, the properties of 2-base encoding allow significantly enhanced results if 2-base encoding is taken into account and expanded algorithms used.
DecodingTo decode a sequence the decoding matrix in figure 3 is used:
Figure 3. The decoding matrix allows a sequence of dinucleotides to be converted to a base sequence, as long as one of two bases is known. The design of encoding probes has been carefully made, as can be seen by the reversed transition (e.g., A -> T and T -> A is the same color as is the complement A -> G and T -> C).
Single Base Insertions/Deletions
Figure 4. (a) If a deletion occurs in the sequence GTC the result has to be GC. The number of observed transitions will decrease from 2 to1. The single transition must be a G to C thus giving asignature to the event. (b) The reverse is true if a single base insertion occurs with the result that only 4 of the potential adjacent transitions can occur for any individual starting transition.
Single Nucleotide Polymorphisms (SNPs)In many resequencing projects one of the most important objectives is to measure Single Nucleotide Polymorphisms (SNPs) that may be responsible for differences in phenotype. In 2-base encoding most measure errors can be distinguished from potential SNPs as demonstrated below in figure 5:
Figure 5. If a SNP occurs in the sequence ‘C-A-T’ there are only 3 possible results: CGT, CCT and CTT. This means that only 3 dibase combinations are allowed and any other dibasecombinations are illegal. Since any base is defined by two nucleotides (e.g., C-A and A-T), then two adjacent changes must be observed for any SNP. Thus, measurement errors are represented by single changes. As there are only 3 alternative bases that can occur when a SNP is observed (i.e., an A can go to C, G or T), there are only three allowed dibase combinations for any starting adjacent transition. The other six possible adjacent combinations are therefore by definition invalid. Thus,when two adjacent measurement errors are seen, only 1/3 of them could be mistaken for a real SNP, prior to applying any consensus rules. Since the two surrounding combinations contain information about the incorrect combination it is possible to have support for the hypothesis that the reference sequence is unchanged even if a single changed combination is seen and discarded.
SOLiD SystemTM Accuracy
Figure 6: SOLiDTM System’s error rate per base position in sequence read.
ConclusionThe ability to use 2-base encoding to recognize and eliminate measurement errors from subsequent analysis has been demonstrated. In numerous experiments, a minimum error reduction of 20-fold has been seen. Only sequencing by ligation offers the ability to use 2-base encoding. Thus, SOLiD sequencing systems offer the best solution to many applications.
12
Tuesday, 21 June, 2011

Comparative Genomics Workshop, KMUTT, Bangkok, Thailand 21 June, 2011 13
243D.W. Ussery et al., Computing for Comparative Microbial Genomics, Computational Biology 8, DOI 10.1007/978-1-84800-255-5_14, © Springer-Verlag London Limited 2009
Chapter 14Evolution of Microbial Communities; or, On the Origins of Bacterial Species
Outline Evolution can be thought of as the adaptation or optimization of species to their environment. Since, at the level of microorganisms, there can be considerable differences in microenvironments, it is not hard to imagine that many bacteria have a constant need to be adaptable and ready to change to new surroundings. In this final chapter, we will take a look at the processes that drive evolution, and at the evolutionary traces that are visible in the DNA sequences of genomes. Mobile DNA elements play an important role in evolution and an example is given for insertion sequences in Shigella flexneri. Genome islands can be considered genetic ‘building blocks’ that can be added to or removed from a genome core. Finally, we will take a closer look at Vibrio cholerae, to see how this species differs from other Vibrio spe-cies, and how a relatively small set of genes can be responsible for niche adaptation (and sometimes speciation). The amount of genomic diversity within closely related bacterial populations is far greater than anyone had imagined, and the raw material for evolution is abundant in the microbial world.
Introduction
As mentioned in the first chapter, cells obey the laws of chemistry and physics, and there is no need to invoke supernatural forces to explain the physical mechani-cal events happening inside bacterial cells. One of the undercurrent themes of this book has been to build up a firm ‘post-genomic’ foundation from which to view the bacterial communities. We’ve now come full circle, and in this last chapter, we will have a look at the evidence for evolution within individual genomes, and how we can extrapolate such observations to bacterial populations.
In order for evolution to happen, three components are necessary: (1) a number of organisms must have a diverse set of traits that have different advantages under different conditions, (2) these traits must have the ability to change, and finally (3) selection must take place by some particular condition so that (some of) these traits become dominant in the offspring population. We can add the time factor to this as an essential component, because evolution is rarely instantaneous. Before turning to biological examples, we will first take a closer look at evolution in general.
Solexa now ~100 bp (June, 2011)
454 Titanium ~1000 bp (June, 2011)
Tuesday, 21 June, 2011

Comparative Genomics Workshop, KMUTT, Bangkok, Thailand 21 June, 2011 14
!"#$%#&%'()$(*+$,-).(!.)+$.+'(/01123(!"#0145067# 89:;61<417=>')?'<0@6AA(
(BC+(*+$,-).(!"#$%#&%'(D,$',&")E-(
$%&%'()#*+,-.%+"#/�&1%+231(4%#5,,6#7,+#8(.926()(&:#;%<9%&3%=#>?+,@,.,@%.#
A%1%+#BC#D266(&!E#D2&.FD%&+(G#;1H+7%6=1!E#I42#J,1%&*%+:!E#KE#5(@#5C#L(&&%-(%.!E#ME#>+2(:#NC#L%&?2@OE#2&=#P24(=#'C#Q..%+R!#
!#>%&1%+#7,+#L(,6,:(326#;%<9%&3%#/&26R.(.E#P%S2+1@%&1#,7#;R.1%@.#L(,6,:RE#5?%#5%3?&(326#Q&(4%+.(1R#,7#P%&@2+GE#KTUU#V:.C#WR&:*RE#P%&@2+GC#
K#W%+.,%#A2+G266%#MXE#K58E#K!UU#>,S%&?2:%&E#P%&@2+G#M#J,3?%#P(2:&,.1(3.#W1=CE#>DFYMOM#J,1G+%9)E#;-(1)%+62&=#O#Q>#P24(.#$%&,@%#>%&1%+E#Q&(4%+.(1R#,7#>26(7,+&(2E#P24(.E#>26(7,+&(2E#QC;C/C#
F+(G&+'+$"(#$()$"+&#.")H+(I+J(#GGK).#"),$(L,&(H)'E#K)M)$?(?+$,-).(%#"#(,L(G&,N#&O,").(.C&,5-,',-+'<( BC+( ",,K( /*+$+F)M( J&,I'+&3( #KK,I'( E'+&'( ",( .#&&O( ,E"( H#&),E'( #$#KO'+'( 'E.C( #'(-#GG)$?(#K)?$-+$"'(,L( C,-,K,?,E'( ?+$+'( ",(,"C+&( ?+$,-+'P(-#GG)$?(,L( 'C,&"( '+QE+$.)$?(&+#%'(",(#(&+L+&+$.+(.C&,-,',-+P(#$%(.#K.EK#")$?(8RS(G&,G+&")+'('E.C(#'(.E&H#"E&+(,&('"#.N5)$?( +$+&?O( #K,$?( "C+( .C&,-,',-+<( BC+(*+$+F)M( J&,I'+&( G&,%E.+'( #$( )$"+&#.")H+( ?&#GC).("C#"(+$#JK+'(M,,-)$?(L&,-(#(?K,J#K('.#K+(%,I$(",(')$?K+($E.K+,")%+'P(I)"C,E"(.C#$?)$?("C+(')M+( ,L( "C+( GK,"<( :"'( #J)K)"O( ",( %)'G&,G,&"),$#KKO( M,,-( G&,H)%+'( ,G")-#K( &+#%#J)K)"O( #$%( )$5.&+#'+%(LE$."),$#K)"O(.,-G#&+%(",(,"C+&(J&,I'+&'<(BC+(",,K(#KK,I'("C+(E'+&(",('+K+."("C+(%)'5GK#O(,L(H#&),E'(?+$,-).(L+#"E&+'P(.,K,&('+"")$?(#$%(%#"#(&#$?+'<(DE'",-($E-+&).#K(%#"#(.#$(J+(#%%+%(",("C+(GK,"(#KK,I)$?P( L,&(+T#-GK+P(H)'E#K)M#"),$(,L(?+$+(+TG&+''),$(#$%(&+?EK#"),$(%#"#<( UE&"C+&P( '"#$%#&%( #"K#'+'( #&+( G&+5?+$+&#"+%( L,&( #KK( G&,N#&O,").( ?+$,-+'( #H#)K#JK+( )$(*+$V#$NP(G&,H)%)$?(#( L#'"(,H+&H)+I(,L( #KK( #H#)K#JK+( ?+$,-+'P( )$.KE%)$?( &+.+$"KO(%+G,')"+%(?+$,-+( '+QE+$.+'<( BC+( ",,K( )'( #H#)K#JK+( ,$K)$+( L&,-(C""G;>>III<.J'<%"E<%N>'+&H).+'>?IV&,I'+&<( !EGGK+-+$"#K( -#"+&)#K( )$.KE%)$?( )$"+&#.")H+( #"5K#'+'()'(#H#)K#JK+(,$K)$+(#"(C""G;>>III<.J'<%"E<%N>'+&H).+'>?IV&,I'+&>'EGGK><(
#
#
0&1+,=931(,&!"#$%#&#'()*#+,$(-$ -./,$.+%$0+#1)#+/0&#$2#+(*#$/#34#+50+2$,#5"+('(20#/$"./$'#%$,($,"#$2#+#6.,0(+$(-$ &./,$ .*(4+,/$ (-$ 2#+(*05$ 0+-(6*.,0(+7$ 8/$ 2#9+(*05$ /#34#+50+2$ :#5(*#/$ :(,"$ *(6#$ )(;#6-4'$.+%$ .--(6%.:'#<$ ,"#$ ".+%'0+2$ .+%$ .+.'=/0/$ (-$ ,"#$2#+#6.,#%$ %.,.$ )6(%45#/$ +(&#'$ 5".''#+2#/$ .+%$/"0-,/$ ,"#$ -(54/$ .;.=$ -6(*$ ,"#$%0/5(=$ )6(5#//$,(;.6%/$ ,#5"+05.'$ 5(+/0%#6.,0(+/$ (-$ ".+%'0+2<$/,(60+2$ .+%$ .+.'=>0+2$ /#34#+5#$ %.,.7$ 8+$ 0*)(69,.+,$/,#)$;"#+$#1)'(60+2$.$+#;$2#+(*#$0/$,($5(*9).6#$ 0,$ ,($ #10/,0+2$ /#34#+5#/<$ 0+$ (6%#6$ ,($ 0%#+,0-=$:(,"$ +(&#'$ .+%$ 5(+/#6&#%$ -#.,46#/7$ ?.+=$ .4,(9*.,#%$ 5(*)4,.,0(+.'$ *#,"(%/$ .6#$ .&.0'.:'#$ ,".,$.,,#*),$,($%#60&#$)6(,#0+$-4+5,0(+$-6(*$/#34#+5#$@!"#A7$ B+$ .$*#,.2#+(*05$ /,4%=$ :=$C.660+2,(+$ .+%$5(9;(6D#6/$ 0,$;./$ #/,0*.,#%$ ,".,$ EFG$ (-$ ,"#$ #19.*0+#%$)6(,#0+$5(%0+2$2#+#/$5(4'%$:#$.//02+#%$.$-4+5,0(+7$C(;#<$ ,($ .//#//$)6#%05,0(+/$ -(6$ 0+%09
&0%4.'$ 2#+#/$ ,"#$ &0/4.'0>.,0(+$ 6#*.0+/$ 560,05.'$ ,($)6(&0%#$ ,"#$:0('(20/,$;0,"$.+$(&0#;$(-$ ,"#$2#9+(*05$ 5(+,#1,7$ 86#$ 2#+#/$ (-$ 0+,#6#/,$ /0,4.,#%$ 0+$5'4/,#6/H$ B+$ ()#6(+/H$ C(;$ .6#$ ,"#=$ 6#24'.,#%H$C(;$ %(#/$ ,"#06$ IJ8$ :./#$ 5(*)(/0,0(+$ 5(*).6#$;0,"$ ,".,$ (-$ ,"#$ 6#/,$ (-$ ,"#$ 2#+(*#H$ B+$ (6%#6$ ,($%0/)'.=$/45"$-#.,46#/$:(,"$(+$.$2#+(*#$/5.'#$.+%$0+$ 5'(/#94)$ %(;+$ ,($ ,"#$ '#&#'$ (-$ +45'#(,0%#/<$ ;#$%#&#'()#%$ ,"#$ K#+#L0>$ :6(;/#6$ ;"05"$ 0/$ :./#%$(+$ ,"#$ MK#+(*#$8,'./N$5(+5#),$ @$%&A7$!"0/$ ,(('$5.+$.'/($ %0/)'.=$ '(5.'$ IJ8$ /,645,46.'$ )6()#6,0#/<$ /($,".,$ 6#24'.,(6=$ (6$ 6#)#.,$ 6#20(+/$ 5.+$ #./0'=$ :#$0%#+,0-0#%$.+%$ 0+,#6)6#,#%$ 0+$.$5"6(*(/(*.'$5(+9,#1,7$I460+2$ %#&#'()*#+,$ (-$ ,"#$ K#+#L0>$ :6(;/#6<$ 0,$:#5.*#$.)).6#+,$,".,$+(&#'$/#34#+50+2$,#5"+('(92=$56#.,#/$.$ -46,"#6$%#*.+%7$!"#$5466#+,$2#+#6.9,0(+$ (-$ /#34#+50+2$ 0+/,64*#+,/$ 4,0'0>#/$ )60*#%$
!"#"$%&'()*+,")!
"#$! %&'()'*)+!,(!-.(/0,1!%1,.(1.+!
!"#$%"&'( #)*+%,-,./( 0!"#$%& '12( !+)( 3&4-"*( 5)67&)%*)(8$5(5)-)*#)9($5(:);):)%*)(;,:('$33"%.(#+)(:)65)7&)%*"%.( :)$95( &5"%.( #+)( <)%)=">( 4:,85):(#,,-2( !+)( :$%9,'%)55( "%( ;:$.')%#$#",%( 8$5( )5#"6'$#)9( 4/( *,'3$:"%.( #+)( )?3):"')%#$-( 9$#$( 8"#+(!"#$!%!&'( 9".)5#",%5@( .)%):$#)9( $#( ABC( *,D):$.)(&5"%.(:)$9(-)%.#+5(4)#8))%(EB(#,(F@BBB(432(G(.,,9(*,::)53,%9)%*)( 4)#8))%( #+)( !"#$!%!&'( $%9( )?3):"6')%#$-( :)$95( 5&..)5#5( -"##-)( 4"$5( #,8$:95( *):#$"%(*+:,',5,'$-( :).",%5( 0()*+,%& -@( 3$%)-( G12( !+)( $56
5)'4-)9(*,%#".5(3:,D"9)9(4/(AFA(0()* +,+-"!($%9(.)*&'%!1( $:)( '$33)9( #,( #+)( :);):)%*)( .)%,')( &5"%.(HIGJ!( $%9( $%%,#$#)9( "%( #+)( 3):"')#):( ,;( #+)( $#6-$5)5(0#8,(-);#',5#($#-$5)5("%(()*+,%&-@(3$%)-(GKH12(!+)( 9)#$"-)9( $#-$5( ,;( #+)( )?3):"')%#$-( 9$#$( 0#:&)(:)$951@( $:)( 5+,8%( "%( ()*+,%& -@( 3$%)-( H2( L$%)-( M(5+,85(7&$-"#/N*,&%#(,;(:)$95(3-,##)9($5($(;&%*#",%(,;( :)$9( 3,5"#",%2( O,#)( #+$#( #+)( :)$9( 7&$-"#/( 9)6*:)$5)5( #+)( ;&:#+):( #+)( 9"5#$%*)( ;:,'( #+)( 4)."%6%"%.(,;(#+)(:)$92(
!"#$%!&!%.23.(1,(4!).&',5+!/6!&7*..!8'1&.*,'5!4.(/0.+9!&:/!/6!:7,17!:.*.!*.;+.23.(1.)!3+,(4!<=<;>,&'(,30!'()!/(.!:,&7!?5530,('!-@!&.17(/5/4AB!& !"#$%&'#()*'()*+,,! +"#,-,./''
-.!.***+/!0"#1234''!01!
234"56'57! @>CCD!E$$F"GH;=! @>CCD!E$$I#FH;=!
JK@$$$$$#!
!%896:$:;0! <=<;>,&'(,30! <=<;>,&'(,30! ?5530,('!-@!??!<%"7'8:=63! =LI9EI<! =$"9<LI! #9G=$9LE$!>?;'4%"7'$%6;39'@@A37B'7%?C!
=""!M "#$%! =FI!M "&#%! =#!M "'%!
!4=68"3%7'$%6;39! G$$! G$$! L=!.:?%4";%! G#N! #ILN! #IN!)%6:D%'A5E%! <9GLF9GE=!8O! #9G<#9<I#!8O! <9EF#9FG#!8O!>88%AA5:6'"67':45;56"$'<%F%4%68%!
P$$$FG!Q./R! @S####GI!Q.0R! @J$#<G#L!Q.1R!
(
&G5;=4%',!T!U'(.5!@D!>7.!0'V,030!3(,23.(.++!23'5,&A!,+!+7/:(!6/*!&7.!'1&3'5!*.')+!M4*..(;&/;853.!5'(.W! O5/&&.)! ,(! &7.! /3&.*0/+&! 5'(.+9! 3+,(4! &7.! O385,+7.)! 4.(/0.! '+! '! *.6.*.(1.B! >7.! 6/55/:,(4!5'(.+!+7/:!,(;+,5,1/!),4.+&,/(+!'&!<$ N!1/X.*'4.!M*.);&/;853.!5'(.W9!3+,(4!*.')!5.(4&7+!L$9!=$9!E$9!
Tuesday, 21 June, 2011

15
!"#"$%&'()*+,")!
"#$! %&'()'*)+!,(!-.(/0,1!%1,.(1.+!
!"#$%"&'( #)*+%,-,./( 0!"#$%& '12( !+)( 3&4-"*( 5)67&)%*)(8$5(5)-)*#)9($5(:);):)%*)(;,:('$33"%.(#+)(:)65)7&)%*"%.( :)$95( &5"%.( #+)( <)%)=">( 4:,85):(#,,-2( !+)( :$%9,'%)55( "%( ;:$.')%#$#",%( 8$5( )5#"6'$#)9( 4/( *,'3$:"%.( #+)( )?3):"')%#$-( 9$#$( 8"#+(!"#$!%!&'( 9".)5#",%5@( .)%):$#)9( $#( ABC( *,D):$.)(&5"%.(:)$9(-)%.#+5(4)#8))%(EB(#,(F@BBB(432(G(.,,9(*,::)53,%9)%*)( 4)#8))%( #+)( !"#$!%!&'( $%9( )?3):"6')%#$-( :)$95( 5&..)5#5( -"##-)( 4"$5( #,8$:95( *):#$"%(*+:,',5,'$-( :).",%5( 0()*+,%& -@( 3$%)-( G12( !+)( $56
5)'4-)9(*,%#".5(3:,D"9)9(4/(AFA(0()* +,+-"!($%9(.)*&'%!1( $:)( '$33)9( #,( #+)( :);):)%*)( .)%,')( &5"%.(HIGJ!( $%9( $%%,#$#)9( "%( #+)( 3):"')#):( ,;( #+)( $#6-$5)5(0#8,(-);#',5#($#-$5)5("%(()*+,%&-@(3$%)-(GKH12(!+)( 9)#$"-)9( $#-$5( ,;( #+)( )?3):"')%#$-( 9$#$( 0#:&)(:)$951@( $:)( 5+,8%( "%( ()*+,%& -@( 3$%)-( H2( L$%)-( M(5+,85(7&$-"#/N*,&%#(,;(:)$95(3-,##)9($5($(;&%*#",%(,;( :)$9( 3,5"#",%2( O,#)( #+$#( #+)( :)$9( 7&$-"#/( 9)6*:)$5)5( #+)( ;&:#+):( #+)( 9"5#$%*)( ;:,'( #+)( 4)."%6%"%.(,;(#+)(:)$92(
!"#$%!&!%.23.(1,(4!).&',5+!/6!&7*..!8'1&.*,'5!4.(/0.+9!&:/!/6!:7,17!:.*.!*.;+.23.(1.)!3+,(4!<=<;>,&'(,30!'()!/(.!:,&7!?5530,('!-@!&.17(/5/4AB!& !"#$%&'#()*'()*+,,! +"#,-,./''
-.!.***+/!0"#1234''!01!
234"56'57! @>CCD!E$$F"GH;=! @>CCD!E$$I#FH;=!
JK@$$$$$#!
!%896:$:;0! <=<;>,&'(,30! <=<;>,&'(,30! ?5530,('!-@!??!<%"7'8:=63! =LI9EI<! =$"9<LI! #9G=$9LE$!>?;'4%"7'$%6;39'@@A37B'7%?C!
=""!M "#$%! =FI!M "&#%! =#!M "'%!
!4=68"3%7'$%6;39! G$$! G$$! L=!.:?%4";%! G#N! #ILN! #IN!)%6:D%'A5E%! <9GLF9GE=!8O! #9G<#9<I#!8O! <9EF#9FG#!8O!>88%AA5:6'"67':45;56"$'<%F%4%68%!
P$$$FG!Q./R! @S####GI!Q.0R! @J$#<G#L!Q.1R!
(
&G5;=4%',!T!U'(.5!@D!>7.!0'V,030!3(,23.(.++!23'5,&A!,+!+7/:(!6/*!&7.!'1&3'5!*.')+!M4*..(;&/;853.!5'(.W! O5/&&.)! ,(! &7.! /3&.*0/+&! 5'(.+9! 3+,(4! &7.! O385,+7.)! 4.(/0.! '+! '! *.6.*.(1.B! >7.! 6/55/:,(4!5'(.+!+7/:!,(;+,5,1/!),4.+&,/(+!'&!<$ N!1/X.*'4.!M*.);&/;853.!5'(.W9!3+,(4!*.')!5.(4&7+!L$9!=$9!E$9!
Tuesday, 21 June, 2011

Comparative Genomics Workshop, KMUTT, Bangkok, Thailand 21 June, 2011
as of 21 Jan, 2009
as of 26 Jan., 201159382226
16
Matloob
Tuesday, 21 June, 2011

Comparative Genomics Workshop, KMUTT, Bangkok, Thailand 21 June, 2011
Is this everybody’s future? Probably not. But as the torrent of information increases, it is not
surprising that people feel overwhelmed. “There is an immense risk of cognitive overload,” explains
Carl Pabo, a molecular biologist who studies cognition. The mind can handle seven pieces of
information in its short-term memory and can generally deal with only four concepts or relationships
at once. If there is more information to process, or it is especially complex, people become confused.
Moreover, knowledge has become so specialised that it is impossible for any individual to grasp the
whole picture. A true understanding of climate change, for instance, requires a knowledge of
meteorology, chemistry, economics and law, among many other things. And whereas doctors a
century ago were expected to keep up with the entire field of medicine, now they would need to be
familiar with about 10,000 diseases, 3,000 drugs and more than 1,000 lab tests. A study in 2004
suggested that in epidemiology alone it would take 21 hours of work a day just to stay current. And
as more people around the world become more educated, the flow of knowledge will increase even
further. The number of peer-reviewed scientific papers in China alone has increased 14-fold since
1990 (see chart 3).
“What information consumes is rather obvious: it consumes the attention of its recipients,” wrote
Herbert Simon, an economist, in 1971. “Hence a wealth of information creates a poverty of attention.”
But just as it is machines that are generating most of the data deluge, so they can also be put to
work to deal with it. That highlights the role of “information intermediaries”. People rarely deal with
raw data but consume them in processed form, once they have been aggregated or winnowed by
computers. Indeed, many of the technologies described in this report, from business analytics to
recursive machine-learning to visualisation software, exist to make data more digestible for humans
The problem - too much data!
27 February, 2010 | From The Economist print edition
17
Tuesday, 21 June, 2011

Comparative Genomics Workshop, KMUTT, Bangkok, Thailand 21 June, 2011 18
Figure 3: Computing cost dominate sequencing costs. While sequencing costs re-
main almost identical across platforms, the analysis costs vary with data set sizes. The
cost of sequencing compared to the cost of running BLASTX analysis. Data from [11]
using the Amazon EC2 cloud machine as a cost model.
Multiple analysis providers re-run the initial sequence analysis results using
slightly different tools and parameters. Driven by historical factors, not by actual
scientific need the various groups providing data portals for the metagenomics com-
munity ([11,12,13] ) each run separate analysis pipelines, sharing significant parts of
the value add process.
Given the cost of computing almost identical analysis, sharing of results would be
very desirable at a time when significantly more data sets are being created. However
due to the aforementioned implementation details, sharing the computational results is
currently not possible.
In the current state of metagenomics, no single tool can provide all the answers to
researchers, so submissions of data sets to multiple portals are the norm rather than
the exception. This frequently leads to a multiple months wait time for researchers
due to the need to re-compute the basic similarity analysis.
3 Metagenome Standards
Data standards are required to allow sharing of not only sequence sets but also
computational results. If present these data standards would allow “instant” access to
the metagenomic views and analysis tools provided by the other portals without incur-
ring the extensive cost for re-computing the analysis.
Folker Meyer and Nikos Kyrpide, Proposal for open discussion: Informatics challenges for next generation sequencing metagenomics experiments, DOE JGI User Meeting (March 23, 2010).
Tuesday, 21 June, 2011

Comparative Genomics Workshop, KMUTT, Bangkok, Thailand 21 June, 2011 19
E.coliPublicly available genomes:
203 genomes
Rolf
SalmonellaPublicly available genomes:
42 genomes
Shinny
CampylobacterPublicly available genomes:
44 genomes
Marlene
High-throughput comparisonsRasmus
Pseudomonas
72 genomes
Oksana
Annika Asli
Carsten
Tuesday, 21 June, 2011

Comparative Genomics Workshop, KMUTT, Bangkok, Thailand 21 June, 2011 20
A window into third-generation sequencingEric E. Schadt!, Steve Turner and Andrew Kasarskis
Pacific Biosciences, 1380 Willow Road, Menlo Park, CA 94025, USA
Received September 15, 2010; Revised and Accepted September 17, 2010
First- and second-generation sequencing technologies have led the way in revolutionizing the field of geno-mics and beyond, motivating an astonishing number of scientific advances, including enabling a more com-plete understanding of whole genome sequences and the information encoded therein, a more completecharacterization of the methylome and transcriptome and a better understanding of interactions between pro-teins and DNA. Nevertheless, there are sequencing applications and aspects of genome biology that are pre-sently beyond the reach of current sequencing technologies, leaving fertile ground for additional innovationin this space. In this review, we describe a new generation of single-molecule sequencing technologies (third-generation sequencing) that is emerging to fill this space, with the potential for dramatically longer readlengths, shorter time to result and lower overall cost.
INTRODUCTION
The genomics community has been enormously enabled byfirst- and second-generation sequencing (SGS) technologiesin comprehensively characterizing DNA sequence variation,de novo sequencing of a number of species, sequencing ofmicrobiomes, detecting methylated regions of the genome,quantitating transcript abundances, characterizing differentisoforms of genes present in a given sample and identifyingthe degree to which mRNA transcripts are being activelytranslated (1–10). One of the hallmark features of the SGStechnologies is their massive throughput at a modest cost,with hundreds of gigabases of sequencing now possible in asingle run for several thousand dollars (11). Despite therecent and rapid acceptance of SGS technologies, a new gen-eration of single-molecule sequencing (SMS) technologies isemerging (12–15). Unlike major SGS sequencing by synthesis(SBS) technologies that rely on PCR to grow clusters of agiven DNA template, attaching the clusters of DNA templatesto a solid surface that is then imaged as the clusters aresequenced by synthesis in a phased approach, the new gener-ation of SBS technologies interrogate single molecules ofDNA, such that no synchronization is required (a limitationof SGS) (16), thereby overcoming issues related to thebiases introduced by PCR amplification and dephasing.More importantly, this new generation of sequencing technol-ogies has the potential to exploit more fully the high catalyticrates and high processivity of DNA polymerase or avoid anybiology or chemistry altogether to radically increase readlength (from tens of bases to tens of thousands of bases per
read) and time to result (from days to hours or minutes).The promises then of this new, third generation of sequencingtechnologies in offering advantages over current sequencingtechnologies are (i) higher throughput; (ii) faster turnaroundtime (e.g. sequencing metazoan genomes at high fold coveragein minutes); (iii) longer read lengths to enhance de novoassembly and enable direct detection of haplotypes and evenwhole chromosome phasing; (iv) higher consensus accuracyto enable rare variant detection; (v) small amounts of startingmaterial (theoretically only a single molecule may be requiredfor sequencing); and (vi) low cost, where sequencing thehuman genome at high fold coverage for less than $100 isnow a reasonable goal for the community.
But how do these next–next-generation technologies work?What scales of data generation will be achieved with thesenew technologies? What types of ‘sequencing’ data can begenerated? Will they ease analysis issues and/or create newones? And, most importantly, what are the timelines forthese technologies to become available, will they really meetthe above promises and what do we need to do to prepare?In this review we will address these questions, providinginsights into third-generation sequencing (TGS) that promisesto bring sequencing to nearly every aspect of our lives. Whatwill it take to be ready?
RESULTS
A brief history on first-generation sequencing and SGS
The process of sequencing DNA consists of three basic phasescomprising sample preparation, physical sequencing and
!To whom correspondence should be addressed. Tel: +1 6505218250; Fax: +1 6503239420; Email: [email protected]
# The Author 2010. Published by Oxford University Press.This is an Open Access article distributed under the terms of the Creative Commons Attribution Non-Commercial License (http://creativecommons.org/licenses/by-nc/2.5), which permits unrestricted non-commercial use, distribution, and reproduction in any medium, provided the original work isproperly cited.
Human Molecular Genetics, 2010, Vol. 19, Review Issue 2 R227–R240doi:10.1093/hmg/ddq416Advance Access published on September 21, 2010
at The Technical Knowledge C
enter of Denm
ark on April 26, 2011hm
g.oxfordjournals.orgD
ownloaded from
Tuesday, 21 June, 2011
Comparative Genomics Workshop, KMUTT, Bangkok, Thailand 21 June, 2011 21
and ultimately, throughput is limited as well, compared withwhat SMS platforms will be capable of achieving.Sitting even closer to the TGS boundary is the Helicos
Genetic Analysis Platform, the first commercially availablesequencing instrument to carry out SMS (24–27). TheHelicos sequencing instrument works by imaging individualDNA molecules affixed to a planar surface as they are extendedusing a defined primer and a modified polymerase as well asproprietary fluorescently labeled nucleotide analogues, referredto as Virtual Terminator nucleotides, in which the dye isattached to the nucleotide via a chemically cleavable groupthat allows for step-wise sequencing to be carried out (25).Because halting is still required in this process (similar toSGS technologies), the time to sequence a single nucleotide ishigh, and the read lengths realized are !32 nucleotides long.However, given the SMS nature of this technology, no PCRis required for sequencing, a significant advantage over SGStechnologies. However, also due to the single-molecule natureof this technology (and all of the SMS technologies), the rawread error rates are generally at or .5%, although the highlyparallel nature of this technology can deliver high fold coverageand a consensus or finished read accuracy of .99%. This tech-nology is capable of sequencing an entire human genome, albeitat significant cost by today’s standards (roughly $50 000 inreagents) (28). It can follow roughly one billion individualDNA molecules as they are sequenced over the course ofmany days. Unlike SGS, these many hundreds of millions ofsequencing reactions can be carried out asynchronously, a hall-mark of TGS. Further, given individual monitoring of tem-plates, the enzymatic incorporation step does not need to be
driven to completion, which serves to reduce the overallmis-incorporation error rate. As with the other TGS technol-ogies discussed below, deletions and insertions are a significantissue.The sample preparation part of this technology involves
fragmenting genomic DNA into smaller pieces, adding a 3’poly(A) tail to the fragments, labeling and blocking by term-inal transferase. These templates are then captured onto asurface with covalently bound 5’ dT(50) oligonucleotides viahybridization (25). The surface is then imaged using charge-coupled device (CCD) sensors, where those templates thathave been appropriately captured are identified and thentracked for SBS. The process then resembles the‘wash-and-scan’ steps of SGS in which a labeled nucleotideand polymerase mixture are flooded onto the system and incu-bated for a period of time, the surface is then washed toremove the synthesis mixture and scanned to detect the fluor-escent label. The dye–nucleotide linker is then cleaved torelease the dye, and this process is repeated.Not only can this technology be used to sequence DNA,
but the DNA polymerase can be replaced with a reversetranscriptase enzyme to sequence RNA directly (29),without requiring the conversion of RNA to cDNA orwithout the need for ligation/amplification steps, somethingall existing SGS technologies require for RNA sequencing(5). Instead, each RNA molecule is polyadenylated and3’-blocked and captured on a surface coated with dT(50)oligonucleotides, similar to the DNA sequencing process.Sequencing is then carried out as described for DNA, butusing reverse transcriptase instead of DNA polymerase. In
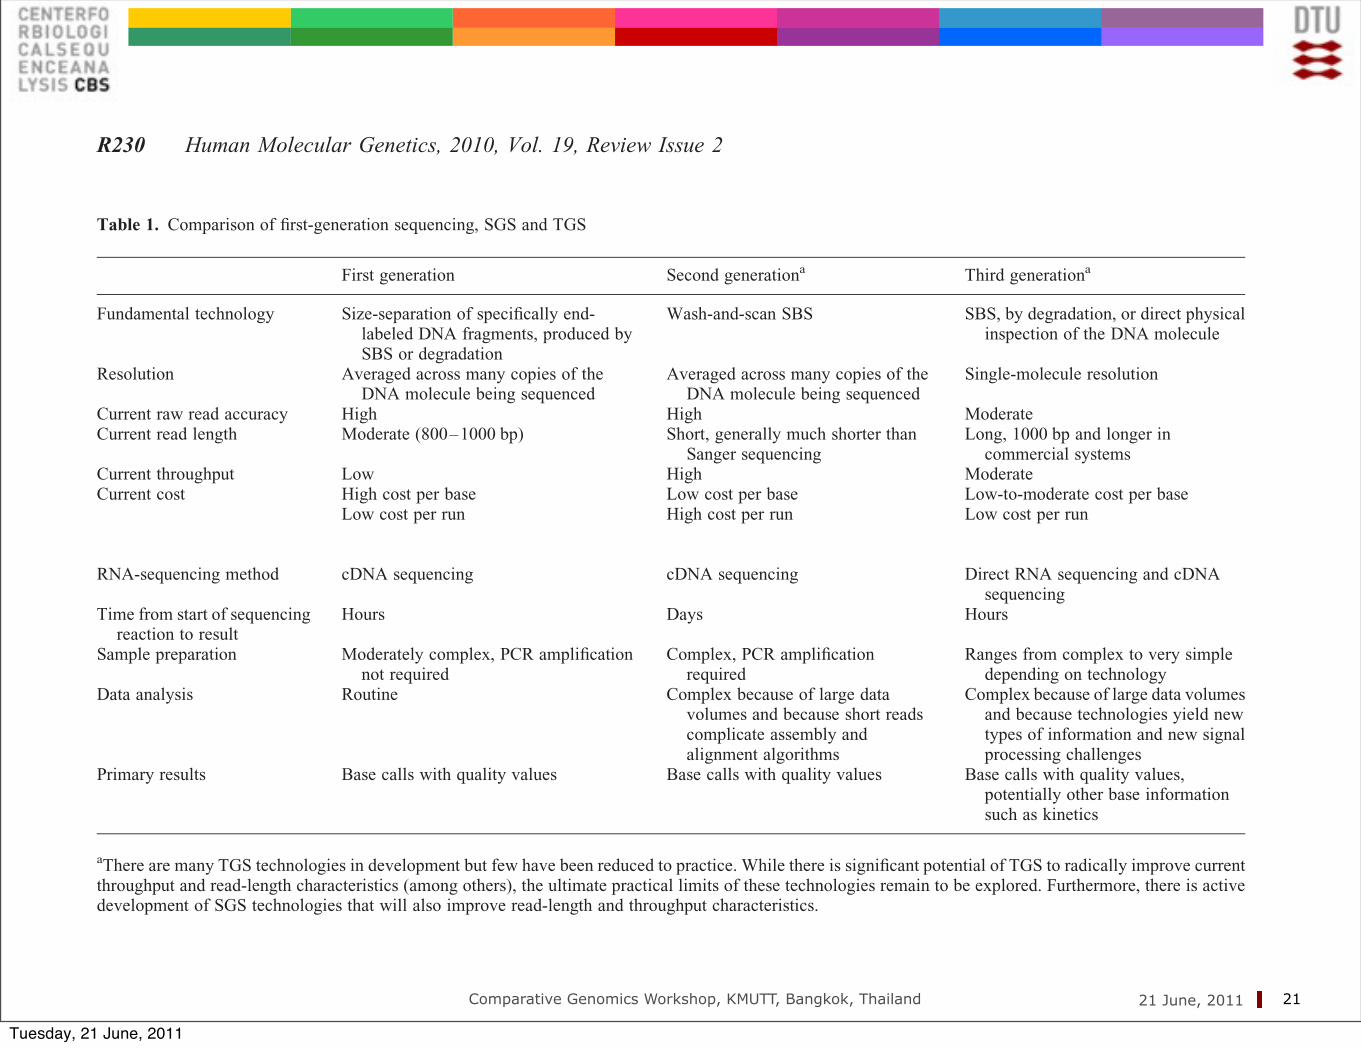
Table 1. Comparison of first-generation sequencing, SGS and TGS
First generation Second generationa Third generationa
Fundamental technology Size-separation of specifically end-labeled DNA fragments, produced bySBS or degradation
Wash-and-scan SBS SBS, by degradation, or direct physicalinspection of the DNA molecule
Resolution Averaged across many copies of theDNA molecule being sequenced
Averaged across many copies of theDNA molecule being sequenced
Single-molecule resolution
Current raw read accuracy High High ModerateCurrent read length Moderate (800–1000 bp) Short, generally much shorter than
Sanger sequencingLong, 1000 bp and longer in
commercial systemsCurrent throughput Low High ModerateCurrent cost High cost per base Low cost per base Low-to-moderate cost per base
Low cost per run High cost per run Low cost per run
RNA-sequencing method cDNA sequencing cDNA sequencing Direct RNA sequencing and cDNAsequencing
Time from start of sequencingreaction to result
Hours Days Hours
Sample preparation Moderately complex, PCR amplificationnot required
Complex, PCR amplificationrequired
Ranges from complex to very simpledepending on technology
Data analysis Routine Complex because of large datavolumes and because short readscomplicate assembly andalignment algorithms
Complex because of large data volumesand because technologies yield newtypes of information and new signalprocessing challenges
Primary results Base calls with quality values Base calls with quality values Base calls with quality values,potentially other base informationsuch as kinetics
aThere are many TGS technologies in development but few have been reduced to practice. While there is significant potential of TGS to radically improve currentthroughput and read-length characteristics (among others), the ultimate practical limits of these technologies remain to be explored. Furthermore, there is activedevelopment of SGS technologies that will also improve read-length and throughput characteristics.
R230 Human Molecular Genetics, 2010, Vol. 19, Review Issue 2
at The Technical Knowledge C
enter of Denm
ark on April 26, 2011hm
g.oxfordjournals.orgD
ownloaded from
Tuesday, 21 June, 2011

Comparative Genomics Workshop, KMUTT, Bangkok, Thailand 21 June, 2011 22
426 VOLUME 28 NUMBER 5 MAY 2010 NATURE BIOTECHNOLOGY
Biosciences (PacBio; Menlo Park, CA), Life Technologies (Carlsbad, CA), Oxford Nanopore (Oxford, UK) and Ion Torrent (Gilford, CT). The representatives of these companies were decked out in their brightly colored company regalia at the meeting, with each ensconced in their respective rooms like the pits of a Formula One race.
Of the emerging third-generation tech-nologies, the PacBio and Life Technologies platforms are the most similar and closest to commercial release, with early-access part-nerships scheduled for midyear and year-end, respectively. The similarities between these two platforms confer a shared set of strengths and weaknesses. Both the PacBio and Life Technologies instruments use DNA polymerase and terminal phosphate–labeled nucleotides2 that allow long read lengths (1 kb and 1.5 kb, respectively) and short run times (15 min and 20 min, respectively). They both also use a charge-coupled diode (CCD) array detection system3. This means that the throughput of these platforms is restricted by the current state-of-the-art in CCD array technology. Simply put, these cameras have a finite amount of data-recording capacity. Until this capacity is increased, the per-run throughput of these platforms will be limited to a level no higher than that of the Illumina and SOLiD second-generation sequencers.
But it is the differences, rather than the similarities, between the PacBio and Life Technologies platforms that are most per-tinent. The reactions in the PacBio RS sequencer are performed in 80,000 zero-mode waveguide (ZMW) ‘wells’, each hold-ing 20 zeptoliters (10–21 liters)4–7(Fig. 1a). In addition to de novo sequencing capabilities, the first release of the PacBio instrument will also offer redundant re-sequencing and strobe-sequencing applications. Redundant sequencing generates multiple independent reads of each template molecule, result-ing in accuracy rates exceeding 99.9%. The second application, strobe sequencing, is a simplified alternative to second-generation sequencing’s mate-pair application. Strobe sequencing was developed as a solution to the problem that continuous illumination required by the excitation laser inflicts photo
Third-generation sequencing fireworks at Marco IslandDavid J Munroe & Timothy J R Harris
Advances in sequencing platforms promise to make this technology more accessible.
David J. Munroe and Timothy J. R. Harris are in the Advanced Technology Program, SAIC-Frederick, Inc., National Cancer Institute–Frederick, Frederick, Maryland, USA. e-mail: [email protected]
It was unseasonably cold in Florida dur-ing the Advances in Genome Biology and Technology (AGBT) meeting on Marco Island, on 24–27 February, but there was no cooling the enthusiasm and excitement of meeting participants over the new devel-opments and innovations that continue to drive DNA sequencing technology. Even the lavish firework display could not upstage the sequencing pyrotechnics on offer from the newest generation of instruments showcased during the meeting.
Over the course of the past 5 years, the development of so-called ‘next’- or ‘second’-generation DNA sequencing, and the applications that this enabled, have firmly established DNA sequencing as the preeminent technology driving future devel-opments in genomics. As reported at AGBT, the dominant second-generation sequencing platforms—HiSeq from Illumina (San Diego, CA) and SOLiD from Life Technologies (Foster City, CA)—have been optimized so that, by years end, they will not only have substantially reduced hands-on sample prep-aration time but also have their throughput increased to 100 Gb of mappable sequence per run. Improvements in the new Illumina platform (HiSeq 2000) include reagent opti-mization, the use of two flow cells and a dual surface imaging system, whereas the new SOLiD platform (SOLiD 4) makes use of a newly engineered DNA ligase, smaller bead size, reagent optimization, and improved software for bead detection and color call-ing. In addition to increased throughput, the SOLiD 4 boasts a >99.9% accuracy rate.
Last year, these platforms were joined by the commercial launch of another system, the arrayed nanoball system of Complete Genomics (Mountain View, CA), which is an iteration of the sequencing-by-ligation approach. Unlike the Illumina and Life Technologies sequencing businesses, which were positioned as instrument vendors, the
Complete Genomics business model is to operate as a sequencing service rather than sell instrumentation and consumables. The Complete Genomics platform uses a pro-prietary combinatorial probe–anchor liga-tion strategy to sequence amplified DNA templates that are self-assembled into DNA nanoballs anchored onto patterned nano-arrays1. The ligation chemistry is complex, as is the data analysis inherent to all short-read platforms, two features that together translate into long turnaround times. Even so, a recent report detailing the sequenc-ing of three human genomes demonstrates that this platform is highly accurate and is capable of generating an average of 45–87 fold coverage at a consumables cost of $4,400 per genome1.
Although improvements to the second-generation continue to impress, perhaps the greatest ‘buzz’ at AGBT and elsewhere has been about the development of so-called third-generation DNA sequencing platforms. Designed to complement second-generation sequencing, third-generation platforms have several characteristics that distinguish them from their predecessors, including single-molecule templates, lower cost per base, easy sample preparation, significantly faster run times and simplified primary data analysis. Long-read lengths (hundreds of base pairs or more) enable de novo sequencing and simplify data analysis. In particular, a long-read length simplifies sequence assembly and facilitates a variety of data analysis functions such as detection of copy number variations (CNVs), translocations, splice variation, chimeric transcripts and haplotype phas-ing. The use of single-molecule templates translates into simplified template prepa-ration and typically reduces the amount of sample needed for analysis. Third-generation sequencing platforms also have significantly faster run times compared with second-gen-eration instruments (minutes as opposed to days). These short run times will facilitate application development and open the door to the routine use of sequencing as a diag-nostic tool. Currently, several such platforms are in various stages of development. Four distinguish themselves from the rest: Pacific
NEW S AN D V IEW S426 VOLUME 28 NUMBER 5 MAY 2010 NATURE BIOTECHNOLOGY
Biosciences (PacBio; Menlo Park, CA), Life Technologies (Carlsbad, CA), Oxford Nanopore (Oxford, UK) and Ion Torrent (Gilford, CT). The representatives of these companies were decked out in their brightly colored company regalia at the meeting, with each ensconced in their respective rooms like the pits of a Formula One race.
Of the emerging third-generation tech-nologies, the PacBio and Life Technologies platforms are the most similar and closest to commercial release, with early-access part-nerships scheduled for midyear and year-end, respectively. The similarities between these two platforms confer a shared set of strengths and weaknesses. Both the PacBio and Life Technologies instruments use DNA polymerase and terminal phosphate–labeled nucleotides2 that allow long read lengths (1 kb and 1.5 kb, respectively) and short run times (15 min and 20 min, respectively). They both also use a charge-coupled diode (CCD) array detection system3. This means that the throughput of these platforms is restricted by the current state-of-the-art in CCD array technology. Simply put, these cameras have a finite amount of data-recording capacity. Until this capacity is increased, the per-run throughput of these platforms will be limited to a level no higher than that of the Illumina and SOLiD second-generation sequencers.
But it is the differences, rather than the similarities, between the PacBio and Life Technologies platforms that are most per-tinent. The reactions in the PacBio RS sequencer are performed in 80,000 zero-mode waveguide (ZMW) ‘wells’, each hold-ing 20 zeptoliters (10–21 liters)4–7(Fig. 1a). In addition to de novo sequencing capabilities, the first release of the PacBio instrument will also offer redundant re-sequencing and strobe-sequencing applications. Redundant sequencing generates multiple independent reads of each template molecule, result-ing in accuracy rates exceeding 99.9%. The second application, strobe sequencing, is a simplified alternative to second-generation sequencing’s mate-pair application. Strobe sequencing was developed as a solution to the problem that continuous illumination required by the excitation laser inflicts photo
Third-generation sequencing fireworks at Marco IslandDavid J Munroe & Timothy J R Harris
Advances in sequencing platforms promise to make this technology more accessible.
David J. Munroe and Timothy J. R. Harris are in the Advanced Technology Program, SAIC-Frederick, Inc., National Cancer Institute–Frederick, Frederick, Maryland, USA. e-mail: [email protected]
It was unseasonably cold in Florida dur-ing the Advances in Genome Biology and Technology (AGBT) meeting on Marco Island, on 24–27 February, but there was no cooling the enthusiasm and excitement of meeting participants over the new devel-opments and innovations that continue to drive DNA sequencing technology. Even the lavish firework display could not upstage the sequencing pyrotechnics on offer from the newest generation of instruments showcased during the meeting.
Over the course of the past 5 years, the development of so-called ‘next’- or ‘second’-generation DNA sequencing, and the applications that this enabled, have firmly established DNA sequencing as the preeminent technology driving future devel-opments in genomics. As reported at AGBT, the dominant second-generation sequencing platforms—HiSeq from Illumina (San Diego, CA) and SOLiD from Life Technologies (Foster City, CA)—have been optimized so that, by years end, they will not only have substantially reduced hands-on sample prep-aration time but also have their throughput increased to 100 Gb of mappable sequence per run. Improvements in the new Illumina platform (HiSeq 2000) include reagent opti-mization, the use of two flow cells and a dual surface imaging system, whereas the new SOLiD platform (SOLiD 4) makes use of a newly engineered DNA ligase, smaller bead size, reagent optimization, and improved software for bead detection and color call-ing. In addition to increased throughput, the SOLiD 4 boasts a >99.9% accuracy rate.
Last year, these platforms were joined by the commercial launch of another system, the arrayed nanoball system of Complete Genomics (Mountain View, CA), which is an iteration of the sequencing-by-ligation approach. Unlike the Illumina and Life Technologies sequencing businesses, which were positioned as instrument vendors, the
Complete Genomics business model is to operate as a sequencing service rather than sell instrumentation and consumables. The Complete Genomics platform uses a pro-prietary combinatorial probe–anchor liga-tion strategy to sequence amplified DNA templates that are self-assembled into DNA nanoballs anchored onto patterned nano-arrays1. The ligation chemistry is complex, as is the data analysis inherent to all short-read platforms, two features that together translate into long turnaround times. Even so, a recent report detailing the sequenc-ing of three human genomes demonstrates that this platform is highly accurate and is capable of generating an average of 45–87 fold coverage at a consumables cost of $4,400 per genome1.
Although improvements to the second-generation continue to impress, perhaps the greatest ‘buzz’ at AGBT and elsewhere has been about the development of so-called third-generation DNA sequencing platforms. Designed to complement second-generation sequencing, third-generation platforms have several characteristics that distinguish them from their predecessors, including single-molecule templates, lower cost per base, easy sample preparation, significantly faster run times and simplified primary data analysis. Long-read lengths (hundreds of base pairs or more) enable de novo sequencing and simplify data analysis. In particular, a long-read length simplifies sequence assembly and facilitates a variety of data analysis functions such as detection of copy number variations (CNVs), translocations, splice variation, chimeric transcripts and haplotype phas-ing. The use of single-molecule templates translates into simplified template prepa-ration and typically reduces the amount of sample needed for analysis. Third-generation sequencing platforms also have significantly faster run times compared with second-gen-eration instruments (minutes as opposed to days). These short run times will facilitate application development and open the door to the routine use of sequencing as a diag-nostic tool. Currently, several such platforms are in various stages of development. Four distinguish themselves from the rest: Pacific
NEW S AN D V IEW S
NATURE BIOTECHNOLOGY VOLUME 28 NUMBER 5 MAY 2010 427
characteristic ability to disturb electrical current, which should enable epigenetics applications. A clear disadvantage, how-ever, is that because the template molecule is digested during sequencing, redundant sequencing (and the associated high accu-racy) is not possible. However, this drawback could be eliminated by simply replacing the exonuclease coupled to the nanopore with a DNA polymerase. Several other notewor-thy groups, including GE Healthcare (Little Chalfont, UK), are also developing nanop-ore-based sequencing platforms, the details of which have not yet been made public.
Arguably, though, the most heat at AGBT was generated by the Ion Torrent Systems platform. This technology uses a semicon-ductor-based high-density array of microw-ells that function as reaction chambers (Fig. 1d). As DNA polymerase traverses each single-molecule template, nucleotide incor-poration events are recorded using a unique and imaginative readout system that mea-sures hydrogen ions released as a natural by-product of chain elongation—a kind of sequencing pH meter. Like other nanopore-based technologies, the Ion Torrent platform has the advantage of low instrument fabrica-tion and operation costs owing to the lack of labeled nucleotides and optical detection systems. Ion Torrent currently claims 100–200 base reads in 1–2 h on an instrument the size of a typical microwave oven with a projected sales price of ~$50,000. Although highly anticipated, no release date has yet been scheduled.
plate molecules are stretched in nanotubes and sequenced by several polymerase mole-cules simultaneously. As this platform comes closer to commercial release, we will see to what extent these differences translate into advantages.
Slightly further from commercial release is the Oxford Nanopore Technologies instru-ment. Rather than using a sequencing-by-synthesis method, this technology employs an exonuclease-based ‘sequencing by decon-struction’ approach. At the heart of this technology is an exonuclease coupled to a modified -hemolysin nanopore (Fig. 1c). The modified nanopores are positioned within a lipid bilayer over a microwell that contains a pair of electrodes on either side of the lipid bilayer. When an electrical potential is applied, the high intrinsic resistance of the bilayer directs a cation-modulated current through the nanopore. As a DNA sample is introduced, the exonuclease functions to ‘capture’ the DNA molecule and direct the sequentially cleaved bases through the nanopore. As each cleaved base traverses the nanopore, the current is disturbed in a man-ner characteristic for each base, creating an ‘electrical trace’ unique to each nucleotide8.
Distinct advantages of this system include a low instrument fabrication and operation cost due to the lack of labeled nucleotides and optical detection systems (that is, laser and CCD camera). In addition, the Oxford Nanopore platform is compatible with direct RNA sequencing and the detection of modi-fied bases8 by virtue of each individual base’s
damage on the polymerase in the ZMW guide wells, thus limiting read lengths. Strobe sequencing addresses this issue by periodi-cally ‘turning off ’ the excitation laser. While the laser is ‘off,’ no sequence data can be collected, but the polymerase can continue to traverse the template molecule without incurring damage; and the distant sequence is then read when the laser is turned back on. The net effect is that multiple sequence reads (totaling an average of 1 kb) can be collected across longer stretches of each contiguous template molecule.
In contrast to PacBio, the Life Technologies platform covalently binds the end of the DNA template molecule to a glass array sur-face (Fig. 1b). The DNA polymerase used in the Life Technologies system is modified with a quantum dot fluorescent donor mol-ecule that enables a fluorescence resonance energy transfer (FRET)–based labeling strat-egy offering two distinct advantages. First, light emission can only emanate from labeled nucleotides as they are being incorporated, leading to a significantly lower background. Second, because a FRET-based system does not require continuous high-energy laser excitation, significantly less photodam-age is inflicted on the polymerase, which should ultimately lead to much longer read lengths. With the initial release of this plat-form, Life Technologies will also offer a redundant sequencing application that will push accuracy rates to >99.9%. Currently in development is an ultra-long-read-length application (>100 kb), in which single tem-
a b c d
Illumination Emission
Ion-sensitive layer
Ion sensor
H+
GA
Figure 1 Third-generation sequencing platforms. (a) Pacific Biosciences SMRT (single-molecule real-time) DNA sequencing method. The platform uses a DNA polymerase anchored to the bottom surface of a ZMW (pictured in cross section). Differentially labeled nucleotides enter the ZMW via diffusion and occupy the ‘detection volume’ (white translucent halo area) or microseconds. During an incorporation event, the labeled nucleotide is ‘held’ within the detection volume by the polymerase for tens of milliseconds. As each nucleotide is incorporated, the label, located on the terminal phosphate, is cleaved off and diffuses out of the ZMW. (b) Life Technologies FRET sequencing platform uses base fluorescent labeling technology, a DNA polymerase modified with a quantum dot and DNA template molecules immobilized onto a solid surface. During an incorporation event, energy is transferred from the quantum dot to an acceptor fluorescent moiety on each labeled base. Light emission can only emanate from labeled nucleotides as they are being incorporated. (c) The Oxford nanopore sequencing platform uses an exonuclease coupled to a modified -hemolysin nanopore (purple, pictured in cross section) positioned within a lipid bilayer. As sequentially cleaved bases are directed through the nanopore, they are transiently bound by a cyclodextrin moiety (blue), disturbing current through the nanopore in a manner characteristic for each base. (d) The Ion Torrent sequencing platform uses a semiconductor-based high-density array of microwell reaction chambers positioned above an ion-sensitive layer and an ion sensor. Single nucleotides are added sequentially, and incorporation is recorded by measuring hydrogen ions released as a by-product of nucleotide chain elongation.
NEW S AN D V IEW S
Tuesday, 21 June, 2011

10 DECEMBER, 2010, 9:08 AM
Sequencing Machine Helped Trace Cholera in HaitiBy ANDREW POLLACK
Nothing like a public health crisis to put a new technology through its paces.
Scientists on Thursday said they used new technology to rapidly sequence the genome of the cholera bacterium that has killed more than 2,000 people in Haiti and sickened nearly 100,000.
The analysis confirmed one from the Centers of Disease Control and Prevention that the strain appears to have come from South Asia, not from Latin America. The study was published online late Thursday by The New England Journal of Medicine.
Dr. Matthew K. Waldor, an infectious disease specialist at Harvard Medical School and a senior author of the paper, said one implication was that the disease was transmitted by people, not carried to Haiti on water currents. In the future, he said, people entering countries that might be vulnerable to cholera should be screened for the disease.
“If that was the policy, we could have prevented the Haitian epidemic,’’ he said.
Yet another implication, he said, is the growing role that fast genome sequencing can play in tracking infectious disease outbreaks.
Dr. Waldor turned to Pacific Biosciences, which next year is planning to begin selling a so-called third generation sequencing machine for $695,000. It has the potential to vastly increase the pace and lower the cost of DNA sequencing. While other companies also make such claims, PacBio has been successful in raising hundreds of millions of dollars from investors, including $200 million in its initial public stock offering in October.
Seeing a chance to prove and publicize its technology, PacBio worked night and day on the cholera project. The bacterium, known as Vibrio cholerae, has about 4.5 million bases of DNA in its genome, compared to 3 billion for the human genome.
The company received the samples at its headquarters in Menlo Park, Calif., on Nov. 10. By midday the next day, it had some raw sequences done. By Nov. 15, it had sequenced and analyzed not only two strains from Haiti but two from Bangladesh and one from Peru. The draft of the paper was submitted to the journal on Nov. 19.
“It was definitely intense,’’ said Eric Schadt, the company’s chief scientific officer and an author of the paper.
Dr. Schadt said the sequencing might be quick enough to allow construction and updating of a “disease weather map,’’ something the company is trying to develop for San Francisco’s Bay Area. Samples can be taken every day from various spots and analyzed and mapped to see how different germs are spreading, perhaps providing early warning of an impending outbreak.
The conclusion that the Haitian disease came from South Asia is sensitive. There have already been riots directed at United Nations peacekeeping forces there because of suspicions that Nepalese soldiers brought the disease.
The new study did not have a Nepalese strain for comparison so it is impossible to say if that country was the source, only that the Haitian strains closely resembled a 2008 strain from Bangladesh.
23
Tuesday, 21 June, 2011

T h e n e w e ngl a nd j o u r na l o f m e dic i n e
10.1056/nejmoa1012928 nejm.org 1
original article
The Origin of the Haitian Cholera Outbreak Strain
Chen-Shan Chin, Ph.D., Jon Sorenson, Ph.D., Jason B. Harris, M.D., William P. Robins, Ph.D., Richelle C. Charles, M.D., Roger R. Jean-Charles, M.D.,
James Bullard, Ph.D., Dale R. Webster, Ph.D., Andrew Kasarskis, Ph.D., Paul Peluso, Ph.D., Ellen E. Paxinos, Ph.D., Yoshiharu Yamaichi, Ph.D.,
Stephen B. Calderwood, M.D., John J. Mekalanos, Ph.D., Eric E. Schadt, Ph.D., and Matthew K. Waldor, M.D., Ph.D.
From Pacific Biosciences, Menlo Park, CA (C.-S.C., J.S., J.B., D.R.W., A.K., P.P., E.E.P., E.E.S.); the Division of Infectious Diseas-es, Massachusetts General Hospital (J.B.H., R.C.C., S.B.C.), Channing Labora-tory, Brigham and Women’s Hospital (Y.Y., M.K.W.), the Departments of Pediat-rics (J.B.H.), Medicine (R.C.C., Y.Y., S.B.C., M.K.W.), Microbiology (W.P.R., S.B.C., J.J.M., M.K.W.), and Molecular Genetics (W.P.R., S.B.C., J.J.M., M.K.W.), Harvard Medical School, and the Howard Hughes Medical Institute (M.K.W.) — all in Bos-ton; and Fondation pour le Développe-ment des Universités et de la Recherche en Haïti, Port-au-Prince, Haiti (R.R.J.-C.). Address reprint requests to Dr. Schadt at [email protected].
Drs. Chin, Sorenson, Harris, and Robins contributed equally to this article.
This article (10.1056/NEJMoa1012928) was published on December 9, 2010, at NEJM .org.
N Engl J Med 2010.Copyright © 2010 Massachusetts Medical Society.
A bs tr ac t
BackgroundAlthough cholera has been present in Latin America since 1991, it had not been epidemic in Haiti for at least 100 years. Recently, however, there has been a severe outbreak of cholera in Haiti.
MethodsWe used third-generation single-molecule real-time DNA sequencing to determine the genome sequences of 2 clinical Vibrio cholerae isolates from the current outbreak in Haiti, 1 strain that caused cholera in Latin America in 1991, and 2 strains iso-lated in South Asia in 2002 and 2008. Using primary sequence data, we compared the genomes of these 5 strains and a set of previously obtained partial genomic sequences of 23 diverse strains of V. cholerae to assess the likely origin of the cholera outbreak in Haiti.
ResultsBoth single-nucleotide variations and the presence and structure of hypervariable chromosomal elements indicate that there is a close relationship between the Hai-tian isolates and variant V. cholerae El Tor O1 strains isolated in Bangladesh in 2002 and 2008. In contrast, analysis of genomic variation of the Haitian isolates reveals a more distant relationship with circulating South American isolates.
ConclusionsThe Haitian epidemic is probably the result of the introduction, through human activity, of a V. cholerae strain from a distant geographic source. (Funded by the Na-tional Institute of Allergy and Infectious Diseases and the Howard Hughes Medical Institute.)
The New England Journal of Medicine Downloaded from www.nejm.org on December 11, 2010. For personal use only. No other uses without permission.
From the NEJM Archive Copyright © 2010 Massachusetts Medical Society.
24
Tuesday, 21 June, 2011

Comparative Genomics Workshop, KMUTT, Bangkok, Thailand 21 June, 2011 25ZMWs overcome the first obstacle, but not the second. All
SGS technologies directly attach the dye to the base, which isincorporated into the DNA strand. This is problematic for any
system attempting to observe DNA synthesis in real timebecause the dye’s large size relative to the DNA can interferewith the activity of the DNA polymerase. Typically, a DNA
Figure 2. How third-generation DNA-sequencing technologies work. Third-generation DNA-sequencing technologies are distinguished by direct inspection ofsingle molecules with methods that do not require wash steps during DNA synthesis. (A) Pacific Biosciences technology for direct observation of DNA synthesison single DNA molecules in real time. A DNA polymerase is confined in a zero-mode waveguide and base additions measured with florescence detection ofgamma-labeled phosphonucleotides. (B) Several companies seek to sequence DNA by direct inspection using electron microscopy similar to the Reveo tech-nology pictured here, in which an ssDNA molecule is first stretched and then examined by STM. (C) Oxford Nanopore technology for measuring translocationof nucleotides cleaved from a DNA molecule across a pore, driven by the force of differential ion concentrations across the membrane. (D) IBM’s DNA transistortechnology reads individual bases of ssDNA molecules as they pass through a narrow aperture based on the unique electronic signature of each individual nucleo-tide. Gold bands represent metal and gray bands dielectric layers of the transistor.
R232 Human Molecular Genetics, 2010, Vol. 19, Review Issue 2
at The Technical Knowledge C
enter of Denm
ark on April 26, 2011hm
g.oxfordjournals.orgD
ownloaded from
Tuesday, 21 June, 2011

Comparative Genomics Workshop, KMUTT, Bangkok, Thailand 21 June, 2011 26
NEWS & ANALYSIS
www.sciencemag.org SCIENCE VOL 332 10 JUNE 2011 1249
CR
ED
IT: C
HR
IST
IAN
CH
AR
ISIU
S/A
FP
/GE
TT
Y IM
AG
ES
/NE
WS
CO
M
When cholera raged in the German port city of Hamburg in 1892 and killed thousands of people, famous epidemiologist Robert Koch pinpointed contaminated drinking water as the source of the infection, but he was unable to isolate the responsible bacte-rium. Nearly 120 years later, German public health offi cials and scientists are facing the opposite dilemma.
As Science went to press, they had not been able to fi nd the source of the deadli-est outbreak of enterohemorrhagic Esch-
erichia coli (EHEC) bacteria on record. Yet they are getting to know the pathogen caus-ing it in unprecedented detail, aided by an armada of scientists around the world who are analyzing available genomic data on the fl y and, via tweets, wikis, and blogs, dissemi-nating results online. “I am really surprised and impressed at how fast this is develop-ing,” says Holger Rohde, a microbiologist at the University Medical Center Hamburg-Eppendorf. “I think it shows how relevant this platform can be to science.”
Although E. coli are a natural part of the human gut fl ora and usually not pathogenic, the strains classed together as EHEC produce
the dangerous Shiga toxin that enters the cells lining the gut and inhibits protein synthesis. The resulting cellular destruction leads to abdominal cramping and eventually bloody diarrhea. In some cases, the toxin also attacks the kidneys, triggering the potentially fatal hemolytic-uremic syndrome (HUS). During the outbreak that started the second week of May in northern Germany, more than 2300 people had become infected as of 7 June, more than 600 had developed HUS, and at least 23 had died.
As the number of EHEC cases started to rise in Germany, microbiologists at the Uni-versity Medical Center Hamburg-Eppendorf, the clinic hit hardest by the outbreak, were swamped by patient samples to be examined. But then a Danish postdoc of Chinese ori-gin working there on an exchange program raised the idea of teaming up with the Bei-jing Genomics Institute (BGI) in Shenzhen to sequence the genome of the deadly bacterium. On Wednesday 25 May, the clinic sent a small tube of purifi ed bacterial DNA to BGI. “It arrived in China on Friday and the sequencing started on the weekend,” Rohde says.
On 2 June, Chinese scientists announced
that they had deciphered the microbe’s entire 5.2-million-base-pair genome and immedi-ately made the DNA sequence available for researchers to download. Scores of scien-tists all over the world started poring over the data, assembling sequence fragments generated by BGI into a coherent genome, and comparing it to reference genomes for E. coli and other bacteria. The same day, a collaboration between the University of Münster and Life Technologies Corp., which manufactures advanced DNA sequencing machines, announced it had also sequenced a strain from a patient.
The two announcements came on the sec-ond day of a U.K. meeting on applied bio-informatics and public health microbiology. Speakers and other attendees immediately started working on annotating the bacte-rial sequence provided by BGI. “In less than 24 hours we got the reads, the assembly, and the annotation. A good case study,” blogged Marina Manrique of era7 bioinformatics, a Spanish company that quickly did an auto-mated analysis of the E. coli’s genome.
The picture emerging from these fi rst anal-yses is surprising: The German strain’s DNA sequence revealed the microbe not to be a typical EHEC bacterium. Instead, the patho-gen shares 93% of its sequence with EAEC 55989, an E. coli strain isolated in 2002 from an HIV-positive patient in the Central Afri-can Republic suffering from chronic diar-rhea. EAEC stands for enteroaggregative
Scientists Rush to Study Genome of Lethal E. coli
G E R M A N Y
Dangerous. A German researcher holds a culture of E. coli from a patient.
NEWS & ANALYSIS
Published by AAAS
Tuesday, 21 June, 2011

Comparative Genomics Workshop, KMUTT, Bangkok, Thailand 21 June, 2011 27
Optical Mapping First to Definitively Determine Deadly E. coli Strains in German Outbreak Are From a Single Source and Related to Earlier Outbreaks Whole Genome Analysis Adds Crucial Information to Better Understand and Manage the Ongoing E. Coli Outbreak in Germany
GAITHERSBURG, MD, June 13, 2011 -- OpGen, Inc. today announced successful completion of whole genome maps of the German outbreak E. coli isolates, performed in cooperation with the University Hospital Münster, Germany on the Argus™ Optical Mapping System. In less than 48 hours, the company completed de novo, whole genome maps of six isolates from the outbreak and reference strains, confirming that the outbreak E. coli are clonal or genetically identical, providing the strongest evidence to date of a single source for the outbreak. In addition, comparison of the optical maps clearly shows the relationship of the current outbreak to prior outbreak strains.
“Working with OpGen, Optical Mapping allowed us to quickly compare multiple isolates from this outbreak to demonstrate convincingly the clonality of the ongoing outbreak here in Germany,” commented Dr. Dag Harmsen, University Professor and Head of Research at the University Hospital Münster, Germany. “We believe that Optical Mapping is an important breakthrough technology for outbreak identification and clarification, which will enable our ability to intervene and make appropriate public health decisions earlier in future outbreaks.”
The OpGen Optical Mapping technology and ARGUS system provide rapid, accurate analysis of microbial genomes. Optical Mapping is the only technology that provides complete, ordered, high-resolution DNA maps of microorganisms like bacteria, yeast and fungi. Comparison of multiple outbreak and reference strain Optical Maps enables public health agencies and researchers to identify unique, specific, and conserved regions of the genome. As a result, when combined with sequencing technologies this powerful technology can identify the presence and location of important virulence, resistance and toxin genes in the bacterial genome. During this outbreak OpGen used Optical Maps to order and orient sequence contigs to produce a complete, whole genome sequence of the outbreak organism. In addition, combining sequence and Optical Map data definitively shows which virulence and toxin genes are on the chromosome and which are on plasmids, information which has implications for the development of diagnostic tests.
“OpGen’s Optical Mapping technology has added critical information to better understand the epidemiology of the ongoing E. coli outbreak in Germany and we look forward to publishing the full data set from our findings,” commented Doug White, chief executive officer of OpGen. “We believe that the rapid turnaround time and higher resolution whole genome data provided by optical maps offer an important new advance for outbreak response and identification of targets for the development of accurate, rapid molecular diagnostics. We will continue to work with public health officials in Germany and elsewhere to address these outbreaks and rapidly deliver the genomic information needed to make prompt decisions to protect public health.”
Tuesday, 21 June, 2011

Comparative Genomics Workshop, KMUTT, Bangkok, Thailand 21 June, 2011 28
Tuesday, 21 June, 2011

Questions:
●Will 1000x coverage, with 25 nt reads, be enough to assemble an E. coli genome completely to one piece?
●What is ‘third generation’ sequencing technology?
●What is the lower range of quality that is still ‘good enough’ to use in comparing genomes?
29
Tuesday, 21 June, 2011