genome biology and biotechnology 7. the phenome prof. m. zabeau department of plant systems biology...
Post on 19-Dec-2015
214 views
TRANSCRIPT

Genome Biology and Genome Biology and BiotechnologyBiotechnology
7. The phenome7. The phenome
Prof. M. ZabeauProf. M. ZabeauDepartment of Plant Systems Biology Department of Plant Systems Biology
Flanders Interuniversity Institute for Biotechnology (VIB)Flanders Interuniversity Institute for Biotechnology (VIB)University of GentUniversity of Gent
International course 2005International course 2005
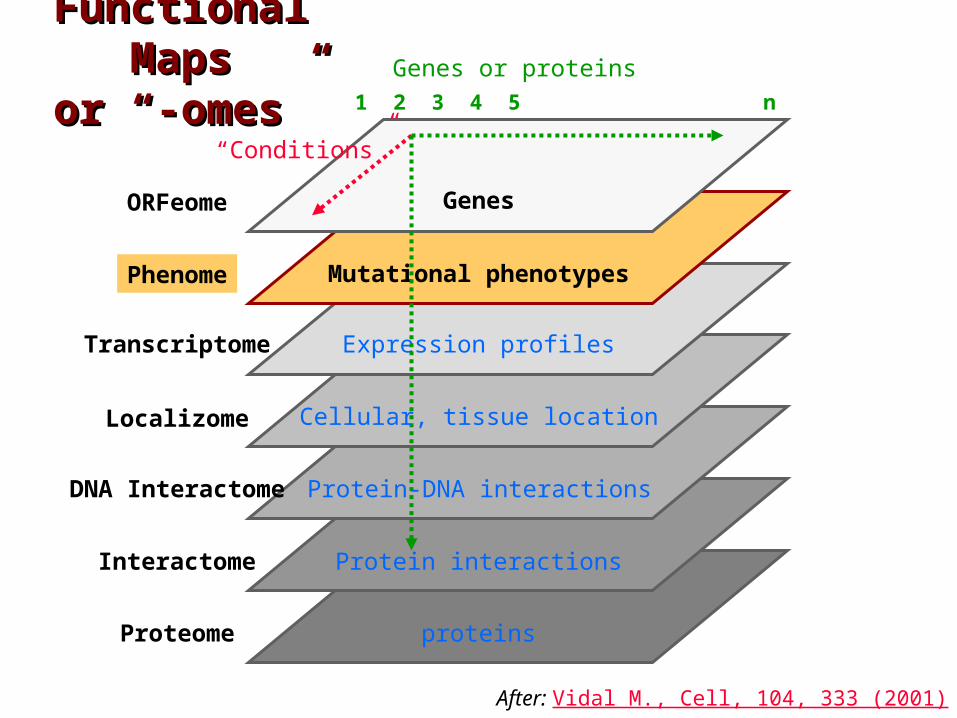
Functional Functional MapsMaps
or “-omes”or “-omes”
proteins
ORFeome
Localizome
Phenome
Transcriptome
Interactome
Proteome
Genes or proteins
Genes
Mutational phenotypes
Expression profiles
Protein interactions
1 2 3 4 5 n
DNA Interactome Protein-DNA interactions
“Conditions”
After: Vidal M., Cell, 104, 333 (2001)
Cellular, tissue location
The phenome: The phenome: genome-wide phenotypic genome-wide phenotypic analysisanalysis
¤ Classical (forward) genetic screens– Saturated mutagenesis to identify all the genes that exhibit a
specific phenotype– Draw back
• characterization of the gene through positional cloning is slow and laborious
¤ Phenomics platforms: Reverse genetics– Systematic alteration of gene function to identify the functions of
predicted genes– Advantage
• Identity of the gene is known beforehand
¤ Phenomics platforms• Transposon-based mutant libraries
– Extensively used in yeast and Arabidopsis• RNA interference (RNAi)-based mutant libraries
– the technology of choice for gene knock-outs
Large-scale analysis of the yeast genome Large-scale analysis of the yeast genome by transposon tagging and gene by transposon tagging and gene
disruption disruption
¤ Paper presents– a transposon-tagging strategy to perform large-scale analysis of
gene function in yeast to simultaneously study• phenotypes• gene expression • protein localization
– a large collection (>11,000 strains) of yeast mutants carrying a transposon inserted in genes
• Tagged 30% of all yeast genes
Ross-Macdonald et al., Nature 402: 413 (1999)
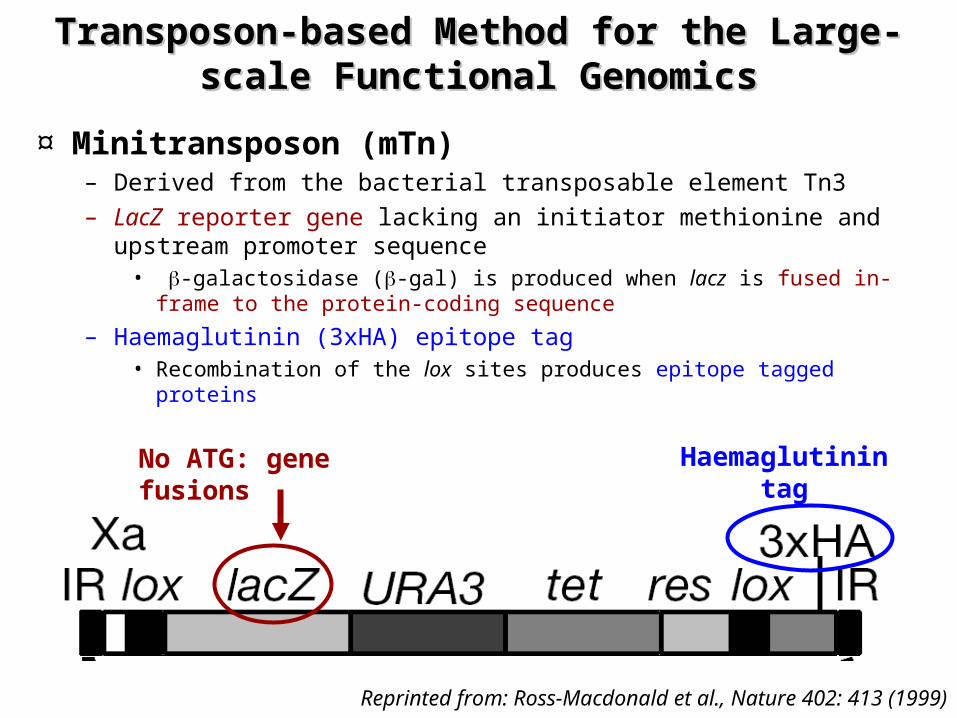
Transposon-based Method for the Large-Transposon-based Method for the Large-scale Functional Genomicsscale Functional Genomics
¤ Minitransposon (mTn) – Derived from the bacterial transposable element Tn3 – LacZ reporter gene lacking an initiator methionine and upstream
promoter sequence • -galactosidase (-gal) is produced when lacz is fused in-frame to the
protein-coding sequence
– Haemaglutinin (3xHA) epitope tag • Recombination of the lox sites produces epitope tagged proteins
Reprinted from: Ross-Macdonald et al., Nature 402: 413 (1999)
No ATG: gene fusions
Haemaglutinin tag
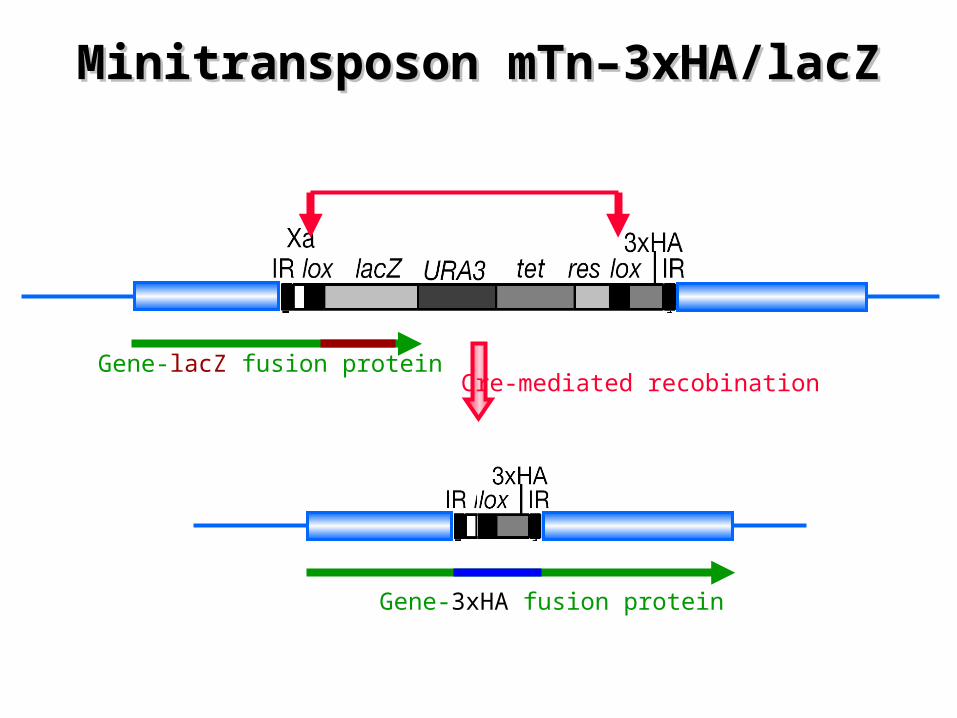
Minitransposon mTn–3xHA/lacZMinitransposon mTn–3xHA/lacZ
Gene-lacZ fusion proteinCre-mediated recobination
Gene-3xHA fusion protein
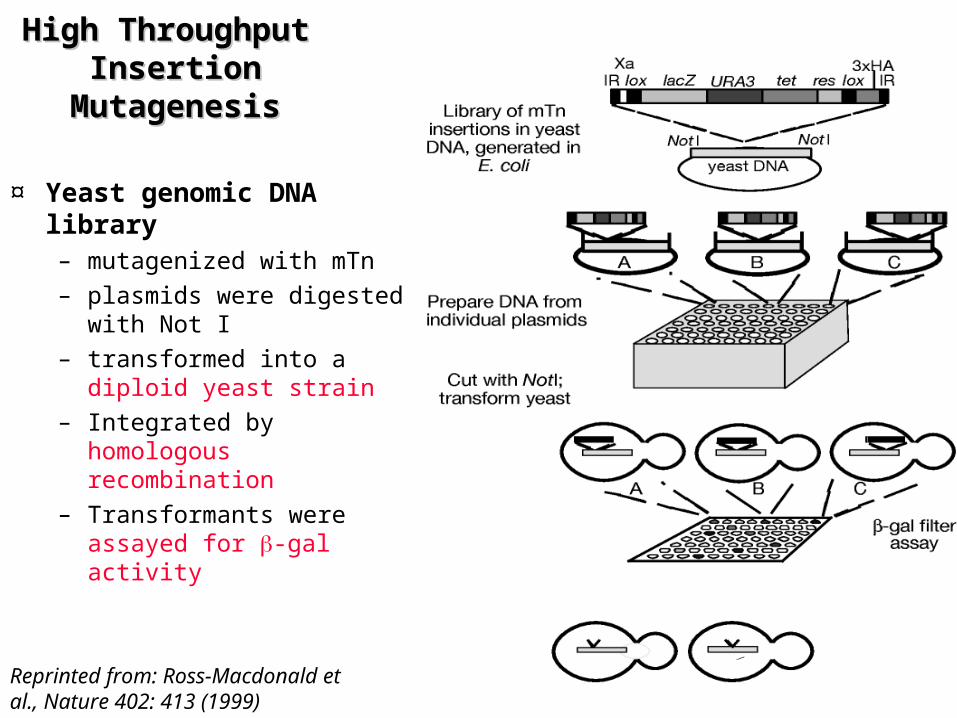
High Throughput High Throughput Insertion Insertion
MutagenesisMutagenesis
¤ Yeast genomic DNA library – mutagenized with mTn– plasmids were digested
with Not I – transformed into a diploid
yeast strain – Integrated by homologous
recombination– Transformants were
assayed for -gal activity
Reprinted from: Ross-Macdonald et al., Nature 402: 413 (1999)
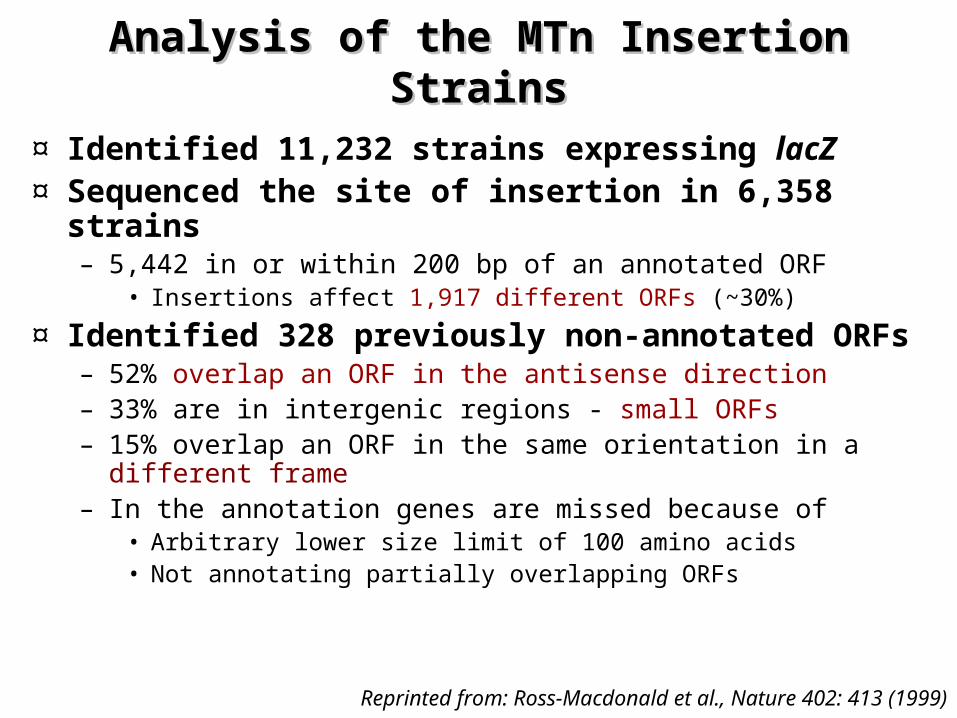
Analysis of the MTn Insertion StrainsAnalysis of the MTn Insertion Strains
¤ Identified 11,232 strains expressing lacZ ¤ Sequenced the site of insertion in 6,358 strains
– 5,442 in or within 200 bp of an annotated ORF• Insertions affect 1,917 different ORFs (~30%)
¤ Identified 328 previously non-annotated ORFs– 52% overlap an ORF in the antisense direction– 33% are in intergenic regions - small ORFs– 15% overlap an ORF in the same orientation in a different
frame– In the annotation genes are missed because of
• Arbitrary lower size limit of 100 amino acids• Not annotating partially overlapping ORFs
Reprinted from: Ross-Macdonald et al., Nature 402: 413 (1999)
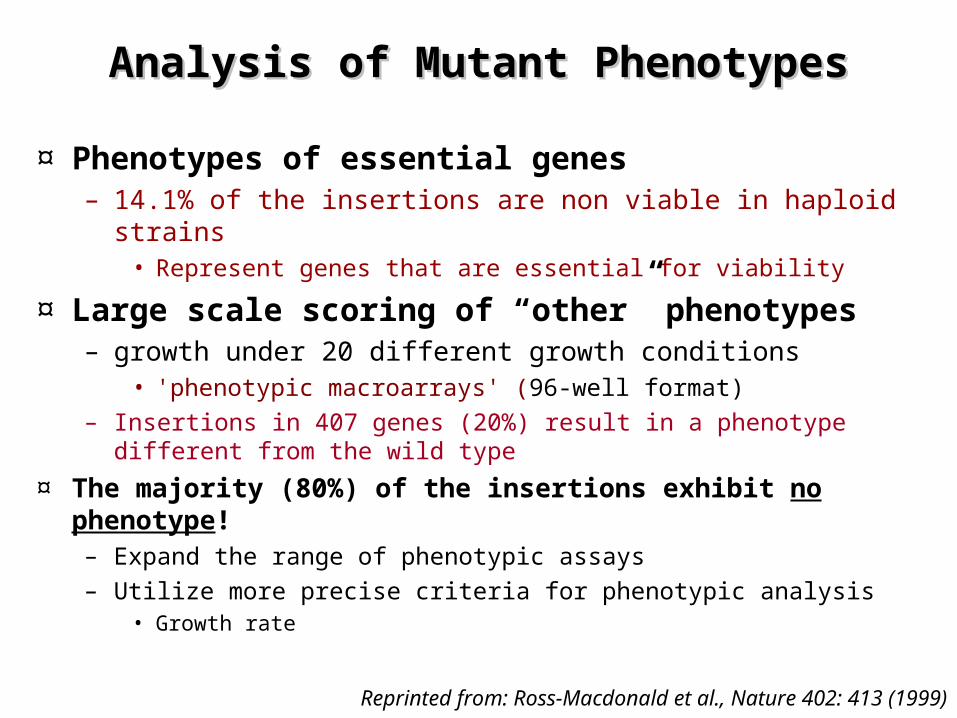
Analysis of Mutant PhenotypesAnalysis of Mutant Phenotypes
¤ Phenotypes of essential genes– 14.1% of the insertions are non viable in haploid strains
• Represent genes that are essential for viability
¤ Large scale scoring of “other” phenotypes – growth under 20 different growth conditions
• 'phenotypic macroarrays' (96-well format) – Insertions in 407 genes (20%) result in a phenotype different from
the wild type
¤ The majority (80%) of the insertions exhibit no phenotype!– Expand the range of phenotypic assays– Utilize more precise criteria for phenotypic analysis
• Growth rate
Reprinted from: Ross-Macdonald et al., Nature 402: 413 (1999)
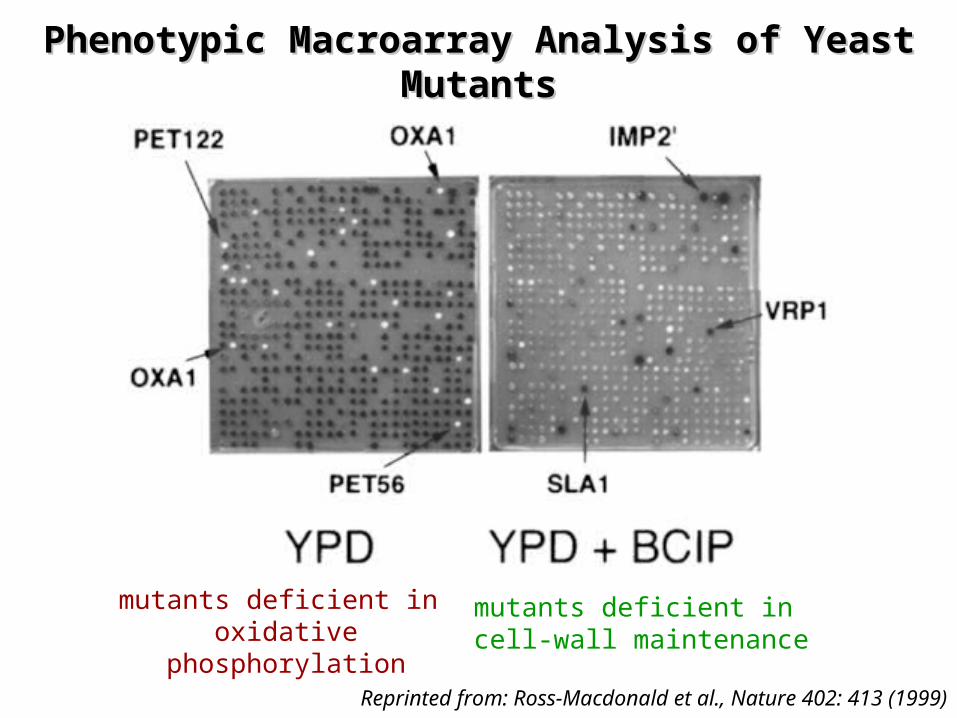
Phenotypic Macroarray Analysis of Yeast Phenotypic Macroarray Analysis of Yeast MutantsMutants
Reprinted from: Ross-Macdonald et al., Nature 402: 413 (1999)
mutants deficient in oxidative phosphorylation
mutants deficient in cell-wall maintenance
Genomic ScaleGenomic Scale Analysis of Analysis of PhenotypesPhenotypes
¤ Phenotypes observed – Expected phenotypes
• genes involved in microtubule functions - sensitive to benomyl
– Unexpected phenotypes• Genes involved in cell wall biogenesis - stress-related responses
– Pleiotropic phenotypes: observed in apparently unrelated assays
• Sensitivity to hydroxyurea, benomyl and calcofluor
¤ Pleitrophic mutants are the rule – Many mutants exhibit phenotypes in specific subsets of
conditions
¤ Mutants appear to ‘group' into discrete classes– “pheno-clusters” represent groups of mutants having
common disruption phenotypes
Reprinted from: Ross-Macdonald et al., Nature 402: 413 (1999)
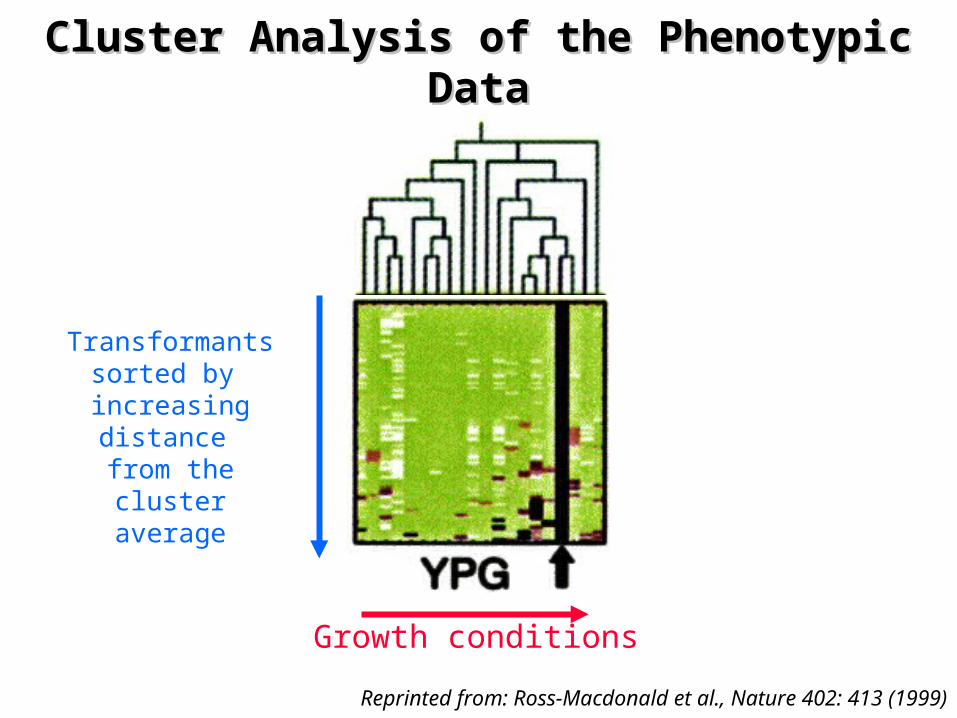
Cluster Analysis of the Phenotypic Cluster Analysis of the Phenotypic DataData
Reprinted from: Ross-Macdonald et al., Nature 402: 413 (1999)
Transformantssorted by increasingdistance from the
cluster average
Growth conditions
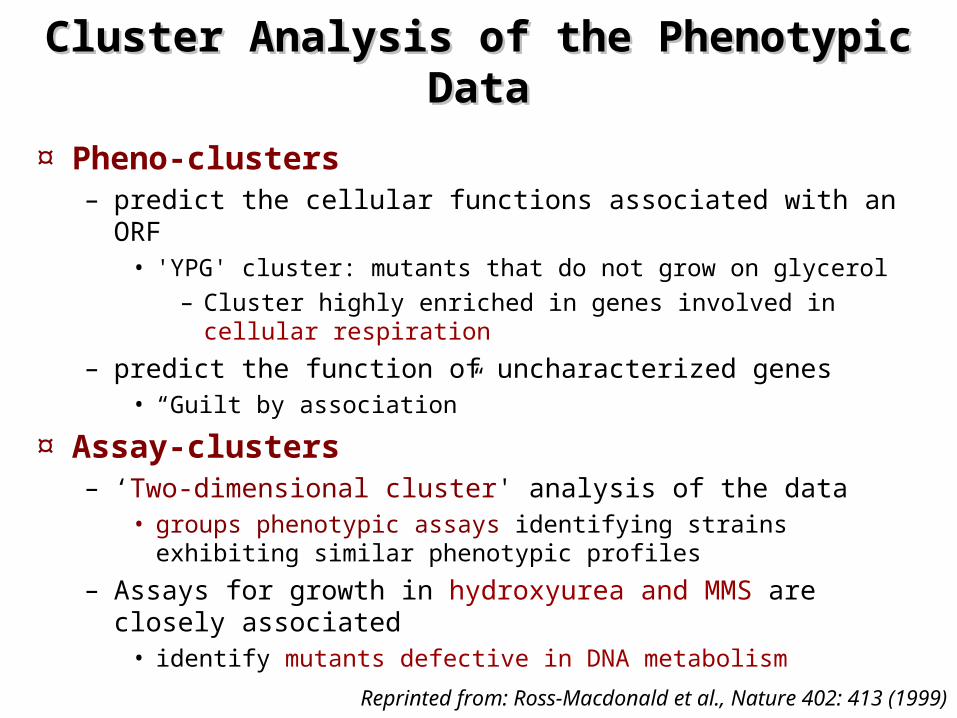
Cluster Analysis of the Phenotypic Cluster Analysis of the Phenotypic DataData
¤ Pheno-clusters– predict the cellular functions associated with an ORF
• 'YPG' cluster: mutants that do not grow on glycerol– Cluster highly enriched in genes involved in cellular
respiration
– predict the function of uncharacterized genes • “Guilt by association”
¤ Assay-clusters– ‘Two-dimensional cluster' analysis of the data
• groups phenotypic assays identifying strains exhibiting similar phenotypic profiles
– Assays for growth in hydroxyurea and MMS are closely associated
• identify mutants defective in DNA metabolism
Reprinted from: Ross-Macdonald et al., Nature 402: 413 (1999)
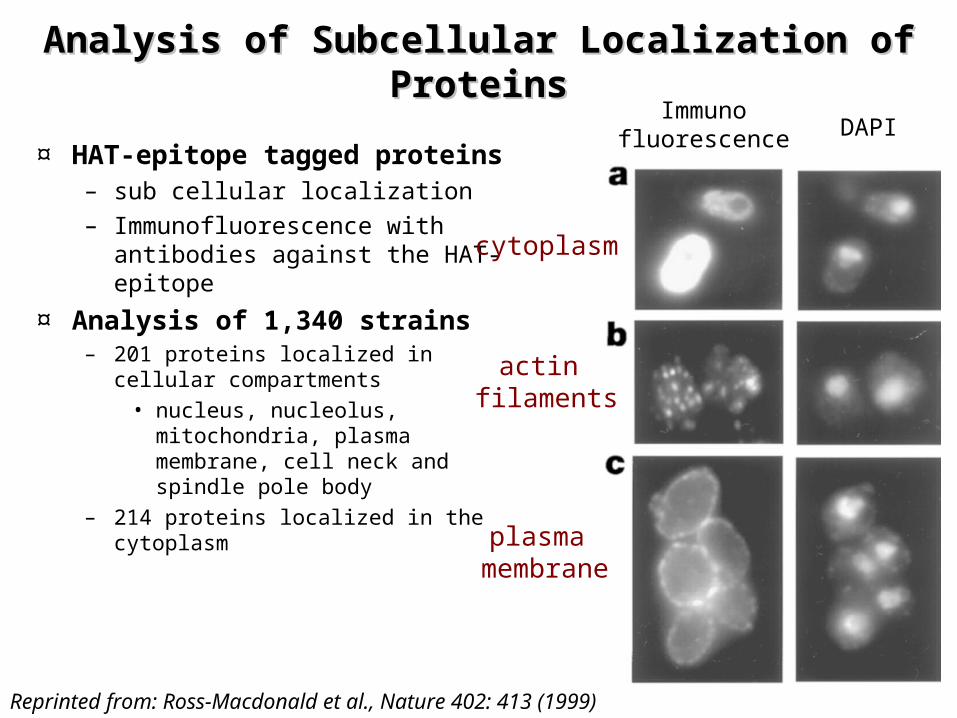
Analysis of Subcellular Localization of Analysis of Subcellular Localization of ProteinsProteins
¤ HAT-epitope tagged proteins– sub cellular localization– Immunofluorescence with
antibodies against the HAT-epitope
¤ Analysis of 1,340 strains– 201 proteins localized in cellular
compartments• nucleus, nucleolus,
mitochondria, plasma membrane, cell neck and spindle pole body
– 214 proteins localized in the cytoplasm
cytoplasm
actin filaments
plasma membrane
Immunofluorescence DAPI
Reprinted from: Ross-Macdonald et al., Nature 402: 413 (1999)
ConclusionsConclusions
¤ Insertion strategy generates in a single mutagenic event– reporter gene fusions– epitope-tagging constructs – insertion alleles
¤ Random approaches are intrinsically limited – in achieving saturation mutagenesis
• Small genes are less likely to be mutagenized than are large genes
• to mutagenize 90% of the yeast genes an additional 30,000 mTn insertions in yeast ORFs would be required
– This amounts to a 5 to 10 fold redundancy
– For multicellular organisms • collections of 100.000 to 250.000 insertions are needed
Reprinted from: Ross-Macdonald et al., Nature 402: 413 (1999)
RNA Interference (RNAi)RNA Interference (RNAi)
¤ Phenomenon first discovered in transgenic plants– “anti-sense mediated gene silencing”
• Anti-sense constructs reduce the expression of the cognate gene
– “co-suppresion”• Enhanced gene expression constructs occasionally lead to reduced
gene expression
¤ “related” phenomena were later found in C. elegans– Small temporal RNAs (stRNAs)
• responsible for the control of gene expression during development– stRNAs contain sequences complementary to specific target
mRNAs
¤ Broader significance of RNA-mediated gene regulation became apparent in recent years
RNA-mediated Gene RegulationRNA-mediated Gene Regulation
¤ Small regulatory RNAs are involved in two pathways for RNA-mediated gene regulation:– micro RNA pathway (miRNAs)
• responsible for the control of gene expression during development
– miRNAs contain sequences complementary to specific target mRNAs – specific silencing of one or more target genes
– Short interfering RNA pathway (siRNAs) • responsible for gene silencing by RNA interference (RNAi)
– dsRNA triggers destruction of a homologous mRNA that has the same sequence as one of the dsRNA strands
• guide DNA modifying (methylating) enzymes to corresponding genomic regions
– converting these regions to heterochromatin
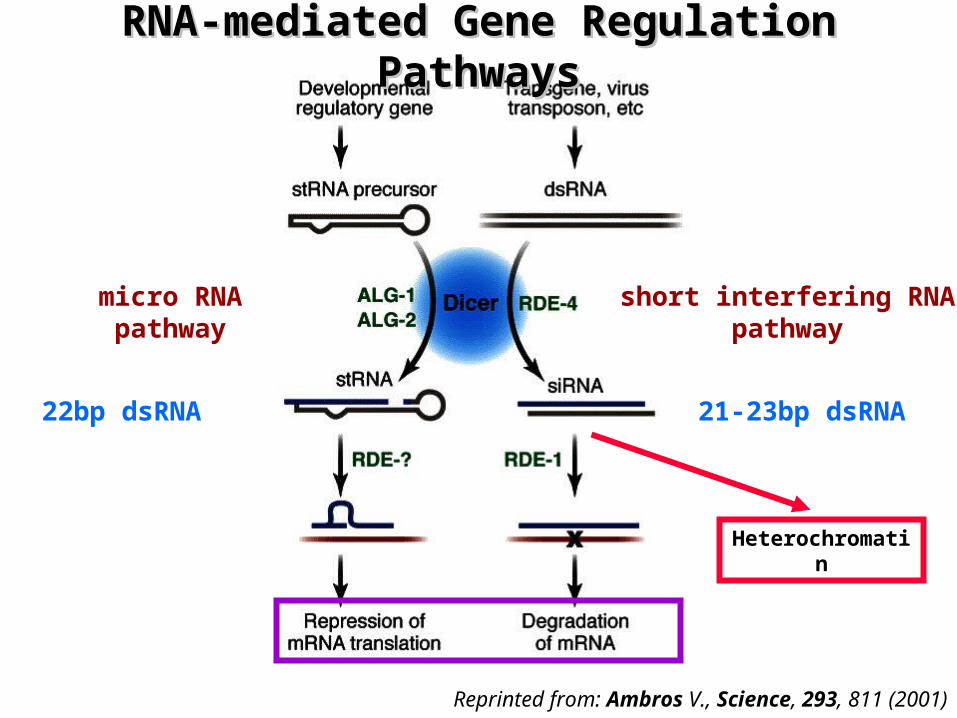
RNA-mediated Gene Regulation RNA-mediated Gene Regulation PathwaysPathways
Reprinted from: Ambros V., Science, 293, 811 (2001)
micro RNApathway
short interfering RNApathway
21-23bp dsRNA22bp dsRNA
Heterochromatin
RNA-mediated Gene RegulationRNA-mediated Gene Regulation
¤ RNA-mediated gene regulation is ancient in origin– Evolved before the divergence of plants and animals– Two pathways are interconnected and share molecular
components• Highly conserved nuclease Dicer• Small dsRNAs about 21 to 23 nucleotides in length
– RNA Interference (RNAi) is thought to be • a primitive genetic surveillance mechanism that protects cells
from viruses
¤ RNAi is well suited for large scale gene knockout– First pioneered in C. elegans– Now used in all model organisms
RNA Interference (RNAi) RNA Interference (RNAi) in C. in C. ElegansElegans
¤ Injection of anti-sense or double stranded RNA into cells – can be used to interfere with the function of endogenous
genes– results in silencing of the corresponding gene
¤ The RNA interference process involves – a catalytic or amplification component
• Only a few molecules of injected dsRNA are required
– injection of dsRNA into the extracellular body cavity in C. Elegans, results in silencing in the whole animal
¤ Experimentally, gene silencing is achieved in nematodes– Feeding worms E. coli expressing dsRNAs
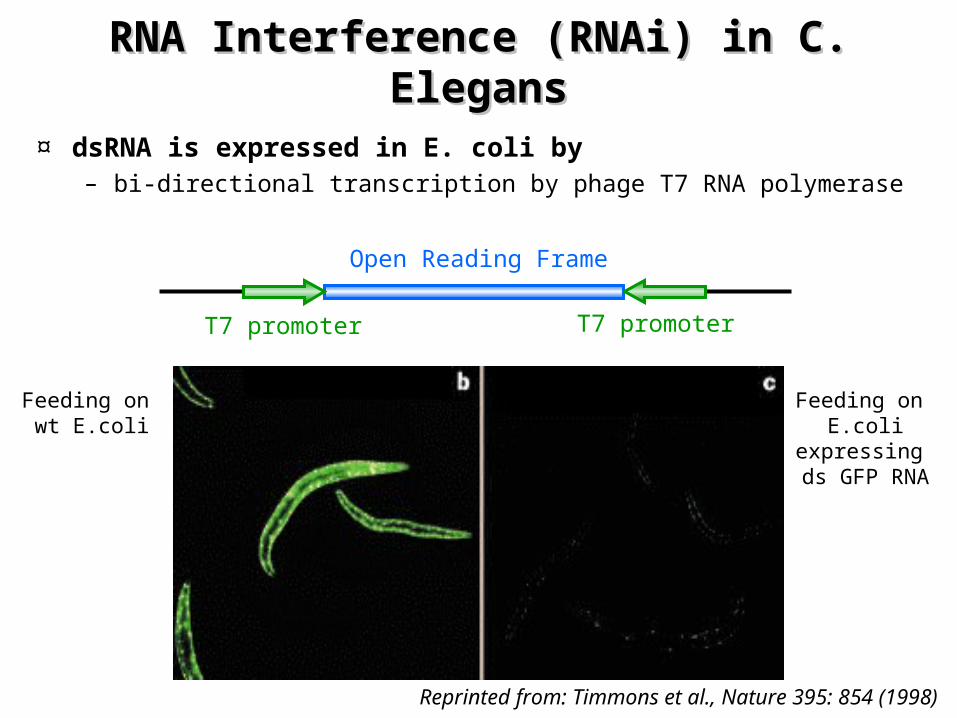
RNA Interference (RNAi) RNA Interference (RNAi) in C. in C. ElegansElegans
¤ dsRNA is expressed in E. coli by – bi-directional transcription by phage T7 RNA polymerase
Reprinted from: Timmons et al., Nature 395: 854 (1998)
T7 promoter T7 promoter
Open Reading Frame
Feeding on wt E.coli
Feeding on E.coli
expressing ds GFP RNA
Functional Genomic Analysis of C. Elegans Functional Genomic Analysis of C. Elegans Chromosome I by Systematic RNAiChromosome I by Systematic RNAi
¤ Paper reviews/presents– RNAi approach to systematically investigate
• loss-of-function phenotypes of predicted genes of C. Elegans chromosome I
– by feeding worms with E. coli bacteria that express double-stranded RNA
– Demonstrates that high-throughput genome-wide RNAi screens can be performed using a library of dsRNA-expressing bacteria
• The specificity of RNAi make it an ideal tool for investigating gene function
Fraser et al., Nature 408: 325 (2000)
Functional Analysis of Chromosome I Functional Analysis of Chromosome I GenesGenes
¤ Constructed a library of E.coli expressing dsRNA for – the predicted genes on chromosome I
• 2,416 predicted genes (87.3% of the predicted genes)
¤ Screened the library for detectable phenotypes– L3–L4 stage worms were were fed for 72 h at 15 °C on
bacterial cultures for each targeted gene– Phenotypes of adults and progeny were scored
• Embryonic lethal (Emb) – 10–100% embryonic lethality
• Sterile (Ste) – brood size of <= 10 (wild-type worms typically give > 50)
• Progeny sterile (Stp) – brood size of <= to 10 in the progeny of fed worms
Reprinted from: Fraser et al., Nature 408: 325 (2000)
Functional Analysis of Chromosome I Functional Analysis of Chromosome I GenesGenes
¤ Assigned a phenotype to 13.9% of the genes– Confirmed 90% of the known embryonic lethal genes– number of genes with known phenotypes increased from 70
to 378– Not all genes give a RNAi phenotype
• Did not find phenotypes for some previously characterized genes
– genes involved in neuronal function
¤ Highly conserved genes are more likely to have an RNAi phenotype than genes that show no conservation – >72% of genes with an RNAi phenotype have a Drosophila
match
Reprinted from: Fraser et al., Nature 408: 325 (2000)
Functional Analysis of Chromosome I GenesFunctional Analysis of Chromosome I Genes
¤ Embryonic lethal (Emb) mutants: essential genes– genes involved in the basal cellular machinery:
• RNA-binding proteins, chromosome condensation and separation, components of signal transduction pathways
– genes involved in basic metabolic processes– largest class: >60% of the mutants
¤ Uncoordinated and post-embryonic mutants – High proportion (30% to 40%) of genes of unknown function
• genes that regulate the development are still largely unknown
Reprinted from: Fraser et al., Nature 408: 325 (2000)
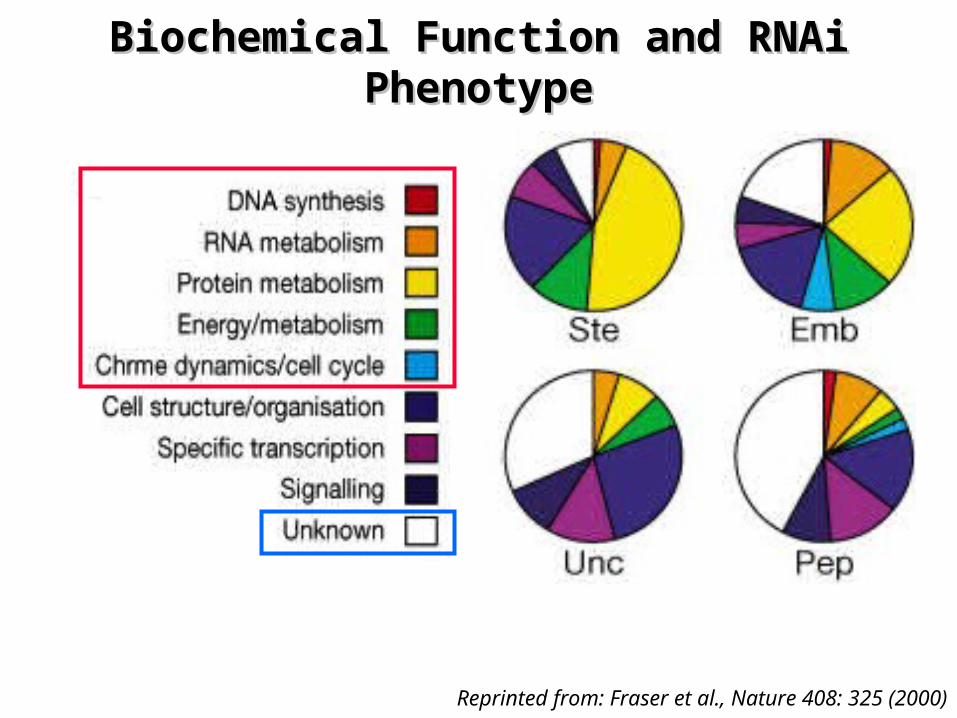
Biochemical Function and RNAi Biochemical Function and RNAi PhenotypePhenotype
Reprinted from: Fraser et al., Nature 408: 325 (2000)
Toward Improving Toward Improving Caenorhabditis elegansCaenorhabditis elegans Phenome Mapping With an ORFeome-Based Phenome Mapping With an ORFeome-Based
RNAi Library RNAi Library
¤ Paper presents– the use of the C. elegans ORFeome as a starting point for
high throughput RNAi with enhanced flexibility• increasing the possibilities for phenome mapping in C.
elegans– additional HT-RNAi libraries can be generated to perform
gene knockdowns under various conditions
Rual et. al., Genome Research 14:2162-2168(2004)
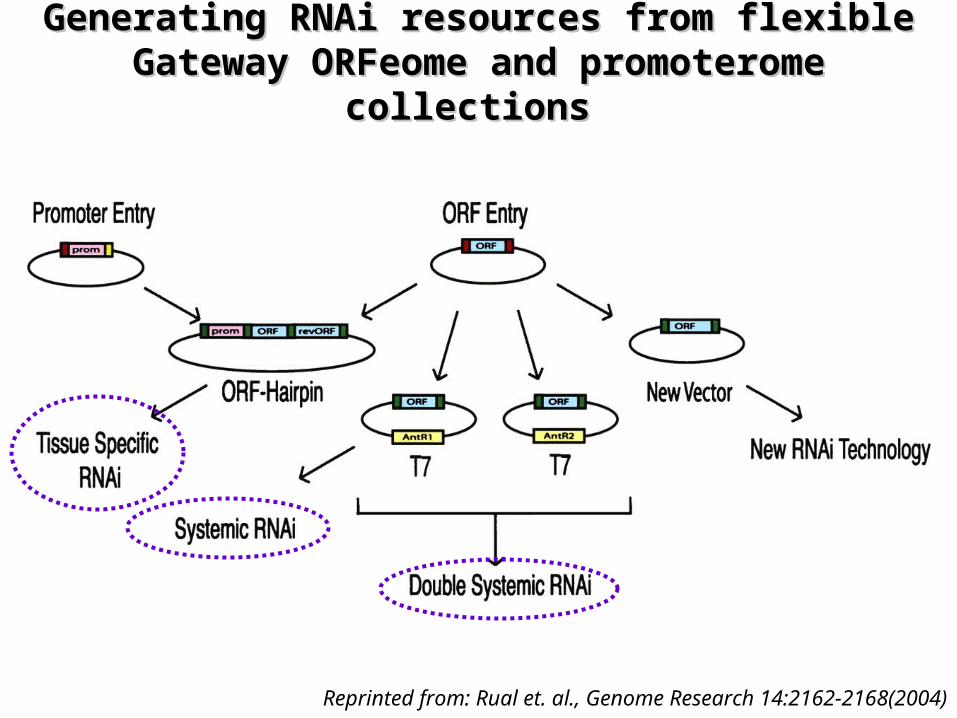
Generating RNAi resources from flexible Generating RNAi resources from flexible Gateway ORFeome and promoterome Gateway ORFeome and promoterome
collections collections
Reprinted from: Rual et. al., Genome Research 14:2162-2168(2004)
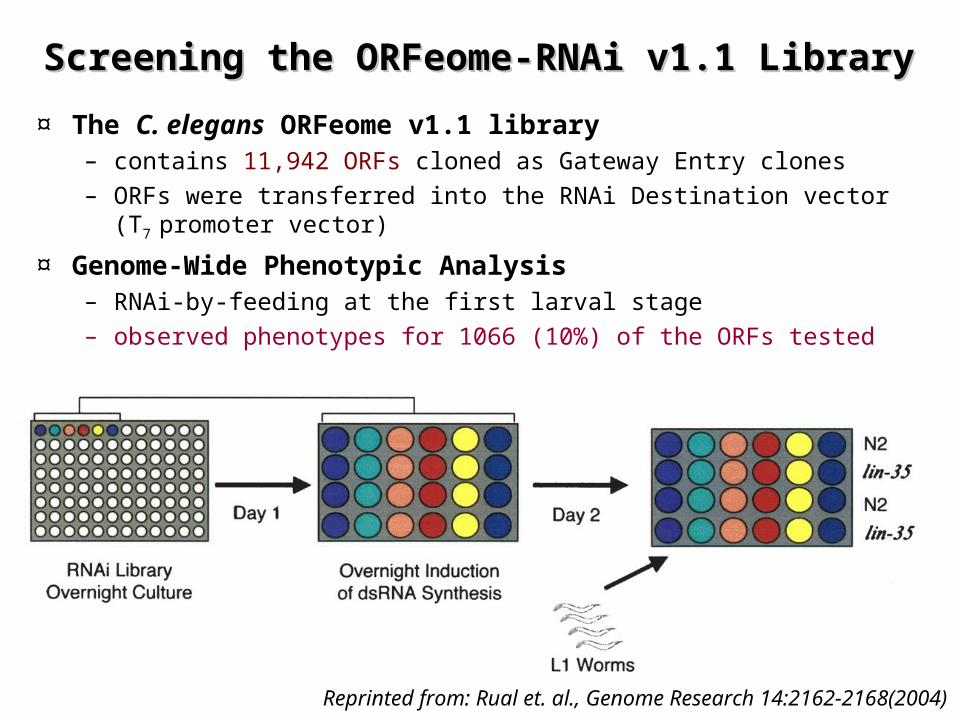
Screening the ORFeome-RNAi v1.1 LibraryScreening the ORFeome-RNAi v1.1 Library
¤ The C. elegans ORFeome v1.1 library – contains 11,942 ORFs cloned as Gateway Entry clones
– ORFs were transferred into the RNAi Destination vector (T7
promoter vector)
¤ Genome-Wide Phenotypic Analysis– RNAi-by-feeding at the first larval stage– observed phenotypes for 1066 (10%) of the ORFs tested
Reprinted from: Rual et. al., Genome Research 14:2162-2168(2004)
Genome-Wide RNAi Analysis of Growth Genome-Wide RNAi Analysis of Growth and Viability in and Viability in DrosophilaDrosophila Cells Cells
¤ Paper presents– a high-throughput RNA-interference (RNAi) screen of nearly
all (91%) predicted Drosophila genes – Using in Drosophila cultured cells to characterize genes in
cell growth and viability• Treatment of cells with dsRNA leads to detect specific
phenotypes • Systematic screen for loss-of-function phenotypes• Genome-wide RNAi performed on two embryonic cell lines
– Established a quantitative assay of cell death: z-score
Boutros et. al., Science, 303, 832-835(2004)
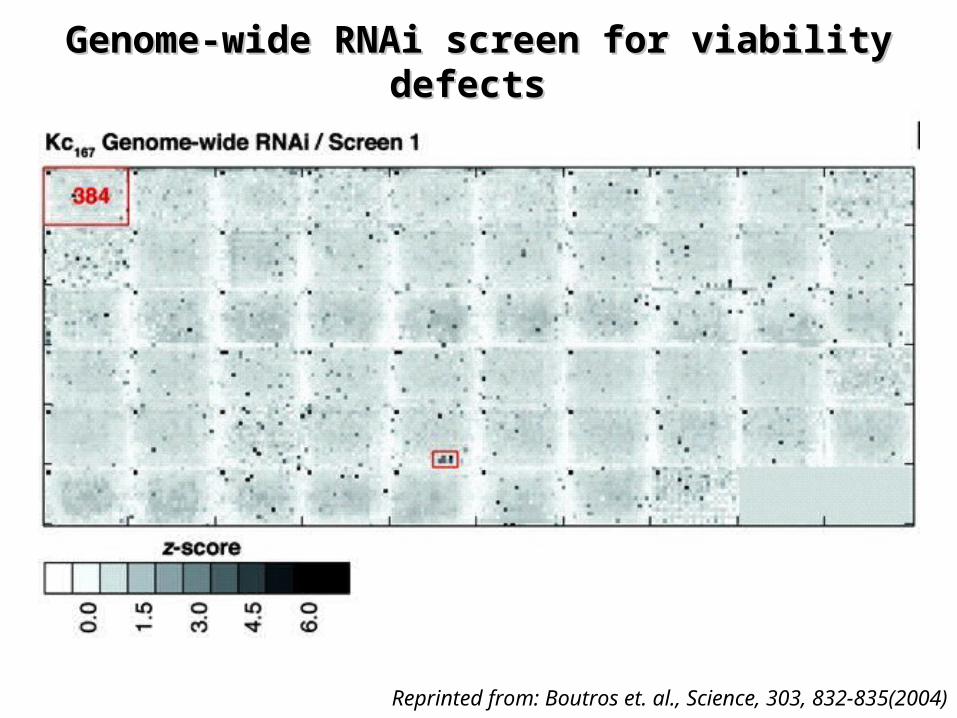
Genome-wide RNAi screen for viability Genome-wide RNAi screen for viability defects defects
Reprinted from: Boutros et. al., Science, 303, 832-835(2004)
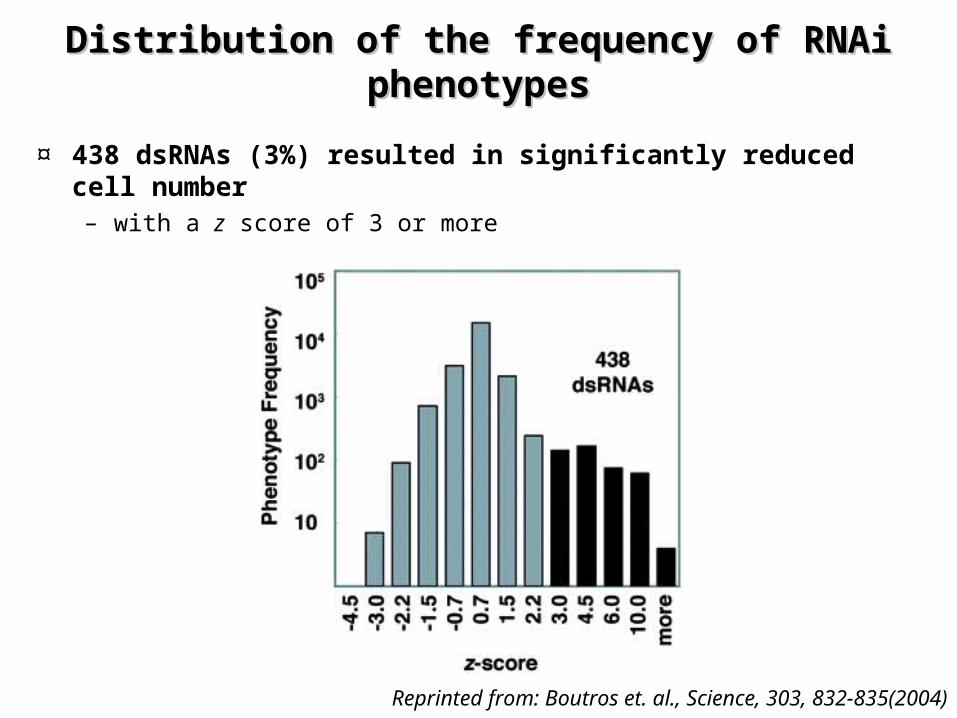
Distribution of the frequency of RNAi Distribution of the frequency of RNAi phenotypesphenotypes
¤ 438 dsRNAs (3%) resulted in significantly reduced cell number – with a z score of 3 or more
Reprinted from: Boutros et. al., Science, 303, 832-835(2004)
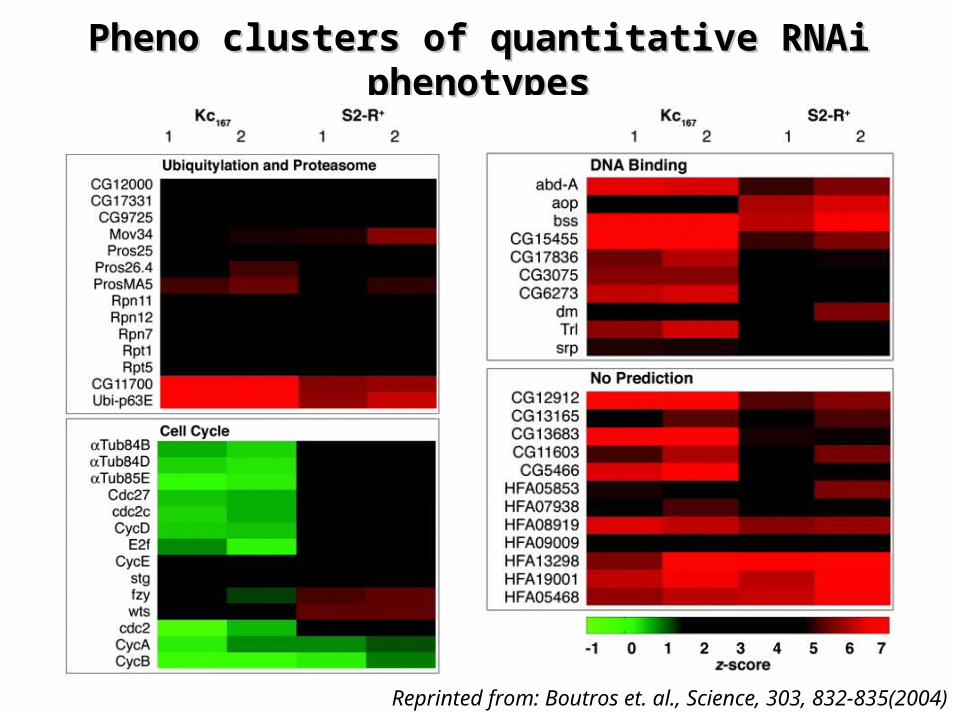
Pheno clusters of quantitative RNAi Pheno clusters of quantitative RNAi phenotypesphenotypes
Reprinted from: Boutros et. al., Science, 303, 832-835(2004)
Genome-wide RNAi screening in Genome-wide RNAi screening in ArabidopsisArabidopsis
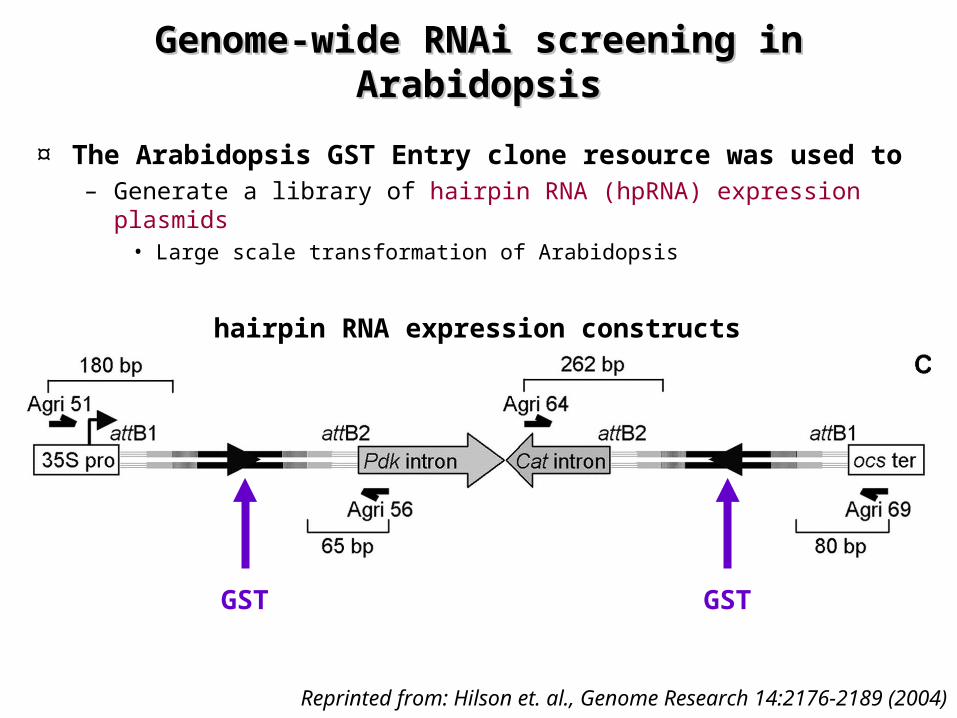
¤ The Arabidopsis GST Entry clone resource was used to – Generate a library of hairpin RNA (hpRNA) expression plasmids
• Large scale transformation of Arabidopsis
Reprinted from: Hilson et. al., Genome Research 14:2176-2189 (2004)
GST GST
hairpin RNA expression constructs
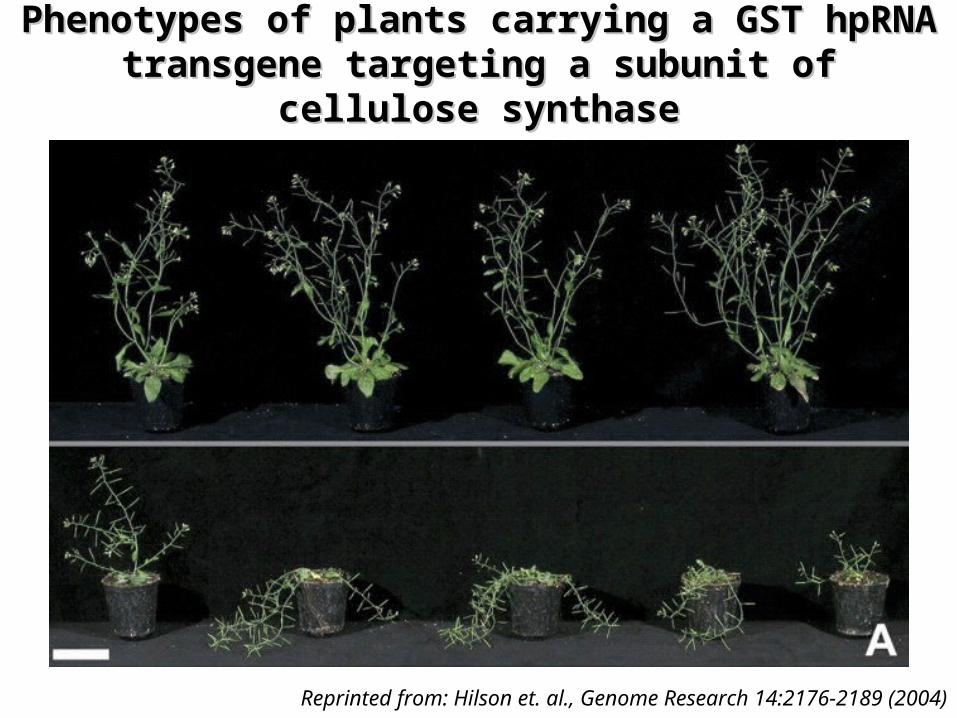
Phenotypes of plants carrying a GST hpRNA Phenotypes of plants carrying a GST hpRNA transgene targeting a subunit of cellulose transgene targeting a subunit of cellulose
synthasesynthase
Reprinted from: Hilson et. al., Genome Research 14:2176-2189 (2004)
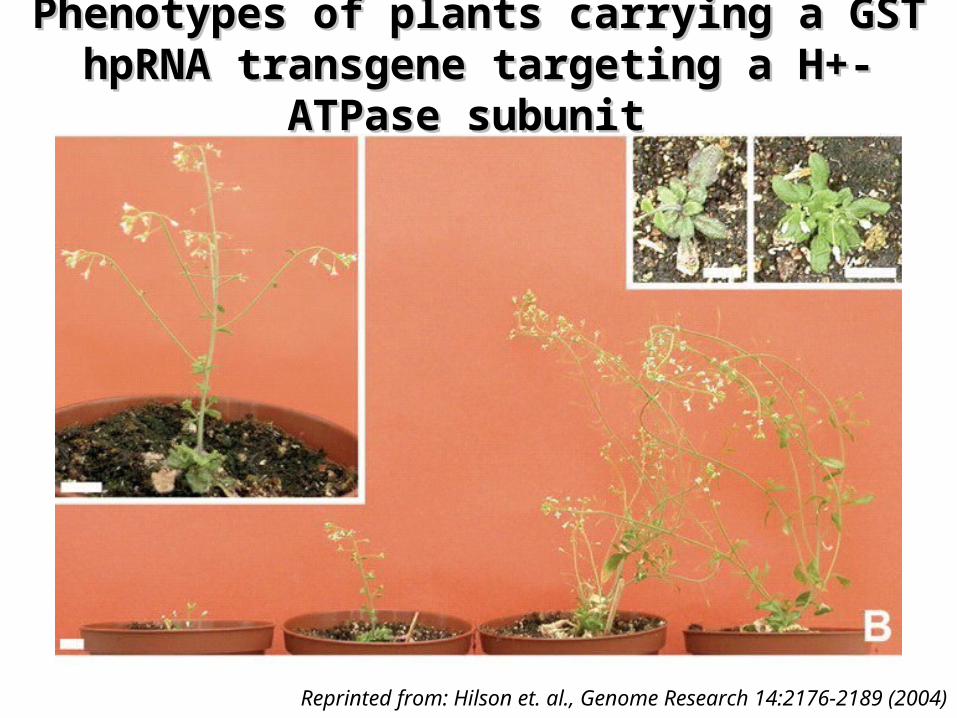
Phenotypes of plants carrying a GST Phenotypes of plants carrying a GST hpRNA transgene targeting a H+-hpRNA transgene targeting a H+-
ATPase subunit ATPase subunit
Reprinted from: Hilson et. al., Genome Research 14:2176-2189 (2004)
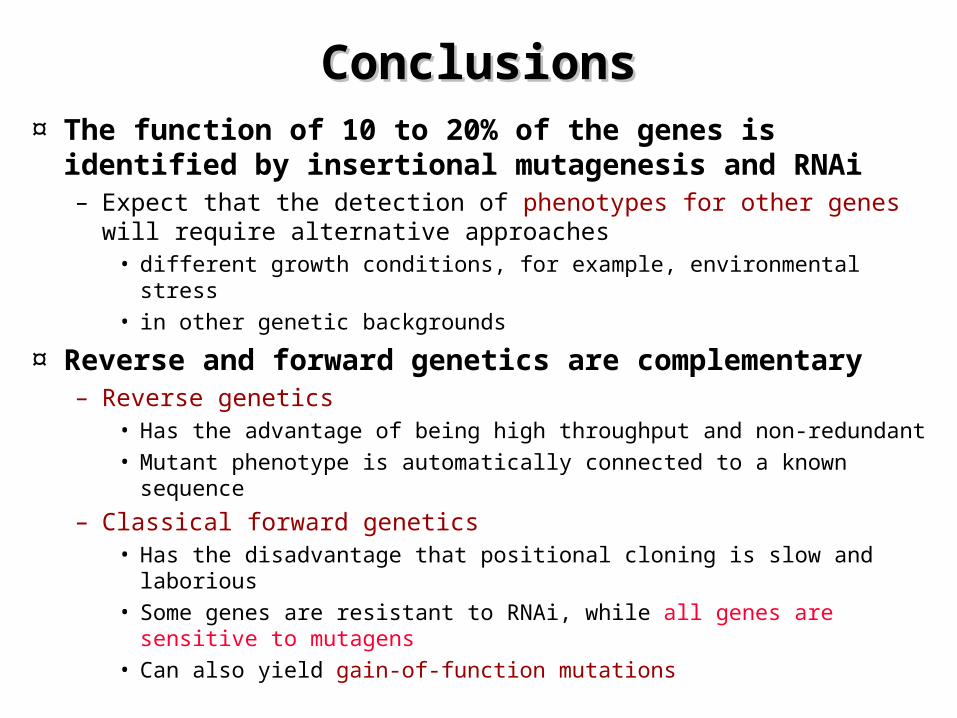
ConclusionsConclusions¤ The function of 10 to 20% of the genes is
identified by insertional mutagenesis and RNAi– Expect that the detection of phenotypes for other genes will
require alternative approaches • different growth conditions, for example, environmental stress• in other genetic backgrounds
¤ Reverse and forward genetics are complementary– Reverse genetics
• Has the advantage of being high throughput and non-redundant• Mutant phenotype is automatically connected to a known sequence
– Classical forward genetics • Has the disadvantage that positional cloning is slow and laborious • Some genes are resistant to RNAi, while all genes are sensitive to
mutagens • Can also yield gain-of-function mutations
Genome Biology and Genome Biology and BiotechnologyBiotechnology
8. The transcriptome 8. The transcriptome
International course 2005International course 2005
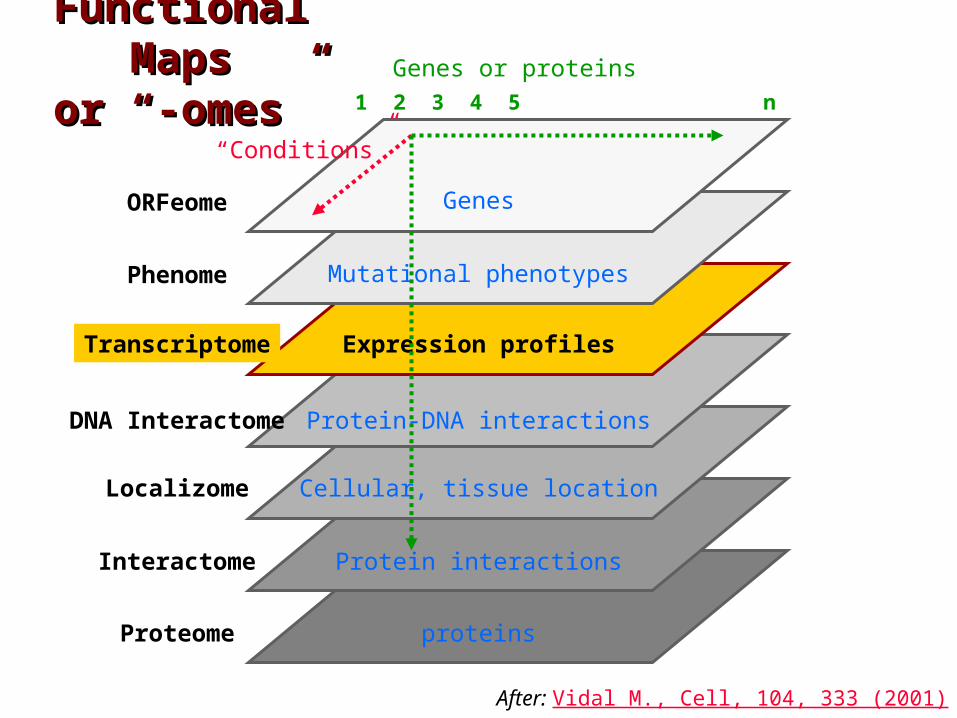
Functional Functional MapsMaps
or “-omes”or “-omes”
proteins
ORFeome
Localizome
Phenome
Transcriptome
Interactome
Proteome
Genes or proteins
Genes
Mutational phenotypes
Expression profiles
Protein interactions
1 2 3 4 5 n
DNA Interactome Protein-DNA interactions
“Conditions”
After: Vidal M., Cell, 104, 333 (2001)
Cellular, tissue location
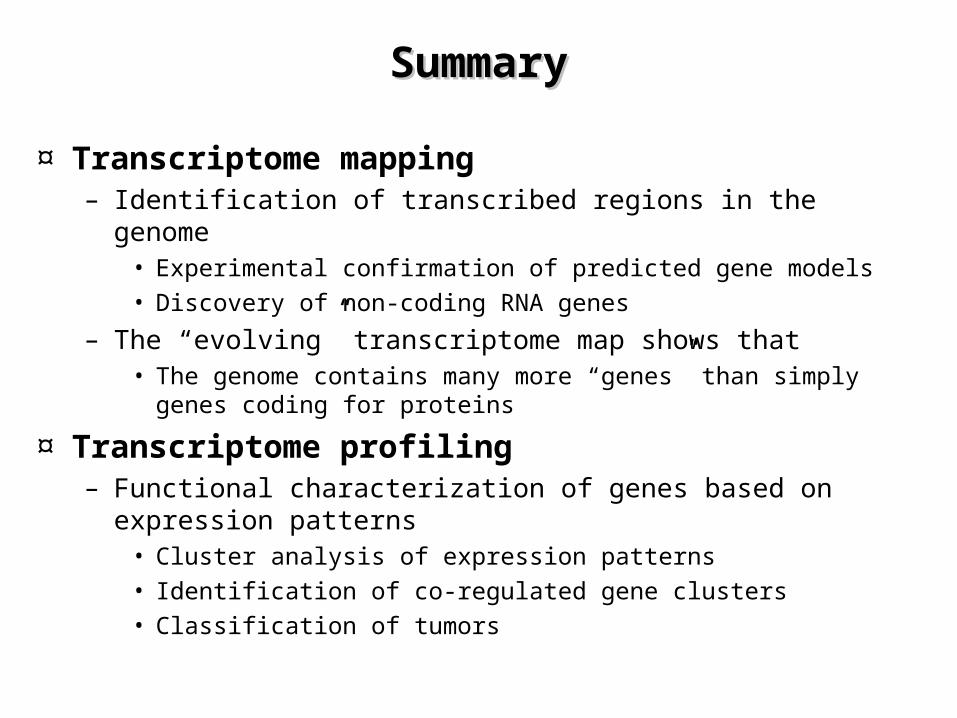
SummarySummary
¤ Transcriptome mapping– Identification of transcribed regions in the genome
• Experimental confirmation of predicted gene models• Discovery of non-coding RNA genes
– The “evolving” transcriptome map shows that• The genome contains many more “genes” than simply genes
coding for proteins
¤ Transcriptome profiling– Functional characterization of genes based on expression
patterns• Cluster analysis of expression patterns• Identification of co-regulated gene clusters• Classification of tumors
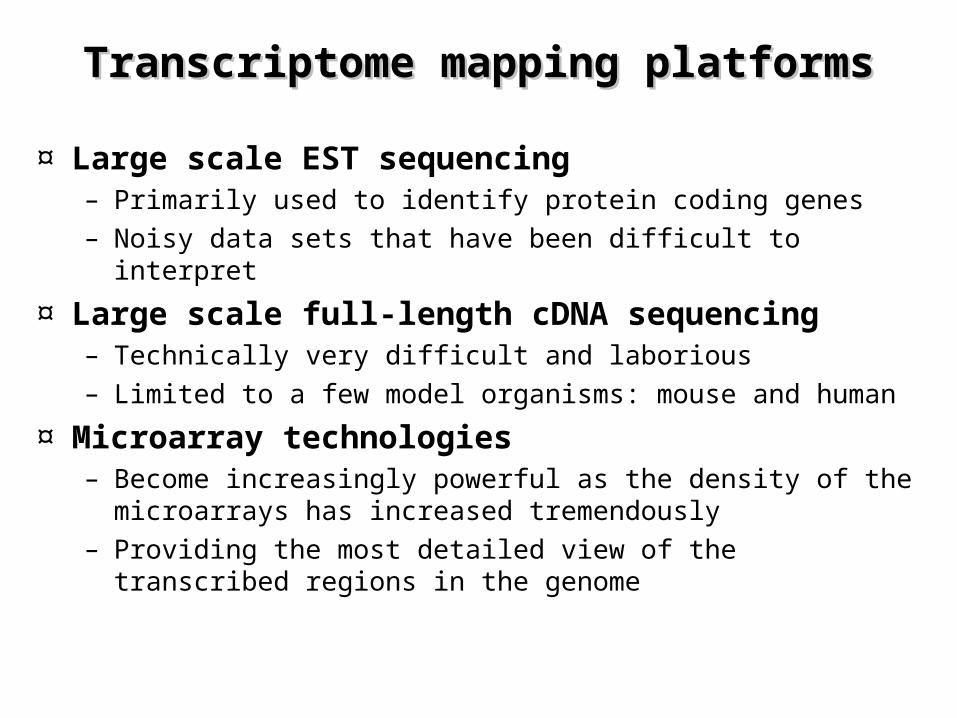
Transcriptome mapping platformsTranscriptome mapping platforms
¤ Large scale EST sequencing– Primarily used to identify protein coding genes– Noisy data sets that have been difficult to interpret
¤ Large scale full-length cDNA sequencing– Technically very difficult and laborious– Limited to a few model organisms: mouse and human
¤ Microarray technologies– Become increasingly powerful as the density of the
microarrays has increased tremendously– Providing the most detailed view of the transcribed regions
in the genome
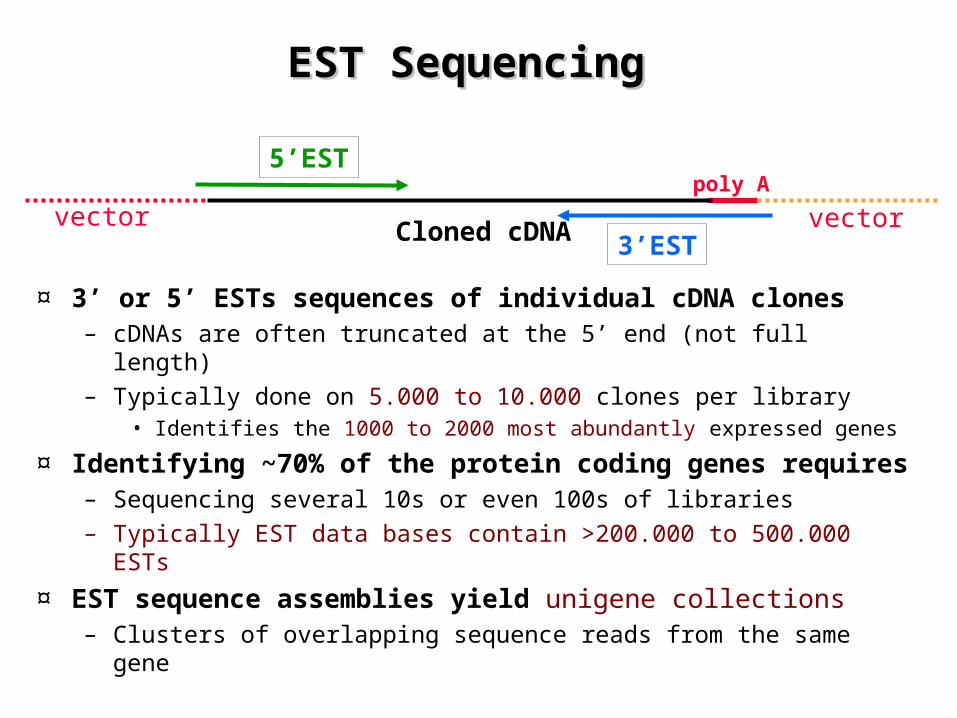
EST Sequencing EST Sequencing
¤ 3’ or 5’ ESTs sequences of individual cDNA clones– cDNAs are often truncated at the 5’ end (not full length)– Typically done on 5.000 to 10.000 clones per library
• Identifies the 1000 to 2000 most abundantly expressed genes
¤ Identifying ~70% of the protein coding genes requires– Sequencing several 10s or even 100s of libraries– Typically EST data bases contain >200.000 to 500.000 ESTs
¤ EST sequence assemblies yield unigene collections– Clusters of overlapping sequence reads from the same gene
5’EST
3’EST
poly A
Cloned cDNAvector vector
Full length cDNA SequencingFull length cDNA Sequencing
¤ Technically very challenging– Special techniques for selecting full length cDNA clones
• 5’ end (Capped end) selection• Aggressive subtraction/normalization required to cover “all” genes
¤ Mouse and human “FANTOM” full length cDNA libraries– Large scale sequencing of >> million 5' end and 3'-end sequences – Complete sequencing of >100.000 full length cDNA clones
¤ Full length cDNAs define transcriptional units (TU)– segments of the genome from which transcripts are generated– TUs are DNA strand-specific, and are typically bounded by
promoters at one end and termination sequences at the other
Reprinted from: The FANTOM consortium, Nature 420, 563 - 573 (2002)
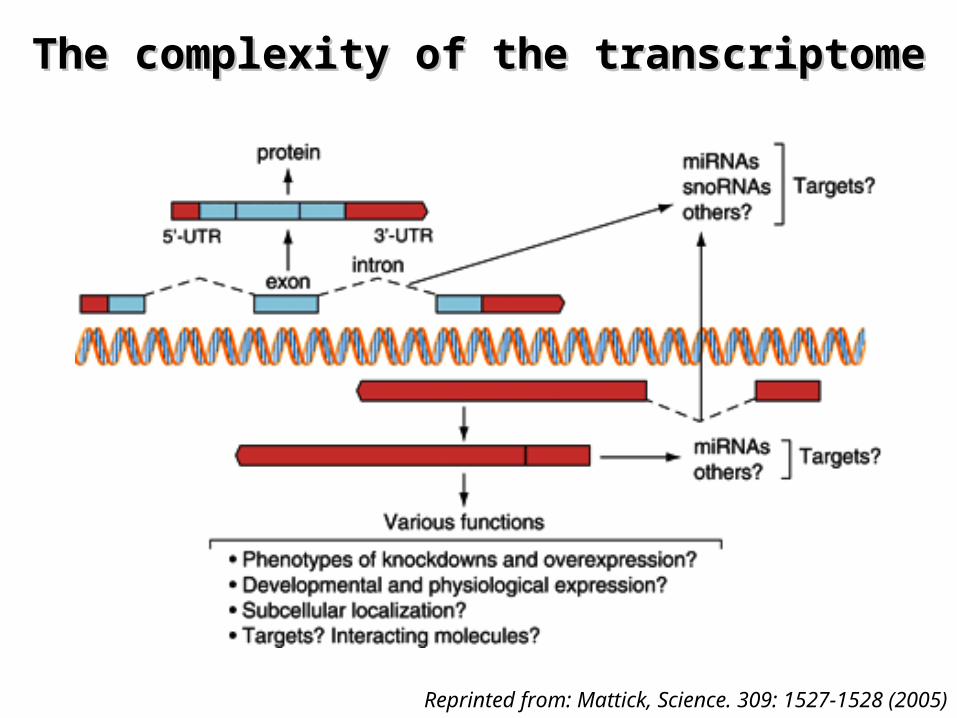
Transcriptional UnitsTranscriptional Units
¤ Transcriptional units (TUs) comprise – Protein coding transcripts (genes) and non-coding transcripts
(genes?)
– Alternatively spliced transcripts– Transcripts with alternative 5' start– Transcripts with alternative 3' ends
¤ Frequently transcripts are made from both strands– Sense and antisense transcripts
• are considered to be made from separate TUs
¤ The transcriptome is much more complex than we have always thought!
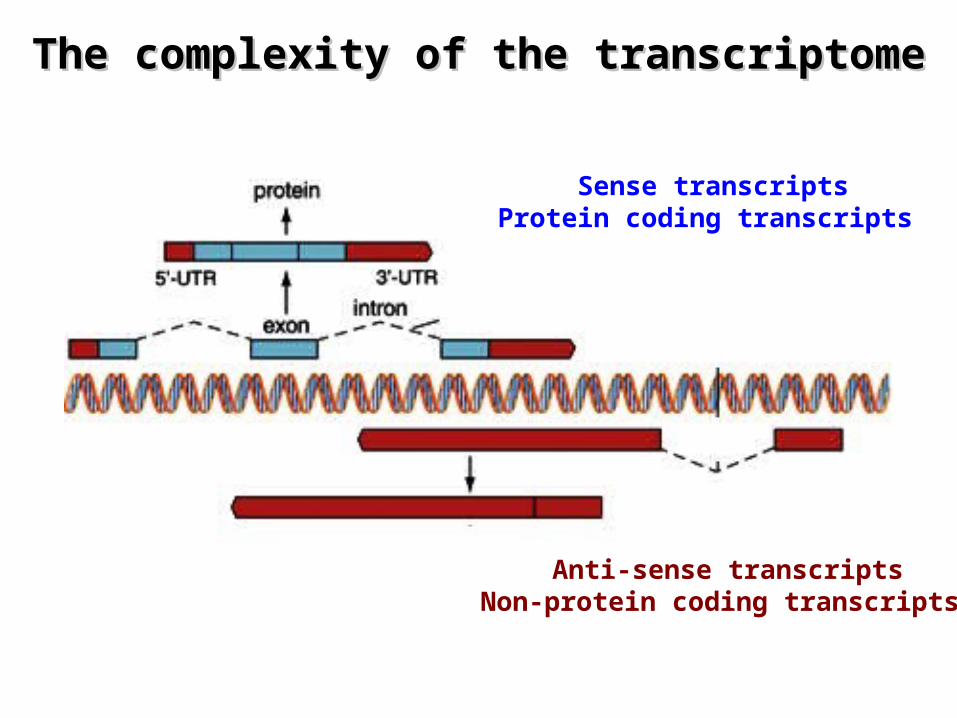
The complexity of the transcriptomeThe complexity of the transcriptome
Sense transcriptsProtein coding transcripts
Anti-sense transcriptsNon-protein coding transcripts
Reprinted from: The FANTOM consortium, Nature 420, 563 - 573 (2002)
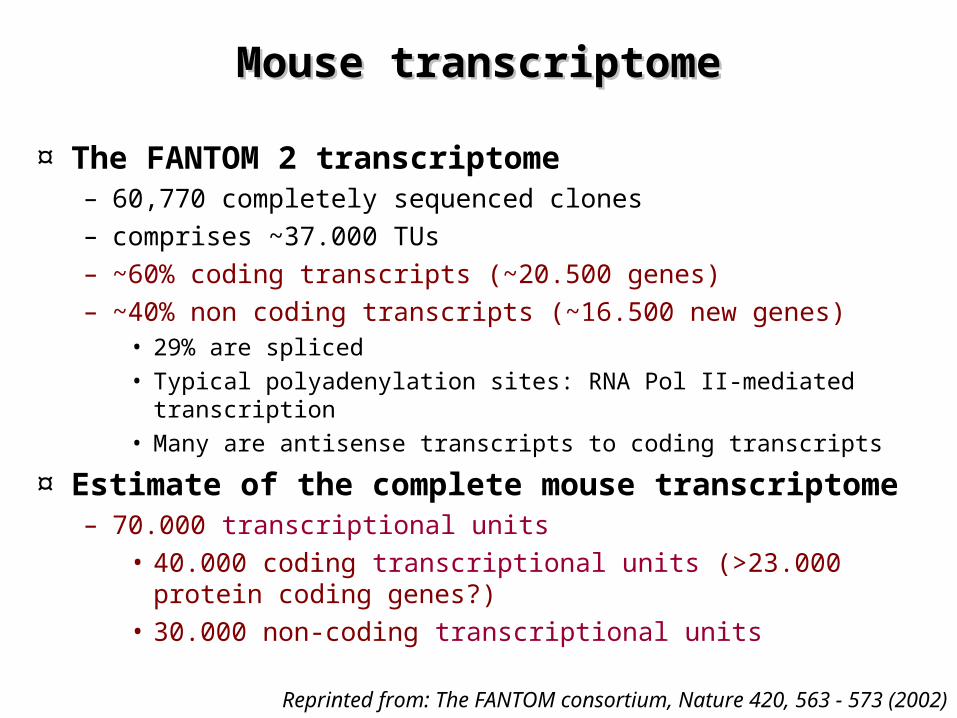
Mouse transcriptomeMouse transcriptome
¤ The FANTOM 2 transcriptome – 60,770 completely sequenced clones– comprises ~37.000 TUs– ~60% coding transcripts (~20.500 genes) – ~40% non coding transcripts (~16.500 new genes)
• 29% are spliced• Typical polyadenylation sites: RNA Pol II-mediated transcription• Many are antisense transcripts to coding transcripts
¤ Estimate of the complete mouse transcriptome– 70.000 transcriptional units
• 40.000 coding transcriptional units (>23.000 protein coding genes?)
• 30.000 non-coding transcriptional units
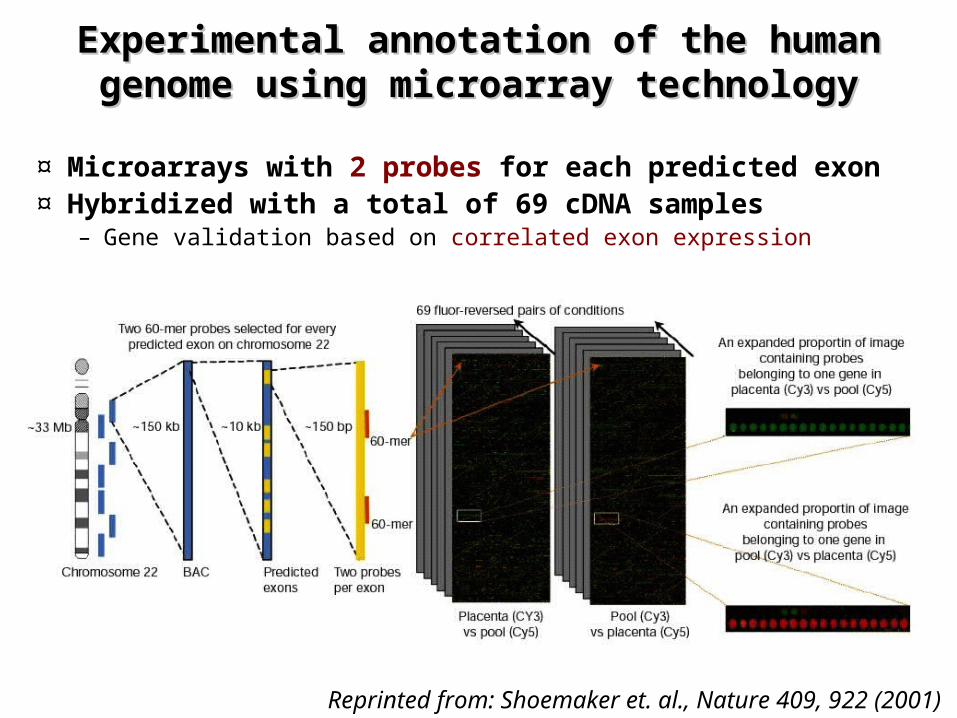
Experimental annotation of the human Experimental annotation of the human genome using microarray technologygenome using microarray technology
¤ Microarrays with 2 probes for each predicted exon¤ Hybridized with a total of 69 cDNA samples
– Gene validation based on correlated exon expression
Reprinted from: Shoemaker et. al., Nature 409, 922 (2001)
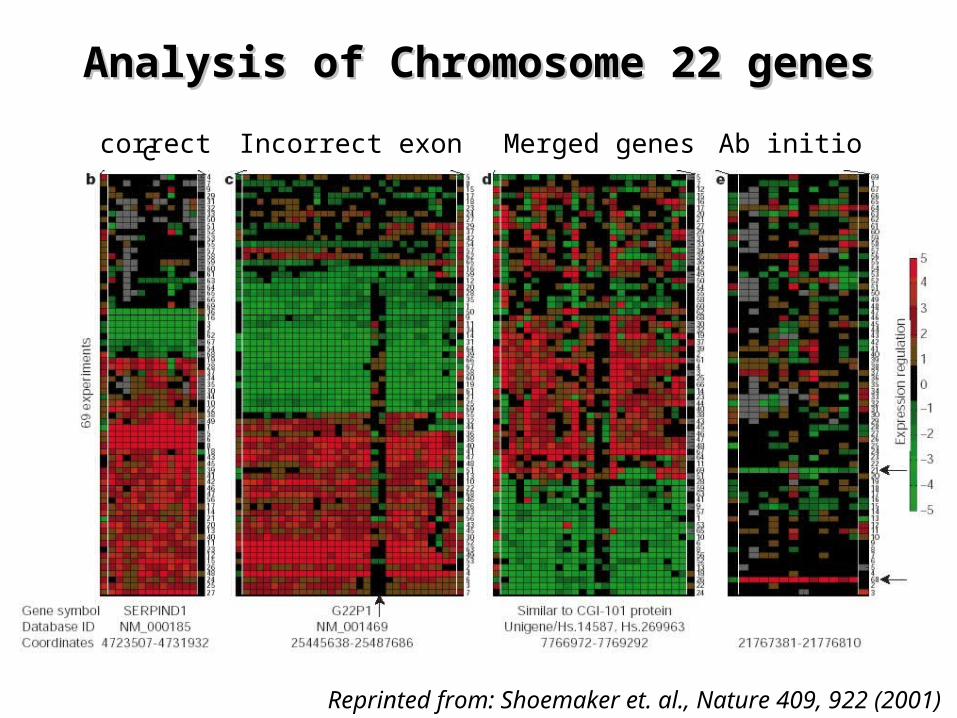
Analysis of Chromosome 22 genesAnalysis of Chromosome 22 genes
Reprinted from: Shoemaker et. al., Nature 409, 922 (2001)
correct
correct Ab initioMerged genesIncorrect exon
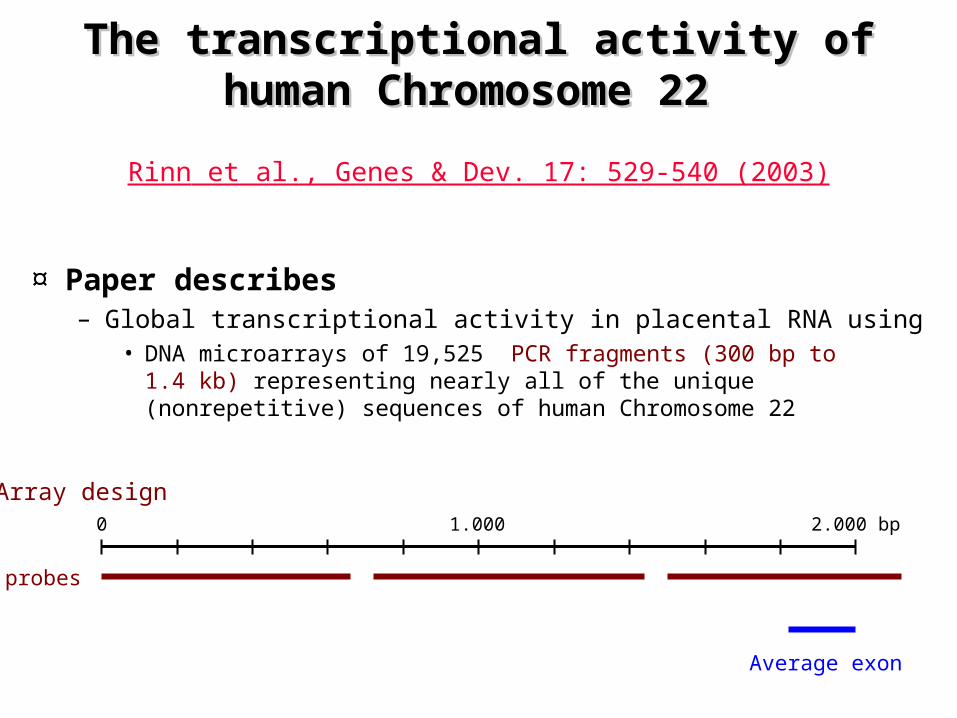
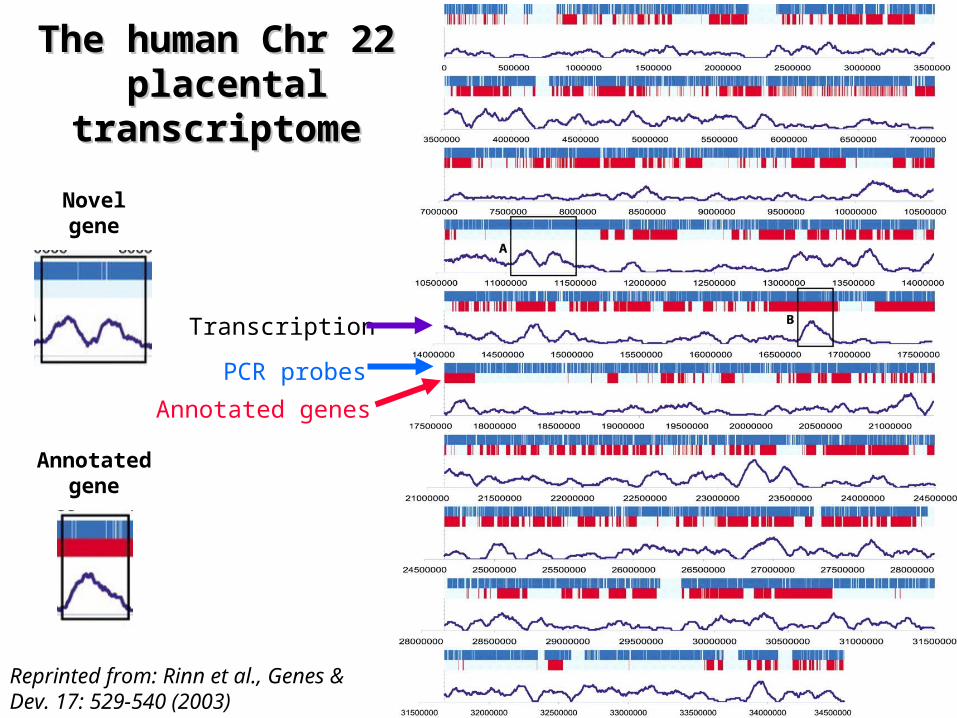
The transcriptional activity of human The transcriptional activity of human Chromosome 22 Chromosome 22
¤ Paper describes– Global transcriptional activity in placental RNA using
• DNA microarrays of 19,525 PCR fragments (300 bp to 1.4 kb) representing nearly all of the unique (nonrepetitive) sequences of human Chromosome 22
Rinn et al., Genes & Dev. 17: 529-540 (2003)
Array design2.000 bp1.0000
probes
Average exon
Reprinted from: Rinn et al., Genes & Dev. 17: 529-540 (2003)
The human Chr The human Chr 22 22
placental placental transcriptometranscriptome
PCR probes
Annotated genes
Transcription
Annotatedgene
Novelgene
Reprinted from: Rinn et al., Genes & Dev. 17: 529-540 (2003)
The human Chr 22 placental transcriptomeThe human Chr 22 placental transcriptome
¤ Twice as many sequences are transcribed than previously reported– Equal number of transcribed sequences in unannotated
regions as in annotated regions
¤ Transcripts from unannotated regions comprise– transcripts internal to annotated introns – transcripts that are antisense to annotated genes– a large portion of the novel transcripts is evolutionarily
conserved in the mouse
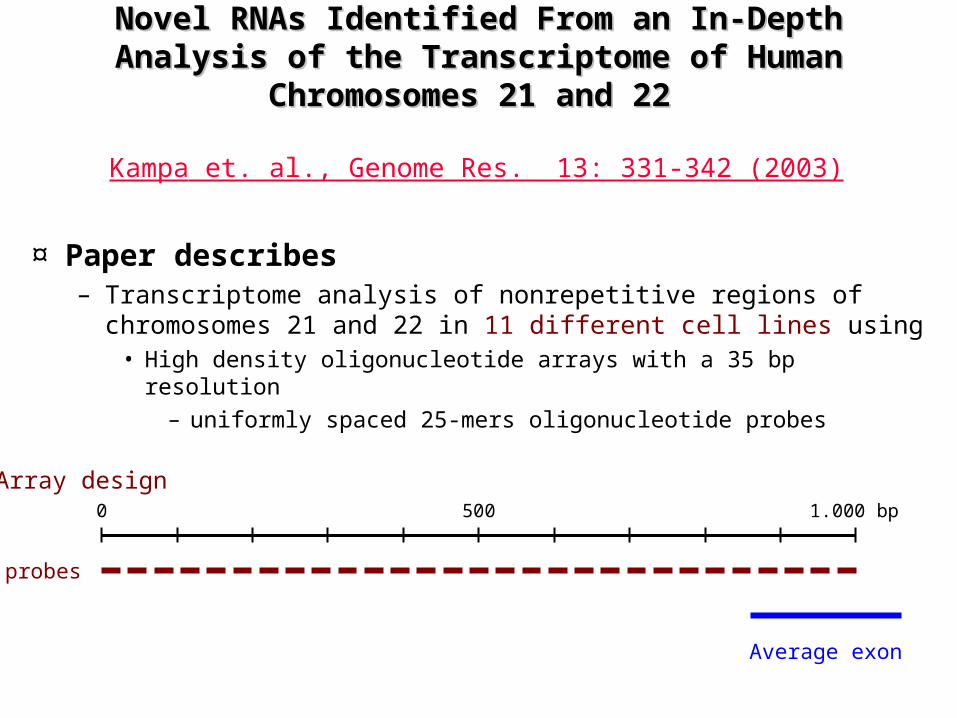
Novel RNAs Identified From an In-Depth Analysis Novel RNAs Identified From an In-Depth Analysis of the Transcriptome of Human Chromosomes 21 of the Transcriptome of Human Chromosomes 21
and 22 and 22
¤ Paper describes– Transcriptome analysis of nonrepetitive regions of
chromosomes 21 and 22 in 11 different cell lines using• High density oligonucleotide arrays with a 35 bp resolution
– uniformly spaced 25-mers oligonucleotide probes
Kampa et. al., Genome Res. 13: 331-342 (2003)
Array design1.000 bp5000
probes
Average exon
Reprinted from: Kampa et. al., Genome Res. 13: 331-342 (2003)
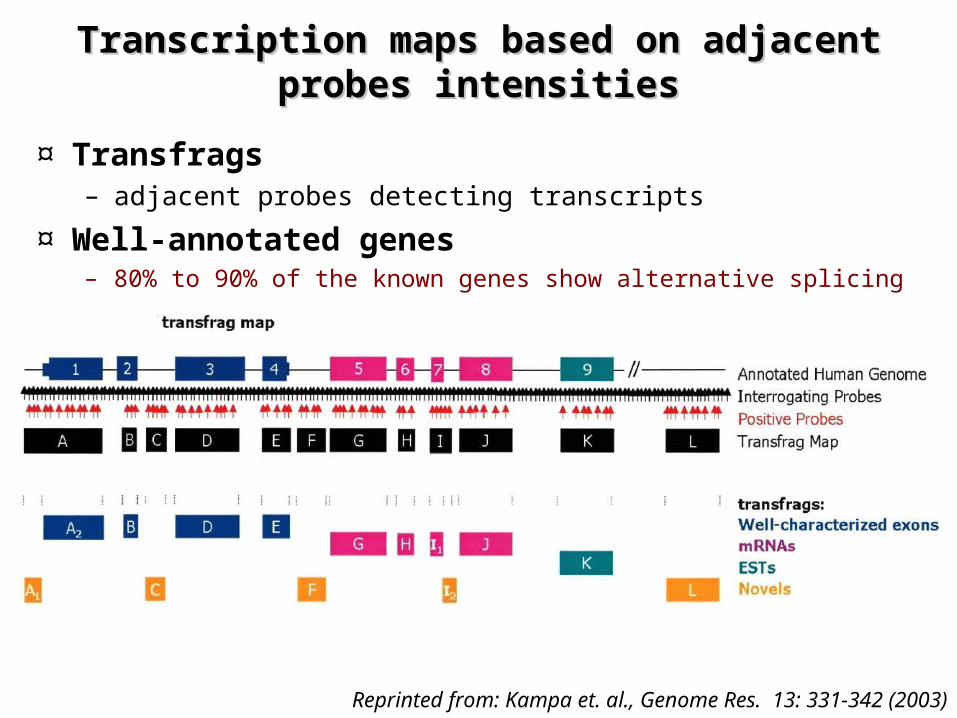
Transcription maps based on adjacent Transcription maps based on adjacent probesprobes intensitiesintensities
¤ Transfrags– adjacent probes detecting transcripts
¤ Well-annotated genes– 80% to 90% of the known genes show alternative splicing
Reprinted from: Kampa et. al., Genome Res. 13: 331-342 (2003)
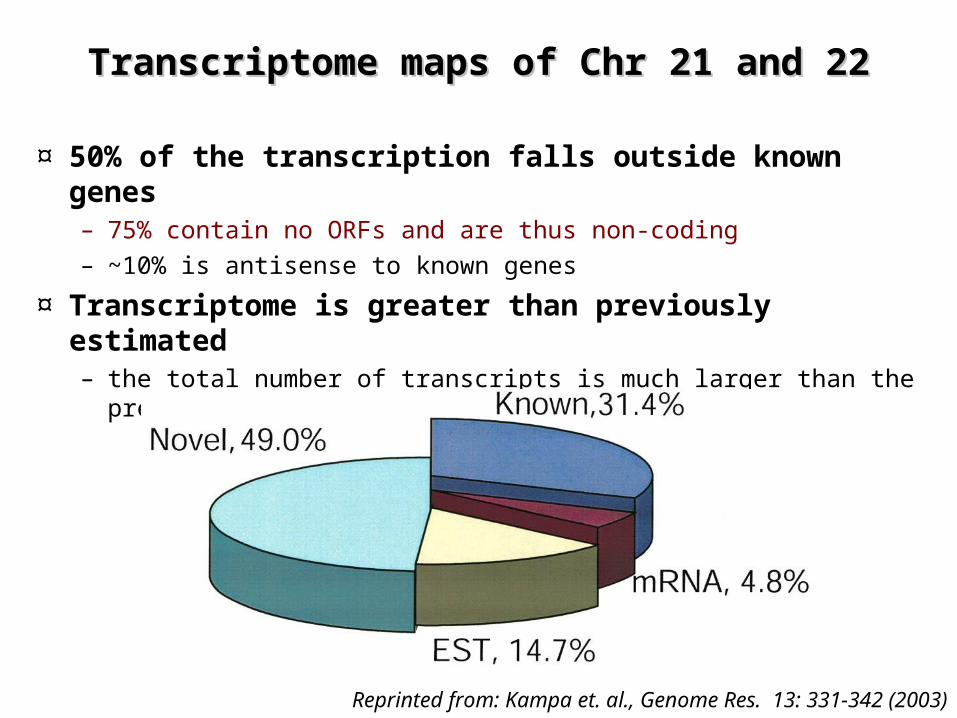
Transcriptome maps Transcriptome maps of Chr 21 and 22of Chr 21 and 22
¤ 50% of the transcription falls outside known genes– 75% contain no ORFs and are thus non-coding– ~10% is antisense to known genes
¤ Transcriptome is greater than previously estimated– the total number of transcripts is much larger than the present
estimates of 25,000 genes
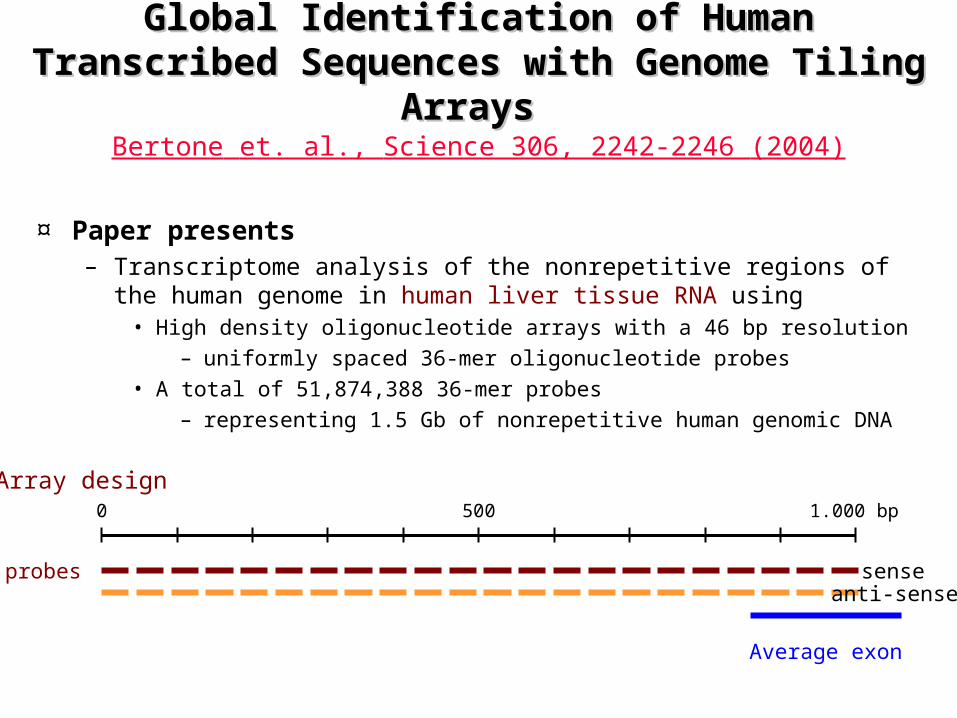
Global Identification of Human Global Identification of Human Transcribed Sequences with Genome Transcribed Sequences with Genome
Tiling Arrays Tiling Arrays
¤ Paper presents– Transcriptome analysis of the nonrepetitive regions of the human
genome in human liver tissue RNA using• High density oligonucleotide arrays with a 46 bp resolution
– uniformly spaced 36-mer oligonucleotide probes• A total of 51,874,388 36-mer probes
– representing 1.5 Gb of nonrepetitive human genomic DNA
Bertone et. al., Science 306, 2242-2246 (2004)
Array design1.000 bp5000
probes
Average exon
senseanti-sense
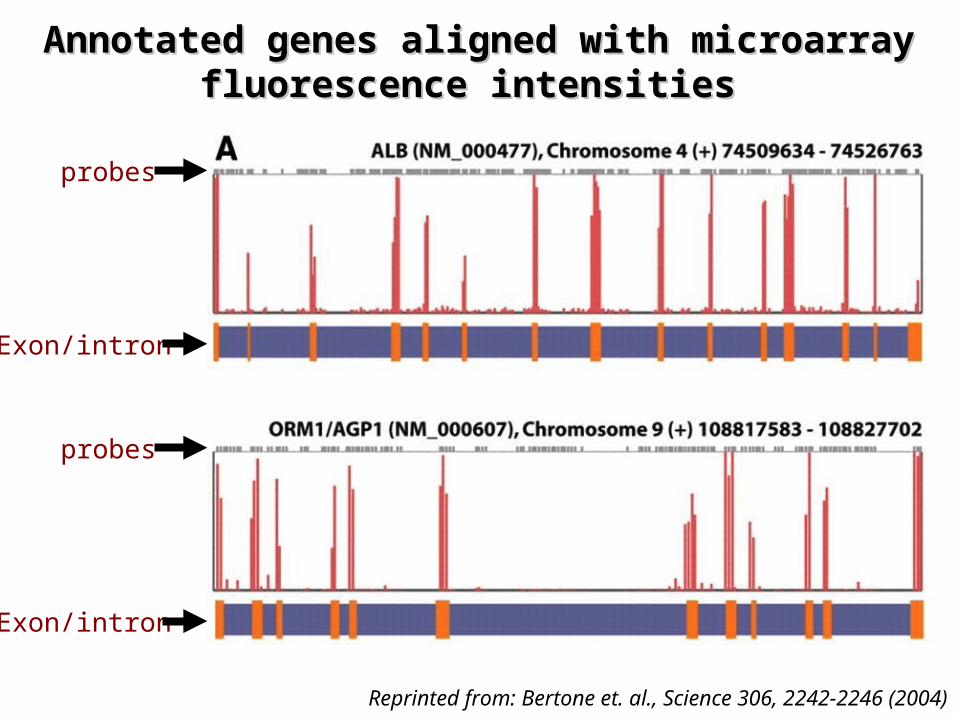
Annotated genes aligned with microarray Annotated genes aligned with microarray fluorescence intensities fluorescence intensities
Reprinted from: Bertone et. al., Science 306, 2242-2246 (2004)
probes
Exon/intron
probes
Exon/intron
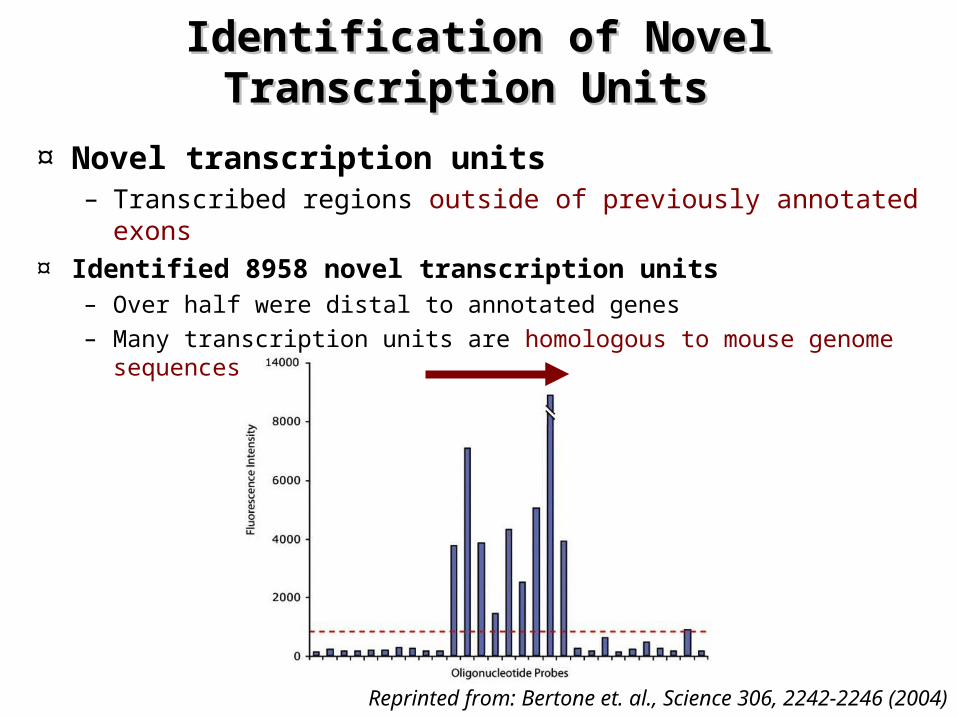
Identification of Novel Transcription Identification of Novel Transcription Units Units
¤ Novel transcription units – Transcribed regions outside of previously annotated exons
¤ Identified 8958 novel transcription units – Over half were distal to annotated genes – Many transcription units are homologous to mouse genome
sequences
Reprinted from: Bertone et. al., Science 306, 2242-2246 (2004)
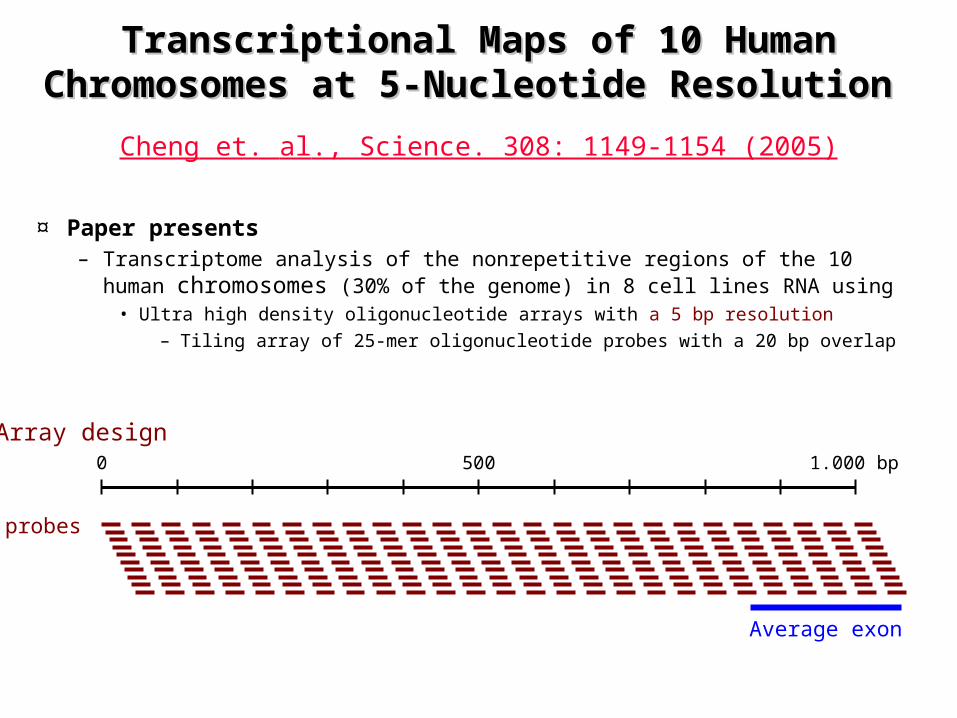
Transcriptional Maps of 10 Human Transcriptional Maps of 10 Human Chromosomes at 5-Nucleotide ResolutionChromosomes at 5-Nucleotide Resolution
¤ Paper presents– Transcriptome analysis of the nonrepetitive regions of the 10 human
chromosomes (30% of the genome) in 8 cell lines RNA using• Ultra high density oligonucleotide arrays with a 5 bp resolution
– Tiling array of 25-mer oligonucleotide probes with a 20 bp overlap
Cheng et. al., Science. 308: 1149-1154 (2005)
Array design1.000 bp5000
probes
Average exon
Reprinted from: Cheng et. al., Science. 308: 1149-1154 (2005)
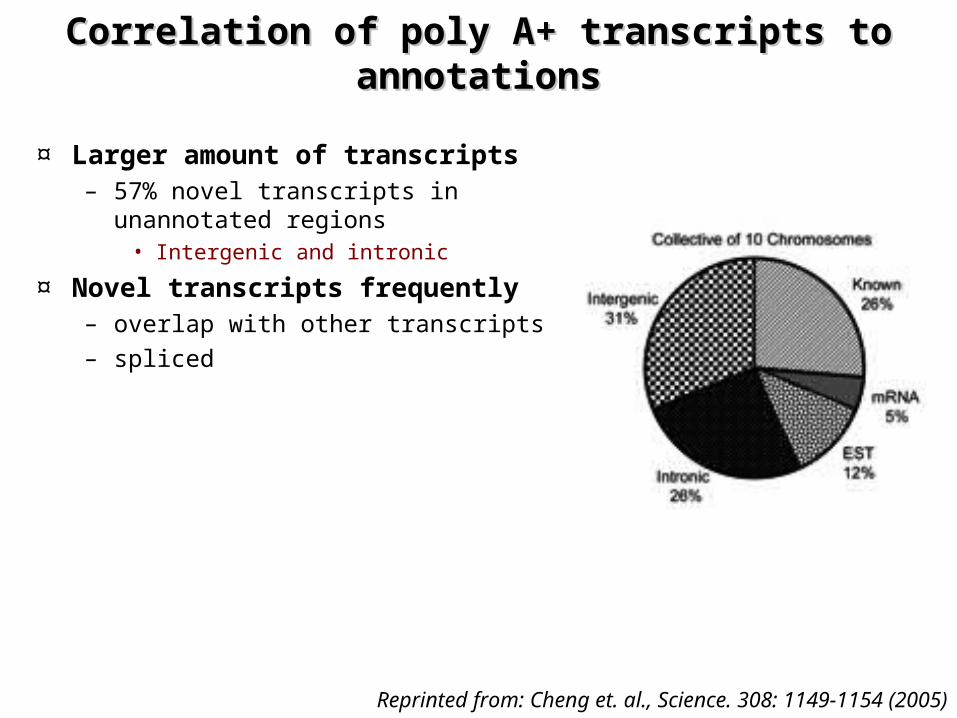
Correlation of poly A+ transcripts to Correlation of poly A+ transcripts to annotationsannotations
¤ Larger amount of transcripts – 57% novel transcripts in unannotated
regions• Intergenic and intronic
¤ Novel transcripts frequently– overlap with other transcripts– spliced
Reprinted from: Cheng et. al., Science. 308: 1149-1154 (2005)
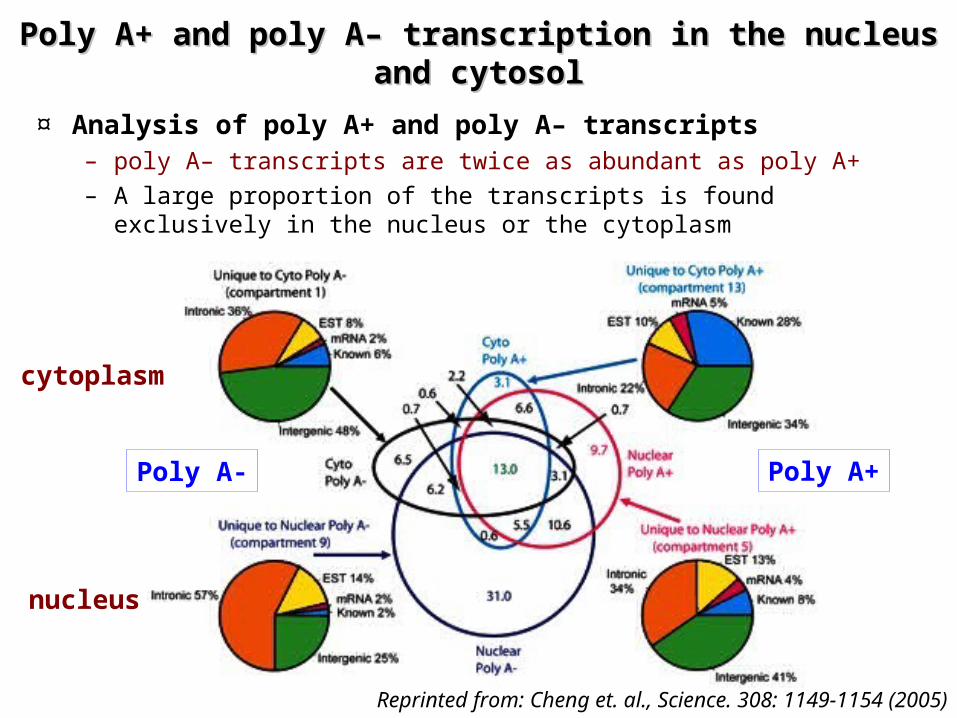
Poly A+ and poly A– transcription in the nucleus Poly A+ and poly A– transcription in the nucleus and cytosoland cytosol
¤ Analysis of poly A+ and poly A– transcripts– poly A– transcripts are twice as abundant as poly A+– A large proportion of the transcripts is found exclusively in the
nucleus or the cytoplasm
Poly A- Poly A+
nucleus
cytoplasm
Reprinted from: Cheng et. al., Science. 308: 1149-1154 (2005)
ConclusionsConclusions
¤ Transcriptome mapping experiments show that – a larger percentage of the genome is transcribed than can
be accounted for by the current state of genome annotations
– The human transcriptome is composed of • a network of overlapping transcripts (> 50% of the transcripts)• Poly A– RNAs potentially comprise almost half of the human
transcriptome
¤ Our understanding of the human transcriptome is still evolving…– What are the functions of the non-coding transcripts?
Reprinted from: Mattick, Science. 309: 1527-1528 (2005)
The complexity of the transcriptomeThe complexity of the transcriptome
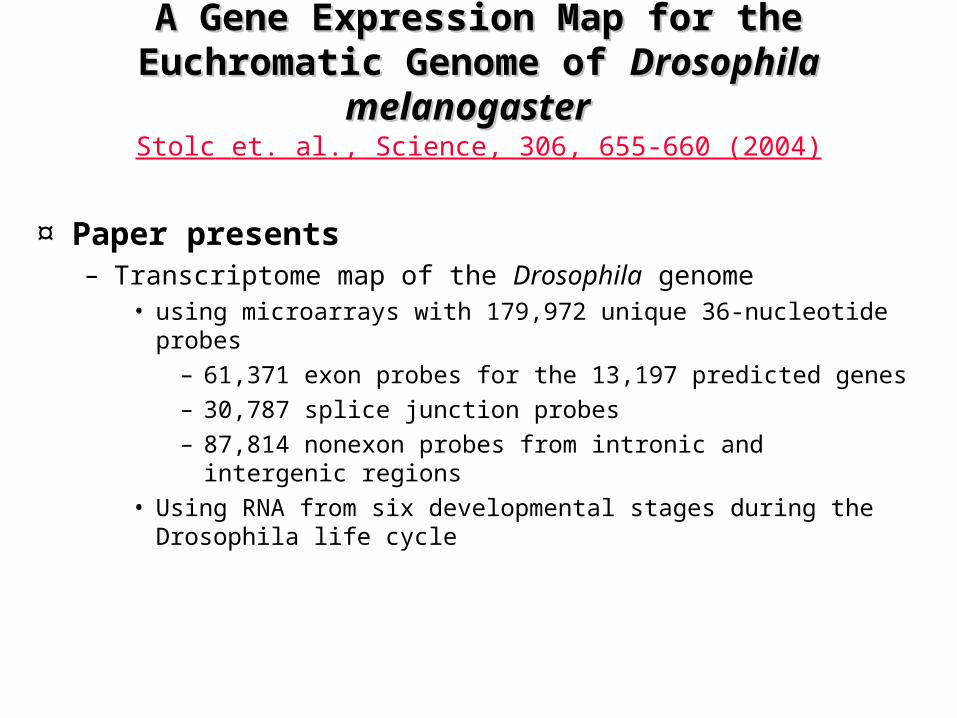
A Gene Expression Map for the A Gene Expression Map for the Euchromatic Genome of Euchromatic Genome of Drosophila Drosophila
melanogastermelanogaster
¤ Paper presents– Transcriptome map of the Drosophila genome
• using microarrays with 179,972 unique 36-nucleotide probes– 61,371 exon probes for the 13,197 predicted genes– 30,787 splice junction probes– 87,814 nonexon probes from intronic and intergenic
regions• Using RNA from six developmental stages during the
Drosophila life cycle
Stolc et. al., Science, 306, 655-660 (2004)
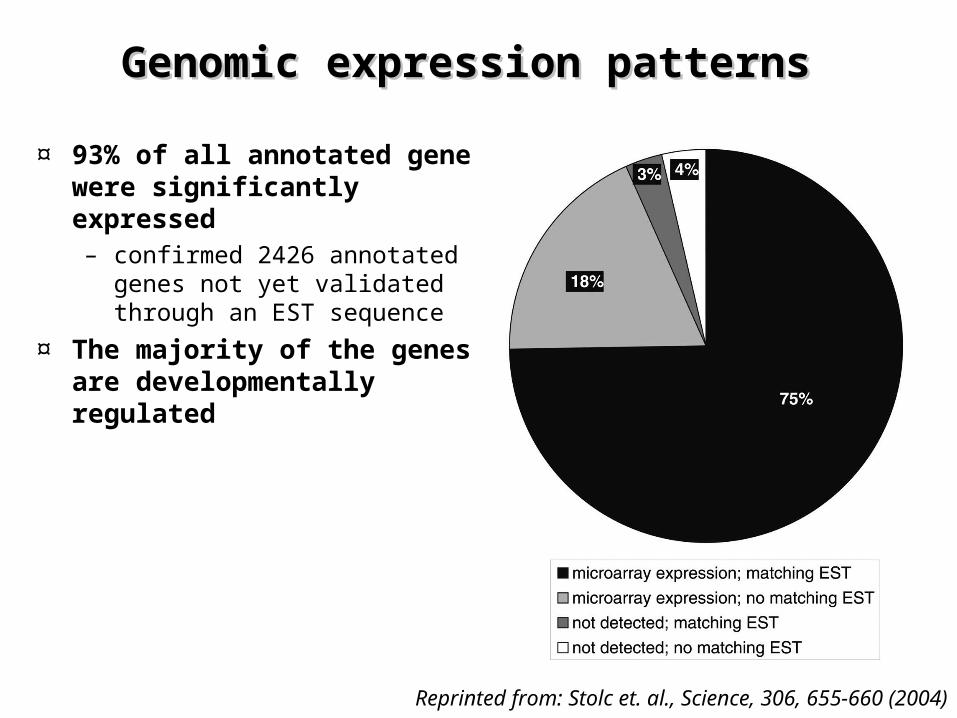
Genomic expression patterns Genomic expression patterns
¤ 93% of all annotated gene were significantly expressed– confirmed 2426 annotated
genes not yet validated through an EST sequence
¤ The majority of the genes are developmentally regulated
Reprinted from: Stolc et. al., Science, 306, 655-660 (2004)
Transcriptome map of Drosophila Transcriptome map of Drosophila
¤ 41% of intergenic and intronic probes are expressed – One fraction does not correspond to exons and may
represent putative noncoding transcription units– 15% of the intergenic and intronic probes are
developmentally regulated
¤ Alternative splicing– 53% of expressed Drosophila genes exhibit exon skipping– 46% of genes showed multiple patterns of exon expression
suggesting alternative splicing or alternative promoter usage
¤ Alternative splicing in Drosophila– Much higher than previously estimated
Reprinted from: Bertone et. al., Science 306, 2242-2246 (2004)
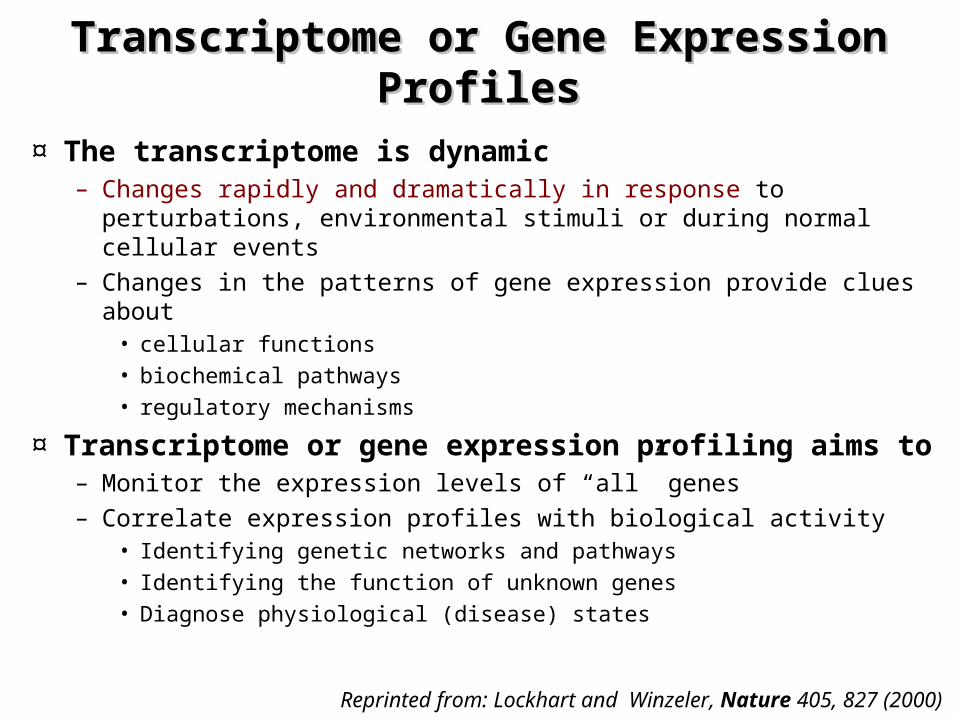
Transcriptome or Gene Expression Transcriptome or Gene Expression ProfilesProfiles
¤ The transcriptome is dynamic– Changes rapidly and dramatically in response to perturbations,
environmental stimuli or during normal cellular events– Changes in the patterns of gene expression provide clues
about • cellular functions • biochemical pathways• regulatory mechanisms
¤ Transcriptome or gene expression profiling aims to– Monitor the expression levels of “all” genes– Correlate expression profiles with biological activity
• Identifying genetic networks and pathways• Identifying the function of unknown genes• Diagnose physiological (disease) states
Reprinted from: Lockhart and Winzeler, Nature 405, 827 (2000)
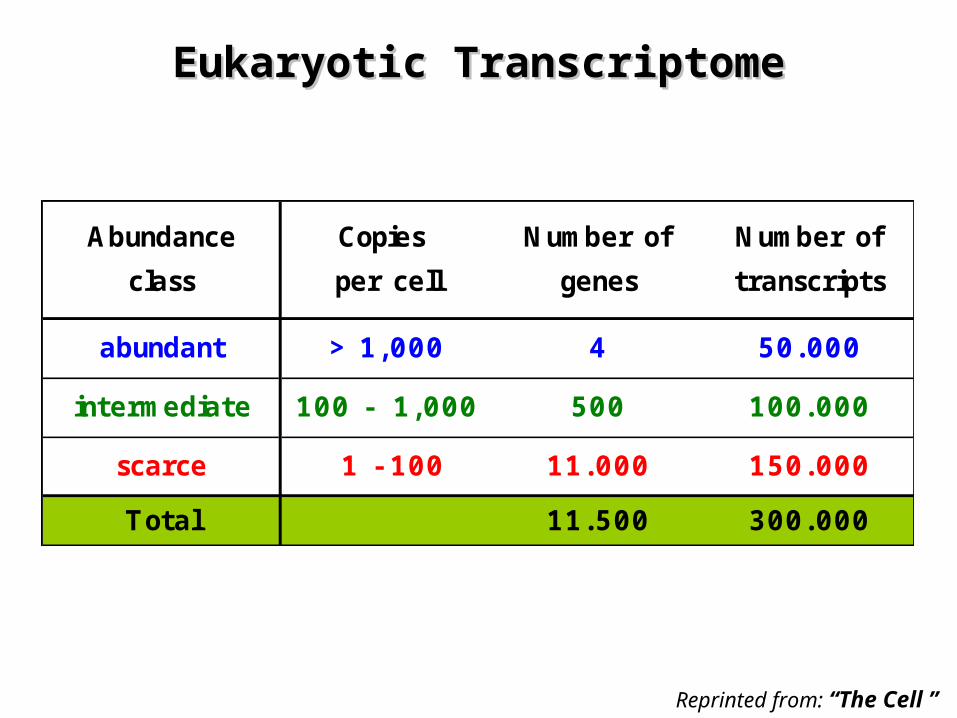
Eukaryotic TranscriptomeEukaryotic Transcriptome
Abundance Copies Number of Number of
class per cell genes transcripts
abundant > 1,000 4 50.000
intermediate 100 - 1,000 500 100.000
scarce 1 - 100 11.000 150.000
Total 11.500 300.000
Reprinted from: “The Cell ”
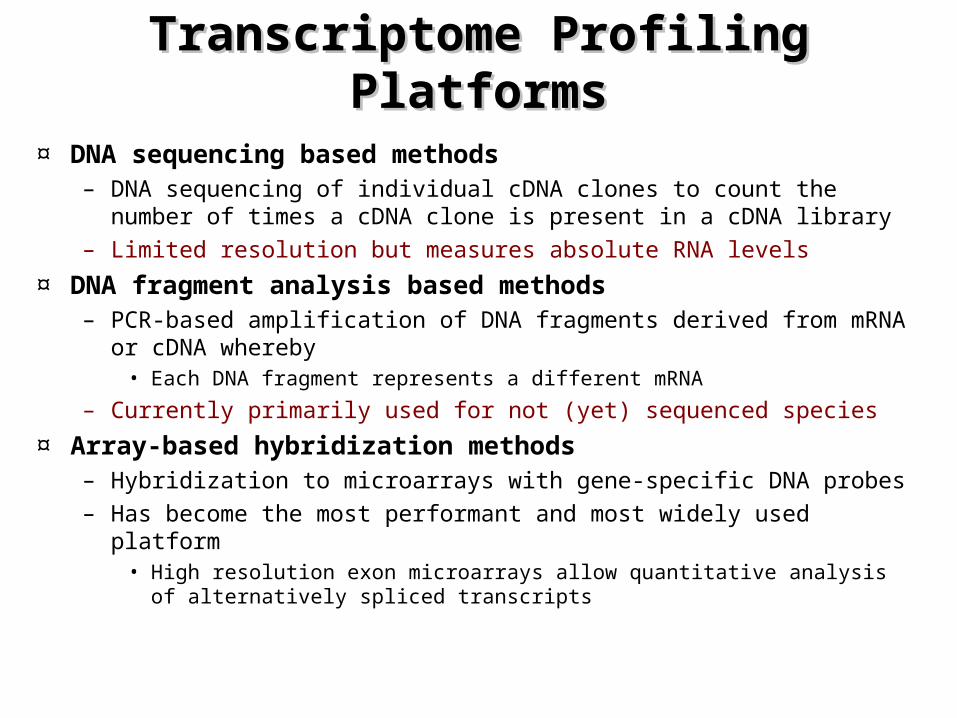
Transcriptome Profiling Transcriptome Profiling PlatformsPlatforms
¤ DNA sequencing based methods– DNA sequencing of individual cDNA clones to count the number of
times a cDNA clone is present in a cDNA library– Limited resolution but measures absolute RNA levels
¤ DNA fragment analysis based methods– PCR-based amplification of DNA fragments derived from mRNA or
cDNA whereby• Each DNA fragment represents a different mRNA
– Currently primarily used for not (yet) sequenced species
¤ Array-based hybridization methods– Hybridization to microarrays with gene-specific DNA probes– Has become the most performant and most widely used platform
• High resolution exon microarrays allow quantitative analysis of alternatively spliced transcripts
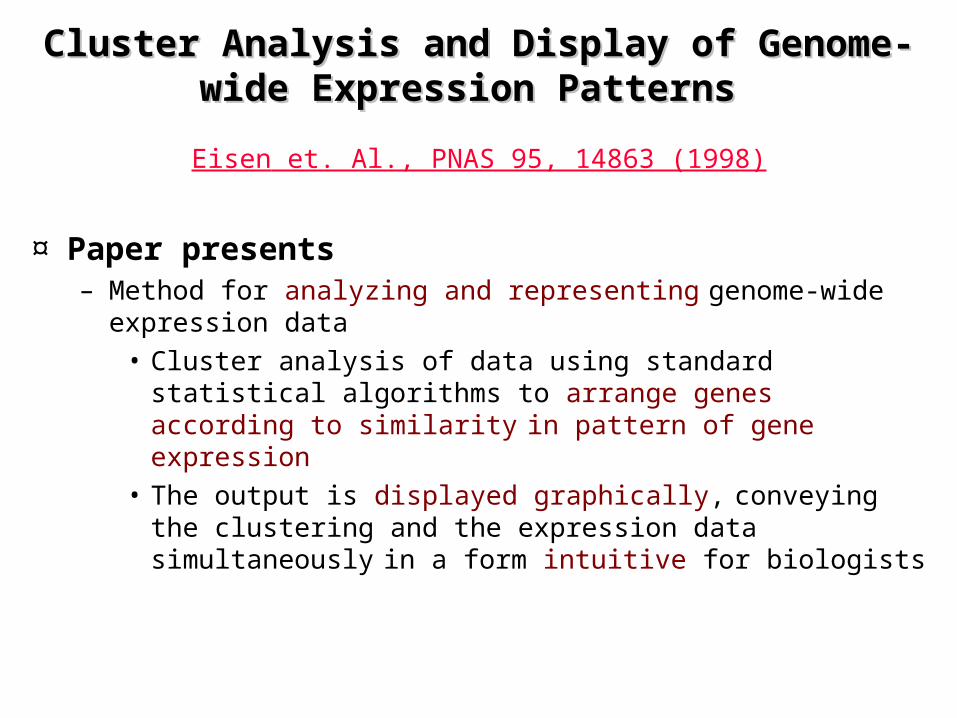
Cluster Analysis and Display of Genome-Cluster Analysis and Display of Genome-wide Expression Patterns wide Expression Patterns
¤ Paper presents– Method for analyzing and representing genome-wide
expression data• Cluster analysis of data using standard statistical
algorithms to arrange genes according to similarity in pattern of gene expression
• The output is displayed graphically, conveying the clustering and the expression data simultaneously in a form intuitive for biologists
Eisen et. Al., PNAS 95, 14863 (1998)
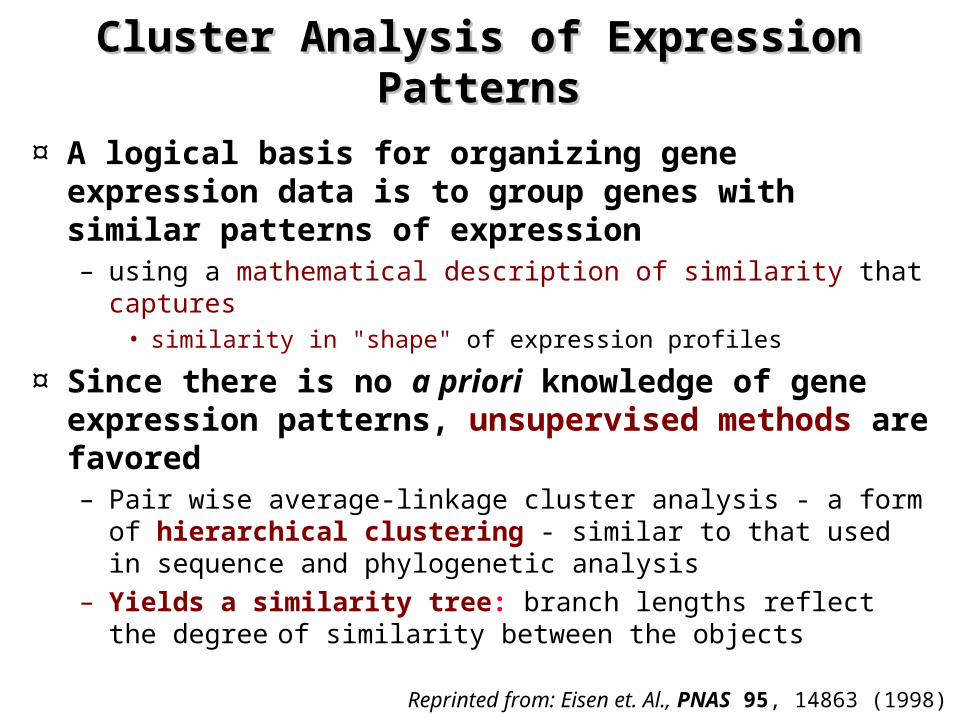
Cluster Analysis of Expression Cluster Analysis of Expression PatternsPatterns
¤ A logical basis for organizing gene expression data is to group genes with similar patterns of expression – using a mathematical description of similarity that captures
• similarity in "shape" of expression profiles
¤ Since there is no a priori knowledge of gene expression patterns, unsupervised methods are favored– Pair wise average-linkage cluster analysis - a form of
hierarchical clustering - similar to that used in sequence and phylogenetic analysis
– Yields a similarity tree: branch lengths reflect the degree
of similarity between the objects
Reprinted from: Eisen et. Al., PNAS 95, 14863 (1998)
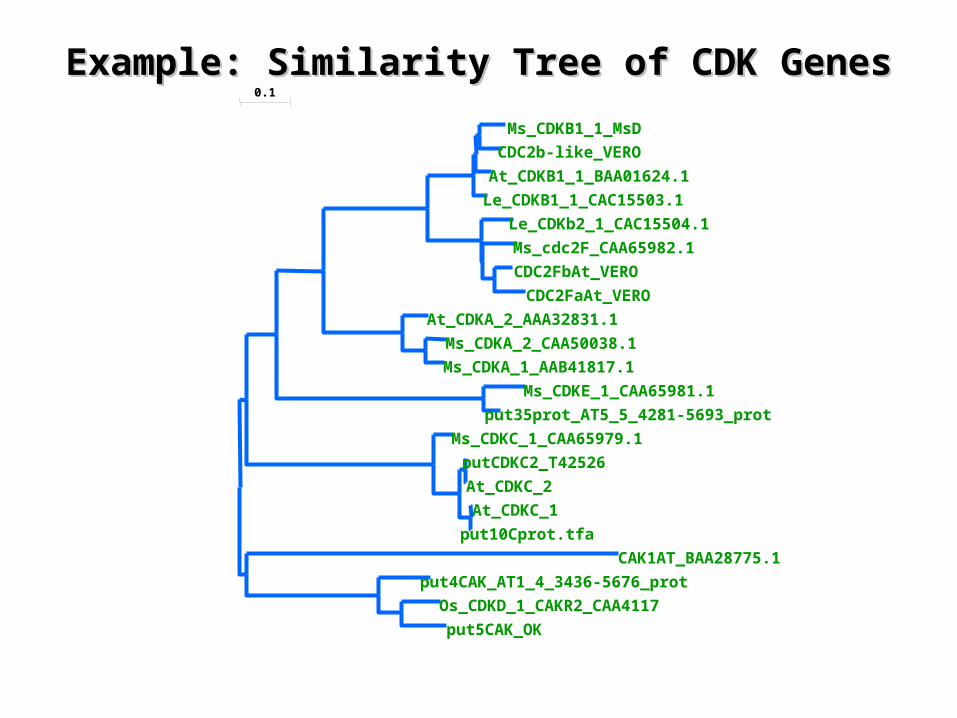
Example: Similarity Tree of CDK GenesExample: Similarity Tree of CDK Genes0.1
Ms_CDKC_1_CAA65979.1
CAK1AT_BAA28775.1
Le_CDKb2_1_CAC15504.1
Le_CDKB1_1_CAC15503.1
At_CDKA_2_AAA32831.1
Ms_cdc2F_CAA65982.1
put4CAK_AT1_4_3436-5676_prot
At_CDKB1_1_BAA01624.1
Ms_CDKB1_1_MsD
CDC2b-like_VERO
CDC2FbAt_VERO
CDC2FaAt_VERO
Ms_CDKA_2_CAA50038.1
Ms_CDKA_1_AAB41817.1
Ms_CDKE_1_CAA65981.1
put35prot_AT5_5_4281-5693_prot
putCDKC2_T42526
At_CDKC_2
At_CDKC_1
put10Cprot.tfa
Os_CDKD_1_CAKR2_CAA4117
put5CAK_OK
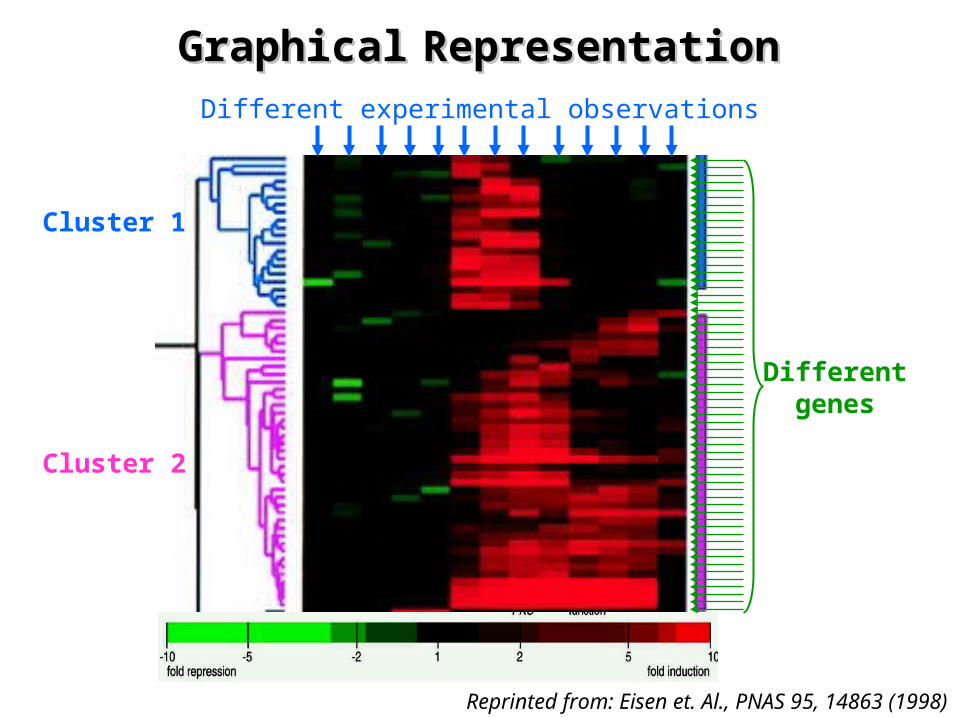
GraphicalGraphical RepresentationRepresentation
¤ Combines clustering with a graphical
representation of the primary data – By representing each data point with a color that is a
quantitative reflection of the experimental observations• Green: down regulated• Red: up regulated
¤ Images show contiguous patches of color – Representing groups of genes that share similar expression
patterns over multiple conditions
¤ Analysis of clustered genes shows that– The clustered genes share common functions in cellular
processes
Reprinted from: Eisen et. Al., PNAS 95, 14863 (1998)
Reprinted from: Eisen et. Al., PNAS 95, 14863 (1998)
Cluster 1
Cluster 2
Different experimental observations
Differentgenes
GraphicalGraphical RepresentationRepresentation
Reprinted from: Eisen et. Al., PNAS 95, 14863 (1998)
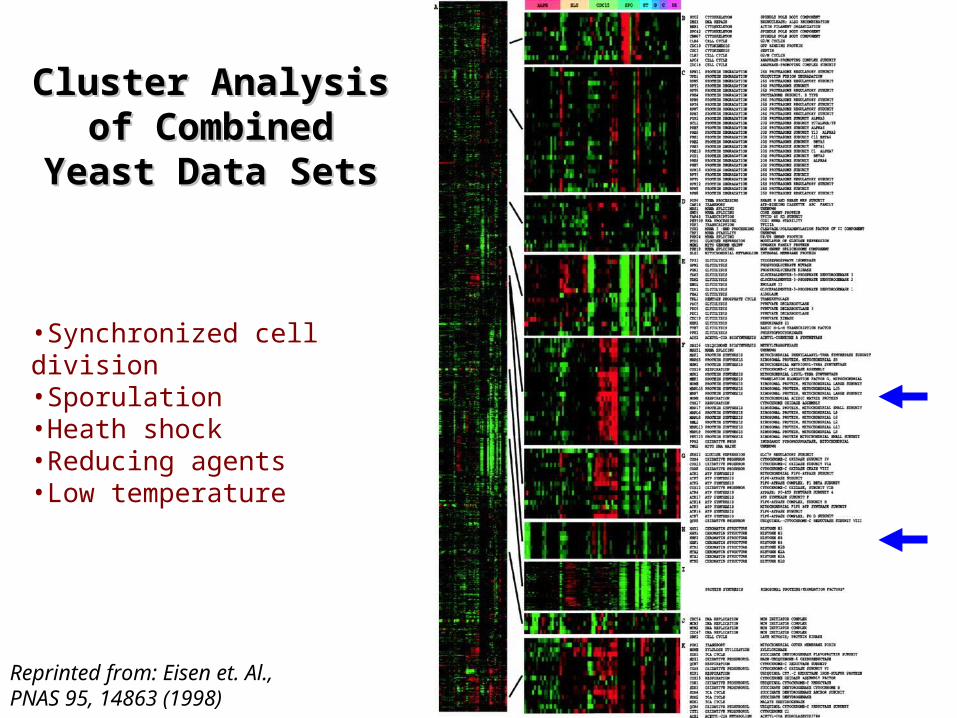
Cluster Analysis Cluster Analysis of Combined of Combined
Yeast Data SetsYeast Data Sets
•Synchronized cell division•Sporulation•Heath shock•Reducing agents•Low temperature
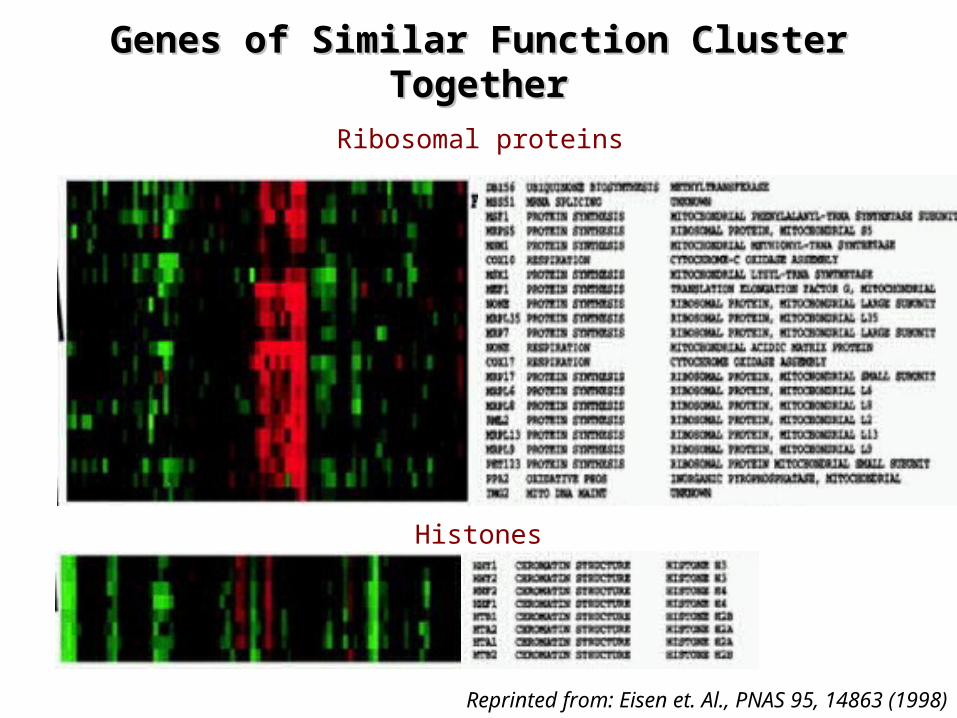
Genes of Similar Function Cluster Genes of Similar Function Cluster TogetherTogether
Reprinted from: Eisen et. Al., PNAS 95, 14863 (1998)
Histones
Ribosomal proteins
Global Analysis of the Genetic Network Global Analysis of the Genetic Network Controlling a Bacterial Cell Cycle Controlling a Bacterial Cell Cycle
¤ Paper presents – full-genome evidence that bacterial cells use
discrete transcription patterns to control cell division
• Demonstrating that genes involved in a given cell function are activated at the time of execution of that function
Laub et. Al., Science, 290, 5499 (2000)
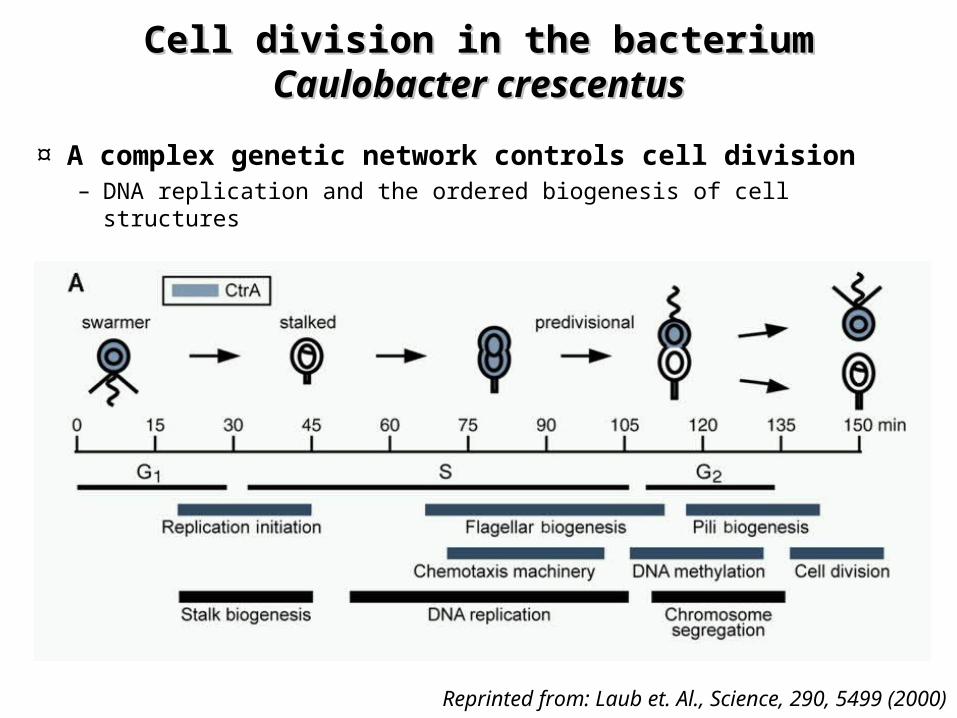
Cell division in the bacterium Cell division in the bacterium Caulobacter Caulobacter crescentuscrescentus
¤ A complex genetic network controls cell division – DNA replication and the ordered biogenesis of cell structures
Reprinted from: Laub et. Al., Science, 290, 5499 (2000)
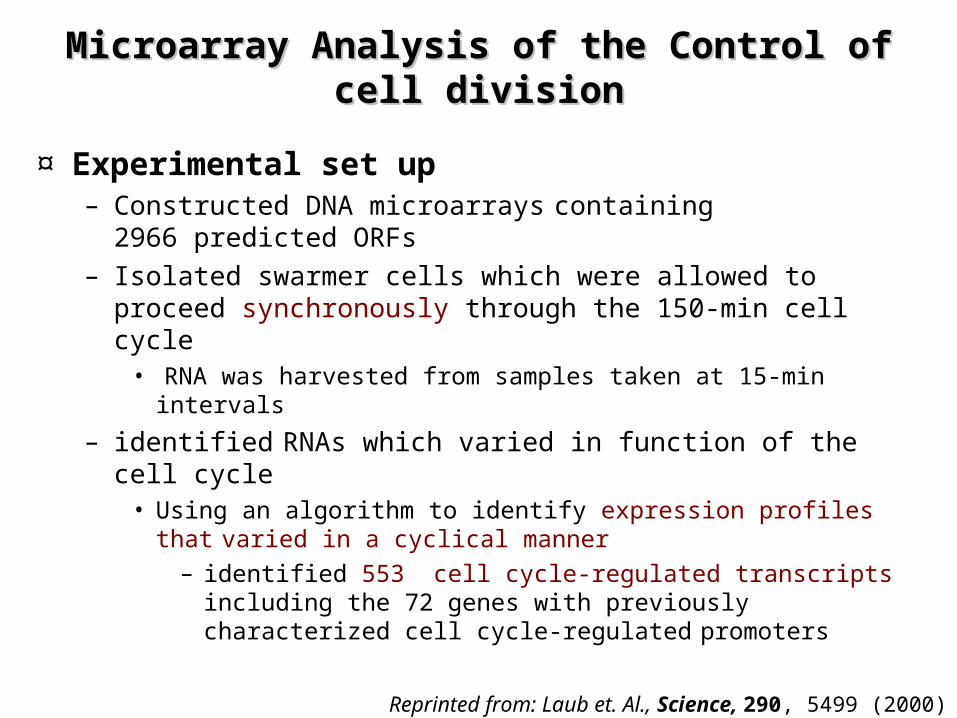
Microarray Analysis of the Control of cell Microarray Analysis of the Control of cell divisiondivision
¤ Experimental set up– Constructed DNA microarrays containing 2966 predicted
ORFs– Isolated swarmer cells which were allowed to proceed
synchronously through the 150-min cell cycle• RNA was harvested from samples taken at 15-min intervals
– identified RNAs which varied in function of the cell cycle• Using an algorithm to identify expression profiles that varied in
a cyclical manner – identified 553 cell cycle-regulated transcripts including the
72 genes with previously characterized cell cycle-regulated
promoters
Reprinted from: Laub et. Al., Science, 290, 5499 (2000)
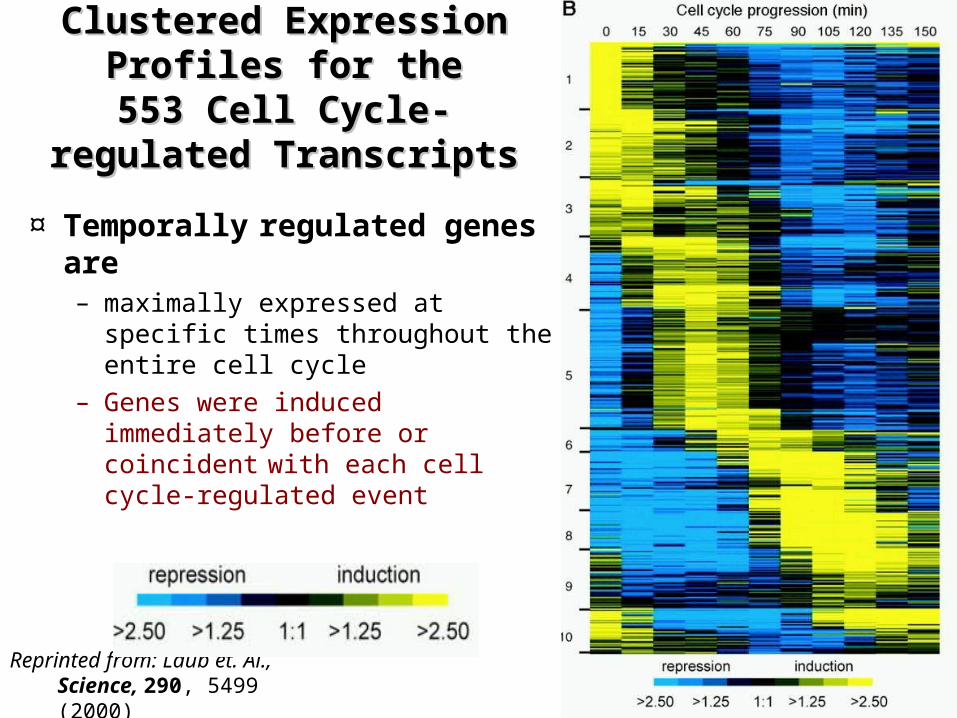
Clustered Expression Clustered Expression Profiles for the 553 Cell Profiles for the 553 Cell
Cycle-regulated Cycle-regulated TranscriptsTranscripts
Reprinted from: Laub et. Al., Science, 290, 5499 (2000)
¤ Temporally regulated genes are – maximally expressed at specific
times throughout the entire cell cycle
– Genes were induced immediately before or coincident with each cell cycle-regulated event
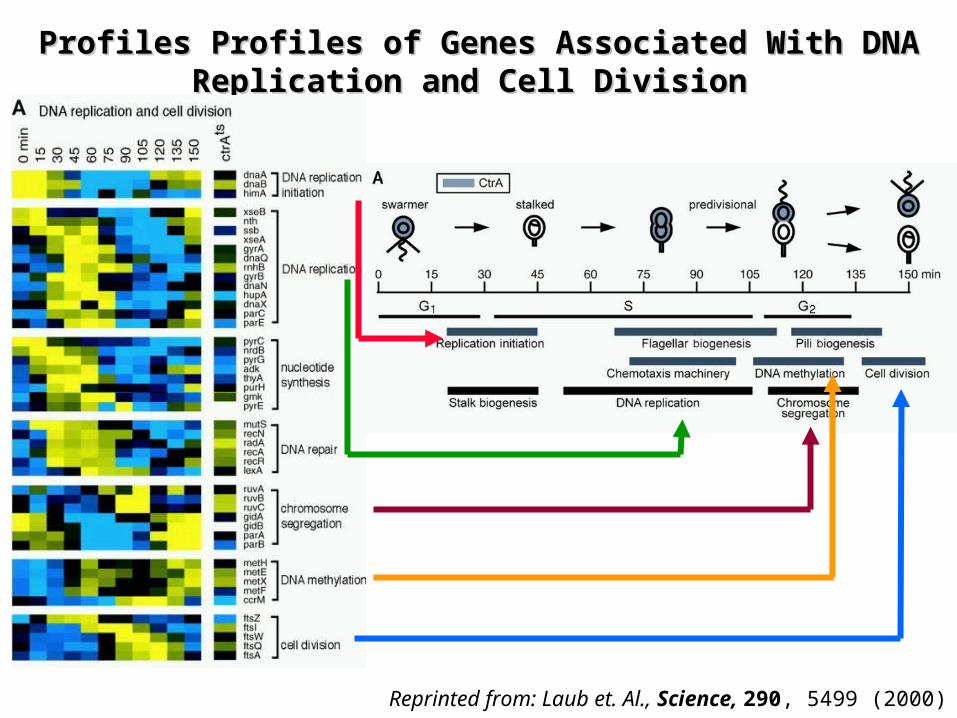
Profiles Profiles Profiles of Genes Associated With DNA Profiles of Genes Associated With DNA Replication and Cell Division Replication and Cell Division
Reprinted from: Laub et. Al., Science, 290, 5499 (2000)
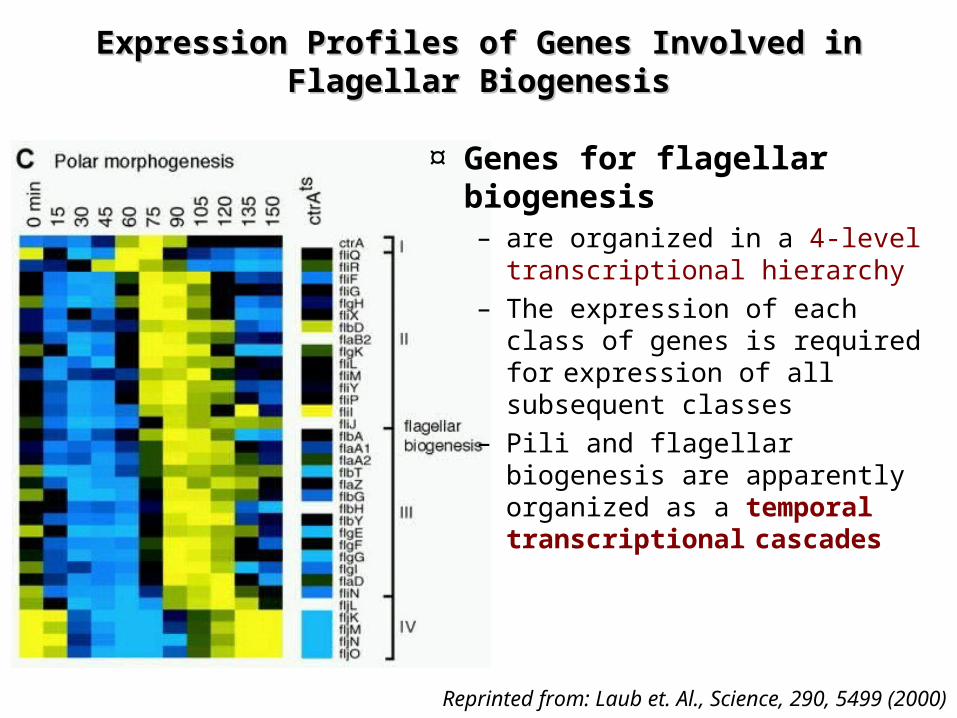
Expression Profiles of Genes Involved in Flagellar Expression Profiles of Genes Involved in Flagellar BiogenesisBiogenesis
¤ Genes for flagellar
biogenesis– are organized in a 4-level
transcriptional hierarchy– The expression of each class
of genes is required for
expression of all subsequent classes
– Pili and flagellar biogenesis are apparently organized as a temporal transcriptional
cascades
Reprinted from: Laub et. Al., Science, 290, 5499 (2000)
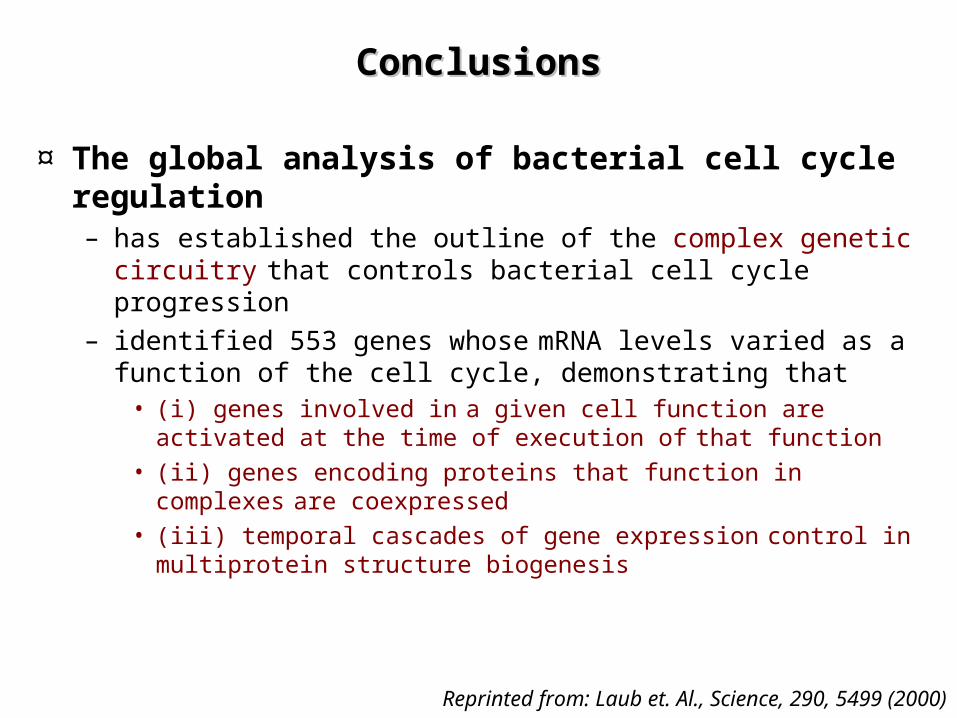
ConclusionsConclusions
¤ The global analysis of bacterial cell cycle regulation – has established the outline of the complex genetic circuitry
that controls bacterial cell cycle progression – identified 553 genes whose mRNA levels varied as a
function of the cell cycle, demonstrating that• (i) genes involved in a given cell function are activated at the
time of execution of that function• (ii) genes encoding proteins that function in complexes are
coexpressed• (iii) temporal cascades of gene expression control in
multiprotein structure biogenesis
Reprinted from: Laub et. Al., Science, 290, 5499 (2000)
Gene expression profiling predicts clinical Gene expression profiling predicts clinical outcome of breast cancer outcome of breast cancer
¤ Paper presents– The application of gene expression profiling to diagnose
breast cancer patients• that are likely to develop metastases and should receive
chemotherapy
– Exemplifies the clinical applications of microarray technology
Van 'T Veer et. al., Nature 415, 530 (2002)
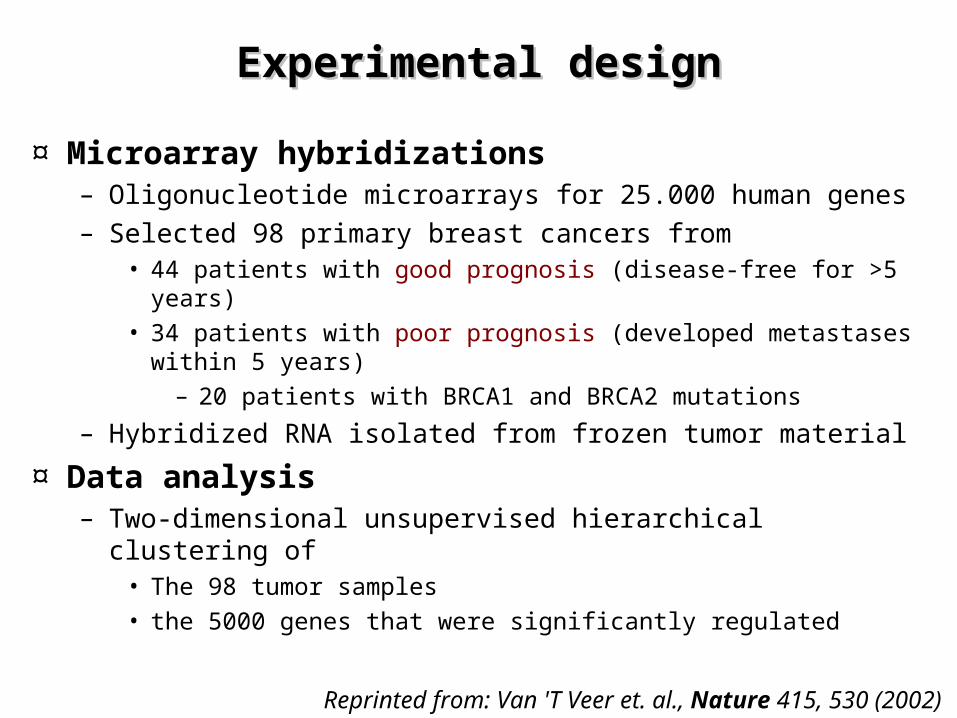
Experimental designExperimental design
¤ Microarray hybridizations– Oligonucleotide microarrays for 25.000 human genes– Selected 98 primary breast cancers from
• 44 patients with good prognosis (disease-free for >5 years)• 34 patients with poor prognosis (developed metastases within 5
years)– 20 patients with BRCA1 and BRCA2 mutations
– Hybridized RNA isolated from frozen tumor material
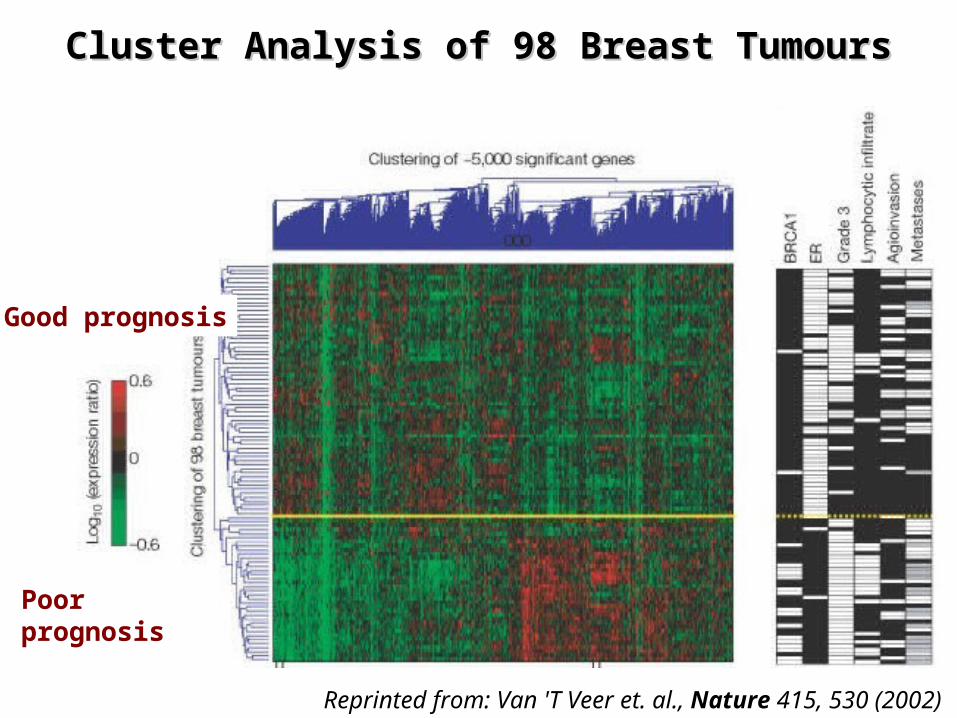
¤ Data analysis– Two-dimensional unsupervised hierarchical clustering of
• The 98 tumor samples• the 5000 genes that were significantly regulated
Reprinted from: Van 'T Veer et. al., Nature 415, 530 (2002)
Reprinted from: Van 'T Veer et. al., Nature 415, 530 (2002)
Cluster Analysis of 98 Breast TumoursCluster Analysis of 98 Breast Tumours
Good prognosis
Poor prognosis
Reprinted from: Van 'T Veer et. al., Nature 415, 530 (2002)
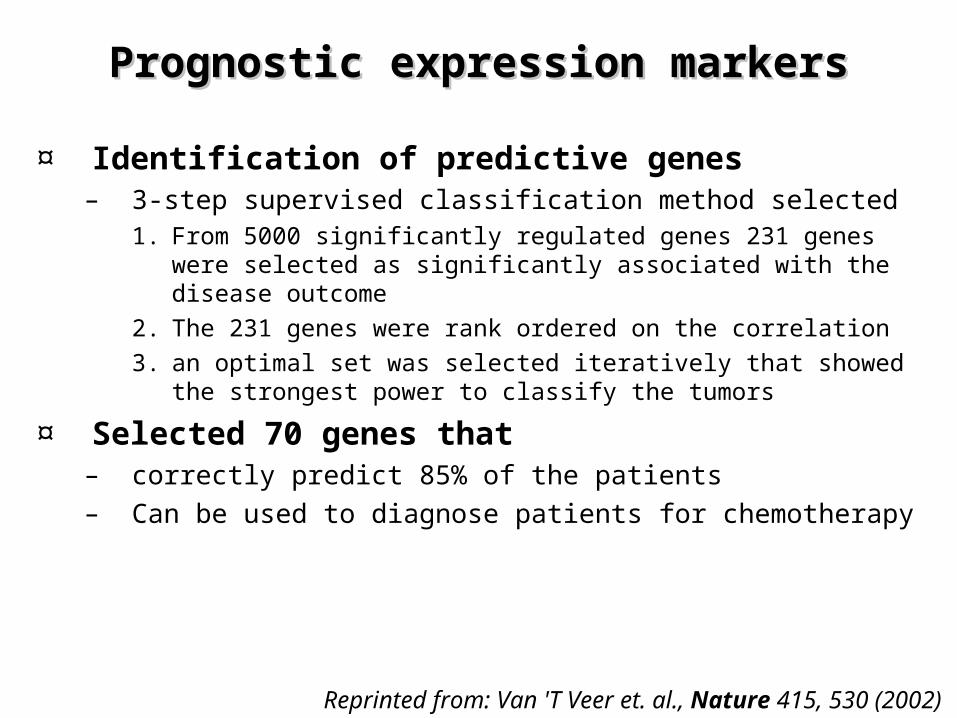
Prognostic expression markersPrognostic expression markers
¤ Identification of predictive genes– 3-step supervised classification method selected
1. From 5000 significantly regulated genes 231 genes were selected as significantly associated with the disease outcome
2. The 231 genes were rank ordered on the correlation3. an optimal set was selected iteratively that showed the
strongest power to classify the tumors
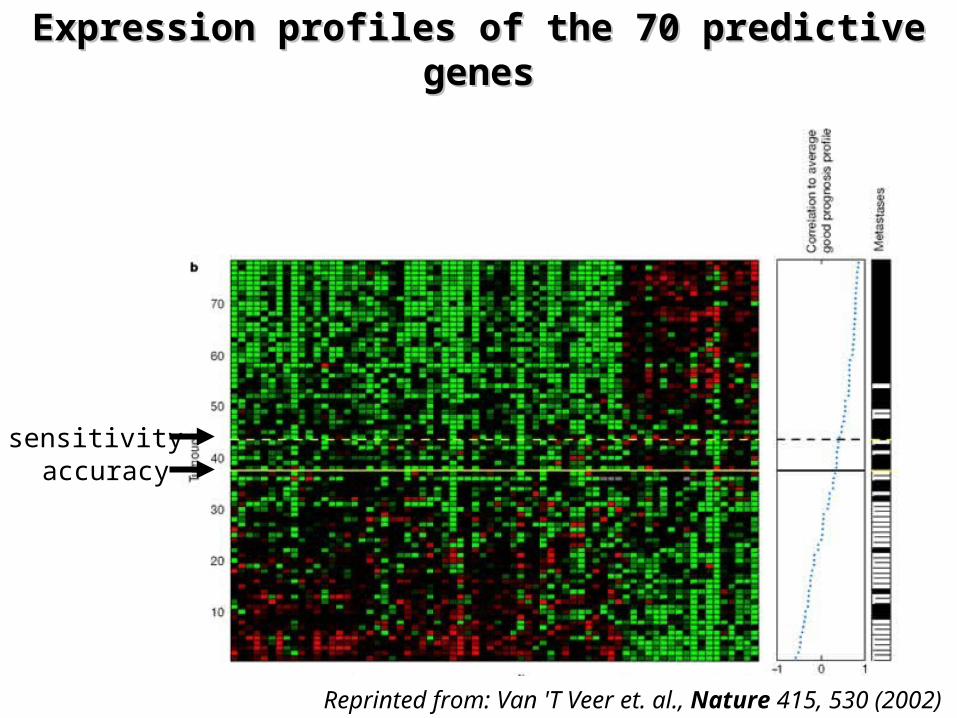
¤ Selected 70 genes that – correctly predict 85% of the patients– Can be used to diagnose patients for chemotherapy
Reprinted from: Van 'T Veer et. al., Nature 415, 530 (2002)
Expression profiles of the 70 predictive Expression profiles of the 70 predictive genesgenes
sensitivityaccuracy
ConclusionsConclusions
¤ Microarray-based expression profiling is – Currently the most powerful tool for functional gene
analysis– Comprehensive approach to investigate the response of
genes • under a broad spectrum of conditions such as
– Genetic backgrounds– Perturbations– Environmental stimuli
¤ Continued increases in probe density– Provide more detailed analyses of the different transcripts
• Alternative promoter usage• Alternative splicing• Non-coding transcripts