genetically engineered crops, glyphosate and the deterioration of
TRANSCRIPT

ISSN 1177-4258 6
Journal of Organic Systems, 9(2), 2014 ORIGINAL PAPER
Genetically engineered crops, glyphosate and the deterioration of health in the United States of America
Nancy L. Swanson1, Andre Leu2*, Jon Abrahamson3 and Bradley Wallet4 1 Abacus Enterprises, Lummi Island, WA, USA
2 International Federation of Organic Agricultural Movements, Bonn, Germany
3 Abacus Enterprises, Lummi Island, WA, USA
4 Crustal Imaging Facility, Conoco Phillips School of Geology and Geophysics, University of Oklahoma, USA
* Corresponding author: [email protected]
Abstract
A huge increase in the incidence and prevalence of chronic diseases has been reported in the United States (US) over the last 20 years. Similar increases have been seen globally. The herbicide glyphosate was introduced in 1974 and its use is accelerating with the advent of herbicide-tolerant genetically engineered (GE) crops. Evidence is mounting that glyphosate interferes with many metabolic processes in plants and animals and glyphosate residues have been detected in both. Glyphosate disrupts the endocrine system and the balance of gut bacteria, it damages DNA and is a driver of mutations that lead to cancer. In the present study, US government databases were searched for GE crop data, glyphosate application data and disease epidemiological data. Correlation analyses were then performed on a total of 22 diseases in these time-series data sets. The Pearson correlation coefficients are highly significant (< 10
-5) between glyphosate applications and hypertension (R = 0.923), stroke (R = 0.925),
diabetes prevalence (R = 0.971), diabetes incidence (R = 0.935), obesity (R = 0.962), lipoprotein metabolism disorder (R = 0.973), Alzheimer’s (R = 0.917), senile dementia (R = 0.994), Parkinson's (R = 0.875), multiple sclerosis (R = 0.828), autism (R = 0.989), inflammatory bowel disease (R = 0.938), intestinal infections (R = 0.974), end stage renal disease (R = 0.975), acute kidney failure (R = 0.978), cancers of the thyroid (R = 0.988), liver (R = 0.960), bladder (R = 0.981), pancreas (R = 0.918), kidney (R = 0.973) and myeloid leukaemia (R = 0.878). The Pearson correlation coefficients are highly significant (< 10
-4) between the percentage of GE corn
and soy planted in the US and hypertension (R = 0.961), stroke (R = 0.983), diabetes prevalence (R = 0.983), diabetes incidence (R = 0.955), obesity (R = 0.962), lipoprotein metabolism disorder (R = 0.955), Alzheimer’s (R = 0.937), Parkinson's (R = 0.952), multiple sclerosis (R = 0.876), hepatitis C (R = 0.946), end stage renal disease (R = 0.958), acute kidney failure (R = 0.967), cancers of the thyroid (R = 0.938), liver (R = 0.911), bladder (R = 0.945), pancreas (R = 0.841), kidney (R = 0.940) and myeloid leukaemia (R = 0.889). The significance and strength of the correlations show that the effects of glyphosate and GE crops on human health should be further investigated.

Swanson, Leu, Abrahamson & Wallet Journal of Organic Systems, 9(2), 2014
ISSN 1177-4258 7
Keywords: Glyphosate, GMO, GE corn, GE soy, toxicology, obesity, cancer, hypertension, diabetes, Alzheimer’s disease, senile dementia, autism, Parkinson’s disease, inflammatory bowel disease, intestinal infections, hepatitis C, end stage renal disease, kidney failure, thyroid cancer, liver cancer, bladder cancer, pancreatic cancer, kidney cancer.
Introduction
Within the last 20 years there has been an alarming increase in serious illnesses in the US, along with a marked decrease in life expectancy (Bezruchka, 2012). The Centers for Disease Control and Prevention (CDC) estimates that the cost of diabetes and diabetes-related treatment was approximately $116 billion dollars in 2007. Estimated costs related to obesity were $147 billion in 2008 and cardiovascular diseases and stroke were $475.3 billion in 2009. Health care expenditures in the US totaled 2.2 trillion dollars in 2007 (CDC, 2013a). The onset of serious illness is appearing in increasingly younger cohorts. The US leads the world in the increase in deaths due to neurological diseases between 1979-81 and 2004-06 for the 55-65 age group (Pritchard et al., 2013). These mental disorder deaths are more typical of the over 65 age group. There have been similar findings for obesity, asthma, behavior and learning problems, and chronic disease in children and young adults (Van Cleave et al., 2010). Type II diabetes in youth is being called an epidemic (Rosenbloom et al., 1999). The rate of chronic disease in the entire US population has been dramatically increasing with an estimated 25% of the US population suffering from multiple chronic diseases
(Autoimmunity
Research Foundation, 2012). These findings suggest environmental triggers rather than genetic or age-related causes. During this same time period, there has been an exponential increase in the amount of glyphosate applied to food crops and in the percentage of GE food crops planted (Benbrook, 2012). We undertook a study to see if correlations existed between the rise of GE crops, the associated glyphosate use and the rise in chronic disease in the US. Genetic engineering To genetically modify a plant for herbicide tolerance, genes are identified which convey tolerance of the active chemical in the herbicide to the organism. In the case of glyphosate, glyphosate-tolerant genes were isolated from a strain of Agrobacterium. These were inserted into the genome of the plant via a multi-step process resulting in a plant that can withstand the direct application of the herbicide. Genetic modification is also utilised for developing insect resistant plants by using insecticidal proteins from Bacillus thuringiensis, or Bt toxin. The promoter used to drive the expression of the foreign genes is generally the 35S promoter from the Cauliflower Mosaic Virus (CaMV). Not only are the virus and bacteria genes themselves potentially harmful (Ho, 2013; Ewen & Pusztai, 1999), but the plants are sprayed directly with herbicides. The herbicide-tolerant plants absorb the poisons and humans and domestic animals eat them. The GMO industry claims that genetic engineering is no different than plant hybridisation, which has been practiced for centuries (FDA, 1992). It is the reason they gave, which the US Food and Drug Administration (FDA) accepted, for not having to submit GE food to rigorous safety testing to obtain FDA approval.
This distortion of the facts needs to be corrected. One critical issue is that multiple
genes are being transferred across taxonomical kingdoms in ways that do not occur by natural breeding methods (Bohn et al., 2014). All living things are classified according to a ranking system that starts with species and sub species. Closely related species are grouped together under a rank that is called a genus. Closely related genera are grouped together under the rank of family. There are seven ranks. Starting with the highest they are: kingdom, phylum or division, class, order, family, genus, species. Plants, animals, fungi, viruses and bacteria belong to separate kingdoms. Natural inter-breeding can take place between some species that belong to the same genus and very occasionally between species of different genera. However, species that belong to different families do not inter-breed and definitely species that belong to different kingdoms such as plants, animals, fungi, bacteria and viruses do not inter-breed in nature. Plants, for example, do not inter-breed with animals, bacteria or viruses. Genetic engineering allows for the transfer of genes between kingdoms in a way that does not occur naturally.

Swanson, Leu, Abrahamson & Wallet Journal of Organic Systems, 9(2), 2014
ISSN 1177-4258 8
The other great misconception is that only one gene with the desired trait is inserted. At this stage, science is not sophisticated enough to insert a single gene and get it to work. To overcome this problem, scientists have to combine the gene with the desired trait (such as herbicide tolerance or pesticide production) with other genes that will make it work, such as promoter genes and marker genes. The result is a complex construction of transgenes that can come from bacterial, viral, fish, plant and other sources. This is completely different from natural hybridisation. The stance taken by Monsanto, Dow, Bayer and the other purveyors of both chemicals and genetically engineered seeds is that GE food is “substantially equivalent” to non-GE products. According to the US FDA, “the substances expected to become components of food as a result of genetic modification of a plant will be the same as or substantially similar to substances commonly found in food, such as proteins, fats and oils, and carbohydrates” (FDA, 1992, Section I). The FDA maintains that it is up to the biotech companies that manufacture GE seeds to research and determine the safety of their products. But Bohn et al. (2014) were able to discriminate between organic, conventional and GE soybeans without exception, based on vitamin, fat and protein content. Furthermore, they were able to distinguish GE soybeans from both conventional and organic by their glyphosate and AMPA (glyphosate degradation product) residues, as well as substantial non-equivalence in numerous compositional characteristics of soybeans. The researchers stated, “Using 35 different nutritional and elemental variables to characterise each soy sample, we were able to discriminate GM, conventional and organic soybeans without exception, demonstrating ‘substantial non-equivalence’ in compositional characteristics for ‘ready-to-market’ soybeans” (p. 207). Exponentially increasing use of glyphosate world-wide Since glyphosate was introduced in 1974 as the active ingredient in Roundup® it has become the most widely used herbicide for urban, industrial, forest and farm use (Monsanto, 2010). Pre-harvest application of glyphosate to wheat and barley as a desiccant was suggested as early as 1980, and its use as a drying or ripening agent 7-10 days before harvest has since become routine. It is now used on grain crops, rice, seeds, dried beans and peas, sugar cane and sweet potatoes (Monsanto, 2010; Orgeron, 2012; Orson & Davies, 2007). According to the Canadian Pulse Growers Association (PGA pamphlet, 2012), “Desiccants are used worldwide by growers who are producing crops that require 'drying down' to create uniformity of plant material at harvest. These products may also assist in pre-harvest weed control. In Canada, products such as diquat (Reglone) and glyphosate (Roundup) have been used as desiccants in pulse crops in the past, and there are new products on the way.” In 2012, 98% of spring wheat, 99% of durum wheat and 61% of winter wheat were treated with glyphosate or glyphosate salts in the US (USDA:NASS, 2013c). The glyphosate plots in this study include all formulations of glyphosate. Monsanto, the manufacturer of Roundup®, states, “Since its discovery in the early 1970’s the unique herbicidal active ingredient glyphosate has become the world’s most widely used herbicide because it is efficacious, economical and environmentally benign. These properties have enabled a plethora of uses which continue to expand to this day providing excellent weed control both in agricultural and non-crop uses to benefit mankind and the environment. Glyphosate has an excellent safety profile to operators, the public and the environment. ... It is approved for weed control in amenity, industrial, forestry and aquatic areas. Roundup Pro Biactive and ProBiactive 450 can be used at any time of the year as long as weeds are green and actively growing” (Monsanto, 2010, p.1). The Monsanto document outlines use areas including vegetation control on agricultural land, on GE Roundup Ready Crops and on non-agricultural land. By 2006, glyphosate became used routinely for both agricultural and non-agricultural weed control and pre-harvest treatment. Since 1995, glyphosate use has rapidly increased with the planting of GE glyphosate-tolerant crops. Glyphosate and its degradation product, aminomethylphosphonic acid (AMPA) have been detected in air (Majewski et al., 2014, Chang et al., 2011), rain (Scribner et al., 2007, Majewski, 2014), groundwater (Scribner, 2007), surface water (Chang, 2011; Scribner, 2007; Coupe et al., 2012), soil (Scribner, 2007) and sea water (Mercurio et al., 2014). These studies show that glyphosate and AMPA persist in the soil and water, and the amounts detected are increasing over time with increasing agricultural use. Chang et al. (2011) reported that glyphosate was frequently detected in water, rain and air in the Mississippi River basin with concentrations as high as 2.5 µg/L in agricultural areas in Mississippi and Iowa. Because glyphosate is in air, water and food, humans are likely to be accumulating it in low doses over time. Glyphosate residues of up to 4.4 parts per million (ppm) have been detected in stems, leaves and beans of glyphosate-resistant soy, indicating uptake of the herbicide into plant tissue

Swanson, Leu, Abrahamson & Wallet Journal of Organic Systems, 9(2), 2014
ISSN 1177-4258 9
(Arregui et al., 2004). Reports from Germany of glyphosate in the urine of dairy cows (Kruger et al., 2013b), rabbits and humans (Kruger et al., 2014) ranged from 10-35 ppm. According to the study (Kruger, 2014, p. 212), “Chronically ill humans had significantly higher glyphosate residues in urine than healthy humans.” Furthermore, the cows were dissected and glyphosate residues in the tissues of the kidney, liver, lung, spleen, muscles and intestines were comparable to that found in the urine. This means that the glyphosate is not being passed through the urine without affecting the organism and that meat and dairy are an additional source of dietary glyphosate for humans. Industry and lobbyists claim that GE crops reduce the amount of pesticides used on crops, resulting in a more sustainable agriculture. This has proved not to be the case. Since the introduction of GE seeds in 1996 the amount of glyphosate used on crops in the US has increased from 27 million pounds in 1996 to 250 million pounds in 2009 (US Geological Survey pesticide use maps, 2013). Charles Benbrook (2012) showed that there was a 527 million pound (239 million kilogram) increase in herbicide use in the United States between 1996 and 2011. Furthermore, Benbrook states that the spread of glyphosate-resistant weeds has brought about substantial increases in the number and volume of herbicides applied. This has led to genetically engineered forms of corn and soybeans tolerant of 2,4-D, which he predicts will drive herbicide usage up by approximately 50% more. In the US, glyphosate residues allowed in food are some of the highest in the world. In July of 2013 the Environmental Protection Agency (EPA, 2013) raised the maximum allowable residues of glyphosate. An abbreviated list is provided in Table 1 and Table 2. Table 1. Glyphosate residues allowed in food from crops (EPA, 2013).
Crop Maximum residue allowance for glyphosate (ppm) Beet, sugar, dried pulp 25 Beet, sugar, roots 10 Beet, sugar, tops 10 Canola, seed 20 Corn, sweet, kernel plus cob 3.5 Grain, cereal, group 15 30 Oilseeds, except canola 40 Pea, dry 8 Peppermint, tops 200 Quinoa, grain 5 Shellfish 3 Soybean, seed 20 Spice subgroup 19B 7 Sugarcane, cane 2 Sugarcane, molasses 30 Sweet potatoes 3 Vegetable, legume, group 6 except soybean and dry pea
5
Table 2. Glyphosate residues allowed in livestock feed (EPA, 2013).
Animal feeds Maximum residue allowance for glyphosate (ppm) Grass, forage, fodder and hay, group 17 300 Grain, cereal, forage, fodder and straw 100 Soybean, forage 100 Soybean, hay 200 Soybean, hulls 120 Cattle, meat byproducts 5 Glyphosate and disease The connection between glyphosate and chronic disease has been outlined in a recent review paper by Samsel & Seneff (2013a). The authors show how glyphosate disrupts the metabolic process by interfering with the Cytochrome P450 (CYP) pathways. The CYP is known as a super-family of enzymes that are present in most tissues of the body. They are responsible for around 75% of the reactions involved in drug metabolism and the oxidation of organic molecules. According to the authors, “glyphosate enhances the damaging effects of other food borne chemical residues and environmental toxins. Negative impact on the body is insidious and manifests slowly over time as inflammation damages cellular systems throughout the body. Here, we show how interference with CYP enzymes acts synergistically with disruption of the biosynthesis of aromatic amino acids by gut bacteria, as well as impairment in serum sulfate transport. Consequences are most of the diseases

Swanson, Leu, Abrahamson & Wallet Journal of Organic Systems, 9(2), 2014
ISSN 1177-4258 10
and conditions associated with a Western diet, which include gastrointestinal disorders, obesity, diabetes, heart disease, depression, autism, infertility, cancer and Alzheimer’s disease. We explain the documented effects of glyphosate and its ability to induce disease, and we show that glyphosate is the 'textbook example' of exogenous semiotic entropy: the disruption of homeostasis by environmental toxins” (p. 1416). Séralini et al. (2011) reviewed 19 studies of animals fed with GE soy and corn. The studies covered more than 80% of the GE varieties that are widely cultivated around the world. Their review found significant levels of negative effects to the kidneys and livers of the animals that ingested GE feed. In another review article, Samsel & Seneff (2013b) point out that glyphosate is patented as a biocide and, as such, it kills the beneficial bacteria in our gut, leading to the steep rise in intestinal diseases. This has also been reported in the microbiota of horses and cows (Kruger, 2013a) and poultry (Shehata et al., 2012) where it was found that, “highly pathogenic bacteria as Salmonella Entritidis, Salmonella Gallinarum, Salmonella Typhimurium, Clostridium perfringens and Clostridium botulinum are highly resistant to glyphosate. However, most of beneficial bacteria such as Enterococcus faecalis, Enterococcus faecium, Bacillus badius, Bifidobacterium adolescentis and Lacto-bacillus spp. were found to be moderate to highly susceptible” (p. 350). The authors postulate that glyphosate is associated with the increase in C. botulinum-mediated diseases in these domestic farm animals. Carman et al. (2013) reported that a diet of GE corn and soy was associated with stomach inflammation in pigs. In 2012, Antoniou et al. published a review of the evidence on the teratogenicity and reproductive toxicity of glyphosate on vertebrates. Gasnier et al. (2009)
published evidence that glyphosate-based
herbicides are endocrine disruptors in human cells. They reported toxic effects to liver cells at 5 ppm and endocrine disrupting actions starting at 0.5 ppm. They concluded that glyphosate damages DNA in human cells. Subsequent studies have also shown that glyphosate is an endocrine disruptor (Paganelli et al., 2010; Antoniou et al., 2012). A more recent study showed that glyphosate causes the multiplication of estrogen sensitive human breast cancer cells, which further confirms that it acts as an endocrine disruptor (Thongprakaisang et al., 2013). An endocrine disruptor is a chemical that either mimics or blocks hormones and disrupts the body's normal functions. This disruption can happen through altering normal hormone levels, halting or stimulating the production of hormones, or interacting directly with the organ the hormone was meant to regulate. Because hormones work at very small doses, endocrine disruption can occur from low-dose exposure to hormonally active chemicals (Vandenberg et al., 2012). Threshold doses of pesticides are set based on toxicology studies assuming the response is linear. But the response is not only non-linear, it is also dependent on the hormone level in the body at any given time. The meta study on endocrine disruption by the World Health Organisation and the United Nations Environment Program clearly makes this point (Bergman et al., 2013, p. 19): “Endocrine disruptors produce non linear dose responses both in vitro and in vivo; these non linear dose responses can be quite complex and often include non-monotonic dose responses. They can be due to a variety of mechanisms; because endogenous hormone levels fluctuate, no threshold can be assumed.” Consequently, low doses over long periods of time may lead to very serious illnesses. Endocrine disruptors can increase or decrease hormone production, imitate hormones or even transform one hormone into another. Endocrine disruptors can also tell cells to die prematurely, compete with essential nutrients and build up in hormone-producing organs. These imbalances and malfunctions of the endocrine system can lead to diabetes, hypertension, obesity, kidney disease, cancer (breast, prostate, liver, brain, thyroid, non-Hodgkin's lymphoma) (Marc et al., 2004; Thongprakaisang et al., 2013), osteoporosis, Cushing's syndrome, hypo- and hyperthyroidism, infertility, birth defects, erectile dysfunction (Soto & Sonnenschein, 2010), sexual development problems and neurological disorders such as: learning disabilities, attention deficit disorder (ADD) (de Cock et al., 2012), autism (Schulkin, 2007), dementia (Ghosh, 2010), Alzheimer's (Merlo et al., 2010), Parkinson's and schizophrenia (MacSweeney et al., 1978). Endocrine disruptors are especially damaging to organisms undergoing hormonal changes: fetuses, babies, children, adolescents and the elderly (Bergman et al., 2013). Given that glyphosate disrupts gut bacteria balance, the metabolic process, the uptake of nutrients, the endocrine system, and damages DNA, it seemed likely that there would be correlations between the increase of these diseases and the exponential increase in the use of glyphosate, particularly with the advent of glyphosate-resistant food crops. To this end, we searched for epidemiological disease data, along with pesticide use on crops and the percentage of GE crops planted since first being

Swanson, Leu, Abrahamson & Wallet Journal of Organic Systems, 9(2), 2014
ISSN 1177-4258 11
introduced in 1995. These were plotted and Pearson correlation coefficients were calculated. These data, provided by the US government, are readily available on the internet.
Methods
United States Government databases were searched for GE crop data, glyphosate application data and disease epidemiological data. Correlation analyses were then performed on these time-series data sets. Crop data The United States Department of Agriculture National Agricultural Statistics Service (USDA:NASS) maintains a database of US crops. Every year they randomly select fields of certain crops and send surveys to the persons who manage those fields. Among other things, they ask what herbicides were used, the application rate, how many times was it applied, and whether or not the field was planted with a GE variety. Surveys are only sent to the states that are the major producers of a given crop, usually accounting for about 90% of the total US acreage planted in that crop. They then perform a statistical analysis and report the total acreage planted, the percentage of acres that are GE, the Percentage of Acres Treated (PAT) with each herbicide for that crop and the application rate per acre per year. One can then calculate the total amount of an herbicide that was applied to that crop in the survey states for that year. Data files from the USDA containing the information for GE varieties are available from 2000-2013 (USDA:NASS 2013a), but only corn, cotton and soy are tracked. Data for 1996-1999 were obtained from a USDA agricultural report (Fernandez-Cornejo & McBride, 2002). The survey states accounted for 85-90% of all corn, cotton and soy grown in the US. Sampling errors for the percentage of GE crops planted are given as 1-2%, varying by year and crop. The increase in the adoption of GE crops in the US from 1996-2010 is shown in Figure 1. Data files containing the information for herbicide applications are available from 1990-2012 (USDA:NASS 2013b). Sampling errors (reported as standard errors) are small (<5%) in both the PAT and the application rate if the PAT is greater than 50%. Sampling errors are 5-10% if the PAT is between 10-50%, while the sampling errors are 10-100% if the PAT is <10%. We extracted the data for glyphosate applications to corn, cotton and soy. Data for cotton was not included in these results because, except for cottonseed oil in food and cottonseed meal in animal food, cotton is not generally considered a food crop. Though the manufacturers claim that there are no GE content or traits in processed foods (like oil), it has been reported that glyphosate residues up to 0.350 ppm have been detected in refined soy oil (GEAC, 2006).

Swanson, Leu, Abrahamson & Wallet Journal of Organic Systems, 9(2), 2014
ISSN 1177-4258 12
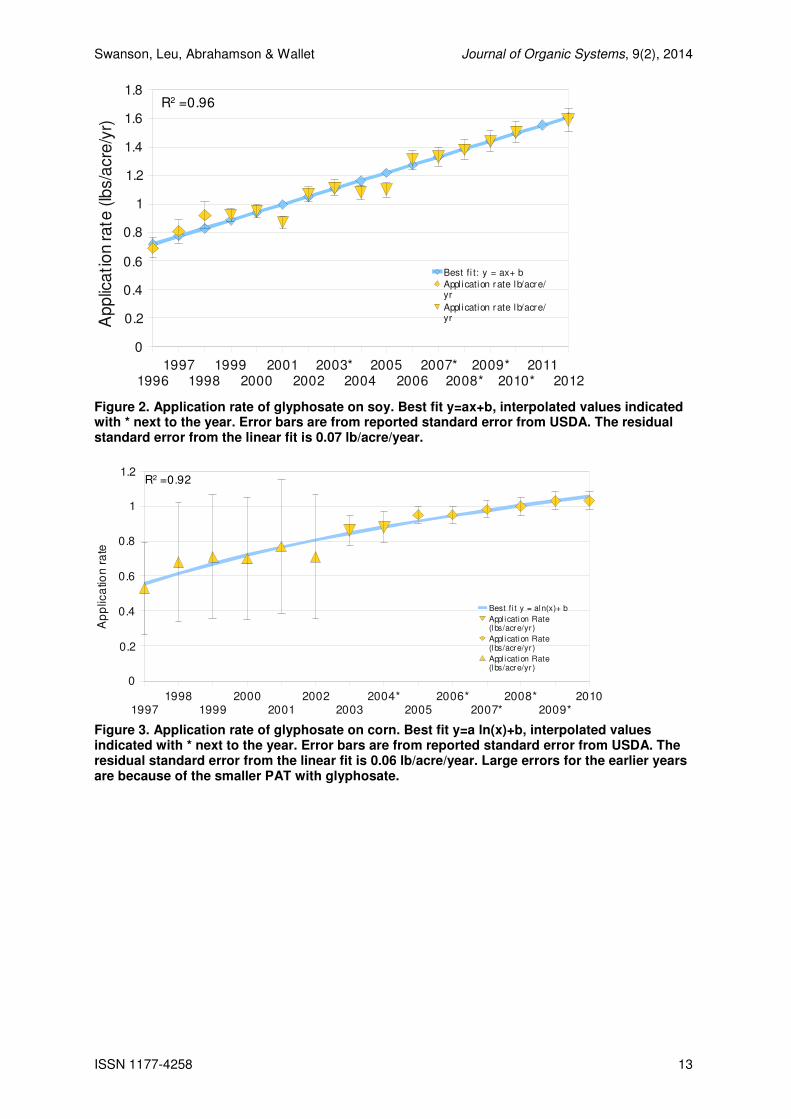
Figure 1. Adoption of GE crops in US. From 1990-2002, glyphosate data were available for all three crops, but beginning in 2003 data were not collected for all three crops in any given year. Data on the application rates were interpolated for the missing years by plotting and calculating a best fit curve. Results for the application rates for soy and corn are shown in Figures 2 and 3. Because the PAT was relatively small prior to about 1995, the sampling errors are much larger for pre-1995 data, more so for corn than for soy. Also, data were not missing until 2003 for soy and 2004 for corn. For these reasons, the interpolated curves begin in 1996 for soy and 1997 for corn in Figures 2 and 3. To calculate the amount of glyphosate applied, it was also necessary to interpolate the PAT for both corn and soy. This was easier because they followed almost exactly the curves for the percentage of acres planted in GE crops. GE soy crops are only herbicide tolerant (HT), which nicely tracked with the PAT for glyphosate, as shown in Figure 4. GE corn crops can be either insecticide resistant (Bt) or HT or both (stacked). The HT and stacked trait percentages, reported separately in the USDA files for corn, were plotted with the PAT for glyphosate as shown in Figure 5.
Swanson, Leu, Abrahamson & Wallet Journal of Organic Systems, 9(2), 2014
ISSN 1177-4258 13
19961997
19981999
20002001
20022003*
20042005
20062007*
2008*2009*
2010*2011
2012
0
0.2
0.4
0.6
0.8
1
1.2
1.4
1.6
1.8
Best fi t: y = ax+ bAppl ication rate lb/acre/yr
Appl ication rate lb/acre/yr
Year
Ap
plic
ati
on r
ate
(lb
s/a
cre
/yr)
R2 =0.96
Figure 2. Application rate of glyphosate on soy. Best fit y=ax+b, interpolated values indicated with * next to the year. Error bars are from reported standard error from USDA. The residual standard error from the linear fit is 0.07 lb/acre/year.
19971998
19992000
20012002
20032004*
20052006*
2007*2008*
2009*2010
0
0.2
0.4
0.6
0.8
1
1.2
Best fi t y = aln(x)+ b
Appl ication Rate (lbs/acre/yr )
Appl ication Rate (lbs/acre/yr )
Appl ication Rate (lbs/acre/yr )
Ap
plic
atio
n r
ate
R2 =0.92
Figure 3. Application rate of glyphosate on corn. Best fit y=a ln(x)+b, interpolated values indicated with * next to the year. Error bars are from reported standard error from USDA. The residual standard error from the linear fit is 0.06 lb/acre/year. Large errors for the earlier years are because of the smaller PAT with glyphosate.

Swanson, Leu, Abrahamson & Wallet Journal of Organic Systems, 9(2), 2014
ISSN 1177-4258 14
Figure 4. Percentage of GE soy crops planted and PAT with glyphosate. Interpolated values are indicated with an * next to the year. Data were not available for glyphosate applications to soy from 2007-2011. Data were only used through 2010; therefore the data point at 2011 was not interpolated. Data for 2012 are shown for reference.
Figure 5. Percent GE corn crops and PAT with glyphosate; interpolated values indicated with *. From these data, along with the total acreage planted in the survey states, the amount of glyphosate (in tons) applied to corn and soy crops in those states for each year from 1990-2010 was calculated and is shown in Figure 6. The calculation is: application rate (lbs/acre/year)*PAT/100*total acres planted. The contribution of glyphosate on soy is about twice that for corn. While both corn and soy are major US food crops (75-80 million acres planted annually), GE corn was more slowly adopted (Figure 1) and some of the earlier GE corn is Bt only. The curve for glyphosate applied to all three crops is included only to show that the shape of the curve is unchanged, so it is doubtful there would have been much change in the results had cotton been included.

Swanson, Leu, Abrahamson & Wallet Journal of Organic Systems, 9(2), 2014
ISSN 1177-4258 15
Figure 6. Glyphosate applied to corn, cotton and soy crops in the surveyed states. Standard errors (corn & soy): 2007-2010: 3-10%; 2000-2006: 7-16%; 1998-2000: 16-62%; 1992-1997: 16-100%; 1990-1991: 22-100%. Errors calculated from the USDA reported standard errors.
Epidemiological disease data
Databases were searched for epidemiological data on diseases that might have a correlation to glyphosate use and/or GE crop growth based on information given in the introduction. The primary source for these data was the Centers for Disease Control and Prevention (CDC). These data were plotted against the amount of glyphosate applied to corn and soy from Figure 6 and the total %GE corn and soy crops planted from Figure 1. The percentage of GE corn and soy planted is given by: (total estimated number of acres of GE soy + total estimated number of acres of GE corn)/(total estimated acres of soy + total estimated acres of corn)x100, where the estimated numbers were obtained from the USDA as outlined above.
Statistical analyses
A statistical analysis was performed on each of the data sets. A standard analysis for correlating two sets of data is to calculate the Pearson correlation coefficients. The Pearson correlation coefficient is based on the linear least-squares formulation, which in turn is based on the assumption that each of the individual variables is normally distributed. All of the US government data, both crop data and disease data, were gathered from surveys and census data. These data were statistically analysed and the results reported as an average with an associated error (standard deviation of the mean), indicating that normal distributions were assumed in the statistical methods used. We generated scatter plots for each set of data (disease vs. glyphosate applications and disease vs. percentage of GE crops) to determine whether or not the Pearson correlation method (i.e. linear least-squares method) was appropriate. The scatter plots showed a strong linear relationship between the two data sets in all cases. Plots of the residuals were checked to confirm homogeneity. The Pearson's correlation coefficient, R, is a determination of how closely correlated the two data sets
are, i.e., how close the scatter plot is to a line. For N pairs of ( yx, ) data, the correlation coefficient is
given by )/( yxxyR σσσ= where xyσ is the covariance, ∑ −−= ))((/1 yyxxN iixyσ and xσ and
yσ are the standard deviations of the x and y variables.
When the individual standard deviations are not known, but calculated from the data sets themselves,
the statistic )1/()2(2
RNRt −−= can be used to test the claim that there is a positive correlation
by calculating the probability that a value of R greater than or equal to that observed would have been

Swanson, Leu, Abrahamson & Wallet Journal of Organic Systems, 9(2), 2014
ISSN 1177-4258 16
obtained if R were in fact 0 (the null hypothesis). If this probability, the P-value, is less than 5%, the correlation is deemed to be significant. If it is less than 1% it is described as highly significant. The probabilities obtained here are very small, so we may confidently reject the null hypothesis that R = 0. After verifying the accuracy of the results, we performed the correlation calculations using the online statistical package from the University of Amsterdam (UA, 2014). Much of the CDC data is stored and retrieved according to the International Classification of Disease (ICD) codes. These codes changed from 1998 to 1999, causing some concern that there would be a discontinuity in the graphs between those years due to improper coding or added or subtracted categories. This only showed up in one graph, Alzheimer's. It is unclear whether the jump in the data on this graph is real or an artefact from the code change.
Results and Discussion
The plots are loosely grouped into related disease categories. If the disease data were linearly increasing prior to the 1990s, a linear trend line was overlaid on the plot in green. The error bars on the green trend lines are the residual standard errors from the least squares fit. In some cases, the axes have been adjusted to better illustrate the correlation; otherwise the data are plotted as is. In all cases, the left vertical axis is the prevalence or the rate of incidence or death from the disease. The right vertical axis is both the percentage of GE corn and soy planted and the amount (in 1,000 tons) of glyphosate applied to the corn and soy crops. Correlations of cancers of the liver, kidney, bladder, and thyroid with the planting of GE crops and glyphosate applications Epidemiology data for cancer incidence were obtained from the National Cancer Institute Surveillance, Epidemiology and End Results (SEER) database (National Cancer Institute, 2013). Based on published reports on endocrine disruptors, we expected but did not find correlations for: non-Hodgkin's lymphoma (slightly rising), prostate (oscillating), testicular (slightly rising), colon (slightly decreasing) and breast (slightly decreasing) cancers. The decrease in breast cancer may be attributable to reduced use of hormone replacement therapy (Chlebowski, 2012). We found strong correlations for cancers of the liver, kidney, bladder/urinary and thyroid. Results are shown in Figures 7-10. Thyroid and bladder cancers especially seem to track with the advent of GE crops and associated glyphosate applications. Thyroid cancer seems to affect females more, while males are more susceptible to liver and kidney cancers (not shown in graphs). We found weaker correlations between pancreatic cancer incidence (R = 0.84 with %GE crops & R = 0.92 with glyphosate applications) and deaths from acute myeloid leukaemia (R = 0.89 with %GE crops & R = 0.88 with glyphosate applications). Both of these peaked in the 1980s, then decreased and are now rising again. Pancreatic cancer incidence began rising again in 1996 and myeloid leukaemia deaths in 1989.

Swanson, Leu, Abrahamson & Wallet Journal of Organic Systems, 9(2), 2014
ISSN 1177-4258 17
Figure 7. Correlation between age-adjusted liver cancer incidence and glyphosate applications and percentage of US corn and soy crops that are GE.
Figure 8. Correlation between age-adjusted kidney cancer incidence and glyphosate applications and percentage of US corn and soy crops that are GE.

Swanson, Leu, Abrahamson & Wallet Journal of Organic Systems, 9(2), 2014
ISSN 1177-4258 18
Figure 9. Correlation between age-adjusted bladder/urinary tract cancer and glyphosate applications and percentage of US corn and soy crops that are GE.
Figure 10. Correlation between age-adjusted thyroid cancer incidence and glyphosate applications and percentage of US corn and soy crops that are GE. Correlations between hypertension and hemorrhagic strokes with the planting of GE crops and glyphosate applications Correlations for deaths due to hypertension and hemorrhagic stroke are shown in Figures 11 & 12. Death data were obtained from the CDC mortality files (CDC, 2013b).
Data for hypertensive heart
disease suffered from a discontinuity between the years 1998 and 1999, most likely due to the change in ICD codes at that time (Joyner-Grantham, 2010). After adjusting the latter data (multiplying by a

Swanson, Leu, Abrahamson & Wallet Journal of Organic Systems, 9(2), 2014
ISSN 1177-4258 19
constant factor) to remove the discontinuity, we found R = 0.93 with glyphosate applications and R = 0.94 with %GE crops, but the results are not presented here due to the necessary manipulation of those data.
Figure 11. Correlation between age-adjusted hypertension deaths and glyphosate applications and percentage of US corn and soy crops that are GE.
Figure 12. Correlation between age-adjusted hemorrhagic stroke deaths and glyphosate applications and percentage of US corn and soy crops that are GE.

Swanson, Leu, Abrahamson & Wallet Journal of Organic Systems, 9(2), 2014
ISSN 1177-4258 20
Correlations of obesity, lipoprotein metabolism disorder and diabetes with the planting of GE crops and glyphosate applications Epidemiological data for obesity deaths, lipoprotein metabolism (hyperlipidemia & hypercholesterolemia) disorder deaths, and diabetes incidence and prevalence also showed strong correlations with glyphosate use and GE crop growth. Death data were again obtained from the CDC mortality files (CDC, 2013b). Diabetes prevalence (CDC, 2013c) and incidence (CDC, 2013d) data were obtained from CDC National Center for Health Statistics. Results are shown in Figures 13-16. According to the CDC, approximately one third of people with diabetes have not been diagnosed. Therefore, the National Health Interview Survey underestimates the true incidence and prevalence of diabetes. Because diabetes and obesity are associated with sugar consumption, we present the per capita sweetener delivery for US consumption (USDA, 2013) in Figure 17. The majority of the sugar consumed is from corn, sugar beets and sugar cane. In 2011, 88% of the corn (USDA:NASS, 2013a) and 90% of sugar beets (ISAAA, 2011) planted in the US were GE. Glyphosate is routinely used for sugar cane crop ripening and desiccation (Orgeron, 2012). Hyperlipidemia is characterised by inflammation of the pancreas (pancreatitis), abdominal pain, enlargement of the liver and spleen (hepatosplenomegaly), and small yellow skin lesions called eruptive xanthomas (Raphael, 1993; Berglund, 2012). Diseases associated with secondary hyperlipidemias include obesity, diabetes mellitus (type I and type II), hypothyroidism, Cushing's syndrome, chronic kidney disease, nephrotic syndrome, and cholestatic disorder, a major risk factor for atherosclerosis and cardiovascular disease. According to Samsel & Seneff (2013a) glyphosate disrupts the CYP enzymes that are heavily involved in producing bile acids. Ordinarily, the liver exports a lot of cholesterol as cholesterol sulfate into the bile acids. This allows the digestive system to digest fats, which are then packaged up into the chylomicron with the cholesterol sulfate packed into its outer shell to deliver cholesterol to all the tissues. When the liver cannot make bile acids, it is forced to divert the cholesterol into LDL, so the LDL rises, resulting in hypercholesterolemia. Furthermore, lipoprotein metabolism disorder has been associated with Alzheimer's (AD) and Parkinson's diseases (Merlo, 2010). According to Merlo, “Recent evidence suggests a strict link between metabolic disorders and AD. In the last decade much attention has focused specifically on the connection between dysfunction of lipid metabolism and AD. Here we discuss aspects of lipid regulation, including changes in cholesterol levels, function of apolipoproteins and leptin, and how these relate to AD pathogenesis. Despite the vast literature available, many aspects still need clarification. Nevertheless, the route is already delineated to directly connect aspects of lipid regulation to AD” (p. 537).

Swanson, Leu, Abrahamson & Wallet Journal of Organic Systems, 9(2), 2014
ISSN 1177-4258 21
Figure 13. Correlation between age-adjusted obesity deaths and glyphosate applications and percentage of US corn and soy crops that are GE.
Figure 14. Correlation between age-adjusted diabetes incidence and glyphosate applications and percentage of US corn and soy crops that are GE.

Swanson, Leu, Abrahamson & Wallet Journal of Organic Systems, 9(2), 2014
ISSN 1177-4258 22
Figure 15. Correlation between age-adjusted diabetes prevalence and glyphosate applications and percentage of US corn and soy crops that are GE.
Figure 16. Correlation between age-adjusted lipoprotein disorder deaths and glyphosate applications and percentage of US corn and soy crops that are GE.

Swanson, Leu, Abrahamson & Wallet Journal of Organic Systems, 9(2), 2014
ISSN 1177-4258 23
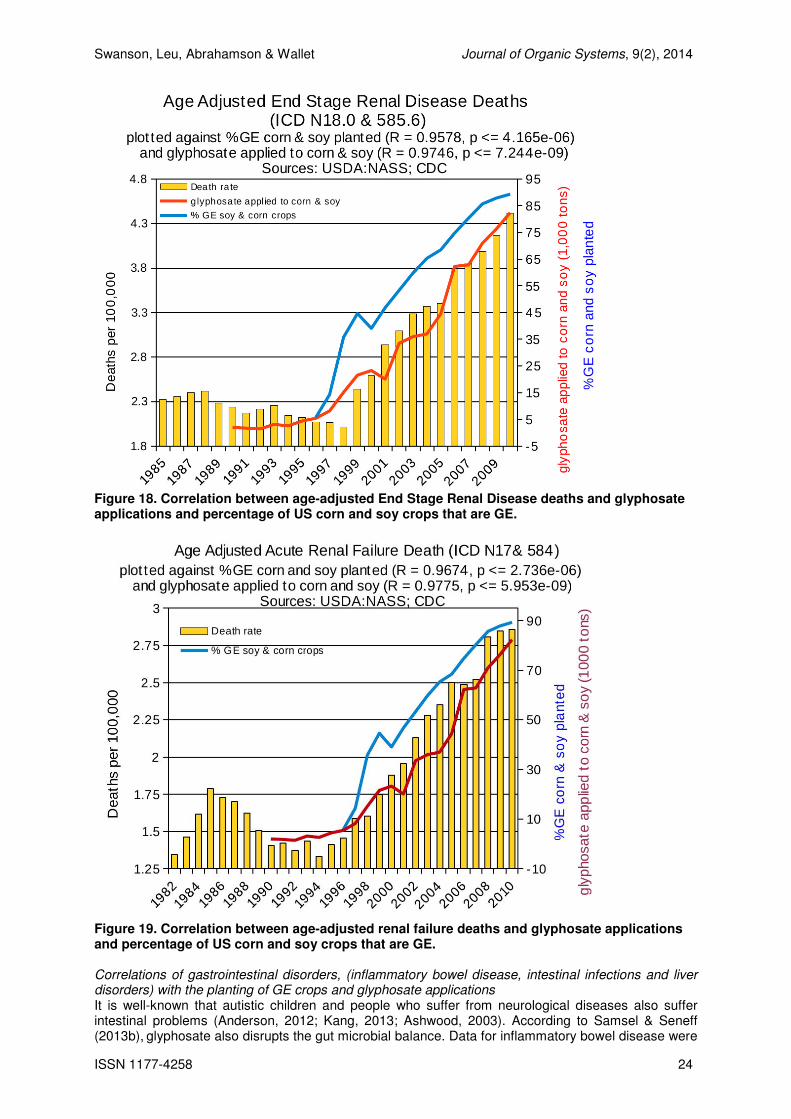
Figure 17. Sugar consumption in the US. The black line is sugar from cane, beet and corn combined; the red line is the total of all sources, including honey and syrups. Correlations of renal failure with the planting of GE crops and glyphosate applications Deaths from end stage renal disease (ESRD) and acute renal failure showed strong correlations with glyphosate use and GE crop growth. Death data were obtained from the CDC mortality files (CDC 2013b). Results are shown in Figures 18 and 19. Both of these have a peak in the mid-1980s, then decline and start rising again in the mid-1990s. The slight jump in ESRD deaths from 1998 to 1999 could be due to the ICD code changes at that time, but this was not apparent in the crude death rate data. Researchers in Sri Lanka reported massive kidney failure in rice paddy workers exposed to glyphosate in combination with minerals in hard water. According to Jayasumana et al. (2014) glyphosate’s strong chelating properties allow it to combine with heavy metals and arsenic in hard water resulting in damage to renal tissues, thereby causing chronic kidney diseases. The authors concluded that, “The GMA [Glyphosate-metal/arsenic complex] lattice hypothesis gives rational and consistent explanations to the many observations and unanswered questions associated with the mysterious kidney disease in rural Sri Lanka. Furthermore, it may explain the similar epidemics of CKDu [Chronic Kidney Disease of Unknown etiology] observed in Andra Pradesh, India and Central America” (p. 2139). An earlier study found that a 96 hour exposure to low levels of Roundup in water caused oxidative stress to the cells in the kidneys of goldfish (Lushchak et al., 2009). Studies by El-Shenawy (2009) and de Liz Oliveira Cavalli et al. (2013) confirm that Roundup and its active ingredient, glyphosate, caused oxidative stress and necrosis in the hepatic cells of rats. The only lifetime feeding trial of rats with GE maize, Roundup, and GE maize combined with Roundup, compared to the controls fed the non-GE isogenic line of the maize, found very significant chronic kidney deficiencies, for all treatments compared to the controls. Seralini et al. (2014) reported that, “In treated males, liver congestions and necrosis were 2.5 to 5.5 times higher. Marked and severe nephropathies were also generally 1.3 to 2.3 times greater. In females, all treatment groups showed a two- to threefold increase in mortality, and deaths were earlier.” (p.1)
Swanson, Leu, Abrahamson & Wallet Journal of Organic Systems, 9(2), 2014
ISSN 1177-4258 24
Figure 18. Correlation between age-adjusted End Stage Renal Disease deaths and glyphosate applications and percentage of US corn and soy crops that are GE.
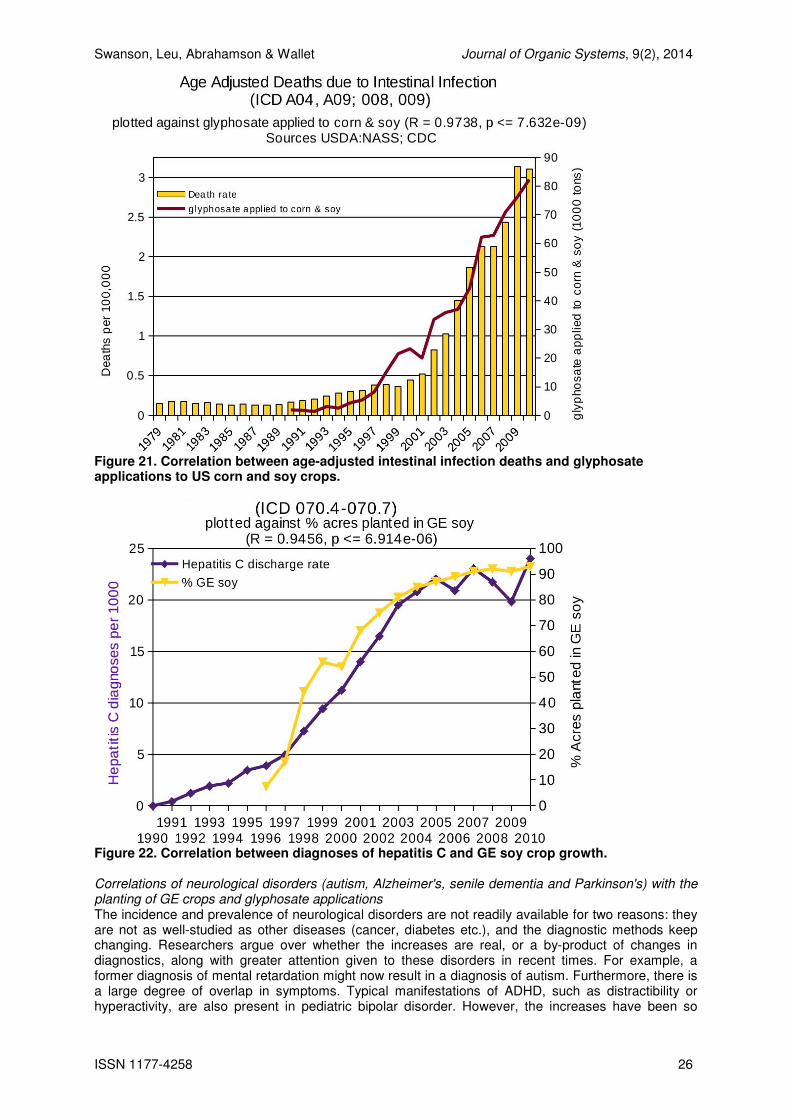
Figure 19. Correlation between age-adjusted renal failure deaths and glyphosate applications and percentage of US corn and soy crops that are GE. Correlations of gastrointestinal disorders, (inflammatory bowel disease, intestinal infections and liver disorders) with the planting of GE crops and glyphosate applications It is well-known that autistic children and people who suffer from neurological diseases also suffer intestinal problems (Anderson, 2012; Kang, 2013; Ashwood, 2003). According to Samsel & Seneff (2013b),
glyphosate also disrupts the gut microbial balance. Data for inflammatory bowel disease were

Swanson, Leu, Abrahamson & Wallet Journal of Organic Systems, 9(2), 2014
ISSN 1177-4258 25
obtained from the CDC hospital discharge data and are plotted in Figure 20 (CDC, 2013e). Data for deaths due to intestinal infection were obtained from the CDC mortality files (CDC, 2013b) and are shown in Figure 21. While retrieving these data, we stumbled upon a startling increase in hospital discharges for viral hepatitis C. At first this was puzzling. We do not imply that hepatitis is transmitted by food, but that the CaMV is very similar to hepatitis and HIV and if those are already dormant in the body, introduction of the CaMV through the food could activate them. Ho (2013, p. 4760) has stated that, “insertion mutations [can occur] including those leading to cancer, activation of dormant viruses, and recombination with viral sequences in the genome to generate new viruses; all of which have been demonstrated in gene therapy experiments”. And also, “New evidence raises the possibility that the CaMV 35S promoter in practically all transgenic crops grown commercially may enhance multiplication of disease-associated viruses including HIV through induction of proteins required for their transcription” (Ho et al., 2009, p. 172). Furthermore, recent evidence (Furuta, 2013) suggests that cholesterol sulfate is an inhibitor of the hepatitis C virus and, according to Samsel & Seneff (2013a),
glyphosate also interferes with the
uptake of nutrients, particularly sulfates. We searched the hospital discharge data from the CDC (CDC, 2013e) for diagnoses of hepatitis C. We found a correlation between those data and the percent of GE soy crops planted in the US. Results are shown in Figure 22. We also looked at the data for deaths from HIV, but found that they have been steadily decreasing.
Figure 20. Correlation between inflammatory bowel disease and glyphosate applications to US corn and soy crops.
Swanson, Leu, Abrahamson & Wallet Journal of Organic Systems, 9(2), 2014
ISSN 1177-4258 26
Figure 21. Correlation between age-adjusted intestinal infection deaths and glyphosate applications to US corn and soy crops.
Figure 22. Correlation between diagnoses of hepatitis C and GE soy crop growth. Correlations of neurological disorders (autism, Alzheimer's, senile dementia and Parkinson's) with the planting of GE crops and glyphosate applications The incidence and prevalence of neurological disorders are not readily available for two reasons: they are not as well-studied as other diseases (cancer, diabetes etc.), and the diagnostic methods keep changing. Researchers argue over whether the increases are real, or a by-product of changes in diagnostics, along with greater attention given to these disorders in recent times. For example, a former diagnosis of mental retardation might now result in a diagnosis of autism. Furthermore, there is a large degree of overlap in symptoms. Typical manifestations of ADHD, such as distractibility or hyperactivity, are also present in pediatric bipolar disorder. However, the increases have been so

Swanson, Leu, Abrahamson & Wallet Journal of Organic Systems, 9(2), 2014
ISSN 1177-4258 27
great in recent years that most experts now agree that they are real and must be environmentally induced (Weintraub, 2011). We found data for autism from the US Department of Education, Individuals with Disabilities Education Act (USDE:IDEA) (Gallup, 2002; Snyder, 2012). These data are for autistic children 6-21 years old served under IDEA. In the plot in Figure 23, the numbers for the year correspond to the beginning of the school year in the fall. According to the University of Washington Institute for Health Metrics and Evaluation (UW, 2012), Alzheimer's disease went from number 32 in 1990 to number 9 in 2010 in the ranking of leading causes of premature death in the US. Senile dementia and its care costs have also skyrocketed in the last two decades. Prevalence and incidence data were sparse, but data on death rates were available from 1979. Death data were again obtained from the CDC for senile dementia, Parkinson's & Alzheimer's diseases (CDC, 2013b). These are presented in Figures 24-26. A weaker correlation was found for multiple sclerosis deaths (R = 0.88 for %GE crops and R = 0.83 for glyphosate applications). Cattani et al. (2014) found that both acute and chronic exposure to Roundup induced oxidative stress resulting in neural cell death and neurotoxic effects in the hippocampus of immature rats. Lushchak et al. (2009) found that a 96-hour exposure to low levels of Roundup in water caused oxidative stress to the cells in the brains, livers and kidneys of goldfish.
Figure 23. Correlation between children with autism and glyphosate applications.

Swanson, Leu, Abrahamson & Wallet Journal of Organic Systems, 9(2), 2014
ISSN 1177-4258 28
Figure 24. Correlation between age-adjusted dementia deaths and glyphosate applications.
Figure 25. Correlation between age-adjusted Alzheimer's disease deaths and glyphosate applications and percentage of US corn and soy crops that are GE.

Swanson, Leu, Abrahamson & Wallet Journal of Organic Systems, 9(2), 2014
ISSN 1177-4258 29
Figure 26. Correlation between age-adjusted Parkinson's disease deaths and glyphosate applications and percentage of US corn and soy crops that are GE. Statistical summary of disease data correlations with GE crops planted and glyphosate applications The Pearson correlation coefficient is a measure of the linear relation between two variables, X and Y. The correlation coefficient, R lies between -1 and 1, and the coefficient of determination, R
2 is the
proportion of the variation in Y that can be accounted for by the linear part of its relation with X. If, for example, R = 0.9, then 81% of the variation in Y can be accounted for by the linear relation with X. If R = 1 and the (x,y) pairs are plotted on a graph, they lie on a straight line. In the social sciences, R ≥ 0.8 is considered a strong correlation. The values obtained here are much greater than that. It is important to bear in mind that the correlation coefficient measures only the strength of the linear part of the relation. Correlation of course only suggests cause and effect; it does not prove it. If, however, the variables X and Y both increase in time but not linearly, then the observation that the relation between them is close to linear, as indicated by the very high correlation coefficients that were obtained, is stronger evidence in favour of a causal relationship. The correlation coefficients, their squares and the p-values for the various incidences, prevalence and deaths due to diseases are summarised in Tables 3 and 4.

Swanson, Leu, Abrahamson & Wallet Journal of Organic Systems, 9(2), 2014
ISSN 1177-4258 30
Table 3. Pearson's coefficients between disease and glyphosate applications (N=21 encompassing 1990-2010), except autism (N=16; autism data only available for 1995-2010).
Disease Coefficient, R R2 × 100 Probability, p
Thyroid cancer (incidence) 0.988 97.6 ≤7.6E-9
Liver cancer (incidence) 0.960 92.1 ≤4.6E-8
Bladder cancer (deaths) 0.981 96.2 ≤4.7E-9
Pancreatic cancer (incidence) 0.918 84.2 ≤4.6E-7
Kidney cancer (incidence) 0.973 94.8 ≤2.0E-8
Myeloid leukaemia (deaths) 0.878 77.1 ≤1.5E-6
Lipoprotein metabolism (deaths) 0.973 94.8 ≤7.9E-9
Hypertension (deaths) 0.923 85.2 ≤1.6E-7
Stroke (deaths) 0.925 85.5 ≤1.5E-7
Obesity 0.962 92.5 ≤1.7E-8
Diabetes (prevalence) 0.971 94.3 ≤9.2E-9
Diabetes (incidence) 0.935 87.4 ≤8.3E-8
ESRD (deaths) 0.975 95.0 ≤7.2E-9
Renal failure (deaths) 0.978 95.6 ≤6.0E-9
Autism (prevalence) 0.989 97.9 ≤3.6E-7
Alzheimer's (deaths) 0.917 84.1 ≤2.2E-7
Parkinson's (deaths) 0.875 76.6 ≤1.6E-6
Dementia (deaths) 0.994 98.8 ≤1.8E-9
Multiple sclerosis (deaths) 0.828 68.5 ≤1.1E-5
Intestinal infection (deaths) 0.974 94.8 ≤7.6E-9
Inflammatory bowel 0.938 88.0 ≤7.1E-8 Table 4. Pearson's coefficients between disease and the percentage of US corn and soy crops that are GE (N=15 encompassing 1996-2010; GE crops were first planted in 1995).
Disease Coefficient, R R2 × 100 Probability, p
Thyroid cancer (incidence) 0.938 87.9 ≤2.2E-5
Liver cancer (incidence) 0.911 82.9 ≤5.4E-5
Bladder cancer (incidence) 0.945 89.3 ≤7.1E-6
Pancreatic cancer (incidence) 0.841 70.7 ≤4.0E-4
Kidney cancer (incidence) 0.940 88.4 ≤2.0E-5
Myeloid leukaemia (deaths) 0.889 79.0 ≤5.4E-5
Lipoprotein metabolism (deaths) 0.955 91.2 ≤4.7E-6
Hypertension (deaths) 0.961 92.3 ≤3.7E-6
Stroke (deaths) 0.983 96.6 ≤1.4E-6
Obesity 0.962 92.5 ≤3.5E-6
Diabetes (prevalence) 0.983 96.6 ≤5.1E-7
Diabetes (incidence) 0.955 91.2 ≤2.0E-6
ESRD (deaths) 0.958 91.7 ≤4.2E-6
Renal failure (deaths) 0.967 93.6 ≤2.7E-6
Alzheimer's (deaths) 0.937 87.9 ≤9.6E-6
Parkinson's (deaths) 0.952 90.6 ≤5.4E-6
Multiple sclerosis (deaths) 0.876 76.7 ≤8.0E-5
Hepatitis C (hospital diagnoses) 0.946 89.4 ≤6.9E-6

Swanson, Leu, Abrahamson & Wallet Journal of Organic Systems, 9(2), 2014
ISSN 1177-4258 31
There are four diseases in Table 3 that are not in Table 4 because we did not plot the percentage of GE crops for autism, dementia, inflammatory bowel and intestinal infection. We plotted only glyphosate applications against inflammatory bowel and intestinal infection because the information from Samsel & Seneff (2013b) indicated that glyphosate causes intestinal problems by killing beneficial bacteria in the intestines. We plotted only glyphosate applications against autism and dementia because the correlation coefficients were already 0.989 and 0.994 respectively. There is one disease (hepatitis C) in Table 4 that is not included in Table 3 because we did not plot hepatitis against glyphosate applications. This is because, according to Ho (2009; 2013), viral diseases may be activated by the CaMV promoter used in GE crops. We plotted the hepatitis C against the percentage of GE soy crops planted in the US because soy was more quickly adopted, is currently 98% of the total US soy crops, and is ubiquitous in packaged food in the US. Table 5 provides a summary of which diseases have the highest correlation. All of these have a very strong correlation coefficient with very high significance (very low probability that the correlation is random). The highest correlations were found for senile dementia, autism, bladder and thyroid cancer with glyphosate applications and stroke and diabetes prevalence with %GE crops planted. In most cases, diseases that had correlation coefficients of less than 0.95 with glyphosate applications had greater than 0.95 with %GE crops planted and vice-versa. Some had correlation coefficients exceeding 0.95 for both GE crops and glyphosate applications: obesity, lipoprotein metabolism disorder, ESRD, renal failure, prevalence of diabetes as well as kidney and bladder cancers. Table 5. Summary of correlation coefficients, showing the number of diseases with R in the various ranges for glyphosate applications and for %GE crops planted.
R-value range Correlation with glyphosate Correlation with %GE crops planted No. Disease No. Disease R > 0.98
R2 × 100 > 96%
4 Thyroid, autism, dementia, & bladder
2 Stroke, diabetes (prevalence)
0.97 < R < 0.98 94% < R
2 × 100 < 96%
6 ESRD, diabetes (prevalence), lipoprotein metabolism, intestinal, kidney & renal
0.95 < R < 0.97 90% < R
2 × 100 < 94%
2 Obesity, liver 7 Parkinson's, hypertension, diabetes (incidence), obesity, lipoprotein metabolism, ESRD, renal
0.90 < R < 0.95 81% < R
2 × 100 < 90%
6 Diabetes (incidence), inflammatory bowel, hypertension, stroke, Alzheimer's, pancreatic
7 Liver, bladder, kidney thyroid, pancreatic, Alzheimer's, hepatitis
0.86 < R < 0.9 74% < R
2 × 100 < 81%
2 Parkinson's, myeloid leukaemia 2 Myeloid leukaemia, multiple sclerosis
Correlation ≥ 0.90 18 16 Interpretation of results Some of the plots show a significant linear rise that began prior to 1990. Others show a peak in the 1980s, then a decline followed by another rise in the 1990s. Clearly, there are multiple factors involved. Though the data for glyphosate are only available beginning in 1990, glyphosate was first introduced in the marketplace in 1974. Other known endocrine disruptors are: BPA (bisphenol-A) and phthalates (both in plastics), dioxins (by-product of smelting, paper bleaching, manufacture of herbicides and pesticides), hexane (cooking oil extraction), atrazine, and polychlorinated biphenyls (PCBs - used in electrical equipment, coatings, inks, adhesives, flame-retardants, and paints) (Kavlock, 1996). The population of the US is bombarded with a veritable cocktail of chemicals daily in addition to GE food and glyphosate (Reuben, 2010). These include food preservatives (BHA & BHT), water contaminants (chlorine & fluoride), heavy metals, food additives (aspartame, monosodium glutamate, carrageenan) and food colouring, to name a few. The US President’s Cancer Panel reported that a study by the CDC found many toxic chemicals in the blood and urine of most Americans that they tested, and the Environmental Working Group found up to 232 xenobiotic chemicals in the placental cord blood of newborns in the US (Reuben, 2010). The people have been exposed to an increasing background level of chemicals and other toxins for over 70 years, yet few, if any, have increased at the rate of glyphosate and GE crops.

Swanson, Leu, Abrahamson & Wallet Journal of Organic Systems, 9(2), 2014
ISSN 1177-4258 32
According to Samsel & Seneff (2013a), glyphosate disrupts the ability of animals, including humans, to detoxify xenobiotics. This means that exposures to the numerous chemicals in food and the environment, such as endocrine disrupting chemicals and carcinogens, could be causing levels of damage that would not occur if the body were able to detoxify them. The accumulation of toxins as the result of low levels of poisoning over a long period of time leads to a high body burden or toxic load. Every person is unique and the ability of the body, or the path it takes to detoxify, is both genetic and acquired (Anderson, 2012). If the body burden becomes overwhelming, it could be that only a small amount of additional stress will induce the breakdown of the system in whatever way that manifests according to individual predisposition. If we know that a causal factor exists, that is A causes B, then we would expect a high degree of correlation between the two data sets for A and B. The inverse is not true, i.e. because there is a high degree of correlation between A and B it is not necessarily the case that A causes B or vice-versa. However, we have data for 22 diseases, all with a high degree of correlation and very high significance. It seems highly unlikely that all of these can be random coincidence. Ruling out coincidence, we are left with these three options: 1. There is a direct cause and effect relationship 2. The relationship may be caused by a third variable 3. The relationship may be caused by complex interactions of several variables In 1965, Austin Bradford Hill addressed the problem of deducing causation when observations reveal an association beyond what can be considered random chance (Hill, 1965). Hill proposed nine conditions that should be considered as an aid in determining causation. These are the well-known Hill's Criteria. Since we have not performed an experiment, and we do not have information on dose/response, it would be difficult to go through and say this criterion is true and this one is not for all of the diseases as a whole. However, we quote from the American Academy of Environmental Medicine's position paper on genetically modified (GM) foods: “[S]everal animal studies indicate serious health risks associated with GM food consumption including infertility, immune dysregulation, accelerated aging, dysregulation of genes associated with cholesterol synthesis, insulin regulation, cell signaling, and protein formation, and changes in the liver, kidney, spleen and gastrointestinal system.” “There is more than a casual association between GM foods and adverse health effects. There is causation as defined by Hill's Criteria in the areas of strength of association, consistency, specificity, biological gradient, and biological plausibility” (Dean & Armstrong, 2009, online). The document goes on to explain in detail why and how each of these criteria are met based on published research.
Conclusions
These data show very strong and highly significant correlations between the increasing use of glyphosate, GE crop growth and the increase in a multitude of diseases. Many of the graphs show sudden increases in the rates of diseases in the mid-1990s that coincide with the commercial production of GE crops. The large increase in glyphosate use in the US is mostly due to the increase in glyphosate-resistant GE crops. The probabilities in the graphs and tables show that it is highly unlikely that the correlations are a coincidence. The strength of the correlations shows that there is a very strong probability that they are linked somehow. The number of graphs with similar data trends also indicates a strong probability that there is a link. Although correlation does not necessarily mean causation, when correlation coefficients of over 0.95 (with p-value significance levels less than 0.00001) are calculated for a list of diseases that can be directly linked to glyphosate, via its known biological effects, it would be imprudent not to consider causation as a plausible explanation. We do not imply that all of these diseases have a single cause as there are many toxic substances and pathogens that can contribute to chronic disease. However, no toxic substance has increased in ubiquity in the last 20 years as glyphosate has. The disruption by glyphosate of the detoxification pathways in the human body can intensify the effect of other toxic chemicals. The disruption of the Cytochrome P450 pathways by glyphosate could account for it causing numerous diseases (Samsel & Seneff, 2013a). The Cytochrome P450 enzymes are the superfamily of enzymes that are responsible for around 75% of the reactions involved in drug metabolism and the oxidation of organic molecules (Guengerich, 2008). Another critical issue is that glyphosate is an endocrine disruptor and it has been argued that there are no safe levels of endocrine disruptors (Vandenberg et al., 2012; Bergman et al., 2013). This would imply that the current permitted residue levels in food could be causing multiple

Swanson, Leu, Abrahamson & Wallet Journal of Organic Systems, 9(2), 2014
ISSN 1177-4258 33
health problems that have been documented in the scientific literature to be caused by endocrine disrupting chemicals. The findings reported by Kruger et al. (2014) that there is no significant difference in glyphosate residues detected in the urine, tissue and organs of cows is evidence that glyphosate bio-accumulates in our bodies. The research showing that Roundup and glyphosate cause oxidative stress resulting in changes to cell functions, necrosis in cells and neurotoxic effects in brain, kidney hepatic, testis and Sertoli cells needs to be considered as a possible causative agent in a range of diseases (Cattani et al., 2014; de Liz Oliveira Cavalli et al., 2013; Lushchak et al., 2009; El-Shenawy, 2009). The prevalence of certain diseases is likely to rise simply due to better treatments available, allowing people to live longer with the diseases. All of the graphs, save three (inflammatory bowel, hepatitis & autism), are age-adjusted. The age-adjustment would partially account for many of the people living longer with chronic diseases, and consequently this group of people would not be a significant reason for the dramatic increase in diseases found in most of the graphs. An increase in surveillance of a particular disease can artificially increase the prevalence of the disease because it merely increases the known number of cases, when the actual number has not changed. Surveillance of certain diseases has been boosted over recent decades, and may have artificially increased the prevalence of some of these diseases. The increased surveillance would initially find more cases and subsequently show an increase; however this would be expected to capture approximately the same percentage every year and would thus level off fairly quickly. If the actual prevalence of diseases was not increasing, the graphs would show a new stasis that would remain fairly level reflecting the extra cases found by the surveillance. The rates of disease prevalence are steadily increasing, so increased surveillance cannot be a significant reason for the dramatic and continuing rise in many of the diseases shown in the graphs since the 1990s. Any increase in surveillance could only account for part of the increase shown in the graphs. In reviewing the toxicity of chemicals based on the latest peer reviewed science, the US President’s Cancer Panel report was critical about the current testing methodologies and the lack of action taken by regulatory authorities (Reuben, 2010). According to the report, the regulatory approach in the US is reactionary rather than precautionary. Instead of taking preventive action when uncertainty exists about the potential harm a chemical or other environmental contaminant may cause, a hazard must be incontrovertibly demonstrated before action is initiated. Instead of requiring industry to prove the safety of their devices or chemical products, the public bears the burden of proving that a given environmental exposure is harmful. The current testing methodologies, length of feed trials of GE crops, and the parameters measured are insufficient to evaluate the health problems that may be caused by diets consisting of GE food (Seralini et al., 2011). The lack of proper testing protocols means that there is insufficient data to show that the increase in GE crops and glyphosate is not linked to the increase in diseases. The data presented in this paper highlight the need for independent scientific research to be conducted, especially in the areas of the endocrine disruption, cancer precursor, oxidative stress, gut microbiome and the Cytochrome P450 pathways. It is our hope that, in addition to more basic research in the form of toxicology and carcinogenic studies, epidemiology studies will be undertaken by experts in each of these disease categories. Conflicts of Interest The authors declare no conflicts of interest.
References
Anderson, M.D., 2012. Autism Prevention Care and Management. Traverse City, Michigan: Allegra Printing.
Antoniou, M., Habib, M.E.M., Howard, C.V., Jennings, R.C., Leifert, C., Nodari, R.O., Robinson, C.J. and Fagan. J., 2012. Teratogenic Effects of Glyphosate-Based Herbicides: Divergence of Regulatory Decisions from Scientific Evidence. Journal of Environmental and Analytical Toxicology, S: 4.
Arregui, M.C., Lenardón, A., Sanchez, D., Maitre, M.I. and Enrique, S., 2004. Monitoring glyphosate residues in transgenic glyphosate-resistant soybean. Pesticide Management Science, 60(2): 163-166.

Swanson, Leu, Abrahamson & Wallet Journal of Organic Systems, 9(2), 2014
ISSN 1177-4258 34
Ashwood P., Murch S.H., Anthony A., Pellicer A.A., Torrente F., Thomson M.A., Walker-Smith, J.A. and Wakefield A.J., 2003. Intestinal Lymphocyte Populations in Children with Regressive Autism: Evidence for Extensive Mucosal Immunopathology. Journal of Clinical Immunology, 23(6): 504-517.
Autoimmunity Research Foundation., 2012. Incidence and Prevalence of Chronic Disease. Autoimmunity Research Foundation. http://mpkb.org/home/pathogenesis/epidemiology (Viewed: 9 February 2013)
Benbrook, C.B., 2012. Impacts of genetically engineered crops on pesticide use in the U.S. -- the first sixteen years. Environmental Sciences Europe, 24(24): 2190-4715. http://www.enveurope.com/content/24/1/24 (Viewed: 9 February, 2013)
Berglund, L., Brunzell, J.D., Goldberg, A.C., Goldberg, I.J., Sacks, F., Murad, M.H. and Stalenhoef, A.F.H., 2012. Evaluation and treatment of hypertriglyceridemia: an endocrine society clinical practice guideline. Journal of Clinical Endocrinology and Metabolism, 97 (9): 2969–89.
Bergman, A., Heindel, J.J., Jobling, S., Kidd, K.A. and R. Zoeller, T. (eds.), 2013. State of the science of endocrine disrupting chemicals 2012, United Nations Environment Programme and the World Health Organization, ISBN: 978-92-807-3274-0 (UNEP) and 978 92 4 150503 1 (WHO) (NLM classification: WK 102)
Bezruchka, S., 2012. The Hurrider I Go the Behinder I Get: The Deteriorating International Ranking of U.S. Health Status. Annual Review of Public Health, 33: 157-173.
Bohn, T., Cuhra, M., Travail, T., Sanden, M., Fagan, J. and Primicerio, R., 2014. Compositional differences in soybeans on the market: glyphosate accumulates in Roundup Ready GM soybeans. Food Chemistry. 153: 207-15.
Carman, J. A., Vlieger, H.R., Ver Steeg, L.J., Sheller, V.E., Robinson, G.W., Clinch-Jones C.A., Haynes, J.I., John, W. and Edwards, J.W., 2013. A long-term toxicology study on pigs fed a combined genetically modified (GM) soy and GM maize diet, Journal of Organic Systems, 8(1): 38-54.
Cattani, D., de Liz Oliveira Cavalli, V.L., Heinz Rig, C.E., Dominguez, J.T., Dal-Cim, T., Tosca, C.I., Mena Barreto Silva, F.R. and Zamoner, A,. 2014. Mechanisms underlying the neurotoxicity induced by glyphosate-based herbicide in immature rat hippocampus: Involvement of glutamate excitotoxicity. Toxicology. 2014 Mar 15;320C:34-4.
CDC, 2013a. Rising Health Care Costs are Unsustainable, Centers for Disease Control and Prevention. http://www.cdc.gov/workplacehealthpromotion/businesscase/reasons/rising.html (Viewed: 17 December 2013)
CDC, 2013b. Death data, Centers for Disease Control and Prevention, National Center for Health Statistics. Compressed Mortality Files on CDC WONDER Online Database. 1999-2010 Data are compiled from Compressed Mortality File 1999-2010 Series 20 No. 2P, released Jan. 2013. 1989-1998 Data are compiled from Compressed Mortality File CMF 1989-1998, Series 20, No. 2E, 2003. Available at: http://wonder.cdc.gov/mortSQL.html (Last viewed: 19 November 2013)
CDC, 2013c. Diabetes prevalence data. Centers for Disease Control and Prevention, National Center for Health Statistics, Division of Health Interview Statistics, data from the National Health Interview Survey. Statistical analysis by the Centers for Disease Control and Prevention, National Center for Chronic Disease Prevention and Health Promotion, Division of Diabetes Translation. http://www.cdc.gov/diabetes/statistics/prev/national/figage.htm (Last viewed: 19 November 2013)
CDC, 2013d. Diabetes incidence data. Centers for Disease Control and Prevention, National Center for Health Statistics, Division of Health Interview Statistics, data from the National Health Interview Survey. Data computed by personnel in the Division of Diabetes Translation, National Center for Chronic Disease Prevention and Health Promotion. http://www.cdc.gov/diabetes/statistics/incidence/fig2.htm (Last viewed: 19 November 2013)
CDC, 2013e. Hospital discharge data. Centers for Disease Control and Prevention. Available at: http://www.cdc.gov/nchs/nhds/nhds_publications.htm (Last viewed: 10 December 2013)
Chang, F.C., Simcik, M.F. and Capel, P.D., 2011. Occurrence and fate of the herbicide glyphosate and its degradate aminomethylphosphonic acid in the atmosphere. Environmental Toxicology and Chemistry, 30(3): 548-55.
Chlebowski, R.T. and Anderson, G.L., 2012. Changing Concepts: Menopausal Hormone Therapy and Breast Cancer. Journal of the National Cancer Institute, 104 (7): 517-527.
Coupe, R.H., Kalkhoff, S.J., Capelc, P.D., and Gregoired, C., 2012. Fate and transport of glyphosate and aminomethylphosphonic acid in surface waters of agricultural basins. Pest Management Science, 68(1): 16-30.
de Cock, M., Maas, Y.G. and van de Bor M., 2012. Does perinatal exposure to endocrine disruptors induce autism spectrum and attention deficit hyperactivity disorders? Acta Paediatric, 101(8): 811-819.
de Liz Oliveira Cavalli, V.L., Cattani, D., Heinz Rieg, C.E., Pierozan. P., Zanatta. L., Benedetti Parisotto, E., Wilhelm Filho, D., Mena Barreto Silva, F.R. and Pessoa-Pureur R,Zamoner, A,.

Swanson, Leu, Abrahamson & Wallet Journal of Organic Systems, 9(2), 2014
ISSN 1177-4258 35
2013. Roundup disrupts male reproductive functions by triggering calcium-mediated cell death in rat testis and Sertoli cells. Free Radical Biology & Medicine. 65:335-46.
Dean, A. & Armstrong, J., 2009. Genetically Modified Foods, American Academy of Environmental Medicine Position Paper, online. http://aaemonline.org/gmopost.html
El-Shenawy, N.S., 2009. Oxidative stress responses of rats exposed to Roundup and its active ingredient glyphosate. Environmental Toxicology and Pharmacology. 28(3):379-85.
EPA, 2013. Electronic Code of Federal Regulations, Title 40: Protection of Environment. PART 180—Tolerances and Exemptions for Pesticide Chemical Residues in Food. Subpart C—Specific Tolerances. Environmental Protection Agency, Washington, DC.
Ewen, S.W. and Pusztai, A., 1999. Effect of diets containing genetically modified potatoes expressing Galanthus nivalis lectin on rat small intestine. Lancet, 354(9187): 1353-1354.
FDA,1992. Statement of Policy - Foods Derived from New Plant Varieties. FDA Federal Register Volume 57. Food and Drug Administration, Silver Spring.
Fernandez-Cornejo, J. and McBride, W., 2002. Adoption of Bioengineered Crops. USDA Economic Research Service Agricultural Economic Report No. (AER-810) USDA Agricultural Economic Report No. (AER-810) 67 pp, May 2002
Furuta, A., Salam, K.A., Akimitsu, N., Tanaka, J., Tani, H., Yamashita, A., Moriishi, K., Nakakoshi, M., Tsubuki, M., Sekiguchi, Y., Tsuneda, S. and Noda, N., 2013. Cholesterol sulfate as a potential inhibitor of hepatitis C virus NS3 helicase. Journal of Enzyme Inhibition and Medicinal Chemistry, 29(2): 223-229.
Gallup, R., 2002. The Autism Epidemic in the USA-Our Bitter Harvest and National Shame. Vaccination News. www.vaccinationnews.com/Scandals/feb_15_02/GallupPressRelease.htm (Last viewed: 21 November 2013)
Gasnier, C., Dumont, C., Benachour, N., Clair, E., Chagnon, M.C. and Séralini, G.E., 2009. Glyphosate-based herbicides are toxic and endocrine disruptors in human cell lines. Toxicology, 262(3): 184-191.
GEAC, 2006. Decisions taken in the 71st Meeting of the Genetic Engineering Approval Committee held on 11.10.2006. Genetic Engineering Approval Committee, Ministry of Environment and Forests, Government of India, Sect. 1.1.4.
Ghosh, A., 2010. Endocrine, metabolic, nutritional, and toxic disorders leading to dementia. Annals of Indian Academy of Neurology, (Suppl 2): S63-8.
Guengerich, F.P., 2008. Cytochrome P450 and chemical toxicology. Chem. Res. Toxicol. 21(1): 70-83.
Hill, A., 1965. The environment and disease: Association or causation. Proceedings of the Royal Society of Medicine, 58 (5): 295-300.
Ho, M.W., Ryan, A. and Cummins, J., 2009. New evidence links CaMV 35S promoter to HIV transcription. Microbial Ecology in Health and Disease, 21: 172–174.
Ho, M., 2013. The New Genetics and Natural versus Artificial Genetic Modification. Entropy, 15(11), 4748-4781. http://www.mdpi.com/1099-4300/15/11/4748 (Viewed: 14 October, 2013)
International Service for the Acquisition of Agri-biotech Applications, 2011. Global Status of Commercialized Biotech/GM Crops: 2011. ISAAA Brief 43-2011. International Service for the Acquisition of Agri-biotech Applications, Ithaca.
Jayasumana, C., Gunatilake, S. and Senanayake, P., 2014. Glyphosate, Hard Water and Nephrotoxic Metals: Are They the Culprits Behind the Epidemic of Chronic Kidney Disease of Unknown Etiology in Sri Lanka? International Journal of Environmental Research and Public Health, 11, 2125-2147;
Joyner-Grantham, J., Simmons, D.R., Moore, M.A. and Ferrario, C.M., 2010. The impact of changing ICD code on hypertension-related mortality in the southeastern United States from 1994-2005. Journal of Clinical Hypertension, 12(3): 213-22.
Kang, D., Park, J.G., Ilhan, Z.E., Wallstrom, G., LaBaer, J., Adams, J.B. and Krajmalnik-Brown, R., 2013. Reduced incidence of Prevotella and other fermenters in intestinal microflora of autistic children. PLoS ONE, 8(7): e68322.
Kavlock, R.J., Daston, G.P., DeRosa, C., Fenner-Crisp, P., Gray, L.E., Kaattari, S., Lucier, G., Luster, M., Mac, M.J., Maczka, C., Miller, R., Moore, J. Rolland, R., Scott, G., Sheehan, D.M. Sinks, T. and Tilson, H.A., 1996. Research needs for the risk assessment of health and environmental effects of endocrine disruptors: a report of the U.S. EPA-sponsored workshop. Environmental Health Perspectives, 104(Suppl 4): 715-740.
Kruger, M., Shehata, A.A., Schrödl, W. And Rodloff, A., 2013a. Glyphosate suppresses the antagonistic effect of Enterococcus spp. On Clostridium botulinum. Anaerobe, 20: 74-78.
Kruger, M., Schrödl, W., Neuhaus, J. and Shehata, A.A., 2013b. Field Investigations of glyphosate in urine of danish dairy cows. Journal of Environmental and Analytical Toxicology, 3(5): 186-192.

Swanson, Leu, Abrahamson & Wallet Journal of Organic Systems, 9(2), 2014
ISSN 1177-4258 36
Kruger, M., Schledorn, P., Schrödl, W., Hoppe, H.W., Lutz, W. and Shehata, A.A., 2014. Detection of glyphosate residues in animals and humans. Journal of Environmental and Analytical Toxicology, 4(2): 210-15.
Lushchak, O.V., Kubrak, O.I., Storey, J.M., Storey, K.B. and Lushchak, V.I., 2009. Low toxic herbicide Roundup induces mild oxidative stress in goldfish tissues. Chemosphere. 76(7): 932-7.
MacSweeney, D., Timms, P. and Johnson A., 1978. Preliminary communication thyro-endocrine pathology, obstetric morbidity and schizophrenia: survey of a hundred families with a schizophrenic proband. Psychological Medicine, 8(1): 151-155.
Majewski, M.S., Coupe, R.H., Foreman, W.T. and Capel, P.D., 2014. Pesticides in Mississippi air and rain: a comparison between 1995 and 2007. Environmental Toxicology and Chemistry, 33(6): 1283-1293.
Marc, J., Mulner-Lorillon, O. and Bellé, R., 2004. Glyphosate-based pesticides affect cell cycle regulation, Biology of the Cell, 96(3): 245-249.
Mercurio P, Flores F, Mueller JF, Carter S, Negri AP. 2014. Glyphosate persistence in seawater. Marine Pollution Bulletin, 85(2): 385-390.
Merlo, S., Spampinato, S., Canonico, P.L., Copani, A. and Sortino, M.A., 2010. Alzheimer’s disease: brain expression of a metabolic disorder? Trends in Endocrinology and Metabolism, 21(9): 537-544.
Monsanto International sàrl and Monsanto Europe sa, 2010. The Agronomic Benefits of Glyphosate in Europe-Benefits of glyphosate per market use—REVIEW www.monsanto.com/products/Documents/glyphosate-background-materials/Agronomic%20benefits%20of%20glyphosate%20in%20Europe.pdf (Viewed: 3 September, 2013)
National Cancer Institute, 2013. Cancer data: National Cancer Institute-Surveillance Epidemiology and End Results (SEER) SEER 9 areas (San Francisco, Connecticut, Detroit, Hawaii, Iowa, New Mexico, Seattle, Utah, and Atlanta). Rates are per 100,000 and are age-adjusted to the 2000 US Std Population (19 age groups - Census P25-1130). http://seer.cancer.gov/csr/1975_2009_pops09/browse_csr.php?section=14andpage=sect_14_table.05.html (Last viewed: 19 November 2013)
Orgeron, A.J., 2012. Sugarcane growth, sucrose content, and yield response to the ripeners glyphosate and trinexapacethyl. PhD Dissertation, School of Plant, Environmental, and Soil Sciences, Louisiana State University.
Orson, J.H. and Davies, D.K.H., 2007. Pre-harvest glyphosate for weed control and as a harvest aid in cereals. Research Review No. 65. HGCA.
Paganelli, A., Gnazzo ,V., Acosta, H., López, S.L. and Carrasco, A.E., 2010. Glyphosate-based Herbicides Produce Teratogenic Effects on Vertebrates by Impairing Retinoic Acid Signaling. Chemical Research in Toxicology, 23(10): 1586–1595.
Pulse Growers Association, Canada, 2012. 2012 Harvest management tools and regulatory requirements for pulse crops. www.manitobapulse.ca/wp-content/uploads/2012-Harvest-Management-Tools-and-Regulatory-Requirements-for-Pulse-Crops.pdf
Pritchard, C., Meyers, A., and Baldwin, D., 2013. Changing patterns of neurological mortality in the 10 major developed countries.-- 1979-2010. Public Health, 127(4): 357-368.
Raphael, S.J., Macaulay, J.D., Miller, C., Thomas, J. and Asa, S.L., 1993. Pancreatic xanthomatous neuropathy associated with hyperlipidemia: a cause of abdominal pain mimicking chronic pancreatitis. Human Pathology, 24(9): 1023-1025.
Reuben, S. H. (ed.), 2010. Reducing environmental cancer risk, what we can do now. US President’s Cancer Panel 2008–2009 Annual Report, April 2010. US Department of Health and Human Services, National Institutes of Health, National Cancer Institute.
Rosenbloom, A.L., Joe, J.R., Young, R.S. and Winter, W.E., 1999. Emerging epidemic of type 2 diabetes in youth. Diabetes Care, 22(2): 345-354.
Samsel, A. and Seneff, S., 2013a. Glyphosate’s suppression of cytochrome P450 enzymes and amino acid biosynthesis by the gut microbiome: pathways to modern diseases. Entropy, 15(4): 1416-1463.
Samsel, A. and Seneff, S., 2013b. Glyphosate, pathways to modern diseases II: Celiac sprue and gluten intolerance. Interdisciplinary Toxicology, 6(4): 159-184.
Scribner, E.A., Battaglin, W.A., Gilliom, R.J. And Meyer, M.T., 2007 Concentrations of glyphosate, its degradation product, aminomethylphophonic acid, and glufosinate in ground- and surface-water, rainfall, and soil samples collected in the United States, 2001-06S. Geological Survey Scientific Investigations Report 2007-5122.
Schulkin, J., 2007. Autism and the amygdala: An endocrine hypothesis. Brain and Cognition, 65(1): 87-99.

Swanson, Leu, Abrahamson & Wallet Journal of Organic Systems, 9(2), 2014
ISSN 1177-4258 37
Seralini, G.Eric.,Clair, E., Mesnage, R., Gress, S., Defarge, N., Malatesta, M., Hennequin, D. and Spiroux de Vendômois, J., 2014, Republished study: long-term toxicity of a Roundup herbicide and a Roundup-tolerant genetically modified maize. Environmental Sciences Europe, 2014: 14.
Seralini, G.E., Mesnage, R., Clair, E., Gress, S., de Vendomois, J. and Cellier, D., 2011. Genetically modified crops safety assessments: present limits and possible improvements. Environmental Sciences Europe, 23: 10.
Shehata, A.A., Schrodl, W., Aldin, A.A., Hafez, H.M. and Kruger, M., 2012. The effect of glyphosate on potential pathogens and beneficial members of poultry microbiota in vitro. Current Microbiology, 66(4):350-8.
Snyder, T.D. and Dillow, S.A., 2012. Digest of Education Statistics 2011. U.S. Dept. of Education, National Center for Education Statistics, NCES 2012-001 p. 85. http://nces.ed.gov/pubs2012/2012001.pdf (Last viewed: 21 November 2013) Note: This document says the data are for children 3-21 served under IDEA, however we obtained the original data files from data.gov and the data are for children 6-21, as stated.
Soto, A.M. and Sonnenschein, C., 2010. Environmental causes of cancer: endocrine disruptors as carcinogens, Nature Reviews Endocrinology. 6: 363-370.
Thongprakaisang, S., Thiantanawat, A., Rangkadilok, N., Suriyo, T. and Satayavivad, J., 2013. Glyphosate induces human breast cancer cells growth via estrogen receptors, Food and Chemical Toxicology, 59: 129-136.
UA, 2014. The Correlation Coefficient. University of Amsterdam, Amsterdam. http://www.fon.hum.uva.nl/Service/Statistics/Correlation_coefficient.html (Last viewed: 20 March 2014)
University of Washington Institute for Health and Metrics Evaluation, 2012. Years of Life Lost Premature Mortality Chart. http://www.healthmetricsandevaluation.org/gbd/visualizations/gbd-2010-change-leading-causes-and-risks-between-1990-and-2010?metric=YLL (Last viewed: 10 December 2013)
USDA:NASS, 2013a. Acreage planted and/or harvested. USDA Economics, Statistics and Market Information System. Albert R. Mann Library. Cornell University. http://usda.mannlib.cornell.edu/MannUsda/viewDocumentInfo.do?documentID=1000 (Last viewed: 16 November 2013)
USDA:NASS, 2013b. Agricultural Chemical Usage - Field Crops and Potatoes. USDA Economics, Statistics and Market Information System. Albert R. Mann Library. Cornell University. http://usda.mannlib.cornell.edu/MannUsda/viewDocumentInfo.do?documentID=1560 (Last viewed: 16 November 2013)
USDA:NASS, 2013c. Quick Stats. http://quickstats.nass.usda.gov/ (Last viewed: 16 November 2013) USDA Economic Research Service, 2013. Sugar and Sweeteners Yearbook Tables: Table 50.
http://www.ers.usda.gov/data-products/sugar-and-sweeteners-yearbook-tables.aspx#25512 (Last viewed: 24 December 2013)
US Geological Survey pesticide use maps, 2013. http://water.usgs.gov/nawqa/pnsp/usage/maps/show_map.php?year=2009andmap=GLYPHOSATEandhilo=L (Viewed: 14 November, 2013)
Van Cleave, J., Gortmaker, S.L. and Perrin, J.M., 2010. Dynamics of obesity and chronic health conditions among children and youth. Journal of the American Medical Society, 303(7): 623-630.
Vandenberg, L.N., Colburn, T., Hayes, T.B., Heindel, J.J., Jacobs, D.R. Jr., Lee, D., Shioda, T., Soto, A.M., vom Sal, F.S., Welshons, W.V., Zeller, R.T. and Myers, J.P., 2012. Hormones and endocrine-disrupting chemicals: low-dose effects and nonmonotonic dose responses. Endocrine Reviews, 33(3): 378-455.
Weintraub, K., 2011. The prevalence puzzle: Autism counts. Nature, 479: 22-24.