generating alpha from event driven investing - northfield · 4 permission to reprint or distribute...
TRANSCRIPT
Permission to reprint or distribute any content from this presentation requires the prior written approval of S&P Capital IQ. Not for distribution to the public. Copyright © 2013 Standard & Poor’s Financial Services LLC, a subsidiary of The McGraw-Hill Companies, Inc. All rights reserved.
'GENERATING ALPHA FROM EVENT DRIVEN INVESTING’
David S. Pope, CFA Managing Director, Quantamental Research 9 October 2013
2 Permission to reprint or distribute any content from this presentation requires the prior written approval of S&P Capital IQ.
Topics
• Introduction to Event Driven Investing
• Event Driven Investing in Practice
– Activist Investing
– CEO/CFO Turnover
– Dividend Policy Changes
– Complicated Firms
– Performance Summary
3 Permission to reprint or distribute any content from this presentation requires the prior written approval of S&P Capital IQ.
Introduction To Event Driven Investing
• Characteristics/Types
– Endogenous (CEO Departure)/Exogenous (Activist activity)
– Long/Short Horizon
– Company/Group/Market Level
– Tail / Non-linear in nature
– Not necessarily related to underlying financials
• Why are Event Signals Intriguing?
– Differentiated ideas that can be added systematically into an investment and monitoring process
• What are some of the concerns?
– These signals may occur infrequently leading to lower breadth
– The context of the event can impact the directional quality of the performance impact on the company
4 Permission to reprint or distribute any content from this presentation requires the prior written approval of S&P Capital IQ.
Event Driven Investing - Methodology
• Traditional Event Study
– Track Cumulative Average Abnormal Return performance around list of events
– Informative view of return impact on the period surrounding events
– Compresses relative time aspect between events
– Unattainable returns due to difficulty in allocating investable funds across events without perfect foresight
• Portfolio Approach
– Establish process to incorporate events into investable portfolios
– Maintains integrity of relative time with respect to different events
– Attainable returns with periodic portfolio formation, but it represents a high bar when responding more slowly to events between rebalances
5 Permission to reprint or distribute any content from this presentation requires the prior written approval of S&P Capital IQ.
Topics
• Introduction to Event Driven Investing
• Event Driven Investing in Practice
– Activist Investing
– CEO/CFO Turnover
– Dividend Policy Changes
– Complicated Firms
– Performance Summary
6 Permission to reprint or distribute any content from this presentation requires the prior written approval of S&P Capital IQ.
Investor Activism
• Activist Investing – A number of highly publicized events where an investor takes a substantial equity stake in a
company in hopes of influencing its future policies (e.g. Icahn’s stake in Netflix)
– Share prices of the targeted firms increase, some by substantial amounts, after disclosure
– According to Hedge Fund Research
Activist index returned 380 bps annually vs. Global Hedge Fund index 25 bps annually in past 3 years
AUM in activist funds has doubled to $65B in 2012 from $32B in 2008 – Activist funds operate as a syndicate
– Given this backdrop, we examined whether
Money can potentially be made by holding these targeted firms
Are the returns to this portfolio subsumed by well-known anomalies such as value and momentum?
What are the commonalities of the targeted firms?
What changes activists make in the targeted firms?
7 Permission to reprint or distribute any content from this presentation requires the prior written approval of S&P Capital IQ.
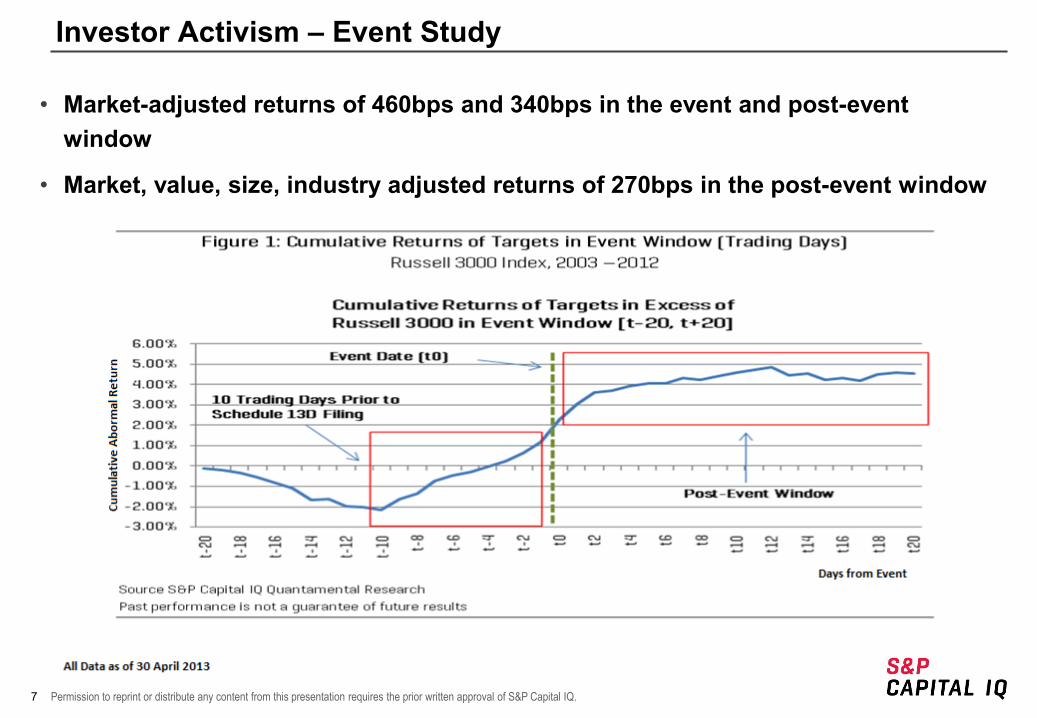
Investor Activism – Event Study
• Market-adjusted returns of 460bps and 340bps in the event and post-event window
• Market, value, size, industry adjusted returns of 270bps in the post-event window
8 Permission to reprint or distribute any content from this presentation requires the prior written approval of S&P Capital IQ.
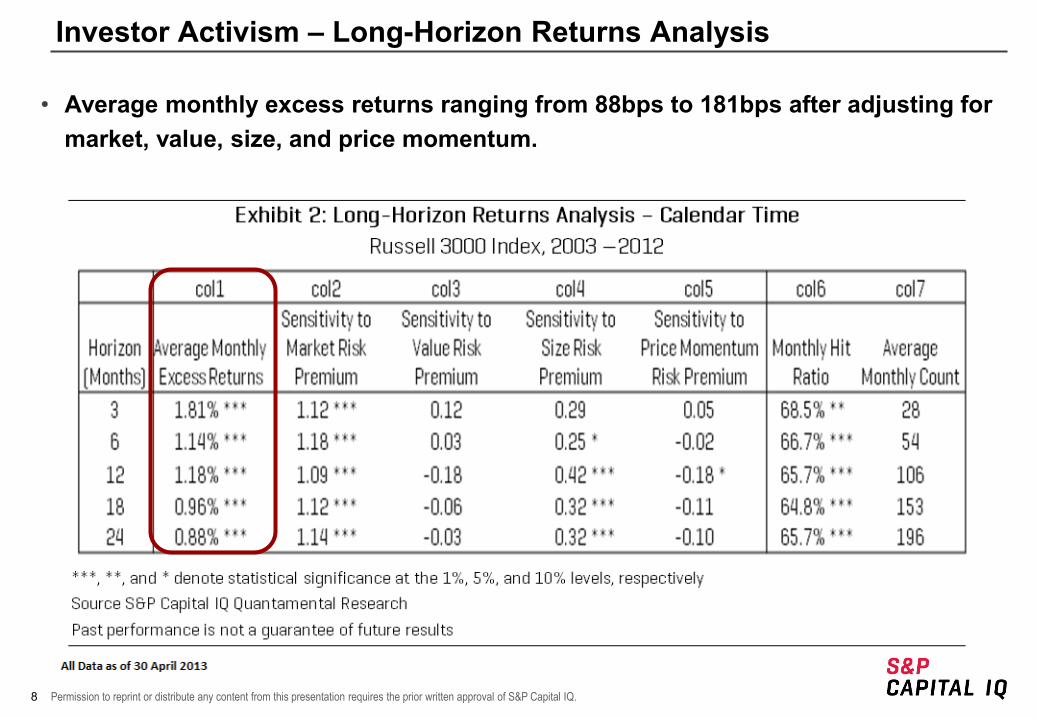
Investor Activism – Long-Horizon Returns Analysis
• Average monthly excess returns ranging from 88bps to 181bps after adjusting for market, value, size, and price momentum.
9 Permission to reprint or distribute any content from this presentation requires the prior written approval of S&P Capital IQ.
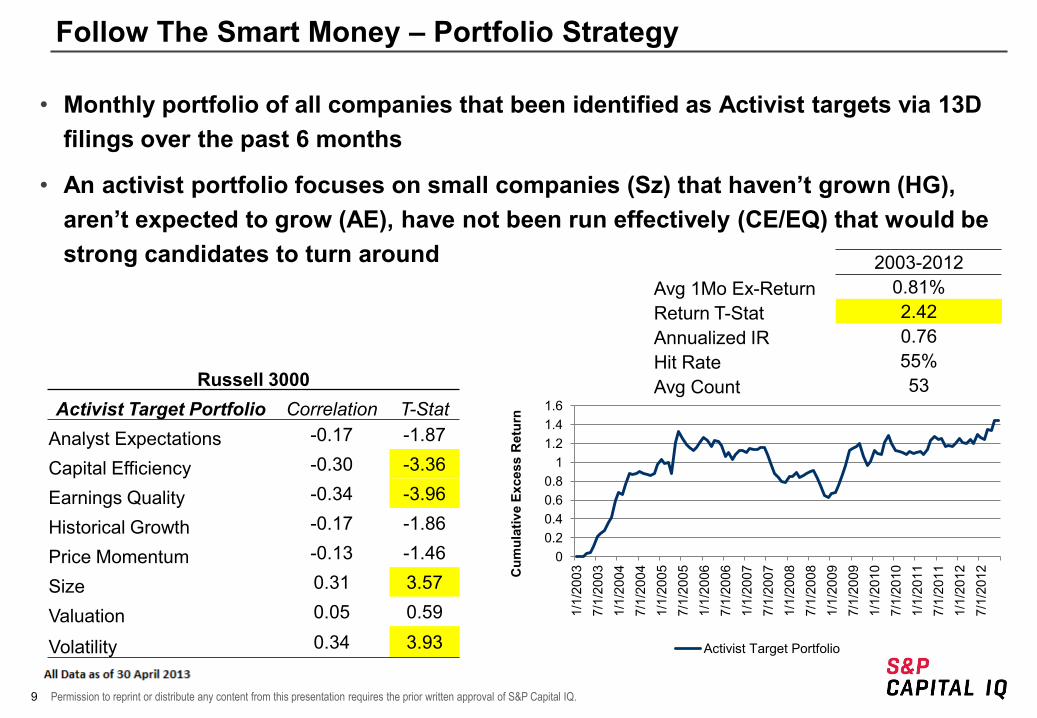
Follow The Smart Money – Portfolio Strategy
• Monthly portfolio of all companies that been identified as Activist targets via 13D filings over the past 6 months
• An activist portfolio focuses on small companies (Sz) that haven’t grown (HG), aren’t expected to grow (AE), have not been run effectively (CE/EQ) that would be strong candidates to turn around
Russell 3000
Activist Target Portfolio Correlation T-Stat Analyst Expectations -0.17 -1.87
Capital Efficiency -0.30 -3.36
Earnings Quality -0.34 -3.96
Historical Growth -0.17 -1.86
Price Momentum -0.13 -1.46
Size 0.31 3.57
Valuation 0.05 0.59
Volatility 0.34 3.93
2003-2012 Avg 1Mo Ex-Return 0.81% Return T-Stat 2.42 Annualized IR 0.76 Hit Rate 55% Avg Count 53
0 0.2 0.4 0.6 0.8
1 1.2 1.4 1.6
1/1/
2003
7/
1/20
03
1/1/
2004
7/
1/20
04
1/1/
2005
7/
1/20
05
1/1/
2006
7/
1/20
06
1/1/
2007
7/
1/20
07
1/1/
2008
7/
1/20
08
1/1/
2009
7/
1/20
09
1/1/
2010
7/
1/20
10
1/1/
2011
7/
1/20
11
1/1/
2012
7/
1/20
12
Cum
ulat
ive
Exce
ss R
etur
n
Activist Target Portfolio
10 Permission to reprint or distribute any content from this presentation requires the prior written approval of S&P Capital IQ.
Investor Activism – Summary
• There are opportunities for both short- and long-horizon excess returns after controlling for market, value, size, momentum and industry.
• Investor Activism occurs frequently enough to consider incorporating into an investment process
• The returns of a portfolio that tracks activist targets produces a positive return that is significant and weakly correlated to major investment themes
• Please see additional details in our paper from March – Follow the Smart Money: Riding the Coattails of Activist Investors.
11 Permission to reprint or distribute any content from this presentation requires the prior written approval of S&P Capital IQ.
Topics
• Introduction to Event Driven Investing
• Event Driven Investing in Practice
– Activist Investing
– CEO/CFO Turnover
– Dividend Policy Changes
– Complicated Firms
– Performance Summary
12 Permission to reprint or distribute any content from this presentation requires the prior written approval of S&P Capital IQ.
CEO / CFO Turnover
• Following a period of poor stock price performance, pressures often build that lead to a company replacing key executives.
• The announcement of CEO changes are often met with pomp and circumstance, but do these changes in management signify a legitimate turning point in stock performance? Or, do they just represent short term measures for shareholder appeasement?
• We explore the return impact of CEO/CFO turnover in the US and Europe both as a long term event study and as a portfolio formation strategy.
13 Permission to reprint or distribute any content from this presentation requires the prior written approval of S&P Capital IQ.
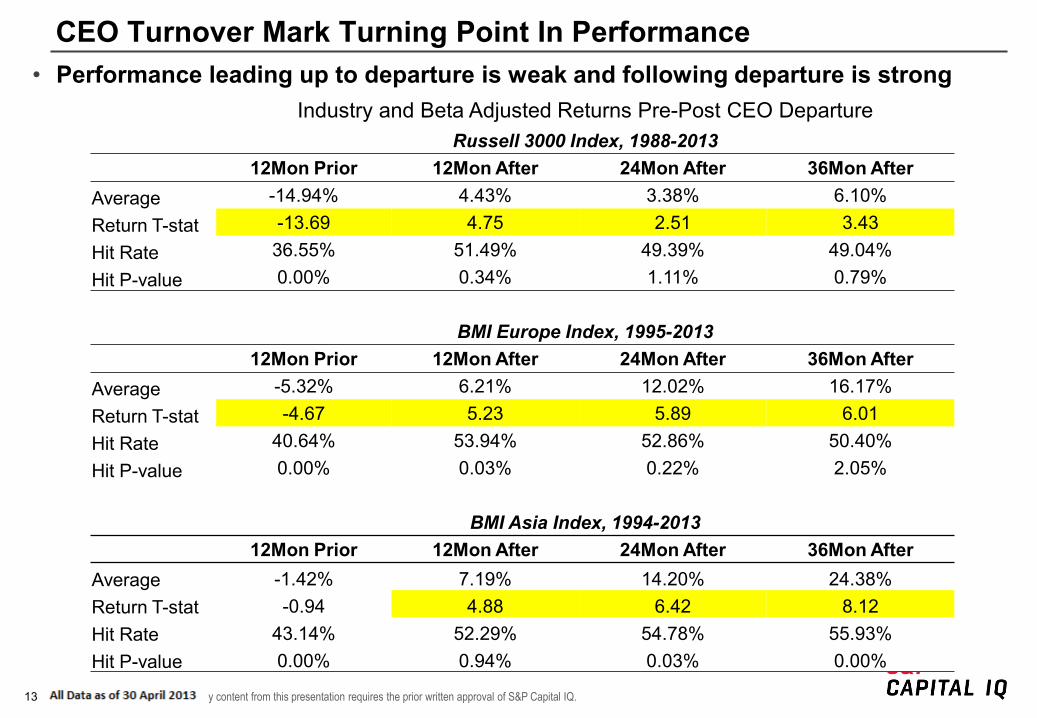
CEO Turnover Mark Turning Point In Performance • Performance leading up to departure is weak and following departure is strong
Industry and Beta Adjusted Returns Pre-Post CEO Departure Russell 3000 Index, 1988-2013 12Mon Prior 12Mon After 24Mon After 36Mon After Average -14.94% 4.43% 3.38% 6.10% Return T-stat -13.69 4.75 2.51 3.43 Hit Rate 36.55% 51.49% 49.39% 49.04% Hit P-value 0.00% 0.34% 1.11% 0.79% BMI Europe Index, 1995-2013 12Mon Prior 12Mon After 24Mon After 36Mon After Average -5.32% 6.21% 12.02% 16.17% Return T-stat -4.67 5.23 5.89 6.01 Hit Rate 40.64% 53.94% 52.86% 50.40% Hit P-value 0.00% 0.03% 0.22% 2.05%
BMI Asia Index, 1994-2013 12Mon Prior 12Mon After 24Mon After 36Mon After
Average -1.42% 7.19% 14.20% 24.38% Return T-stat -0.94 4.88 6.42 8.12 Hit Rate 43.14% 52.29% 54.78% 55.93% Hit P-value 0.00% 0.94% 0.03% 0.00%
14 Permission to reprint or distribute any content from this presentation requires the prior written approval of S&P Capital IQ.
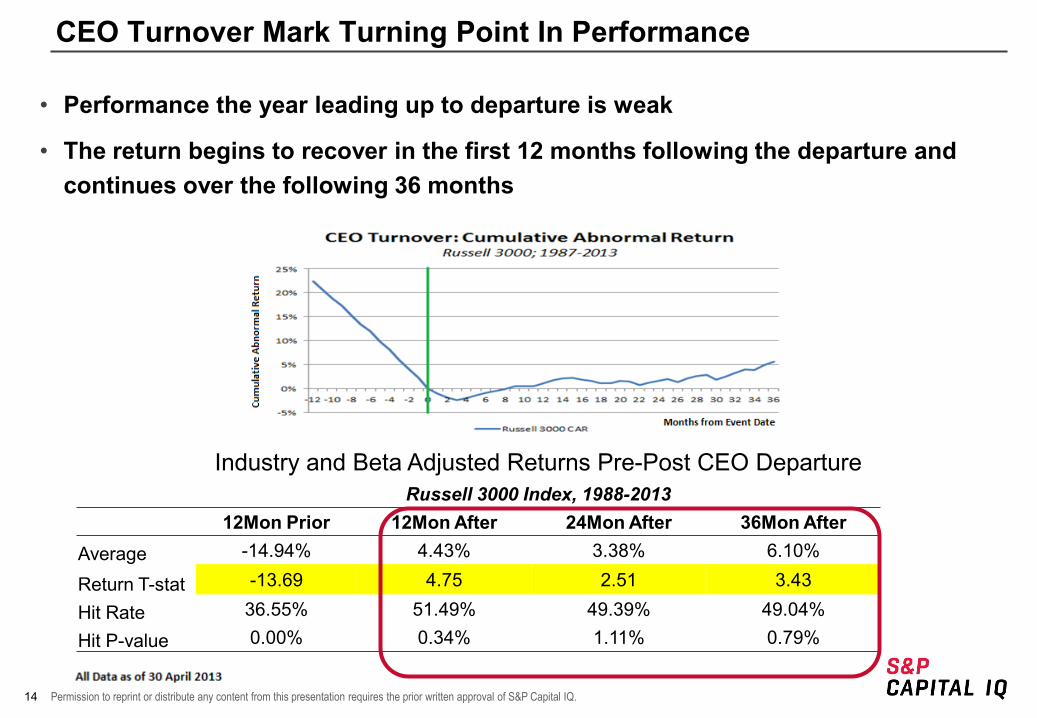
CEO Turnover Mark Turning Point In Performance
• Performance the year leading up to departure is weak
• The return begins to recover in the first 12 months following the departure and continues over the following 36 months
Industry and Beta Adjusted Returns Pre-Post CEO Departure Russell 3000 Index, 1988-2013 12Mon Prior 12Mon After 24Mon After 36Mon After Average -14.94% 4.43% 3.38% 6.10%
Return T-stat -13.69 4.75 2.51 3.43
Hit Rate 36.55% 51.49% 49.39% 49.04%
Hit P-value 0.00% 0.34% 1.11% 0.79%
15 Permission to reprint or distribute any content from this presentation requires the prior written approval of S&P Capital IQ.
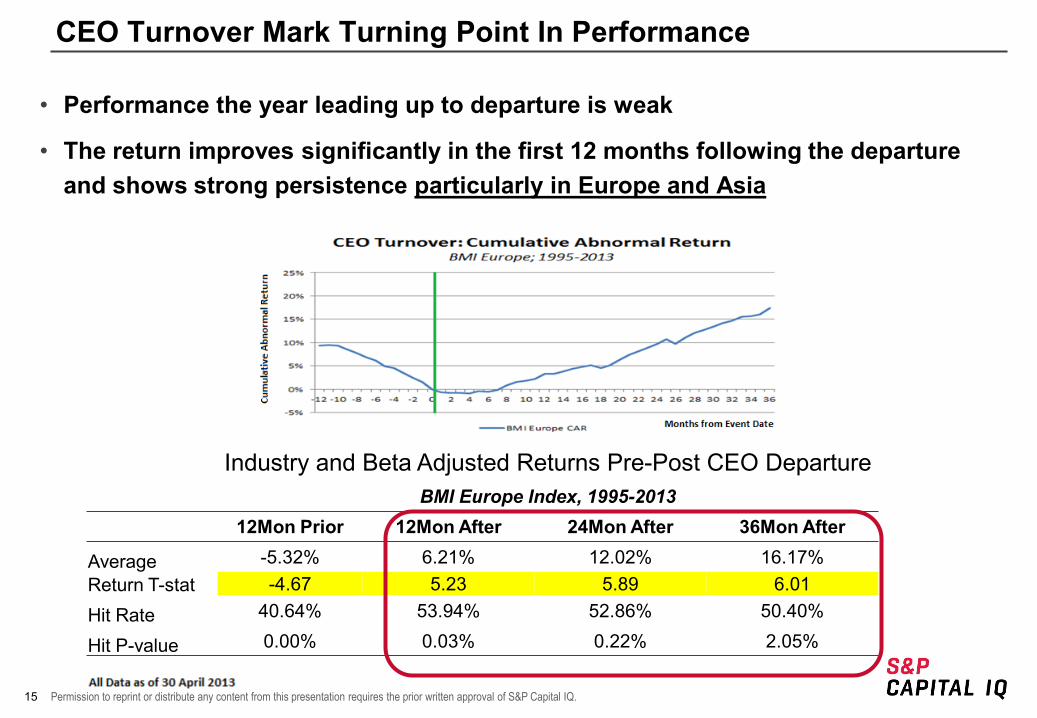
CEO Turnover Mark Turning Point In Performance
• Performance the year leading up to departure is weak
• The return improves significantly in the first 12 months following the departure and shows strong persistence particularly in Europe and Asia
Industry and Beta Adjusted Returns Pre-Post CEO Departure BMI Europe Index, 1995-2013
12Mon Prior 12Mon After 24Mon After 36Mon After
Average -5.32% 6.21% 12.02% 16.17% Return T-stat -4.67 5.23 5.89 6.01
Hit Rate 40.64% 53.94% 52.86% 50.40%
Hit P-value 0.00% 0.03% 0.22% 2.05%
16 Permission to reprint or distribute any content from this presentation requires the prior written approval of S&P Capital IQ.
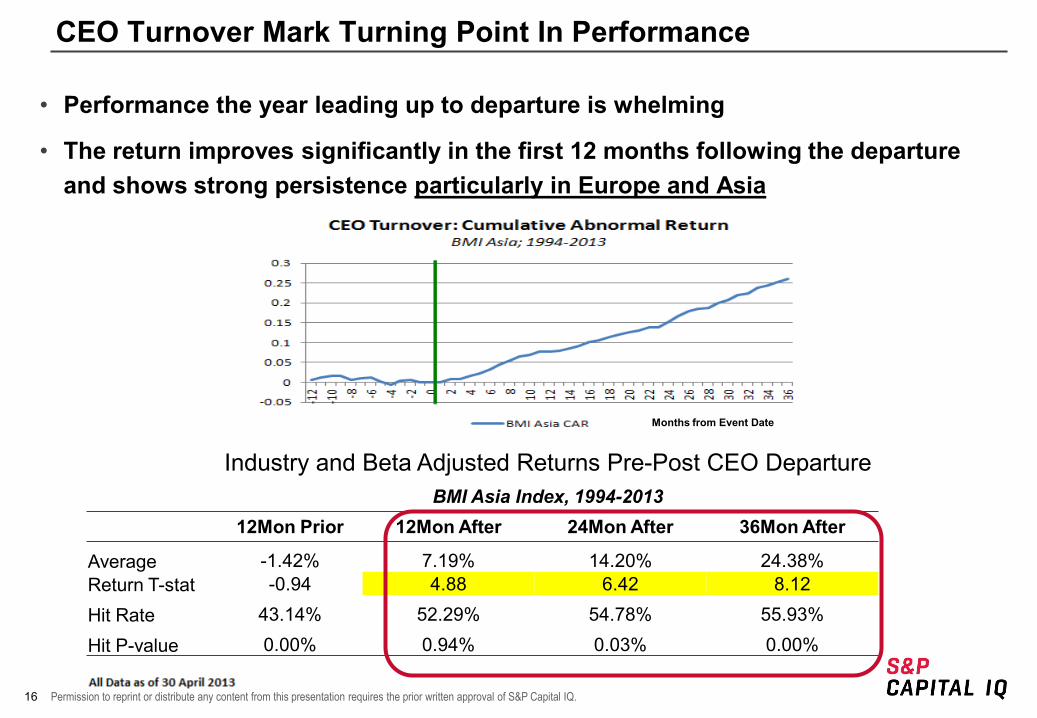
CEO Turnover Mark Turning Point In Performance
• Performance the year leading up to departure is whelming
• The return improves significantly in the first 12 months following the departure and shows strong persistence particularly in Europe and Asia
Industry and Beta Adjusted Returns Pre-Post CEO Departure BMI Asia Index, 1994-2013
12Mon Prior 12Mon After 24Mon After 36Mon After
Average -1.42% 7.19% 14.20% 24.38% Return T-stat -0.94 4.88 6.42 8.12
Hit Rate 43.14% 52.29% 54.78% 55.93%
Hit P-value 0.00% 0.94% 0.03% 0.00%
Months from Event Date
17 Permission to reprint or distribute any content from this presentation requires the prior written approval of S&P Capital IQ.
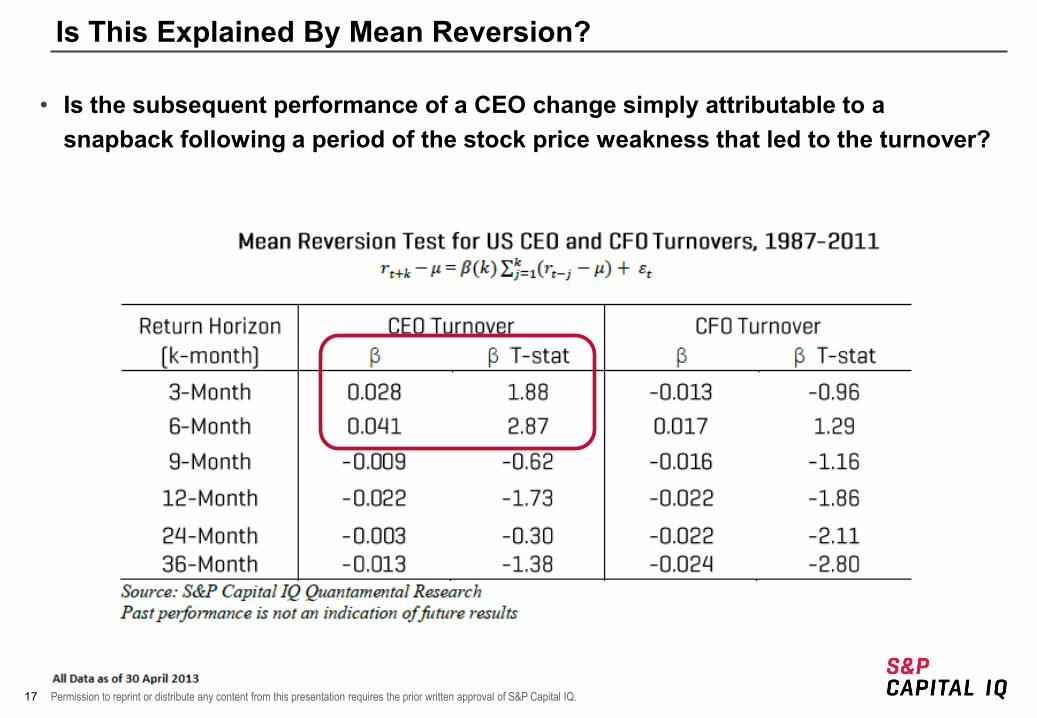
Is This Explained By Mean Reversion?
• Is the subsequent performance of a CEO change simply attributable to a snapback following a period of the stock price weakness that led to the turnover?
18 Permission to reprint or distribute any content from this presentation requires the prior written approval of S&P Capital IQ.
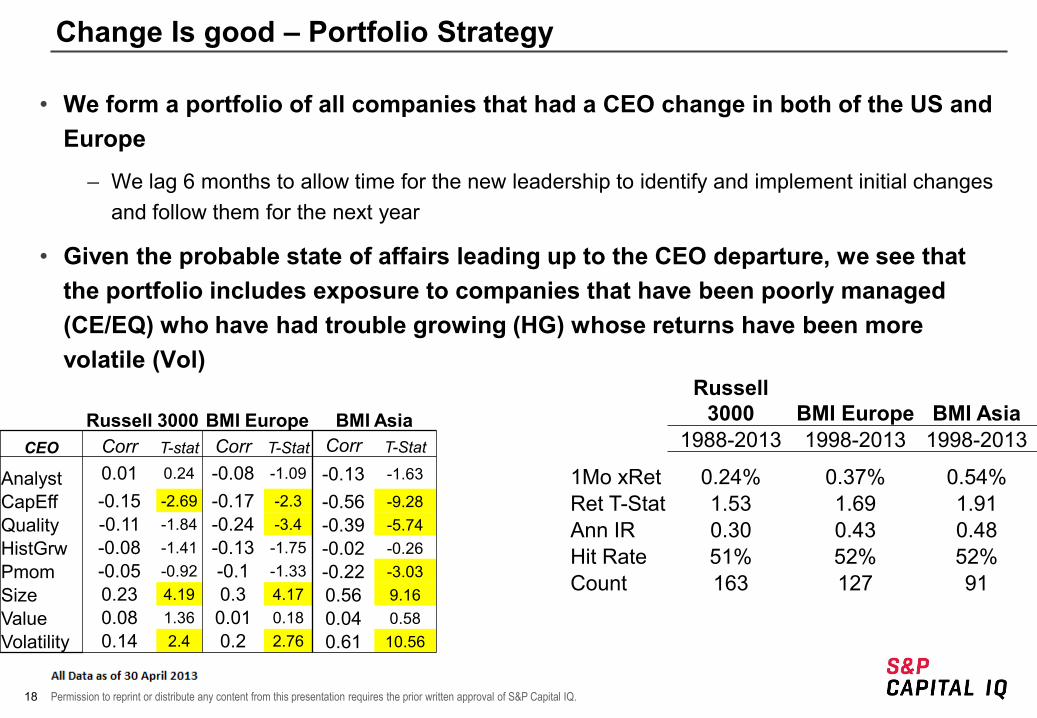
Change Is good – Portfolio Strategy
• We form a portfolio of all companies that had a CEO change in both of the US and Europe
– We lag 6 months to allow time for the new leadership to identify and implement initial changes and follow them for the next year
• Given the probable state of affairs leading up to the CEO departure, we see that the portfolio includes exposure to companies that have been poorly managed (CE/EQ) who have had trouble growing (HG) whose returns have been more volatile (Vol)
Russell 3000 BMI Europe BMI Asia
1988-2013 1998-2013 1998-2013
1Mo xRet 0.24% 0.37% 0.54% Ret T-Stat 1.53 1.69 1.91 Ann IR 0.30 0.43 0.48 Hit Rate 51% 52% 52% Count 163 127 91
Russell 3000 BMI Europe BMI Asia CEO Corr T-stat Corr T-Stat Corr T-Stat
Analyst 0.01 0.24 -0.08 -1.09 -0.13 -1.63
CapEff -0.15 -2.69 -0.17 -2.3 -0.56 -9.28 Quality -0.11 -1.84 -0.24 -3.4 -0.39 -5.74 HistGrw -0.08 -1.41 -0.13 -1.75 -0.02 -0.26 Pmom -0.05 -0.92 -0.1 -1.33 -0.22 -3.03 Size 0.23 4.19 0.3 4.17 0.56 9.16 Value 0.08 1.36 0.01 0.18 0.04 0.58 Volatility 0.14 2.4 0.2 2.76 0.61 10.56

19 Permission to reprint or distribute any content from this presentation requires the prior written approval of S&P Capital IQ.
Topics
• Introduction to Event Driven Investing
• Event Driven Investing in Practice
– Activist Investing
– CEO/CFO Turnover
– Dividend Policy Changes
– Complicated Firms
– Performance Summary
20 Permission to reprint or distribute any content from this presentation requires the prior written approval of S&P Capital IQ.
Dividend Policy Changes
• Investors are acutely sensitive to changes in dividend policy. Literature suggests that dividend change announcements provide information about management’s assessment of companies’ prospects, and therefore are predictive of future stock returns.
• We analyze the market reaction to different types of dividend policy changes in the United States and Europe
– Dividend Initiation
– Dividend Increase
21 Permission to reprint or distribute any content from this presentation requires the prior written approval of S&P Capital IQ.
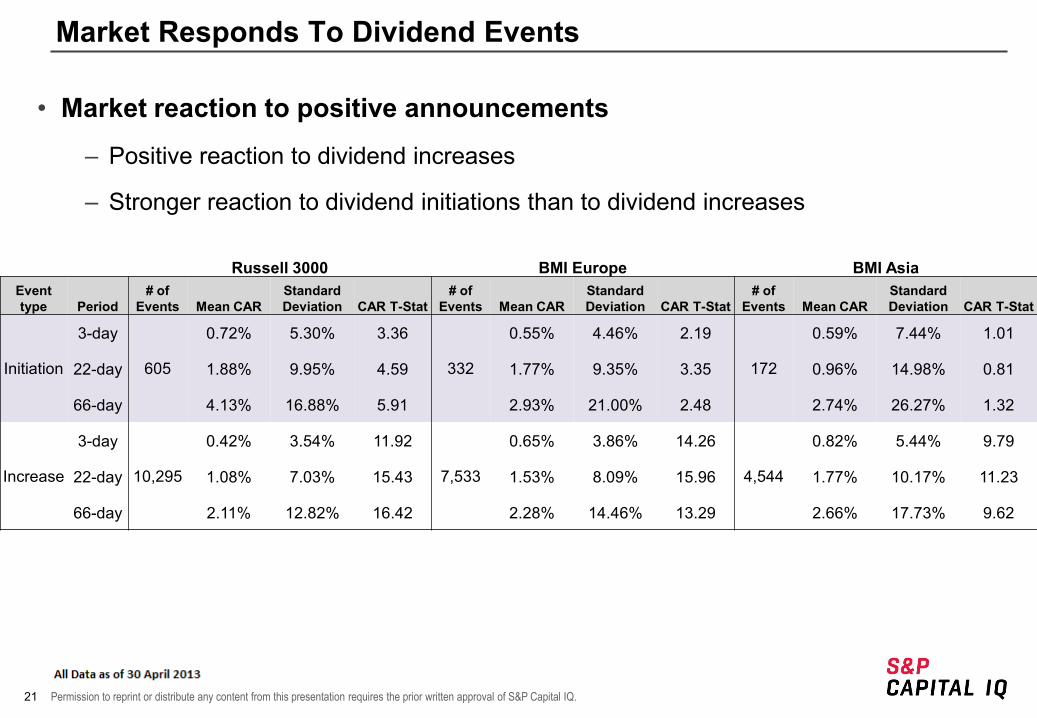
Market Responds To Dividend Events
• Market reaction to positive announcements
– Positive reaction to dividend increases
– Stronger reaction to dividend initiations than to dividend increases
Russell 3000 BMI Europe BMI Asia Event type Period
# of Events Mean CAR
Standard Deviation CAR T-Stat
# of Events Mean CAR
Standard Deviation CAR T-Stat
# of Events Mean CAR
Standard Deviation CAR T-Stat
Initiation
3-day
605
0.72% 5.30% 3.36
332
0.55% 4.46% 2.19
172
0.59% 7.44% 1.01
22-day 1.88% 9.95% 4.59 1.77% 9.35% 3.35 0.96% 14.98% 0.81
66-day 4.13% 16.88% 5.91 2.93% 21.00% 2.48 2.74% 26.27% 1.32
Increase
3-day
10,295
0.42% 3.54% 11.92
7,533
0.65% 3.86% 14.26
4,544
0.82% 5.44% 9.79
22-day 1.08% 7.03% 15.43 1.53% 8.09% 15.96 1.77% 10.17% 11.23
66-day 2.11% 12.82% 16.42 2.28% 14.46% 13.29 2.66% 17.73% 9.62
22 Permission to reprint or distribute any content from this presentation requires the prior written approval of S&P Capital IQ.
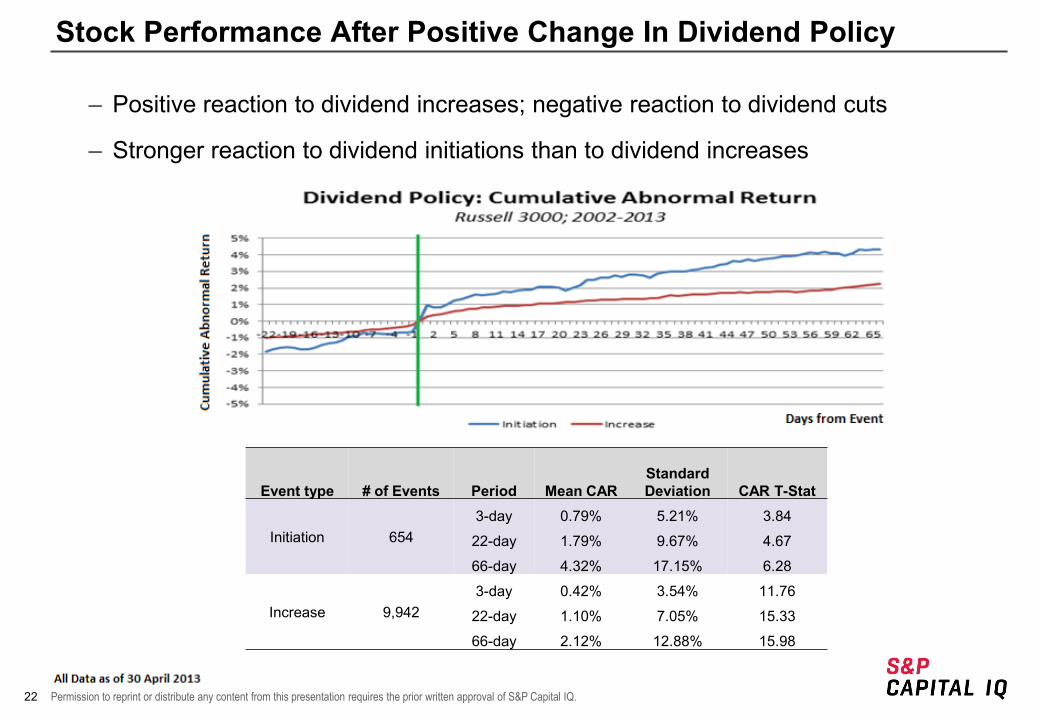
Stock Performance After Positive Change In Dividend Policy
– Positive reaction to dividend increases; negative reaction to dividend cuts
– Stronger reaction to dividend initiations than to dividend increases
Event type # of Events Period Mean CAR Standard Deviation CAR T-Stat
Initiation 654 3-day 0.79% 5.21% 3.84
22-day 1.79% 9.67% 4.67
66-day 4.32% 17.15% 6.28
Increase 9,942 3-day 0.42% 3.54% 11.76
22-day 1.10% 7.05% 15.33
66-day 2.12% 12.88% 15.98
23 Permission to reprint or distribute any content from this presentation requires the prior written approval of S&P Capital IQ.
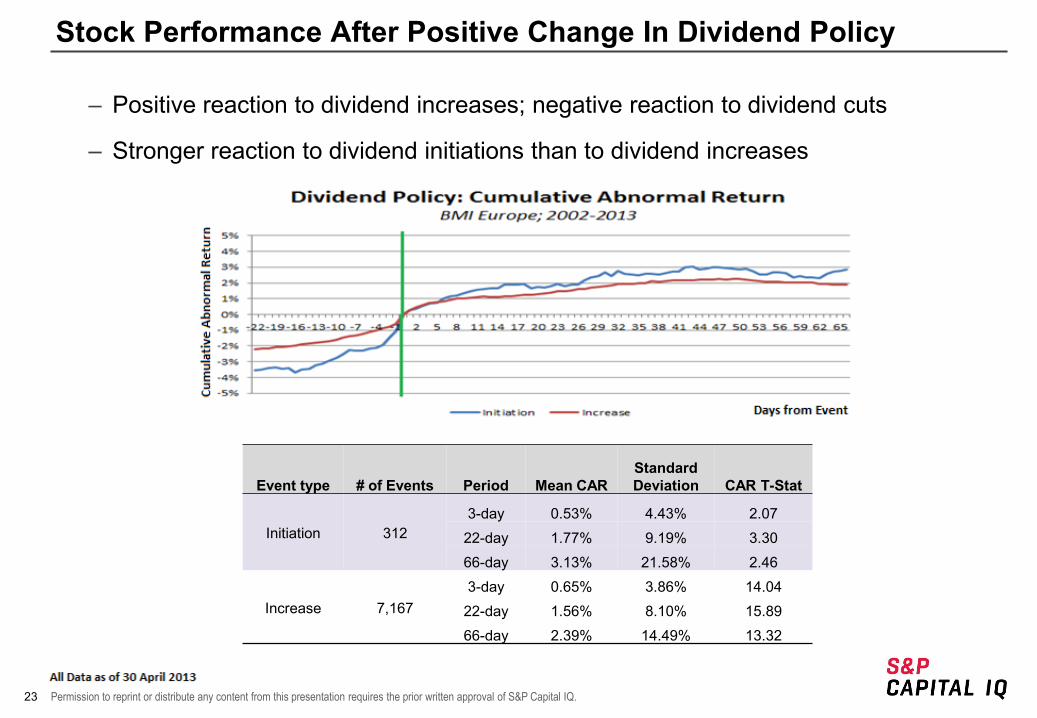
Stock Performance After Positive Change In Dividend Policy
– Positive reaction to dividend increases; negative reaction to dividend cuts
– Stronger reaction to dividend initiations than to dividend increases
Event type # of Events Period Mean CAR Standard Deviation CAR T-Stat
Initiation 312 3-day 0.53% 4.43% 2.07
22-day 1.77% 9.19% 3.30 66-day 3.13% 21.58% 2.46
Increase 7,167 3-day 0.65% 3.86% 14.04
22-day 1.56% 8.10% 15.89 66-day 2.39% 14.49% 13.32
24 Permission to reprint or distribute any content from this presentation requires the prior written approval of S&P Capital IQ.
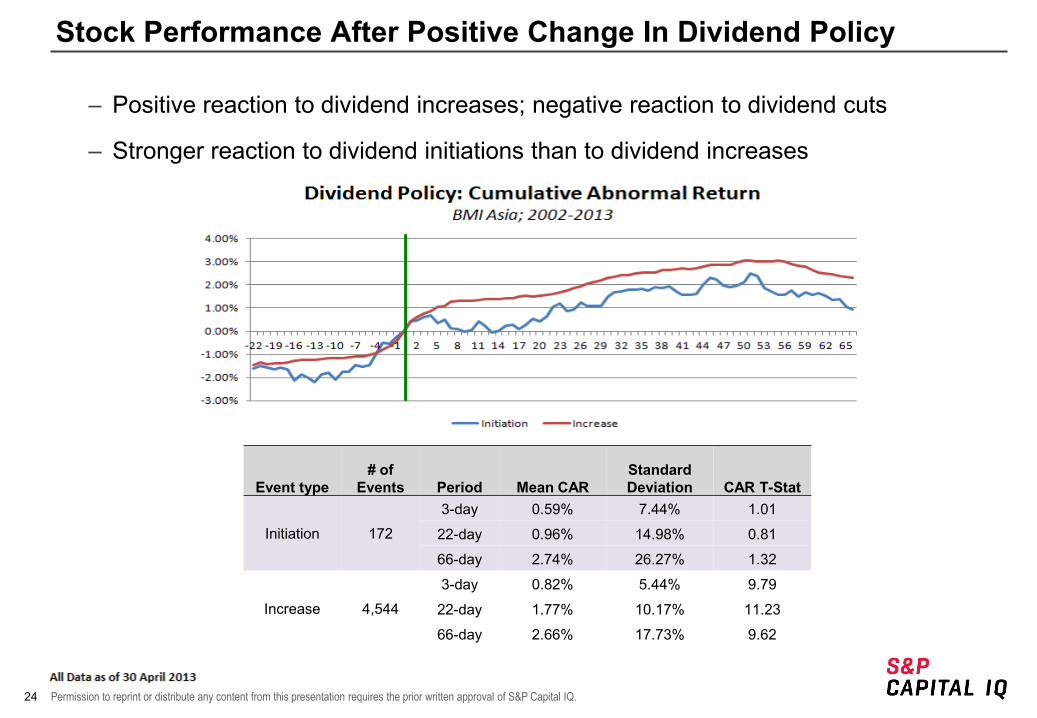
Stock Performance After Positive Change In Dividend Policy
– Positive reaction to dividend increases; negative reaction to dividend cuts
– Stronger reaction to dividend initiations than to dividend increases
Event type # of
Events Period Mean CAR Standard Deviation CAR T-Stat
Initiation 172
3-day 0.59% 7.44% 1.01
22-day 0.96% 14.98% 0.81
66-day 2.74% 26.27% 1.32
Increase 4,544
3-day 0.82% 5.44% 9.79
22-day 1.77% 10.17% 11.23
66-day 2.66% 17.73% 9.62
25 Permission to reprint or distribute any content from this presentation requires the prior written approval of S&P Capital IQ.
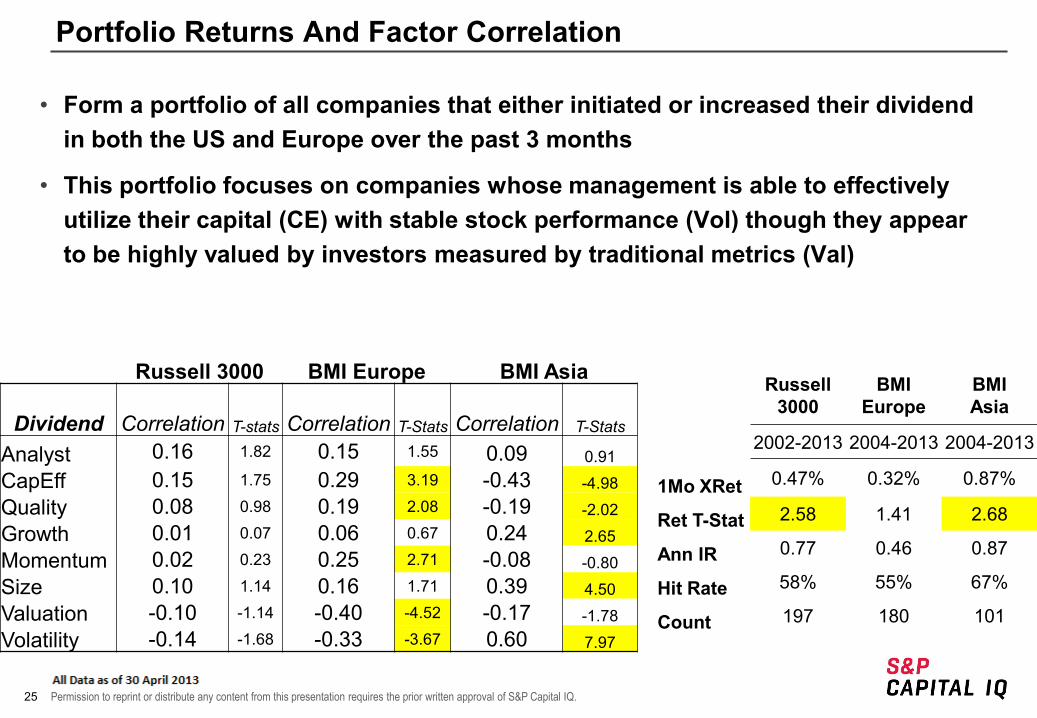
Portfolio Returns And Factor Correlation
• Form a portfolio of all companies that either initiated or increased their dividend in both the US and Europe over the past 3 months
• This portfolio focuses on companies whose management is able to effectively utilize their capital (CE) with stable stock performance (Vol) though they appear to be highly valued by investors measured by traditional metrics (Val)
Russell 3000
BMI Europe
BMI Asia
2002-2013 2004-2013 2004-2013
1Mo XRet 0.47% 0.32% 0.87%
Ret T-Stat 2.58 1.41 2.68
Ann IR 0.77 0.46 0.87
Hit Rate 58% 55% 67%
Count 197 180 101
Russell 3000 BMI Europe BMI Asia
Dividend Correlation T-stats Correlation T-Stats Correlation T-Stats
Analyst 0.16 1.82 0.15 1.55 0.09 0.91 CapEff 0.15 1.75 0.29 3.19 -0.43 -4.98 Quality 0.08 0.98 0.19 2.08 -0.19 -2.02 Growth 0.01 0.07 0.06 0.67 0.24 2.65 Momentum 0.02 0.23 0.25 2.71 -0.08 -0.80 Size 0.10 1.14 0.16 1.71 0.39 4.50 Valuation -0.10 -1.14 -0.40 -4.52 -0.17 -1.78 Volatility -0.14 -1.68 -0.33 -3.67 0.60 7.97
26 Permission to reprint or distribute any content from this presentation requires the prior written approval of S&P Capital IQ.
Topics
• Introduction to Event Driven Investing
• Event Driven Investing in Practice
– Activist Investing
– CEO/CFO Turnover
– Dividend Policy Changes
– Complicated Firms
– Performance Summary
27 Permission to reprint or distribute any content from this presentation requires the prior written approval of S&P Capital IQ.
Complicated Firms
• While many investors look to leverage industry-specific information sources to enhance their portfolios, many of the most widely followed largest companies span multiple business lines.
• It is more difficult for markets to incorporate industry-level information for these complicated firms given the added layer of complexity.
– Investors have to identify information across multiple industries, assess the significance in terms of the industry, and finally assess the importance of that industry to the complicated firm
Complicated Firms lag their representative industries
• Identify companies where their underlying industries are experiencing the strongest performance over the past month
28 Permission to reprint or distribute any content from this presentation requires the prior written approval of S&P Capital IQ.
Methodology
• FASB Statement 14 requires that public companies provide information regarding their reportable segments including the segments industry and revenue
• Simple Firms - firms that derive greater than 80% of their total sales from one industry segment
• Complicated Firms - firms where there largest industry segment accounts for less than 80% of their total sales
• We weight simple industry returns proportionate to the company’s sales in each industry in an attempt to identify where there have been information shocks over the past month
29 Permission to reprint or distribute any content from this presentation requires the prior written approval of S&P Capital IQ.
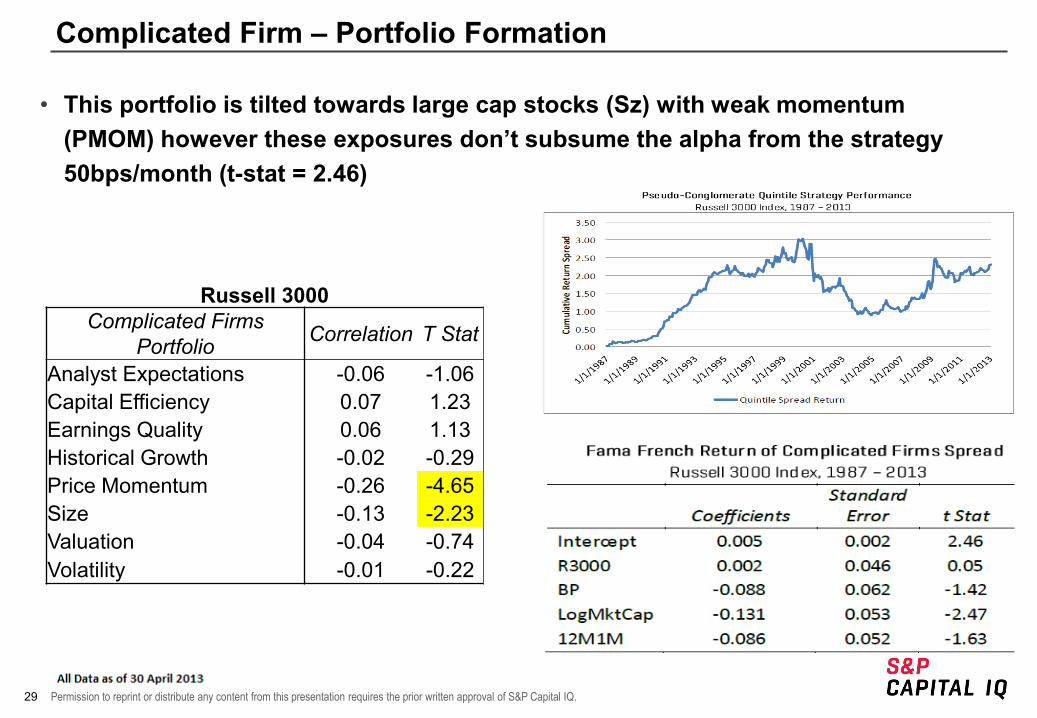
Complicated Firm – Portfolio Formation
• This portfolio is tilted towards large cap stocks (Sz) with weak momentum (PMOM) however these exposures don’t subsume the alpha from the strategy 50bps/month (t-stat = 2.46)
Russell 3000 Complicated Firms
Portfolio Correlation T Stat
Analyst Expectations -0.06 -1.06 Capital Efficiency 0.07 1.23 Earnings Quality 0.06 1.13 Historical Growth -0.02 -0.29 Price Momentum -0.26 -4.65 Size -0.13 -2.23 Valuation -0.04 -0.74 Volatility -0.01 -0.22
30 Permission to reprint or distribute any content from this presentation requires the prior written approval of S&P Capital IQ.
Topics
• Introduction to Event Driven Investing
• Event Driven Investing in Practice
– Activist Investing
– CEO/CFO Turnover
– Dividend Policy Changes
– Complicated Firms
– Performance Summary
31 Permission to reprint or distribute any content from this presentation requires the prior written approval of S&P Capital IQ.
Event Driven Investing In The US And Europe
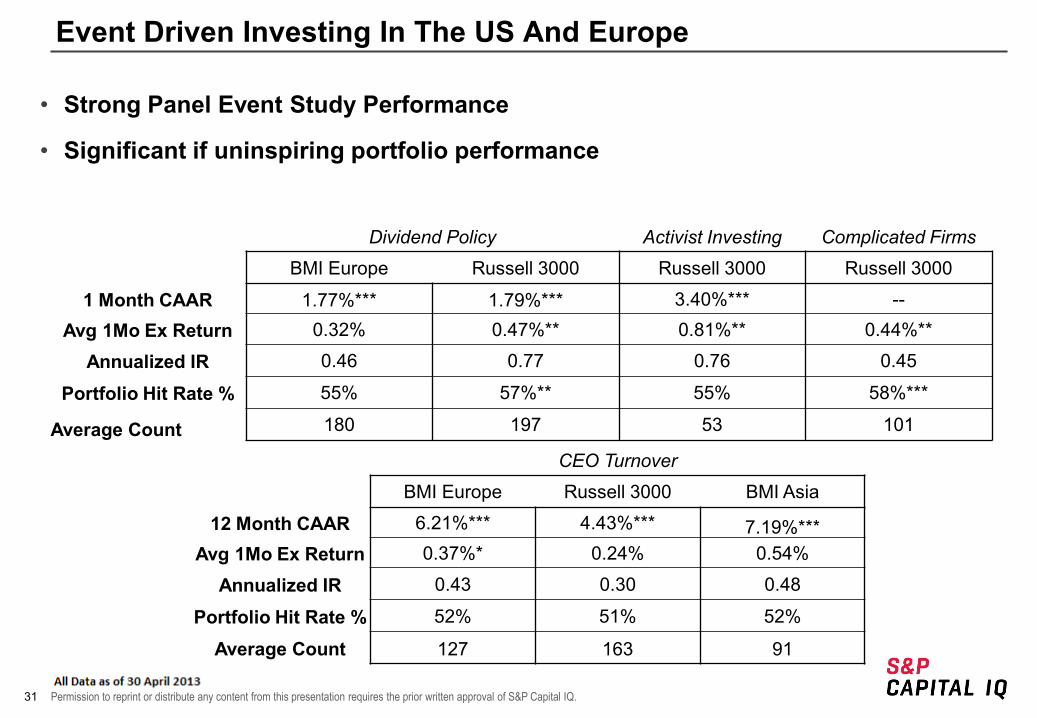
• Strong Panel Event Study Performance
• Significant if uninspiring portfolio performance
Dividend Policy Activist Investing Complicated Firms
BMI Europe Russell 3000 Russell 3000 Russell 3000
1 Month CAAR 1.77%*** 1.79%*** 3.40%*** --
Avg 1Mo Ex Return 0.32% 0.47%** 0.81%** 0.44%**
Annualized IR 0.46 0.77 0.76 0.45
Portfolio Hit Rate % 55% 57%** 55% 58%***
Average Count 180 197 53 101
CEO Turnover
BMI Europe Russell 3000 BMI Asia
12 Month CAAR 6.21%*** 4.43%*** 7.19%*** Avg 1Mo Ex Return 0.37%* 0.24% 0.54%
Annualized IR 0.43 0.30 0.48
Portfolio Hit Rate % 52% 51% 52%
Average Count 127 163 91
32 Permission to reprint or distribute any content from this presentation requires the prior written approval of S&P Capital IQ.
Event Driven Investing In The US And Europe
• Traditional ‘panel’ approach to event studies may be overly simplistic
– The simplicity is attractive but it tends to produce overly optimistic results by not taking into real world constraints
– Portfolio approach is considerably more conservative
• Event signals provide meaningful alpha as an overlay or as its own strategy
– Typically low correlation to many traditional investment strategies suggests potential to complement an existing strategy
– Possible to generate significant abnormal returns even with a conservative approach on its own
– Events can generate alpha globally as both quantitative and fundamental investors respond to these stimuli
33. Permission to reprint or distribute any content from this presentation requires the prior written approval of S&P Capital IQ. Not for distribution to the public.
Copyright © 2013 by Standard & Poor’s Financial Services LLC (S&P), a subsidiary of The McGraw-Hill Companies, Inc. All rights reserved. No content (including ratings, valuations, credit-related analyses and data, model, software or other application or output therefrom) or any part thereof (Content) may be modified, reverse engineered, reproduced or distributed in any form by any means, or stored in a database or retrieval system, without the prior written permission of Standard & Poor’s Financial Services LLC or its affiliates (collectively, S&P). The Content shall not be used for any unlawful or unauthorized purposes. S&P and any third-party providers, as well as their directors, officers, shareholders, employees or agents (collectively S&P Parties) do not guarantee the accuracy, completeness, timeliness or availability of the Content. S&P Parties are not responsible for any errors or omissions (negligent or otherwise), regardless of the cause, for the results obtained from the use of the Content, or for the security or maintenance of any data input by the user. The Content is provided on an “as is” basis. S&P PARTIES DISCLAIM ANY AND ALL EXPRESS OR IMPLIED WARRANTIES, INCLUDING, BUT NOT LIMITED TO, ANY WARRANTIES OF MERCHANTABILITY OR FITNESS FOR A PARTICULAR PURPOSE OR USE, FREEDOM FROM BUGS, SOFTWARE ERRORS OR DEFECTS, THAT THE CONTENT’S FUNCTIONING WILL BE UNINTERRUPTED OR THAT THE CONTENT WILL OPERATE WITH ANY SOFTWARE OR HARDWARE CONFIGURATION. In no event shall S&P Parties be liable to any party for any direct, indirect, incidental, exemplary, compensatory, punitive, special or consequential damages, costs, expenses, legal fees, or losses (including, without limitation, lost income or lost profits and opportunity costs or losses caused by negligence) in connection with any use of the Content even if advised of the possibility of such damages.
Credit-related and other analyses, including ratings, and statements in the Content are statements of opinion as of the date they are expressed and not statements of fact. S&P’s opinions, analyses and rating acknowledgment decisions (described below) are not recommendations to purchase, hold, or sell any securities or to make any investment decisions, and do not address the suitability of any security. S&P assumes no obligation to update the Content following publication in any form or format. The Content should not be relied on and is not a substitute for the skill, judgment and experience of the user, its management, employees, advisors and/or clients when making investment and other business decisions. S&P does not act as a fiduciary or an investment advisor except where registered as such. While S&P has obtained information from sources it believes to be reliable, S&P does not perform an audit and undertakes no duty of due diligence or independent verification of any information it receives.
To the extent that regulatory authorities allow a rating agency to acknowledge in one jurisdiction a rating issued in another jurisdiction for certain regulatory purposes, S&P reserves the right to assign, withdraw or suspend such acknowledgement at any time and in its sole discretion. S&P Parties disclaim any duty whatsoever arising out of the assignment, withdrawal or suspension of an acknowledgment as well as any liability for any damage alleged to have been suffered on account thereof.
S&P keeps certain activities of its business units separate from each other in order to preserve the independence and objectivity of their respective activities. As a result, certain business units of S&P may have information that is not available to other S&P business units. S&P has established policies and procedures to maintain the confidentiality of certain non-public information received in connection with each analytical process.
S&P may receive compensation for its ratings and certain analyses, normally from issuers or underwriters of securities or from obligors. S&P reserves the right to disseminate its opinions and analyses. S&P’s public ratings and analyses are made available on its Web sites, www.standardandpoors.com (free of charge), and www.ratingsdirect.com and www.globalcreditportal.com (subscription), and may be distributed through other means, including via S&P publications and third-party redistributors. Additional information about our ratings fees is available at www.standardandpoors.com/usratingsfees.
www.spcapitaliq.com