generalists versus specialists: lifetime work … versus specialists: lifetime work experience and...
TRANSCRIPT
Generalists versus Specialists: Lifetime Work Experience and CEO Pay*
Cláudia Custódio† Arizona State University – W. P. Carey School of Business
Miguel A. Ferreira Nova School of Business and Economics
Pedro Matos University of Virginia – Darden School of Business
(forthcoming in Journal of Financial Economics)
This Version: July 2012
Abstract
We show that pay is higher for CEOs with general managerial skills gathered during lifetime work experience. We use CEOs’ résumés of S&P 1,500 firms from 1993 through 2007 to construct an index of general skills that are transferable across firms and industries. We estimate an annual pay premium for generalist CEOs—those with an index value above the median—of 19% relative to specialist CEOs, which represents nearly a million dollars per year. This relation is robust to the inclusion of firm- and CEO-level controls, including fixed effects. CEO pay increases the most when firms externally hire a new CEO and switch from a specialist to a generalist CEO. Furthermore, the pay premium is higher when CEOs are hired to perform complex tasks such as restructurings and acquisitions. Our findings provide direct evidence of the increased importance of general managerial skills over firm-specific human capital in the market for CEOs in the last decades.
JEL Classification: G34, J24, J33 Keywords: Executive compensation, Market for executives, Human capital
* We thank for helpful comments Ilona Babenko, Jeff Coles, Alex Edmans, Charles Hadlock, Todd Milbourn, Kevin J. Murphy, Oguzhan Ozbas, Albert Sheen, Laura Starks, René Stulz, Marie Sushka, and Yuhai Xuan; participants at the 2011 SFS Finance Cavalcade and 2012 American Finance Association meetings; and seminar participants at Arizona State University, Nova School of Business and Economics, Ohio State University, and University of Oregon. † Corresponding author. Address: Department of Finance, W. P. Carey School of Business, Arizona State University, PO Box 873906, Tempe, AZ 85287-3906; Phone: +1 480 965 8074; E-mail: [email protected].
1
1. Introduction
Gabaix and Landier (2008), Tervio (2008), and Edmans, Gabaix, and Landier (2009) argue that
the pay of Chief Executive Officers (CEOs) is determined in a competitive labor market between
firms and CEOs. Market-based theories predict that CEOs with the ability to be more productive
should earn higher pay. Yet ability is hard to observe, and there is little empirical evidence on its
effect on CEO pay. In this paper, we analyze new data on CEOs’ lifetime work experience to
study whether CEOs are paid a premium when they accumulate general managerial capital (i.e.,
not specific to any organization, and transferable across firms or industries), rather than firm-
specific managerial capital (i.e., valuable only within an organization).1
Murphy and Zabojnik (2004, 2007) argue that general managerial skills have recently
become more important than firm-specific skills in the case of the CEO function. This means
more competition in the labor market and higher pay when CEOs capture these rents. We do not
expect this to happen in the case of firm-specific human capital, as these skills cannot be applied
elsewhere, so specialist executives have little bargaining power in the labor market. The
empirical prediction is that CEOs with more general skills receive higher pay. There are also
likely to be more outside hires than internal promotions, because the benefit of a better match
between CEO and firm outweighs the cost of firm-specific capital that is lost. This implies that
CEOs hired from outside the firm, especially generalist managers, will earn higher pay.
The increased importance of general skills could result from product market changes due to
industry deregulation (Hubbard and Palia, 1995; and Cunat and Guadalupe, 2009a) or from
1 Becker (1962) is the first to have made the distinction between general human capital that increases productivity not only at one firm but also at other firms, and firm-specific human capital that increases worker productivity at the current firm but not elsewhere. A broader approach assumes all skills are general but firms use them with different weights (Lazear (2009)).
2
foreign competition (Cunat and Guadalupe, 2009b). Other forces could be changes in technology
and management practices, which amplify the effect of CEO talent on firm value (Garicano and
Rossi-Hansberg, 2006) and the need of CEOs to be involved in companies’ investor-relation
efforts (Murphy and Zabojnik, 2007).2
We test whether the composition of managerial skills is a determinant of CEO pay. We
construct a proxy for general managerial skills based on past work experience using a panel of
the CEOs of S&P 1,500 firms over 1993-2007. We use information on all of a CEO’s past
positions in other firms, including positions in non-S&P 1,500 firms. The sample includes nearly
4,500 CEOs, whose résumés include a total of 32,500 different past positions.
Our measure of general managerial skills considers five aspects of a CEO’s professional
career: past number of (1) positions, (2) firms, and (3) industries in which a CEO worked; (4)
whether the CEO held a CEO position at a different company; and (5) whether the CEO worked
for a conglomerate. The index of general managerial ability is the first factor of the principal
components analysis of the five proxies, which is a linear combination of the proxies with more
weight given to those that more accurately reflect a CEO’s general skills. The index summarizes
information on a CEO’s general skills and allows us to classify a CEO as a generalist or a
specialist. This approach minimizes measurement error and increases the power of the regression
tests by avoiding multicollinearity from using the five proxies individually.
We find that the average general ability index has risen over the last 15 years and that it is
positively and significantly associated with total CEO pay. The effect is economically important.
A one-standard deviation increase in the index of general managerial ability is associated with an
2 Ferreira and Sah (2012) propose a model where more generalist managers tend to occupy the top of the hierarchy as the complexity of the business environment increases and communication technologies improve.
3
additional 12% in annual total CEO pay. Moreover, generalist CEOs (those with a general ability
index value above the median) earn a premium of 19% in annual pay, or nearly a million dollars
in extra pay per year on average. The generalist pay premium is pervasive across industries but it
is higher in industries that have experienced regulatory and technological shocks in the last two
decades such as the telecom sector. We also find that the positive relation between pay and
general managerial ability holds for each individual component of the index and for both cash-
and equity-based pay.
We control for many firm characteristics and CEO characteristics in our tests, including CEO
age, tenure, and educational background. The results are robust to the inclusion of firm and CEO
fixed effects, which control for time-invariant unobserved firm and CEO heterogeneity. We also
address the endogeneity of CEO selection, which is the concern that the general managerial skills
premium is due to non-random assignment of CEOs to firms. In order to address this possibility,
we choose a control group of specialist CEOs using a propensity score matching procedure to
ensure that there are virtually no observable differences in firm and CEO characteristics between
the specialists CEOs and those in the treated sample of generalist CEOs. This method gives
estimates of the generalist pay premium that are in line with the baseline regression estimates.
We also test whether CEOs with general managerial skills get higher market pay when they
change jobs by examining a sample of newly appointed CEOs. We find an increase in CEO pay
when a firm switches from a specialist to a generalist CEO, especially when a new CEO is hired
from outside the firm. This is direct evidence that general managerial human capital commands a
premium in the CEO labor market at the time a new compensation package is set.
Finally, we offer insights on why firms pay a significant wage premium to generalist CEOs.
The generalist pay premium is higher when CEOs are hired to perform tasks such as
4
restructurings and acquisitions, which implies adapting to an evolving business environment.
Indeed, the generalist pay premium is higher in firms operating in industries hit by shocks,
distressed firms, and firms with intense mergers and acquisitions activity. These findings provide
insights into why the labor market pays generalists at a premium.
There are several alternative interpretations for a positive relation between CEO pay and
general managerial skills. A first hypothesis is that our index is simply capturing talent. Gabaix
and Landier (2008) emphasize that the relation between CEO pay and firm size is consistent with
assortative matching of top talent to large firms. We address this possibility in several ways. We
show that the findings are robust to the inclusion of CEO fixed effects, which control for
unobserved time-invariant CEO heterogeneity such as innate talent. We show that the relation
between pay and general skills is pervasive across different-sized firms, indicating that it is not
stronger for larger firms that attract top talent. And the results are robust when we control
directly for proxies of CEO innate talent such as age of first appointment to CEO, selectiveness
of the CEO’s college, and job market conditions at the time of graduation from college.
A second alternative hypothesis is rent extraction by powerful CEOs who grant themselves
excessive pay packages (Bebchuk, Fried, and Walker, 2002). CEOs with more accumulated
experience are likely to be better at extracting rents. This hypothesis predicts that the generalist
CEO pay premium would be higher in weaker governance firms. We find that the generalist pay
premium is robust to controls for internal and external corporate governance, and that general
skills are equally important for the CEO pay of firms with weak and strong corporate governance.
A third alternative hypothesis is that risk-averse CEOs may chose different career paths. A
CEO that is more risk averse might choose a more diversified professional career by working in
different firms and industries. The finding that the generalist pay premium is important for both
5
cash and equity pay does not seem to support the risk-aversion hypothesis. Furthermore, a risk-
averse CEOs should demand a pay premium for accepting the increased risk of equity-based pay
(e.g., Hall and Murphy, 2002; Conyon, Core and Guay, 2011; and Edmans and Gabaix, 2011).
We still find a significant generalist pay premium after we control directly for the risk of
compensation using the pay mix.
A final alternative hypothesis is that generalist CEOs are more high profile and attract more
attention from boards (Malmendier and Tate, 2009). Generalists could also be “serial CEOs”
who engage in job hopping (Giannetti, 2011) and feature more prominently in databases of
executive search firms and have an easier time being recruited (Dasgupta and Ding, 2010). In
these cases, CEOs could just have temporary luck, but their performance would ultimately be
disappointing. We investigate this possibility and do not find a significant relation between firm
performance and the general ability index. Additionally, we find that generalist CEOs are not at
any greater risk of termination following poor firm performance.
Taken altogether, the results are consistent with an efficient market-based explanation of the
pay premium awarded to CEOs with more general managerial skills. The relation between CEO
pay and general managerial skills is consistent with optimal contracting and the view that
compensation decisions by boards are based on candidate merits.
Our study complements previous findings that CEO skill set is an important determinant of
CEO pay. Coles and Li (2010) and Graham, Li, and Qiu (2012) find that manager fixed effects
explain a large part of the variation in executive pay. Fee and Hadlock (2003) use prior stock
price performance as a proxy for managerial ability and find that CEOs in firms with above-
average performance are more likely to be hired by other firms and receive higher pay at the new
firm. Falato, Li, and Milbourn (2011) find that CEO talent (proxied by media coverage, age at
6
which an executive becomes a CEO, and educational background) is an important determinant of
pay.3 We complement this work by measuring skills acquired during an executive professional
career and showing that these skills help to explain CEO pay.4
Our work also adds to the empirical evidence of Murphy and Zabojnik (2007) and Frydman
(2009) that CEO pay is determined in a competitive labor market of firms and CEOs, and that
CEO pay has increased in the last decades because conditions in the market have changed in the
direction of emphasizing general skills. Murphy and Zabojnik (2007) provide indirect evidence
by examining the relation between outside hiring and CEO pay. Frydman (2009) measures the
generality of human capital by looking at occupational mobility within a firm (i.e., number of
organizational areas where an executive worked such as production or sales) and educational
background in a sample of the top-50 firms. Our measure of general ability focuses instead on
mobility across industries and firms (as well as experience as a top manager and in a diversified
firm) rather than internal mobility within a firm. Our focus on external mobility is important
because of the time trend observed in the labor market of appointing CEOs through external
hiring rather than internal promotion.
2. Sample and data description
Our initial sample consists of a panel of 25,562 CEO-firm-years in the 1993-2007 period drawn
from the Execucomp database. We manually match the executives in Execucomp who are
3 Garvey and Milbourn (2003) and Milbourn (2003) also link CEO pay, pay-performance sensitivities, and relative performance evaluations to CEO characteristics such as age, wealth, and media coverage. Another line of research links CEO pay level and structure to CEO physical and personality traits (Graham, Harvey, and Puri (2010)). 4 Others have shown that managers’ fixed effects and measurable characteristics have significant explanatory power for corporate financial policies and performance (Bertrand and Schoar (2003), Kaplan, Klebanov, and Sorensen (2012), and Malmendier, Tate, and Yan (2011)). Fee, Hadlock, and Pierce (2010), however, find no evidence of a managerial style effect using a sample of exogenous CEO turnovers.
7
identified as CEOs in a specific year with profiles in the BoardEx database in order to have data
on their characteristics including all prior professional experience (whatever the position or firm).
We could not find a match in BoardEx for 1,024 CEOs in our initial sample as there is some
survivorship bias in BoardEx, which affects primarily the match with Execucomp in the first
years of the sample period. The percentage of CEOs in Execucomp whose profiles are in
BoardEx grows from about 80% in the 1993-1999 period to more than 90% in the 2000-2007
period.5 The final sample includes 21,909 CEO-firm-year observations and 4,451 different CEOs.
We match firms in BoardEx to Compustat (US firms) and Datastream (international firms) in
order to obtain the standard industrial classification (SIC) of firms where CEOs worked. Because
Compustat and Datastream include only publicly traded firms, our analysis is restricted to past
positions in these firms. The sample of past positions includes 32,500 observations.
2.1. Measuring general managerial ability and CEO pay
Our goal is to test whether a generalist CEO is paid at a premium over a specialist CEO with
otherwise similar characteristics who is at a similar firm. To do this we create an index of the
generality of the CEO’s human capital (general ability index) based on the CEO’s lifetime work
experience in publicly traded firms prior to his current CEO position. This index captures the
skills of the CEO that are transferrable across firms and industries, rather than firm-specific. We
consider five proxies of general managerial ability:
Number of Positions (X1): Number of different positions that a CEO performed during his
career. A CEO with more positions is likely to have been exposed to different organizational
areas such as production, finance, human resources, sales, and marketing.
5 The CEO profiles missing in BoardEx are mainly from executives who retired or died before 2000. In untabulated results, we find that primary findings are robust when we use the 2000-2007 sample period.
8
Number of Firms (X2): Number of firms where a CEO worked. A CEO who worked for
multiple firms has probably acquired more generic skills as opposed to firm-specific skills.
Number of Industries (X3): Number of industries at the four-digit SIC level where a CEO
worked. A CEO who worked for firms in different industries has been exposed to different
business environments.6
CEO Experience Dummy (X4): Dummy variable that equals one if a CEO held a CEO
position at another firm. A CEO position requires by definition a set of generic skills in order to
deal with different organizational areas, and also to deal with the many external entities such as
capital markets, stakeholders, and media.
Conglomerate Experience Dummy (X5): Dummy variable that equals one if a CEO worked
for a multi-division firm. A CEO who has worked for a conglomerate has been exposed to a
more complex organization and likely has more attractive outside options. Lazear (2009)
develops a theory that firms vary in their weighting of different skills. This view suggests that a
diversified firm puts non-zero weights on skills applicable across the industries in which the firm
operates. Tate and Yang (2011) show that workers who move from diversified firms face better
outcomes in the labor market.
To combine these variables into a one-dimensional index of general managerial ability, we
extract common components, using principal component analysis, from the five variables that
proxy for general human capital. Using a single factor, instead of the five variables individually,
we increase the power of the regression tests by avoiding the problems arising from
multicollinearity and minimize measurement error.
6 In unreported results, we obtain similar findings when we count the number of industries at the two-digit SIC level.
9
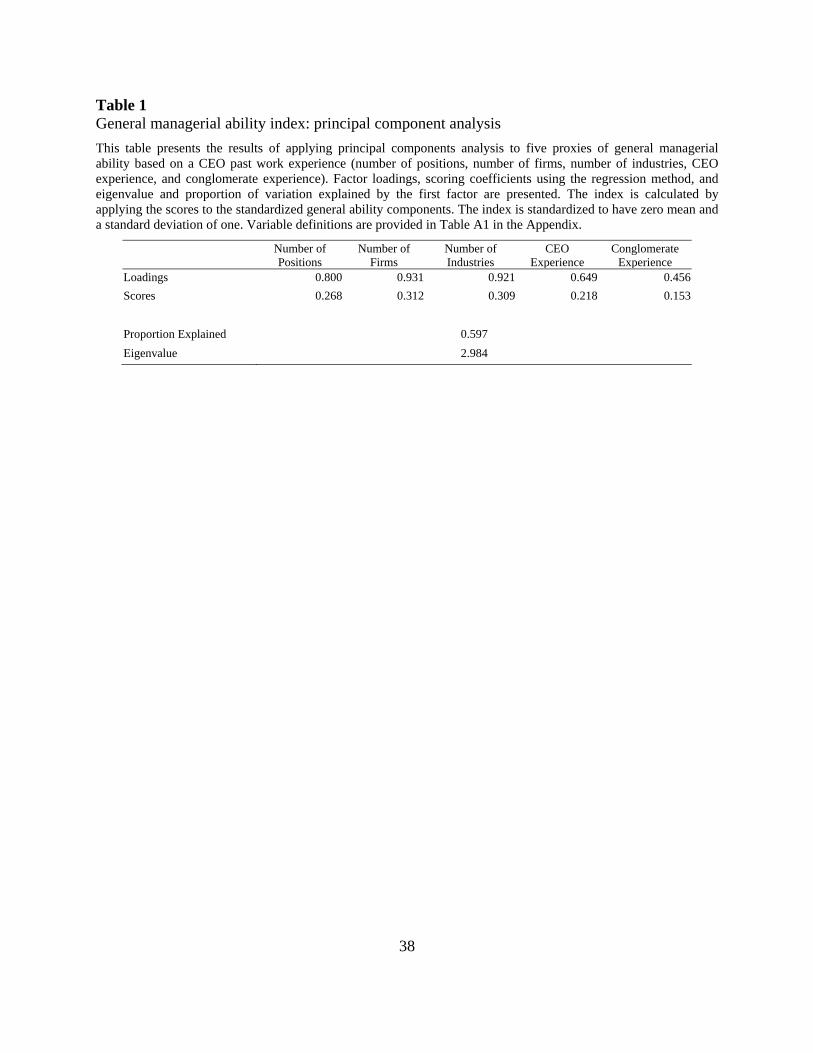
Table 1 shows the results of the principal component analysis for the proxies of general
managerial ability. Using this methodology we obtain only one component with an eigenvalue
higher than one (eigenvalue of 2.984).7 As expected, all the five variables have positive loadings,
being positively correlated with the index. Thus, higher levels of general human capital are
reflected in a higher value of the index. The index gives close to equal weights to the past
number of positions, firms, and industries, and a lower weight to the past CEO and conglomerate
experiences. The general ability index (GAI) of CEO i in year t is calculated by applying the
scores in Table 1 to the standardized general ability components; the index is standardized to
have zero mean and a standard deviation of one:8
GAIi,t = 0.268 X1i,t + 0.312 X2i,t + 0.309 X3i,t + 0.218 X4i,t + 0.153 X5i,t (1)
Figure 1 and Panel A of Table 2 show a shift in the relative importance of general versus
firm-specific managerial skills; the general ability index increases over time. This is consistent
with the idea that CEOs have more general skills that are transferable across firms and industries.
Figure 1 and Panel A of Table 2 also report the time series of average CEO total pay in the
1993-2007 period. Total pay consists of salary, bonus, value of restricted stock granted, value of
options granted, long-term incentive payout, and other compensation (Execucomp item TDC1).
We observe a significant increase in average total pay, consistent with findings in Piketty and
Saez (2003), Frydman and Jenter (2010) and Murphy (2012). Average total pay more than
doubles from 1993 to 2000, but then stays fairly stable at about $5 million.
Using the general ability index, we classify CEOs with an index above the yearly median as 7 An eigenvalue above one means that the extracted component has more explanatory power than any one of the original proxies by itself. The eigenvalue of the second factor is less than one. 8 The general ability index data used in this paper is online at http://jfe.rochester.edu/data.htm.
10
generalists and CEOs with an index below the yearly median as specialists.9 We then calculate
the average total pay of each type of CEO in each year. We find that generalists are paid at a
premium over specialists in every year. The premium increases over the 1990s, reaching a peak
of $3.4 million in 2000. Then there is a decline over the 2000s, but the premium stays above $2.3
million in every single year.
We also develop a new measure–Generalist Excess Pay–that aims to capture the pay
premium of a multi-industry CEO (an executive who worked in several industries) when
matched to an equivalent portfolio of single-industry CEOs (i.e., an executive who worked only
in that industry). The portfolio of specialists aims to match the set of skills that the multi-industry
CEO acquired during his career. This measure is inspired by the excess value measure used in
the corporate diversification literature (Berger and Ofek, 1995).
The generalist excess pay is computed as the difference between CEO total and imputed pay,
where the latter is the average CEO pay of the industries where the CEO worked. The industry-
level pay is given by the median pay of single-industry CEOs. The industry match is at the four-
digit SIC code level when there are five or more single-industry CEOs or at the highest SIC level
with at least five single-industry CEOs. Panel A of Table 2 shows a significant increase in the
generalist excess pay measure over the period. Because the average generalist excess pay is
always positive over time, we conclude that multi-industry CEOs are paid at a premium.10
9 In unreported results, we obtain similar findings when we classify CEOs with an index above the overall median as generalists. 10 Analysis of the average generalist excess pay over time in Table 2 is restricted to the sample of multi-industry CEOs. Thus, the measure is simply capturing how much more (or less) a generalist earns compared to an otherwise equivalent portfolio of specialists.
11
2.2. Cross-industry variation
We find significant variation across industries (Fama-French 12 industry groups) in terms of the
general ability index as well as in terms of the difference in pay between generalist and specialist
CEOs. Panel B of Table 2 shows that the telecom (telephone and television industry) industry
has the highest average level of generality of CEO human capital (0.472) and at the same time is
also the industry whose CEOs are the highest paid on average ($9 million). Further, CEOs of
telecom firms with résumés that include positions in other industries receive on average $7.7
million more than CEOs who have spent all their careers in the telecom industry. Over the 1990s,
the telecom industry changed rapidly not only because of technological innovation (cell phones,
internet), but also in terms of regulation following the Telecommunications Act in 1996. This
could have increased the demand for managers with more general skills. The industry with the
lowest general managerial skills index is finance (-0.228), but we still find a significant premium
in generalists’ pay in this industry. Overall, there is a positive and significant generalist pay
premium and generalist excess pay measure across all industries.
A good example of a generalist executive is Michael H. Jordan who has the fifth highest
general ability index (5.866 as of 2007). He served as Division Chairman/CEO of PepsiCo
(consumer nondurables industry) in 1986-1990, and as CEO of Westinghouse Electric
(manufacturing industry) in 1993-1998, CBS (telephone and television industry) in 1995-1998,
and Electronic Data Systems (business equipment industry) in 2003-2007. In addition, he had
several other positions in companies operating in other industries such as consumer nondurables
and wholesale and retail industries. His total compensation was $3.1 million in 1997 (the year
before he left CBS) and nearly five times higher at $14.9 million in 2004 (the year after he joined
Electronic Data Systems). He was paid an average premium of $10 million over the average pay
12
of specialist (single-industry) CEOs while he was the CEO of Electronic Data Systems.
Other examples of generalist executives (from the list of CEOs whose index is above the
90th percentile) include Robert S. Miller Jr. (the second highest index with 6.868 as of 2007)
who served as CEO of Delphi (2005-2007), Gerald Grinstein who served as CEO of Delta Air
Lines (2004-2007), and Ivan Seidenberg who served as CEO of Verizon Communications (2003-
2011).
Examples of specialist executives (from the list of CEOs whose index is below the 10th
percentile) include Michael Dell who is the founder and CEO of Dell since 1984, John Mackey
who is the founder and CEO of Whole Foods Market since 1980, Robert Selander who served as
CEO of Mastercard (1997-2010), and James Skinner who served as CEO of McDonald’s since
2004. These specialists have spent their entire professional careers in a single firm or industry.
The succession planning prior to Jack Welch’s retirement as Chairman and CEO of General
Electric (manufacturing industry) is also a good example of how general managerial abilities, in
particular experience at a conglomerate, could matter for CEO pay. James McNerney, Robert
Nardelli, and Jeffrey Immelt were the three potential successors who competed to succeed Welch.
Immelt was selected for the job, but all three ended up receiving a pay premium in the labor
market. Immelt, who made $23 million in 2002 at General Electric, has been quite successful as
CEO. McNerney made $12 million in 2002 at 3M (manufacturing industry) and, after a good job
as CEO at 3M, went to Boeing (manufacturing industry) as CEO. Nardelli made $35 million in
2002 at Home Depot (wholesale and retail industry), but the company lagged in performance,
with a stock price performance significantly behind its peers. Interestingly, the manufacturing
industry is above the median in terms of the general ability index, while the wholesale and retail
industry is the second-lowest in terms of the general ability index. Thus, Nardelli’s general skills
13
were a bad match for Home Depot, while McNerney’s were a good match for 3M.
2.3. Summary statistics of CEO and firm characteristics
Table 3 shows summary statistics for CEO pay, CEO characteristics, and firm characteristics.
Besides the CEO attributes in the general ability index, we measure some additional CEO
characteristics: CEO Age, CEO Tenure, External Hire Dummy, MBA Dummy, CEO-Chair
Dummy, First Year as CEO Dummy, Ivy League Dummy, Recession Graduate Dummy, and Fast
Track Career. We also control in the tests for firm characteristics: Sales, Tobin’s Q, ROA,
Volatility, Stock Return, Firm Age, and Diversification Dummy. All variables are winsorized at
the 1th and 99th percentile values. Table A.1 in the Appendix provides variable definitions and
data sources.
2.4. General managerial ability and CEO and firm characteristics
Which firms are more likely to have a generalist CEO? Table 4 shows the average CEO and firm
characteristics for generalist and specialist CEOs. Table 4 also presents correlation coefficients
between the general ability index and firm and CEO characteristics. CEOs with more
accumulated general human capital tend to be older, appointed from outside the firm, hold an
MBA degree, and have a shorter tenure than specialist CEOs. As expected, we find that firms
with generalist CEOs are bigger, older, and more diversified. We also find that firms with
generalist CEOs have higher leverage and lower cash holdings and stock return volatility. The
differences in firm performance are small, even though statistically significant. Accounting
performance and stock market performance are slightly higher for firms with specialist CEOs.
The differences in Tobin’s Q, CAPEX, and R&D are not economically meaningful.
14
3. Do generalist CEOs get paid more?
In this section, we examine the relation between CEO pay and the generality of his managerial
ability based on past work experience using regression tests.
3.1. Baseline regressions
Table 5 presents our main test of whether CEOs with higher general managerial ability receive
higher pay. The base specification is an ordinary least squares (OLS) panel regression where the
dependent variable is the logarithm of CEO total pay. The regressions include both year and
industry (two-digit SIC) fixed effects, and the t-statistics are adjusted for heteroskedasticity and
within-firm correlation using clustered standard errors.11
We also estimate firm and CEO fixed effects panel regressions. Fixed-effects methods solve
“joint determination” problems in which an unobserved time-invariant variable simultaneously
determines total pay and the general ability index. In firm fixed-effect regressions, only the
effects of within-firm changes in total pay are taken into account, so firm-specific omitted
variables cannot explain the observed relation between pay and managerial attributes. The CEO
fixed-effects regression solves the equivalent problem at the CEO level; that is, it controls for
CEO characteristics that are innate, such as CEO talent or CEO risk aversion. In the CEO fixed-
effects regression, the coefficient of the generalist ability index dummy captures only the
difference in pay for CEOs who change from specialist to generalist or vice-versa.12
Column (1) presents the estimates of an OLS regression of CEO total pay on firm
11 Results (untabulated) with t-statistics adjusted for within-CEO correlation are similar to those with t-statistics adjusted for within-firm correlation. 12 A CEO can change from the generalist to the specialist group because we use the yearly median to define the groups.
15
characteristics, while column (2) presents the estimates of an OLS regression of CEO total pay
on firm and CEO characteristics, but without including the general ability index. The coefficients
of the firm and CEO characteristics are consistent with other studies of the determinants of CEO
pay. We find that firm size is positively associated with total pay, which is consistent with
findings in Gabaix and Landier (2008) and others. Examination of other commonly used firm-
level factors affecting CEO pay indicates that pay is positively associated with growth
opportunities (Tobin’s Q), firm performance as measured by stock returns, and stock return
volatility. In terms of CEO characteristics, we find a pay premium for CEOs with an MBA (this
variable is dropped in the CEO fixed-effects specification because CEOs with an MBA degree
got it before their first CEO position), CEOs who are also chair of the board, and those in the
first year of CEO appointment (which might reflect a signing bonus effect). The R-squared is
47.7% in column (1) and 49.3% in column (2), which is in line with other studies of the
determinants of CEO pay.
Columns (3)-(5) of Table 5 show that the coefficient on the general ability index is positive
and significant in all specifications, which is consistent with the idea that CEOs with more
general managerial skills earn a wage premium. Using the estimates in column (3), CEOs who
are one-standard deviation higher in the general ability index distribution earn 12% higher in
annual total pay, which corresponds to approximately half a million dollars of extra pay per year.
The general ability index is correlated with some of the firm and CEO characteristics, so
there is a concern that multicollinearity may be driving the results. When we run the regressions
in Table 5 using the general ability index as the only explanatory variable (untabulated), we find
that the index coefficient is positive and significant. Additionally, we find that the inclusion of
the general ability index does not significantly affect the coefficients of the other control
16
variables relative to the regressions using only the control variables in columns (1) and (2).
So far we have treated the general ability index as a continuous variable. An alternative
approach is to classify CEOs as generalists versus specialists according to the distribution of the
general ability index in each year. In this case, we define a general ability index dummy variable
that takes a value of one for CEO-year observations with an index above the yearly median, and
zero otherwise. In columns (6)-(8) of Table 5 we present the results of the total pay regressions
after replacing the general ability index with this dummy. The results are robust across the
different specifications and are consistent with those using a continuous variable. We see that the
general ability index dummy coefficient is positive and significant, indicating that generalist
CEOs earn a wage premium. A generalist CEO earns about 19% more than a specialist CEO,
which in dollar terms is about $850,000 per year.
In Table 6 we examine the effect of the general ability index on each pay component: cash
pay (salary plus bonus) in columns (1)-(3) and equity pay (restricted stock plus option awards) in
columns (4)-(6). We find a positive relation between the general ability index and cash and
equity pay, but a stronger effect in equity pay. In columns (1) and (4), a one-standard deviation
increase in the index is associated with an increase of 4% in cash pay and 16% in equity pay.
When we use the general ability index dummy as an explanatory variable (untabulated), we find
that the cash and equity pay are 5% and 23% higher for generalist CEOs than specialist CEOs. In
the CEO fixed-effects specification for equity pay in column (6), the coefficient is not
statistically significant although it is similar in size to the firm fixed-effects estimates in column
(5). This is probably due to lower within-CEO variation and a smaller number of observations in
the case of equity pay.
Columns (7)-(9) test the sensitivity of the results to the inclusion of the pay mix (ratio of
17
equity pay to total pay) as an economic determinant of CEO total pay. The pay mix is included
as a determinant of pay levels to see whether controlling for compensation risk significantly
affects our results. If firms provide more incentives to generalist CEOs through equity pay, it is
possible that the generalist pay premium is a result of risk-averse CEOs demanding a pay
premium for accepting the increased risk of equity pay. We still find a positive and significant
general ability index coefficient when we include the pay mix as an explanatory variable. The
magnitude of the coefficients is reduced relative to those in Table 5 but the effect is still
economically important. Using the estimates in column (7), CEOs who are one-standard
deviation higher in the general ability index distribution earn 7% higher annual total pay.
In order to further examine this issue, we use the pay mix as the dependent variable to
examine the relation with general managerial skills. Column (10) presents the results of a Tobit
model for the ratio of equity pay to total pay. We also find that general ability index is positively
associated with the ratio of equity pay to total pay.
The pay components and mix results are informative about the alternative hypothesis that
risk-averse CEOs may choose a more diversified professional career by working in different
firms and industries or demanding a pay premium for accepting the increased risk of equity pay.
The finding that the generalist pay premium is important for both cash and equity pay does not
seem to support the risk-aversion story. A risk-averse CEO would not value cash and equity pay
equally. Furthermore, the finding of significant generalist pay premium when we control for the
risk of pay does not support the risk-aversion story.
Table 7 presents estimates of the same regressions as those in Table 5 but now using the five
individual measures of general skills instead of the general ability index as main explanatory
variables. We find that all index components are positively associated with total pay. These
18
findings support the hypothesis that greater mobility of CEOs across positions, firms, and
industries and prior experience as CEO and in conglomerates carry a positive pay premium. The
effects are economically important. For example, columns (3) and (5) show that one extra firm or
industry in a CEO’s résumé adds an extra 6% to annual total pay.
3.2. Sample selection bias
One important concern with our findings of a general managerial ability pay premium is sample
selection bias due to endogeneity in the assignment of CEOs to firms. The main concern with the
endogenous matching of CEOs to firms is that the generalist pay premium is in reality driven by
some unobserved firm and/or CEO characteristic that is correlated with the general ability index.
If matching is based only on observable firm and CEO characteristics and time-invariant effects,
the firm and CEO fixed effects regressions address the matching problem. In other words, fixed
effects control for time-invariant factors that affect managers’ choice of firm or firm’s choice of
manager. However, if managers and firms are matched based on unobserved time-variant firm or
manager characteristics, then fixed effects cannot fully address the matching problem (e.g.,
Abowd, Kramarz, and Margolis, 1999; and Bertrand and Schoar, 2003). For example, a selection
story would attribute the generalist pay premium to the fact that generalist CEOs are
disproportionally assigned to large firms.
We use a nearest-neighbor matching estimator (Abadie and Imbens, 2011) to address
selection concerns. Ideally, we would like to compare the CEO pay of a firm that appoints a
generalist CEO to the same firm’s pay if it had appointed a specialist CEO. As we cannot
observe the counter-factual, we construct a hypothetical one by estimating a first-stage probit
regression of the likelihood that a firm appoints a generalist CEO (i.e., those with a general
19
ability index above the yearly median) using observable pre-transition firm and CEO
characteristics related to the CEO selection. CEO selection is a natural application for a matching
procedure as selection decisions are made by directors who rely mostly on public information to
assess CEO ability.
Research has found that one signal that boards rely on in choosing external CEO candidates
is performance of the candidate’s current firm. Boards are more likely to hire executives from
high-performing firms, and boards pay a premium for this performance (Fee and Hadlock,
2003). 13 The first-stage probit model estimates (untabulated) show a greater likelihood of
appointing a generalist CEO in larger firms, conglomerates, more levered firms, and R&D-
intensive firms. There is a negative and significant relation between pre-transition firm
accounting performance and the likelihood of appointing a generalist CEO.
We find that the total pay difference between generalist CEOs (the treatment group) and the
matched specialist CEOs with the closest predicted probability (the control group) is 18%, which
is statistically significant and similar in size to our baseline regression results in Table 5.
Estimates of the cash pay and equity pay premiums here are also in line with the estimates in
Table 6. Overall, this evidence suggests that the endogeneity of CEO selection is unlikely to be
driving our primary findings. In the next section, we further address endogeneity concerns.
3.3. CEO appointments and switch types
We now consider only newly appointed CEOs whose lifetime work experience is more likely to
be a valuable signal of general ability, as they do not have a track record at their new job.
Appointment-year pay should also be closest to pay set in the labor market. In this sample of
13 A caveat of this approach is that we cannot rule out selection based on directors’ private information. We minimize this possibility by using specifications that control for unobserved firm heterogeneity.
20
newly appointed CEOs we expect to find an increase in pay when a firm appoints a CEO with
greater general managerial ability. We use pay measured in the year of the CEO appointment.14
Panel A of Table 8 shows a positive and significant link between total pay and the general
ability index in the sample of newly appointed CEOs. A one-standard deviation increase in the
general ability index is associated with a 12% increase in total pay per year, which is similar to
the estimates in Table 5. Again, this effect comes predominantly from the equity pay component.
The ideal experiment to address selection concerns would be to replace (exogenously) a
generalist CEO with a specialist CEO (or vice versa) and observe the change in pay. If there was
no change in pay then we would conclude that CEO pay is not linked to general managerial
ability, but generated by some unobservable characteristic. Unfortunately this experiment cannot
be implemented in practice. The closest we get is by looking at switches of CEO type. Of course
in this case, the decision to replace the CEO and the selection of the new CEO is not exogenous.
We examine the effect on pay when a firm switches CEO type from generalist to specialist or
vice-versa. We classify CEOs as generalists (specialists) if their general ability index is above
(below) the 75th percentile in each year. We expect firms to offer a pay premium when they
switch from a specialist to a generalist CEO. The effect should be more pronounced when the
new CEO is hired from outside the firm because the firm is accessing the CEO labor market
(Murphy and Zabojnik, 2004, 2007).
We measure the switch of CEO type using variables as follows: (1) No Switch of CEO Type,
a dummy that equals one if there is a new CEO at year t but there is no switch of CEO type from
t - 1 to t; (2) Switch to Generalist – External Hire, a dummy that equals one if there is a
generalist CEO hired from outside the firm at year t who follows a specialist CEO; (3) Switch to
14 We obtain consistent results if we use pay of the year following the CEO appointment.
21
Specialist – External Hire, a dummy that equals one if there is a specialist CEO hired from
outside the firm at year t who follows a generalist CEO; and similarly (4) Switch to Generalist –
Internal Hire and (5) Switch to Specialist – Internal Hire, for the case of internally appointed
CEOs. We estimate these coefficients using the panel of firms-CEOs, and therefore the intercept
in the regression captures the base case of no CEO turnover.
Column (1) of Table 8, Panel B, shows that the coefficient on Switch to Generalist – External
Hire is positive and significant, while the coefficient on Switch to Specialist – External Hire is
negative although statistically insignificant. Moreover, these two coefficients are statistically
different from each other as shown by the F-statistic at the bottom of the table. The effect on
CEO total pay of switching from a specialist to a generalist CEO by external appointment is
economically important at about 27% extra pay, which corresponds to $1.2 million per year.
Columns (2) and (3) show that the increase in pay associated with switching from a specialist to
a generalist CEO is driven by an increase in equity pay of more than 40%, while there is a
reduction in cash pay (although not statistically significant). For internally appointed CEOs,
there is some evidence of a pay discount when a specialist is appointed.
Overall, there is an increase in CEO pay when a specialist is replaced by a generalist,
especially when the CEO is hired from outside the firm. This is evidence that general managerial
human capital commands a pay premium in the CEO labor market. Furthermore, there is no
indication that matching explains the generalist pay premium although we cannot completely
rule out the possibility that some time-variant unobserved characteristic explains our findings.
3.4. Is general managerial ability capturing talent?
Another concern with the measure of general managerial ability is that it may be capturing a
22
CEO’s innate talent rather than accumulated skills. Talented CEOs may move more across firms
and industries. In this case, the observed generalist premium would represent a reward for talent.
The CEO fixed-effects regressions in Tables 5 and 6 address this concern to the extent that they
control for unobserved time-invariant heterogeneity across CEOs.
To further address the talent hypothesis, we run additional tests using proxies for CEO talent.
Ivy League Dummy is a variable that takes a value of one if the CEO attended an Ivy League
school at any academic level. Falato, Li, and Milbourn (2011) suggest that CEOs educated at
more selective institutions are paid at a premium, and this effect is associated with talent. The
second proxy of CEO talent is the Recession Graduate Dummy, which is a variable that takes a
value of one if the CEO’s first academic degree was awarded in an NBER recession year.
Conditional on having become a CEO, managers who started their careers under tougher labor
market conditions should be more talented than other managers. Oyer (2008) show that the labor
market consequences of completing an MBA in a bad economy are negative and persistent, and
Schoar and Zuo (2011) show that economic conditions at the beginning of a managers’ career
have lasting effects on his career path. The third proxy is the Fast Track Career, which is the age
at which a manager became CEO for the first time. Falato, Li, and Milbourn (2011) suggest that
executives who are appointed CEOs earlier in their careers have greater talent and are expected
to be paid a premium.
Column (1) of Table 9, Panel A, shows a generalist pay premium of approximately 12%,
which is similar to what we see in Table 5, even after controlling for different proxies for CEO
talent. Talent proxies coefficients have the expected sign but they are not statistically significant
across all specifications. In columns (3)-(6) we find a generalist pay premium using both cash
and equity pay but the equity pay premium is higher than the cash pay premium. Fixed effects
23
estimates are also consistent with the estimates in Table 5.
In an additional check, we test whether a CEO general ability index as of 2007 predicts CEO
average pay in the 1990s (1993-1999, specifically). If this is the case, then the index may well be
capturing CEO innate skills. Panel B of Table 9 shows that the general ability index of 2007 does
not significantly predict CEO pay in the earlier period. We conclude that the general ability
index is thus capturing accumulated skills and not just CEO innate talent.
3.5. Cross-sectional variation in the generalist pay premium
Next we investigate whether the relation between general managerial attributes and CEO pay is
heterogeneous across different types of firms. We first study the size of a firm’s operations
because that has been shown to be an important determinant of CEO pay, as more talented CEOs
are matched to larger firms (Gabaix and Landier, 2008). We then study the effect of corporate
diversification. Both firm size and number of business segments have been used as proxies for
the scope and complexity of a firm’s operations (e.g., Boone, Field, Karpoff, and Raheja, 2007;
and Coles, Daniel, and Naveen, 2008).
Panel A of Table 10 presents regressions of CEO total pay for groups of firms according to
firm size and number of business segments. Columns (1)-(4) present results for the sample split
into small and large firms based on sales below or above the yearly median. There is a positive
relation between total pay and the general ability index in both the small and large firm groups.
We conclude that our primary findings are not exclusively driven by large firms. To the extent
that we find a CEO pay-general ability premium of the same magnitude in small and large firms,
there is no indication that the general ability index is just a proxy for talent.
Columns (5)-(8) present results for firms with a single business segment (stand-alone firms)
24
and multiple business segments (diversified firms). We find a positive coefficient only in the
sample of diversified firms. This finding is consistent with the idea that diversified firms have
more need of general skills and pay a higher premium for managers with such skills. Generalist
CEOs have the abilities required to manage a firm that operates in different business
environments, and these firms seem to reward these managers with extra pay.15
Finally, we examine how the quality of a firm’s internal and external corporate governance
affects the CEO pay-general ability relation. Panels B and C of Table 10 present regressions for
groups of firms depending on the fraction of independent directors on the board of directors
(Board Independence), concentration of institutional ownership (Institutional Ownership
Herfindahl), takeover defenses (Gompers, Ishii and Metrick, 2003; GIM governance index), and
product market competition (Industry Sales Herfindahl). We rank firms into groups according to
the median of the distribution of these variables.16
High board independence and institutional ownership Herfindahl index are associated with
better corporate governance and more effective monitoring of management actions (Weisbach,
1988; and Hartzell and Starks, 2003). In Panel B we find that the pay-general ability relation is
important in groups of both low and high internal corporate governance. The relation is slightly
stronger in the low corporate governance groups, but the difference between the high and low
groups is not statistically significant.
In Panel C we find that the pay-general ability relation is important both in the groups of low
and high external governance in terms of the governance index and product market competition.
15 There is evidence that generalist CEOs perform better than specialist CEOs in diversified firms. Xuan (2009) finds that appointment of specialist CEOs in multi-division firms leads to inefficient capital allocation decisions. 16 We obtain similar findings using the level of institutional ownership or number of firms in the industry to rank firms in low and high groups.
25
There is some evidence that the relation is stronger for firms with fewer takeover defenses but
only in the fixed-effects models. In untabulated regressions, we also find that estimates of the
general ability index coefficient are barely affected by including the measures of corporate
governance directly as control variables in the regressions in Tables 5 and 6.
We conclude that the effect of general managerial ability is pervasive across firms with
different corporate governance mechanisms. If general managerial attributes are proxies for CEO
power to set their own pay (Bebchuk, Fried, and Walker, 2002), then pay for general skills would
be a reflection of entrenchment issues, and we should see significantly higher premiums for
firms with weaker governance, such as lax board monitoring. If general skills are to the contrary
signals of productive ability that are useful to executives in competitive labor markets, we should
see similar (or even higher) premiums in better-governed firms than in more-poorly governed
firms. Overall, the results are inconsistent with an entrenchment view explaining the generalist
CEO pay premium.
3.6. Effect of firm performance and industry shocks
Generalist CEOs might be particularly important at the time of shocks to the firm and they might
be hired to perform difficult tasks such as restructurings and acquisitions. This could be one
reason why firms are willing to pay generalist CEOs a premium over specialists. We run tests to
investigate this possibility in the sample of newly appointed CEOs, as this is the time there
should be a stronger link between the CEO pay package and the type of task an executive is hired
to perform.
We first consider the possibility that generalist CEOs are hired and paid a premium when the
firm is in distress. We classify a firm as in Distress if in a given year its return on assets is below
26
the industry median (two-digit SIC) for two consecutive years. All other firms are classified as in
No Distress. Columns (1) and (2) of Table 11 present the results. We find a significantly stronger
positive relation between pay and general managerial ability in the sample of distressed firms.
Mergers and acquisitions (M&A) could represent another important setting where there may
be strong demand for CEOs with general skills. If this is the case, we should see that the pay
premium is more pronounced in situations with high M&A activity. We classify a firm as High
M&A Activity if in a given year it has a value of acquisitions in the top quartile of the distribution
of acquisitions across all firms. All other observations are classified as Low M&A Activity.
Columns (3) and (4) of Table 11 show a more pronounced positive relation between CEO pay
and general managerial ability in the sample of firms that make more acquisitions.
Finally, firms operating in industries hit by shocks (technological changes or other factors)
may hire a generalist CEO for restructuring or adapting to an evolving business environment,
and be willing to pay a significant wage premium. We test for this possibility by classifying an
industry as High Industry Shocks if in a given year it is in the top quartile of the distribution of
the difference between industry sales growth and the average sales growth across all industries.
An industry is classified as Low Industry Shocks if in a given year it is in the bottom quartile of
the distribution. This definition follows Mitchell and Mulherin (1996). In columns (5) and (6) of
Table 11, we find that the positive relation between pay and general managerial ability is
statistically significantly only for firms operating in industries facing shocks.
3.7. Generalist CEO excess pay
A different measure of the pay premium to generalist CEOs is defined as the difference between
a CEO’s total pay and the imputed pay, given the executive’s past industry experience measured
27
by the pay of single-industry CEOs (i.e., the pay of CEOs who worked only in one industry over
their careers at the four-digit SIC code level). The Generalist Excess Pay is the logarithm of the
ratio of a CEO’s total pay to imputed pay; i.e., the premium or discount in pay resulting from
industry mobility.17 This measure produces a better match between the compensation of a CEO
with more general skills (generalists) and specialist CEOs in terms of industry experience.
Table 12 presents the results of regressions where the dependent variable is the Generalist
Excess Pay variable. We control for the same set of firm and CEO characteristics (coefficients
not shown) used in Table 5. We use the past number of industries or the multi-industry dummy
as explanatory variables because they naturally match the definition of the dependent variable.
The coefficient on the multi-industry dummy captures the percentage difference in average
excess pay between CEOs with a career path across more than one industry (multi-industry) and
single-industry CEOs. The pay premium for multi-industry CEOs is more than 14% in the OLS
specification in column (3).
In columns (5)-(8) we also estimate the excess pay regressions using as main explanatory
variables the general ability index and the general ability index dummy. There is strong evidence
of a positive relation between excess pay and general managerial attributes. A one-standard
deviation increase in the index is associated with 11% higher generalist CEO excess pay using
the specification in column (5).
Overall, the results using the excess pay measure support the notion that CEOs with more
general managerial skills earn a significant wage premium in the labor market. In particular,
CEO pay is higher for executives who have worked in more than one industry, and therefore
17 In the case of a single-industry CEO, the excess pay measure is simply the difference between the CEO total pay and the median pay of single-industry CEOs in the industry.
28
there is evidence of an industry mobility wage premium.
3.8. Other robustness checks
We perform several other robustness checks of our primary findings. In the interest of
conserving space, we do not tabulate these additional tests.
The general ability index is constructed using five proxies for general managerial ability.
There is a concern that the number of positions and firms does not capture acquisition of general
skills, as it may reflect simply intra- and inter-firm mobility, which is not directly related to
acquisition of general skills. We thus construct an index of general skills using just the other
three measures (past number of industries, experience as top manager, and experience in a
conglomerate). Using this alternative index, we obtain estimates of the pay-general attributes
premium similar to those reported in Tables 5 and 6 in both statistical and economic terms.
The coverage of CEO profiles in BoardEx is better in the 2000s than in the 1990s, although
the coverage is reasonably good since 1993. When we check whether an improvement in
coverage over time could bias our estimates of the pay-general ability premium, we find this is
not the case. Estimation of the regressions in Tables 5 and 6 separately for each decade indicate a
similar CEO pay effect in both the 1993-1999 and 2000-2007 periods. We also check that the
results are robust to the exclusion of financial firms from the sample.
We check the sensitivity of our estimates of the general ability premium to alternative
proxies of firm size. Indeed, there is strong theoretical justification for a positive relation
between CEO pay and firm size (Rosen, 1981; and Gabaix and Landier, 2008), which is backed
up by strong empirical evidence (e.g., Baker, Jensen and Murphy 1988; and Murphy, 1999). In
untabulated results, we find that the estimates of the general ability index are barely affected by
29
using alternative proxies of firm size such as market value or book value of assets. For example,
we estimate annual pay premiums for generalist CEOs relative to specialist CEOs between 17%
and 18%, which are similar to the equivalent estimate of 18.6% in column (6) of Table 5.
We also perform robustness checks on the measure of Generalist Excess Pay. We calculate
the measure of excess pay by performing the match between the multi-industry CEO and the
portfolio of single-industry CEOs using two-digit SIC codes. Using this coarser industry
classification has two main implications: First, we ensure that the industries are significantly
different from each other, and, second, that we have more single-industry CEOs to use as a
benchmark. In untabulated tests, we find the results to be robust to this alternative definition of
the measure of excess pay.
4. Interpretation and other hypotheses
In this section, we discuss alternative hypotheses to an efficient functioning of the CEO market
that could explain why generalist CEOs earn a pay premium. One prominent alternative
explanation is that generalist CEOs could just be more high profile or “hyped up” (Malmendier
and Tate, 2009). It could be also the case that generalist CEOs just feature more prominently in
databases of executive search firms and have an easier time being recruited. Dasgupta and Ding
(2010) emphasize the enhanced role of executive search firms in the last decades. Finally, it
could be the case that generalist CEOs accumulate firm or industry experience because they are
just “serial CEOs” who engage in job hopping (Giannetti, 2011).
In these cases, higher pay could just be a temporary phenomenon that would ultimately result
in disappointing performance. Cazier and McInnis (2010) and Chang, Dasgupta, and Hilary
(2010) find that boards tend to overpay for externally hired CEOs’ prior performance, as this pay
30
premium is negatively correlated with future performance at the hiring firm.
We investigate the relation between the CEO general ability index and firm performance to
test for these alternative explanations. The alternative hypothesis predicts that firms hiring
generalist CEOs would suffer poorer performance and lower shareholder returns. We estimate
the relation between alternative measures of accounting and stock market performance (net profit
margin, return on equity, Tobin’s Q, and stock return) and the index of general managerial ability
using firm fixed-effects and (annual) changes regressions. The changes regressions use the
subsample of newly appointed CEOs and compare the average firm performance in the three
years following an appointment with performance in the year before the appointment. The
regressions include the same controls (coefficients not shown) as in Table 5.
Table 13 shows the results. We find a statistically insignificant relation between firm
performance and the index of general managerial ability of the CEO. This result is not consistent
with the alternative hypotheses but rather with an efficient working of the CEO labor market.18
We also look at whether generalist CEOs are exposed to greater risk of termination following
poor firm performance. We estimate probit regressions where the dependent variable is a dummy
that takes the value of one if there is a CEO turnover in a given firm-year.19 The explanatory
variables of interest are interactions between past firm performance and the general ability index.
Table 14 shows the results of the CEO turnover-performance sensitivity regressions. We
measure performance using both accounting performance (ROA and industry-adjusted ROA) in
columns (1) and (2) and stock market performance (stock return and abnormal stock return) in
18 An alternative explanation for the statistical insignificant relation between firm performance and the general ability index is that performance is endogenous and our tests lack power. 19 We obtain similar findings when we consider only forced CEO turnovers. We thank Dirk Jenter for providing us with the forced CEO turnover data, used in Jenter and Lewellen (2010).
31
columns (3) and (4). We find a positive relation between the generalist ability index and CEO
turnover, but the relation does not seem to be triggered by poor firm performance. We find no
difference in sensitivity of CEO turnover to prior firm performance for generalist and specialist
CEOs. Indeed, the interaction term between the general ability index and firm performance is not
statistically significant in any of the specifications.20
Overall, our results are consistent with an efficient market-based explanation of the wage
premium earned by CEOs with general managerial skills. Our findings are consistent with
models of efficient sorting of CEO talent (Gabaix and Landier, 2008) where the small dispersion
of CEO talent at the top of the distribution results in small differences in firm value.21 These
small differences in talent, however, translate into large CEO pay differences.
Murphy and Zabojnik (2004, 2007) develop a theory that predicts a generalist pay premium,
but it does not necessarily imply that generalist CEOs perform better than specialists because
CEOs can appropriate the surplus generated by their general skills. Additionally, it is not always
the case that a generalist CEO is the best match for any type of firm. Specialist CEOs may be the
best match for firms where firm-specific knowledge is an important dimension of the CEO skill
set. The CEO turnover-performance sensitivity results are also consistent with the Murphy and
Zabojnik (2007) findings that the increased relative importance of general managerial skills is
not driven by more performance-related CEO terminations.
20 We obtain similar finding when we estimate the marginal effect of the general ability index and firm performance interaction and its significance using the delta method described by Ai and Norton (2003). 21 Gabaix and Landier (2008) offer a calibration of their model where firm value will go up by only 0.016% if the CEO number 250 (in terms of talent) is replaced by the number one CEO.
32
5. Conclusion
This paper shows that CEOs with general managerial skills are paid at a premium over those
with specific skills. We construct a new measure of the generality of human capital based on a
CEO’s résumé, including mobility across positions, firms, and industries, and experience as top
executive and in a conglomerate. We find a positive relation between the index of general
managerial ability and CEO pay using the sample of S&P 1,500 firms in the 1993-2007 period.
The results are robust to the inclusion of many firm and CEO characteristics as control variables,
including firm and CEO fixed effects.
We estimate that generalist CEOs earn an average annual pay premium of 19% relative to
specialist CEOs, which is nearly a million dollars in extra compensation per year. We show that
compensation for general managerial skills increases the most when a firm is exposed to labor
market conditions, namely, when it hires a generalist CEO from outside the firm to replace a
specialist CEO. In addition, the generalist pay premium is higher when generalist CEOs are hired
to perform complex tasks such as restructurings and acquisitions in order to adapt to an evolving
business environment. Finally, we find no evidence consistent with alternative explanations of
our findings such as compensation risk, risk aversion, sample selection bias, managerial
entrenchment, and CEO talent and high profile.
Overall, we show that measurable CEO characteristics, in particular skills gathered through
work experience, have significant explanatory power for CEO pay. We provide direct evidence
of the growing importance of general managerial skills versus firm-specific skills in the market
for CEOs. This trend is likely to expand opportunities for CEOs with more general managerial
skills, and therefore lead to higher levels of CEO pay in equilibrium.
33
References
Abowd, J., Kramarz, F., Margolis, D., 1999. High wage workers and high wage firms.
Econometrica 67, 251-333.
Abadie, A., Imbens, G., 2011. Bias-corrected matching estimators for average treatment effects.
Journal of Business and Economic Statistics 29, 1-11.
Ai, C., Norton, 2003. Interaction terms in logit and probit models. Economics Letters 80, 123-
129.
Baker, G., Jensen, M., Murphy, K. J., 1988. Compensation and incentives: Practice vs. theory.
Journal of Finance 43, 593-616.
Bebchuk, L., Fried, J., Walker, D., 2002. Managerial power and rent extraction in the design of
executive compensation. University of Chicago Law Review 69, 751-761.
Becker, G., 1962. Investment in human capital: A theoretical analysis. Journal of Political
Economy 70, 9-49.
Berger, P., Ofek, E., 1995. Diversification’s effect on firm value. Journal of Financial Economics
37, 39-65.
Bertrand, M., Schoar, A., 2003. Managing with style: The effect of managers on firm policies.
Quarterly Journal of Economics 68, 1169-1208.
Boone, A., Field, L., Karpoff, J., Raheja, C., 2007. The determinants of corporate board size and
composition: An empirical analysis. Journal of Financial Economics 85, 66-101.
Cazier, R., McInnis, J., 2010. Do firms contract efficiently on past performance when hiring
external CEO’s? Unpublished working paper, Texas Christian University.
Chang, Y., Dasgupta, S., Hilary, G., 2010. CEO ability, pay, and firm performance. Management
Science 56, 1633-1652.
Coles, J., Daniel, N., Naveen, L., 2008. Boards: Does one size fit all? Journal of Financial
Economics 87, 329-356.
Coles, J., Li, Z., 2010. Managerial attributes, incentives, and performance. Unpublished working
paper, Arizona State University.
34
Conyon, M., Core, J., Guay, W., 2011. Are US CEOs paid more than UK CEOs? Inferences
from risk-adjusted pay. Review of Financial Studies 24, 402-438.
Cunat, V., Guadalupe, M., 2009a. Executive compensation and competition in the banking and
financial sectors. Journal of Banking and Finance 33, 495-504.
Cunat, V., Guadalupe, M., 2009b. Globalization and the provision of incentives inside the firm:
The effect of foreign competition. Journal of Labor Economics 27, 179-212.
Dasgupta, S., Ding, F., 2010. Search intermediaries, internal labor markets, and CEO pay.
Unpublished working paper, Hong Kong University of Science and Technology.
Edmans, A., Gabaix, X., 2011. The effect of risk on the CEO market. Review of Financial
Studies 24, 2822-2863.
Edmans, A., Gabaix, X., Landier, A., 2009. A multiplicative model of optimal CEO incentives in
market equilibrium. Review of Financial Studies 22, 4881-4917.
Falato, A., Li, D., Milbourn, T., 2011. To each according to his ability? CEO pay and the market
for CEOs. Unpublished working paper, Washington University in St Louis.
Fee, E., Hadlock, C., 2003. Raids, rewards, and reputations in the market for managerial talent.
Review of Financial Studies 16-4, 1311-1353.
Fee, E., Hadlock, C., Pierce, J., 2010. Managers who lack style: Evidence from exogenous CEO
changes. Unpublished working paper, Michigan State University.
Ferreira, D., Sah, R., 2012. Who gets to the top? Generalists versus specialists in organizations.
RAND Journal of Economics, forthcoming.
Frydman, C., 2009. Rising through the ranks: The evolution of the market for corporate
executives, 1936-2003. Unpublished working paper, MIT Sloan School.
Frydman, C., Jenter, D., 2010. CEO compensation. Annual Review of Financial Economics 2,
75-102.
Gabaix, X., Landier, A., 2008. Why has CEO pay increased so much? Quarterly Journal of
Economics 123, 49-100.
35
Garicano, L., Rossi-Hansberg, E., 2006. Organization and inequality in a knowledge economy.
Quarterly Journal of Economics 121, 1383-1435.
Garvey, G., Milbourn, T., 2003. Incentive compensation when executives can hedge the market:
Evidence of relative performance evaluation in the cross section. Journal of Finance 58,
1557-1581.
Giannetti, M., 2011. Serial CEO incentives and the structure of managerial contracts. Journal of
Financial Intermediation 20, 633-662.
Gompers, P., Ishii, J., Metrick, A., 2003. Corporate governance and equity prices. Quarterly
Journal of Economics 118, 107-155.
Graham, J., Harvey, C., Puri, M., 2010. Managerial attitudes and corporate actions. Unpublished
working paper, Duke University.
Graham, J., Li, S., Qiu, J., 2012. Managerial attributes and executive compensation. Review of
Financial Studies 25, 144-186.
Hall, B., Murphy, K. J., 2002. Stock options for undiversified executives. Journal of Accounting
and Economics 33, 3-42.
Hartzell, J., Starks, L., 2003. Institutional investors and executive compensation. Journal of
Finance 58, 2351-2374.
Hubbard, R. G., Palia, D., 1995. Executive pay and performance: Evidence from the US banking
industry. Journal of Financial Economics 39, 105-130.
Jenter, D., Lewellen, K., 2010. Performance-induced CEO turnover. Unpublished working paper,
Stanford University.
Kaplan, S., Klebanov, M., Sorensen, M., 2012. Which CEO characteristics matter? Journal of
Finance 67, 973-1007.
Lazear E., 2009. Firm-specific human capital: A skill-weights approach. Journal of Political
Economy 117, 914-940.
Malmendier, U., Tate, G., 2009. Superstar CEOs. Quarterly Journal of Economics 124, 1593-
1638.
36
Malmendier, U., Tate, G., Yan, J., 2011. Overconfidence and early-life experiences: The effect
of managerial traits on corporate financial policies. Journal of Finance 66, 1687- 1733.
Milbourn, T., 2003. CEO reputation and stock-based compensation. Journal of Financial
Economics 68, 233-262.
Mitchell, M., Mulherin, J., 1996. The impact of industry shocks on takeover and restructuring
activity. Journal of Financial Economics 41, 193-229.
Murphy, K. J., 1999. Executive compensation. In: Ashenfelter, O., Card, D. (Ed.), Handbook of
Labor Economics. North Holland, Amsterdam, pp. 2485-2563.
Murphy, K. J., 2012. Executive compensation: Where we are, and how we got there. In:
Constantinides, G., Harris, M., Stulz, R. (Ed.), Handbook of Economics and Finance. North
Holland, Amsterdam, forthcoming.
Murphy, K. J., Zabojnik, J., 2004. CEO pay and appointments: A market-based explanation for
recent trends. American Economic Review Papers and Proceedings 94, 192-196.
Murphy, K. J., Zabojnik, J., 2007. Managerial capital and the market for CEOs. Unpublished
working paper, University of Southern California.
Oyer, P., 2008. The long-term labor market consequences of graduating from college in a bad
economy. Journal of Finance 63, 2601-2628.
Piketty, T., Saez, E., 2003. Income inequality in the United States, 1913-1998. Quarterly Journal
of Economics 118, 1-39.
Rosen, S., 1981. The economics of superstars. American Economic Review 71, 845-858.
Schoar, A., Zuo, L., 2011. Shaped by booms and busts: How the economy impacts CEO careers
and management style. Unpublished working paper, MIT Sloan School.
Tate, G., Yang, L., 2011. The bright side of corporate diversification: Evidence from internal
labor markets. Unpublished working paper, UCLA.
Tervio, M., 2008. The difference that CEOs make: An assignment model approach. American
Economic Review 98, 642-668.

37
Xuan, Y., 2009. Empire-building or bridge-building? Evidence from new CEOs’ internal capital
allocation decisions. Review of Financial Studies 22, 4919-4948.
Weisbach, M., 1988. Outside directors and CEO turnover. Journal of Financial Economics 20,
431-460.
38
Table 1 General managerial ability index: principal component analysis
This table presents the results of applying principal components analysis to five proxies of general managerial ability based on a CEO past work experience (number of positions, number of firms, number of industries, CEO experience, and conglomerate experience). Factor loadings, scoring coefficients using the regression method, and eigenvalue and proportion of variation explained by the first factor are presented. The index is calculated by applying the scores to the standardized general ability components. The index is standardized to have zero mean and a standard deviation of one. Variable definitions are provided in Table A1 in the Appendix.
Number of Positions
Number of Firms
Number of Industries
CEO Experience
Conglomerate Experience
Loadings 0.800 0.931 0.921 0.649 0.456
Scores 0.268 0.312 0.309 0.218 0.153
Proportion Explained 0.597
Eigenvalue 2.984
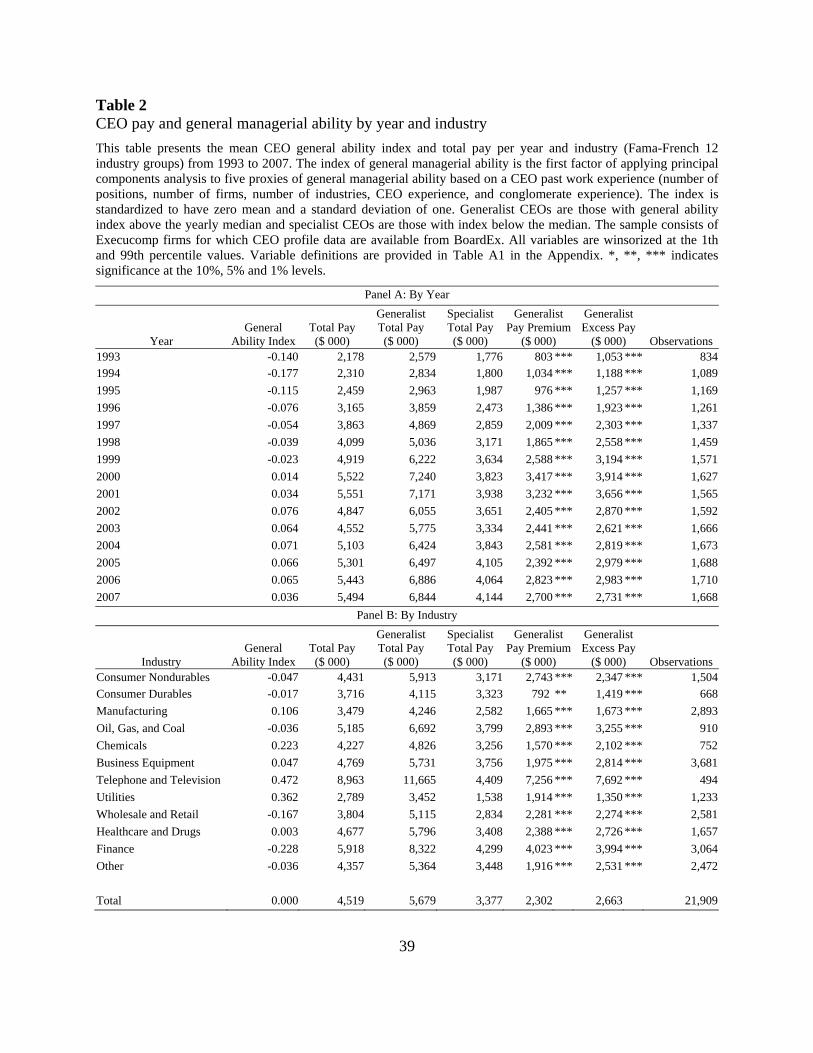
39
Table 2 CEO pay and general managerial ability by year and industry
This table presents the mean CEO general ability index and total pay per year and industry (Fama-French 12 industry groups) from 1993 to 2007. The index of general managerial ability is the first factor of applying principal components analysis to five proxies of general managerial ability based on a CEO past work experience (number of positions, number of firms, number of industries, CEO experience, and conglomerate experience). The index is standardized to have zero mean and a standard deviation of one. Generalist CEOs are those with general ability index above the yearly median and specialist CEOs are those with index below the median. The sample consists of Execucomp firms for which CEO profile data are available from BoardEx. All variables are winsorized at the 1th and 99th percentile values. Variable definitions are provided in Table A1 in the Appendix. *, **, *** indicates significance at the 10%, 5% and 1% levels.
Panel A: By Year
Year General
Ability Index Total Pay ($ 000)
Generalist Total Pay ($ 000)
Specialist Total Pay ($ 000)
Generalist Pay Premium
($ 000)
Generalist Excess Pay
($ 000) Observations 1993 -0.140 2,178 2,579 1,776 803 *** 1,053 *** 834 1994 -0.177 2,310 2,834 1,800 1,034 *** 1,188 *** 1,089
1995 -0.115 2,459 2,963 1,987 976 *** 1,257 *** 1,169
1996 -0.076 3,165 3,859 2,473 1,386 *** 1,923 *** 1,261
1997 -0.054 3,863 4,869 2,859 2,009 *** 2,303 *** 1,337
1998 -0.039 4,099 5,036 3,171 1,865 *** 2,558 *** 1,459
1999 -0.023 4,919 6,222 3,634 2,588 *** 3,194 *** 1,571
2000 0.014 5,522 7,240 3,823 3,417 *** 3,914 *** 1,627
2001 0.034 5,551 7,171 3,938 3,232 *** 3,656 *** 1,565
2002 0.076 4,847 6,055 3,651 2,405 *** 2,870 *** 1,592
2003 0.064 4,552 5,775 3,334 2,441 *** 2,621 *** 1,666
2004 0.071 5,103 6,424 3,843 2,581 *** 2,819 *** 1,673
2005 0.066 5,301 6,497 4,105 2,392 *** 2,979 *** 1,688
2006 0.065 5,443 6,886 4,064 2,823 *** 2,983 *** 1,710
2007 0.036 5,494 6,844 4,144 2,700 *** 2,731 *** 1,668
Panel B: By Industry
Industry General
Ability Index Total Pay ($ 000)
Generalist Total Pay ($ 000)
Specialist Total Pay ($ 000)
Generalist Pay Premium
($ 000)
Generalist Excess Pay
($ 000) Observations Consumer Nondurables -0.047 4,431 5,913 3,171 2,743 *** 2,347 *** 1,504
Consumer Durables -0.017 3,716 4,115 3,323 792 ** 1,419 *** 668
Manufacturing 0.106 3,479 4,246 2,582 1,665 *** 1,673 *** 2,893
Oil, Gas, and Coal -0.036 5,185 6,692 3,799 2,893 *** 3,255 *** 910
Chemicals 0.223 4,227 4,826 3,256 1,570 *** 2,102 *** 752
Business Equipment 0.047 4,769 5,731 3,756 1,975 *** 2,814 *** 3,681
Telephone and Television 0.472 8,963 11,665 4,409 7,256 *** 7,692 *** 494
Utilities 0.362 2,789 3,452 1,538 1,914 *** 1,350 *** 1,233
Wholesale and Retail -0.167 3,804 5,115 2,834 2,281 *** 2,274 *** 2,581
Healthcare and Drugs 0.003 4,677 5,796 3,408 2,388 *** 2,726 *** 1,657
Finance -0.228 5,918 8,322 4,299 4,023 *** 3,994 *** 3,064
Other -0.036 4,357 5,364 3,448 1,916 *** 2,531 *** 2,472
Total 0.000 4,519 5,679 3,377 2,302 2,663 21,909

40
Table 3 Summary statistics
This table presents the mean, median, standard deviation, minimum, maximum and number of observations for each variable. The sample consists of Execucomp firms for which CEO profile data are available from BoardEx in the 1993-2007 period. All variables are winsorized at the 1th and 99th percentile values. Variable definitions are provided in Table A1 in the Appendix.
Variable Mean Median Standard Deviation Minimum Maximum Observations
Panel A: CEO Pay
Total Pay ($ 000) 4,519 2,384 5,997 198 36,332 21,909
Cash Pay ($ 000) 1,301 939 1,214 35 7,625 21,909
Equity Pay ($ 000) 2,525 852 4,672 0 29,704 18,813
Generalist Excess Pay ($ 000) 2,099 204 5,689 -4,041 32,598 21,895
Panel B: CEO Characteristics General Ability Index 0.000 -0.182 1.000 -1.504 7.230 21,909
Number of Positions 5.750 5.000 3.231 0.000 31.000 21,909
Number of Firms 1.775 1.000 1.902 0.000 18.000 21,909
Number of Industries 1.517 1.000 1.583 0.000 14.000 21,909
CEO Experience Dummy 0.354 0.000 0.478 0.000 1.000 21,909
Conglomerate Experience Dummy 0.739 1.000 0.439 0.000 1.000 21,909
CEO Age 55.548 56.000 7.400 29.000 92.000 20,841
CEO Tenure 7.969 6.000 7.089 1.000 57.000 20,371
External Hire Dummy 0.401 0.000 0.490 0.000 1.000 21,909
MBA Dummy 0.302 0.000 0.459 0.000 1.000 21,909
CEO-Chair Dummy 0.622 1.000 0.485 0.000 1.000 21,909
First Year as CEO Dummy 0.073 0.000 0.260 0.000 1.000 21,909
Ivy League Dummy 0.208 0.000 0.406 0.000 1.000 21,909
Recession Graduate Dummy 0.296 0.000 0.457 0.000 1.000 21,909
Fast Track Career 48.323 49.000 8.315 23.000 90.000 20,043
Panel C: Firm Characteristics Sales ($ milions) 4,415 1,294 8,772 27 56,877 21,875
Tobin’s Q 1.996 1.515 1.386 0.801 8.894 21,826
ROA 0.089 0.087 0.094 -0.298 0.361 21,408
Volatility 0.377 0.317 0.223 0.101 1.294 21,677
Stock Return 0.152 0.097 0.472 -0.775 2.208 19,414
Firm Age 23.043 18.000 19.029 0.000 82.000 21,728
Diversification Dummy 0.571 1.000 0.495 0.000 1.000 19,221
Leverage 0.230 0.217 0.182 0.000 0.828 21,793
Cash 0.132 0.059 0.167 0.001 0.751 21,871
R&D 0.027 0.000 0.052 0.000 0.271 21,878
CAPEX 0.056 0.043 0.053 0.000 0.286 20,797
ROE 0.103 0.124 0.317 -1.537 1.577 21,869
Net Profit Margin 0.041 0.058 0.198 -1.320 0.410 21,864
Board Independence 0.668 0.700 0.172 0.000 1.000 15,147
Institutional Ownership Herfindahl 0.060 0.047 0.063 0.000 1.000 21,541
GIM Governance Index 9.298 9.000 2.650 1.000 18.000 17,275
Industry Sales Herfindahl 0.073 0.050 0.074 0.008 0.939 21,541
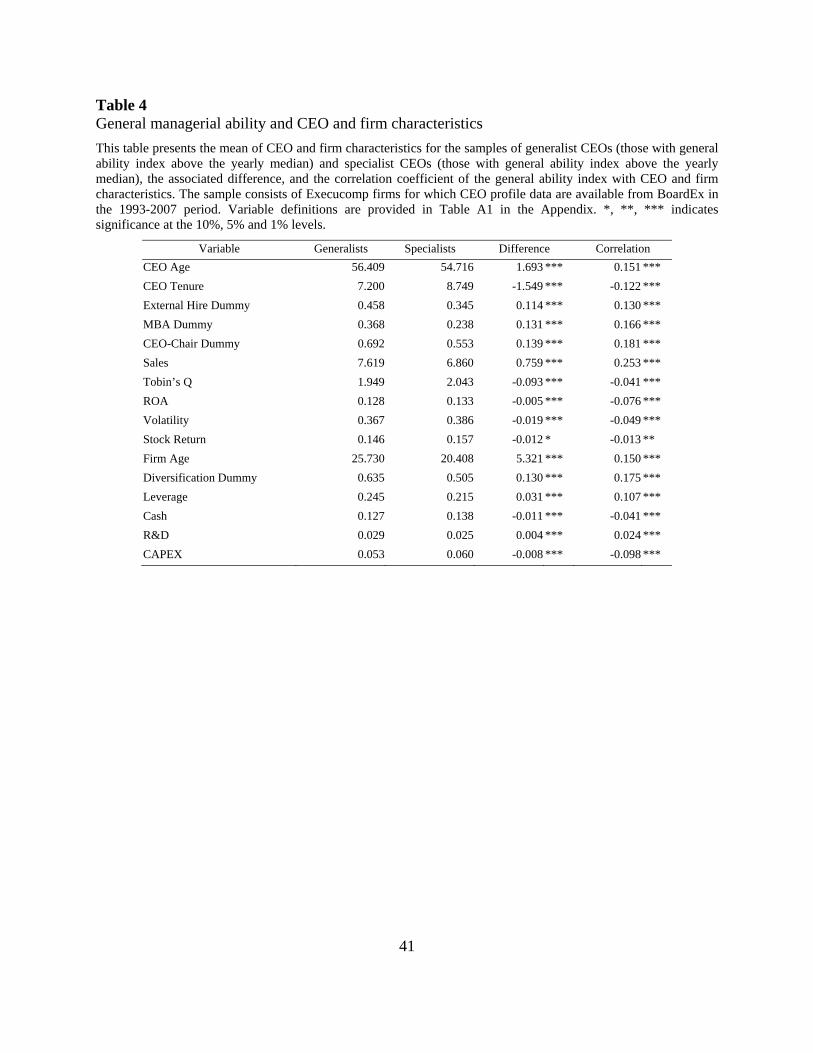
41
Table 4 General managerial ability and CEO and firm characteristics
This table presents the mean of CEO and firm characteristics for the samples of generalist CEOs (those with general ability index above the yearly median) and specialist CEOs (those with general ability index above the yearly median), the associated difference, and the correlation coefficient of the general ability index with CEO and firm characteristics. The sample consists of Execucomp firms for which CEO profile data are available from BoardEx in the 1993-2007 period. Variable definitions are provided in Table A1 in the Appendix. *, **, *** indicates significance at the 10%, 5% and 1% levels.
Variable Generalists Specialists Difference Correlation
CEO Age 56.409 54.716 1.693 *** 0.151 ***
CEO Tenure 7.200 8.749 -1.549 *** -0.122 ***
External Hire Dummy 0.458 0.345 0.114 *** 0.130 ***
MBA Dummy 0.368 0.238 0.131 *** 0.166 ***
CEO-Chair Dummy 0.692 0.553 0.139 *** 0.181 ***
Sales 7.619 6.860 0.759 *** 0.253 ***
Tobin’s Q 1.949 2.043 -0.093 *** -0.041 ***
ROA 0.128 0.133 -0.005 *** -0.076 ***
Volatility 0.367 0.386 -0.019 *** -0.049 ***
Stock Return 0.146 0.157 -0.012 * -0.013 **
Firm Age 25.730 20.408 5.321 *** 0.150 ***
Diversification Dummy 0.635 0.505 0.130 *** 0.175 ***
Leverage 0.245 0.215 0.031 *** 0.107 ***
Cash 0.127 0.138 -0.011 *** -0.041 ***
R&D 0.029 0.025 0.004 *** 0.024 ***
CAPEX 0.053 0.060 -0.008 *** -0.098 ***
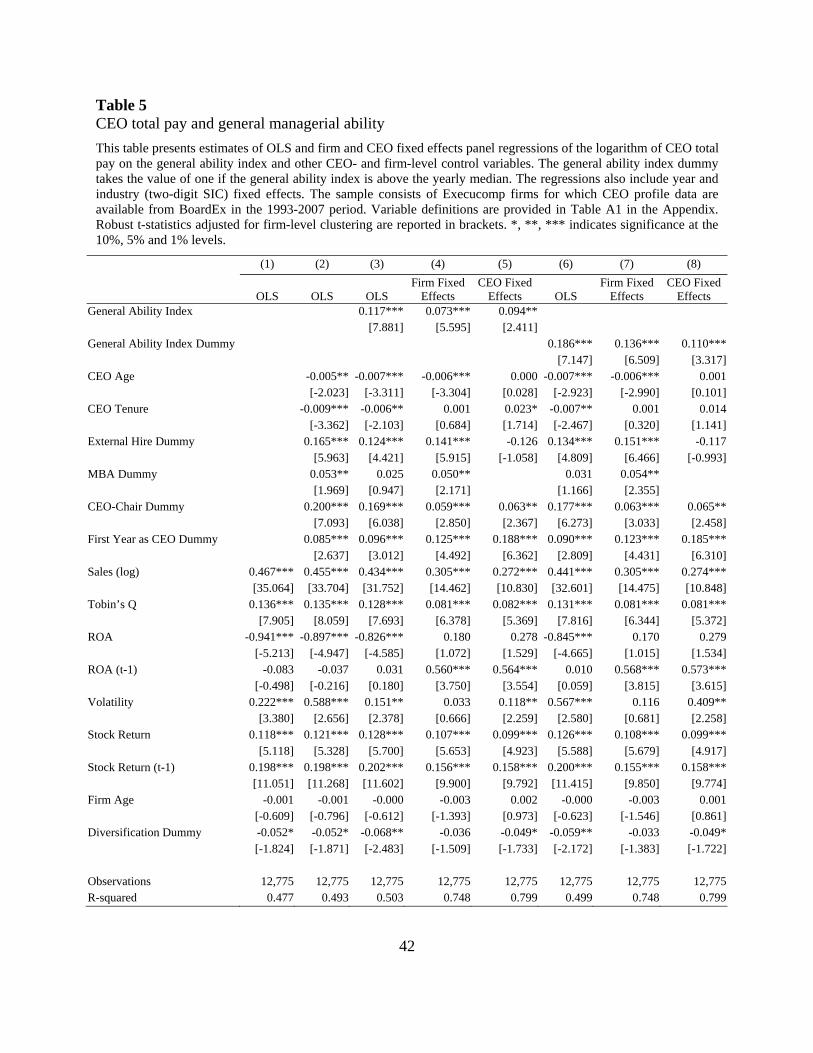
42
Table 5 CEO total pay and general managerial ability
This table presents estimates of OLS and firm and CEO fixed effects panel regressions of the logarithm of CEO total pay on the general ability index and other CEO- and firm-level control variables. The general ability index dummy takes the value of one if the general ability index is above the yearly median. The regressions also include year and industry (two-digit SIC) fixed effects. The sample consists of Execucomp firms for which CEO profile data are available from BoardEx in the 1993-2007 period. Variable definitions are provided in Table A1 in the Appendix. Robust t-statistics adjusted for firm-level clustering are reported in brackets. *, **, *** indicates significance at the 10%, 5% and 1% levels.
(1) (2) (3) (4) (5) (6) (7) (8)
OLS OLS OLS Firm Fixed
Effects CEO Fixed
Effects OLS Firm Fixed
Effects CEO Fixed
Effects General Ability Index 0.117*** 0.073*** 0.094**
[7.881] [5.595] [2.411]General Ability Index Dummy 0.186*** 0.136*** 0.110***
[7.147] [6.509] [3.317]CEO Age -0.005** -0.007*** -0.006*** 0.000 -0.007*** -0.006*** 0.001
[-2.023] [-3.311] [-3.304] [0.028] [-2.923] [-2.990] [0.101]CEO Tenure -0.009*** -0.006** 0.001 0.023* -0.007** 0.001 0.014
[-3.362] [-2.103] [0.684] [1.714] [-2.467] [0.320] [1.141]External Hire Dummy 0.165*** 0.124*** 0.141*** -0.126 0.134*** 0.151*** -0.117
[5.963] [4.421] [5.915] [-1.058] [4.809] [6.466] [-0.993]MBA Dummy 0.053** 0.025 0.050** 0.031 0.054**
[1.969] [0.947] [2.171] [1.166] [2.355]CEO-Chair Dummy 0.200*** 0.169*** 0.059*** 0.063** 0.177*** 0.063*** 0.065**
[7.093] [6.038] [2.850] [2.367] [6.273] [3.033] [2.458]First Year as CEO Dummy 0.085*** 0.096*** 0.125*** 0.188*** 0.090*** 0.123*** 0.185***
[2.637] [3.012] [4.492] [6.362] [2.809] [4.431] [6.310]Sales (log) 0.467*** 0.455*** 0.434*** 0.305*** 0.272*** 0.441*** 0.305*** 0.274***
[35.064] [33.704] [31.752] [14.462] [10.830] [32.601] [14.475] [10.848]Tobin’s Q 0.136*** 0.135*** 0.128*** 0.081*** 0.082*** 0.131*** 0.081*** 0.081***
[7.905] [8.059] [7.693] [6.378] [5.369] [7.816] [6.344] [5.372]ROA -0.941*** -0.897*** -0.826*** 0.180 0.278 -0.845*** 0.170 0.279
[-5.213] [-4.947] [-4.585] [1.072] [1.529] [-4.665] [1.015] [1.534]ROA (t-1) -0.083 -0.037 0.031 0.560*** 0.564*** 0.010 0.568*** 0.573***
[-0.498] [-0.216] [0.180] [3.750] [3.554] [0.059] [3.815] [3.615]Volatility 0.222*** 0.588*** 0.151** 0.033 0.118** 0.567*** 0.116 0.409**
[3.380] [2.656] [2.378] [0.666] [2.259] [2.580] [0.681] [2.258]Stock Return 0.118*** 0.121*** 0.128*** 0.107*** 0.099*** 0.126*** 0.108*** 0.099***
[5.118] [5.328] [5.700] [5.653] [4.923] [5.588] [5.679] [4.917]Stock Return (t-1) 0.198*** 0.198*** 0.202*** 0.156*** 0.158*** 0.200*** 0.155*** 0.158***
[11.051] [11.268] [11.602] [9.900] [9.792] [11.415] [9.850] [9.774]Firm Age -0.001 -0.001 -0.000 -0.003 0.002 -0.000 -0.003 0.001
[-0.609] [-0.796] [-0.612] [-1.393] [0.973] [-0.623] [-1.546] [0.861]Diversification Dummy -0.052* -0.052* -0.068** -0.036 -0.049* -0.059** -0.033 -0.049*
[-1.824] [-1.871] [-2.483] [-1.509] [-1.733] [-2.172] [-1.383] [-1.722]
Observations 12,775 12,775 12,775 12,775 12,775 12,775 12,775 12,775R-squared 0.477 0.493 0.503 0.748 0.799 0.499 0.748 0.799
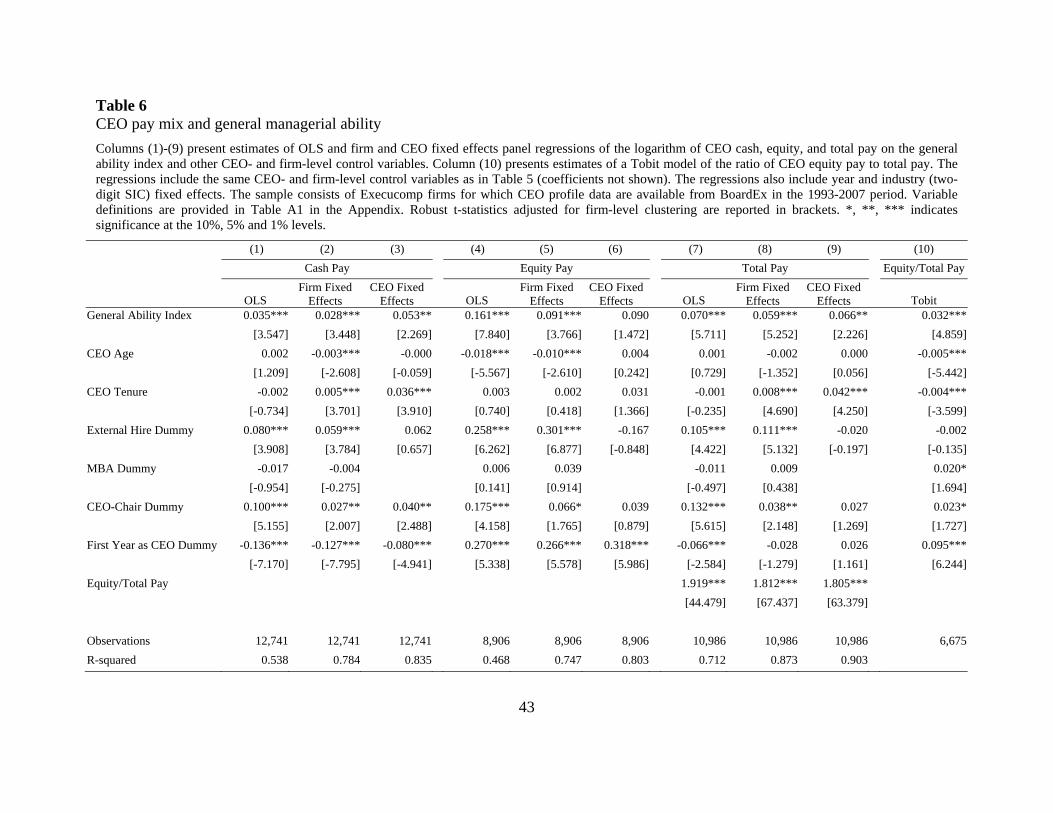
43
Table 6 CEO pay mix and general managerial ability
Columns (1)-(9) present estimates of OLS and firm and CEO fixed effects panel regressions of the logarithm of CEO cash, equity, and total pay on the general ability index and other CEO- and firm-level control variables. Column (10) presents estimates of a Tobit model of the ratio of CEO equity pay to total pay. The regressions include the same CEO- and firm-level control variables as in Table 5 (coefficients not shown). The regressions also include year and industry (two-digit SIC) fixed effects. The sample consists of Execucomp firms for which CEO profile data are available from BoardEx in the 1993-2007 period. Variable definitions are provided in Table A1 in the Appendix. Robust t-statistics adjusted for firm-level clustering are reported in brackets. *, **, *** indicates significance at the 10%, 5% and 1% levels.
(1) (2) (3) (4) (5) (6) (7) (8) (9) (10)
Cash Pay Equity Pay Total Pay Equity/Total Pay
OLS Firm Fixed
EffectsCEO Fixed
Effects OLS Firm Fixed
EffectsCEO Fixed
Effects OLS Firm Fixed
EffectsCEO Fixed
Effects Tobit General Ability Index 0.035*** 0.028*** 0.053** 0.161*** 0.091*** 0.090 0.070*** 0.059*** 0.066** 0.032***
[3.547] [3.448] [2.269] [7.840] [3.766] [1.472] [5.711] [5.252] [2.226] [4.859]
CEO Age 0.002 -0.003*** -0.000 -0.018*** -0.010*** 0.004 0.001 -0.002 0.000 -0.005***
[1.209] [-2.608] [-0.059] [-5.567] [-2.610] [0.242] [0.729] [-1.352] [0.056] [-5.442]
CEO Tenure -0.002 0.005*** 0.036*** 0.003 0.002 0.031 -0.001 0.008*** 0.042*** -0.004***
[-0.734] [3.701] [3.910] [0.740] [0.418] [1.366] [-0.235] [4.690] [4.250] [-3.599]
External Hire Dummy 0.080*** 0.059*** 0.062 0.258*** 0.301*** -0.167 0.105*** 0.111*** -0.020 -0.002
[3.908] [3.784] [0.657] [6.262] [6.877] [-0.848] [4.422] [5.132] [-0.197] [-0.135]
MBA Dummy -0.017 -0.004 0.006 0.039 -0.011 0.009 0.020*
[-0.954] [-0.275] [0.141] [0.914] [-0.497] [0.438] [1.694]
CEO-Chair Dummy 0.100*** 0.027** 0.040** 0.175*** 0.066* 0.039 0.132*** 0.038** 0.027 0.023*
[5.155] [2.007] [2.488] [4.158] [1.765] [0.879] [5.615] [2.148] [1.269] [1.727]
First Year as CEO Dummy -0.136*** -0.127*** -0.080*** 0.270*** 0.266*** 0.318*** -0.066*** -0.028 0.026 0.095***
[-7.170] [-7.795] [-4.941] [5.338] [5.578] [5.986] [-2.584] [-1.279] [1.161] [6.244]
Equity/Total Pay 1.919*** 1.812*** 1.805***
[44.479] [67.437] [63.379]
Observations 12,741 12,741 12,741 8,906 8,906 8,906 10,986 10,986 10,986 6,675
R-squared 0.538 0.784 0.835 0.468 0.747 0.803 0.712 0.873 0.903
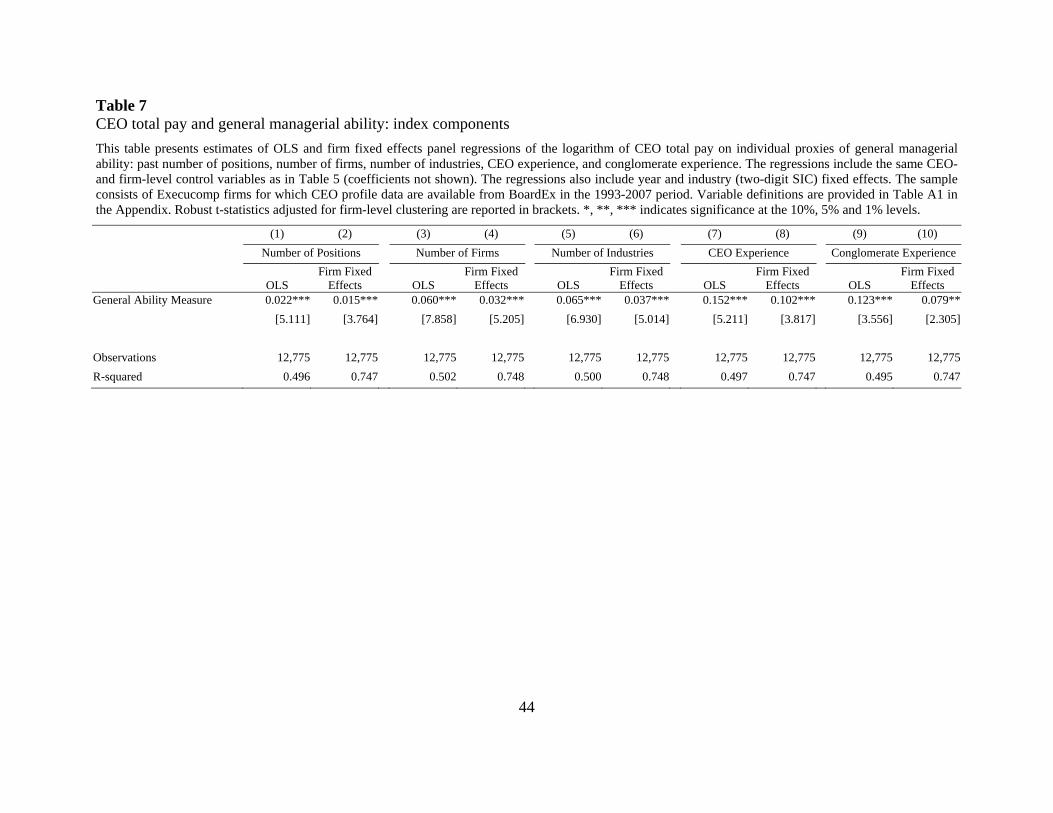
44
Table 7 CEO total pay and general managerial ability: index components
This table presents estimates of OLS and firm fixed effects panel regressions of the logarithm of CEO total pay on individual proxies of general managerial ability: past number of positions, number of firms, number of industries, CEO experience, and conglomerate experience. The regressions include the same CEO- and firm-level control variables as in Table 5 (coefficients not shown). The regressions also include year and industry (two-digit SIC) fixed effects. The sample consists of Execucomp firms for which CEO profile data are available from BoardEx in the 1993-2007 period. Variable definitions are provided in Table A1 in the Appendix. Robust t-statistics adjusted for firm-level clustering are reported in brackets. *, **, *** indicates significance at the 10%, 5% and 1% levels.
(1) (2) (3) (4) (5) (6) (7) (8) (9) (10)
Number of Positions Number of Firms Number of Industries CEO Experience Conglomerate Experience
OLS Firm Fixed
Effects OLS Firm Fixed
Effects OLS Firm Fixed
Effects OLS Firm Fixed
Effects OLS Firm Fixed
Effects General Ability Measure 0.022*** 0.015*** 0.060*** 0.032*** 0.065*** 0.037*** 0.152*** 0.102*** 0.123*** 0.079**
[5.111] [3.764] [7.858] [5.205] [6.930] [5.014] [5.211] [3.817] [3.556] [2.305]
Observations 12,775 12,775 12,775 12,775 12,775 12,775 12,775 12,775 12,775 12,775
R-squared 0.496 0.747 0.502 0.748 0.500 0.748 0.497 0.747 0.495 0.747
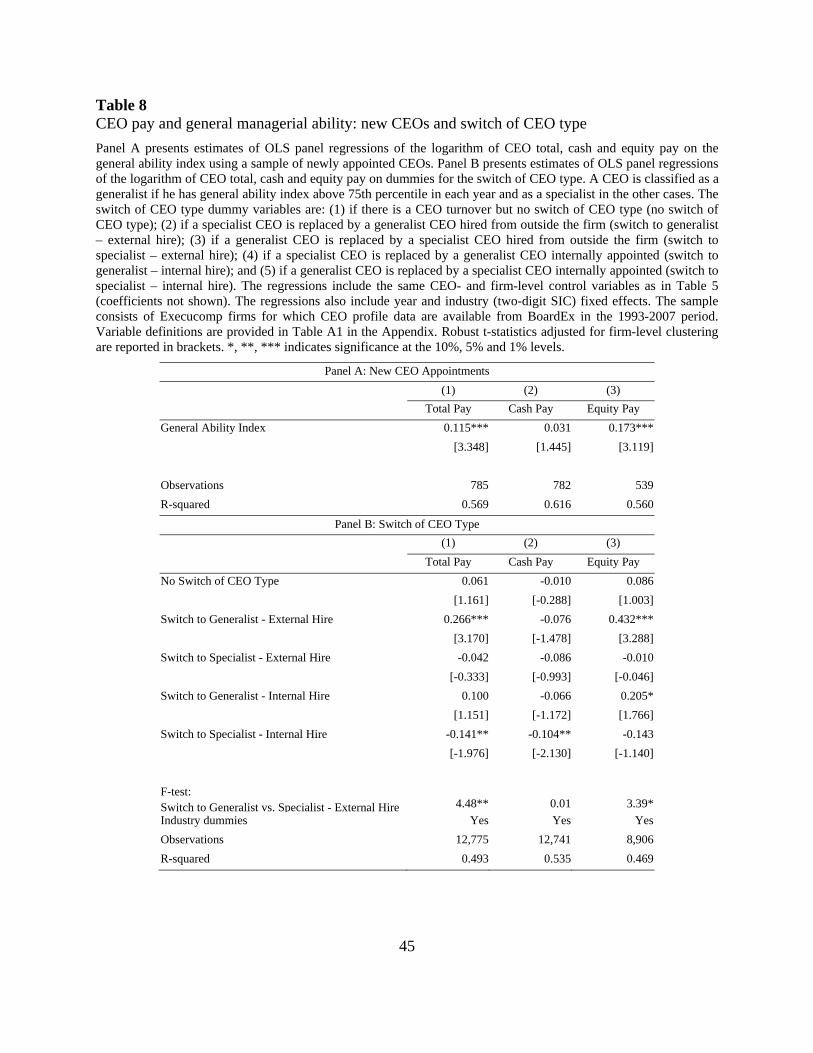
45
Table 8 CEO pay and general managerial ability: new CEOs and switch of CEO type
Panel A presents estimates of OLS panel regressions of the logarithm of CEO total, cash and equity pay on the general ability index using a sample of newly appointed CEOs. Panel B presents estimates of OLS panel regressions of the logarithm of CEO total, cash and equity pay on dummies for the switch of CEO type. A CEO is classified as a generalist if he has general ability index above 75th percentile in each year and as a specialist in the other cases. The switch of CEO type dummy variables are: (1) if there is a CEO turnover but no switch of CEO type (no switch of CEO type); (2) if a specialist CEO is replaced by a generalist CEO hired from outside the firm (switch to generalist – external hire); (3) if a generalist CEO is replaced by a specialist CEO hired from outside the firm (switch to specialist – external hire); (4) if a specialist CEO is replaced by a generalist CEO internally appointed (switch to generalist – internal hire); and (5) if a generalist CEO is replaced by a specialist CEO internally appointed (switch to specialist – internal hire). The regressions include the same CEO- and firm-level control variables as in Table 5 (coefficients not shown). The regressions also include year and industry (two-digit SIC) fixed effects. The sample consists of Execucomp firms for which CEO profile data are available from BoardEx in the 1993-2007 period. Variable definitions are provided in Table A1 in the Appendix. Robust t-statistics adjusted for firm-level clustering are reported in brackets. *, **, *** indicates significance at the 10%, 5% and 1% levels.
Panel A: New CEO Appointments
(1) (2) (3)
Total Pay Cash Pay Equity Pay
General Ability Index 0.115*** 0.031 0.173***
[3.348] [1.445] [3.119]
Observations 785 782 539
R-squared 0.569 0.616 0.560
Panel B: Switch of CEO Type
(1) (2) (3)
Total Pay Cash Pay Equity Pay
No Switch of CEO Type 0.061 -0.010 0.086
[1.161] [-0.288] [1.003]
Switch to Generalist - External Hire 0.266*** -0.076 0.432***
[3.170] [-1.478] [3.288]
Switch to Specialist - External Hire -0.042 -0.086 -0.010
[-0.333] [-0.993] [-0.046]
Switch to Generalist - Internal Hire 0.100 -0.066 0.205*
[1.151] [-1.172] [1.766]
Switch to Specialist - Internal Hire -0.141** -0.104** -0.143
[-1.976] [-2.130] [-1.140]
F-test: Switch to Generalist vs. Specialist - External Hire 4.48** 0.01 3.39*
Industry dummies Yes Yes Yes
Observations 12,775 12,741 8,906
R-squared 0.493 0.535 0.469
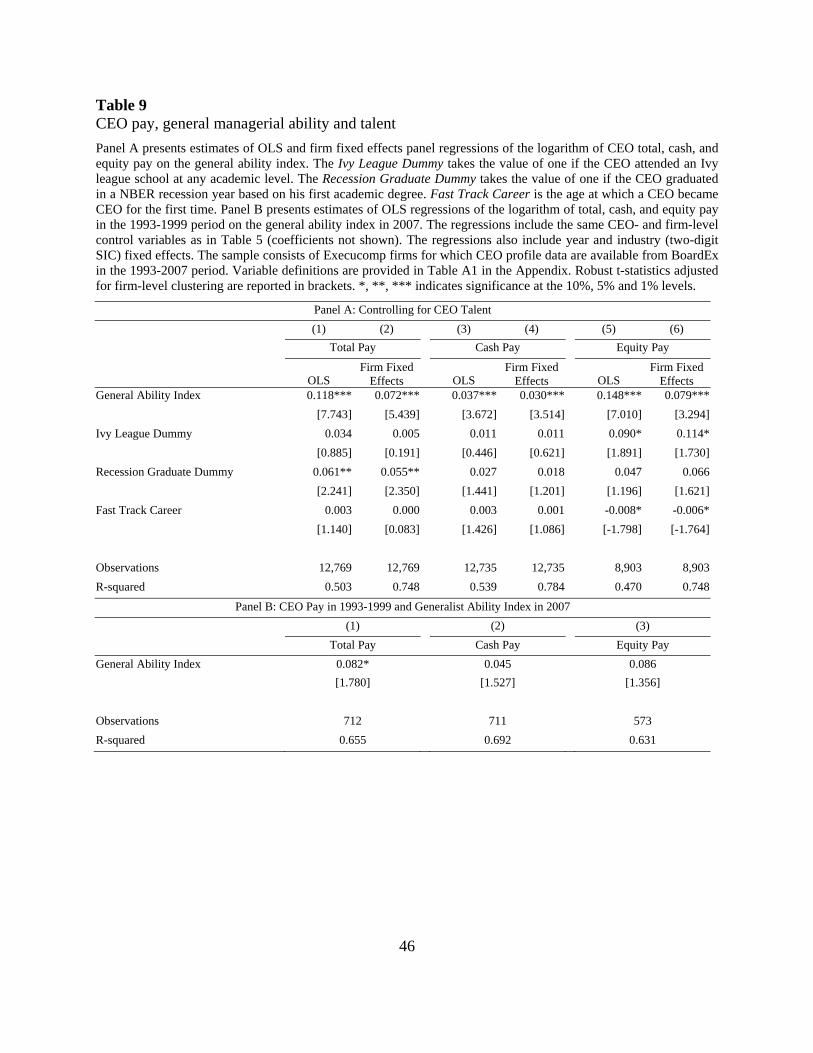
46
Table 9 CEO pay, general managerial ability and talent
Panel A presents estimates of OLS and firm fixed effects panel regressions of the logarithm of CEO total, cash, and equity pay on the general ability index. The Ivy League Dummy takes the value of one if the CEO attended an Ivy league school at any academic level. The Recession Graduate Dummy takes the value of one if the CEO graduated in a NBER recession year based on his first academic degree. Fast Track Career is the age at which a CEO became CEO for the first time. Panel B presents estimates of OLS regressions of the logarithm of total, cash, and equity pay in the 1993-1999 period on the general ability index in 2007. The regressions include the same CEO- and firm-level control variables as in Table 5 (coefficients not shown). The regressions also include year and industry (two-digit SIC) fixed effects. The sample consists of Execucomp firms for which CEO profile data are available from BoardEx in the 1993-2007 period. Variable definitions are provided in Table A1 in the Appendix. Robust t-statistics adjusted for firm-level clustering are reported in brackets. *, **, *** indicates significance at the 10%, 5% and 1% levels.
Panel A: Controlling for CEO Talent
(1) (2) (3) (4) (5) (6)
Total Pay Cash Pay Equity Pay
OLS Firm Fixed
Effects OLS Firm Fixed
Effects OLS Firm Fixed
EffectsGeneral Ability Index 0.118*** 0.072*** 0.037*** 0.030*** 0.148*** 0.079***
[7.743] [5.439] [3.672] [3.514] [7.010] [3.294]
Ivy League Dummy 0.034 0.005 0.011 0.011 0.090* 0.114*
[0.885] [0.191] [0.446] [0.621] [1.891] [1.730]
Recession Graduate Dummy 0.061** 0.055** 0.027 0.018 0.047 0.066
[2.241] [2.350] [1.441] [1.201] [1.196] [1.621]
Fast Track Career 0.003 0.000 0.003 0.001 -0.008* -0.006*
[1.140] [0.083] [1.426] [1.086] [-1.798] [-1.764]
Observations 12,769 12,769 12,735 12,735 8,903 8,903
R-squared 0.503 0.748 0.539 0.784 0.470 0.748
Panel B: CEO Pay in 1993-1999 and Generalist Ability Index in 2007
(1) (2) (3)
Total Pay Cash Pay Equity Pay
General Ability Index 0.082* 0.045 0.086
[1.780] [1.527] [1.356]
Observations 712 711 573
R-squared 0.655 0.692 0.631
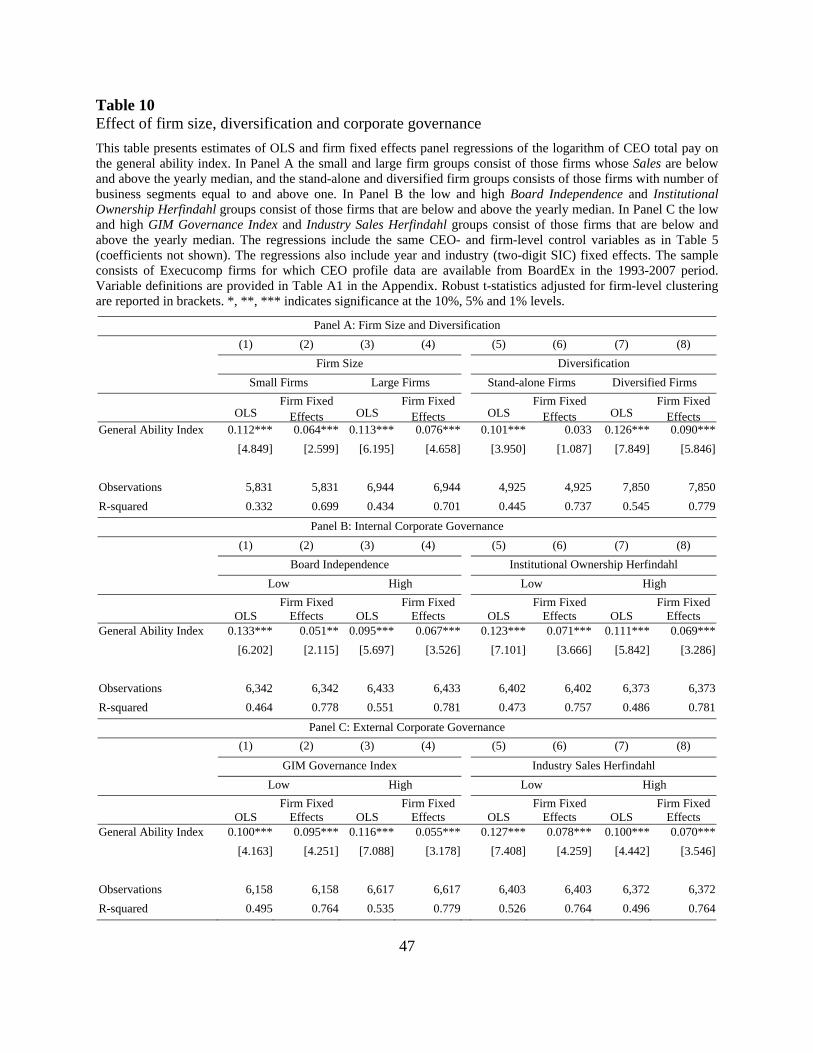
47
Table 10 Effect of firm size, diversification and corporate governance
This table presents estimates of OLS and firm fixed effects panel regressions of the logarithm of CEO total pay on the general ability index. In Panel A the small and large firm groups consist of those firms whose Sales are below and above the yearly median, and the stand-alone and diversified firm groups consists of those firms with number of business segments equal to and above one. In Panel B the low and high Board Independence and Institutional Ownership Herfindahl groups consist of those firms that are below and above the yearly median. In Panel C the low and high GIM Governance Index and Industry Sales Herfindahl groups consist of those firms that are below and above the yearly median. The regressions include the same CEO- and firm-level control variables as in Table 5 (coefficients not shown). The regressions also include year and industry (two-digit SIC) fixed effects. The sample consists of Execucomp firms for which CEO profile data are available from BoardEx in the 1993-2007 period. Variable definitions are provided in Table A1 in the Appendix. Robust t-statistics adjusted for firm-level clustering are reported in brackets. *, **, *** indicates significance at the 10%, 5% and 1% levels.
Panel A: Firm Size and Diversification
(1) (2) (3) (4) (5) (6) (7) (8)
Firm Size Diversification
Small Firms Large Firms Stand-alone Firms Diversified Firms
OLS Firm Fixed
Effects OLS Firm Fixed
Effects OLS Firm Fixed
Effects OLS Firm Fixed
EffectsGeneral Ability Index 0.112*** 0.064*** 0.113*** 0.076*** 0.101*** 0.033 0.126*** 0.090***
[4.849] [2.599] [6.195] [4.658] [3.950] [1.087] [7.849] [5.846]
Observations 5,831 5,831 6,944 6,944 4,925 4,925 7,850 7,850
R-squared 0.332 0.699 0.434 0.701 0.445 0.737 0.545 0.779
Panel B: Internal Corporate Governance
(1) (2) (3) (4) (5) (6) (7) (8)
Board Independence Institutional Ownership Herfindahl
Low High Low High
OLS Firm Fixed
Effects OLS Firm Fixed
Effects OLS Firm Fixed
Effects OLS Firm Fixed
Effects General Ability Index 0.133*** 0.051** 0.095*** 0.067*** 0.123*** 0.071*** 0.111*** 0.069***
[6.202] [2.115] [5.697] [3.526] [7.101] [3.666] [5.842] [3.286]
Observations 6,342 6,342 6,433 6,433 6,402 6,402 6,373 6,373
R-squared 0.464 0.778 0.551 0.781 0.473 0.757 0.486 0.781
Panel C: External Corporate Governance
(1) (2) (3) (4) (5) (6) (7) (8)
GIM Governance Index Industry Sales Herfindahl
Low High Low High
OLS Firm Fixed
Effects OLS Firm Fixed
Effects OLS Firm Fixed
Effects OLS Firm Fixed
Effects General Ability Index 0.100*** 0.095*** 0.116*** 0.055*** 0.127*** 0.078*** 0.100*** 0.070***
[4.163] [4.251] [7.088] [3.178] [7.408] [4.259] [4.442] [3.546]
Observations 6,158 6,158 6,617 6,617 6,403 6,403 6,372 6,372
R-squared 0.495 0.764 0.535 0.779 0.526 0.764 0.496 0.764
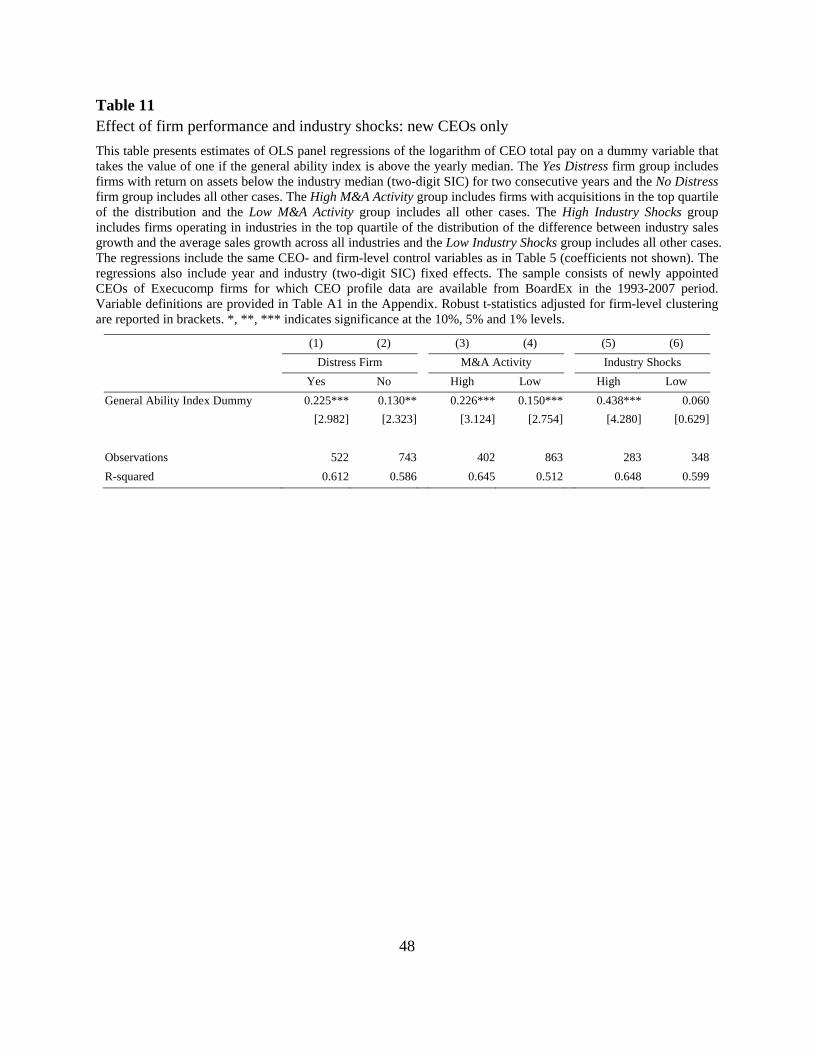
48
Table 11 Effect of firm performance and industry shocks: new CEOs only
This table presents estimates of OLS panel regressions of the logarithm of CEO total pay on a dummy variable that takes the value of one if the general ability index is above the yearly median. The Yes Distress firm group includes firms with return on assets below the industry median (two-digit SIC) for two consecutive years and the No Distress firm group includes all other cases. The High M&A Activity group includes firms with acquisitions in the top quartile of the distribution and the Low M&A Activity group includes all other cases. The High Industry Shocks group includes firms operating in industries in the top quartile of the distribution of the difference between industry sales growth and the average sales growth across all industries and the Low Industry Shocks group includes all other cases. The regressions include the same CEO- and firm-level control variables as in Table 5 (coefficients not shown). The regressions also include year and industry (two-digit SIC) fixed effects. The sample consists of newly appointed CEOs of Execucomp firms for which CEO profile data are available from BoardEx in the 1993-2007 period. Variable definitions are provided in Table A1 in the Appendix. Robust t-statistics adjusted for firm-level clustering are reported in brackets. *, **, *** indicates significance at the 10%, 5% and 1% levels.
(1) (2) (3) (4) (5) (6)
Distress Firm M&A Activity Industry Shocks
Yes No High Low High Low
General Ability Index Dummy 0.225*** 0.130** 0.226*** 0.150*** 0.438*** 0.060
[2.982] [2.323] [3.124] [2.754] [4.280] [0.629]
Observations 522 743 402 863 283 348
R-squared 0.612 0.586 0.645 0.512 0.648 0.599
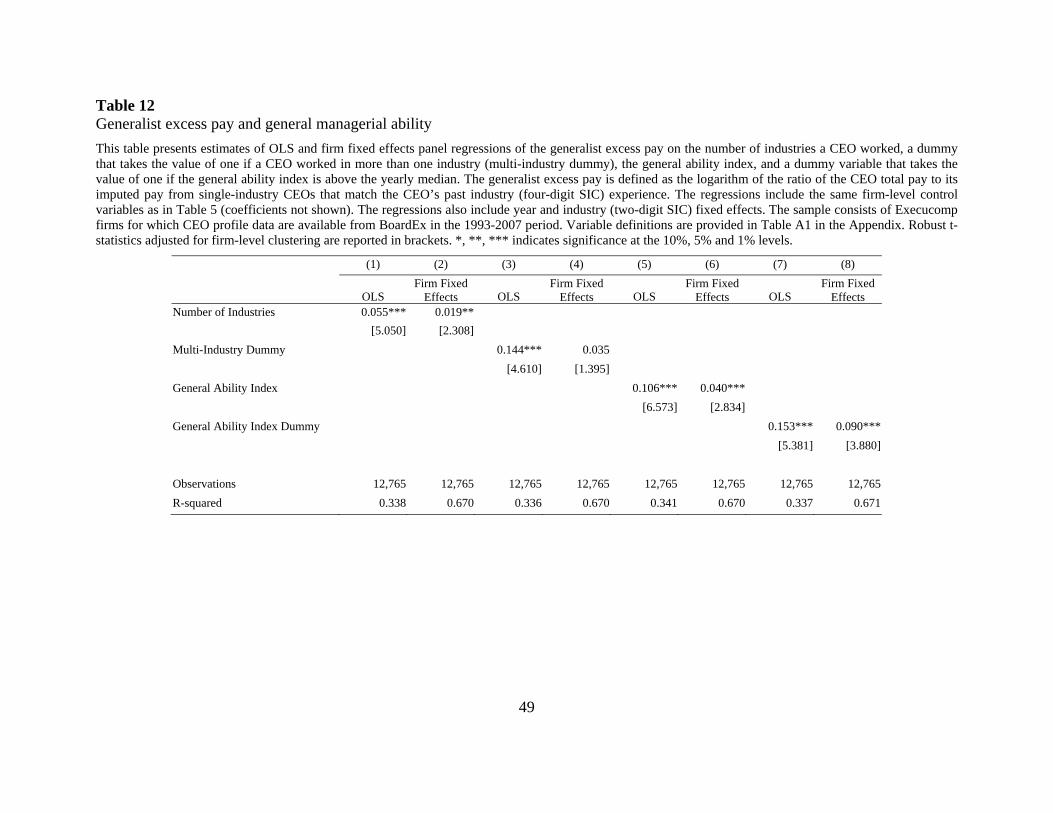
49
Table 12 Generalist excess pay and general managerial ability
This table presents estimates of OLS and firm fixed effects panel regressions of the generalist excess pay on the number of industries a CEO worked, a dummy that takes the value of one if a CEO worked in more than one industry (multi-industry dummy), the general ability index, and a dummy variable that takes the value of one if the general ability index is above the yearly median. The generalist excess pay is defined as the logarithm of the ratio of the CEO total pay to its imputed pay from single-industry CEOs that match the CEO’s past industry (four-digit SIC) experience. The regressions include the same firm-level control variables as in Table 5 (coefficients not shown). The regressions also include year and industry (two-digit SIC) fixed effects. The sample consists of Execucomp firms for which CEO profile data are available from BoardEx in the 1993-2007 period. Variable definitions are provided in Table A1 in the Appendix. Robust t-statistics adjusted for firm-level clustering are reported in brackets. *, **, *** indicates significance at the 10%, 5% and 1% levels.
(1) (2) (3) (4) (5) (6) (7) (8)
OLS Firm Fixed
Effects OLS Firm Fixed
Effects OLS Firm Fixed
Effects OLS Firm Fixed
EffectsNumber of Industries 0.055*** 0.019**
[5.050] [2.308]
Multi-Industry Dummy 0.144*** 0.035
[4.610] [1.395]
General Ability Index 0.106*** 0.040***
[6.573] [2.834]
General Ability Index Dummy 0.153*** 0.090***
[5.381] [3.880]
Observations 12,765 12,765 12,765 12,765 12,765 12,765 12,765 12,765
R-squared 0.338 0.670 0.336 0.670 0.341 0.670 0.337 0.671
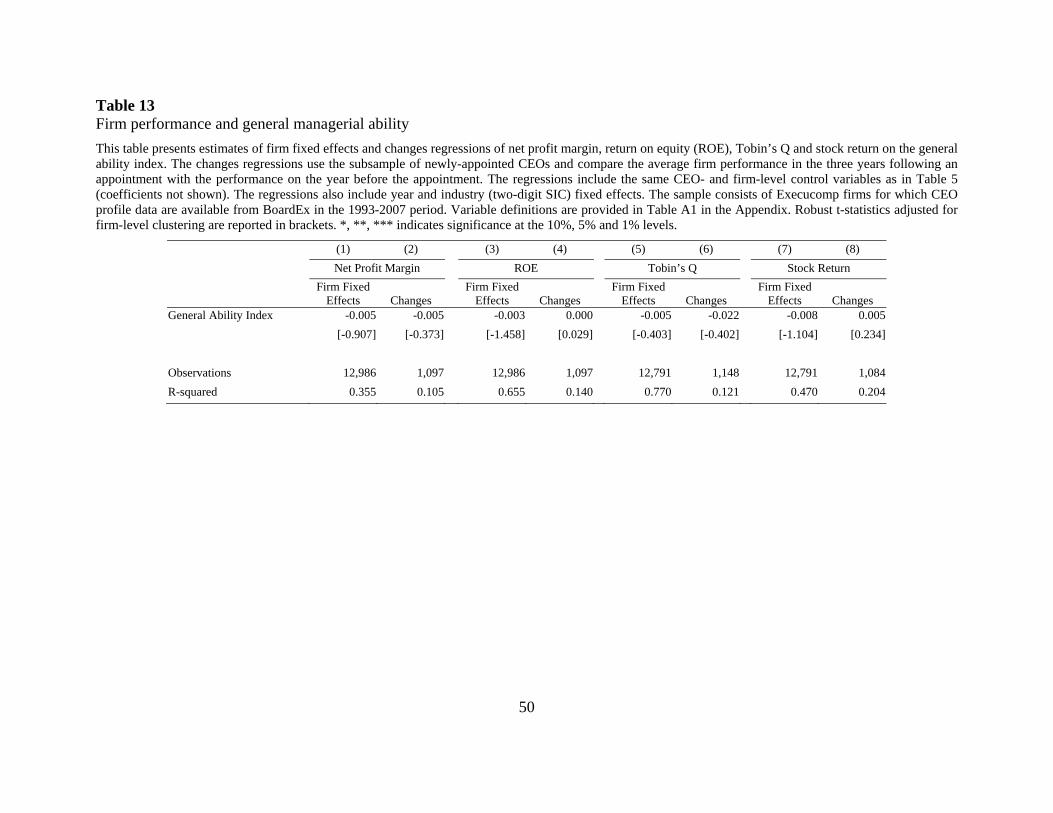
50
Table 13 Firm performance and general managerial ability
This table presents estimates of firm fixed effects and changes regressions of net profit margin, return on equity (ROE), Tobin’s Q and stock return on the general ability index. The changes regressions use the subsample of newly-appointed CEOs and compare the average firm performance in the three years following an appointment with the performance on the year before the appointment. The regressions include the same CEO- and firm-level control variables as in Table 5 (coefficients not shown). The regressions also include year and industry (two-digit SIC) fixed effects. The sample consists of Execucomp firms for which CEO profile data are available from BoardEx in the 1993-2007 period. Variable definitions are provided in Table A1 in the Appendix. Robust t-statistics adjusted for firm-level clustering are reported in brackets. *, **, *** indicates significance at the 10%, 5% and 1% levels.
(1) (2) (3) (4) (5) (6) (7) (8)
Net Profit Margin ROE Tobin’s Q Stock Return
Firm Fixed
Effects Changes Firm Fixed
Effects Changes Firm Fixed
Effects Changes Firm Fixed
Effects Changes General Ability Index -0.005 -0.005 -0.003 0.000 -0.005 -0.022 -0.008 0.005
[-0.907] [-0.373] [-1.458] [0.029] [-0.403] [-0.402] [-1.104] [0.234]
Observations 12,986 1,097 12,986 1,097 12,791 1,148 12,791 1,084
R-squared 0.355 0.105 0.655 0.140 0.770 0.121 0.470 0.204
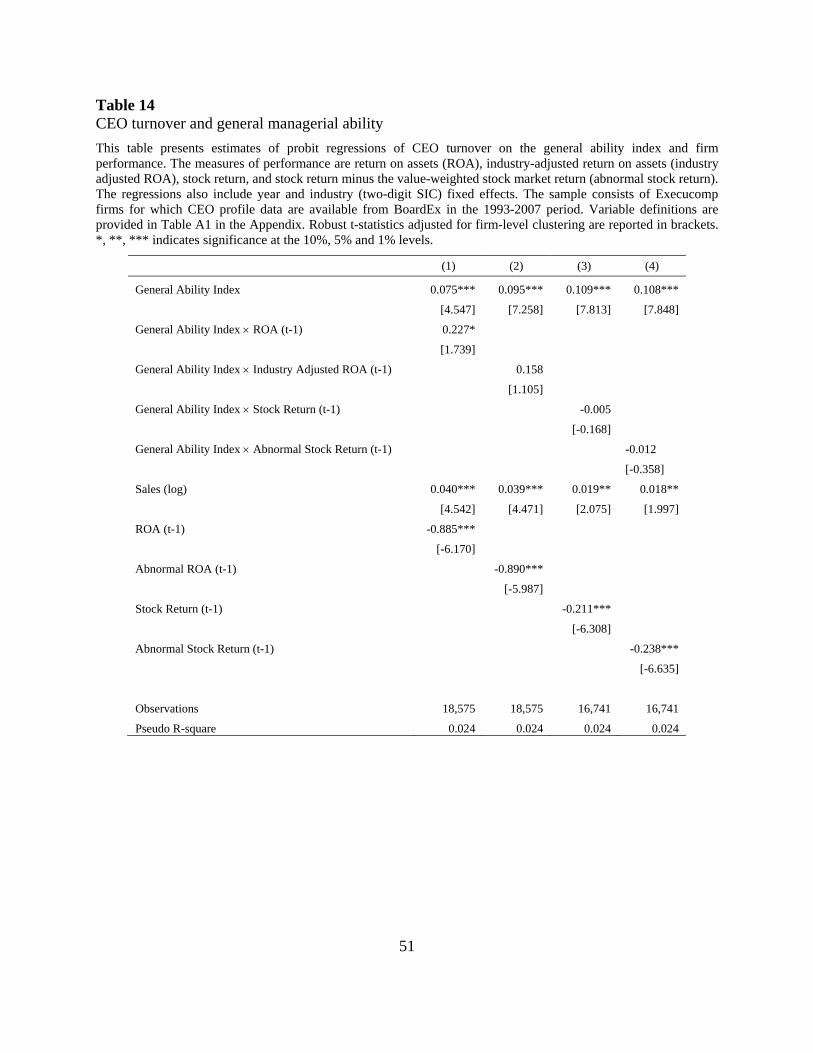
51
Table 14 CEO turnover and general managerial ability
This table presents estimates of probit regressions of CEO turnover on the general ability index and firm performance. The measures of performance are return on assets (ROA), industry-adjusted return on assets (industry adjusted ROA), stock return, and stock return minus the value-weighted stock market return (abnormal stock return). The regressions also include year and industry (two-digit SIC) fixed effects. The sample consists of Execucomp firms for which CEO profile data are available from BoardEx in the 1993-2007 period. Variable definitions are provided in Table A1 in the Appendix. Robust t-statistics adjusted for firm-level clustering are reported in brackets. *, **, *** indicates significance at the 10%, 5% and 1% levels.
(1) (2) (3) (4)
General Ability Index 0.075*** 0.095*** 0.109*** 0.108***
[4.547] [7.258] [7.813] [7.848]
General Ability Index ROA (t-1) 0.227*
[1.739]
General Ability Index Industry Adjusted ROA (t-1) 0.158
[1.105]
General Ability Index Stock Return (t-1) -0.005
[-0.168]
General Ability Index Abnormal Stock Return (t-1) -0.012
[-0.358]
Sales (log) 0.040*** 0.039*** 0.019** 0.018**
[4.542] [4.471] [2.075] [1.997]
ROA (t-1) -0.885***
[-6.170]
Abnormal ROA (t-1) -0.890***
[-5.987]
Stock Return (t-1) -0.211***
[-6.308]
Abnormal Stock Return (t-1) -0.238***
[-6.635]
Observations 18,575 18,575 16,741 16,741
Pseudo R-square 0.024 0.024 0.024 0.024
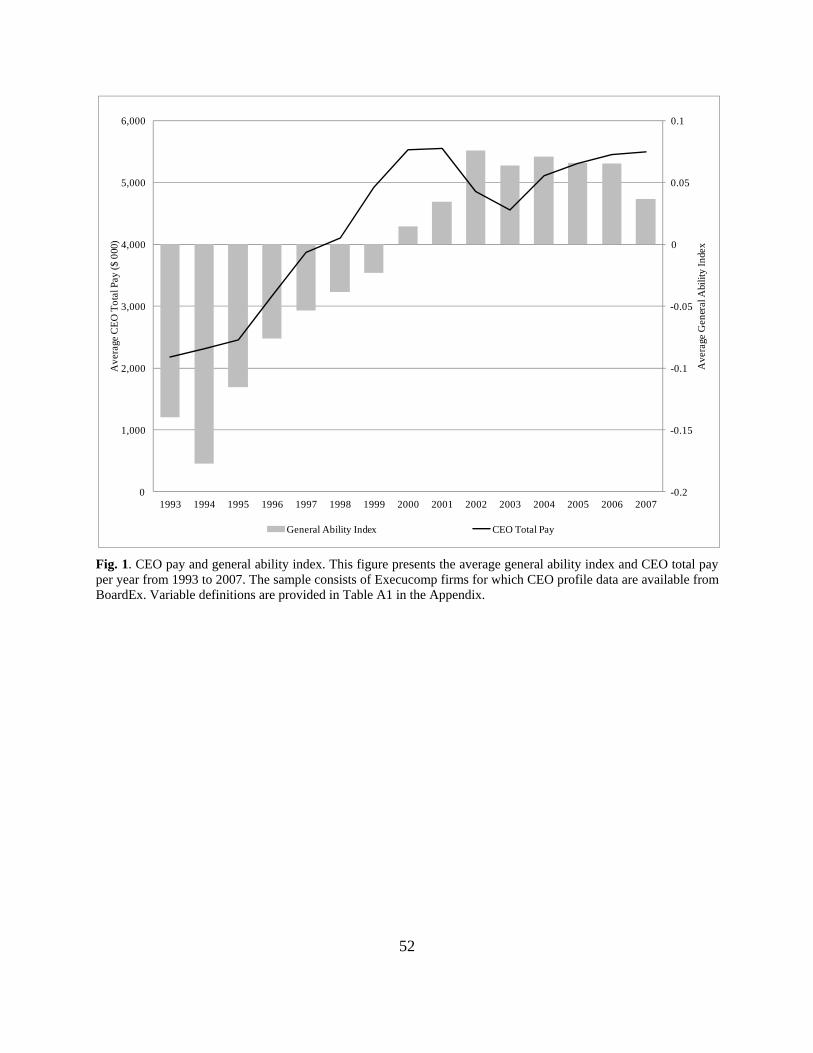
52
Fig. 1. CEO pay and general ability index. This figure presents the average general ability index and CEO total pay per year from 1993 to 2007. The sample consists of Execucomp firms for which CEO profile data are available from BoardEx. Variable definitions are provided in Table A1 in the Appendix.
-0.2
-0.15
-0.1
-0.05
0
0.05
0.1
0
1,000
2,000
3,000
4,000
5,000
6,000
1993 1994 1995 1996 1997 1998 1999 2000 2001 2002 2003 2004 2005 2006 2007
Ave
rage
Gen
eral
Abi
lity
Inde
x
Ave
rage
CE
O T
otal
Pay
($ 0
00)
General Ability Index CEO Total Pay
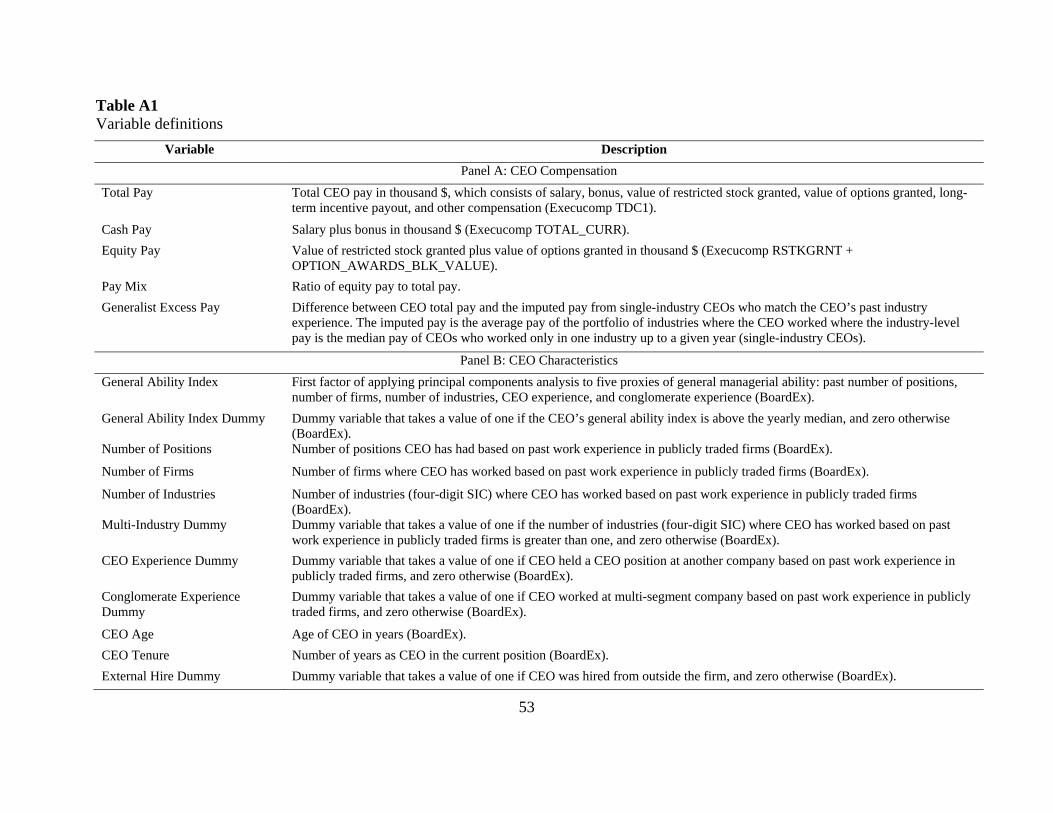
53
Table A1 Variable definitions
Variable Description
Panel A: CEO Compensation
Total Pay Total CEO pay in thousand $, which consists of salary, bonus, value of restricted stock granted, value of options granted, long-term incentive payout, and other compensation (Execucomp TDC1).
Cash Pay Salary plus bonus in thousand $ (Execucomp TOTAL_CURR).
Equity Pay Value of restricted stock granted plus value of options granted in thousand $ (Execucomp RSTKGRNT + OPTION_AWARDS_BLK_VALUE).
Pay Mix Ratio of equity pay to total pay.
Generalist Excess Pay Difference between CEO total pay and the imputed pay from single-industry CEOs who match the CEO’s past industry experience. The imputed pay is the average pay of the portfolio of industries where the CEO worked where the industry-level pay is the median pay of CEOs who worked only in one industry up to a given year (single-industry CEOs).
Panel B: CEO Characteristics
General Ability Index First factor of applying principal components analysis to five proxies of general managerial ability: past number of positions, number of firms, number of industries, CEO experience, and conglomerate experience (BoardEx).
General Ability Index Dummy Dummy variable that takes a value of one if the CEO’s general ability index is above the yearly median, and zero otherwise (BoardEx).
Number of Positions Number of positions CEO has had based on past work experience in publicly traded firms (BoardEx).
Number of Firms Number of firms where CEO has worked based on past work experience in publicly traded firms (BoardEx).
Number of Industries Number of industries (four-digit SIC) where CEO has worked based on past work experience in publicly traded firms (BoardEx).
Multi-Industry Dummy Dummy variable that takes a value of one if the number of industries (four-digit SIC) where CEO has worked based on past work experience in publicly traded firms is greater than one, and zero otherwise (BoardEx).
CEO Experience Dummy Dummy variable that takes a value of one if CEO held a CEO position at another company based on past work experience in publicly traded firms, and zero otherwise (BoardEx).
Conglomerate Experience Dummy
Dummy variable that takes a value of one if CEO worked at multi-segment company based on past work experience in publicly traded firms, and zero otherwise (BoardEx).
CEO Age Age of CEO in years (BoardEx).
CEO Tenure Number of years as CEO in the current position (BoardEx).
External Hire Dummy Dummy variable that takes a value of one if CEO was hired from outside the firm, and zero otherwise (BoardEx).
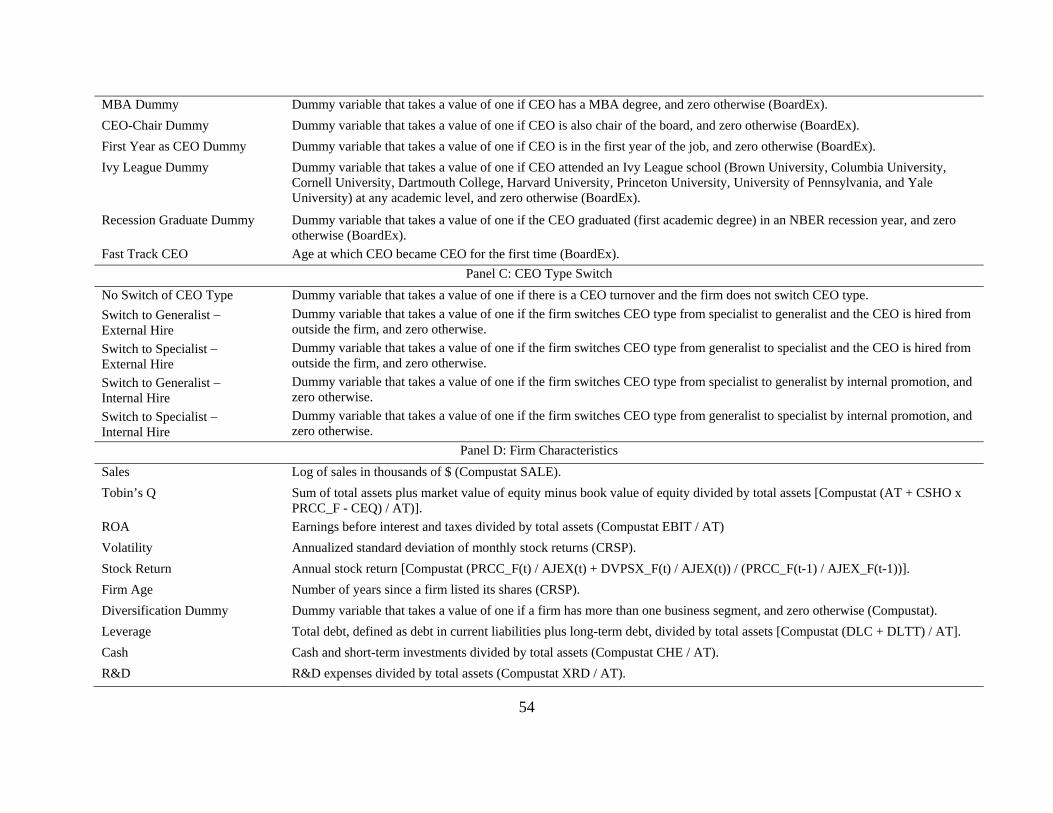
54
MBA Dummy Dummy variable that takes a value of one if CEO has a MBA degree, and zero otherwise (BoardEx).
CEO-Chair Dummy Dummy variable that takes a value of one if CEO is also chair of the board, and zero otherwise (BoardEx).
First Year as CEO Dummy Dummy variable that takes a value of one if CEO is in the first year of the job, and zero otherwise (BoardEx).
Ivy League Dummy Dummy variable that takes a value of one if CEO attended an Ivy League school (Brown University, Columbia University, Cornell University, Dartmouth College, Harvard University, Princeton University, University of Pennsylvania, and Yale University) at any academic level, and zero otherwise (BoardEx).
Recession Graduate Dummy Dummy variable that takes a value of one if the CEO graduated (first academic degree) in an NBER recession year, and zero otherwise (BoardEx).
Fast Track CEO Age at which CEO became CEO for the first time (BoardEx).
Panel C: CEO Type Switch
No Switch of CEO Type Dummy variable that takes a value of one if there is a CEO turnover and the firm does not switch CEO type.
Switch to Generalist External Hire
Dummy variable that takes a value of one if the firm switches CEO type from specialist to generalist and the CEO is hired from outside the firm, and zero otherwise.
Switch to Specialist External Hire
Dummy variable that takes a value of one if the firm switches CEO type from generalist to specialist and the CEO is hired from outside the firm, and zero otherwise.
Switch to Generalist Internal Hire
Dummy variable that takes a value of one if the firm switches CEO type from specialist to generalist by internal promotion, and zero otherwise.
Switch to Specialist Internal Hire
Dummy variable that takes a value of one if the firm switches CEO type from generalist to specialist by internal promotion, and zero otherwise.
Panel D: Firm Characteristics
Sales Log of sales in thousands of $ (Compustat SALE).
Tobin’s Q Sum of total assets plus market value of equity minus book value of equity divided by total assets [Compustat (AT + CSHO x PRCC_F - CEQ) / AT)].
ROA Earnings before interest and taxes divided by total assets (Compustat EBIT / AT)
Volatility Annualized standard deviation of monthly stock returns (CRSP).
Stock Return Annual stock return [Compustat (PRCC_F(t) / AJEX(t) + DVPSX_F(t) / AJEX(t)) / (PRCC_F(t-1) / AJEX_F(t-1))].
Firm Age Number of years since a firm listed its shares (CRSP).
Diversification Dummy Dummy variable that takes a value of one if a firm has more than one business segment, and zero otherwise (Compustat).
Leverage Total debt, defined as debt in current liabilities plus long-term debt, divided by total assets [Compustat (DLC + DLTT) / AT].
Cash Cash and short-term investments divided by total assets (Compustat CHE / AT).
R&D R&D expenses divided by total assets (Compustat XRD / AT).
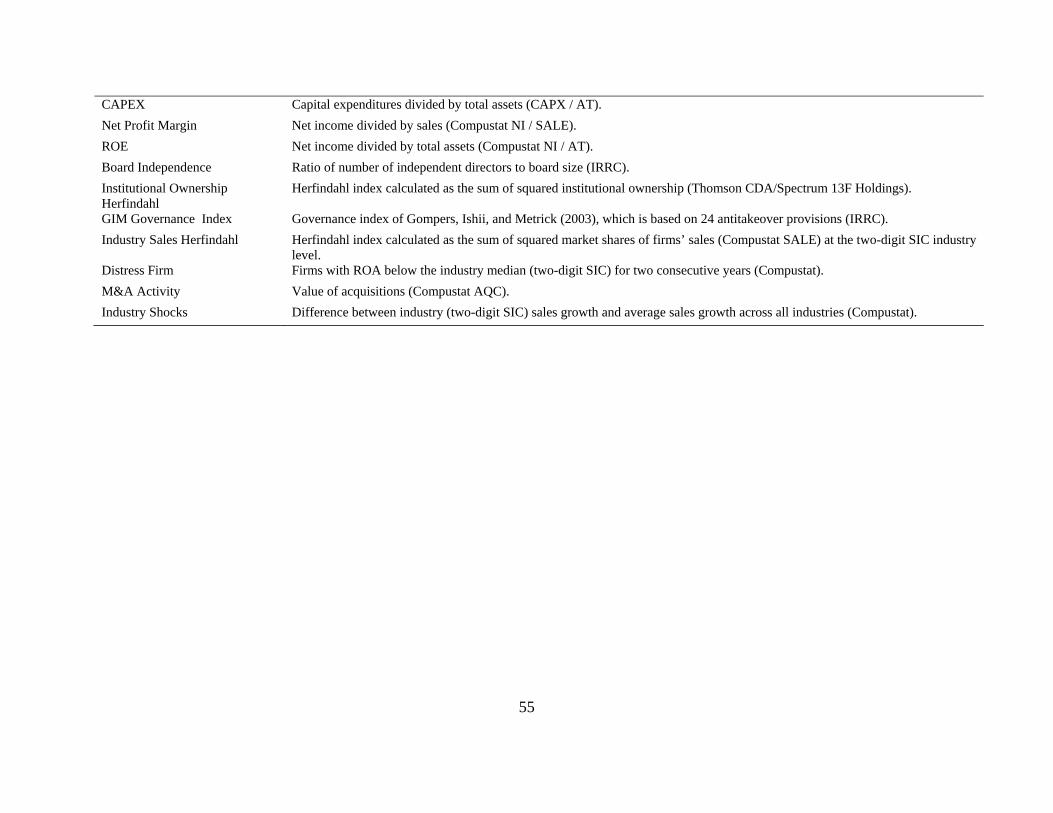
55
CAPEX Capital expenditures divided by total assets (CAPX / AT).
Net Profit Margin Net income divided by sales (Compustat NI / SALE).
ROE Net income divided by total assets (Compustat NI / AT).
Board Independence Ratio of number of independent directors to board size (IRRC).
Institutional Ownership Herfindahl
Herfindahl index calculated as the sum of squared institutional ownership (Thomson CDA/Spectrum 13F Holdings).
GIM Governance Index Governance index of Gompers, Ishii, and Metrick (2003), which is based on 24 antitakeover provisions (IRRC).
Industry Sales Herfindahl Herfindahl index calculated as the sum of squared market shares of firms’ sales (Compustat SALE) at the two-digit SIC industry level.
Distress Firm Firms with ROA below the industry median (two-digit SIC) for two consecutive years (Compustat).
M&A Activity Value of acquisitions (Compustat AQC).
Industry Shocks Difference between industry (two-digit SIC) sales growth and average sales growth across all industries (Compustat).