general introductory environmental chemistry labscecas.clemson.edu/ecl/labs/general/labs.pdfgeneral...
TRANSCRIPT
General Introductory Environmental Chemistry Labs
1. Hard Water Determination
2. Changes in Alkalinity and pH
3. Phosphate Determination
4. Softening Hard Water
5. Determination of Sulfate by Turbidimetric Method
6. Determination of Chloride Ions in Water
7. Determination of pH and Buffer Capacity
8. Total Suspended Solids
9. Total Dissolved Solids
10. Synthesis and Environmental Impact of Soap and Detergents
11. Fertilizer and water quality
12. Analysis of soil
Hard Water Determination
Your group has been sent to a water treatment plant that is trying to decide the cheapest and best source of water it should use to supply local homes with. Your job specifically is to test the hardness of possible water sources and use that information to decide which water source will be the best to use. Hardness can be caused by the presence of iron, aluminum, manganese, strontium, zinc, hydrogen, magnesium, and calcium ions present water. However, your group is only assigned to test for hardness due to calcium, which can be measured in ppm (mg/L). Hardness can be measured by using a water testing kit, but when you arrive at the water treatment plant your group realizes that there are no water testing kits available to use. Your group must make do and use an EDTA (ethylenediaminetetracetate) titration method in order to determine the hardness of the local waters. Use the following chart: Hardness of water (ppm Ca) Hardness Description 0-50 Soft 51-150 Moderately Hard 151-300 Hard >300 Very Hard Find the hardness of water samples by the following method: Pour 10ml of a filtered water sample into a 250ml Erlenmeyer flask. Add about 150ml of distilled water, followed by 15ml of pH 10 buffer. Mix thoroughly. Then add 4 drops of EBT (Eriochrome Black T) indicator and titrate with standard 0.01M EDTA solution until a pure blue color is obtained with no tinge of purple. It may be helpful to use a sample with a known concentration of Ca first, in order to see what the endpoint will look like.
Pre Lab Questions: 1.What is the molecular weight of EDTA and Calcium? 2. How much EDTA must you use when titrating the known 0.001g Ca/ml to the endpoint? 3. What is the equivalence point of a titration and how can you use this to determine the concentration of an unknown? Post Lab Questions: 1. Show conversions/calculations used to find the hardness of the water. 2. What water source would be the best to use in terms of hardness (or softness)? 3. What is a possible contributor to the hardness of the water sample?
Changes in Alkalinity and pH
Your group has been sent to a rural farm area to test the local lake water for abnormal pH and alkalinity. Before you leave for your assignment you do some research on the pH and alkalinity of water. You also find that excessive algae growth can be the result of too many nutrients such as nitrogen and phosphorus which are found in fertilizers and manure. This addition of too many nutrients is known as eutrophication and can lead to not only the overgrowth of algae, but also the depletion of oxygen and ultimately the death of fish and other aquatic organisms. When algae is present in water it removes carbon dioxide from the water during photosynthesis. The equation below illustrates the removal of carbon dioxide. H+ + HCO3
-=> H2CO3 => H2O + CO2 When the carbon dioxide is removed from the water, H+ decreases as shown below. 2HCO3
- => CO32- + H2O +CO2
CO32- + H2O => 2OH- + CO2
In the dark, the algae no longer photosynthesize. They undergo respiration, the opposite process of photosynthesis in which carbon dioxide is given off and in this case added back into the water. This increase in carbon dioxide results in the increase of H+ as shown below. H2O + CO2 => H2CO3 => H+ + HCO3
- Find how the presence of algae and its processes affect the alkalinity and pH of natural waters using the following methods: Obtain about 400ml of a water sample. 1. Water with little algae growth: Pour a little over 100ml of the sample into a beaker and test the pH, then transfer exactly 100ml of the sample to a 250 Erlenmeyer flask to carry out an alkalinity titration*. 2. Daytime in water with algae growth: Pour 150ml of the original water sample into a 250ml beaker and boil for 5 minutes. Next

take the pH and then transfer 100ml of the boiled sample to a clean 250ml Erlenmeyer flask to do another alkalinity titration. 3. Dark Hours in water with algae growth: Pour a little over 100ml of the original water sample into a beaker and bubble with carbon dioxide for at least 2 minutes (Can blow into sample using a straw). Take the pH and then transfer 100ml of the bubbled sample to a clean 250 Erlenmeyer flask for an alkalinity titration. *Alkalinity Titration Procedure: Pour 100ml of the water sample into a 250ml Erlenmeyer flask. Add 3-5 drops of methyl orange. Rinse a buret with three 10ml portions of 0.1M HCl (this only needs to be done before the first titration). Fill the buret with the acid and record the initial volume. Titrate the sample with the 0.1M HCl to the endpoint (orange to red), and record the final volume. Find the alkalinity of the sample in ppm (mg/L). To find alkalinity use the following equation: [Alkalinity] = [(ml of HCl)(Molarity of HCl)(100.0g/mol)] /[(2)(L of sample)] Pre Lab Questions: 1.What is the difference between alkalinity and pH? 2.How does the concentration of H+ affect the pH? Post Lab Questions: 1. At what time is the alkalinity and pH the greatest, why? 2. At what time is the alkalinity and pH the smallest, why? 3. Why is boiling the sample a good way to simulate the photosynthesis process' effect on water?
Phosphate Determination
A little farming town is complaining that a local lake is experiencing an excessive growth of algae. The residents are concerned the algae will deplete the oxygen and kill other marine life in the lake. Your group has been sent to determine if the phosphate from the fertilizer is the cause. You have found through research that the simplest phosphate is orthophosphate. You also found that when it reacts with ammonium molybdate (NH4Mo7O24.4H2O), a yellow acid forms. With this information, you can do a colorimetric analysis to find the concentration of phosphate in the lake. Keep in mind that a phosphate reading of 1.0ppm or less is excellent, one of 1.1-4ppm is good, one of 4.1-9.9 is fair and a reading of 10ppm is poor. Determine how much phosphate is present by using the following method: First the spectrophotometer must be standardized. Do so by creating the following standards with a 20ppm (mg/L) phosphate stock solution.
1. Blank 2. 2.0 ppm, final volume 100ml 3. 5.0ppm, final volume 100ml 4. 8.0ppm, final volume 100ml 5. 10.0ppm, final volume 100ml For each of the standards follow the following procedure: First measure 25.0ml of the standard into a 50ml volumetric flask or a graduated cylinder. Then determine if the standard is acidic by adding 1 drop of phenolphthalein indicator to the solution. If the solution turns pink, then add 6M HCl drop wise until the solution turns clear. Then dilute the solution to 50ml. Measure out 25ml of this solution and add to 50ml volumetric flask and add 10.0ml vandate-molybdate reagent using a volumetric pipet. Add distilled water carefully to increase the volume to exactly 50ml. Wait at least ten minutes for the yellow color to develop fully. Zero the spectrophotometer with your blank and measure the absorbance of the solution at 420nm. Using the measured absorbance values create an absorbance vs. concentration graph. For the concentration use the original concentration of phosphate before reagents were added. Next test the water for presence of phosphate. Do so by obtaining a filtered sample of the water. If there is still color in the water, shake 50ml of the water sample with 200mg of activated carbon for 5 minutes and filter. Then analyze the sample by using the same procedure as used for the standards. If the sample has an absorbance greater than that of the most concentrated sample, then dilute the original sample 1:10 and repeat the procedure. Use your results to find the concentration of phosphate in the water. Pre-Lab Questions: 1. Draw the structural formula for phosphate. 2. How do you calibrate a spectrophotometer? Post Lab Questions: 1. Draw a standard curve using the recorded data, then find the best fit line, its equation, and r2. 2. Using the standard curve, what was the concentration (ppm) of phosphate in the water sample?
Softening Hard Water
A local beverage company is trying to find a new way to soften the hard water that is supplied to the company's factories. The process they are using now makes the water safe to drink but it is also expensive. While other groups are assigned to test the safeness of softened water, your group has been assigned to test the actual water softening process. Your group will use an ion-exchange process to soften the hard water samples. The equation for the ion-exchange that results in softened water is as follows: 2NaR(s) + Ca2 + CaR2(s) + 2Na+(aq) The R- in the equation above represents the anion of exchange. When hard water containing Ca2+ ion comes in contact with the NaR, the Na+ ion is replaced by the Ca2+ ion.
Keep in mind the following: Hardness Range(ppm Ca) Hardness Description 0-50 Soft 51-50 Moderately Hard 151-300 Hard >300 Very Hard Using the following method hard water can be softened: First do an EDTA titration of a water sample to determine the hardness of the sample. Then in a buret place cotton followed by a measurement of Rexyn. Pour a new 25ml of the water sample into the buret. Open the stopcock enough to allow the water to drop through at a considerably slow pace. Collect the softened water in a beaker. In order to determine the difference in the hardness of the water do another EDTA titration of the softened water. Repeat this several times to determine the least amount of Rexyn that can be used to bring the water into the range of 0-50ppm Ca. Pre Lab Questions: 1. What method will you use to determine the least amount of Rexyn that can be used to soften the water? 2. Rexyn is in the form of small round beads, so why is it important to put cotton in the buret before pouring the Rexyn in? Post Lab Questions: 1. What was the hardness of the water before softening? 2. Report the amount of Rexyn used for each trial and the hardness of the water after. 3. What is the least amount of Rexyn that can be used to get a value where the water can be considered soft?
Determination of Sulfate by Turbidimetric Method
A group of environmental scientists are travelling to a mining town to research the affects of mining on human water supplies and the efficiency of several water treatment techniques. Your group has been assigned the task of determining the concentration of sulfate in the local waters using a turbidimetric method. When testing the water keep in mind that an acceptable concentration for drinking water is 250ppm od sulfate. Although sulfate is not particularly toxic if the concentration is to high it may cause other problems, such as build up in high-pressure boilers, the taste of the water being bitter, and at concentrations above 1000ppm, the water may cause diarrhea. The turbidimetric method you will use to determine sulfate concentration is based on the fact that light is scattered by particulate matter in aqueous solution. When barium and sulfate react in water, they make the solution
turbid, which means the concentration of the Sulfate can be measured by using a spectrophotometer. The equation for the reaction of barium and sulfate is shown below
SO42-(aq) + Ba2
+(aq) -----> BaSO4(s)
Determine the concentration of sulfate by using the following method: First create a conditioning reagent by mixing 50ml glycerol with a solution containing 30ml concentrated HCl, 300ml distilled water, 100ml isopropyl alcohol, and 75g NaCl. Then, using a stock solution of 1000ppm sulfate, create four 100ml standards with the concentrations of 10.0ppm, 20.0ppm, 40.0ppm, and 80.0ppm. For each of the standards use the following procedure: Add 10ml of standard and 10ml of distilled water to a 250ml Erlenmeyer flask. Then add 5.0ml of the conditioning reagent and stir gently. Measure about 0.1-0.2g of 20-30mesh BaCl2 and add to the flask. Stir the contents of the flask for one minute. After the completion of the stir time, quickly and carefully pour the contents into a spectrophotometer cell, and let stand for five minutes. While waiting, zero the spectrophotometer at 420nm with distilled water and then take the absorbance of the standard. After taking the absorbance for the remaining three standards create an absorbance vs. concentration curve, using the original concentrations of your standards. To find the concentration of sulfate in your samples, use the same procedure as used for your standards Pre Lab Questions: 1. How is a spectrophotometer calibrated? 2. Once the absorbance vs. concentration graph is completed how will can the concentration of the water sample be found? Post Lab Questions: 1. Show the absorbance vs. concentration graph. 2. What is the equation for the best-fit line? 3. What is the concentration of chloride in the water sample?
Determination of Chloride Ions in Water
Your group has been assigned to test the water of a local town that is complaining that their water has somewhat of a salty taste. When your group arrives, you notice that there are many geologists roaming around studying the abundance of sedimentary rock, particularly halite (NaCl). You realize that the abundance of halite in addition to other sedimentary rocks may be the cause of the salty water taste due to the presence of chloride. Take samples of water and test them for chloride ions to see if your hypothesis is correct. Determine the concentration of Chloride Ions by using the Mohr method: First make a 0.075M standard AgNO3 solution by mixing 3.0g of silver nitrate with 250ml of distilled in an Erlenmeyer flask. Set aside for later use. To determine the concentration of chloride, first pipet 10ml of filtered water sample into a 250ml Erlenmeyer flask and dilute by adding 65ml of distilled water. Test the pH of the diluted water sample with pH test paper. If the pH is not between a pH of 6 and 8, then use
nitric acid or sodium hydroxide to bring the pH to an appropriate level. Then add 1ml of 0.25M potassium chromate to the flask. Rinse and fill a buret with the standard AgNO3 solution. Titrate the environmental water sample by adding the AgNO3 solution slowly while stirring the sample using a magnetic bar and stir plate. The end point will be indicated by the persistence of a red-brown color through the yellow solution for about 30 seconds. Repeat the titration two more times and average the amount of AgNO3 used to reach the endpoint. Then titrate a blank using the same procedure above. For the blank use distilled water in place of the environmental water sample. Subtract the volume of AgNO3 for the blank from the average used for the sample. This volume will be the one used to determine the concentration of Chloride in the water sample. Keep in mind when doing final calculations that the silver and chloride react in a one-to-one ratio. Pre-lab Questions: 1. If the pH of your sample has a pH greater than 8 would you add nitric acid or sodium hydroxide? 2. Why is it important to rinse the buret with the titrant before beginning the titration? Post-lab Questions: 1. What was the average amount of titrant used to reach the endpoint? 2. What is the concentration of chloride in the water sample?
Determination of pH and Buffer Capacity
A local high school needs the help of your group. The high school chemistry classes are doing experiments that make use of buffers. They would possibly like to use local waters as a source for the buffers in one of their experiments. However they do not know which source will best resist a change in pH. Your group must test the local waters in order to determine which will serve as the best buffer. Find the pH and buffer capacity using the following procedure: Calibrate the pH meter by using a buffer with the pH of seven and another with the pH of 10. Keep in mind the following when taking the pH of a sample: 1. Keep the meter in STANDBY when the electrode is not in solution 2. Between readings, rinse and blot dry the electrode. After calibrating the pH meter, rinse and fill a buret with 0.01 M HCl. Then in a 250ml beaker, pour 100ml of the water sample. Record the pH of the sample. Add HCl to the beaker in increments of 1ml or 0.5ml as necessary. Stir the solution and take the pH after each addition until the sample reaches a pH of about 4. Repeat this procedure using other water samples. Pre Lab Questions: 1. What is buffer capacity?
2. Write a general equation to find buffer capacity. Post Lab Questions: 1. Create a pH vs. volume of titrant graph for each sample tested. 2. Using the graphs find the buffer capacity of each sample. 3. Which sample would be best to use as a buffer, why?
Total Suspended Solids
Introduction The ACME Laboratory, in which your team is employed, has been awarded a contract to test the wastewater for a company that maintains their own wastewater facility. By governmental regulations, an independent contractor must test the wastewater before it can be discharged into a local stream. Your team has been given the task of collecting and determining the total suspended solids (TSS) of the wastewater. Report the findings of the test results. Discuss among the team members the size and number of samples to be tested. The size and number of samples tested will determine the amount of the water source needed to conduct the experiment. Before beginning this experiment read the questions in the last section to help determine what is being asked of the lab. Procedure Water Sampling: Obtain a plastic sample container. Clean the container with water to remove any possible contaminates. Determine the water source in which is to be tested for TSS. When collecting samples, record any observations made about the water such as clarity of the water, is the water stagnate, etc. Place the container into a deep area of the water as to not disturb any sedimentation at the bottom of the water source. Solids that have settled can containment the sample and will introduce higher TSS values when testing. Testing for TSS: Obtain filter paper, vacuum filtration apparatus, and 250 to 400 mL beaker. Clean all glassware prior to testing with tap water. First place filter paper(s) in the oven at 100ºC for approximately 10-15 minutes. This initial step is used to remove moisture from the filter paper that is absorbed from the air. As soon as the filter paper(s) is removed from the oven, weigh and record the mass. This value is the initial mass. Then place the filter paper in the vacuum filtration apparatus. Next measure the sample water using a beaker; be sure to mix the water source first. This is to insure that the suspended solids are evenly disturbed in the sample. Next filter the sample to remove the solids. Record observations pertaining to the water sample after filtration has been completed. The water in the flask, after the filtration process has been carried out, can be discarded into the sink. Remove the filter paper and place into the oven to repeat the drying process. Weigh the filter paper and record the measurement after it has completely dried. This value is the final mass.
Questions 1. Is the TSS reported within a reasonable limit of the EPA standards? 2. What is the main source of the solid in the water that gives it a greenish tint? 3. Why does the EPA prohibit discharging wastewater with a high concentration of suspended solids? What effects would a high TSS have on the ecosystem of a stream or lake? 4. After filtering the sample water, did the filter paper remove all of the suspended solids from the sample? If not, how was this conclusion determined? Did the water sample, after filtration, consists of clear or cloudy water? 5. If the sample water was cloudy or tinted after the filtration procedure was completed, what are the sizes of the particles that remain? (HINT…what was the size of the pores in the filter paper used during the experiment.) 6. What materials could be used in a filtration system to remove all of the suspended solids? (HINT…swimming pool, fish aquarium, etc.)
Total Dissolved Solids
Introduction The ACME Laboratory now would like for your team to test for the total dissolved solids (TDS) in the water source used in the TSS experiment. To insure that the suspended solids are removed from the water source, the team must design a filtering system to remove small particles found in the water. Discuss among the team members the size and number of samples to be tested. The size and number of samples tested will determine the amount of the water source needed to conduct the experiment. Before beginning this experiment read the questions in the last section to help determine what is being asked of the lab. Procedure: Filter Design: Obtain filter paper, charcoal, sand, funnel, vacuum filtration apparatus, and 250 to 400 mL beaker. Clean all glassware prior to testing with distilled water. This cleaning process is to prevent any contamination from tap water. In designing this filtration system, keep in mind that a combination of the materials can be used. Record any observations on the clarity of the water for each filtration system used in the experiment. Testing for TDS: Materials needed for this portion of the experiment. The team must decide the sample size to be tested. A combination of sample sizes will work, or the same sample sizes for all the tests conducted will be sufficient. After determining the sample size(s), obtain four beakers that will hold the filtered samples during the test. Be sure to clean the glassware thoroughly with distilled water before conducting the test. Record the initial mass of each beaker prior to conducting the experiment. With a graduated cylinder, measure the sample and place in a beaker. Repeat procedure three times. There should be four samples tested. Then turn the hot plate on and set the four beakers on it. Do not allow
the water to boil over. This will result in the loss of dissolved solids. Boil off all the water from the samples. Allow the beakers to cool before measuring the final mass. The results should be in mg/L in your report. Questions 1. Was there a combination of materials used in the construction of the filter? Why or why not. 2. How was the filter design constructed? Draw a diagram of the filter. 3. Did this design work? How was this conclusion determined? 4. Did water source have a greater TSS or TDS? Is the result what you expected? 5. What do you think were the main contributing ions in the TDS? Would the water samples tested in this experiment be considered hard water? What would be a way to determine that conclusion?
Synthesis and Environmental Impact of Soap and Detergents
Your group has been sent to a remote mountain region where life is still primitive. Here, the people still use traditional lye soaps, which have been identified a possible sources of pollution. The soap that has been traditionally produced is extremely harsh, and many of the people have developed skin rashes from using it. In addition the soap seems to vary a lot in quality and feel; sometimes the soap does not lather and instead forms a sort of scum. The government has charged you with the task of working with the people to develop a safer soap making process that will be more environmentally sound, and that will produce a milder soap. Alternatively, you may recommend that the people synthesize and use detergents instead of soap. Goals of the Project: 1. Develop and refine a synthesis of soap that gives a product that is mild and lathers well. 2. Develop and refine a synthesis of detergent that gives a product that is mild and lathers well. 3. Identify and minimize environmental problems caused by the syntheses. 4. Compare soap and detergent, for cost, effectiveness, and environmental impact 5. Identify the substances in the water that seem to affect the action of the soap (i.e. make the soap form a scum) 6. Suggest and test remedies for the “scum problem”. Resources available 1. A general soap synthesis that you can use as the basis for your product development. 2. A detergent synthesis that might be used as an alternative. 3. All the starting materials that are available to the people 4. Samples of the water that is used for washing and rinsing Synthesis of Soap.
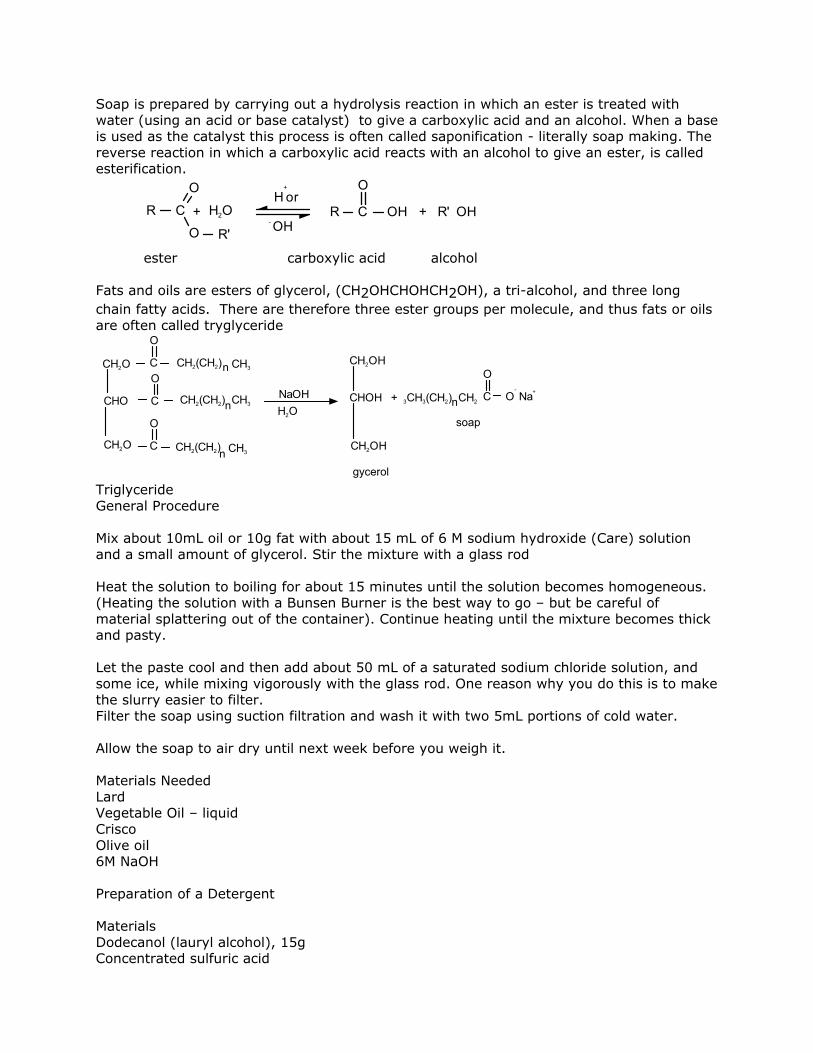
Soap is prepared by carrying out a hydrolysis reaction in which an ester is treated with water (using an acid or base catalyst) to give a carboxylic acid and an alcohol. When a base is used as the catalyst this process is often called saponification - literally soap making. The reverse reaction in which a carboxylic acid reacts with an alcohol to give an ester, is called esterification.
C
O
R'
C
O
OOHR'+OHR
+
H orH2O+R
OH-
ester carboxylic acid alcohol Fats and oils are esters of glycerol, (CH2OHCHOHCH2OH), a tri-alcohol, and three long chain fatty acids. There are therefore three ester groups per molecule, and thus fats or oils are often called tryglyceride
CH2n3CH3(CH2)
CH3nCH2(CH2)
CH3nCH2(CH2)
CH3nCH2(CH2)
CHO CHOH
gycerol
CH2OHC
O
CH2O
CH2OH
soap
C
O+NaO+
H2ONaOH
CH2O
C
OC
O
-
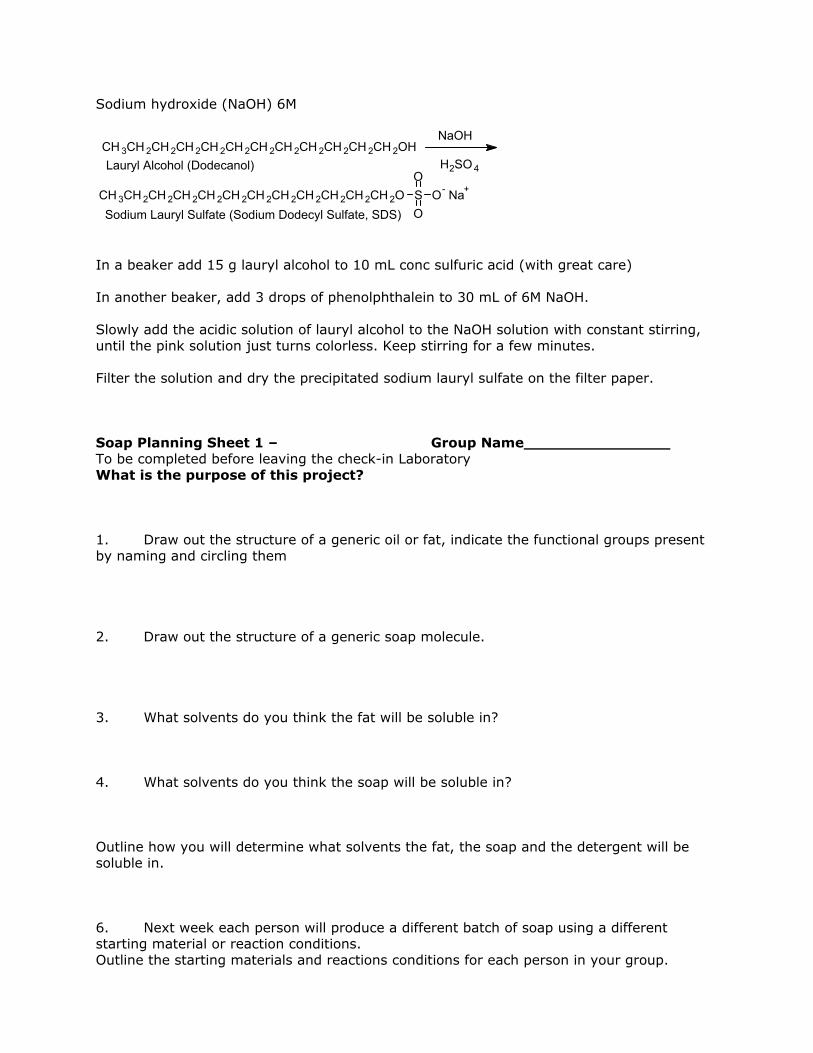
Triglyceride General Procedure Mix about 10mL oil or 10g fat with about 15 mL of 6 M sodium hydroxide (Care) solution and a small amount of glycerol. Stir the mixture with a glass rod Heat the solution to boiling for about 15 minutes until the solution becomes homogeneous. (Heating the solution with a Bunsen Burner is the best way to go – but be careful of material splattering out of the container). Continue heating until the mixture becomes thick and pasty. Let the paste cool and then add about 50 mL of a saturated sodium chloride solution, and some ice, while mixing vigorously with the glass rod. One reason why you do this is to make the slurry easier to filter. Filter the soap using suction filtration and wash it with two 5mL portions of cold water. Allow the soap to air dry until next week before you weigh it. Materials Needed Lard Vegetable Oil – liquid Crisco Olive oil 6M NaOH Preparation of a Detergent Materials Dodecanol (lauryl alcohol), 15g Concentrated sulfuric acid
Sodium hydroxide (NaOH) 6M
CH 3CH 2CH 2CH 2CH 2CH 2CH 2CH 2CH 2CH 2CH 2CH 2OHNaOH
H2SO 4
CH 3CH 2CH 2CH 2CH 2CH 2CH 2CH 2CH 2CH 2CH 2CH 2O SO
OO- Na+
Lauryl Alcohol (Dodecanol)
Sodium Lauryl Sulfate (Sodium Dodecyl Sulfate, SDS) In a beaker add 15 g lauryl alcohol to 10 mL conc sulfuric acid (with great care) In another beaker, add 3 drops of phenolphthalein to 30 mL of 6M NaOH. Slowly add the acidic solution of lauryl alcohol to the NaOH solution with constant stirring, until the pink solution just turns colorless. Keep stirring for a few minutes. Filter the solution and dry the precipitated sodium lauryl sulfate on the filter paper. Soap Planning Sheet 1 – Group Name To be completed before leaving the check-in Laboratory What is the purpose of this project? 1. Draw out the structure of a generic oil or fat, indicate the functional groups present by naming and circling them 2. Draw out the structure of a generic soap molecule. 3. What solvents do you think the fat will be soluble in? 4. What solvents do you think the soap will be soluble in? Outline how you will determine what solvents the fat, the soap and the detergent will be soluble in. 6. Next week each person will produce a different batch of soap using a different starting material or reaction conditions. Outline the starting materials and reactions conditions for each person in your group.
7. Next week you will determine the solubility of the starting materials for soap, and produce as many samples of soap as there are people in your group. Soap Planning Sheet 2 Group Name___________________ What was the purpose of this weeks lab? 1. Briefly discuss the results of your solubility tests on the fat or oil that you used to make the soap. What type of solvent was the fat soluble in? Discuss the molecular interactions that are responsible for the solubility of the fat. 2. Give the reaction conditions and results for each soap preparation. Discuss the similarities and any differences that you observed. 3. Next week you will prepare samples of a detergent. Draw out the reaction scheme for the preparation of detergent below. Give the structure of the detergent and indicate the functional groups 5. What do you think the purpose of the phenolphthalein is, in the preparation of the detergent? 6. Compare the structures of soap and detergent. What are the similarities? What are the differences. You may begin testing the soap and detergent next week. How will you test for lathering ability, solubility, cleansing ability? –Note that you should not test the soap by washing your hands or feeling the solutions. You must devise other methods for testing.
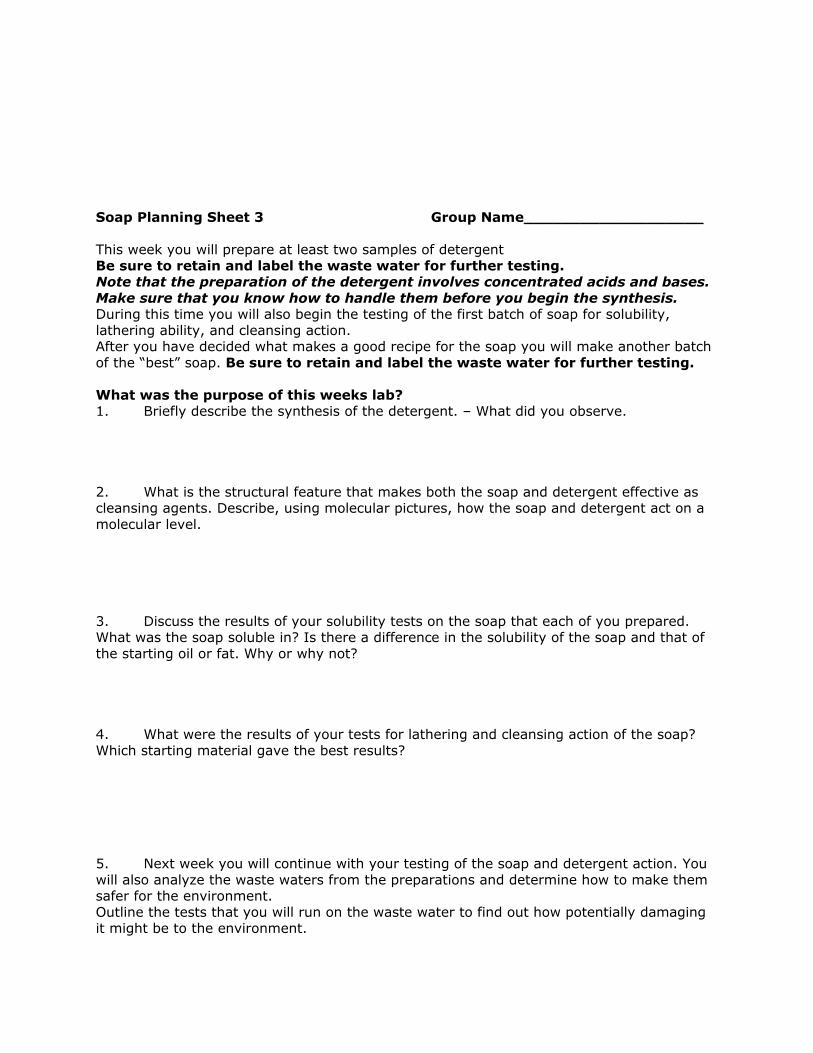
Soap Planning Sheet 3 Group Name___________________ This week you will prepare at least two samples of detergent Be sure to retain and label the waste water for further testing. Note that the preparation of the detergent involves concentrated acids and bases. Make sure that you know how to handle them before you begin the synthesis. During this time you will also begin the testing of the first batch of soap for solubility, lathering ability, and cleansing action. After you have decided what makes a good recipe for the soap you will make another batch of the “best” soap. Be sure to retain and label the waste water for further testing. What was the purpose of this weeks lab? 1. Briefly describe the synthesis of the detergent. – What did you observe. 2. What is the structural feature that makes both the soap and detergent effective as cleansing agents. Describe, using molecular pictures, how the soap and detergent act on a molecular level. 3. Discuss the results of your solubility tests on the soap that each of you prepared. What was the soap soluble in? Is there a difference in the solubility of the soap and that of the starting oil or fat. Why or why not? 4. What were the results of your tests for lathering and cleansing action of the soap? Which starting material gave the best results? 5. Next week you will continue with your testing of the soap and detergent action. You will also analyze the waste waters from the preparations and determine how to make them safer for the environment. Outline the tests that you will run on the waste water to find out how potentially damaging it might be to the environment.
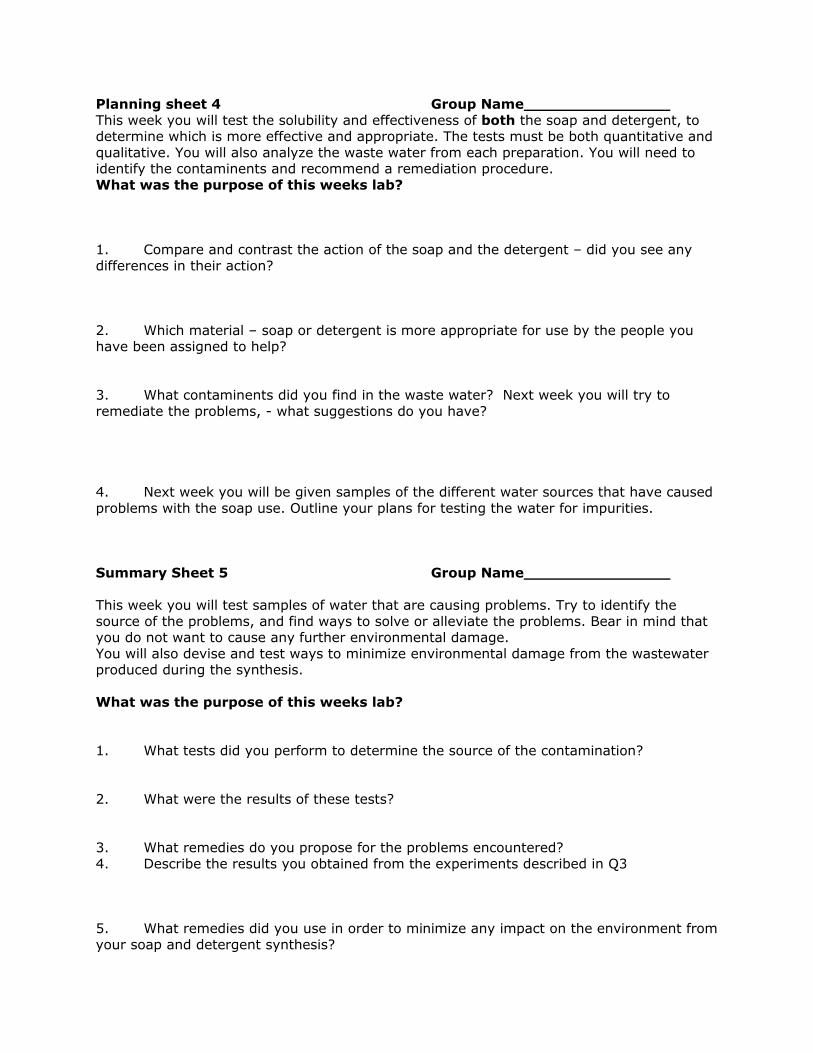
Planning sheet 4 Group Name This week you will test the solubility and effectiveness of both the soap and detergent, to determine which is more effective and appropriate. The tests must be both quantitative and qualitative. You will also analyze the waste water from each preparation. You will need to identify the contaminents and recommend a remediation procedure. What was the purpose of this weeks lab? 1. Compare and contrast the action of the soap and the detergent – did you see any differences in their action? 2. Which material – soap or detergent is more appropriate for use by the people you have been assigned to help? 3. What contaminents did you find in the waste water? Next week you will try to remediate the problems, - what suggestions do you have? 4. Next week you will be given samples of the different water sources that have caused problems with the soap use. Outline your plans for testing the water for impurities. Summary Sheet 5 Group Name This week you will test samples of water that are causing problems. Try to identify the source of the problems, and find ways to solve or alleviate the problems. Bear in mind that you do not want to cause any further environmental damage. You will also devise and test ways to minimize environmental damage from the wastewater produced during the synthesis. What was the purpose of this weeks lab? 1. What tests did you perform to determine the source of the contamination? 2. What were the results of these tests? 3. What remedies do you propose for the problems encountered? 4. Describe the results you obtained from the experiments described in Q3 5. What remedies did you use in order to minimize any impact on the environment from your soap and detergent synthesis?
6. Describe the results you obtained from the experiments described in Q5
FERTILIZER AND WATER QUALITY Fertilizers are commercially available for a variety of specialized applications: for lawns, houseplants, gardens, and farming applications. One fertilizer application that has been of particular interest has been the use of fertilizers on golf courses. It is feared that the large quantities of fertilizers used to keep fairways and greens lush and beautiful are also damaging surface and ground water supplies around the courses. Fertilizers do, in fact, contain a number of compounds that may cause specific problems in water supplies if they are present in high enough quantities. The question then becomes, “how much is too much?” and “how much fertilizer stays where it’s put?” You have been assigned to a group of researchers working for a local golf course. The owner has several concerns about the use of fertilizers on his course. First, he does not trust the manufacturer. He wants to know if the stuff he has bought really contains what it says it does. Secondly, he has heard that the government may soon pass regulations on how much of the nutrients present in fertilizer can end up in ground water supplies. Your team has been hired to address these concerns.
GOALS Determine the nutrients most commonly present in commercially available fertilizers. You will find these fall into three categories: macronutrients, secondary nutrients, and micronutrients.
Determine the sources for these nutrients in commercially available fertilizers. Determine for which of the macronutrients can you perform qualitative and quantitative tests. Practice these tests on known compounds. Perform these tests on the fertilizer(s) provided by the golf course owner. Develop a model for determining the amount of these nutrients entering the groundwater supply. Use this model to determine if these nutrients may be present in groundwater after their application.
Known Compounds Samples of compounds, which contain the macronutrients found in fertilizer, are available in the lab. You may use these to determine properties of these compounds, which may be useful in developing qualitative and quantitative tests. You may want to investigate properties such as odor, solubility, and others. Remember, you have a limited supply of your fertilizer so you will want to test your procedures before you carry them out on the fertilizer itself.
Analysis of Soil
Your team of chemists has been called out to a local farm. The farmer tells you that
she is having problems with the crops in one of the fields. She seems to think that the soil
has become contaminated after a road accident that occurred doing the winter. A truck
jackknifed and spilled some of its contents on the field. She asked for your help. The
farmer would like to know what the contaminant is and if there is anything she can do to
alleviate the problem. The farmer did not know what the chemical spilled was. However,
the truck was carrying bulk chemicals for a company that produced inorganic fertilizers, ice
melting compounds for roads, inorganic industrial cleaners, and cement additives.
Goal of the project
1. Confirm the that observation that there is a problem with the soil.
2. Determine the identity of the soil of the contaminant.
3. Determine the amount of the contaminant present in the soil.
3. Suggest a possible remedy for the problem.
Resources available 1. A bucket of soil from the contaminated area of the farm.
2. A bucket of soil from a adjacent noncontaminated area of the farm.
3. Seeds from radishes, a very fast germinating plant.
4. Samples of the companies starting materials. Potassium chloride, sodium chloride,
calcium chloride, sodium dihydrogen phosphate, Sodium monohydrogen phosphate,
Trisodium phosphate, sodium carbonate, calcium hydroxide or oxide.
5. Some general guidelines for soil testing.
Useful Information
Plants require the presence of several different nutrients for proper growth. These essential foodstuffs must also be found in the proper proportions for the healthy sustainability of the plant. You may want to consider cultivating fast growing plants, like radishes, and monitor there growth in your soil samples. Drying soil samples Soils sampled from the field contain water, the amount depending on soil properties and the preceding weather conditions. Even when the soil is air-dried, some water remains. The water content of soils is determined by drying at about 105˚C which gives oven-dry soil. Results of soil analyses are normally expressed relative to a mass of oven-dry soil. When an oven-dry soil is heated to 500˚C, organic matter is burnt off and there is further loss of water. The mass lost between 105˚C and 500˚C is called the loss on ignition. For these tests, you will want to use 10g of the soil. The samples used for determining water content can be placed in glass dishes and the samples can be dried in a drying oven. Alternatively
the samples can be place on a hot plate set fairly low for several hours. The test is complete when a constant weigh is achieved for each sample -- be patient because this might take time!
An ignition test requires the use of crucibles and Bunsen burners. The samples are heated to red heat until a constant weigh is achieved. Qualitative analysis of Soil samples
For the qualitative analysis of the soil samples, you will want to test for the presence of various anions. Oftentimes, anions will complex with various reagents and then precipitate out of solution. Thus, the presence of a precipitate for an anion test will indicate the presence of that particular anion. These ion tests should be done with the soil in solution. A small amount on the end of a spatula of the soil sample mixed with approximately 1ml of water in a test tube will be sufficient for the tests. pH of soil
The extent of a soil’s basicity or acidity can be determined via a pH reading. pH values can be altered by some contaminates. Make a solution of your soil -- 10g of the soil sample mixed with 20ml of water. In this part of the experiment, you will want to use a pH meter. Remember to calibrate the probe before collection of values. (see supplement on how to use a pH meter) Buffer capacity A buffer helps resist change in pH. Some contaminants can affect the way a soil solution responds to the addition of acid. To test the buffer capacities of your soil samples, make a solution of your soil with KCl (0.1M) as the solvent. To make the solution, combine 5g of your soil sample with 10ml of the KCl solution. Why is KCl better than H2O? Set up several runs with varying amounts of added HCl (0.1M). Allow to react for approximately 2 hours, stirring occasionally. Record pH values and plot the buffer curve. How could you replot the data and obtain a linear relationship in order to compare slopes? Carbonate Analysis To quantitatively determine the amount of carbonate in your soil samples, mix 10g of soil with 20ml of HCl (2M) and allow to react for approximately 15 minutes. What do you observe happening in the flask? Heat the solution on a hot plate and allow to react for another approximate 15 minutes. Filter with a Hirsch funnel and transfer filtrate to a 100ml volumetric flask and fill to mark. Use this soil solution with phenolphthalein indicator and titrate with 0.1 M NaOH. What is the carbonate content of your soil samples? Phosphate analysis
NOTE 1: This analysis procedure is the most complicated one of those used in this project. All solutions must be carefully prepared using distilled or deionized water. You must keep track of all dilutions and make all volume measurements and dilution using volumetric glassware such as volumetric flasks, pipettes and burette. Sample selection must be made carefully.
Procedure for preparation of a calibration curve
1. Switch on a Spec-20 spectrophotometer and allow to ‘warm up’
for 30 minutes, setting the wavelength to 630 nanometers (nm).
2. Prepare a solution of NaH2PO4 in DI water, which contains 30 ppm (i.e. weigh out 0.600 gram of NaH2PO4 in 2 liters of DI water in volumetric flask; dilute this solution 10-fold by pipetting 25 ml into a 250 ml volumetric flask and making up to the mark with DI water. This solution contains 30 ppm phosphate.)
3. Prepare a ‘blank’ solution consisting of 5.75 ml of 4% acetic acid, 0.25 ml of molybdate solution (0.1M in 12% acetic acid), and 1 ml of 5% ascorbic acid solution. With nothing in the Spec-20 sample beam, adjust the instrument to read 0% transmission. With a sample tube containing the blank solution in the beam, adjust the instrument to read 100% transmission.
4. Prepare five phosphate solutions for calibration purposes as follows.
Step 1:
In 5 separate clean test tubes prepare the following phosphate solutions, 15ppm, 7.5 ppm, 3.75 ppm and 1.875 ppm. by diluting the 30 ppm phosphate solution with DI water. Use a pipette. The easiest way to prepare the solutions is prepare 10ml of 15ppm first, then take 5.00 ml of it and dilute it with 5.00 ml of DI water to make 10 ml of 7.5 ppm. use the same procedure to make the other solutions.
Step 2:
Obtain 5 clean spec 20 tubes. Into each of five clean Spec-20 sample tubes pipette 2.75 ml of 4% acetic acid.
Tube 1: add 3.0 ml of the 30 ppm phosphate solution previously prepared.
Tube 2: add 3.0 ml of the previously prepared 15 ppm phosphate solution.
Tube 3: add 3.0 ml of the previously prepared 7.5 ppm phosphate solution.
Tube 4: add 3.0 ml of the previously prepared 3.75 ppm phosphate solution.
Tube 5: add 3.0 ml of the previously prepared 1.875 ppm phosphate solution
5. Into each of the five Spec-20 tubes add 0.25 ml of molybdate solution followed by 1 ml of 5% ascorbic acid solution; mix well by inverting the tubes (insert a rubber stopper or cork in the ‘open’ end of the tube while doing this!).
6. Immerse each of these tubes in a beaker of water at 50oC for 10 minutes in order to fully develop the blue color.
7. Insert each tube in turn into the Spec-20 and measure and record the absorbance of each of the five ‘calibration’ solutions. Note: transmission is related to absorbance by the expression Abs = log10(100/% transmission.
Soil sample preparation for analysis
1. Extract three separate 1.500 gram soil samples with 6 ml of 4% acetic acid solution for 5 minutes, and then filter into a small 50 ml beaker. Wash the solid with 2-3 rinses of 4% acetic acid collecting all rinses in the beaker. If the liquid has a dark color decolorize it with activated charcoal. if the solution is colorless or nearly so skip the decolorizing step.
Decolorizing sample
1. Add 1.0 gram of activated charcoal and boil for 15 minutes by placing the beakers on a hot-plate; this will remove the color of the untreated solution.
2. Filter when the solution is warm using fluted filter paper. Collect the liquid in a 50 ml volumetric flask. Collect all of the rinses in the flask and make up to the mark with 4% acetic acid. be careful not to loose any of the solution.
Spec 20 sample preparation
1. Pipette 3.0 ml of the soil extract into aSpec-20 tube along with 2.75 ml of 4% acetic acid, 0.25 ml of molybdate solution, and 1 ml of 5% ascorbic acid solution. Warm the solutions to 50˚C for 10 minutes and then measure and record the absorbance of the sample soil solutions.
Data handling Plot the absorbance of the calibration solutions against the calculated concentrations
to produce a linear graph (confirming that Beer’s Law is being obeyed). Then using the absorbance of the soil solution, read off from the graph the corresponding concentration. Finally calculate the ppm. phosphate in the 1.5 gram soil samples.
Determining the Amount of Soluble Chloride ion in Aqueous Solution
Note: the standard chloride analysis is much more accurate than the microscale analysis. However, the microscale is much faster than standard procedure and may be all that is necessary to determine if excess chloride ion is present in the soil sample. For the standard analysis procedure you will need to familiar with volumetric techniques and glassware. For the microscale analysis you will need to be familiar with well-plates and the use of transfer pipettes. The chemistry is the same for both procedures. Standard Chloride Analysis The chloride ion concentration of a solution is often determined by titrating the chloride ion with known concentration of silver ion to form an insoluble silver chloride precipitate. The end point in the titration is detected with chromate ion. When a mixture of chloride and chromate is titrated with silver nitrate, silver chloride precipitates first because it is less soluble then silver chromate. After the chloride in solution has precipitated as white silver chloride, the first excess of silver ion precipitates silver chromate which is a dark red. The appearance of the red precipitate signals the endpoint of the titration. Equations
AgNO3 + Cl- NO3- + AgCl(s) white precipitate
AgNO3 + CrO4-2 NO3- + Ag2CrO4(s) red precipitate
Preparation of the AgNO3 solution In a small clean beaker weigh accurately enough silver nitrate to prepare 250 mL of 0.1 Molar solution. Dissolve AgNO3 in a small amount of distilled water and then quantitatively transfer the solution to a 250 mL volumetric flask and dilute to the mark. Silver nitrate solution decompose on exposure to light so store the solution in the dark. Caution: Silver nitrate solid is a corrosive material. Silver nitrate solutions turn black in strong light. If you spill silver nitrate on yourself and do not wash it off promptly and thoroughly it will temporarily stain your skin black. Chromate Indicator You will need 1 mL of 5% Potassium Chromate for each titration. Prepare only what you think you will need.
Caution: Potassium Chromate is a strong oxidizing agent and a suspected carcinogen. Discard the solid residue and dichromate solution in the designated disposal container. Preparation of the sample If you are going to determine the chloride concentration in an unknown solution. It is a good idea to run a quick trial titration. To do so add a 25 mL sample of the solution to a clean 125 mL Erlenmeyer flask then add about 0.5 grams of NaHCO3 and 1 mL chromate indicator solution. Titrate with the silver nitrate solution with constant stirring until the first permanent appearance of red-orange in the yellow solution. If you are not sure what to look for as an end point you can run a blank by substituting 2 grams of CaCO3 in 25 mL of distilled water plus some sodium chloride for the unknown solution. Titrating this with a few drops of silver nitrate will show you what the end point should look like. After this first trial titration adjust the amount of solution to be tested so that at least 20 mL of the silver nitrate solution is needed to reach the end point. Now titrate at least 3 samples to determine the sample chloride concentration. Microscale chloride analysis The microscale approach is less accurate but much faster and cheaper then a standard titration Caution: good results requires counting drops very accurately. To each of 3 wells in a well plate add exactly 25 drops of unknown chloride solution, 5 drops of 0.5 molar NaHCO3 and two drops of chromate indicator solution. Titrate the individual sample with 0.050 molar AgNO3 solution by adding the AgNO3 solution drop wise with stirring after the addition of each drop. (Note: if stirring is not done after each drop the transient red precipitate tends to clump and does not readily disappear.) The titration is complete when the red orange precipitate no longer disappears when the mixture is stirred. The sample should require at least 20 drops of AgNO3. If less is required adjust the amount of chloride unknown sample. Soil Planning sheet 1 Group name____________ To be completed before leaving the Laboratory
1. You have a bucket of soil since it is not possible analyze all of the soil how will you take a
representative sample of the soil?
2. How will you need to prepare the soil for analysis?
3. Soil analysis usually begins with drying the soil. Why is this necessary ?
4. Because soil normally contains most of the ions that can be found in the compounds that
the company makes, how will you determine what the contaminant is?
5. Which contaminants are likely to change the pH of the soil ?
6. Today you should sample and dry the soil it in preparation for next week. If you plan to
test the viability of seeds in the soil samples plant them today.
7. Next week you will need to determine the pH of the soil and develop a procedure for
separating the compounds from the insoluble components of the soil. Before you leave
today outline what each member of the group will do next week.
Soil planning sheet 2 Group name____________
1. Briefly discuss how you will determine the pH of the soil. What reagents or equipment will
you need for this determination?
2. What procedure are you going to use to separate the soluble compounds in the soil.
3. If soil samples are extracted with aqueous solvents a dark colored solution is usually
obtained. Since most acid base indicators and many spot tests depend on color, how will
you deal with this problem? The dark color is most likely due to organic materials in the soil.
Two simple approaches to removing the color involving adsorbing it on activated charcoal or
heating the soil sample at red heat for 30-60 minutes to burn off all the organic materials
4. How will you determine which ions are present in excess in the contaminated soil sample.
What reagents will you need to accomplish this?
5. By the end of today your group should have identified many of the ions in the soil. Next
week your group will have to on determine the concentration of some of these ions in the
soil. It will be necessary for your group to have decided on a standard method for
extracting soluble ions from the soil sample and your group must decide on the analysis
methods you will use. For phosphate analysis you will need to be familiar with pipeting,
dilution techniques with volumetric glassware and the use of a spectrometer. For chloride
analysis you will need to be familiar with microscale titrations. For carbonate analysis you
will need to be familiar with pH meters and burettes.
Soil planning sheet 3 Group name____________
1. Briefly discuss the analytical procedures you will use today to determine the
concentration of ions in the soil. It is likely that you will want to analyze the soil sample for
phosphate, carbonate and chloride ions .
2. How will decide how much soil sample to use? During the most analytical procedures
there are usually several dilutions and transfers of solution it is important to keep track of
these. Why?
3. Usually analytical procedures are on at least three samples of the materials to be
analyzed. Why?
4. Before you leave to day decide what else has to be done and who will be responsible for
doing it.
Soil planning sheet 4 Group name____________
1. Discuss your teams results for the various analytical procedures the team used. Decide
how to tabulate and interpret the results. Do any of the procedure need to be repeated.
Based on your results suggest possible remedies for the farmers field. Carry out any
procedure needed to test your suggested remedies.