general education - content-calpoly … · december 18, 2015 general education program review,...
TRANSCRIPT
December 18, 2015 General Education Program Review, California Polytechnic State University 1
General Education Program Review
2014-2016
California Polytechnic State University San Luis Obispo, CA 93407-0254
December 21, 2015

December 18, 2015 General Education Program Review, California Polytechnic State University 2
Name of program: General Education
Program chair: Brenda Helmbrecht
Program/department website: http://ge.calpoly.edu/
Faculty self-study leaders: Brenda Helmbrecht, GEGB Chair, in collaboration with Bruno Giberti, Faculty Coordinator of Academic Policies, Assessment & Accreditation Gary Laver, Academic Senate Chair Mary Pedersen, Vice Provost Academic Programs & Planning Katie Tool, Administrative Support Coordinator, General Education Program
Reviewer names and affiliations: External Reviewers Dr. Debra David, Student Engagement and Academic Initiatives and Partnerships California State University, Office of the Chancellor Long Beach, CA Dr. Debra Humphreys, Vice President for Policy and Public Engagement American Colleges and Universities Washington, DC Dr. Rick Vaz, Dean, Interdisciplinary and Global Studies Director, WPI Institute on Project-Based Learning Worcester Polytechnic Institute, Worcester, MA Internal Reviewer Dr. Andrew Schaffner, Professor of Statistics Statistics Department, Cal Poly Program review process contact: Lina Heaster-Ekholm [email protected] 805-756-7299 Academic Programs and Planning, Office of Programs and Planning http://www.academicprograms.calpoly.edu/
December 18, 2015 General Education Program Review, California Polytechnic State University 3
Table of Contents I. Introduction .............................................................................................................................. 4
A. General Education History and Description of GE 2001 ................................................. 4 B. Programmatic Purpose and Strategic Direction ............................................................... 8
1) Mission Statement ........................................................................................................... 8 2) GE Program Goals ........................................................................................................... 9
C. Progress Update on Previous Program Review ............................................................... 9 II. Programmatic Components .................................................................................................. 16
A. General Education and University Learning Objectives (ULOs) Mapping ................... 16 B. General Education Program Learning Objectives ......................................................... 18 C. General Education Curriculum ...................................................................................... 21
III. General Education Assessment ........................................................................................... 25 A. Assessment Plans and Results ........................................................................................ 25
1) University Learning Objective Based Assessment in GE and the Majors (ULO Project) ............................................................................................................................... 26 2) University/GE Assessment – Critical Thinking ............................................................ 45
B. Student Perceptions: GE Student Survey ....................................................................... 57 C. Faculty Perceptions: Faculty Surveys ............................................................................ 66
IV. GE Enrollment Management .............................................................................................. 76 A. GE Area A: Communication .......................................................................................... 78 B. GE Area B: Science and Mathematics .......................................................................... 81 C. GE Area C: Arts and Humanities................................................................................... 83 D. GE Area D: Society and the Individual .......................................................................... 85 F. Summary and Conclusions ............................................................................................ 87
IV. Conclusions ......................................................................................................................... 89 A. Taking Stock: The Self-Study’s Significant Findings.................................................... 89
Area A: Communication .................................................................................................... 90 Area B: Science and Mathematics ..................................................................................... 90 Area C: Arts and Humanities ............................................................................................. 90 Area D/E: Society and the Individual ................................................................................ 90 Area F: Technology – Upper Division Elective: 58 Courses ............................................ 90
B. Looking Forward: Strategic Thinking ........................................................................... 96
December 18, 2015 General Education Program Review, California Polytechnic State University 4
I. Introduction
A. General Education History and Description of GE 2001 Cal Poly’s General Education Breadth (GEB) program is mandated by the California State University (CSU) Board of Trustees education code (Title V of the California Code of Regulations, Section 40405). These breadth requirements are “intended to establish a common understanding of the minimum requirements for CSU GE Breadth.” In order for students to become “truly educated persons” they: (a) will have achieved the ability to think clearly and logically, to find and critically examine information, to communicate orally and in writing, and to perform quantitative functions; (b) will have acquired appreciable knowledge about their own bodies and minds, about how human society has developed and how it now functions, about the physical world in which they live, about the other forms of life with which they share that world, and about the cultural endeavors and legacies of their civilizations; (c) will have come to an understanding and appreciation of the principles, methodologies, value systems, and thought processes employed in human inquiries. It is the intent of this section that the general education-breadth requirements be planned and organized in such a manner that students will acquire the abilities, knowledge, understanding, and appreciation suggested as interrelated elements and not as isolated fragments. Following development of the education code, the CSU then created a GEB pattern in Executive Order (EO) 338 and 342 in 1981, creating one pathway. In 1992, a new EO 595 regarding GE was approved which allowed for alternative pathways and reciprocity for lower-division GE between CSU campuses. EO 595 also requested each campus to establish its own requirements within its framework, and to establish a broadly representative standing committee, a majority of which shall be instructional faculty, to provide for appropriate oversight. At Cal Poly, prior to EO 595, an Academic Senate standing committee was overseeing General Education. This structure did not appear to promote adequate coordination between faculty and GE courses across campus. The new EO 595 emphasized that GEB should be a strong and coherent program so at Cal Poly the Academic Senate established a task force to review our GE program and make recommendation for revisions. The task force developed two resolutions including: a new GEB model of unit distribution, which was approved by the Academic Senate in March 1997 (AS-478-97), and a revision of the GE administrative structure (AS-472-97, February 1997). A new GE model of unit distribution was approved by the Academic Senate in March 1997. (AS-478-97). The guiding principles of the new GEB model included: making information competency and technology an educational outcome of the university curriculum; the GE Committee to pursue development of interdisciplinary core courses spanning more than one category; U.S. Cultural Pluralism to be infused appropriately throughout the program; global and
December 18, 2015 General Education Program Review, California Polytechnic State University 5
international issues to be integrated appropriately into GE; and implementation of flexibility and creativity. The new administrative structure was designed to ensure that the GEB program is a university level program with strong leadership. The GEB program is the administrative responsibility of the GEB Committee, which should run similar to a department. “The GEB Committee, after appropriate consultations with affected units, makes curricular and programmatic recommendations to the Academic Senate via the Provost. The Provost submits the GEB proposals to the Academic Senate for review and recommendations. The ultimate decision and responsibilities for the GEB program, as with any program, lie with the president” (AS-472-97). The GEB committee membership was composed of a director and eight faculty members, two from the College of Science and Mathematics, two from the College of Liberal Arts, and one from each of the four professional colleges. The Provost appointed GEB members after consultation with the Academic Senate. The Provost appointed the director after solicitation of nominations and applications and consultation with the GEB Committee and the Academic Senate. Three GEB Subject Area Committees were also established and modified by the GEB Committee for the purpose of advising the committee on courses and programs within each area, and to review courses and programs already in place. These committees were (1) Arts and Humanities, (2) Science, Mathematics and Technology, and (3) Social and Behavioral Sciences. After the GEB committee and GEB subcommittees were created, new guidelines were developed for reviewing new general education proposals (approved by Academic Senate in June 2000, GE 2000, AS-50498/GE). Each GE subarea was redefined in terms of educational objectives and criteria. In addition, a clearer distinction was made between lower-and upper-division courses, with 100- and 200-level courses providing a foundation for the 300-level courses. As stated in the “Program Goals” on the GE Website: Lower-division coursework in Areas A-D has been designed to give students the knowledge and skills to move to more complex materials. The three-course Communications sequence, for example, provides instruction and practice in the kinds of skills in writing, speaking, and critical thinking that students will need in later courses. (Consequently, students are expected to complete this sequence during their first year, and by no later than the end of their sophomore year.) By the end of the sophomore year, students should also complete lower-division courses in Science and Math, Arts and Humanities, and Society and the Individual. As part of the GE revision, student writing was made a component of all GE courses, while courses in certain subareas were designated as “writing-intensive.” While the writing component may take different forms according to the subject matter and the purpose of a course, at least 10% of the grade in all GE courses must be based on appropriate written work. Writing Intensive courses are located in Areas A1, A3, C1, C2, C4, and D5. These courses include a minimum of 3000 words of writing and must base 50% or more of a student's grade on written work.
December 18, 2015 General Education Program Review, California Polytechnic State University 6
The GE Program was also reduced from 79 to 72 units, and all courses were converted to four units. In Fall 2001, the revised GE Program was implemented and has now been in existence for fourteen years (called GE 2001). In 2009-2010, an Academic Senate GE task force developed a governance proposal, which the senate adopted as AS-713-10 Resolution on the Establishment of an Academic Senate General Education Governance Board (GEGB). The resolution outlined the structure of the new committee, stating that it would be comprised of two faculty members from the College of Liberal Arts (CLA), two faculty members from the College of Science and Math (COSAM), one faculty member from each of the remaining colleges, one student representative, and one representative from Professional Consultative Services — all of whom are voting members and serve a three-year term. The Provost, following a recommendation from the Academic Senate Executive Committee and the GEGB, appoints the GEGB chair; the chair serves a four-year term and has a tie-breaking vote only. The GEGB also includes one representative each from the Office of the Registrar and Academic Programs and Planning (both ex-officio, non-voting). A second task force was formed in 2010-11 to assess the 2006 GE Program Review document and delivered a General Education task force report (PDF) to the Academic Senate Executive Committee, which was never adopted by the senate. Recommendations in the report concerned GE advising, writing, assessment, credit for courses in foreign languages, sustainability, and United States Cultural Pluralism requirement. In spring 2011, the GEGB officially formed; in fall 2011, the GEGB began meeting weekly. Initially, it reviewed the recommendations from the 2006 program review and the comments from the 2010-2011 task force. During 2011-2014, the GEGB continued to make progress on the action plan, with sensitivity to campus-wide as well as CSU-wide developments. Shortly after its formation, the GEGB developed a proposal to make changes to the GEGB policy, which the senate adopted as AS-740-12. The resolution specified that the Associate Vice Provost of Academic Programs and Planning (now Vice Provost) be responsible for some of the administrative GE tasks that had previously been part of the GEGB duties and that the GEGB focus on curricular issues. CSU Requirements: At the CSU level, Executive Order (EO) 595—implemented in 1992—was replaced with EO 1065 in 2011. Executive Order 1065 provides for distribution between five subject areas and a recommended minimum number of units within each area, “campus faculty have primary responsibility for developing and revising the institution’s particular general education program. Within the CSU General Education Breadth distribution framework, each CSU campus is to establish its own requirements and exercise creativity in identifying courses, disciplines, and learning outcomes” (Article 6.2.1 Development and Revisions of Campus Requirements, EO 1100). “Each campus is authorized to make reasonable adjustments in the number of units assigned to any of the five required distribution areas.”
December 18, 2015 General Education Program Review, California Polytechnic State University 7
Each campus was encouraged to “define its GE student learning outcomes, to fit within the framework of the four Essential Learning Outcomes drawn from the Liberal Education and American Promise (LEAP) campaign, an initiative of the Association of American Colleges and Universities.” The GE Program Outcomes and Criteria have since been aligned with LEAP outcomes. In March 2015, EO 1065 was replaced with EO 1100, but the revisions to the document were minimal and focused on simplifying the characterization of learning expected in Area D Social Sciences (Appendix A). Cal Poly’s GE Distribution Areas are as follows: Area A: Communication
A1: Expository Writing A2: Oral Communication
A3: Reasoning, Argumentation, and Writing Area B: Science and Mathematics B1: Mathematics and Statistics
B2: Life Sciences B3: Physical Science B4: Lab Experience B5: Science and Mathematics Elective (GE Credit Option for College of Liberal Arts, Liberal Studies, and Liberal Arts & Engineering Students) B6: ABET Engineering Courses in Science and Mathematics
Area C: Arts and Humanities C1: Literature C2: Philosophy C3: Fine and Performing Arts
C4: Arts and Humanities Upper-Division Elective C5: Arts and Humanities Elective (GE Credit Option for students in CAED, CAFES, COSAM, OCOB) Area D/E: Society and the Individual D1: The American Experience D2: Political Economy
D3: Comparative Social Institutions D4: Self-Development (CSU Area E) D5: Society and Individual Upper-Division Elective
Area F: Technology – Upper Division Elective
December 18, 2015 General Education Program Review, California Polytechnic State University 8
The colleges have slightly different unit distributions to accommodate their majors. For instance, the College of Engineering (CENG) requires students to complete 28 units of Science and Mathematics, whereas the College of Liberal Arts (CLA) requires 20 units and the remaining colleges require 16. On the other hand, CENG only requires four units of upper-division GE, while the other colleges require twelve. A full breakdown of GE unit distribution for each college can be seen in (Appendix B).
B. Programmatic Purpose and Strategic Direction
1) Mission Statement In 2011, the GEGB developed the General Education Mission Statement:
The General Education Program is one of the primary sites for realizing Cal Poly's vision of a comprehensive polytechnic education. The program promotes an understanding and appreciation of the foundational disciplines that ground all intellectual inquiry. It enriches the specialized knowledge acquired in a major program with an understanding of its scientific, humanistic, artistic, and technological contexts. The program imparts knowledge and transferable skills, fosters critical thinking and ethical decision making, supports integrative learning, and prepares students for civic engagement and leadership.
In Spring 2015, the mission statement was updated and revised by the GEGB to better reflect the committee’s vision for GE (revisions are in red):
The General Education Program is one of the primary sites for realizing Cal Poly’s vision of a comprehensive polytechnic education. GE promotes an understanding and appreciation of the foundational disciplines that ground all intellectual inquiry. It enriches the specialized knowledge acquired in a major program with an understanding of its scientific, humanistic, artistic, and technological contexts. The program imparts knowledge and transferable skills, fosters critical thinking and ethical decision making, supports integrative learning, and prepares students for civic engagement and leadership.
General Education courses should serve all Cal Poly students. GE courses provide an opportunity for students to work with peers from diverse intellectual and disciplinary backgrounds to develop habits of mind that complement their chosen field of study. GE courses help students reach across disciplines to provide them with a breadth of experiences. http://ge.calpoly.edu/content/learning-objectives-and-criteria#mission
The GEGB believes the revised statement more clearly articulates the purpose of and philosophy behind GE courses on Cal Poly’s campus. Overall, the mission statement illustrates how Cal Poly’s GE program contributes to the “comprehensive polytechnic” education that students receive. The GE program seeks to enable students to connect their own majors to other disciplines, as well as explore areas of study that simply interest them. Moreover, GE courses
December 18, 2015 General Education Program Review, California Polytechnic State University 9
give students an opportunity to learn from and collaborate with students who are developing very different areas of expertise and who may have perspectives and life experiences that differ greatly from their own. 2) GE Program Goals
As part of this self-study, the GEGB also devised program goals that are intended to bring further cohesion to the program. The GEGB believes these goals often influence our decision-making and discussions, but have not been explicitly articulated to the university community. These goals have been posted on the GEGB website.
Cal Poly's GE Program seeks to:
• Promote connections between the GE Areas so students and faculty perceive GE courses as interrelated rather than as isolated fragments.
• Place foundational knowledge in a larger context such that every GE course provides a vision of how its subject matter is an important component of General Education.
• Help students understand the value of a discipline being studied as well as its relationship to their majors.
• Support faculty who teach GE courses.
C. Progress Update on Previous Program Review The suggestions made in the 2006 GE Program Review are below. An update follows each recommendation. Faculty and Administrative Perceptions Help faculty and students alike better understand the value of General Education at Cal Poly, instead of regarding GE as a distraction from major courses. GE should be conceptualized as a resource for learning foundational skills and concepts that provide the groundwork for learning in the academic major. Update: From 2007-2010, the General Education office initiated a communication plan directed at students to promote the value of General Education. Brochures and flyers were created and distributed through both of Cal Poly’s first-year student orientation programs. In addition, staff from the GE office worked closely with the Advising Council to promote the value of both GE and advising on campus through joint promotional brochures as well as campus events. The GE staff also developed a GE faculty brochure that was sent to all departments and new faculty each year. The printed brochure featured the GE web site, the Writing in Generally Every Discipline (WINGED) program that was designed to provide faculty with approaches for responding to student writing (an element now handled by our Center for Teaching, Learning, & Technology (CTLT)), as well as a database of all GE course proposals.
December 18, 2015 General Education Program Review, California Polytechnic State University 10
When the University Learning Objectives (ULOs) were created in 2007, GE adopted the ULOs and implemented efforts to unite the campus around the ULOs. Efforts included the development of a ULO web site (ulo.calpoly.edu), development of a ULO video shown to first-year students, and other promotional materials distributed on campus. Yet, the GEGB would be the first to acknowledge that GE still suffers from a “perception problem” on our campus. It seems that some faculty still regard GE courses as an impediment to their students’ “progress to degree.” Efforts to communicate with faculty, students, and advisers continue today. Since the WINGED program is no longer active, the GEGB chair coordinates closely with the campus’s CTLT, which offers professional and pedagogical development opportunities to faculty across campus. The chair contacted new faculty in fall 2015 to share with them information about the GE program. This kind of outreach has been difficult to sustain over the past few years with growing faculty workloads, but the GEGB is committed to developing further avenues for outreach. Faculty perceptions will be explored further in the self-study by discussing results from both the GE faculty survey administered in 2013 and the WASC faculty survey administered in 2009 as part of Cal Poly’s accreditation. (See Section IIIC: Faculty Perceptions.) Administrative Support for Assessment Provide consistent administrative support for General Education assessment. Moreover, the Provost, deans, chairs, faculty and governance leaders could make a public commitment to GE and assessment as well as commit resources for those willing to assume leadership roles in assessment. Update: ULO Project: Between 2008 and 2011, the University Learning Objective (ULO) assessment project was developed and coordinated by then-Director of General Education, Doug Keesey, with the support of Academic Programs and Planning. The project marked a collaborative effort to define measurable outcomes for the ULOs and to directly assess student attainment of these outcomes. Although the individual assessments reached various stages of completion, the project as a whole aimed to measure “value added” progress as students moved from foundational courses to mastery-level courses, and, where possible, to close the loop by recommending improvements to pedagogy and curriculum. The ULO project began with the appointment of five faculty members as ULO consultants who were recommended by college deans, and who each focused on a different ULO-based skill: writing, oral communication, diversity learning, lifelong learning, and ethics. Each consultant formed a broadly representative committee composed of faculty members representing GE and various majors across the university, as well as staff members from Student Affairs. After reviewing nationwide best practices, two committees (Writing and Oral Communication) reviewed student essays, and three committees (Diversity Learning, Lifelong Learning, and Ethics) developed survey/test instruments to collect essay/multiple-choice responses. The Diversity Learning committee also used focus groups to explore student attitudes toward
December 18, 2015 General Education Program Review, California Polytechnic State University 11
diversity. Each committee developed rubrics to identify traits and articulate levels of development. The committees intended to use student work from lower-and upper-division GE as well as major courses to determine first-year/sophomore and junior/senior levels of attainment and thereby measure the value added during a Cal Poly education. Writing has been assessed twice at the foundational and mastery levels, thereby giving the university comparative data to work with. After collecting and interpreting the assessment data, the committees made recommendations for educational improvement. The complete ULO report was included in Cal Poly’s Student Learning section of the WASC Educational Effectiveness Review report submitted to WASC in January 2012. There were several endorsements to continue the ULO assessment project in the “Recommended Action Items” of the report. In order to engage faculty in the assessment results, workshops were sponsored by the CTLT on ULO-based assessment for oral communication, as well as writing and critical thinking in the senior project. The ULO assessment results will be discussed in Section IIIA: Assessment Plans and Results of this self-study. In 2011-12, funding for the ULO project was suspended due to state, system, and university budget constraints, thereby necessitating a review of all resource allocations, including faculty release time for the ULO consultants. Though faculty from across disciplines participated in the entire ULO project, the administration was concerned that the ULO project should achieve even greater “shared governance.” During the WASC Capacity and Preparatory Review (CPR) and the following Educational Effectiveness Review (EER), the following resolutions were passed by the Academic Senate to provide Academic Senate oversight and structure for university assessment efforts on campus.
1. AS 716-10: Resolution on Academic Assessment at the Program and University Levels clarified the meaning of the use of assessment, and established senate oversight for institutional assessment.
2. AS 735-11: Resolution on Coordinated Campus Assessment Efforts approved a task force report that recommended revising Academic Council membership to include faculty from each college and reaffirmed the council’s responsibility for planning and coordinating institutional assessment efforts like the ULO project.
Cal Poly has a clear assessment timeline that it has been following closely (Appendix C). As you can see from the timeline, Critical Thinking was assessed during AY 2013-2014, and writing was assessed in 2014-2015. Assessment results can be found in Section IIIA: Assessment Plans and Results. Quantitative Learning will be assessed in AY 2015-2016. Program Review: Academic Programs and Planning has revised the program review process and now asks programs to map the alignment of their program learning outcomes to the University Learning Outcomes (ULOs). In addition, a mapping of the GE program learning outcomes (PLOs) to the (ULOs) is provided. Programs are then asked to reflect upon the degree to which the combination of both PLOs and GE PLOs fulfill the ULOs.
December 18, 2015 General Education Program Review, California Polytechnic State University 12
Integrated Assessment: As an experiment in the assessment of transferable skills across GE and the major, faculty members from GE and the Orfalea College of Business (OCOB) developed a pilot program using “Integrated Program Review” in spring 2009. They applied the University Expository Writing Rubric to the work of business students and used the assessment results to discuss how to improve student attainment of the ULO on effective communication. The group identified a number of opportunities for strengthening student writing. This integrated model is now being repeated with writing assessment across campus, which is in its second phase. The assessment coordinators, Matt Luskey, CTLT Writing Consultant, and Dawn Janke, Director of the University Writing and Rhetoric Center, have partnered with departments for assessing their students’ writing skills in fall 2015. More specifically, individual departments interested in working with the assessment coordinators will use an “embedded” approach to assessing senior-level writing. These results will be added to the data generated from collecting writing samples from upper- and lower-level GE Writing Intensive Classes. The data from this effort have not yet been made available, but the assessment plan can be found in section IIIA: Assessment Plans and Results. In 2012, a new University/GE Assessment plan incorporated the five WASC core competencies (critical thinking, written communication, quantitative reasoning, oral communication, and information literacy). Moreover, in spring 2014, Academic Senate Assessment Council approved the assessment plan. The goal of the plan is to measure student learning at the University level with an independent process that parallels program-level efforts. The plan has been implemented with support and funding from the Provost’s Office. As part of this effort, critical thinking was assessed during AY 2013-2014. The results have been included in Section IIIA: Assessment Plans and Results. Learning Outcomes Develop program-wide learning outcomes that focus on what students should learn by taking GE courses. In 2014, the General Education Governance Board developed and approved the GE Program Learning Objectives (PLOs). Presentations on the PLOs were made to both the Academic Senate Executive Committee and the Academic Senate. The development of the PLOs affirms the GE Program’s role as “central and vital to each student’s university experience.” In creating the PLOs, the committee worked not to duplicate the ULOs, but rather to complement and work alongside them. In some respects, the PLOs can be seen as somewhat aspirational as we work to further develop and rethink our GE program. It’s unlikely that one class will cover all seven PLOs, but the program itself will. The GE program is necessarily dynamic and the PLOs should represent that element.
December 18, 2015 General Education Program Review, California Polytechnic State University 13
GE PLOs: GE PLO 1: Construct and critique arguments from a logical perspective. GE PLO 2: Use appropriate rhetorical strategies to connect with diverse audiences through oral,
written, and visual modes of communication. GE PLO 3: Address real-world problems by demonstrating broad disciplinary knowledge, skills,
and values in arts, humanities, sciences, and technology. GE PLO 4: Understand the value of a general education in relation to a major course of study. GE PLO 5: Collaborate with people of different backgrounds, values, and experience. GE PLO 6: Evaluate global and local issues and their impact on society. GE PLO 7: Use intention and reflection to develop and improve one’s own learning. In Spring 2015, as part of the GE self-study, the GEGB began mapping the GE courses onto the PLOs (Appendix D). This mapping project will help us better understand the frequency with which the seven PLOs are met, information that will help the GEGB work with faculty to develop GE courses. In other words, if a PLO is seldom addressed in GE courses, we can make a concerted effort to build that focus into the appropriate classes. Assessment Implement systematic assessment of the GE Program and close the loop on each assessment study. GE leaders should conduct an assessment audit to identify potential sources of assessment evidence. Update: While assessment was discussed briefly above, please see Section IIIA: Assessment Plans and Results for more detailed reports on systematic GE and University assessment efforts. Closing the loop on GE assessment continues to be challenging, but we are making progress on this front. Part of the challenge can be attributed to the position of the GE program in the university. GE courses are dispersed across the disciplines, and coordinating the many faculty and departments responsible for the courses has proven difficult. For instance, the program and university struggle to share assessment results such that faculty can let the data inform their courses. In short, there is a disconnect between the assessment data and the GE classes themselves, as well as a disconnect between the faculty coordinating the assessment efforts and the instructors teaching the courses (see Section III C for data on the faculty who teach GE courses). However, an awareness of these shortcomings is helping us develop better communication with faculty who teach GE courses. Further, Academic Programs and Planning is making a concerted effort to share assessment data with faculty and administrators across Cal Poly. For instance, Academic Programs and Planning
December 18, 2015 General Education Program Review, California Polytechnic State University 14
brought two guest speakers to campus in fall 2014 to begin closing the loop on the previous year’s critical thinking assessment efforts. The two-day event focusing on critical thinking was led by Peter Facione and Carol Ann Gittens, leading experts on critical thinking and co-authors of the college textbook Think Critically. In both a keynote presentation and a series of workshops, Facione and Gittens worked with participants to consider approaches to making critical thinking an intentional and explicit component of their courses. In addition, the Composition Program, in collaboration with Academic Programs and Planning, the CTLT, and the University Writing & Rhetoric Center, brought Dan Melzer, Writing Director at UC Davis, to campus for two days in May 2015. For his most recent book, Assignments Across Curriculum: A National Study of College Writing, Melzer studied more than 2,000 writing assignments from 100 universities and colleges to identify patterns in the assignments students regularly encounter. In both a keynote and two faculty workshops, Melzer worked directly with Cal Poly’s critical thinking assessment data to help faculty consider the role of critical thinking in their assignments. Over sixty people participated in the events. Some faculty have already begun revising their assignments to offer students more clearly articulated objectives. The CTLT also organized follow-up workshops to help faculty integrate critical thinking into their courses more explicitly. Moreover, faculty who teach the GE A3 classes (shared by Philosophy, English, and Communication Studies) met last fall to discuss the goals of the courses, which have a concerted focus on critical thinking. Discussions will continue in AY 2015-2016. The GEGB Chair is an active member of the Academic Senate Assessment Council. She works with the council to review and understand the results of NSSE, BSSE, and FSSE and makes recommendations to add appropriate questions to this national survey data. Questions on GE were also included in Cal Poly’s 2009 WASC Capacity Preparatory Review as part of the senior project survey in 2009.
GE Course Proposals Encourage faculty from all colleges to develop or revise courses that can be added to the GE curriculum.
Update: During the AY 2014-2015, the GEGB reviewed GE course proposals for the 2015-2017 catalog. We reviewed a total of 76 course proposals—39 edited/deleted courses and 37 proposals for new courses. (A full list of courses under review can be found in (Appendix E). In total, the GEGB approved 94.6% of proposals for new courses and course modifications. A fuller discussion of the course review process can be seen below in Section IIB. The GEGB chair and, when necessary, the GEGB college representatives, consult with proposers as they develop their courses. The GEGB chair is also working to provide faculty with model proposals that can guide them as they develop new GE courses. Collaborating with the CTLT will also be key in this effort.
December 18, 2015 General Education Program Review, California Polytechnic State University 15
GEGB Representation Add representation by the College of Education and non-teaching staff, such as Student Affairs and library representatives, to the GE Governance Committee. Update: Based on the AS 713-10, the GE Governance Board has added a representative from Professional Consulting Services (PCS) and Associated Students Inc. Representatives from Student Affairs or the Library have not been added. GE Course Review Create a process to ensure the integrity of the GE courses is maintained after the courses have been approved. Update: Currently, the GEGB does not have a mechanism by which a previously approved GE course is reviewed. Once a course is approved, the proposal is seldom revisited by the proposer, the department, or the GEGB. However, the GEGB recognizes that course content and pedagogical approaches necessarily shift over time and existing courses can fall out of currency. As part of our self-study, the GEGB drafted a proposal for a “GE Course Renewal” process, which will bring accountability into the GE program by ensuring that courses continue to meet the GE Learning Outcomes and Criteria for which the courses were approved. This process is not intended to question the integrity of the faculty or the courses they design and teach. Rather, “GE Course Renewal” ensures that the GE program is cohesive and current for faculty and students alike. Moreover, the process will give faculty and departments an opportunity to revisit their courses. The GEGB hopes to build a collaborative relationship with the faculty who support the GE program to document the educational effectiveness of all GE courses. A full discussion of the GE Renewal Process can be found in Section IIA: Programmatic Components and Section IV: Conclusions. It should also be noted that all faculty are provided with access to a centralized GE database (PolyLearn, Cal Poly’s course management platform) that archives all GE course proposals. When faculty are assigned to teach GE courses, they should be encouraged by department chairs to refer to the learning objectives and criteria for the course and to post them in their syllabi. GE Prerequisites Consistently enforce GE prerequisites. Update: Prerequisites were consistently enforced with the 2011-2013 catalog through assistance from the departments and the Office of the Registrar. Prerequisites are now enforced electronically through the campus’s course management system. The GEGB recently noted some inconsistences with pre-requisites in some GE Areas and is working with the Registrar to address the issue.
December 18, 2015 General Education Program Review, California Polytechnic State University 16
II. Programmatic Components
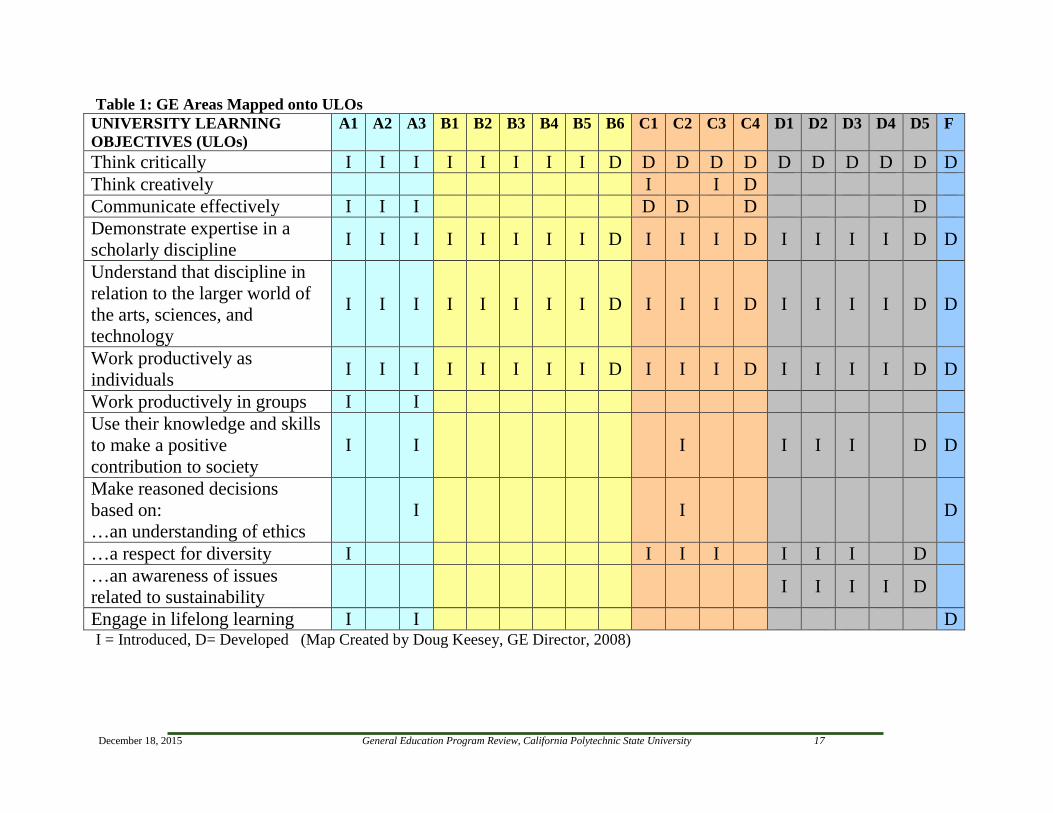
A. General Education and University Learning Objectives (ULOs) Mapping In 2008, then-GE Director Doug Keesey mapped GE Areas onto the recently developed ULOs to foster a sense of sharing educational objectives among GE and department faculty. The following table illustrates where the University Learning Objectives are introduced (I) and developed (D) in the General Education Areas. More specifically, foundational 100- and 200-level GE classes introduce students to skills/concepts, which they continue to develop in upper, 300-level classes. The map is intended to support departments as they map their own curriculum for program review. As the map reveals, the GE program introduces and helps students further develop facility in the ULOs, but is not intended to result in mastery. Rather, the major programs will aid students in cultivating mastery while also developing disciplinary expertise.
December 18, 2015 General Education Program Review, California Polytechnic State University 17
Table 1: GE Areas Mapped onto ULOs UNIVERSITY LEARNING OBJECTIVES (ULOs)
A1 A2 A3 B1 B2 B3 B4 B5 B6 C1 C2 C3 C4 D1 D2 D3 D4 D5 F
Think critically I I I I I I I I D D D D D D D D D D D Think creatively I I D Communicate effectively I I I D D D D Demonstrate expertise in a scholarly discipline I I I I I I I I D I I I D I I I I D D
Understand that discipline in relation to the larger world of the arts, sciences, and technology
I I I I I I I I D I I I D I I I I D D
Work productively as individuals I I I I I I I I D I I I D I I I I D D
Work productively in groups I I Use their knowledge and skills to make a positive contribution to society
I I I I I I D D
Make reasoned decisions based on: …an understanding of ethics
I I D
…a respect for diversity I I I I I I I D …an awareness of issues related to sustainability I I I I D
Engage in lifelong learning I I D I = Introduced, D= Developed (Map Created by Doug Keesey, GE Director, 2008)
December 18, 2015 General Education Program Review, California Polytechnic State University 18
B. General Education Program Learning Objectives
The General Education program is central and vital to each student's university experience. Thus, the GE Program strives to integrate the University Learning Objectives into the GE Curriculum for students.
The General Education Program Learning Objectives (PLOs) were developed by the GEGB during the 2013-2014 AY in response to recommendation from two previous program reviews. While the PLOs are listed earlier in the self-study, it could be useful to include them again here. GE PLOs: All Students who complete an undergraduate education at Cal Poly should be able to: PLO 1: Construct and critique arguments from a logical perspective. PLO 2: Use appropriate rhetorical strategies to connect with diverse audiences through oral,
written, and visual modes of communication. PLO 3: Address real-world problems by demonstrating broad disciplinary knowledge, skills,
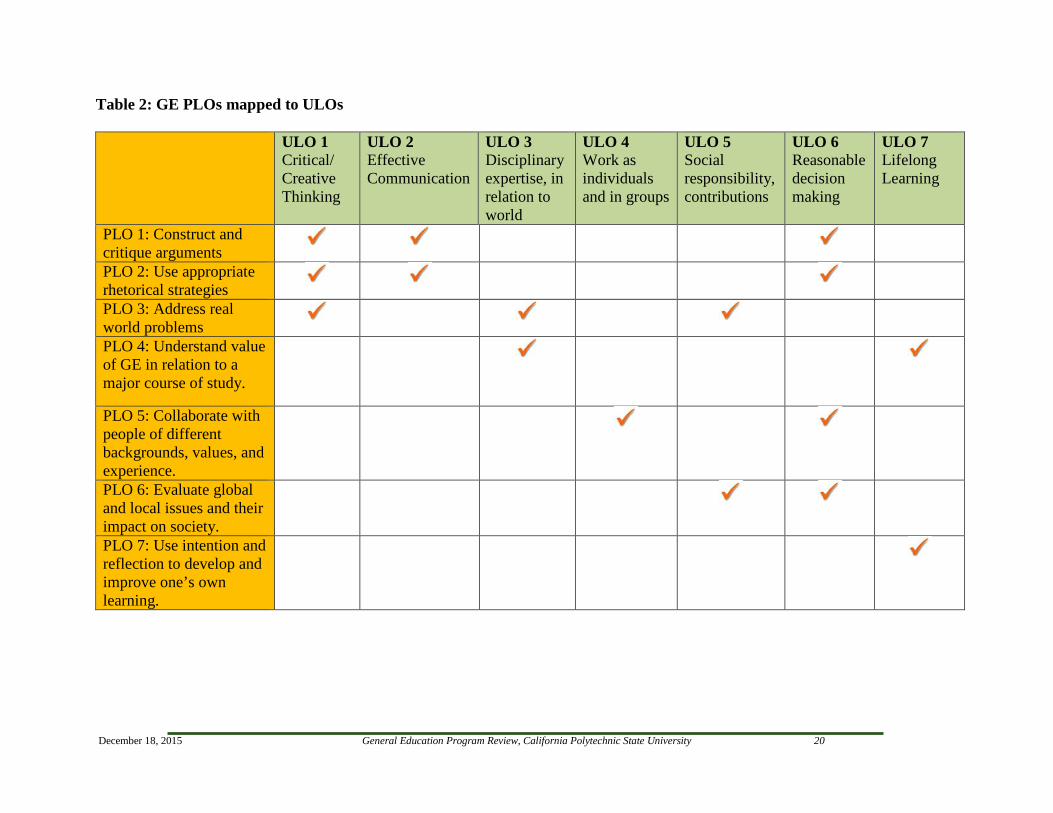
and values in arts, humanities, sciences, and technology. PLO 4: Understand the value of a general education in relation to a major course of study. PLO 5: Collaborate with people of different backgrounds, values, and experience. PLO 6: Evaluate global and local issues and their impact on society. PLO 7: Use intention and reflection to develop and improve one’s own learning. GE PLOs mapped onto the University Learning Objectives As the GE PLOs were developed, the GEGB worked to align them with the University Learning Objectives (ULOs) without fully replicating them. The mapping helped to illustrate both the unique qualities of the GE program and the ways in which the program contributions to the university’s comprehensive polytechnic identity. When students graduate from Cal Poly, they should be able to: ULO 1: Think critically and creatively ULO 2: Communicate effectively ULO 3: Demonstrate expertise in a scholarly discipline and understand that discipline in relation
to the larger world of the arts, sciences, and technology ULO 4: Work productively as individuals and in groups
December 18, 2015 General Education Program Review, California Polytechnic State University 19
ULO 5: Use their knowledge and skills to make a positive contribution to society ULO 6: Make reasoned decisions based on an understanding of ethics, a respect for diversity,
and an awareness of issues related to sustainability ULO 7: Engage in lifelong learning
December 18, 2015 General Education Program Review, California Polytechnic State University 20
Table 2: GE PLOs mapped to ULOs
ULO 1 Critical/ Creative Thinking
ULO 2 Effective Communication
ULO 3 Disciplinary expertise, in relation to world
ULO 4 Work as individuals and in groups
ULO 5 Social responsibility, contributions
ULO 6 Reasonable decision making
ULO 7 Lifelong Learning
PLO 1: Construct and critique arguments
PLO 2: Use appropriate rhetorical strategies
PLO 3: Address real world problems
PLO 4: Understand value of GE in relation to a major course of study.
PLO 5: Collaborate with people of different backgrounds, values, and experience.
PLO 6: Evaluate global and local issues and their impact on society.
PLO 7: Use intention and reflection to develop and improve one’s own learning.
December 18, 2015 General Education Program Review, California Polytechnic State University 21
C. General Education Curriculum The Cal Poly GEGB is charged with ensuring that our GE Program complies with the goals and policies established in CSU EO 1100 (Appendix A). However, the CSU Chancellor’s Office allows room for each campus to develop a GE Program that addresses the unique needs and interests of its students. For instance, Cal Poly developed its own Area F: Technology to meet the needs of a polytechnic campus. General Education Requirements
• All Cal Poly students are required to take 72-quarter units of General Education. • A minimum of 12 units is required in residence. • A minimum of 12 units is required at the upper-division level (8 units upper-division for
Engineering Programs). • Double Counting Lower-Division: Some majors indicate specific GE courses to fulfill
both GE and major and support requirements (These are listed in the major's curriculum display).
• Double Counting Upper-Division: Courses from a student’s major department may not be used to fulfill upper-division Arts & Humanities (C4) or upper-division Society and the Individual (D5).
• All GE courses are 4 units unless otherwise indicated. The course requirements for the different disciplines are shown in (Appendix B). Lower- and Upper-Division Courses Each General Education “Area” has clear Learning Objectives and Criteria, (Appendix F). Perhaps most significantly, GE distinguishes between lower-division, foundational courses and upper-division courses. As part of the GE self study, the GEGB discussed the difference between the depth and breadth of 100- and 200-level courses, and 300-level courses. This distinction can sometimes seem somewhat nebulous, but it’s especially important for faculty submitting GE course proposals to consider. The committee regards “foundational courses” in Areas A-D as giving students the knowledge and skills to move to more complex concepts and ideas. The three-course Communications sequence (GE A1, A2, A3), for example, provides instruction and practice in writing, speaking, and critical thinking, skills students will build on in later courses. (Consequently, students are expected to complete this sequence during their first year, and by no later than the end of their sophomore year.) By the end of the sophomore year, students should also complete lower-division courses in Science and Math (Area B), Arts and Humanities (Area C), and Society and the Individual (Area D/E). Students should complete all foundational courses as early as possible. Upper-Division GE courses (300-level) should build on the content and skills introduced and developed in foundational courses. Students should begin these courses after completing the foundational prerequisites.
December 21, 2015 General Education Program Review
22
Writing Intensive GE Courses All General Education courses must have a writing component. In achieving this objective, writing in most courses should be viewed primarily as a tool of learning and knowledge-making, one that helps students engage with content in deeper and more complex ways. The GE program has a “writing to learn” philosophy where students learn to better understand themselves as writers while using writing to interrogate their own assumptions, claims, experiences, and even beliefs. Writing is regarded as a complex rhetorical task that requires a facility with language and as well as an ability to account for an audience’s expectations and values. Faculty teaching Writing Intensive (WI) courses are expected to provide feedback to students about their writing to help them grasp the effectiveness of their writing in various disciplinary contexts. The GE Program is committed to providing resources to support GE faculty who may not be accustomed to teaching writing. Nevertheless, there is some reluctance on the part of some faculty to fully embrace this element of GE, perhaps because they do not feel comfortable teaching writing, they privilege other course content, assessing writing is time-consuming, and/or because class caps are simply too high. Most WI upper-division GE classes are capped at 30, which is already rather high, while some classes have grown to 60+ students. The GEGB will be the first to admit that it has been difficult to determine exactly how much and what kind of writing is assigned in GE classes. At present, the GE program lacks a mechanism for ensuring the WI requirement is being met in GE classes. Ultimately, the GEGB has to trust that the programs responsible for offering GE courses will enforce the WI requirement. While the WI requirement is frequently met, it is not consistently met. In effect, the GEGB would like to make “reporting out” a regular feature of teaching in the GE program. For instance, if a GE class is required to devote a certain percentage of a student’s grade to writing (10%, for instance), it shouldn’t be difficult for departments to demonstrate how the requirement is being met. At the same time, a WI class should move beyond simply assigning writing; instruction in writing should also be a component of the course. The GE Course Renewal Process will help the GEGB better understand whether or not the writing intensive requirements are being met. University and GE writing assessment findings will be discussed in Section III A: Assessment Plans and Results. GE Double Counting While many lower-division GE courses are necessarily specified as support courses (especially in the sciences), students should be able to choose upper-division courses in C4: Arts and Humanities, D5: Society and the Individual, and F: Technology. The upper-division electives in these areas are seen as opportunities for students to explore an interest in depth beyond their majors. Consequently, courses from the student’s Major Department may not be used to fulfill upper-division electives in Areas C4 or D5. Executive Order 1100 indicates that “campuses may permit the ‘double counting’ of courses for General Education Breadth with major requirements and prerequisites only after giving careful consideration to the impact of such actions on the general education programs” (2.2.6.1).
December 21, 2015 General Education Program Review
23
Double counting major classes as GE classes must be handled carefully. For a class to be approved for GE, it must still meet the GE learning objectives and criteria, and it should be made available to students outside the major (thereby giving students a “true GE experience.”) There has been some resistance to these principles, as some majors reduce their unit counts. GE courses tend to look like attractive ways to reduce the number of classes students have to take (instead of reducing major classes). But the GEGB has held firm to its conception of a GE class as it reviews courses proposals. At the same time, the GEGB committee remains open to the guidelines provided by EO 1100, which state programs that should “consider the possibility of incorporating integrative courses, especially at the upper division level, that feature the interrelationships among disciplines and traditional GE categories” (Article 6.2.1.e, EO 1100). Proposing GE Courses Every faculty member at Cal Poly is welcome to propose a course for GE, which could mean that an existing major course is revised for GE or a brand new course is created. Courses are reviewed every two years according to the catalog cycle set by the Registrar’s Office. For the 2014-2015 course review cycle, 37 new courses were proposed for GE and 32 of these were approved by the GEGB. An additional seven courses were deleted from the GE program (usually because the course had been split into multiple courses to better cover content), and 32 courses were modified (the proposers clarified course descriptions, titles, etc.). Rather than turn down course proposals, the GEGB prefers to work with proposers to revise proposals to ensure the courses meet the GE learning outcomes; further, only three proposals that were sent back to the proposers for revisions were not resubmitted (Appendix G. Sample letters the GEGB chair sends to proposers to request revisions). In addition, two revised proposals were submitted after the Registrar’s submission deadline and will be reviewed in the upcoming AY, while one was not resubmitted at all (the proposer indicated that he didn’t have time to re-work the proposal, but hopes to do so for the next catalog cycle). If the GEGB regards a proposal as being too far afield from GE Learning Outcomes and Criteria, the GEGB may select not to approve a course at all, but this happens rarely. Indeed, only four courses were not approved for GE because they were seen as not meeting course objectives. We have also been working to better understand “bottlenecks” in GE Areas and courses by collecting enrollment data from fall 2009 through spring 2015 (Appendices R-T). This information can also be found in Section IIA: Programmatic Components. General Education Curriculum Initiatives The GE Program works to respond to the immediate contexts surrounding it. The program is quite large and has many moving parts, so often it can be difficult to make sweeping change quickly. However, the GEGB regards the GE program as necessarily in flux. The following illustrate moments when the GE program sought to respond to shifts in the ways the campus regards the relationship between GE and the major.
December 21, 2015 General Education Program Review
24
General Education Academic Senate Resolution for GE Area C5, February 2012 This resolution enabled students to receive Area C5: Arts and Humanities credit in courses taught in a language other than English, which was previously not a feature of the GE program (Appendix H). This new policy (as stated in the resolution) provided additional course options to students in CAFES, CAED, COSAM, and OCOB who take four extra units in GE Area C. In effect, GE credit is now offered in intermediate-200 level foreign language courses, which is an important shift for the program, one that enables students to study content from diverse cultural and linguistic contexts. 180-Unit Resolution In January 2013, the CSU Board of Trustees proposed amendments to Title 5 to limit the maximum number of units for a baccalaureate degree to 180 quarter units unless the program was granted an exception. This mandate had the most direct impact on unit-heavy majors, such as those in engineering and architecture. As departments identified ways to trim units, the GE program became one place that programs looked. In particular, some programs sought to “double count” major courses as General Education courses. In response, the GEGB sent a memo to all departments, suggesting “possible ways the programs might be able to take advantage of double-counting courses currently in their curriculum with the GE areas, such as Self-Development (D4) (CSU Area E Life Long Learning and Self-Development) as well as some in Political Economy (D2). The committee saw this as an opportunity for these interested programs to work with colleagues across disciplines/colleges, to create new partnerships for new stand-alone or cross-listed courses as well as collaborate with specific departments to adapt current major or support courses into GE certified options.” As the GE memo made clear, all classes would still need to meet the GE learning outcomes and criteria for a given area. The CSU 180-Unit memo can be found in (Appendix I). The GEGB memo regarding GE Strategies to implement savings of four (4) units can be found in (Appendix J). C4 Junior Status Compliance While reviewing course proposals in Fall 2014, the GEGB noted that some upper-division courses (300-level) require junior status, while some did not. This inconsistency challenged the purpose and role of upper-division courses. Moreover, requiring junior status for upper-division (300-level) courses would bring Cal Poly’s General Education program into compliance with CSU Executive Order 1100. “Section 2.2.3 Upper-Division Requirement” states, “At least nine of these semester units or twelve of these quarter units must be upper-division level, taken no sooner than the term in which upper-division status (completion of 60 semester units or 90 quarter units) is attained.” Our current catalog (2015-2017) requires junior status for all upper-division classes. However, the GEGB understands that this requirement may need to be excused in some circumstances. Individual instructors still have the ability to waive this hard pre-requisite. The GEGB memo regarding upper-division classes can be found in (Appendix K).
December 21, 2015 General Education Program Review
25
GE Course Renewal Presently, new GE course proposals are submitted for review by the GEGB with every new catalog cycle. Once a course is approved, the proposal is seldom revisited. As part of our self-study, the GEGB has drafted a “GE Course Renewal” process to ensure that courses continue to meet the GE Learning Outcomes and Criteria for which the courses were approved. This process is not intended to question the integrity of the faculty or the courses they design and teach. Rather, “GE Course Renewal” ensures that the GE program is cohesive for faculty and students alike. Moreover, the process gives faculty and departments an opportunity to revisit and update courses to demonstrate how the course is currently taught. The GEGB hopes to build a collaborative relationship with the faculty who support the GE program to document the educational effectiveness of all GE courses • The GE Director will be consulting with the Registrar’s Office and the Academic Senate
Curriculum Chair to develop a mechanism for faculty to submit courses for renewal. Ideally, re-reviewing courses may be required of all university courses, not just GE classes. We will spend the next year piloting a review process before rolling it out campus-wide for the next catalog cycle. This process will be quite a shift on campus, but one that we believe is greatly needed. A more complete draft of the renewal process can be found in (Appendix L).
The GEGB has also worked to develop additional curricular flexibility in the following areas: • GE has added a new Area C5 Arts and Humanities elective area (for students in the colleges
of CAED, CAFES, COSAM and OCOB), which opened up 14 new intermediate 200-level foreign language course options in Chinese, French, German, Italian and Spanish.
• GE has added new courses from departments in Architectural Engineering, Construction Management and Landscape Architecture.
• GE has encouraged high-unit majors to submit/revise courses in GE Area D4: Self Development and GE Area D2: Political Economy, allowing departments to take advantage of double-counting courses for GE and the major.
III. General Education Assessment
A. Assessment Plans and Results Background: From fall 2008-2011, the University Learning Objectives (ULO)-based assessment project, a.k.a., the ULO Project, was coordinated by the Director of General Education under the auspices of Academic Programs and Planning. The project marked a concerted effort to define measurable outcomes for the ULOs and to directly assess student attainment of these outcomes. Assessment at Cal Poly aims to measure “value added,” i.e., progress from the first year to the senior year, and, where possible, to close the loop by recommending improvements to pedagogy and curriculum. During the first phase of assessment, the ULOs were assessed, including written communication, oral communication, diversity learning, life-long learning, and ethical reasoning. Excerpted below is the ULO Project section of the University’s WASC Educational Effectiveness Report (EER).
December 21, 2015 General Education Program Review
26
In 2012-13, the ULO Project was succeeded by a new University/GE Assessment plan with a new timeline (Appendix C). The plan, which was approved by the Academic Assessment Council, spans a ten-year period (2012-2022), during which each of the WASC core competencies — critical thinking, writing, quantitative reasoning, oral communication, and information literacy — will be assessed at least once, in conformance with the 2013 WASC Standards. 1) University Learning Objective Based Assessment in GE and the Majors (ULO Project) In fall 2008, the ULO Project began with the appointment of five faculty members as ULO Consultants, each representing a different ULO-based skill: writing, oral communication, diversity learning, lifelong learning, and ethics. Each consultant formed a broadly representative committee composed of faculty members representing GE and various majors across the university, as well as staff members from Student Affairs. After reviewing nationwide best practices, two committees (Writing and Oral Communication) reviewed class assignments, three (Diversity Learning, Lifelong Learning, and Ethics) developed survey/test instruments to collect essay/multiple-choice responses, and one (Diversity Learning) used focus groups to explore student attitudes; all developed rubrics to identify traits and articulate levels of development. The committees intended to use student work from lower- and upper-division GE as well as major courses to determine first-year/sophomore and junior/senior levels of attainment and thereby measure the value added during a Cal Poly education; only three were able to accomplish this goal (Writing, Diversity Learning, and Lifelong Learning). While these assessments are best considered as pilots, the committees have made some modest recommendations for educational improvement based on the evidence collected. The university has already implemented some, most notably workshops sponsored by the Center for Teaching, Learning, and Technology (CTLT) on ULO-based assessment of writing and critical thinking in the senior project. In connection with the ULO Project, Academic Programs and Planning revised the program review process to include the mapping of major courses and co-curricular activities onto the ULOs. Each program identifies where the ULOs are introduced, developed, and mastered in the major curriculum, although programs are not expressly required to consider the GE and major maps together. The intention is to encourage the faculty to locate and address any significant gaps in the students’ education. As an experiment in the assessment of transferable skills across the GE/major divide, faculty members from GE and the Orfalea College of Business ran a pilot of Integrated Program Review in spring 2009. They applied the University Expository Writing Rubric to the work of Business students and used the assessment results to discuss how to improve student attainment of the ULO on effective communication. Though the group identified a number of opportunities for strengthening student writing, the integrated model has neither been repeated nor revisited for unclear reasons. The ULO Project came under some scrutiny during 2011. The financial crisis affecting the state, CSU system, and university has necessitated a review of all resource allocations. The Provost, concerned about the project’s use of faculty release time for the ULO consultants, suspended funding for AY 2011-12. Shared governance was also an issue; the WASC visiting team in its CPR report encouraged the faculty “to invest time in reviewing the role and critical nature of faculty governance in academic decision-making,” while the Provost and Academic Senate Chair have shared a particular concern for faculty governance as it applies to academic assessment.

December 21, 2015 General Education Program Review
27
This concern applied to the ULO Project; while involving a significant number of faculty and staff members as consultants and committee members, the project was still an initiative of Academic Programs and Planning. In AY 2010-11, the Senate responded to this situation and the WASC recommendation by adopting the following resolutions:
• AS-716-10 Resolution on Academic Assessment at the Program and University Levels established Senate oversight for institutional assessment in addition to clarifying the meaning of assessment and the use of assessment results.
• AS-735-11 Resolution on Coordinated Campus Assessment Efforts approved a task force report that recommended revising the membership of the Academic Assessment Council, in its existing form a committee of managers, to include faculty members from each college. The report also affirmed the council’s responsibility for planning and coordinating institutional assessment efforts like the ULO Project.
These resolutions have been implemented in ensuing years. ULO Project 1: Writing To measure value added, the ULO Project on Writing assessed skill attainment at three key educational levels: first-year, 100-level GE composition courses; 200- and 300-level GE writing-intensive courses; and discipline-specific senior courses that emphasize writing. The chair of the ULO Writing Committee was Brenda Helmbrecht, the English Department’s Director of Writing, whose specialty is composition assessment and pedagogy. To obtain a consistent framework, the committee developed the four-point University Expository Writing Rubric based on five traits of effective writing: purpose, synthesis, support, style, and mechanics. The committee examined persuasive essays of four to six pages in length because curricula across all levels and majors emphasize this type of writing using the Writing Rubric (Appendix M.2). Method The committee collected work from 56 class sections that either had a GE designation of “writing intensive” or were taught by faculty members who made writing a priority. In total, the committee collected 1,147 essays. From this pool, the committee randomly selected 272 essays for scoring: 88 from first-year students, 41 from sophomores, 54 from juniors, and 89 from seniors. 153 of the essays were from men (56%), and 119 were from women (44%), which approximates the university’s gender mix. Table 14 shows the sample’s college breakdown. Table 14. Numbers of ULO Project on Writing Participants as a Function of College and Class Year
Class Year CAED CAFES CENG CLA OCOB COSAM TOTAL
First-Year 12 14 33 6 14 8 87
Sophomore 0 7 16 11 4 3 41
Junior 2 13 13 12 8 5 53
Senior 18 7 11 27 3 23 89
TOTAL 32 41 73 56 29 39 270
December 21, 2015 General Education Program Review
28
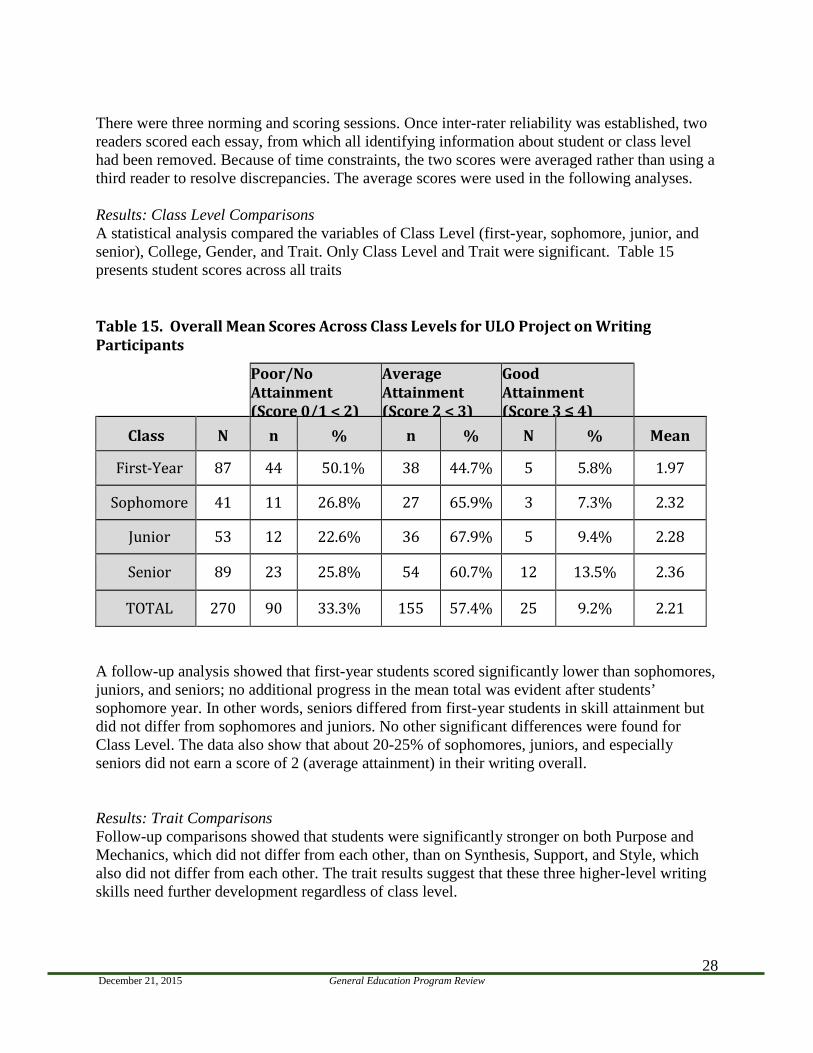
There were three norming and scoring sessions. Once inter-rater reliability was established, two readers scored each essay, from which all identifying information about student or class level had been removed. Because of time constraints, the two scores were averaged rather than using a third reader to resolve discrepancies. The average scores were used in the following analyses. Results: Class Level Comparisons A statistical analysis compared the variables of Class Level (first-year, sophomore, junior, and senior), College, Gender, and Trait. Only Class Level and Trait were significant. Table 15 presents student scores across all traits Table 15. Overall Mean Scores Across Class Levels for ULO Project on Writing Participants
Poor/No Attainment (Score 0/1 < 2)
Average Attainment (Score 2 < 3)
Good Attainment (Score 3 ≤ 4)
Class N n % n % N % Mean
First-Year 87 44 50.1% 38 44.7% 5 5.8% 1.97
Sophomore 41 11 26.8% 27 65.9% 3 7.3% 2.32
Junior 53 12 22.6% 36 67.9% 5 9.4% 2.28
Senior 89 23 25.8% 54 60.7% 12 13.5% 2.36
TOTAL 270 90 33.3% 155 57.4% 25 9.2% 2.21
A follow-up analysis showed that first-year students scored significantly lower than sophomores, juniors, and seniors; no additional progress in the mean total was evident after students’ sophomore year. In other words, seniors differed from first-year students in skill attainment but did not differ from sophomores and juniors. No other significant differences were found for Class Level. The data also show that about 20-25% of sophomores, juniors, and especially seniors did not earn a score of 2 (average attainment) in their writing overall. Results: Trait Comparisons Follow-up comparisons showed that students were significantly stronger on both Purpose and Mechanics, which did not differ from each other, than on Synthesis, Support, and Style, which also did not differ from each other. The trait results suggest that these three higher-level writing skills need further development regardless of class level.
December 21, 2015 General Education Program Review
29
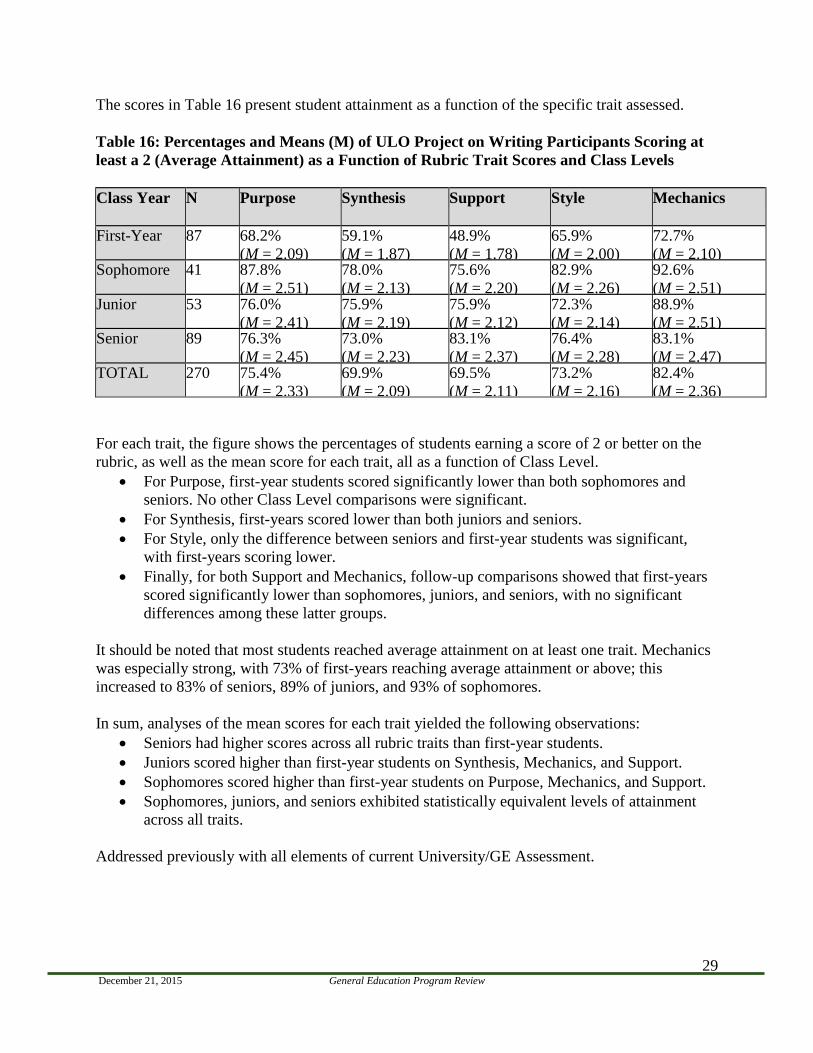
The scores in Table 16 present student attainment as a function of the specific trait assessed. Table 16: Percentages and Means (M) of ULO Project on Writing Participants Scoring at least a 2 (Average Attainment) as a Function of Rubric Trait Scores and Class Levels Class Year N Purpose Synthesis Support Style Mechanics
First-Year 87 68.2% (M = 2.09)
59.1% (M = 1.87)
48.9% (M = 1.78)
65.9% (M = 2.00)
72.7% (M = 2.10)
Sophomore 41 87.8% (M = 2.51)
78.0% (M = 2.13)
75.6% (M = 2.20)
82.9% (M = 2.26)
92.6% (M = 2.51)
Junior 53 76.0% (M = 2.41)
75.9% (M = 2.19)
75.9% (M = 2.12)
72.3% (M = 2.14)
88.9% (M = 2.51)
Senior 89 76.3% (M = 2.45)
73.0% (M = 2.23)
83.1% (M = 2.37)
76.4% (M = 2.28)
83.1% (M = 2.47)
TOTAL 270 75.4% (M = 2.33)
69.9% (M = 2.09)
69.5% (M = 2.11)
73.2% (M = 2.16)
82.4% (M = 2.36)
For each trait, the figure shows the percentages of students earning a score of 2 or better on the rubric, as well as the mean score for each trait, all as a function of Class Level.
• For Purpose, first-year students scored significantly lower than both sophomores and seniors. No other Class Level comparisons were significant.
• For Synthesis, first-years scored lower than both juniors and seniors. • For Style, only the difference between seniors and first-year students was significant,
with first-years scoring lower. • Finally, for both Support and Mechanics, follow-up comparisons showed that first-years
scored significantly lower than sophomores, juniors, and seniors, with no significant differences among these latter groups.
It should be noted that most students reached average attainment on at least one trait. Mechanics was especially strong, with 73% of first-years reaching average attainment or above; this increased to 83% of seniors, 89% of juniors, and 93% of sophomores. In sum, analyses of the mean scores for each trait yielded the following observations:
• Seniors had higher scores across all rubric traits than first-year students. • Juniors scored higher than first-year students on Synthesis, Mechanics, and Support. • Sophomores scored higher than first-year students on Purpose, Mechanics, and Support. • Sophomores, juniors, and seniors exhibited statistically equivalent levels of attainment
across all traits. Addressed previously with all elements of current University/GE Assessment.
December 21, 2015 General Education Program Review
30
Other Writing Assessments English 134 (GE A1) In AY 2008-2009, the Associate Dean in the College of Liberal Arts and the ULO Writing Consultant conducted an assessment that compared students’ initial and final essays in the first-year composition course, English 134: Writing and Rhetoric. The original sample was 156 students from 7 classes. First and last essays from 56 students—8 from each section—were randomly selected for assessment. Essays were scored using an earlier, holistic draft of the expository writing rubric. Final essay scores were significantly higher than those on the initial essays. As a follow-up, scores for both initial and final essays were compared to a constant of 3, which indicates “average” attainment on the holistic rubric. Initial essay scores were significantly lower than 3; in contrast, final essay scores did not differ significantly from the constant. A separate test showed that initial and final essay scores were both correlated with final grades. Initial essay scores were weakly correlated with final grades, whereas final essay scores were significantly correlated with final grades. The overall pattern of results with regard to the initial and final essay scores yielded promising evidence that students significantly improved in their writing during the quarter, that this improvement moved students to an average and acceptable level of attainment, and that the final essay scores were indicative of final grades. Importantly, the data showed that students progressed from minimal to average attainment of writing skills during the quarter. This finding is consistent with the ULO-based assessment results reported above that show gains following the first-year writing experience and suggest that students retain these initial gains. Graduation Writing Requirement All CSU students must satisfy the Graduation Writing Requirement (GWR). Cal Poly students can meet this requirement in two ways:
• Earn a C or better and successfully complete a timed essay in a GWR-designated, 300-level, writing-intensive GE course. Students who are unsuccessful receive feedback and at least one more opportunity to complete the essay. The pass rate was 84% for AY 2010-11.
• Pass the Writing Proficiency Exam (WPE), a 350-500 word, timed, expository essay test scored by writing experts and other faculty members. The WPE pass rate was 70% for AY 2010-11.
The essay and exam results likely constitute non-comparable samples for several reasons: students select the method of administration; the tests are administered in different environments; the content differs from test to test; the scoring differs across test types; and students taking the GWR course receive feedback and have a second opportunity to write the essay. In addition, each test may attract a different population, a factor that may interact with variables such as college, ethnicity, interest in writing, etc. To date, this question has not been looked at in a systematic way because the data have not been readily available. Finally, the essays administered in a GWR course may not be suitable for drawing university-level conclusions because they are only assessed by the instructors of record. However, multiple readers score the WPE using the
December 21, 2015 General Education Program Review
31
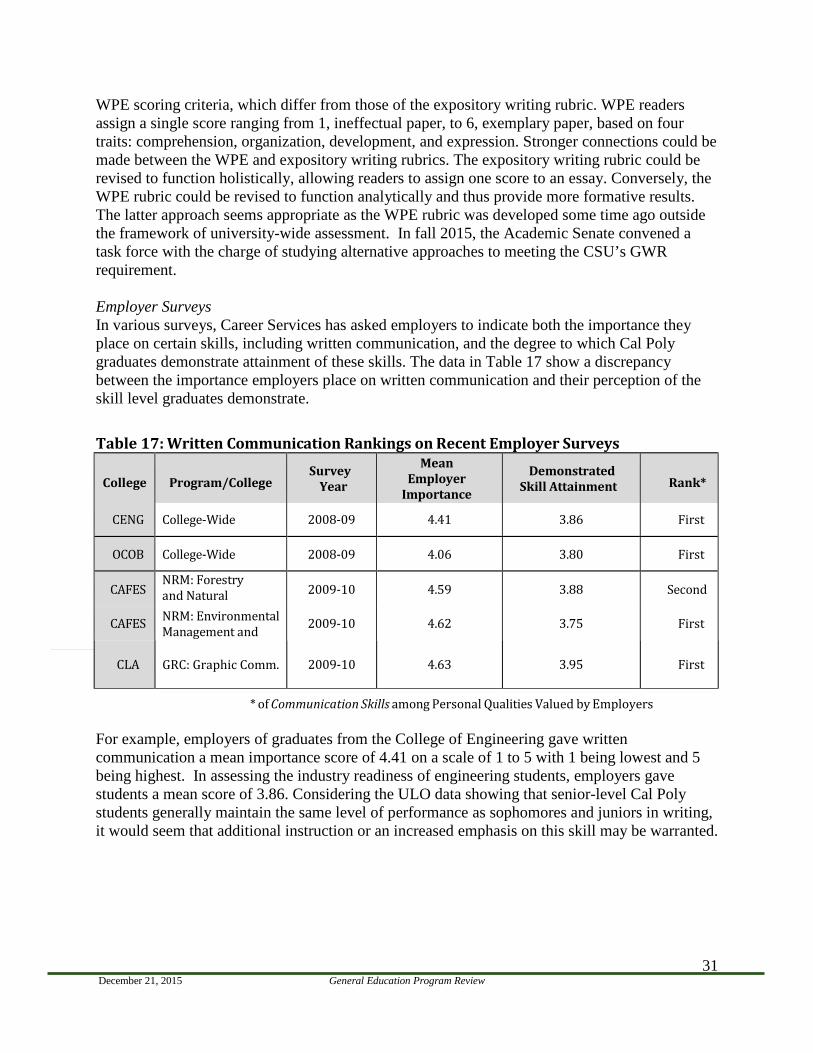
WPE scoring criteria, which differ from those of the expository writing rubric. WPE readers assign a single score ranging from 1, ineffectual paper, to 6, exemplary paper, based on four traits: comprehension, organization, development, and expression. Stronger connections could be made between the WPE and expository writing rubrics. The expository writing rubric could be revised to function holistically, allowing readers to assign one score to an essay. Conversely, the WPE rubric could be revised to function analytically and thus provide more formative results. The latter approach seems appropriate as the WPE rubric was developed some time ago outside the framework of university-wide assessment. In fall 2015, the Academic Senate convened a task force with the charge of studying alternative approaches to meeting the CSU’s GWR requirement. Employer Surveys In various surveys, Career Services has asked employers to indicate both the importance they place on certain skills, including written communication, and the degree to which Cal Poly graduates demonstrate attainment of these skills. The data in Table 17 show a discrepancy between the importance employers place on written communication and their perception of the skill level graduates demonstrate. Table 17: Written Communication Rankings on Recent Employer Surveys
College Program/College Survey
Year
Mean Employer
Importance
Demonstrated Skill Attainment Rank*
CENG College-Wide 2008-09 4.41 3.86 First
OCOB College-Wide 2008-09 4.06 3.80 First
CAFES NRM: Forestry and Natural
2009-10 4.59 3.88 Second
CAFES NRM: Environmental Management and 2009-10 4.62 3.75 First
CLA GRC: Graphic Comm. 2009-10 4.63 3.95 First
* of Communication Skills among Personal Qualities Valued by Employers For example, employers of graduates from the College of Engineering gave written communication a mean importance score of 4.41 on a scale of 1 to 5 with 1 being lowest and 5 being highest. In assessing the industry readiness of engineering students, employers gave students a mean score of 3.86. Considering the ULO data showing that senior-level Cal Poly students generally maintain the same level of performance as sophomores and juniors in writing, it would seem that additional instruction or an increased emphasis on this skill may be warranted.
December 21, 2015 General Education Program Review
32
ULO Project 2: Oral Communication The ULO Project on Oral Communication began in September 2009. The ULO Oral Communication Committee adopted an operational definition from AAC&U’s Oral Communication VALUE Rubric: “a prepared, purposeful presentation designed to increase knowledge, to foster understanding, or to promote change in the listeners’ attitudes, values, beliefs, or behaviors.” Based on this definition, the committee designed a five-point rubric with seven traits: verbal delivery, nonverbal delivery, presence of a central message, organization, language use, use of supporting material, and use of visual aids. Oral Communication Rubric (Appendix N). Method In the first year, the committee sought to establish a benchmark of students’ performance toward the beginning of their academic careers. The assessment entailed videotaping oral presentations delivered by a sample of 102 first-year students enrolled in COMS 101 and 102 during spring 2010. The sample was 51% female and 49% male and represented all six colleges: Engineering (24%), Agriculture (23%), Science and Math (20%), Liberal Arts (15%), Business (13%) and Architecture (7%). Frequencies for both gender and college distributions did not differ significantly. Three faculty members from Communication Studies observed and evaluated the speeches. Training sessions ensured norming of scores and provided evaluators the opportunity to discuss, modify, and clarify the rubric as needed. Following these sessions, each evaluator scored a selection of speeches on each rubric trait on a scale of 1 to 5 with 1 being insufficient and 5 being excellent. Results Table 18 shows the overall scores, with the rubric traits presented in order from highest to lowest means. In addition, the figure shows the percentages of students scoring at each level of the rubric. Because so few had scores of 1, percentages for scores of 1 and 2 (insufficient and below average) were added together.
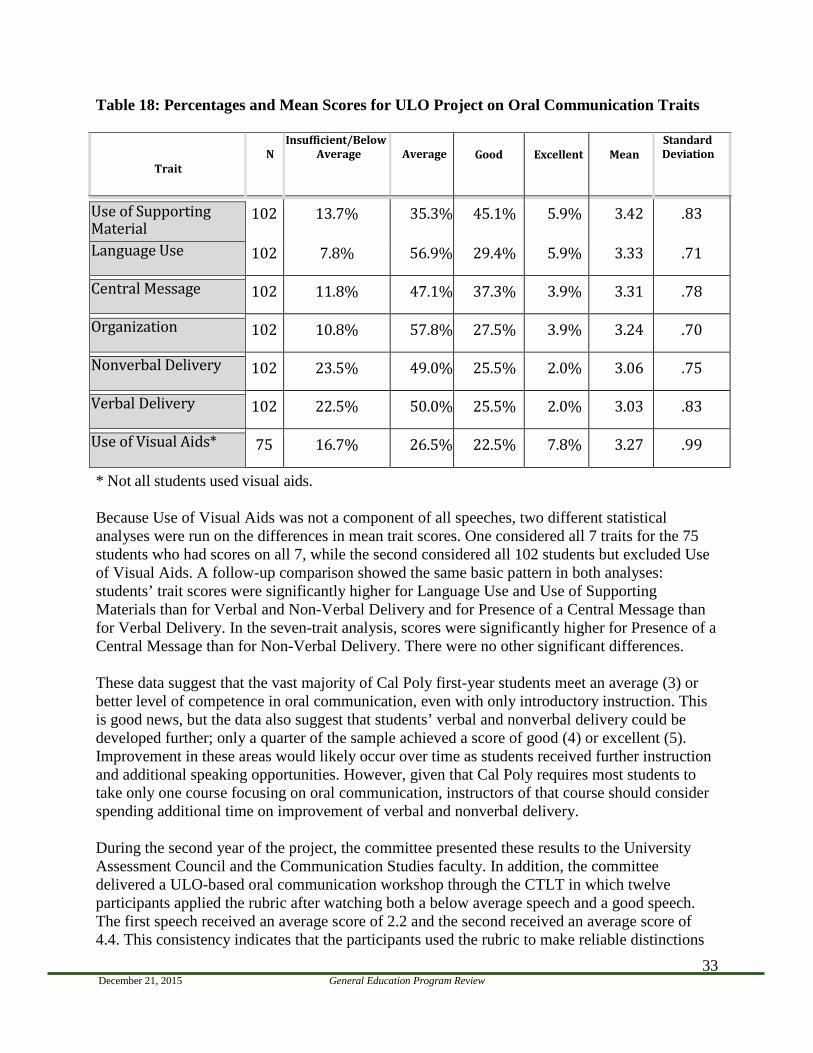
December 21, 2015 General Education Program Review
33
Table 18: Percentages and Mean Scores for ULO Project on Oral Communication Traits
Trait
N
Insufficient/Below Average
Average
Good
Excellent
Mean
Standard Deviation
Use of Supporting Material
102 13.7% 35.3% 45.1% 5.9% 3.42 .83
Language Use 102 7.8% 56.9% 29.4% 5.9% 3.33 .71
Central Message 102 11.8% 47.1% 37.3% 3.9% 3.31 .78
Organization 102 10.8% 57.8% 27.5% 3.9% 3.24 .70
Nonverbal Delivery 102 23.5% 49.0% 25.5% 2.0% 3.06 .75
Verbal Delivery 102 22.5% 50.0% 25.5% 2.0% 3.03 .83
Use of Visual Aids* 75 16.7% 26.5% 22.5% 7.8% 3.27 .99
* Not all students used visual aids. Because Use of Visual Aids was not a component of all speeches, two different statistical analyses were run on the differences in mean trait scores. One considered all 7 traits for the 75 students who had scores on all 7, while the second considered all 102 students but excluded Use of Visual Aids. A follow-up comparison showed the same basic pattern in both analyses: students’ trait scores were significantly higher for Language Use and Use of Supporting Materials than for Verbal and Non-Verbal Delivery and for Presence of a Central Message than for Verbal Delivery. In the seven-trait analysis, scores were significantly higher for Presence of a Central Message than for Non-Verbal Delivery. There were no other significant differences. These data suggest that the vast majority of Cal Poly first-year students meet an average (3) or better level of competence in oral communication, even with only introductory instruction. This is good news, but the data also suggest that students’ verbal and nonverbal delivery could be developed further; only a quarter of the sample achieved a score of good (4) or excellent (5). Improvement in these areas would likely occur over time as students received further instruction and additional speaking opportunities. However, given that Cal Poly requires most students to take only one course focusing on oral communication, instructors of that course should consider spending additional time on improvement of verbal and nonverbal delivery. During the second year of the project, the committee presented these results to the University Assessment Council and the Communication Studies faculty. In addition, the committee delivered a ULO-based oral communication workshop through the CTLT in which twelve participants applied the rubric after watching both a below average speech and a good speech. The first speech received an average score of 2.2 and the second received an average score of 4.4. This consistency indicates that the participants used the rubric to make reliable distinctions
December 21, 2015 General Education Program Review
34
of quality between the two speeches. The committee originally planned a third year of activity to assess senior-level presentations perhaps in connection with senior projects, but budget cuts curtailed this aspect of the project. ULO Project 3: Diversity Learning The ULO Project on Diversity Learning began in AY 2008-09. Based on faculty and staff feedback, the ULO Diversity Learning Committee designed separate surveys for each of the first three of Cal Poly’s Diversity Learning Objectives (DLOs) and used a focus-group protocol to assess the last objective. The committee also developed four-point rubrics to score the data collected for each DLO. The Diversity Learning Objectives are provided below. Diversity Learning Objectives All Students who complete an undergraduate or graduate program at Cal Poly should be able to make reasoned decisions based on a respect and appreciation for diversity as defined in the Cal Poly Statement on Diversity, which is included in the catalog. They should be able to: 1 Demonstrate an understanding of relationships between diversity, inequality, and social, economic, and political power both in the United States and globally. 2 Demonstrate knowledge of contributions made by individuals from diverse and/or underrepresented groups to our local, national, and global communities. 3 Consider perspectives of diverse groups when making decisions. Function as members of society and as professionals with people who have ideas, beliefs, attitudes, and behaviors that are different from their own. Method for DLOs 1-3 In fall quarter 2009, the committee collected responses to the DLO questionnaires from 320 first-year students enrolled in ENGL 134, ENGL 145, and ECON 303. In fall 2009 and winter 2010, the committee collected 380 responses from juniors and seniors enrolled in several GE D5 (the upper division elective in Area D/E Society and the Individual) courses as well as ECON 303, IME 482, KINE 411, MATE 481 and ME 430. Students randomly assigned to respond to only one DLO survey completed either paper-and-pencil or online versions. Figure 1.6 shows the resulting sample as a function of College and Class Level, as determined by students’ self-reported expected graduation date. The sample included 343 men (51%) and 324 women (49%), which approximates the university’s gender mix. 400 students (60%) self-identified as white, the largest racial/ethnic group, while 86 (13%) self-identified as multiracial, the next largest group. In spring 2010, after ensuring inter-rater reliability, the committee conducted three scoring sessions with faculty and staff members. Although data were collected from all class levels, evaluators did not score the sophomore essays due to resource and time constraints and the assessment emphasis on value added. For DLO 1, students answered four short essay questions, each corresponding to one of four traits in the rubric: knowledge and understanding, ability to apply a critical perspective, awareness of how personal values and/or ethical/moral frameworks shape individual beliefs, and self-reflection and engagement. Two evaluators scored each set of essays for each trait on a scale of 0 to 4 with 0 being no response and 4 being complex. The two scores were then averaged to
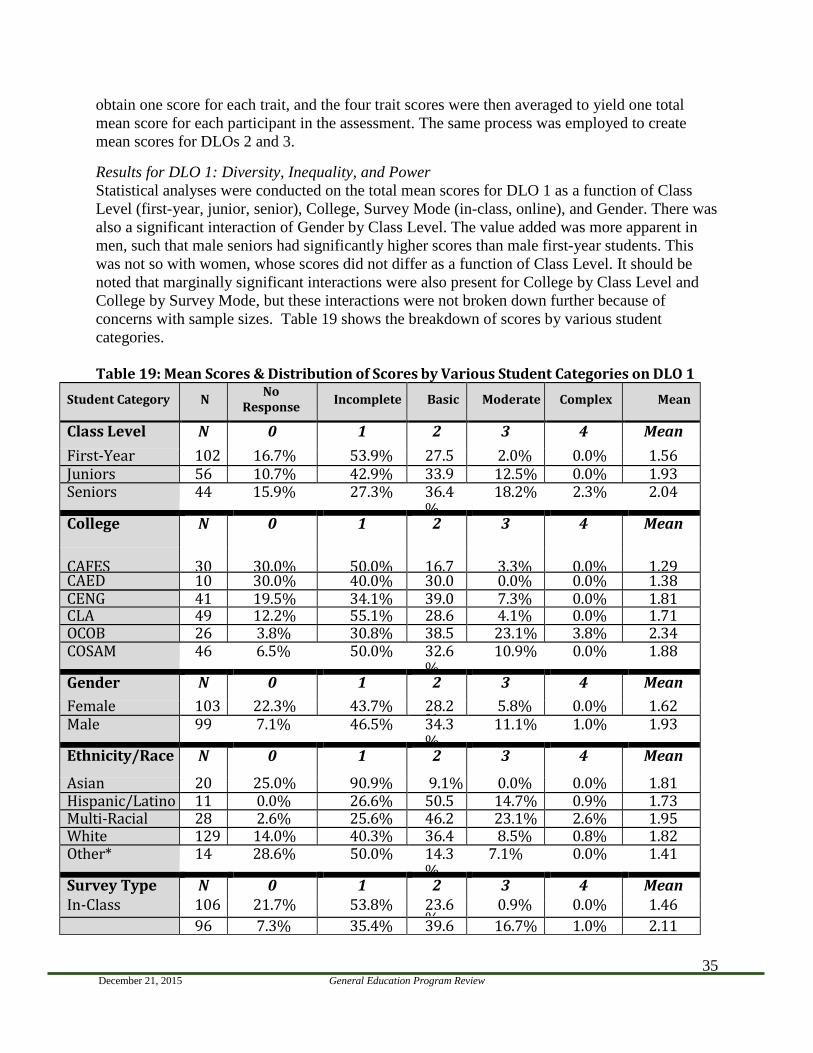
December 21, 2015 General Education Program Review
35
obtain one score for each trait, and the four trait scores were then averaged to yield one total mean score for each participant in the assessment. The same process was employed to create mean scores for DLOs 2 and 3. Results for DLO 1: Diversity, Inequality, and Power Statistical analyses were conducted on the total mean scores for DLO 1 as a function of Class Level (first-year, junior, senior), College, Survey Mode (in-class, online), and Gender. There was also a significant interaction of Gender by Class Level. The value added was more apparent in men, such that male seniors had significantly higher scores than male first-year students. This was not so with women, whose scores did not differ as a function of Class Level. It should be noted that marginally significant interactions were also present for College by Class Level and College by Survey Mode, but these interactions were not broken down further because of concerns with sample sizes. Table 19 shows the breakdown of scores by various student categories. Table 19: Mean Scores & Distribution of Scores by Various Student Categories on DLO 1
Student Category N No Response Incomplete Basic Moderate Complex Mean
Class Level N 0 1 2 3 4 Mean First-Year 102 16.7% 53.9% 27.5
2.0% 0.0% 1.56
Juniors 56 10.7% 42.9% 33.9
12.5% 0.0% 1.93 Seniors 44 15.9% 27.3% 36.4
% 18.2% 2.3% 2.04
College N 0 1 2 3 4 Mean
CAFES
30
30.0%
50.0%
16.7
3.3%
0.0%
1.29
CAED 10 30.0% 40.0% 30.0
0.0% 0.0% 1.38 CENG 41 19.5% 34.1% 39.0
7.3% 0.0% 1.81
CLA 49 12.2% 55.1% 28.6
4.1% 0.0% 1.71 OCOB 26 3.8% 30.8% 38.5
23.1% 3.8% 2.34
COSAM 46 6.5% 50.0% 32.6%
10.9% 0.0% 1.88
Gender N 0 1 2 3 4 Mean Female 103 22.3% 43.7% 28.2
% 5.8% 0.0% 1.62
Male 99 7.1% 46.5% 34.3%
11.1% 1.0% 1.93
Ethnicity/Race N 0 1 2 3 4 Mean
Asian 20 25.0% 90.9% 9.1% 0.0% 0.0% 1.81 Hispanic/Latino 11 0.0% 26.6% 50.5
14.7% 0.9% 1.73
Multi-Racial 28 2.6% 25.6% 46.2
23.1% 2.6% 1.95 White 129 14.0% 40.3% 36.4
8.5% 0.8% 1.82
Other* 14 28.6% 50.0% 14.3%
7.1% 0.0% 1.41
Survey Type N 0 1 2 3 4 Mean In-Class 106 21.7% 53.8% 23.6
% 0.9% 0.0% 1.46
96 7.3% 35.4% 39.6
16.7% 1.0% 2.11
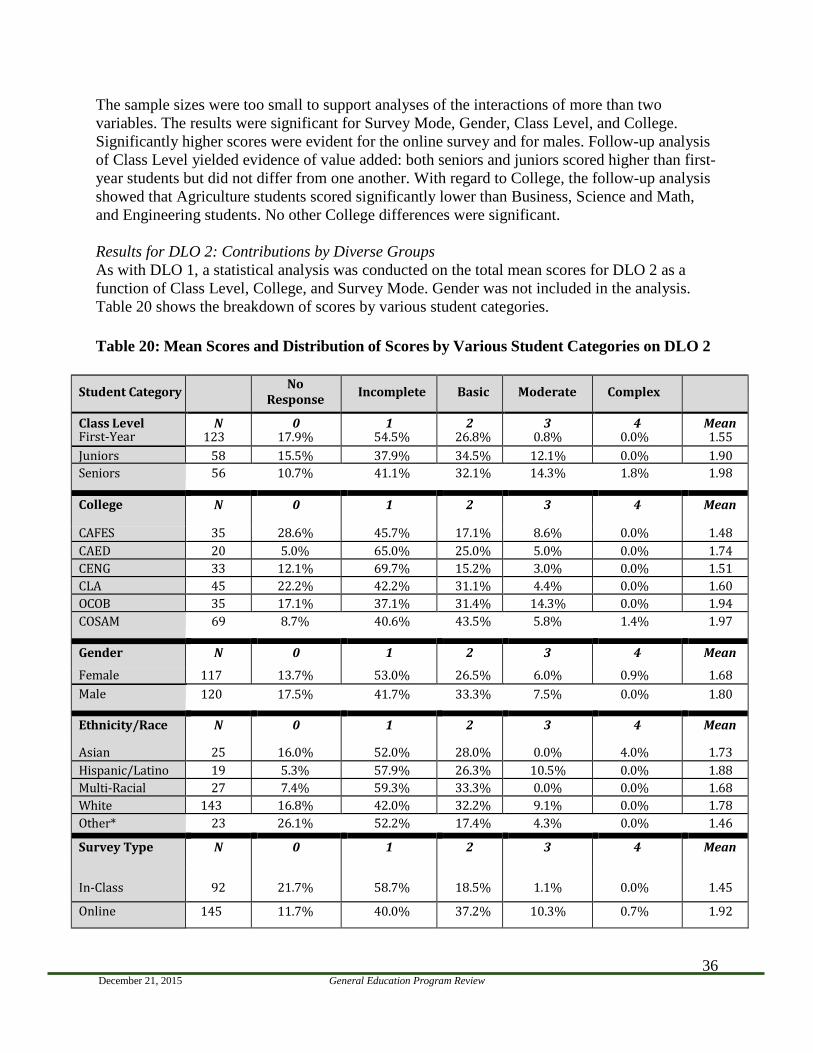
December 21, 2015 General Education Program Review
36
The sample sizes were too small to support analyses of the interactions of more than two variables. The results were significant for Survey Mode, Gender, Class Level, and College. Significantly higher scores were evident for the online survey and for males. Follow-up analysis of Class Level yielded evidence of value added: both seniors and juniors scored higher than first-year students but did not differ from one another. With regard to College, the follow-up analysis showed that Agriculture students scored significantly lower than Business, Science and Math, and Engineering students. No other College differences were significant. Results for DLO 2: Contributions by Diverse Groups As with DLO 1, a statistical analysis was conducted on the total mean scores for DLO 2 as a function of Class Level, College, and Survey Mode. Gender was not included in the analysis. Table 20 shows the breakdown of scores by various student categories. Table 20: Mean Scores and Distribution of Scores by Various Student Categories on DLO 2
Student Category No Response Incomplete Basic Moderate Complex
Class Level N 0 1 2 3 4 Mean First-Year 123 17.9% 54.5% 26.8% 0.8% 0.0% 1.55 Juniors 58 15.5% 37.9% 34.5% 12.1% 0.0% 1.90 Seniors 56 10.7% 41.1% 32.1% 14.3% 1.8% 1.98
College N 0 1 2 3 4 Mean
CAFES 35 28.6% 45.7% 17.1% 8.6% 0.0% 1.48 CAED 20 5.0% 65.0% 25.0% 5.0% 0.0% 1.74 CENG 33 12.1% 69.7% 15.2% 3.0% 0.0% 1.51 CLA 45 22.2% 42.2% 31.1% 4.4% 0.0% 1.60 OCOB 35 17.1% 37.1% 31.4% 14.3% 0.0% 1.94 COSAM 69 8.7% 40.6% 43.5% 5.8% 1.4% 1.97
Gender N 0 1 2 3 4 Mean
Female 117 13.7% 53.0% 26.5% 6.0% 0.9% 1.68 Male 120 17.5% 41.7% 33.3% 7.5% 0.0% 1.80
Ethnicity/Race N 0 1 2 3 4 Mean
Asian 25 16.0% 52.0% 28.0% 0.0% 4.0% 1.73 Hispanic/Latino 19 5.3% 57.9% 26.3% 10.5% 0.0% 1.88 Multi-Racial 27 7.4% 59.3% 33.3% 0.0% 0.0% 1.68 White 143 16.8% 42.0% 32.2% 9.1% 0.0% 1.78 Other* 23 26.1% 52.2% 17.4% 4.3% 0.0% 1.46
Survey Type N 0 1 2 3 4 Mean
In-Class
92
21.7%
58.7%
18.5%
1.1%
0.0%
1.45
Online 145 11.7% 40.0% 37.2% 10.3% 0.7% 1.92
December 21, 2015 General Education Program Review
37
The results were significant for Survey Mode, Class Level, and College. Again, the online survey mode resulted in significantly higher scores. The Class Level effect showed that while there were no differences between junior and senior scores, both seniors and juniors scored significantly higher than first-year students. The College effect showed that Science and Math students scored significantly higher than Agriculture and Engineering students, with no other differences among colleges reaching significance. There was, however, a significant interaction between Class Level and College. Among first-year students, Science and Math students scored significantly higher than Business students; among seniors, Science and Math students scored significantly higher than Engineering students. Small, unequal sample sizes mean that caution should be used in interpreting these results. Results for DLO 3: Perspectives of Diverse Groups Table 21 presents the mean scores for DLO 3. The results of the statistical analysis were significant for Class Level, College, and Gender. There were no significant interactions between variables. Men scored significantly higher than women; students in the College of Business scored significantly higher than students in all other colleges except Liberal Arts; Liberal Arts students scored significantly higher than Agriculture students. Finally, there was once more evidence of value added: both seniors and juniors scored higher than first-year students but did not differ from one another. The pilot nature of the project needs to be stressed, especially with regard to college results. The low and uneven numbers of participants make these patterns tentative at best.
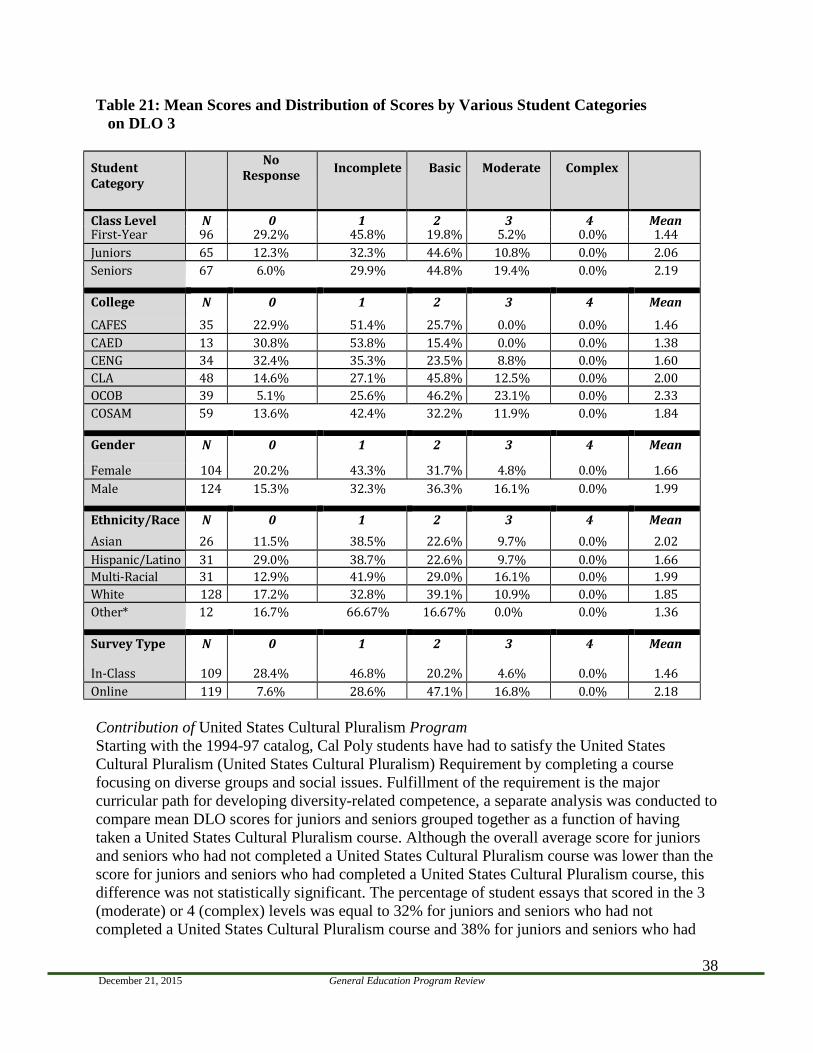
December 21, 2015 General Education Program Review
38
Table 21: Mean Scores and Distribution of Scores by Various Student Categories on DLO 3
Student Category
No Response Incomplete Basic Moderate Complex
Class Level N 0 1 2 3 4 Mean First-Year 96 29.2% 45.8% 19.8% 5.2% 0.0% 1.44 Juniors 65 12.3% 32.3% 44.6% 10.8% 0.0% 2.06 Seniors 67 6.0% 29.9% 44.8% 19.4% 0.0% 2.19
College N 0 1 2 3 4 Mean
CAFES 35 22.9% 51.4% 25.7% 0.0% 0.0% 1.46 CAED 13 30.8% 53.8% 15.4% 0.0% 0.0% 1.38 CENG 34 32.4% 35.3% 23.5% 8.8% 0.0% 1.60 CLA 48 14.6% 27.1% 45.8% 12.5% 0.0% 2.00 OCOB 39 5.1% 25.6% 46.2% 23.1% 0.0% 2.33 COSAM 59 13.6% 42.4% 32.2% 11.9% 0.0% 1.84
Gender N 0 1 2 3 4 Mean
Female 104 20.2% 43.3% 31.7% 4.8% 0.0% 1.66 Male 124 15.3% 32.3% 36.3% 16.1% 0.0% 1.99
Ethnicity/Race N 0 1 2 3 4 Mean Asian 26 11.5% 38.5% 22.6% 9.7% 0.0% 2.02 Hispanic/Latino 31 29.0% 38.7% 22.6% 9.7% 0.0% 1.66 Multi-Racial 31 12.9% 41.9% 29.0% 16.1% 0.0% 1.99 White 128 17.2% 32.8% 39.1% 10.9% 0.0% 1.85 Other* 12 16.7% 66.67% 16.67% 0.0% 0.0% 1.36
Survey Type N 0 1 2 3 4 Mean
In-Class 109 28.4% 46.8% 20.2% 4.6% 0.0% 1.46 Online 119 7.6% 28.6% 47.1% 16.8% 0.0% 2.18 Contribution of United States Cultural Pluralism Program Starting with the 1994-97 catalog, Cal Poly students have had to satisfy the United States Cultural Pluralism (United States Cultural Pluralism) Requirement by completing a course focusing on diverse groups and social issues. Fulfillment of the requirement is the major curricular path for developing diversity-related competence, a separate analysis was conducted to compare mean DLO scores for juniors and seniors grouped together as a function of having taken a United States Cultural Pluralism course. Although the overall average score for juniors and seniors who had not completed a United States Cultural Pluralism course was lower than the score for juniors and seniors who had completed a United States Cultural Pluralism course, this difference was not statistically significant. The percentage of student essays that scored in the 3 (moderate) or 4 (complex) levels was equal to 32% for juniors and seniors who had not completed a United States Cultural Pluralism course and 38% for juniors and seniors who had
December 21, 2015 General Education Program Review
39
completed a United States Cultural Pluralism course. Although the average score and percentage of essays that met higher standards were both somewhat greater for students who had completed a United States Cultural Pluralism course, the results do not indicate that having taken a United States Cultural Pluralism course makes a large positive contribution to diversity learning as defined by the DLOs. Contribution of Service Learning Another avenue by which students may gain diversity-related competence is service learning. Although not a graduation requirement, a number of students take service-learning courses in fulfillment of GE or major requirements. The overall average score for juniors and seniors who had not completed a service learning course was lower than the score for juniors and seniors who had completed a service learning course, but this difference was not statistically significant. The percentage of student essays with scores in the 3 or 4 levels was 32% for juniors and seniors who had not completed a service learning course United States Cultural Pluralism, these results do not indicate that service learning makes a large positive contribution to diversity learning as defined by the DLOs. Method and Results for DLO 4: Professionals in a Diverse World. The committee conducted focus-group sessions with approximately 80 first-year students enrolled in Honors 100 during fall 2009 and with approximately 90 seniors enrolled in ECON 303 during winter 2010. These classes were selected because they were available and because students enrolled in these courses likely had the maturity level necessary to explore the issues seriously. Using transcripts of these sessions, the committee compiled a list of key themes discussed by students. The list served as the context for the committee’s conclusions about student knowledge, perceptions, and beliefs about working together with people from diverse backgrounds—an appropriate focus for Cal Poly, whose institutional identity is marked by the preponderance of professional degree programs. The focus-group responses reveal a negative student bias towards diversity learning, especially in the context of classroom instruction, which seems to exist before students enter Cal Poly. Senior students were better able than first-year students to reflect on their experiences of diversity learning in the classroom but still gave mixed responses; some were positive about these experiences while others viewed them as a form of indoctrination. Virtually all students who spoke were positive about WOW (the Week of Welcome orientation for first-year students) and other cultural events outside the classroom and wished that there were more such opportunities and more campus diversity in general. ULO Project 4: Lifelong Learning The ULO Project on Lifelong Learning began in Spring 2010, when Kennedy Library conducted a survey of student information skills in consultation with the ULO Lifelong Learning Committee. Information skills are a foundational component of lifelong learning, and they contribute to other ULOs including written and oral communication.
December 21, 2015 General Education Program Review
40
Method The survey was designed to identify student competencies by measuring performance on the Information Literacy Learning Objectives, which the library established in 2009. The survey presented students with a research scenario and asked them to respond to a series of 20 questions. Two versions were administered during a one-month period: one for lower-division and one for upper-division students. The versions differed by the order in which questions were asked and the wording of some questions. Invitations to participate were emailed to 1,332 lower-division and 2,905 upper-division students. In addition, an open invitation was posted on the library website, and instructors who had previously brought students for library instruction were encouraged to announce the survey to current students. Approximately 98% of the responses came from the email invitations. Without adjusting for the remaining 2%, the lower-division response rate was 28% (367 respondents) and the upper-division response rate was 20% (578 respondents). The high response rate likely resulted from the promise of cash prizes; however, not all respondents answered all questions. Results Table 22 presents the mean scores in terms of percent correct for five questions for which there was a single response.
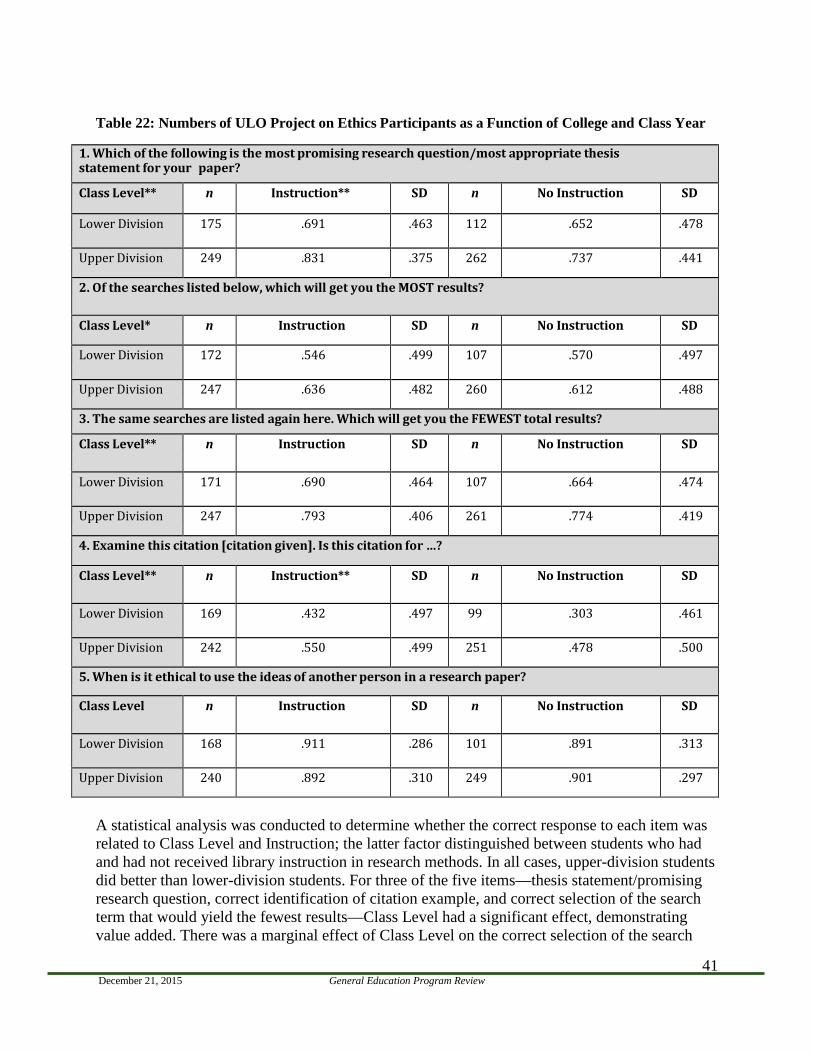
December 21, 2015 General Education Program Review
41
Table 22: Numbers of ULO Project on Ethics Participants as a Function of College and Class Year
1. Which of the following is the most promising research question/most appropriate thesis statement for your paper?
Class Level** n Instruction** SD n No Instruction SD
Lower Division 175 .691 .463 112 .652 .478
Upper Division 249 .831 .375 262 .737 .441
2. Of the searches listed below, which will get you the MOST results?
Class Level* n Instruction SD n No Instruction SD
Lower Division 172 .546 .499 107 .570 .497
Upper Division 247 .636 .482 260 .612 .488
3. The same searches are listed again here. Which will get you the FEWEST total results?
Class Level** n Instruction SD n No Instruction SD
Lower Division 171 .690 .464 107 .664 .474
Upper Division 247 .793 .406 261 .774 .419
4. Examine this citation [citation given]. Is this citation for …?
Class Level** n Instruction** SD n No Instruction SD
Lower Division 169 .432 .497 99 .303 .461
Upper Division 242 .550 .499 251 .478 .500
5. When is it ethical to use the ideas of another person in a research paper?
Class Level n Instruction SD n No Instruction SD
Lower Division 168 .911 .286 101 .891 .313
Upper Division 240 .892 .310 249 .901 .297
A statistical analysis was conducted to determine whether the correct response to each item was related to Class Level and Instruction; the latter factor distinguished between students who had and had not received library instruction in research methods. In all cases, upper-division students did better than lower-division students. For three of the five items—thesis statement/promising research question, correct identification of citation example, and correct selection of the search term that would yield the fewest results—Class Level had a significant effect, demonstrating value added. There was a marginal effect of Class Level on the correct selection of the search

December 21, 2015 General Education Program Review
42
term that would yield the most results. Significant effects of Instruction were found for the thesis statement and correct identification of the citation example. The question on the ethical use of ideas showed no significant effects of either Class Level or Instruction. Across all analyses, no significant interactions between variables were present. The results demonstrate value added across several items on the survey, indicating higher levels of information literacy at the upper-division level. In addition, promising results for the educational effectiveness of library-related instruction were also found, with some indication that lower-division students attending such instruction consistently scored almost as well as upper-division students who had not attended such sessions. It should be noted that the outcomes measured in this scenario-based questionnaire necessarily focused on the means of finding and identifying information rather than on the more complex evaluative and synthetic skills associated with the critical-thinking aspects of information literacy. Additional Initiatives The library has also continued to work closely with GE A1 and GE A3 classes, with support from the English Department’s Writing Director, Dr. Brenda Helmbrecht. Instructors have the option of bringing their classes to the library for sessions that will introduce them to the library’s research tools. Indeed, the library provides a robust foundational information literacy instruction program in General Education courses. Kaila Bussert, the Foundational Experiences Librarian who coordinates the A1 and A3 research sessions, prepared the following report detailing the data collected during the AY 2014-2015: Library Support for General Education During AY 2014-15, the program reached 175 sections of GE A1-A3 courses in English and Communication Studies, with approximately 3,850 students (mostly first-years and sophomores), a 25% increase from the previous AY. While the library’s GE Instruction Program continues to grow, we are aiming to reach more students: last year we taught students in roughly 75% of ENGL 134 classes, 50% of ENGL 145 classes, and a smaller number of Communication Studies classes. Expanding information literacy instruction in GE courses will require online learning solutions. Librarians and LibRATs, the library’s peer-learning assistants, lead the library sessions. The curriculum covers a range of foundational information literacy skills, such as searching the library’s databases strategically, identifying the best sources to use for research assignments, and practicing the process of evaluating the credibility and relevance of information sources for the research purpose. The pedagogy is being redesigned to include more active learning methods linked with critical thinking about information. Assessment of the program is through online evaluations that are administered at the end of as many classes as possible, and are used both formatively to help session leaders grow as teachers or peer-teachers, and summatively, to keep track of the program’s quality. Online evaluations from student participants continue to be strong with scores of 4.2 and above (on a 5-point scale, 5 being the highest) as seen in the table below. Students are also prompted to reflect on their own learning in the session with questions that ask about the content of what they learned, remaining points of confusion, and how their research practice will change after the session.
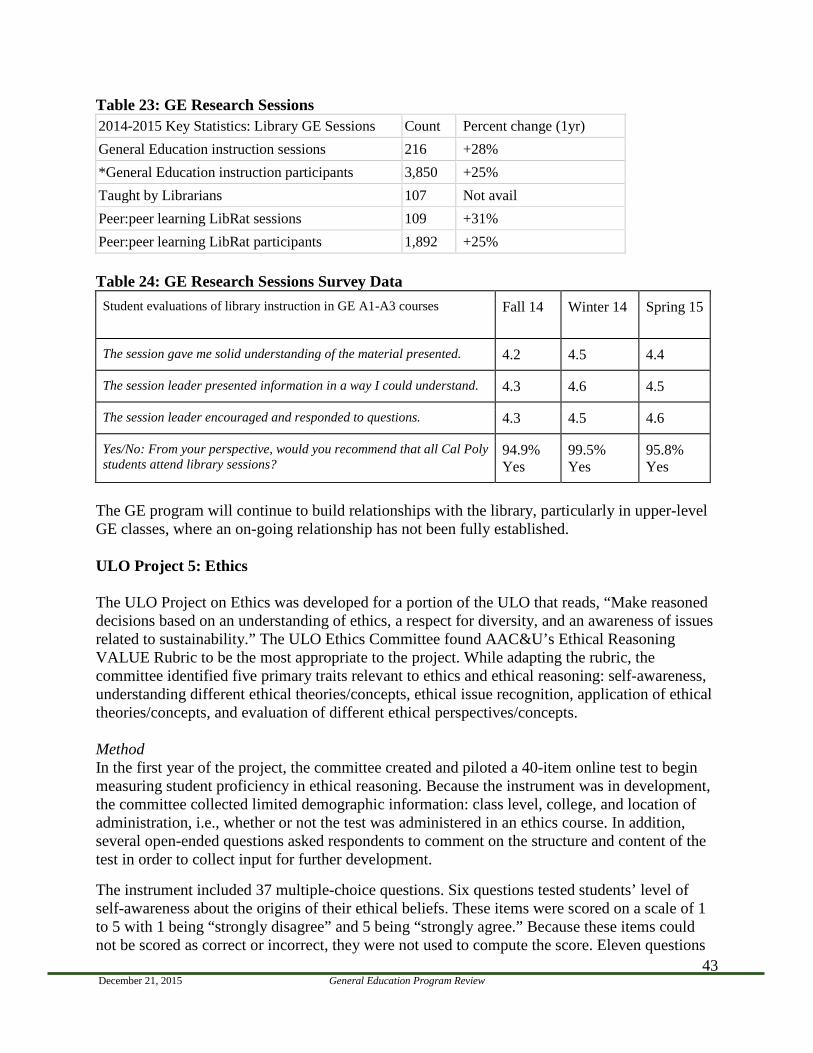
December 21, 2015 General Education Program Review
43
Table 23: GE Research Sessions 2014-2015 Key Statistics: Library GE Sessions Count Percent change (1yr) General Education instruction sessions 216 +28% *General Education instruction participants 3,850 +25% Taught by Librarians 107 Not avail Peer:peer learning LibRat sessions 109 +31% Peer:peer learning LibRat participants 1,892 +25% Table 24: GE Research Sessions Survey Data
Student evaluations of library instruction in GE A1-A3 courses Fall 14 Winter 14 Spring 15
The session gave me solid understanding of the material presented. 4.2 4.5 4.4
The session leader presented information in a way I could understand. 4.3 4.6 4.5
The session leader encouraged and responded to questions. 4.3 4.5 4.6
Yes/No: From your perspective, would you recommend that all Cal Poly students attend library sessions?
94.9% Yes
99.5% Yes
95.8% Yes
The GE program will continue to build relationships with the library, particularly in upper-level GE classes, where an on-going relationship has not been fully established. ULO Project 5: Ethics The ULO Project on Ethics was developed for a portion of the ULO that reads, “Make reasoned decisions based on an understanding of ethics, a respect for diversity, and an awareness of issues related to sustainability.” The ULO Ethics Committee found AAC&U’s Ethical Reasoning VALUE Rubric to be the most appropriate to the project. While adapting the rubric, the committee identified five primary traits relevant to ethics and ethical reasoning: self-awareness, understanding different ethical theories/concepts, ethical issue recognition, application of ethical theories/concepts, and evaluation of different ethical perspectives/concepts. Method In the first year of the project, the committee created and piloted a 40-item online test to begin measuring student proficiency in ethical reasoning. Because the instrument was in development, the committee collected limited demographic information: class level, college, and location of administration, i.e., whether or not the test was administered in an ethics course. In addition, several open-ended questions asked respondents to comment on the structure and content of the test in order to collect input for further development. The instrument included 37 multiple-choice questions. Six questions tested students’ level of self-awareness about the origins of their ethical beliefs. These items were scored on a scale of 1 to 5 with 1 being “strongly disagree” and 5 being “strongly agree.” Because these items could not be scored as correct or incorrect, they were not used to compute the score. Eleven questions
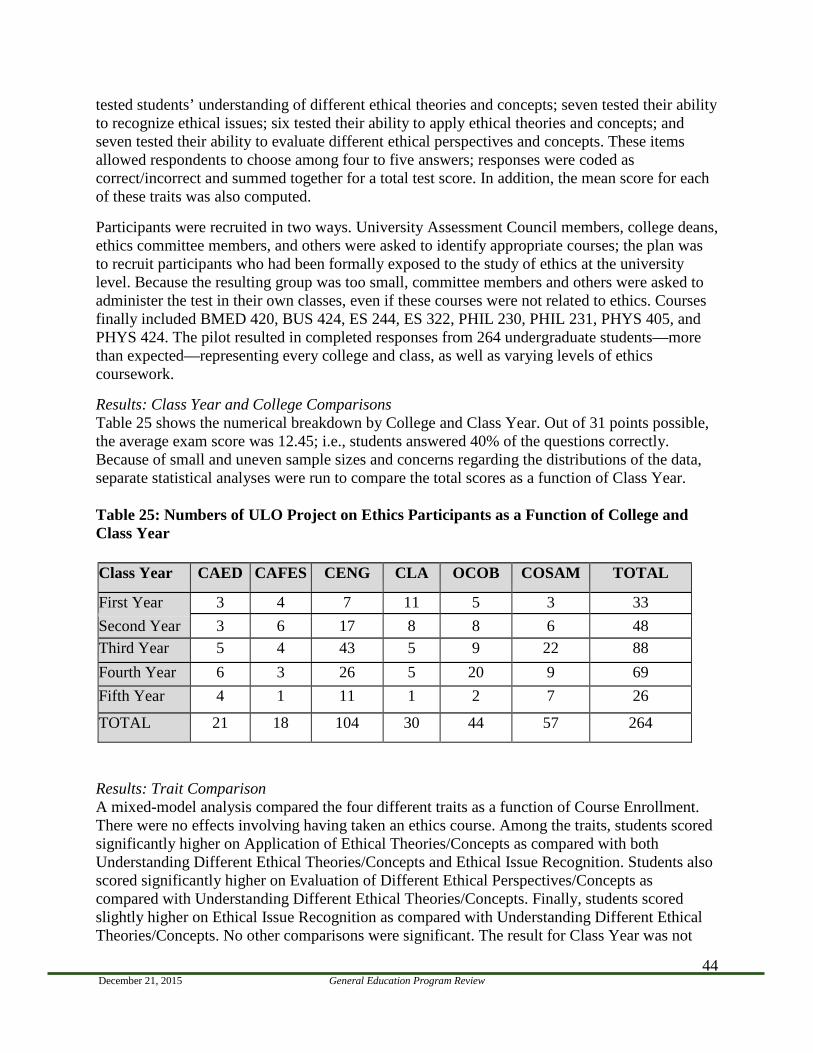
December 21, 2015 General Education Program Review
44
tested students’ understanding of different ethical theories and concepts; seven tested their ability to recognize ethical issues; six tested their ability to apply ethical theories and concepts; and seven tested their ability to evaluate different ethical perspectives and concepts. These items allowed respondents to choose among four to five answers; responses were coded as correct/incorrect and summed together for a total test score. In addition, the mean score for each of these traits was also computed. Participants were recruited in two ways. University Assessment Council members, college deans, ethics committee members, and others were asked to identify appropriate courses; the plan was to recruit participants who had been formally exposed to the study of ethics at the university level. Because the resulting group was too small, committee members and others were asked to administer the test in their own classes, even if these courses were not related to ethics. Courses finally included BMED 420, BUS 424, ES 244, ES 322, PHIL 230, PHIL 231, PHYS 405, and PHYS 424. The pilot resulted in completed responses from 264 undergraduate students—more than expected—representing every college and class, as well as varying levels of ethics coursework. Results: Class Year and College Comparisons Table 25 shows the numerical breakdown by College and Class Year. Out of 31 points possible, the average exam score was 12.45; i.e., students answered 40% of the questions correctly. Because of small and uneven sample sizes and concerns regarding the distributions of the data, separate statistical analyses were run to compare the total scores as a function of Class Year. Table 25: Numbers of ULO Project on Ethics Participants as a Function of College and Class Year
Results: Trait Comparison A mixed-model analysis compared the four different traits as a function of Course Enrollment. There were no effects involving having taken an ethics course. Among the traits, students scored significantly higher on Application of Ethical Theories/Concepts as compared with both Understanding Different Ethical Theories/Concepts and Ethical Issue Recognition. Students also scored significantly higher on Evaluation of Different Ethical Perspectives/Concepts as compared with Understanding Different Ethical Theories/Concepts. Finally, students scored slightly higher on Ethical Issue Recognition as compared with Understanding Different Ethical Theories/Concepts. No other comparisons were significant. The result for Class Year was not
Class Year CAED CAFES CENG CLA OCOB COSAM TOTAL
First Year 3 4 7 11 5 3 33 Second Year 3 6 17 8 8 6 48 Third Year 5 4 43 5 9 22 88 Fourth Year 6 3 26 5 20 9 69 Fifth Year 4 1 11 1 2 7 26
TOTAL 21 18 104 30 44 57 264
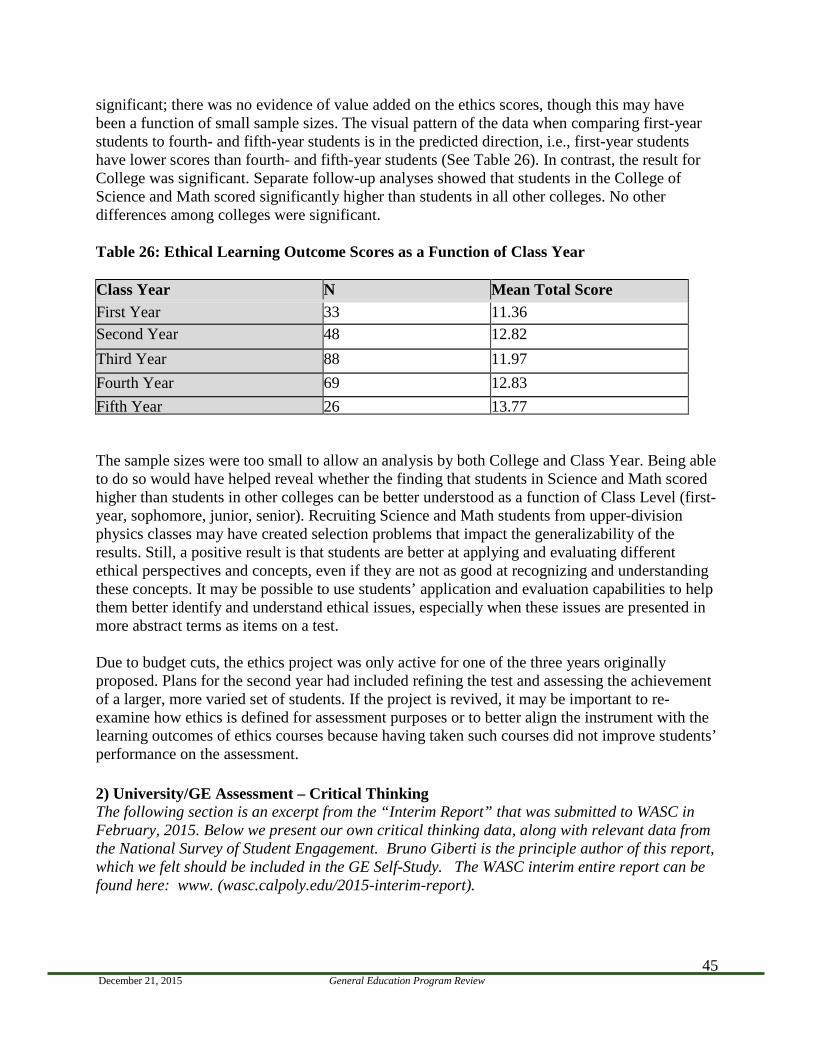
December 21, 2015 General Education Program Review
45
significant; there was no evidence of value added on the ethics scores, though this may have been a function of small sample sizes. The visual pattern of the data when comparing first-year students to fourth- and fifth-year students is in the predicted direction, i.e., first-year students have lower scores than fourth- and fifth-year students (See Table 26). In contrast, the result for College was significant. Separate follow-up analyses showed that students in the College of Science and Math scored significantly higher than students in all other colleges. No other differences among colleges were significant. Table 26: Ethical Learning Outcome Scores as a Function of Class Year Class Year N Mean Total Score First Year 33 11.36 Second Year 48 12.82 Third Year 88 11.97 Fourth Year 69 12.83 Fifth Year 26 13.77 The sample sizes were too small to allow an analysis by both College and Class Year. Being able to do so would have helped reveal whether the finding that students in Science and Math scored higher than students in other colleges can be better understood as a function of Class Level (first-year, sophomore, junior, senior). Recruiting Science and Math students from upper-division physics classes may have created selection problems that impact the generalizability of the results. Still, a positive result is that students are better at applying and evaluating different ethical perspectives and concepts, even if they are not as good at recognizing and understanding these concepts. It may be possible to use students’ application and evaluation capabilities to help them better identify and understand ethical issues, especially when these issues are presented in more abstract terms as items on a test. Due to budget cuts, the ethics project was only active for one of the three years originally proposed. Plans for the second year had included refining the test and assessing the achievement of a larger, more varied set of students. If the project is revived, it may be important to re-examine how ethics is defined for assessment purposes or to better align the instrument with the learning outcomes of ethics courses because having taken such courses did not improve students’ performance on the assessment. 2) University/GE Assessment – Critical Thinking The following section is an excerpt from the “Interim Report” that was submitted to WASC in February, 2015. Below we present our own critical thinking data, along with relevant data from the National Survey of Student Engagement. Bruno Giberti is the principle author of this report, which we felt should be included in the GE Self-Study. The WASC interim entire report can be found here: www. (wasc.calpoly.edu/2015-interim-report).
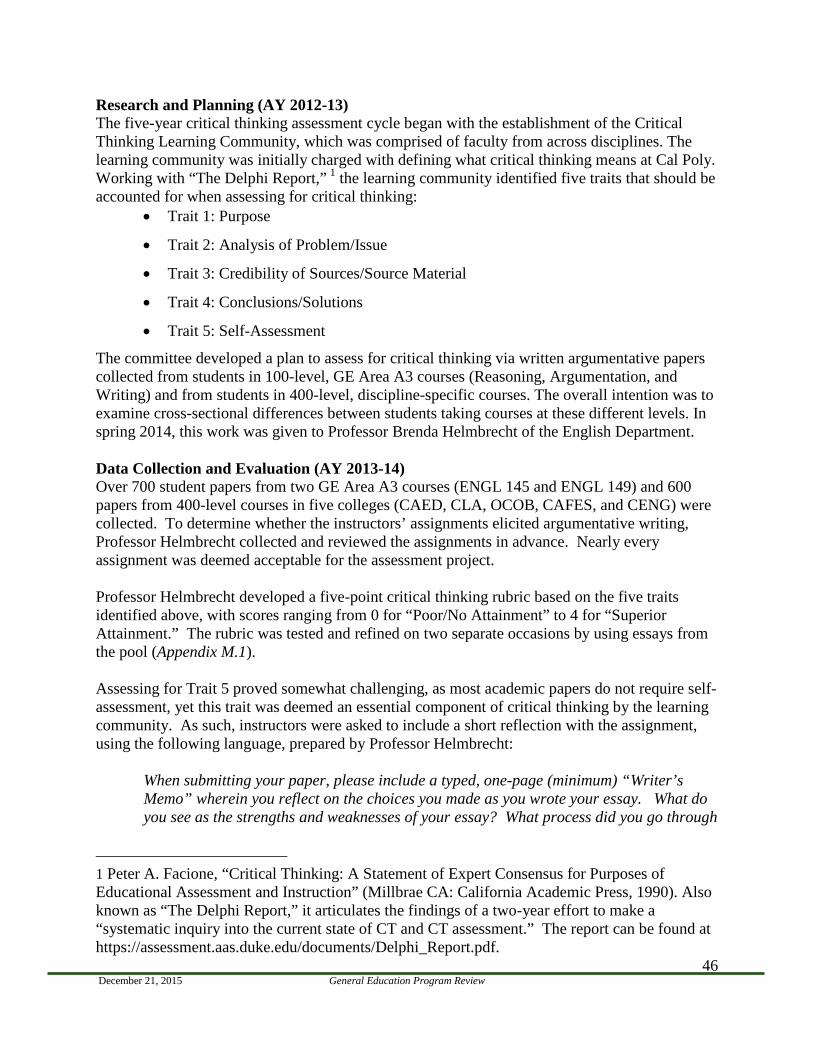
December 21, 2015 General Education Program Review
46
Research and Planning (AY 2012-13) The five-year critical thinking assessment cycle began with the establishment of the Critical Thinking Learning Community, which was comprised of faculty from across disciplines. The learning community was initially charged with defining what critical thinking means at Cal Poly. Working with “The Delphi Report,” 1 the learning community identified five traits that should be accounted for when assessing for critical thinking:
• Trait 1: Purpose
• Trait 2: Analysis of Problem/Issue
• Trait 3: Credibility of Sources/Source Material
• Trait 4: Conclusions/Solutions
• Trait 5: Self-Assessment
The committee developed a plan to assess for critical thinking via written argumentative papers collected from students in 100-level, GE Area A3 courses (Reasoning, Argumentation, and Writing) and from students in 400-level, discipline-specific courses. The overall intention was to examine cross-sectional differences between students taking courses at these different levels. In spring 2014, this work was given to Professor Brenda Helmbrecht of the English Department. Data Collection and Evaluation (AY 2013-14) Over 700 student papers from two GE Area A3 courses (ENGL 145 and ENGL 149) and 600 papers from 400-level courses in five colleges (CAED, CLA, OCOB, CAFES, and CENG) were collected. To determine whether the instructors’ assignments elicited argumentative writing, Professor Helmbrecht collected and reviewed the assignments in advance. Nearly every assignment was deemed acceptable for the assessment project. Professor Helmbrecht developed a five-point critical thinking rubric based on the five traits identified above, with scores ranging from 0 for “Poor/No Attainment” to 4 for “Superior Attainment.” The rubric was tested and refined on two separate occasions by using essays from the pool (Appendix M.1). Assessing for Trait 5 proved somewhat challenging, as most academic papers do not require self-assessment, yet this trait was deemed an essential component of critical thinking by the learning community. As such, instructors were asked to include a short reflection with the assignment, using the following language, prepared by Professor Helmbrecht:
When submitting your paper, please include a typed, one-page (minimum) “Writer’s Memo” wherein you reflect on the choices you made as you wrote your essay. What do you see as the strengths and weaknesses of your essay? What process did you go through
1 Peter A. Facione, “Critical Thinking: A Statement of Expert Consensus for Purposes of Educational Assessment and Instruction” (Millbrae CA: California Academic Press, 1990). Also known as “The Delphi Report,” it articulates the findings of a two-year effort to make a “systematic inquiry into the current state of CT and CT assessment.” The report can be found at https://assessment.aas.duke.edu/documents/Delphi_Report.pdf.
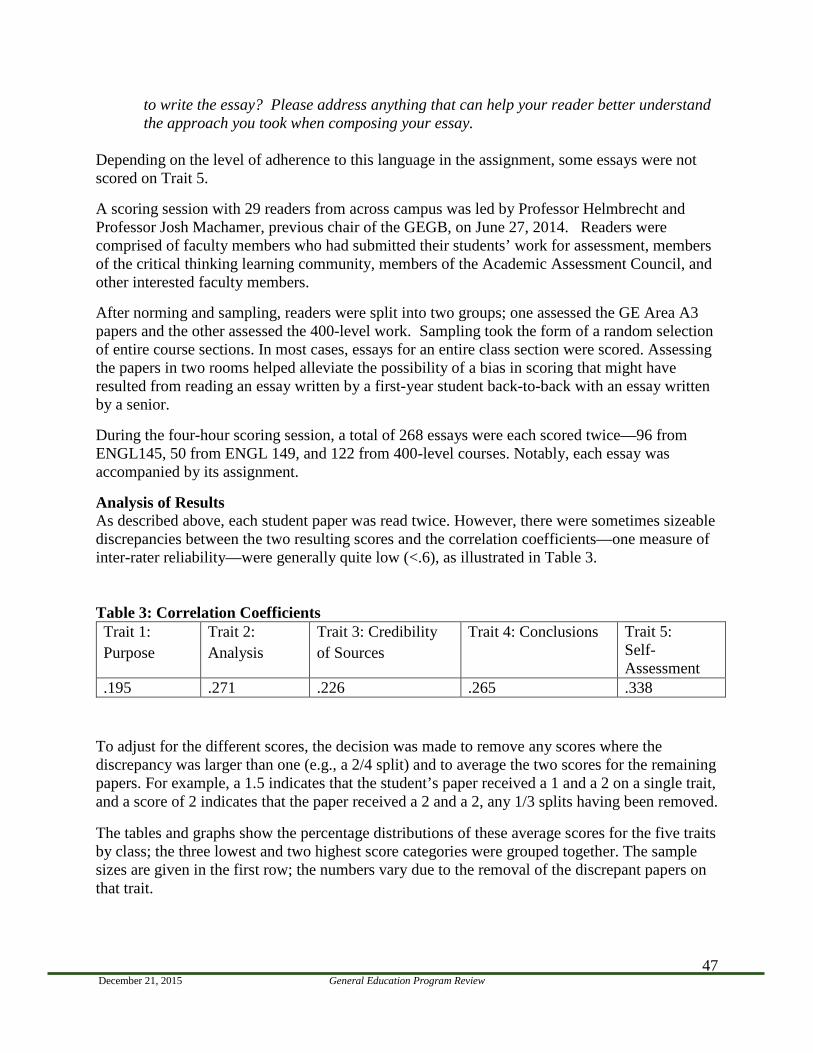
December 21, 2015 General Education Program Review
47
to write the essay? Please address anything that can help your reader better understand the approach you took when composing your essay.
Depending on the level of adherence to this language in the assignment, some essays were not scored on Trait 5. A scoring session with 29 readers from across campus was led by Professor Helmbrecht and Professor Josh Machamer, previous chair of the GEGB, on June 27, 2014. Readers were comprised of faculty members who had submitted their students’ work for assessment, members of the critical thinking learning community, members of the Academic Assessment Council, and other interested faculty members. After norming and sampling, readers were split into two groups; one assessed the GE Area A3 papers and the other assessed the 400-level work. Sampling took the form of a random selection of entire course sections. In most cases, essays for an entire class section were scored. Assessing the papers in two rooms helped alleviate the possibility of a bias in scoring that might have resulted from reading an essay written by a first-year student back-to-back with an essay written by a senior. During the four-hour scoring session, a total of 268 essays were each scored twice—96 from ENGL145, 50 from ENGL 149, and 122 from 400-level courses. Notably, each essay was accompanied by its assignment. Analysis of Results As described above, each student paper was read twice. However, there were sometimes sizeable discrepancies between the two resulting scores and the correlation coefficients—one measure of inter-rater reliability—were generally quite low (<.6), as illustrated in Table 3. Table 3: Correlation Coefficients Trait 1: Purpose
Trait 2: Analysis
Trait 3: Credibility of Sources
Trait 4: Conclusions Trait 5: Self- Assessment
.195 .271 .226 .265 .338
To adjust for the different scores, the decision was made to remove any scores where the discrepancy was larger than one (e.g., a 2/4 split) and to average the two scores for the remaining papers. For example, a 1.5 indicates that the student’s paper received a 1 and a 2 on a single trait, and a score of 2 indicates that the paper received a 2 and a 2, any 1/3 splits having been removed.
The tables and graphs show the percentage distributions of these average scores for the five traits by class; the three lowest and two highest score categories were grouped together. The sample sizes are given in the first row; the numbers vary due to the removal of the discrepant papers on that trait.
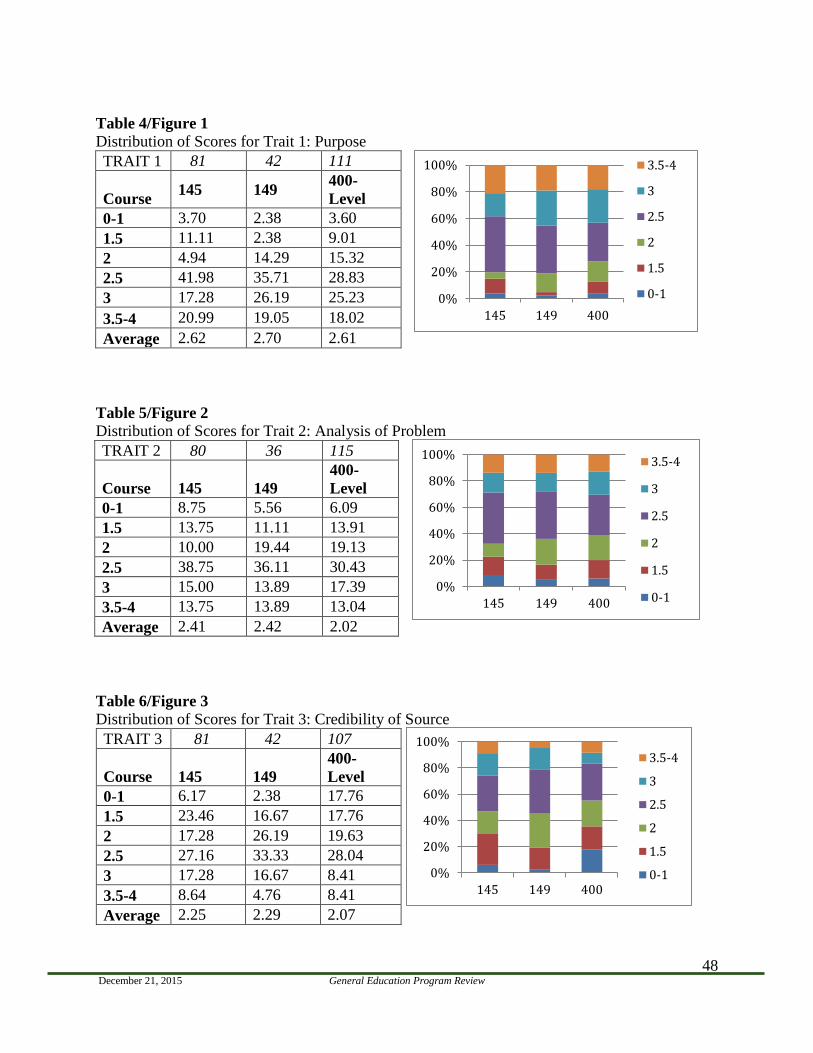
December 21, 2015 General Education Program Review
48
Table 4/Figure 1 Distribution of Scores for Trait 1: Purpose TRAIT 1 81 42 111
Course 145 149 400-Level
0-1 3.70 2.38 3.60 1.5 11.11 2.38 9.01 2 4.94 14.29 15.32 2.5 41.98 35.71 28.83 3 17.28 26.19 25.23 3.5-4 20.99 19.05 18.02 Average 2.62 2.70 2.61
Table 5/Figure 2 Distribution of Scores for Trait 2: Analysis of Problem TRAIT 2 80 36 115
Course 145 149 400-Level
0-1 8.75 5.56 6.09 1.5 13.75 11.11 13.91 2 10.00 19.44 19.13 2.5 38.75 36.11 30.43 3 15.00 13.89 17.39 3.5-4 13.75 13.89 13.04 Average 2.41 2.42 2.02
Table 6/Figure 3 Distribution of Scores for Trait 3: Credibility of Source TRAIT 3 81 42 107
Course 145 149 400-Level
0-1 6.17 2.38 17.76 1.5 23.46 16.67 17.76 2 17.28 26.19 19.63 2.5 27.16 33.33 28.04 3 17.28 16.67 8.41 3.5-4 8.64 4.76 8.41 Average 2.25 2.29 2.07
0%
20%
40%
60%
80%
100%
145 149 400
3.5-4
3
2.5
2
1.5
0-1
0%
20%
40%
60%
80%
100%
145 149 400
3.5-4
3
2.5
2
1.5
0-1
0%
20%
40%
60%
80%
100%
145 149 400
3.5-4
3
2.5
2
1.5
0-1
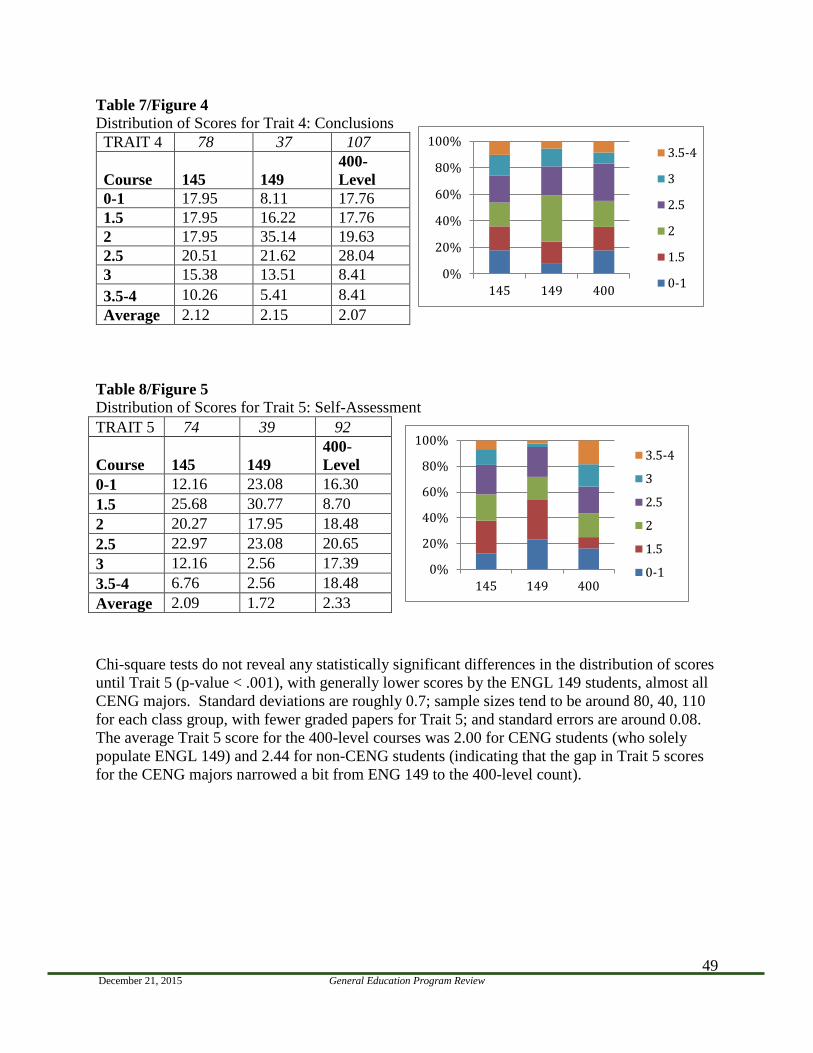
December 21, 2015 General Education Program Review
49
Table 7/Figure 4 Distribution of Scores for Trait 4: Conclusions TRAIT 4 78 37 107
Course 145 149
400-Level
0-1 17.95 8.11 17.76 1.5 17.95 16.22 17.76 2 17.95 35.14 19.63 2.5 20.51 21.62 28.04 3 15.38 13.51 8.41 3.5-4 10.26 5.41 8.41 Average 2.12 2.15 2.07
Table 8/Figure 5 Distribution of Scores for Trait 5: Self-Assessment
Chi-square tests do not reveal any statistically significant differences in the distribution of scores until Trait 5 (p-value < .001), with generally lower scores by the ENGL 149 students, almost all CENG majors. Standard deviations are roughly 0.7; sample sizes tend to be around 80, 40, 110 for each class group, with fewer graded papers for Trait 5; and standard errors are around 0.08. The average Trait 5 score for the 400-level courses was 2.00 for CENG students (who solely populate ENGL 149) and 2.44 for non-CENG students (indicating that the gap in Trait 5 scores for the CENG majors narrowed a bit from ENG 149 to the 400-level count).
TRAIT 5 74 39 92
Course 145 149 400-Level
0-1 12.16 23.08 16.30 1.5 25.68 30.77 8.70 2 20.27 17.95 18.48 2.5 22.97 23.08 20.65 3 12.16 2.56 17.39 3.5-4 6.76 2.56 18.48 Average 2.09 1.72 2.33
0%
20%
40%
60%
80%
100%
145 149 400
3.5-4
3
2.5
2
1.5
0-1
0%
20%
40%
60%
80%
100%
145 149 400
3.5-4
3
2.5
2
1.5
0-1
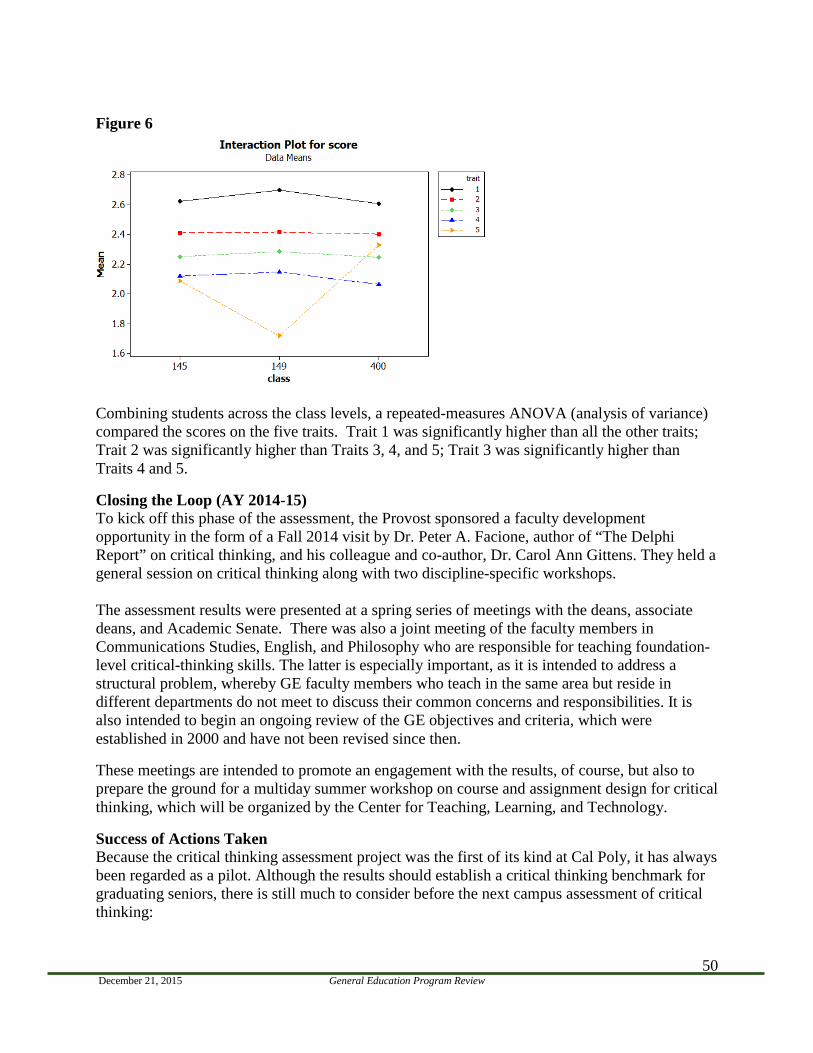
December 21, 2015 General Education Program Review
50
Figure 6
Combining students across the class levels, a repeated-measures ANOVA (analysis of variance) compared the scores on the five traits. Trait 1 was significantly higher than all the other traits; Trait 2 was significantly higher than Traits 3, 4, and 5; Trait 3 was significantly higher than Traits 4 and 5.
Closing the Loop (AY 2014-15) To kick off this phase of the assessment, the Provost sponsored a faculty development opportunity in the form of a Fall 2014 visit by Dr. Peter A. Facione, author of “The Delphi Report” on critical thinking, and his colleague and co-author, Dr. Carol Ann Gittens. They held a general session on critical thinking along with two discipline-specific workshops. The assessment results were presented at a spring series of meetings with the deans, associate deans, and Academic Senate. There was also a joint meeting of the faculty members in Communications Studies, English, and Philosophy who are responsible for teaching foundation-level critical-thinking skills. The latter is especially important, as it is intended to address a structural problem, whereby GE faculty members who teach in the same area but reside in different departments do not meet to discuss their common concerns and responsibilities. It is also intended to begin an ongoing review of the GE objectives and criteria, which were established in 2000 and have not been revised since then.
These meetings are intended to promote an engagement with the results, of course, but also to prepare the ground for a multiday summer workshop on course and assignment design for critical thinking, which will be organized by the Center for Teaching, Learning, and Technology.
Success of Actions Taken Because the critical thinking assessment project was the first of its kind at Cal Poly, it has always been regarded as a pilot. Although the results should establish a critical thinking benchmark for graduating seniors, there is still much to consider before the next campus assessment of critical thinking:
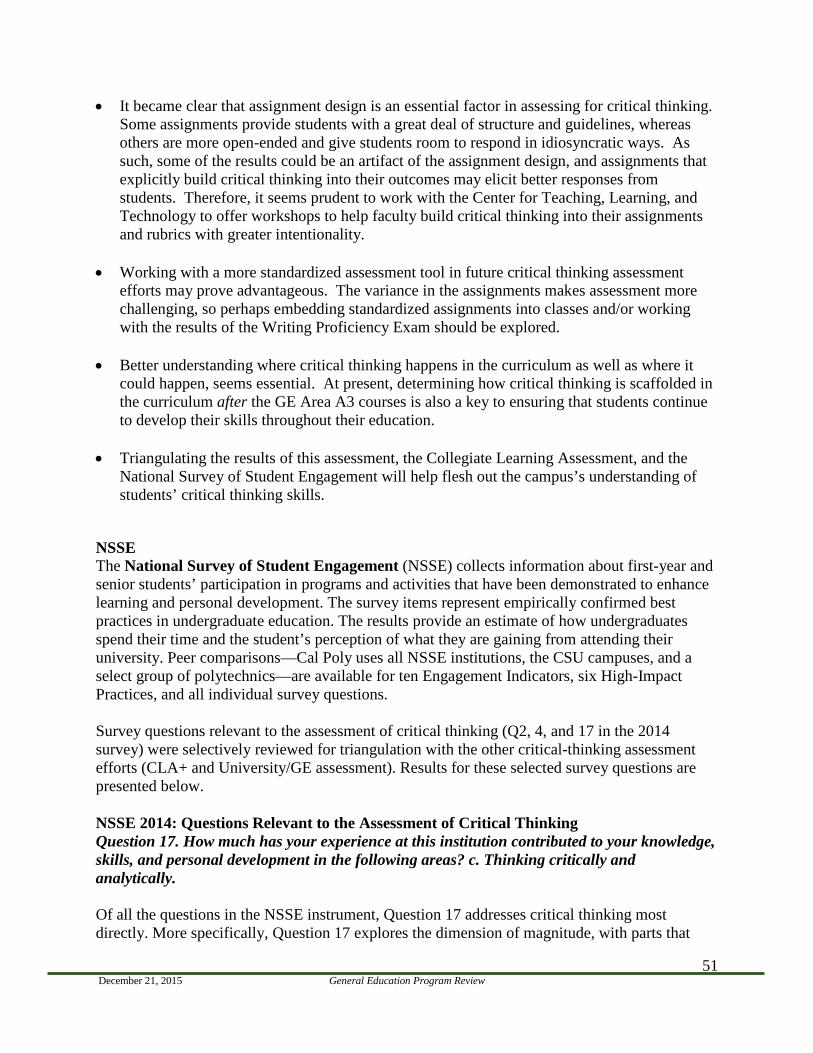
December 21, 2015 General Education Program Review
51
• It became clear that assignment design is an essential factor in assessing for critical thinking. Some assignments provide students with a great deal of structure and guidelines, whereas others are more open-ended and give students room to respond in idiosyncratic ways. As such, some of the results could be an artifact of the assignment design, and assignments that explicitly build critical thinking into their outcomes may elicit better responses from students. Therefore, it seems prudent to work with the Center for Teaching, Learning, and Technology to offer workshops to help faculty build critical thinking into their assignments and rubrics with greater intentionality.
• Working with a more standardized assessment tool in future critical thinking assessment efforts may prove advantageous. The variance in the assignments makes assessment more challenging, so perhaps embedding standardized assignments into classes and/or working with the results of the Writing Proficiency Exam should be explored.
• Better understanding where critical thinking happens in the curriculum as well as where it
could happen, seems essential. At present, determining how critical thinking is scaffolded in the curriculum after the GE Area A3 courses is also a key to ensuring that students continue to develop their skills throughout their education.
• Triangulating the results of this assessment, the Collegiate Learning Assessment, and the
National Survey of Student Engagement will help flesh out the campus’s understanding of students’ critical thinking skills.
NSSE The National Survey of Student Engagement (NSSE) collects information about first-year and senior students’ participation in programs and activities that have been demonstrated to enhance learning and personal development. The survey items represent empirically confirmed best practices in undergraduate education. The results provide an estimate of how undergraduates spend their time and the student’s perception of what they are gaining from attending their university. Peer comparisons—Cal Poly uses all NSSE institutions, the CSU campuses, and a select group of polytechnics—are available for ten Engagement Indicators, six High-Impact Practices, and all individual survey questions. Survey questions relevant to the assessment of critical thinking (Q2, 4, and 17 in the 2014 survey) were selectively reviewed for triangulation with the other critical-thinking assessment efforts (CLA+ and University/GE assessment). Results for these selected survey questions are presented below. NSSE 2014: Questions Relevant to the Assessment of Critical Thinking Question 17. How much has your experience at this institution contributed to your knowledge, skills, and personal development in the following areas? c. Thinking critically and analytically. Of all the questions in the NSSE instrument, Question 17 addresses critical thinking most directly. More specifically, Question 17 explores the dimension of magnitude, with parts that
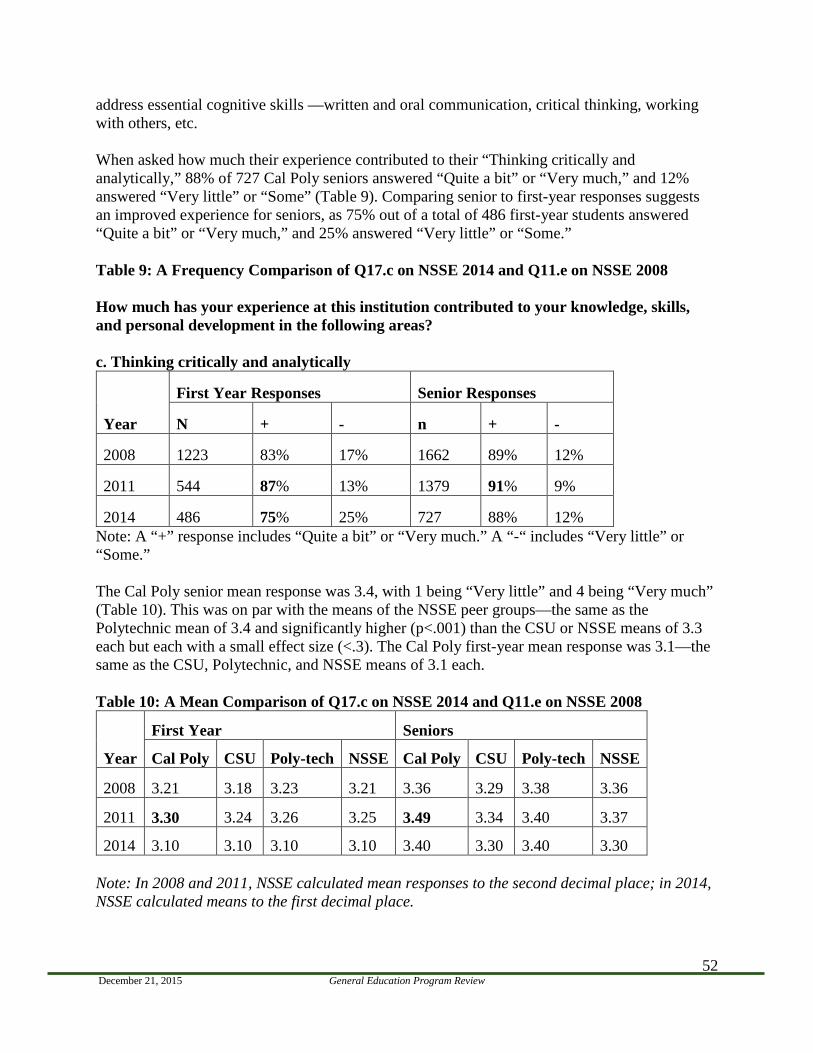
December 21, 2015 General Education Program Review
52
address essential cognitive skills —written and oral communication, critical thinking, working with others, etc. When asked how much their experience contributed to their “Thinking critically and analytically,” 88% of 727 Cal Poly seniors answered “Quite a bit” or “Very much,” and 12% answered “Very little” or “Some” (Table 9). Comparing senior to first-year responses suggests an improved experience for seniors, as 75% out of a total of 486 first-year students answered “Quite a bit” or “Very much,” and 25% answered “Very little” or “Some.” Table 9: A Frequency Comparison of Q17.c on NSSE 2014 and Q11.e on NSSE 2008 How much has your experience at this institution contributed to your knowledge, skills, and personal development in the following areas? c. Thinking critically and analytically
Year
First Year Responses Senior Responses
N + - n + -
2008 1223 83% 17% 1662 89% 12%
2011 544 87% 13% 1379 91% 9%
2014 486 75% 25% 727 88% 12% Note: A “+” response includes “Quite a bit” or “Very much.” A “-“ includes “Very little” or “Some.” The Cal Poly senior mean response was 3.4, with 1 being “Very little” and 4 being “Very much” (Table 10). This was on par with the means of the NSSE peer groups—the same as the Polytechnic mean of 3.4 and significantly higher (p<.001) than the CSU or NSSE means of 3.3 each but each with a small effect size (<.3). The Cal Poly first-year mean response was 3.1—the same as the CSU, Polytechnic, and NSSE means of 3.1 each. Table 10: A Mean Comparison of Q17.c on NSSE 2014 and Q11.e on NSSE 2008
Year
First Year Seniors
Cal Poly CSU Poly-tech NSSE Cal Poly CSU Poly-tech NSSE
2008 3.21 3.18 3.23 3.21 3.36 3.29 3.38 3.36
2011 3.30 3.24 3.26 3.25 3.49 3.34 3.40 3.37
2014 3.10 3.10 3.10 3.10 3.40 3.30 3.40 3.30 Note: In 2008 and 2011, NSSE calculated mean responses to the second decimal place; in 2014, NSSE calculated means to the first decimal place.
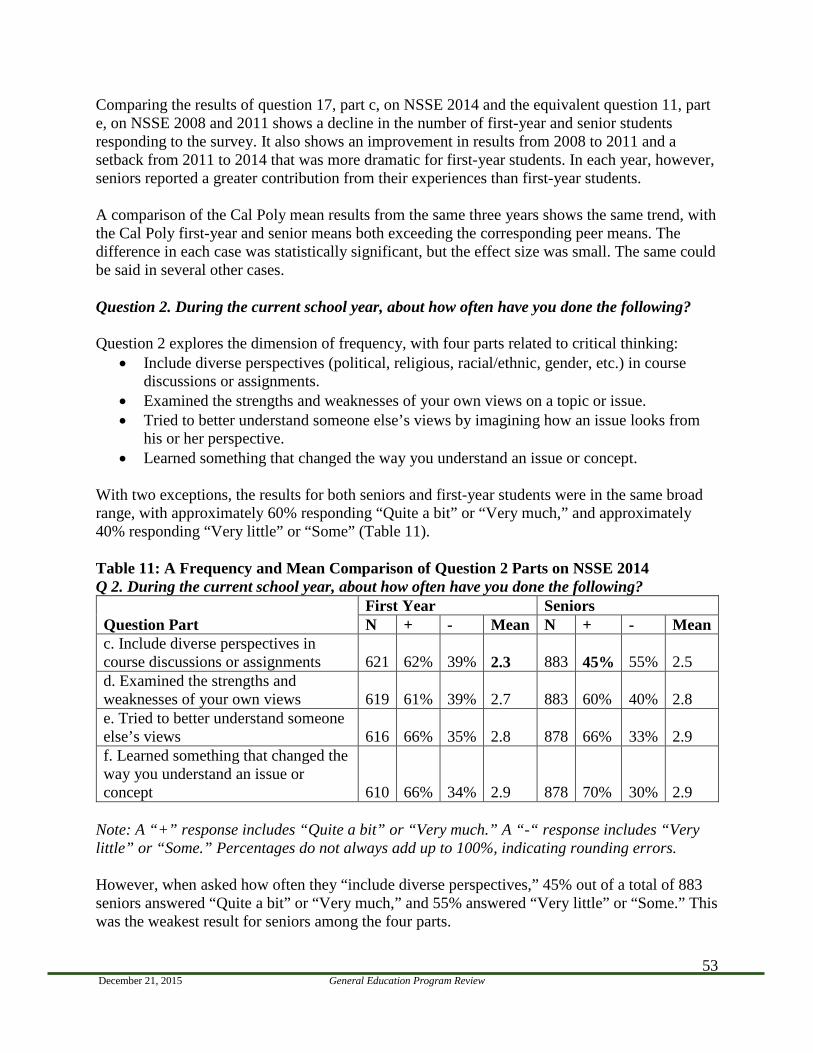
December 21, 2015 General Education Program Review
53
Comparing the results of question 17, part c, on NSSE 2014 and the equivalent question 11, part e, on NSSE 2008 and 2011 shows a decline in the number of first-year and senior students responding to the survey. It also shows an improvement in results from 2008 to 2011 and a setback from 2011 to 2014 that was more dramatic for first-year students. In each year, however, seniors reported a greater contribution from their experiences than first-year students. A comparison of the Cal Poly mean results from the same three years shows the same trend, with the Cal Poly first-year and senior means both exceeding the corresponding peer means. The difference in each case was statistically significant, but the effect size was small. The same could be said in several other cases. Question 2. During the current school year, about how often have you done the following? Question 2 explores the dimension of frequency, with four parts related to critical thinking:
• Include diverse perspectives (political, religious, racial/ethnic, gender, etc.) in course discussions or assignments.
• Examined the strengths and weaknesses of your own views on a topic or issue. • Tried to better understand someone else’s views by imagining how an issue looks from
his or her perspective. • Learned something that changed the way you understand an issue or concept.
With two exceptions, the results for both seniors and first-year students were in the same broad range, with approximately 60% responding “Quite a bit” or “Very much,” and approximately 40% responding “Very little” or “Some” (Table 11). Table 11: A Frequency and Mean Comparison of Question 2 Parts on NSSE 2014 Q 2. During the current school year, about how often have you done the following?
Question Part First Year Seniors N + - Mean N + - Mean
c. Include diverse perspectives in course discussions or assignments 621 62% 39% 2.3 883 45% 55% 2.5 d. Examined the strengths and weaknesses of your own views 619 61% 39% 2.7 883 60% 40% 2.8 e. Tried to better understand someone else’s views 616 66% 35% 2.8 878 66% 33% 2.9 f. Learned something that changed the way you understand an issue or concept 610 66% 34% 2.9 878 70% 30% 2.9
Note: A “+” response includes “Quite a bit” or “Very much.” A “-“ response includes “Very little” or “Some.” Percentages do not always add up to 100%, indicating rounding errors. However, when asked how often they “include diverse perspectives,” 45% out of a total of 883 seniors answered “Quite a bit” or “Very much,” and 55% answered “Very little” or “Some.” This was the weakest result for seniors among the four parts.
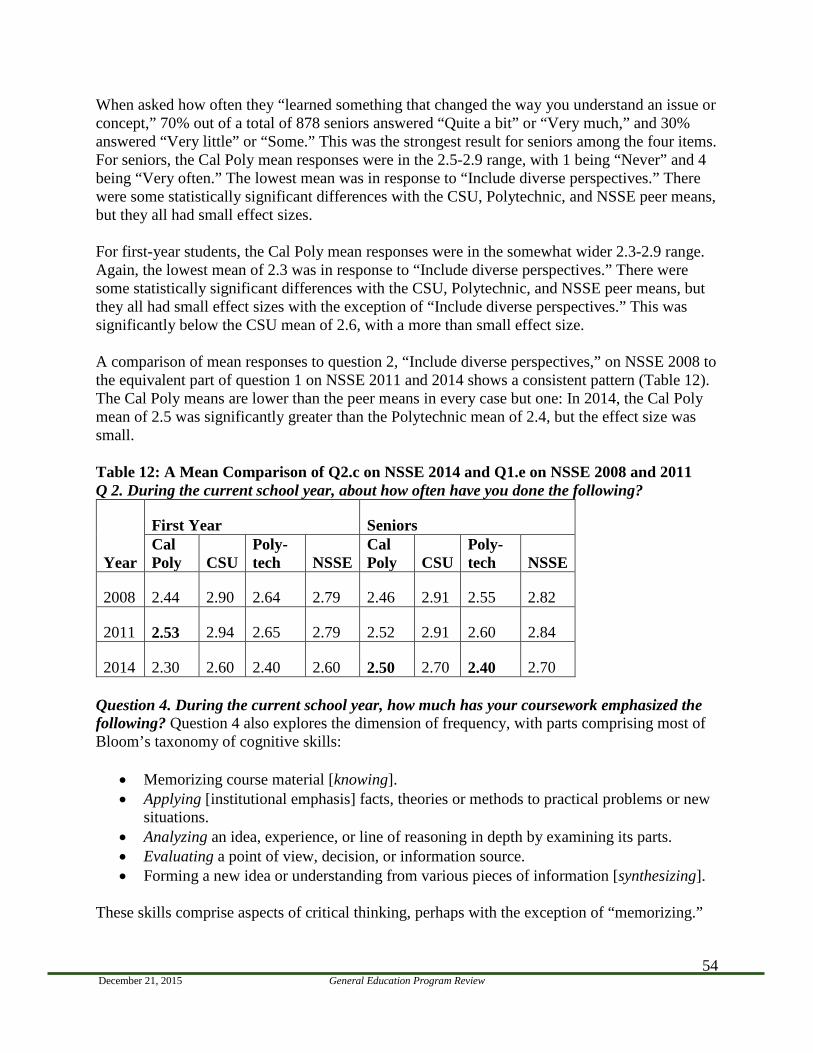
December 21, 2015 General Education Program Review
54
When asked how often they “learned something that changed the way you understand an issue or concept,” 70% out of a total of 878 seniors answered “Quite a bit” or “Very much,” and 30% answered “Very little” or “Some.” This was the strongest result for seniors among the four items. For seniors, the Cal Poly mean responses were in the 2.5-2.9 range, with 1 being “Never” and 4 being “Very often.” The lowest mean was in response to “Include diverse perspectives.” There were some statistically significant differences with the CSU, Polytechnic, and NSSE peer means, but they all had small effect sizes. For first-year students, the Cal Poly mean responses were in the somewhat wider 2.3-2.9 range. Again, the lowest mean of 2.3 was in response to “Include diverse perspectives.” There were some statistically significant differences with the CSU, Polytechnic, and NSSE peer means, but they all had small effect sizes with the exception of “Include diverse perspectives.” This was significantly below the CSU mean of 2.6, with a more than small effect size. A comparison of mean responses to question 2, “Include diverse perspectives,” on NSSE 2008 to the equivalent part of question 1 on NSSE 2011 and 2014 shows a consistent pattern (Table 12). The Cal Poly means are lower than the peer means in every case but one: In 2014, the Cal Poly mean of 2.5 was significantly greater than the Polytechnic mean of 2.4, but the effect size was small. Table 12: A Mean Comparison of Q2.c on NSSE 2014 and Q1.e on NSSE 2008 and 2011 Q 2. During the current school year, about how often have you done the following?
Year
First Year Seniors Cal Poly CSU
Poly-tech NSSE
Cal Poly CSU
Poly-tech NSSE
2008 2.44 2.90 2.64 2.79 2.46 2.91 2.55 2.82
2011 2.53 2.94 2.65 2.79 2.52 2.91 2.60 2.84
2014 2.30 2.60 2.40 2.60 2.50 2.70 2.40 2.70 Question 4. During the current school year, how much has your coursework emphasized the following? Question 4 also explores the dimension of frequency, with parts comprising most of Bloom’s taxonomy of cognitive skills:
• Memorizing course material [knowing]. • Applying [institutional emphasis] facts, theories or methods to practical problems or new
situations. • Analyzing an idea, experience, or line of reasoning in depth by examining its parts. • Evaluating a point of view, decision, or information source. • Forming a new idea or understanding from various pieces of information [synthesizing].
These skills comprise aspects of critical thinking, perhaps with the exception of “memorizing.”
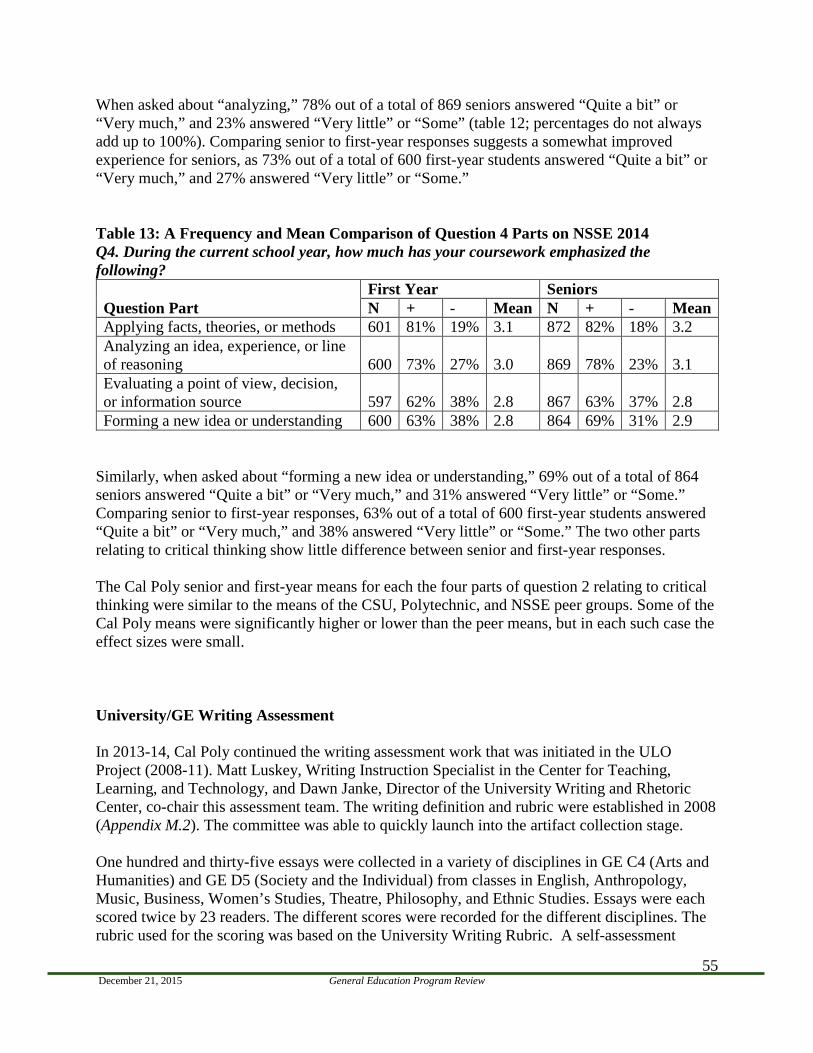
December 21, 2015 General Education Program Review
55
When asked about “analyzing,” 78% out of a total of 869 seniors answered “Quite a bit” or “Very much,” and 23% answered “Very little” or “Some” (table 12; percentages do not always add up to 100%). Comparing senior to first-year responses suggests a somewhat improved experience for seniors, as 73% out of a total of 600 first-year students answered “Quite a bit” or “Very much,” and 27% answered “Very little” or “Some.” Table 13: A Frequency and Mean Comparison of Question 4 Parts on NSSE 2014 Q4. During the current school year, how much has your coursework emphasized the following?
Question Part First Year Seniors N + - Mean N + - Mean
Applying facts, theories, or methods 601 81% 19% 3.1 872 82% 18% 3.2 Analyzing an idea, experience, or line of reasoning 600 73% 27% 3.0 869 78% 23% 3.1 Evaluating a point of view, decision, or information source 597 62% 38% 2.8 867 63% 37% 2.8 Forming a new idea or understanding 600 63% 38% 2.8 864 69% 31% 2.9
Similarly, when asked about “forming a new idea or understanding,” 69% out of a total of 864 seniors answered “Quite a bit” or “Very much,” and 31% answered “Very little” or “Some.” Comparing senior to first-year responses, 63% out of a total of 600 first-year students answered “Quite a bit” or “Very much,” and 38% answered “Very little” or “Some.” The two other parts relating to critical thinking show little difference between senior and first-year responses. The Cal Poly senior and first-year means for each the four parts of question 2 relating to critical thinking were similar to the means of the CSU, Polytechnic, and NSSE peer groups. Some of the Cal Poly means were significantly higher or lower than the peer means, but in each such case the effect sizes were small. University/GE Writing Assessment In 2013-14, Cal Poly continued the writing assessment work that was initiated in the ULO Project (2008-11). Matt Luskey, Writing Instruction Specialist in the Center for Teaching, Learning, and Technology, and Dawn Janke, Director of the University Writing and Rhetoric Center, co-chair this assessment team. The writing definition and rubric were established in 2008 (Appendix M.2). The committee was able to quickly launch into the artifact collection stage. One hundred and thirty-five essays were collected in a variety of disciplines in GE C4 (Arts and Humanities) and GE D5 (Society and the Individual) from classes in English, Anthropology, Music, Business, Women’s Studies, Theatre, Philosophy, and Ethnic Studies. Essays were each scored twice by 23 readers. The different scores were recorded for the different disciplines. The rubric used for the scoring was based on the University Writing Rubric. A self-assessment
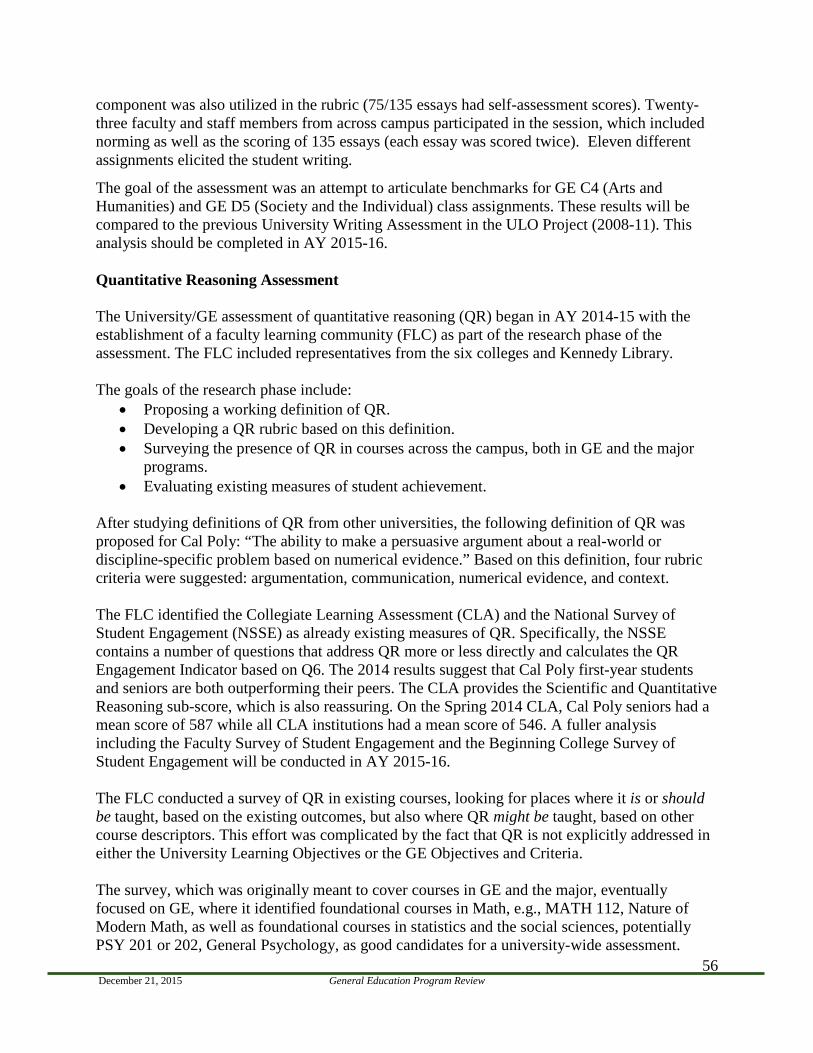
December 21, 2015 General Education Program Review
56
component was also utilized in the rubric (75/135 essays had self-assessment scores). Twenty-three faculty and staff members from across campus participated in the session, which included norming as well as the scoring of 135 essays (each essay was scored twice). Eleven different assignments elicited the student writing.
The goal of the assessment was an attempt to articulate benchmarks for GE C4 (Arts and Humanities) and GE D5 (Society and the Individual) class assignments. These results will be compared to the previous University Writing Assessment in the ULO Project (2008-11). This analysis should be completed in AY 2015-16. Quantitative Reasoning Assessment The University/GE assessment of quantitative reasoning (QR) began in AY 2014-15 with the establishment of a faculty learning community (FLC) as part of the research phase of the assessment. The FLC included representatives from the six colleges and Kennedy Library. The goals of the research phase include:
• Proposing a working definition of QR. • Developing a QR rubric based on this definition. • Surveying the presence of QR in courses across the campus, both in GE and the major
programs. • Evaluating existing measures of student achievement.
After studying definitions of QR from other universities, the following definition of QR was proposed for Cal Poly: “The ability to make a persuasive argument about a real-world or discipline-specific problem based on numerical evidence.” Based on this definition, four rubric criteria were suggested: argumentation, communication, numerical evidence, and context. The FLC identified the Collegiate Learning Assessment (CLA) and the National Survey of Student Engagement (NSSE) as already existing measures of QR. Specifically, the NSSE contains a number of questions that address QR more or less directly and calculates the QR Engagement Indicator based on Q6. The 2014 results suggest that Cal Poly first-year students and seniors are both outperforming their peers. The CLA provides the Scientific and Quantitative Reasoning sub-score, which is also reassuring. On the Spring 2014 CLA, Cal Poly seniors had a mean score of 587 while all CLA institutions had a mean score of 546. A fuller analysis including the Faculty Survey of Student Engagement and the Beginning College Survey of Student Engagement will be conducted in AY 2015-16. The FLC conducted a survey of QR in existing courses, looking for places where it is or should be taught, based on the existing outcomes, but also where QR might be taught, based on other course descriptors. This effort was complicated by the fact that QR is not explicitly addressed in either the University Learning Objectives or the GE Objectives and Criteria. The survey, which was originally meant to cover courses in GE and the major, eventually focused on GE, where it identified foundational courses in Math, e.g., MATH 112, Nature of Modern Math, as well as foundational courses in statistics and the social sciences, potentially PSY 201 or 202, General Psychology, as good candidates for a university-wide assessment.
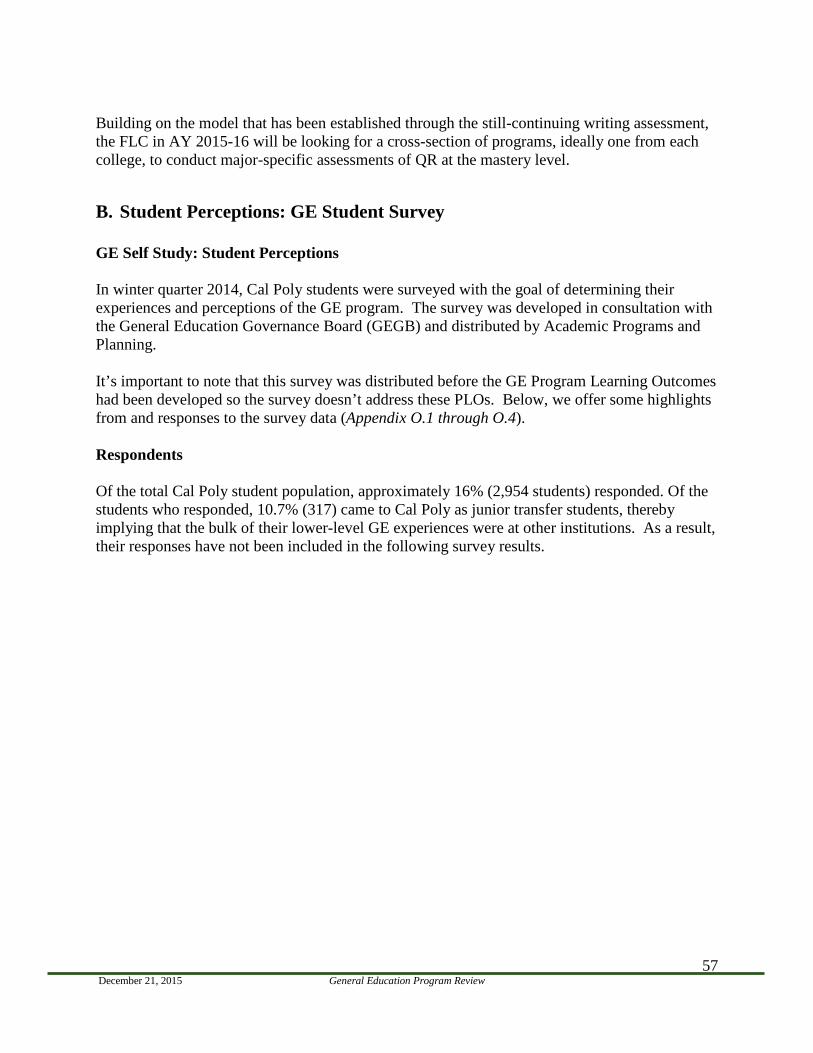
December 21, 2015 General Education Program Review
57
Building on the model that has been established through the still-continuing writing assessment, the FLC in AY 2015-16 will be looking for a cross-section of programs, ideally one from each college, to conduct major-specific assessments of QR at the mastery level.
B. Student Perceptions: GE Student Survey
GE Self Study: Student Perceptions In winter quarter 2014, Cal Poly students were surveyed with the goal of determining their experiences and perceptions of the GE program. The survey was developed in consultation with the General Education Governance Board (GEGB) and distributed by Academic Programs and Planning. It’s important to note that this survey was distributed before the GE Program Learning Outcomes had been developed so the survey doesn’t address these PLOs. Below, we offer some highlights from and responses to the survey data (Appendix O.1 through O.4). Respondents Of the total Cal Poly student population, approximately 16% (2,954 students) responded. Of the students who responded, 10.7% (317) came to Cal Poly as junior transfer students, thereby implying that the bulk of their lower-level GE experiences were at other institutions. As a result, their responses have not been included in the following survey results.
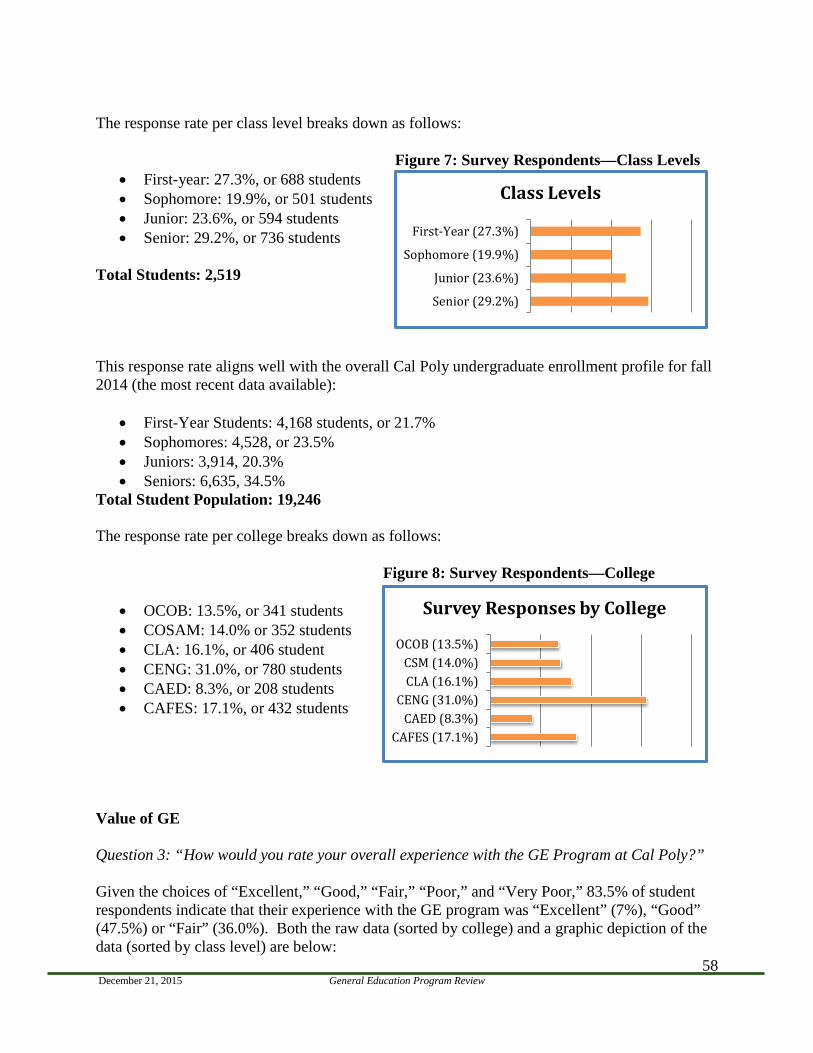
December 21, 2015 General Education Program Review
58
The response rate per class level breaks down as follows: Figure 7: Survey Respondents—Class Levels
• First-year: 27.3%, or 688 students • Sophomore: 19.9%, or 501 students • Junior: 23.6%, or 594 students • Senior: 29.2%, or 736 students
Total Students: 2,519 This response rate aligns well with the overall Cal Poly undergraduate enrollment profile for fall 2014 (the most recent data available):
• First-Year Students: 4,168 students, or 21.7% • Sophomores: 4,528, or 23.5% • Juniors: 3,914, 20.3% • Seniors: 6,635, 34.5%
Total Student Population: 19,246 The response rate per college breaks down as follows:
Figure 8: Survey Respondents—College
• OCOB: 13.5%, or 341 students • COSAM: 14.0% or 352 students • CLA: 16.1%, or 406 student • CENG: 31.0%, or 780 students • CAED: 8.3%, or 208 students • CAFES: 17.1%, or 432 students
Value of GE Question 3: “How would you rate your overall experience with the GE Program at Cal Poly?” Given the choices of “Excellent,” “Good,” “Fair,” “Poor,” and “Very Poor,” 83.5% of student respondents indicate that their experience with the GE program was “Excellent” (7%), “Good” (47.5%) or “Fair” (36.0%). Both the raw data (sorted by college) and a graphic depiction of the data (sorted by class level) are below:
Senior (29.2%)
Junior (23.6%)
Sophomore (19.9%)
First-Year (27.3%)
Class Levels
CAFES (17.1%)CAED (8.3%)
CENG (31.0%)CLA (16.1%)CSM (14.0%)
OCOB (13.5%)
Survey Responses by College
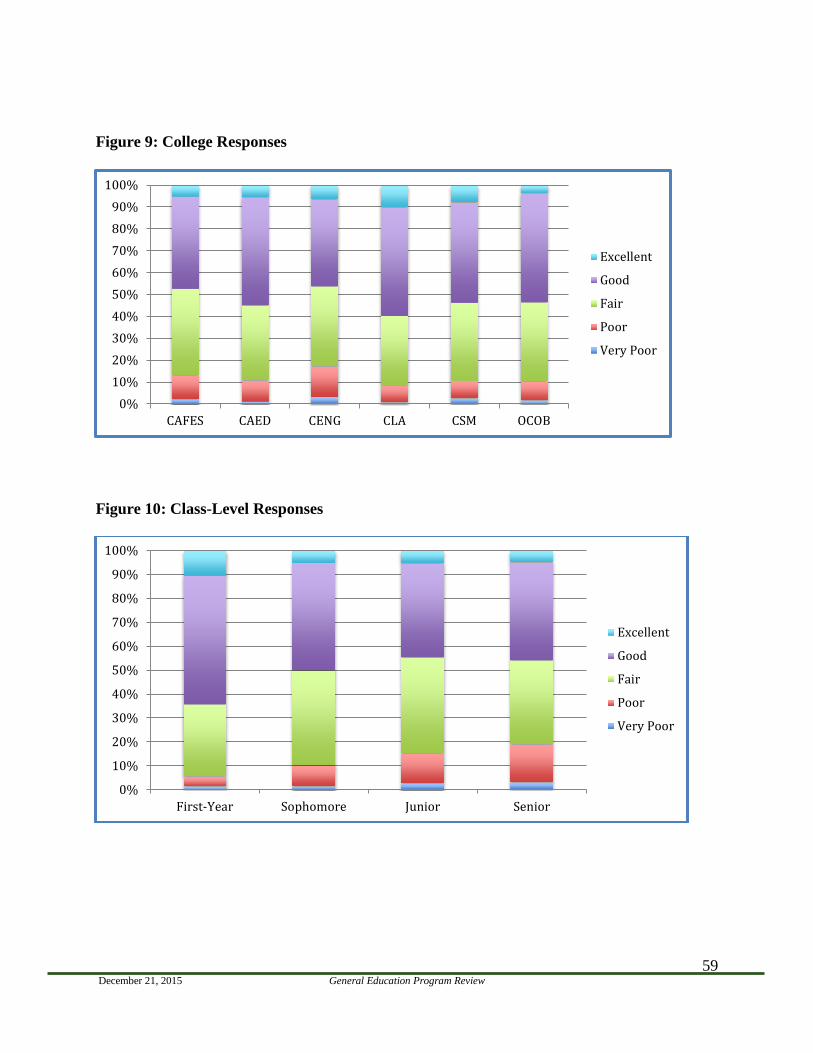
December 21, 2015 General Education Program Review
59
Figure 9: College Responses
Figure 10: Class-Level Responses
0%
10%
20%
30%
40%
50%
60%
70%
80%
90%
100%
First-Year Sophomore Junior Senior
Excellent
Good
Fair
Poor
Very Poor
0%10%20%30%40%50%60%70%80%90%
100%
CAFES CAED CENG CLA CSM OCOB
Excellent
Good
Fair
Poor
Very Poor
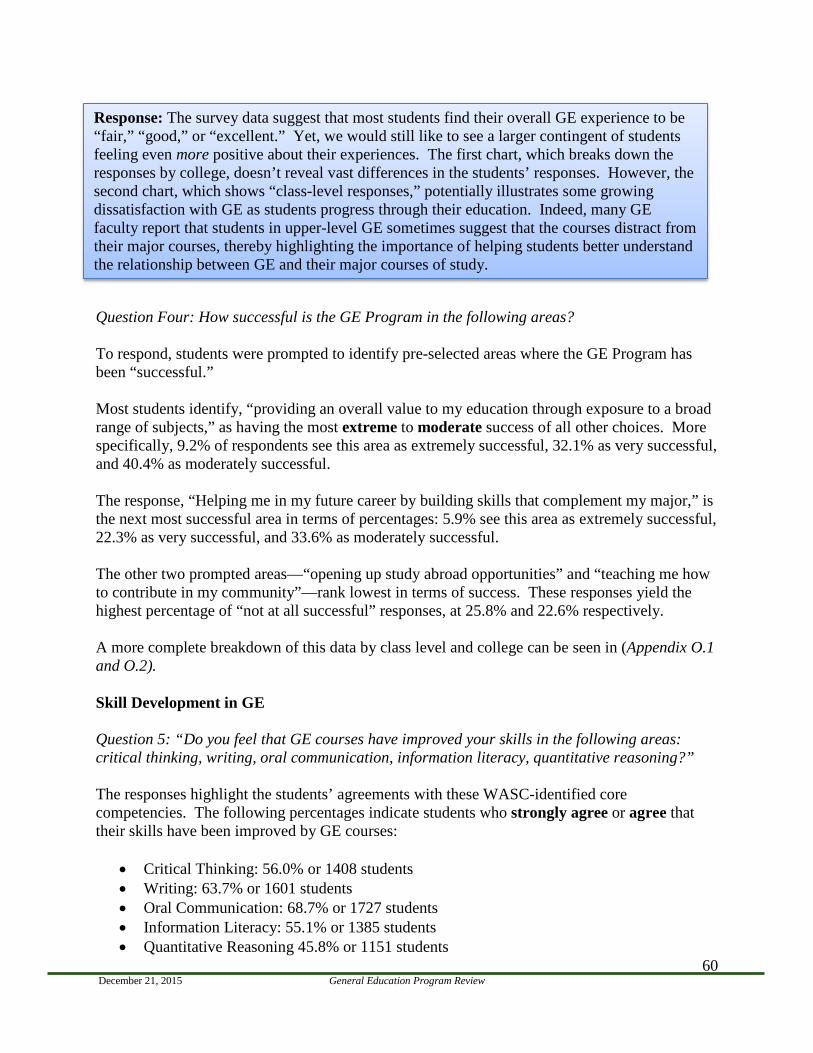
December 21, 2015 General Education Program Review
60
Question Four: How successful is the GE Program in the following areas? To respond, students were prompted to identify pre-selected areas where the GE Program has been “successful.” Most students identify, “providing an overall value to my education through exposure to a broad range of subjects,” as having the most extreme to moderate success of all other choices. More specifically, 9.2% of respondents see this area as extremely successful, 32.1% as very successful, and 40.4% as moderately successful. The response, “Helping me in my future career by building skills that complement my major,” is the next most successful area in terms of percentages: 5.9% see this area as extremely successful, 22.3% as very successful, and 33.6% as moderately successful. The other two prompted areas—“opening up study abroad opportunities” and “teaching me how to contribute in my community”—rank lowest in terms of success. These responses yield the highest percentage of “not at all successful” responses, at 25.8% and 22.6% respectively. A more complete breakdown of this data by class level and college can be seen in (Appendix O.1 and O.2). Skill Development in GE Question 5: “Do you feel that GE courses have improved your skills in the following areas: critical thinking, writing, oral communication, information literacy, quantitative reasoning?” The responses highlight the students’ agreements with these WASC-identified core competencies. The following percentages indicate students who strongly agree or agree that their skills have been improved by GE courses:
• Critical Thinking: 56.0% or 1408 students • Writing: 63.7% or 1601 students • Oral Communication: 68.7% or 1727 students • Information Literacy: 55.1% or 1385 students • Quantitative Reasoning 45.8% or 1151 students
Response: The survey data suggest that most students find their overall GE experience to be “fair,” “good,” or “excellent.” Yet, we would still like to see a larger contingent of students feeling even more positive about their experiences. The first chart, which breaks down the responses by college, doesn’t reveal vast differences in the students’ responses. However, the second chart, which shows “class-level responses,” potentially illustrates some growing dissatisfaction with GE as students progress through their education. Indeed, many GE faculty report that students in upper-level GE sometimes suggest that the courses distract from their major courses, thereby highlighting the importance of helping students better understand the relationship between GE and their major courses of study.
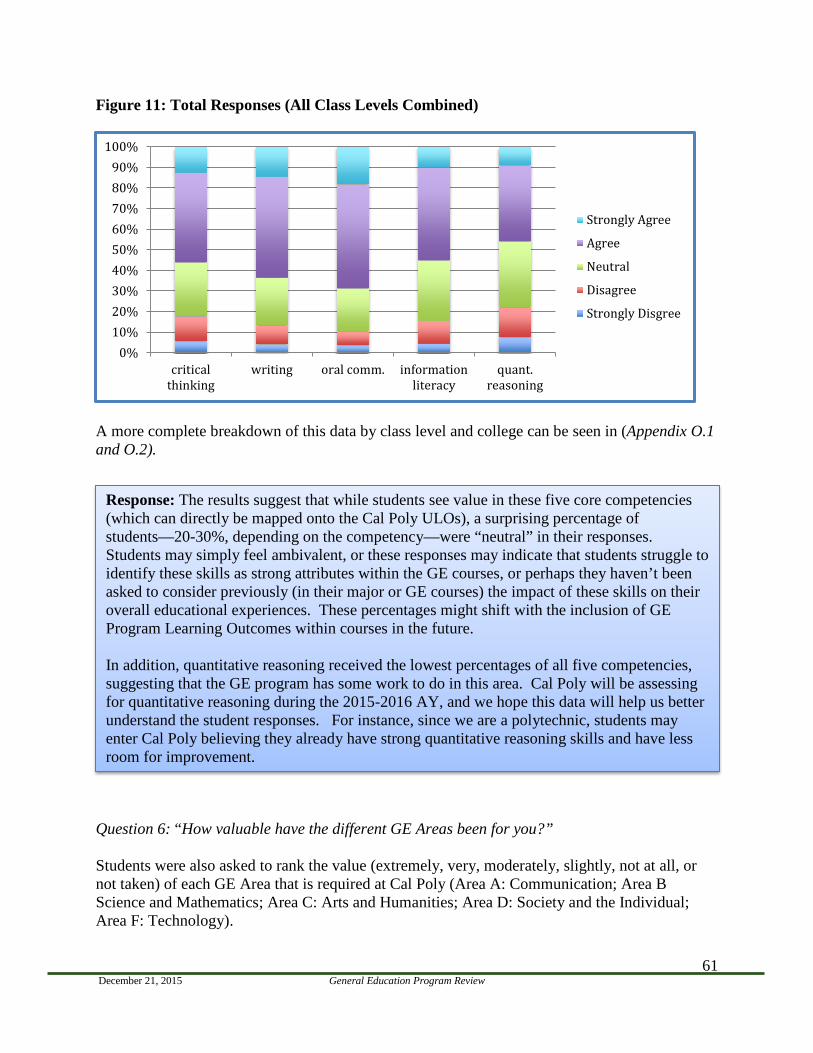
December 21, 2015 General Education Program Review
61
Figure 11: Total Responses (All Class Levels Combined)
A more complete breakdown of this data by class level and college can be seen in (Appendix O.1 and O.2).
Question 6: “How valuable have the different GE Areas been for you?” Students were also asked to rank the value (extremely, very, moderately, slightly, not at all, or not taken) of each GE Area that is required at Cal Poly (Area A: Communication; Area B Science and Mathematics; Area C: Arts and Humanities; Area D: Society and the Individual; Area F: Technology).
0%10%20%30%40%50%60%70%80%90%
100%
criticalthinking
writing oral comm. informationliteracy
quant.reasoning
Strongly Agree
Agree
Neutral
Disagree
Strongly Disgree
Response: The results suggest that while students see value in these five core competencies (which can directly be mapped onto the Cal Poly ULOs), a surprising percentage of students—20-30%, depending on the competency—were “neutral” in their responses. Students may simply feel ambivalent, or these responses may indicate that students struggle to identify these skills as strong attributes within the GE courses, or perhaps they haven’t been asked to consider previously (in their major or GE courses) the impact of these skills on their overall educational experiences. These percentages might shift with the inclusion of GE Program Learning Outcomes within courses in the future. In addition, quantitative reasoning received the lowest percentages of all five competencies, suggesting that the GE program has some work to do in this area. Cal Poly will be assessing for quantitative reasoning during the 2015-2016 AY, and we hope this data will help us better understand the student responses. For instance, since we are a polytechnic, students may enter Cal Poly believing they already have strong quantitative reasoning skills and have less room for improvement.
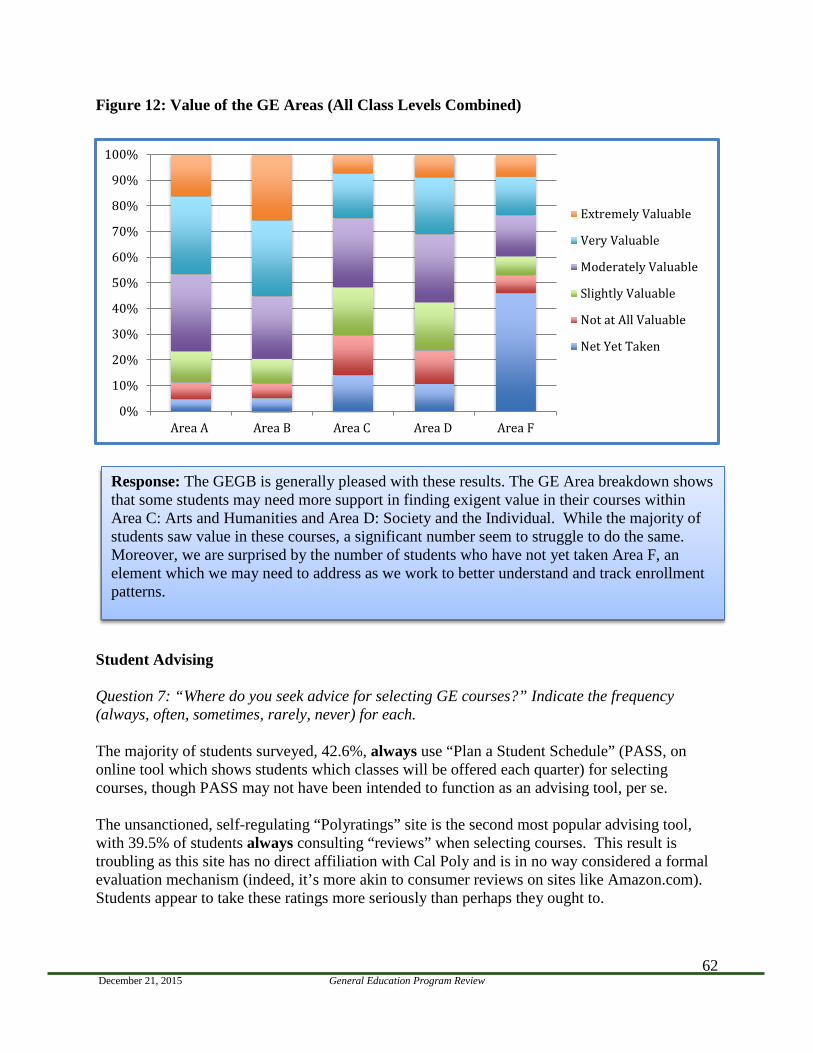
December 21, 2015 General Education Program Review
62
Figure 12: Value of the GE Areas (All Class Levels Combined)
Student Advising Question 7: “Where do you seek advice for selecting GE courses?” Indicate the frequency (always, often, sometimes, rarely, never) for each. The majority of students surveyed, 42.6%, always use “Plan a Student Schedule” (PASS, on online tool which shows students which classes will be offered each quarter) for selecting courses, though PASS may not have been intended to function as an advising tool, per se. The unsanctioned, self-regulating “Polyratings” site is the second most popular advising tool, with 39.5% of students always consulting “reviews” when selecting courses. This result is troubling as this site has no direct affiliation with Cal Poly and is in no way considered a formal evaluation mechanism (indeed, it’s more akin to consumer reviews on sites like Amazon.com). Students appear to take these ratings more seriously than perhaps they ought to.
Response: The GEGB is generally pleased with these results. The GE Area breakdown shows that some students may need more support in finding exigent value in their courses within Area C: Arts and Humanities and Area D: Society and the Individual. While the majority of students saw value in these courses, a significant number seem to struggle to do the same. Moreover, we are surprised by the number of students who have not yet taken Area F, an element which we may need to address as we work to better understand and track enrollment patterns.
0%
10%
20%
30%
40%
50%
60%
70%
80%
90%
100%
Area A Area B Area C Area D Area F
Extremely Valuable
Very Valuable
Moderately Valuable
Slightly Valuable
Not at All Valuable
Net Yet Taken
December 21, 2015 General Education Program Review
63
In addition, 31.8% of students always consult their friends. The same three sources, though in different order, reflect the next highest percentages of where students often go for selecting GE courses: friends, 41.8%; PASS, 33.1%; and Polyratings, 32.2%. Student survey responses also reveal that a large percentage of students never use a formal advisor or advising centers for selecting courses. More specifically, 79.1% of students surveyed have never used the Mustang Success Center. Additionally, 50.8% never use their college advising centers and 55.6% never use the GE website. While the Mustang Success Center is still a relatively new resource for students, these particular percentages offer an important glimpse into the resources students do and do not rely on when selecting their GE courses. Question 8: “When selecting GE courses, which is your level of disagreement or agreement with the following statements:”
• I follow the flow chart for my major. • I follow the recommendations of my advisor. • I choose GE courses that fit my schedule after I select courses for my major. • I select GE 100-200 level courses with a goal of completing them by my junior year.
An overwhelming 45.1%, of students strongly agreed, and 41.3% agreed that they choose GE courses that fit their schedules after selecting their own major courses. This response reinforces the notion that students, when choosing GE courses, default to choices that work around classes for their major course of study, perhaps without serious consideration of learning outcomes or identified departmental/programmatic curricular flowcharts. Also, given the responses to question eight, the role and recommendation of advisors for GE course selection highlighted in question nine had the lowest percentage of strongly agree (15.2%, or 449 students).
Student Comments Best Thing About GE The survey asks students to share their favorite elements of GE. Of the 2,954 students who responded to the multiple-choice portion of the survey, 2,299, or 77.8%, commented on this question. We have identified the most common responses and represented them below. The same results can be found broken down by college (Appendix O.3). Please note that the
Response: The GEGB found these responses quite revealing. It likely goes without saying that advising plays a crucial role on campus. Yet the data illustrate a need to continue to develop better advising for GE. The GEGB director intends to meet with campus advisors in the upcoming year to strengthen the relationship between GE and advising. Moreover, the GEGB is also working to ensure that catalog course descriptions and course titles—two elements students encounter on PASS, the most frequently used advising tool—are written with a student audience in mind. Indeed, during this past review cycle, the GEGB had this data in mind as we worked with a few course proposers to make their descriptions more “student friendly.”
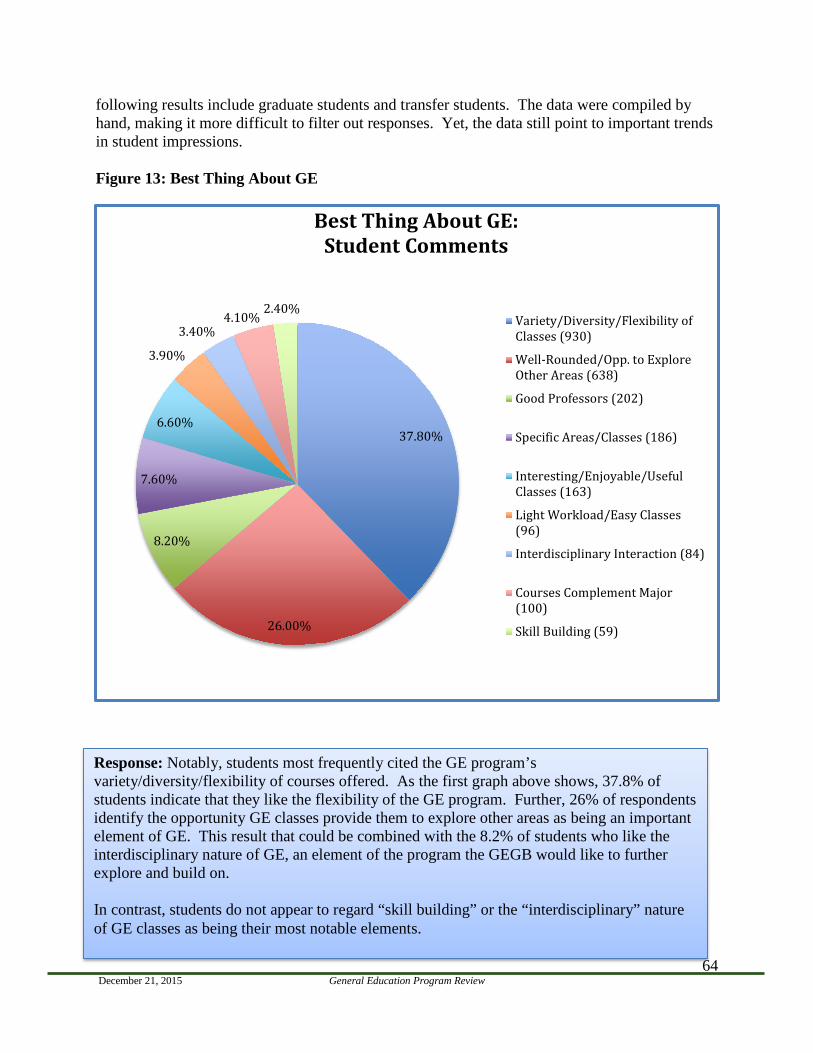
December 21, 2015 General Education Program Review
64
following results include graduate students and transfer students. The data were compiled by hand, making it more difficult to filter out responses. Yet, the data still point to important trends in student impressions. Figure 13: Best Thing About GE
37.80%
26.00%
8.20%
7.60%
6.60%
3.90%
3.40% 4.10%
2.40%
Best Thing About GE: Student Comments
Variety/Diversity/Flexibility ofClasses (930)
Well-Rounded/Opp. to ExploreOther Areas (638)
Good Professors (202)
Specific Areas/Classes (186)
Interesting/Enjoyable/UsefulClasses (163)
Light Workload/Easy Classes(96)
Interdisciplinary Interaction (84)
Courses Complement Major(100)
Skill Building (59)
Response: Notably, students most frequently cited the GE program’s variety/diversity/flexibility of courses offered. As the first graph above shows, 37.8% of students indicate that they like the flexibility of the GE program. Further, 26% of respondents identify the opportunity GE classes provide them to explore other areas as being an important element of GE. This result that could be combined with the 8.2% of students who like the interdisciplinary nature of GE, an element of the program the GEGB would like to further explore and build on. In contrast, students do not appear to regard “skill building” or the “interdisciplinary” nature of GE classes as being their most notable elements.
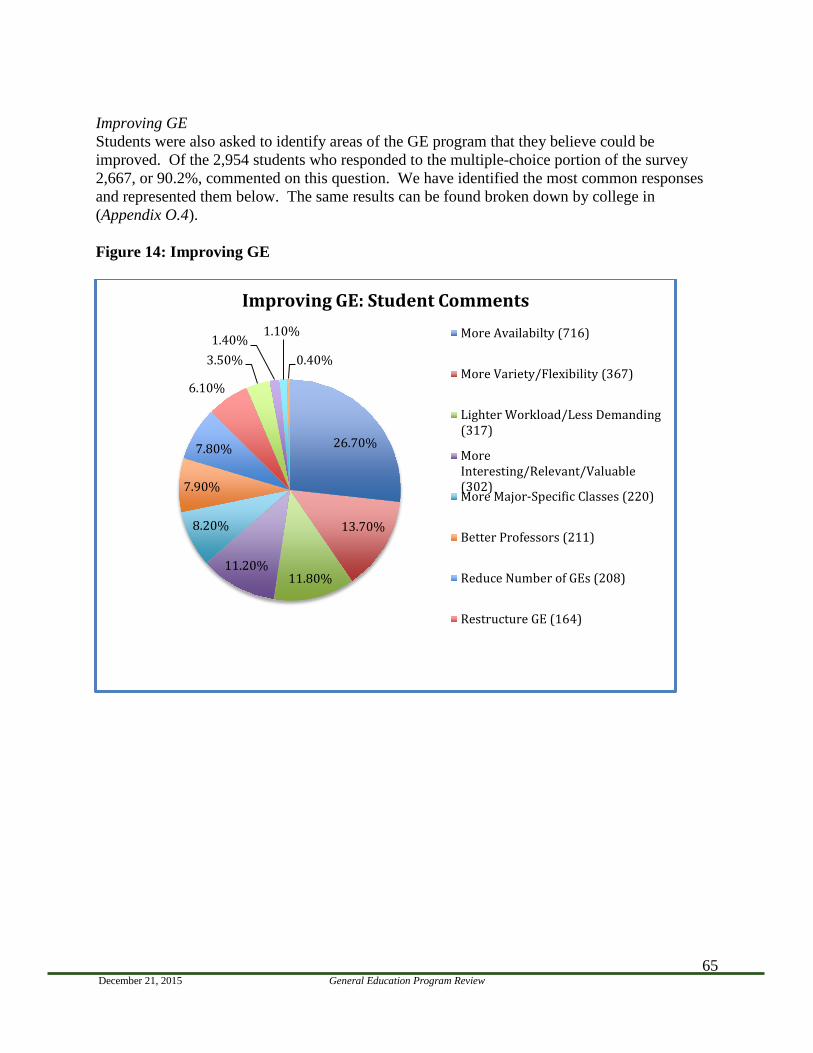
December 21, 2015 General Education Program Review
65
Improving GE Students were also asked to identify areas of the GE program that they believe could be improved. Of the 2,954 students who responded to the multiple-choice portion of the survey 2,667, or 90.2%, commented on this question. We have identified the most common responses and represented them below. The same results can be found broken down by college in (Appendix O.4). Figure 14: Improving GE
26.70%
13.70%
11.80% 11.20%
8.20%
7.90%
7.80%
6.10%
3.50% 1.40%
1.10%
0.40%
Improving GE: Student Comments More Availabilty (716)
More Variety/Flexibility (367)
Lighter Workload/Less Demanding(317)
MoreInteresting/Relevant/Valuable(302)More Major-Specific Classes (220)
Better Professors (211)
Reduce Number of GEs (208)
Restructure GE (164)
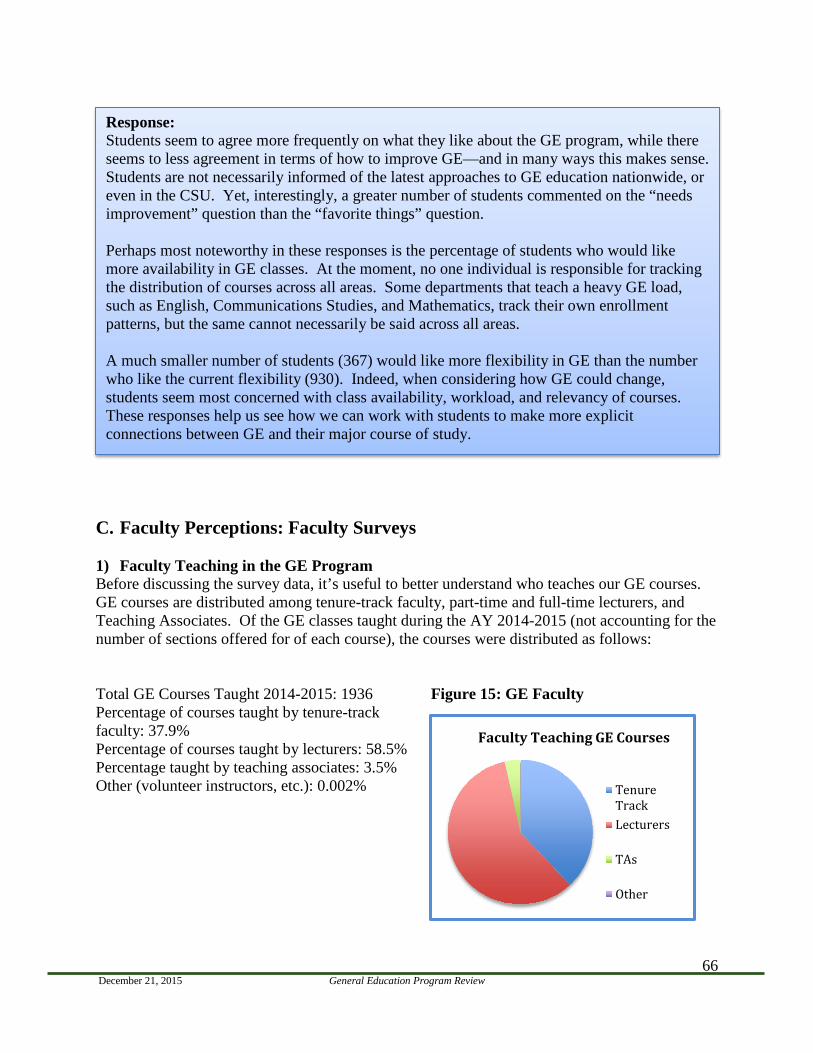
December 21, 2015 General Education Program Review
66
C. Faculty Perceptions: Faculty Surveys 1) Faculty Teaching in the GE Program Before discussing the survey data, it’s useful to better understand who teaches our GE courses. GE courses are distributed among tenure-track faculty, part-time and full-time lecturers, and Teaching Associates. Of the GE classes taught during the AY 2014-2015 (not accounting for the number of sections offered for of each course), the courses were distributed as follows: Total GE Courses Taught 2014-2015: 1936 Figure 15: GE Faculty Percentage of courses taught by tenure-track faculty: 37.9% Percentage of courses taught by lecturers: 58.5% Percentage taught by teaching associates: 3.5% Other (volunteer instructors, etc.): 0.002%
Response: Students seem to agree more frequently on what they like about the GE program, while there seems to less agreement in terms of how to improve GE—and in many ways this makes sense. Students are not necessarily informed of the latest approaches to GE education nationwide, or even in the CSU. Yet, interestingly, a greater number of students commented on the “needs improvement” question than the “favorite things” question. Perhaps most noteworthy in these responses is the percentage of students who would like more availability in GE classes. At the moment, no one individual is responsible for tracking the distribution of courses across all areas. Some departments that teach a heavy GE load, such as English, Communications Studies, and Mathematics, track their own enrollment patterns, but the same cannot necessarily be said across all areas. A much smaller number of students (367) would like more flexibility in GE than the number who like the current flexibility (930). Indeed, when considering how GE could change, students seem most concerned with class availability, workload, and relevancy of courses. These responses help us see how we can work with students to make more explicit connections between GE and their major course of study.
Faculty Teaching GE Courses
TenureTrackLecturers
TAs
Other
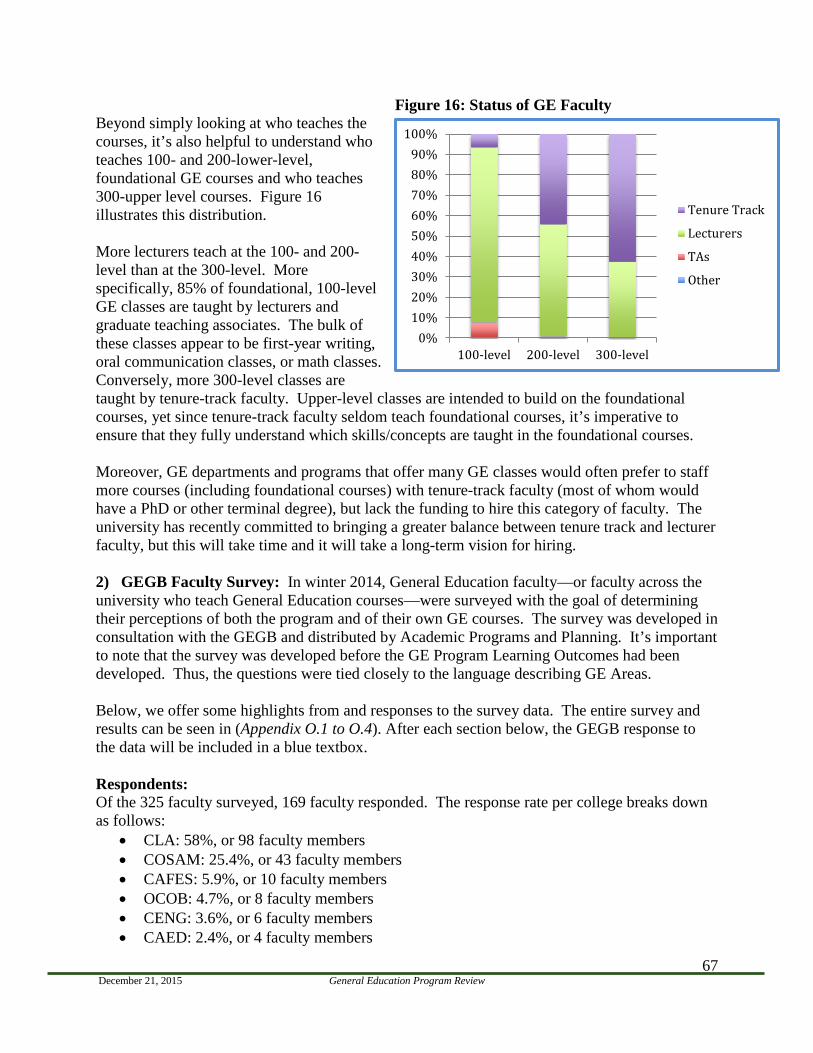
December 21, 2015 General Education Program Review
67
Figure 16: Status of GE Faculty Beyond simply looking at who teaches the courses, it’s also helpful to understand who teaches 100- and 200-lower-level, foundational GE courses and who teaches 300-upper level courses. Figure 16 illustrates this distribution. More lecturers teach at the 100- and 200-level than at the 300-level. More specifically, 85% of foundational, 100-level GE classes are taught by lecturers and graduate teaching associates. The bulk of these classes appear to be first-year writing, oral communication classes, or math classes. Conversely, more 300-level classes are taught by tenure-track faculty. Upper-level classes are intended to build on the foundational courses, yet since tenure-track faculty seldom teach foundational courses, it’s imperative to ensure that they fully understand which skills/concepts are taught in the foundational courses. Moreover, GE departments and programs that offer many GE classes would often prefer to staff more courses (including foundational courses) with tenure-track faculty (most of whom would have a PhD or other terminal degree), but lack the funding to hire this category of faculty. The university has recently committed to bringing a greater balance between tenure track and lecturer faculty, but this will take time and it will take a long-term vision for hiring. 2) GEGB Faculty Survey: In winter 2014, General Education faculty—or faculty across the university who teach General Education courses—were surveyed with the goal of determining their perceptions of both the program and of their own GE courses. The survey was developed in consultation with the GEGB and distributed by Academic Programs and Planning. It’s important to note that the survey was developed before the GE Program Learning Outcomes had been developed. Thus, the questions were tied closely to the language describing GE Areas. Below, we offer some highlights from and responses to the survey data. The entire survey and results can be seen in (Appendix O.1 to O.4). After each section below, the GEGB response to the data will be included in a blue textbox. Respondents: Of the 325 faculty surveyed, 169 faculty responded. The response rate per college breaks down as follows:
• CLA: 58%, or 98 faculty members • COSAM: 25.4%, or 43 faculty members • CAFES: 5.9%, or 10 faculty members • OCOB: 4.7%, or 8 faculty members • CENG: 3.6%, or 6 faculty members • CAED: 2.4%, or 4 faculty members
0%10%20%30%40%50%60%70%80%90%
100%
100-level 200-level 300-level
Tenure Track
Lecturers
TAs
Other
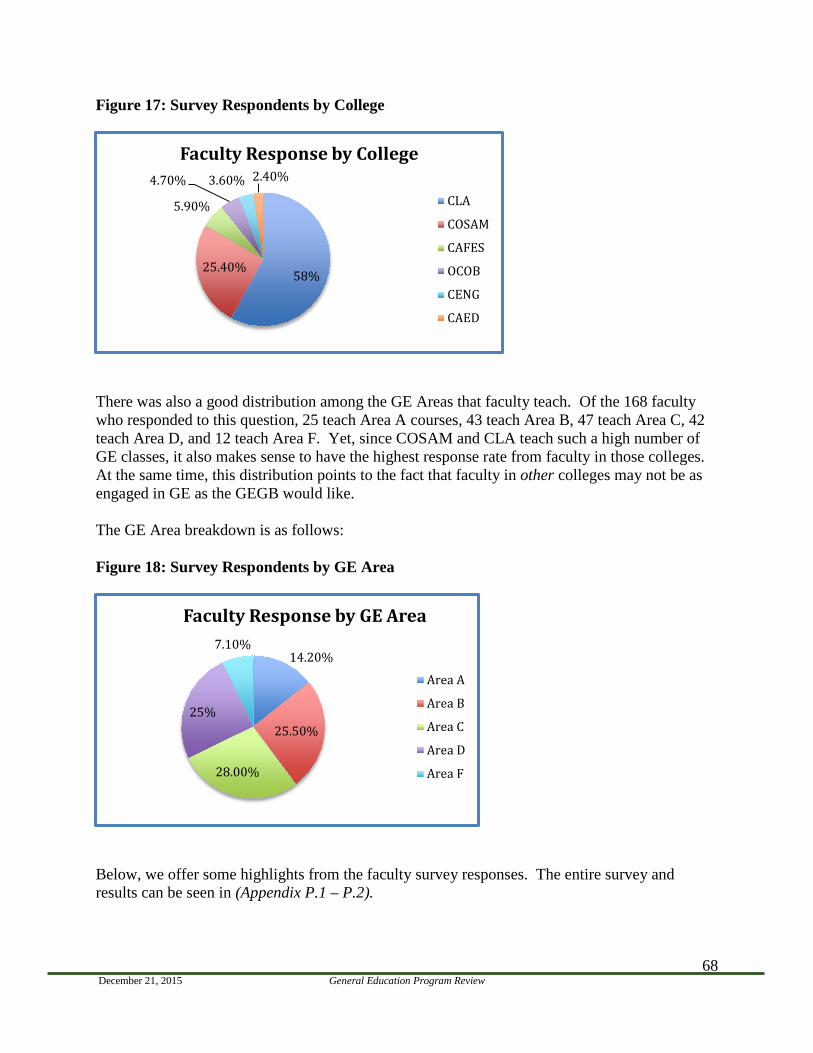
December 21, 2015 General Education Program Review
68
Figure 17: Survey Respondents by College
There was also a good distribution among the GE Areas that faculty teach. Of the 168 faculty who responded to this question, 25 teach Area A courses, 43 teach Area B, 47 teach Area C, 42 teach Area D, and 12 teach Area F. Yet, since COSAM and CLA teach such a high number of GE classes, it also makes sense to have the highest response rate from faculty in those colleges. At the same time, this distribution points to the fact that faculty in other colleges may not be as engaged in GE as the GEGB would like. The GE Area breakdown is as follows: Figure 18: Survey Respondents by GE Area
Below, we offer some highlights from the faculty survey responses. The entire survey and results can be seen in (Appendix P.1 – P.2).
58% 25.40%
5.90%
4.70% 3.60% 2.40% Faculty Response by College
CLA
COSAM
CAFES
OCOB
CENG
CAED
14.20%
25.50%
28.00%
25%
7.10%
Faculty Response by GE Area
Area A
Area B
Area C
Area D
Area F
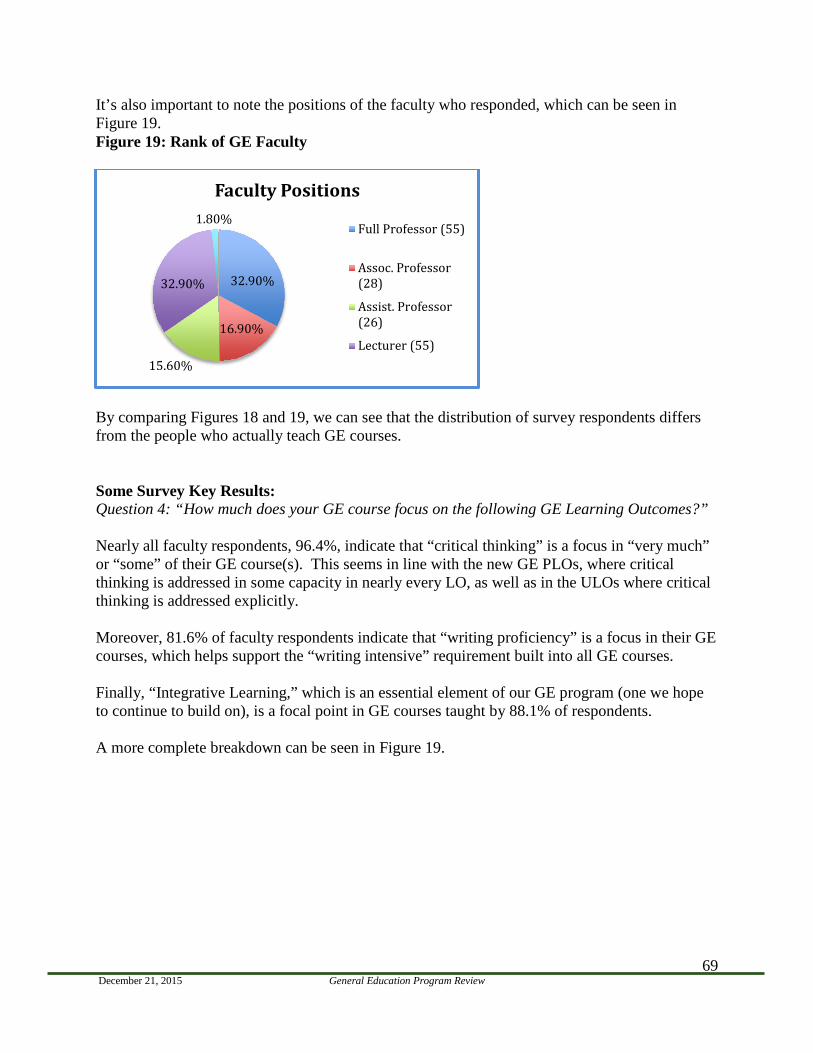
December 21, 2015 General Education Program Review
69
It’s also important to note the positions of the faculty who responded, which can be seen in Figure 19. Figure 19: Rank of GE Faculty
By comparing Figures 18 and 19, we can see that the distribution of survey respondents differs from the people who actually teach GE courses. Some Survey Key Results: Question 4: “How much does your GE course focus on the following GE Learning Outcomes?” Nearly all faculty respondents, 96.4%, indicate that “critical thinking” is a focus in “very much” or “some” of their GE course(s). This seems in line with the new GE PLOs, where critical thinking is addressed in some capacity in nearly every LO, as well as in the ULOs where critical thinking is addressed explicitly. Moreover, 81.6% of faculty respondents indicate that “writing proficiency” is a focus in their GE courses, which helps support the “writing intensive” requirement built into all GE courses. Finally, “Integrative Learning,” which is an essential element of our GE program (one we hope to continue to build on), is a focal point in GE courses taught by 88.1% of respondents. A more complete breakdown can be seen in Figure 19.
32.90%
16.90%
15.60%
32.90%
1.80%
Faculty Positions
Full Professor (55)
Assoc. Professor(28)
Assist. Professor(26)
Lecturer (55)
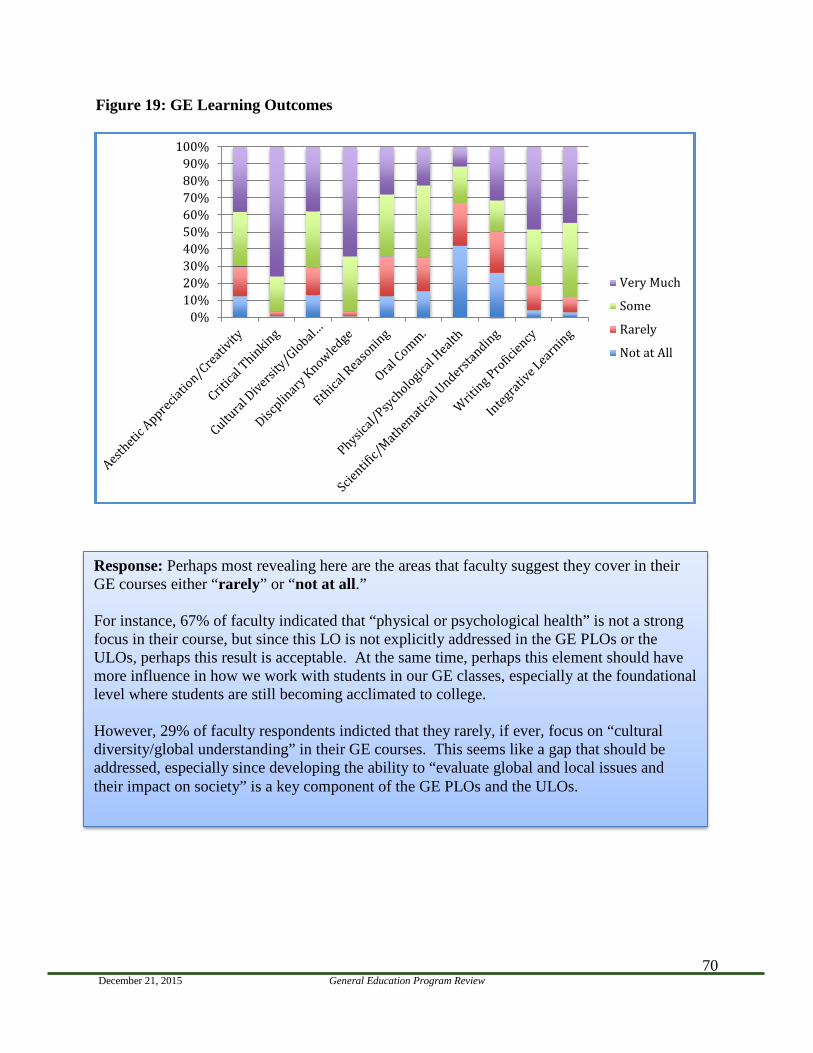
December 21, 2015 General Education Program Review
70
Figure 19: GE Learning Outcomes
0%10%20%30%40%50%60%70%80%90%
100%
Very Much
Some
Rarely
Not at All
Response: Perhaps most revealing here are the areas that faculty suggest they cover in their GE courses either “rarely” or “not at all.” For instance, 67% of faculty indicated that “physical or psychological health” is not a strong focus in their course, but since this LO is not explicitly addressed in the GE PLOs or the ULOs, perhaps this result is acceptable. At the same time, perhaps this element should have more influence in how we work with students in our GE classes, especially at the foundational level where students are still becoming acclimated to college. However, 29% of faculty respondents indicted that they rarely, if ever, focus on “cultural diversity/global understanding” in their GE courses. This seems like a gap that should be addressed, especially since developing the ability to “evaluate global and local issues and their impact on society” is a key component of the GE PLOs and the ULOs.
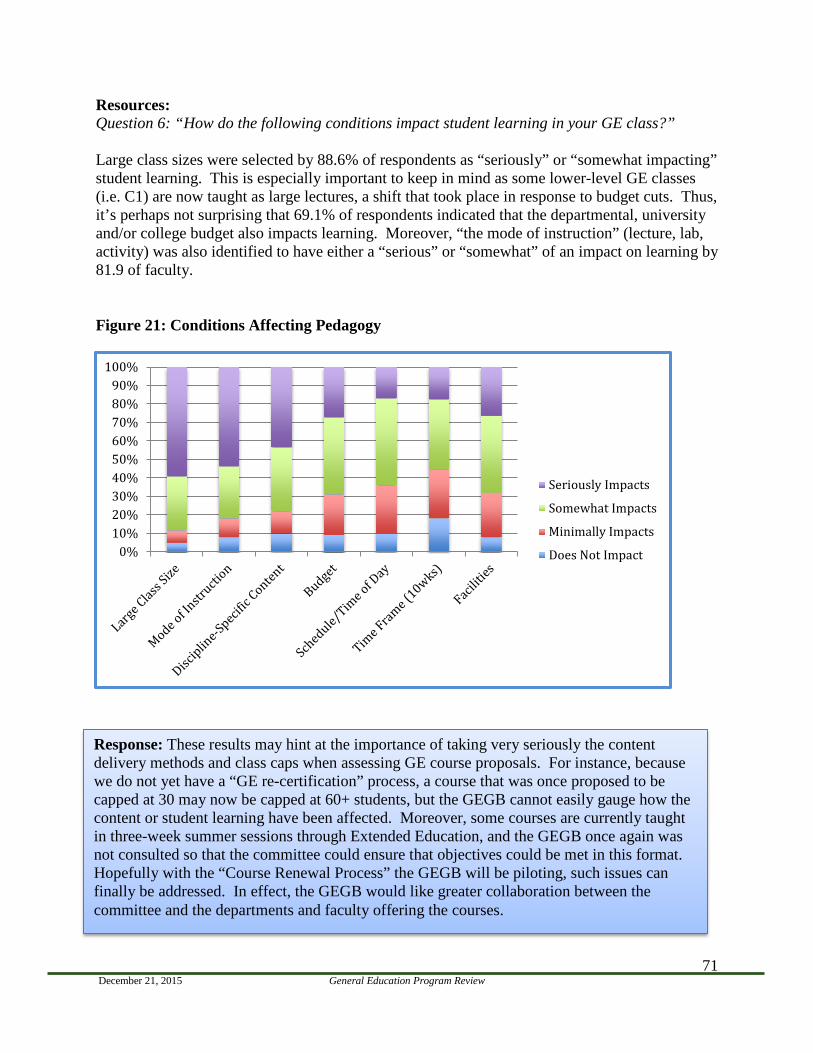
December 21, 2015 General Education Program Review
71
Resources: Question 6: “How do the following conditions impact student learning in your GE class?” Large class sizes were selected by 88.6% of respondents as “seriously” or “somewhat impacting” student learning. This is especially important to keep in mind as some lower-level GE classes (i.e. C1) are now taught as large lectures, a shift that took place in response to budget cuts. Thus, it’s perhaps not surprising that 69.1% of respondents indicated that the departmental, university and/or college budget also impacts learning. Moreover, “the mode of instruction” (lecture, lab, activity) was also identified to have either a “serious” or “somewhat” of an impact on learning by 81.9 of faculty. Figure 21: Conditions Affecting Pedagogy
0%10%20%30%40%50%60%70%80%90%
100%
Seriously Impacts
Somewhat Impacts
Minimally Impacts
Does Not Impact
Response: These results may hint at the importance of taking very seriously the content delivery methods and class caps when assessing GE course proposals. For instance, because we do not yet have a “GE re-certification” process, a course that was once proposed to be capped at 30 may now be capped at 60+ students, but the GEGB cannot easily gauge how the content or student learning have been affected. Moreover, some courses are currently taught in three-week summer sessions through Extended Education, and the GEGB once again was not consulted so that the committee could ensure that objectives could be met in this format. Hopefully with the “Course Renewal Process” the GEGB will be piloting, such issues can finally be addressed. In effect, the GEGB would like greater collaboration between the committee and the departments and faculty offering the courses.
December 21, 2015 General Education Program Review
72
Support for Assessment Question 5: “Would you be willing to supply completed student assignments to be used for assessment of GE Learning Outcomes?” The survey was also distributed with the intention of identifying faculty who would be willing to participate in university-wide assessment efforts. Unfortunately, only 38.7% of respondents indicated a willingness to supply student artifacts. Faculty who lead campus-wide assessment efforts have found it challenging to collect student work for direct assessment. Perhaps this reluctance points to a kind of fatigue that sets in when faculty think about assessment. In any case, the university is still working to build a culture of assessment on campus. Ideally faculty who teach GE courses would regularly submit student work for assessment, but this level of organization has not yet been attained. Question 7: “How useful would the following methods of assessment be for measuring GE focused learning objectives in your course?”
• E-portfolio • Common assignment used in several courses in a GE Area • Indirect assignment (surveys) • Standardized general education/university assessment exam • Supplying assignment data to an assessment committee
Faculty seem to find most “methods of assessment” to be “minimally” or “not at all useful” for measuring GE learning outcomes in GE courses. It’s possible faculty are unsure what it means to assess the GE program, or they fear adding to their workload, but it does seem that faculty still have a tentative relationship with university and GE assessment. However, respondents express interest in experimenting with pedagogical methods and approaches. More specifically, respondents showed interest in linked courses (75%), variable content courses (70%), and themed courses (80%). We regard this as a positive result that highlights the instructors’ openness to experimentation and new directions.
Response: The reluctance of nearly 2/3 of respondents to directly support assessment may indicate a need for the GEGB, in conjunction with other campus leaders (such as the Academic Assessment Council), to further convey the importance of assessment to faculty who teach GE courses. During last year’s writing assessment efforts, for instance, the assessment coordinators had trouble collecting work from faculty teaching “writing intensive” GE courses, with some faculty indicating that they didn’t assign much or any writing (despite the curricular requirement to do so). Yet, the respondents’ willingness to explore different pedagogical models and desire to explore new approaches to content delivery is very encouraging!
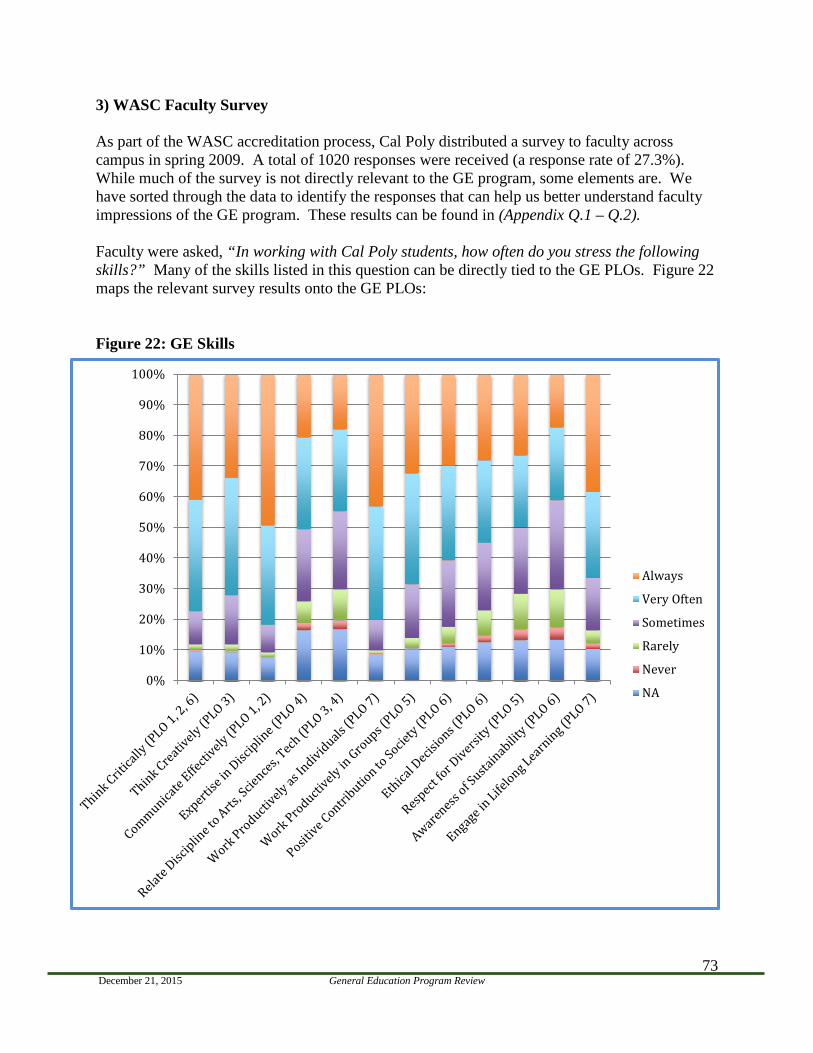
December 21, 2015 General Education Program Review
73
3) WASC Faculty Survey As part of the WASC accreditation process, Cal Poly distributed a survey to faculty across campus in spring 2009. A total of 1020 responses were received (a response rate of 27.3%). While much of the survey is not directly relevant to the GE program, some elements are. We have sorted through the data to identify the responses that can help us better understand faculty impressions of the GE program. These results can be found in (Appendix Q.1 – Q.2). Faculty were asked, “In working with Cal Poly students, how often do you stress the following skills?” Many of the skills listed in this question can be directly tied to the GE PLOs. Figure 22 maps the relevant survey results onto the GE PLOs: Figure 22: GE Skills
0%
10%
20%
30%
40%
50%
60%
70%
80%
90%
100%
Always
Very Often
Sometimes
Rarely
Never
NA
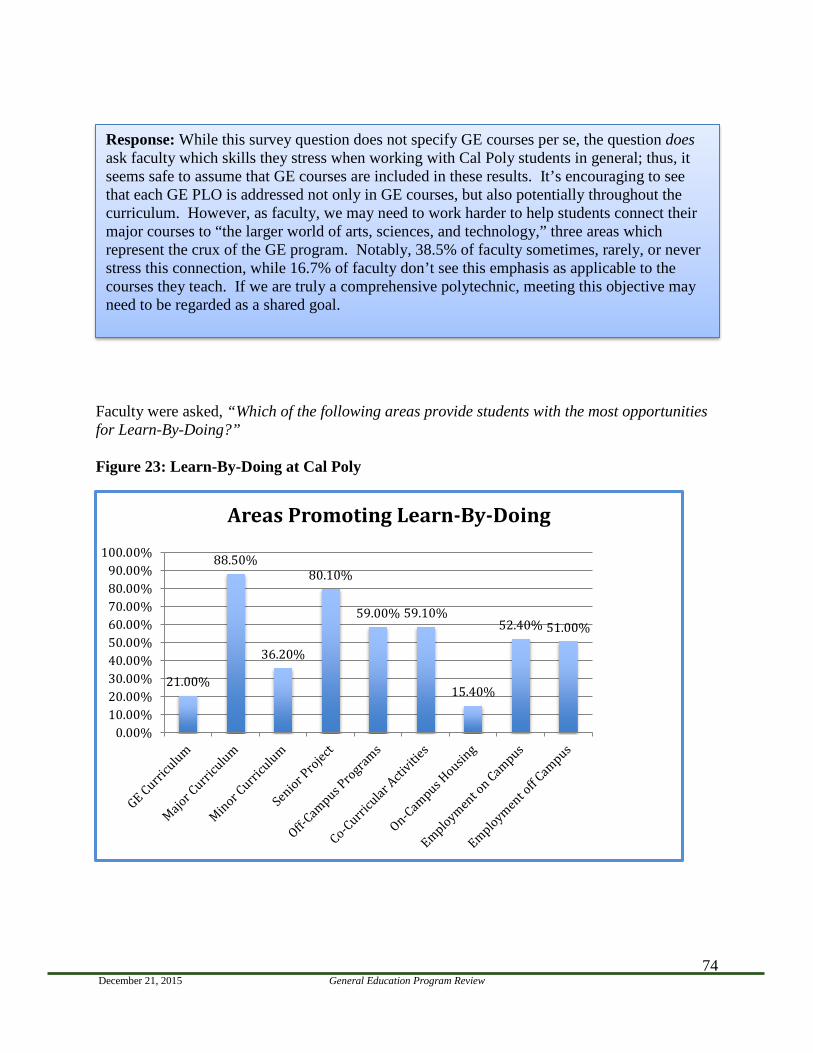
December 21, 2015 General Education Program Review
74
Faculty were asked, “Which of the following areas provide students with the most opportunities for Learn-By-Doing?” Figure 23: Learn-By-Doing at Cal Poly
Response: While this survey question does not specify GE courses per se, the question does ask faculty which skills they stress when working with Cal Poly students in general; thus, it seems safe to assume that GE courses are included in these results. It’s encouraging to see that each GE PLO is addressed not only in GE courses, but also potentially throughout the curriculum. However, as faculty, we may need to work harder to help students connect their major courses to “the larger world of arts, sciences, and technology,” three areas which represent the crux of the GE program. Notably, 38.5% of faculty sometimes, rarely, or never stress this connection, while 16.7% of faculty don’t see this emphasis as applicable to the courses they teach. If we are truly a comprehensive polytechnic, meeting this objective may need to be regarded as a shared goal.
21.00%
88.50%
36.20%
80.10%
59.00% 59.10%
15.40%
52.40% 51.00%
0.00%10.00%20.00%30.00%40.00%50.00%60.00%70.00%80.00%90.00%
100.00%
Areas Promoting Learn-By-Doing
December 21, 2015 General Education Program Review
75
Response: Cal Poly continually argues that “Learn-By-Doing” is more than just a motto. The phrase sums up the institution’s pedagogical identity, one that is not owned by any one discipline or program. Yet, the Learn-By-Doing model does not appear to be a major factor when faculty consider General Education courses, which may imply that major courses alone are responsible for this pedagogical approach, a sentiment that is tacitly untrue. As part of the Learn-By-Doing philosophy, students engage directly and actively with the ideas and concepts they encounter throughout their education, and GE courses should be no exception. Indeed, if students encounter GE classes with the same mindset with which they approach their major classes, they may find that their GE classes are just as important to their degree.
December 21, 2015 General Education Program Review
76
IV. GE Enrollment Management
The Academic Senate resolution (AS-740-12) transferred the direct responsibility for General Education from the Provost to the Academic Senate in a move that was intended to promote shared governance by moving the program closer to the faculty, which is understood to have the primary responsibility for curriculum and pedagogy. The resolution neglected to account very well for the shared part of curriculum governance, which is the responsibility of the administration at every level to assure curriculum resources. This responsibility is complicated in GE by the distribution of administrative decision-making for a single area across multiple departments and colleges.2 This analysis is intended to provide a bird’s eye view of GE enrollment management for the period 2009-15. It begins by considering the effectiveness of enrollment management as measured by the ratio between planned and actual enrollment. Planned enrollment, a measure of initial course capacity, is the number of seats originally provided in the class schedule, i.e., the enrollment cap. For reasons of pedagogy and workload, this number may be less than the actual number of seats in a classroom. Actual enrollment, a partial measure of registration demand, is the number of students enrolled in a course section as of the census date (the 15th instructional day of each quarter). This number may exceed the planned enrollment because the department has raised the cap or the instructor has permitted individual students to add the section. A look at three simple hypothetical cases will illustrate the use of this ratio:
• Case 1: Planned enrollment is 10 and actual enrollment is 8. Initial capacity is 125% of registration demand. More than 100% might indicate extra capacity in a GE area, in the sense that there are more seats, at least as originally scheduled, than registered students.
• Case 2: Planned enrollment is 10 and actual enrollment is 12. Capacity is 83% of demand. Less than 100% might indicate low capacity to meet student demand, in the sense that there are more students than seats.
• Case 3: Planned enrollment is 10 and actual enrollment is 10. Capacity is 100% of demand. 100% might indicate capacity and demand in balance, in the sense that there appears to be balance of seats and students.
In fact, none of these conclusions can be safely drawn without referring to the waitlist, which consists of students still recorded as needing or wanting to add a course section by the first day of class. If initial capacity is 100% of registration demand, a relatively small waitlist suggests that capacity did indeed approach demand, while a relatively large waitlist suggests the persistence of unmet demand. Similarly, a measure of less than 100% with a waitlist suggests additional unmet demand; more than 100% with a waitlist suggests that, in spite of excess capacity, demand as measured by the waitlist was not translated to enrollment.
2As described in the senate resolution, the duties of the GEGB Chair include the following: “Work collaboratively with the college deans, the Office of the Registrar, the GEGB, Academic Programs and Planning, advisors, and the departments to understand where the demand for courses is and availability of resources in both the short and long term.” It is not clear that the chair has the authority and resources to do what the resolution requires.
December 21, 2015 General Education Program Review
77
The waitlist can be seen as a measure of unmet demand, although, as aggregated here, it is an imperfect one. It corrects for duplicate students seeking to add sections of the same course, but it does not correct for students trying to add different courses in the same area. This may inflate the waitlist in areas having many course options. Moreover, if a student is accommodated in a GE Area course, his/her name will remain on waitlists for other courses in that same GE Area. In other words, if a student waitlists for seven Area C4 classes and is accommodated in one of those courses during the first week of class, her name will still remain on the waitlists for the six other classes after the census date. Furthermore, the persistence of waitlists in the face of apparently empty seats is a matter that deserves further investigation. For instance, students might drop a course section after the first day of class, after waitlists have been frozen. Or, an instructor could be disinclined to add students during the second week of the quarter. Further, there might be a mismatch between available courses and the course students want to take. In sum, there is a degree of uncertainty regarding the meaning of the waitlists. Even if reduced to unique demands in a single area, the waitlists will not indicate which course or section is actually in demand — what students want to take for various reasons, in contrast to what they need. Demand as used here refers to both want and need, and it is the contention of this self-study that a student-centered form of GE enrollment management would also address what students want and need in an effort to promote their intentionality and respect their sense of preference in the GE curriculum. From this discussion, it should be apparent that actual enrollment may be only a partial indicator that defines the lower limit of student demand for a course or section. The sum of the actual enrollment and the number of waitlisted students may be a partial indicator that defines the upper limit of student demand for a course or section. The real demand probably lies somewhere in between and can only be approached incrementally, by a series of tacking maneuvers in the course schedule. Ultimately, a thorough understanding of capacity and demand in GE areas depends on a process of triangulation that accounts for changes in enrollments, waitlists, and the relevant student population. For instance, there does appear to be a tendency for declines in a student population to be co-related with decreases in the waitlists and increases in the percentages of total demand met. These two numbers tend to lag population increases, indicating that resources — classroom space and faculty — cannot always keep pace with first-year enrollment. This is an important consideration that argues for more effective enrollment planning. From the planning standpoint, the historical percentages of a student population taking a course, which reflects the impact of Advanced Placement Tests on student needs, produce an average that can be used in such planning. These numbers, along with all the rest of the data discussed in this section, are provided in (Appendices R, S, T, and U).
December 21, 2015 General Education Program Review78
A. GE Area A: CommunicationStudents are expected to complete GE Area A1, A2 and A3 (12 units) during their first year or early in their sophomore year.
GE Area A1: Writing and Rhetoric (Writing Intensive) All first-year students are expected to complete 4 units (1 course) in English 134: Writing and Rhetoric in their first year. Trends show that from 2009 to 2015, AP credit has increased each year, from 34% in 2009-10 to 47% in 2014-15 (Appendix U). Generally, more sections were offered during fall (58), fewer in winter (28), and the least in spring (17) (Appendix S). For the six-year period, the average number of sections was 105 per year, and the average class size was 22. Note: Within GE A1, there are one to two sections offered each year in ENGL 133: Writing and Rhetoric for English as a Second Language Students. For the six-year period (2009-15), the average class size was 11.8.
GE Area A2: Oral Communication All first-year students are expected to complete 4 units (one course) in either COMS 101: Public Speaking or COMS 102: Principles of Oral Communication. There is no AP credit offered in this area. For the six-year period (2009-2015) the average number of sections per year was 159 and the average class size was 24.
GE Area A3: Reasoning, Argumentation and Writing (Writing Intensive) All first-year students are expected to complete 4 units (one course) in this area. There is no AP credit offered in this area. Most students can select between five courses offered by the English, Communications, or Philosophy departments. For the six-year period (2009-2015), the average number of sections offered was 160 per year, and the average class size was 24.1
Note: Within the GE A3 area, Engineering students are required to take a specific course, ENGL 149: Technical Writing for Engineers. For the six-year period (2009-2015), the average number of sections per year offered in this course was 52 out of the 160 average sections per year and the average size was 24.4. Engineering students comprise approximately 28-30% of the total student enrollment.
Enrollment Management in Area A For the period 2009-15, the average ratio of planned enrollment to actual enrollment ran close to 100% in every part of Area A (Appendix R). The average ratio was:
• 100% in A1, ranging from 98% in 2011-12 to 103% in 2010-11.• 100% in A2, ranging from 98% in 2011-12 to 102% in 2009-10.• 101% in A3, ranging from 99% in 2011-12 and 2014-15 to 102% in 2012-13.
In 2011-12, in every part of Area A, actual enrollment exceeded planned enrollment, which coincided with surging first-year enrollment in that AY.
In every part of Area A, the average number of waitlisted students was relatively small — in the hundreds or less than hundreds — but growing over the period 2009-15.
December 21, 2015 General Education Program Review
79
The average number was:
• 175 in A1, ranging from 34 in 2010-11 to 321 in 2014-15. • 655 in A2, ranging from 422 in 2010-11 to 890 in 2014-15. • 701 in A3, ranging from 528 in 2010-11 to 1230 in 2014-15.
The variation in the average number of waitlisted students does seem to correspond to the variation in the number of courses that might be offered in each part: A1 has the smallest number of courses and smallest average number of waitlisted students; A2 has the second smallest number of courses and the second smallest average number of waitlisted students; etc. However, the trend of increasing waitlists indicates that the course offerings in these GE areas are not keeping up with the changes in the first-year student populations. This development warrants further attention. The low annual number of waitlisted students in 2010-11 coincided with a near low in the population of first-year students without AP credit for A1 and a low in the total first-year population. The high annual number of waitlisted students in 2014-15 matches the highs in the population of first-year students without AP credit for A1 and the total first-year population, which occurred in 2013-14. Waitlists continued to increase even as both populations declined a small amount. Most noticeable is the surge to 1230 waitlisted students in A3 even as actual enrollment peaked. This development also warrants further attention. For the period 2009-15, the annual percentage of enrolled students varied widely in every part of Area A. The average percentage of enrolled students was:
• 96% in A1, ranging from 85% in 2011-12 to 106% in 2012-13. • 91% in A2, ranging from 85% in 2011-12 to 97% in 2010-11. • 95% in A3, ranging from 79% in 2013-14 to 106% in 2010-11.
The A1 number is a percentage of first-year students without AP credit; the A2 and A3 numbers are percentages of total first-year students in A2 and A3. There does seem to be a pattern of enrollment percentages going up in years when the student population goes down and vice-versa. This suggests that capacity is not closely tracking demand from year to year. Why more than 100% of a first-year population is taking a required course is not clear. One explanation is that students that do not get the course their first year are taking it later, so the students’ demand for the course is actually higher than the number of first-year students needing it. The analysis discussed above does not account for the size of the annual waitlists relative to the actual enrollment of students in a single year. A waitlist of 100 students, when there are 1000 students taking the course, should be of more concern than a waitlist of 100 students when there are 2000 students taking the course. To address this issue, an additional analysis (Appendix T.1) looks at the waitlist numbers as a percentage of actual enrollment and the actual enrollment as a percentage of students needing to take courses in parts of Area A — total first-year or first-year students without AP credit for A1.
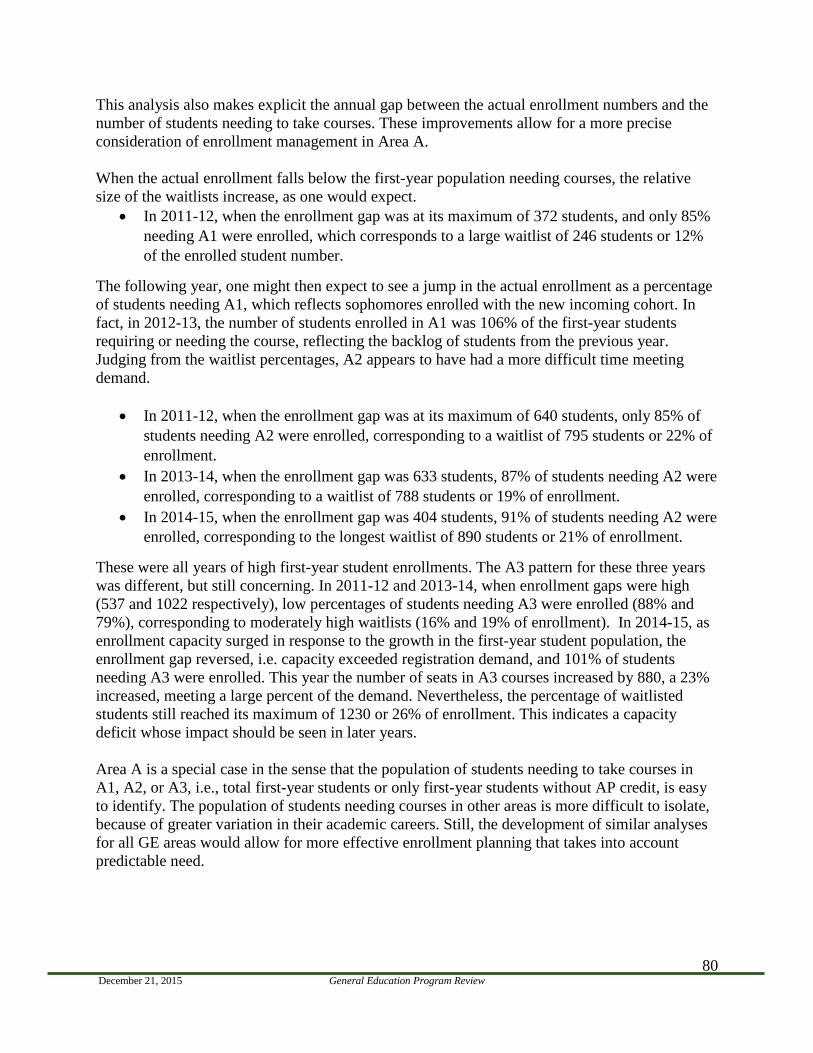
December 21, 2015 General Education Program Review
80
This analysis also makes explicit the annual gap between the actual enrollment numbers and the number of students needing to take courses. These improvements allow for a more precise consideration of enrollment management in Area A. When the actual enrollment falls below the first-year population needing courses, the relative size of the waitlists increase, as one would expect.
• In 2011-12, when the enrollment gap was at its maximum of 372 students, and only 85% needing A1 were enrolled, which corresponds to a large waitlist of 246 students or 12% of the enrolled student number.
The following year, one might then expect to see a jump in the actual enrollment as a percentage of students needing A1, which reflects sophomores enrolled with the new incoming cohort. In fact, in 2012-13, the number of students enrolled in A1 was 106% of the first-year students requiring or needing the course, reflecting the backlog of students from the previous year. Judging from the waitlist percentages, A2 appears to have had a more difficult time meeting demand.
• In 2011-12, when the enrollment gap was at its maximum of 640 students, only 85% of students needing A2 were enrolled, corresponding to a waitlist of 795 students or 22% of enrollment.
• In 2013-14, when the enrollment gap was 633 students, 87% of students needing A2 were enrolled, corresponding to a waitlist of 788 students or 19% of enrollment.
• In 2014-15, when the enrollment gap was 404 students, 91% of students needing A2 were enrolled, corresponding to the longest waitlist of 890 students or 21% of enrollment.
These were all years of high first-year student enrollments. The A3 pattern for these three years was different, but still concerning. In 2011-12 and 2013-14, when enrollment gaps were high (537 and 1022 respectively), low percentages of students needing A3 were enrolled (88% and 79%), corresponding to moderately high waitlists (16% and 19% of enrollment). In 2014-15, as enrollment capacity surged in response to the growth in the first-year student population, the enrollment gap reversed, i.e. capacity exceeded registration demand, and 101% of students needing A3 were enrolled. This year the number of seats in A3 courses increased by 880, a 23% increased, meeting a large percent of the demand. Nevertheless, the percentage of waitlisted students still reached its maximum of 1230 or 26% of enrollment. This indicates a capacity deficit whose impact should be seen in later years. Area A is a special case in the sense that the population of students needing to take courses in A1, A2, or A3, i.e., total first-year students or only first-year students without AP credit, is easy to identify. The population of students needing courses in other areas is more difficult to isolate, because of greater variation in their academic careers. Still, the development of similar analyses for all GE areas would allow for more effective enrollment planning that takes into account predictable need.
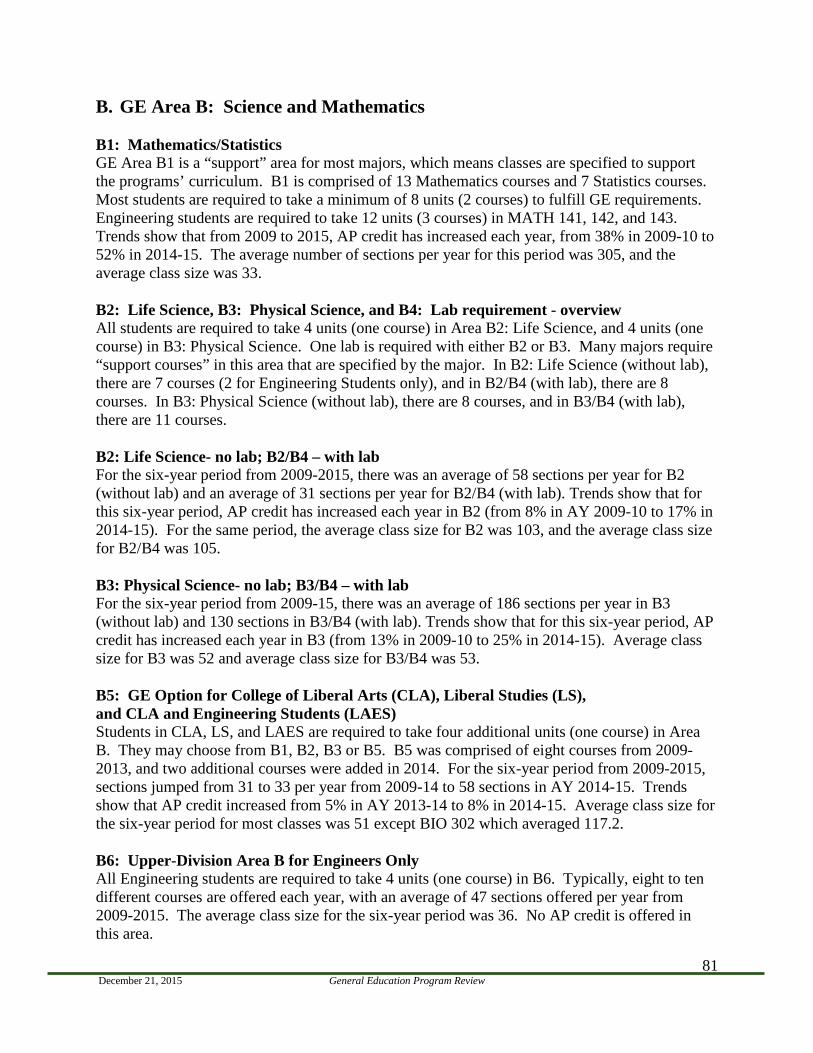
December 21, 2015 General Education Program Review
81
B. GE Area B: Science and Mathematics B1: Mathematics/Statistics GE Area B1 is a “support” area for most majors, which means classes are specified to support the programs’ curriculum. B1 is comprised of 13 Mathematics courses and 7 Statistics courses. Most students are required to take a minimum of 8 units (2 courses) to fulfill GE requirements. Engineering students are required to take 12 units (3 courses) in MATH 141, 142, and 143. Trends show that from 2009 to 2015, AP credit has increased each year, from 38% in 2009-10 to 52% in 2014-15. The average number of sections per year for this period was 305, and the average class size was 33. B2: Life Science, B3: Physical Science, and B4: Lab requirement - overview All students are required to take 4 units (one course) in Area B2: Life Science, and 4 units (one course) in B3: Physical Science. One lab is required with either B2 or B3. Many majors require “support courses” in this area that are specified by the major. In B2: Life Science (without lab), there are 7 courses (2 for Engineering Students only), and in B2/B4 (with lab), there are 8 courses. In B3: Physical Science (without lab), there are 8 courses, and in B3/B4 (with lab), there are 11 courses. B2: Life Science- no lab; B2/B4 – with lab For the six-year period from 2009-2015, there was an average of 58 sections per year for B2 (without lab) and an average of 31 sections per year for B2/B4 (with lab). Trends show that for this six-year period, AP credit has increased each year in B2 (from 8% in AY 2009-10 to 17% in 2014-15). For the same period, the average class size for B2 was 103, and the average class size for B2/B4 was 105. B3: Physical Science- no lab; B3/B4 – with lab For the six-year period from 2009-15, there was an average of 186 sections per year in B3 (without lab) and 130 sections in B3/B4 (with lab). Trends show that for this six-year period, AP credit has increased each year in B3 (from 13% in 2009-10 to 25% in 2014-15). Average class size for B3 was 52 and average class size for B3/B4 was 53. B5: GE Option for College of Liberal Arts (CLA), Liberal Studies (LS), and CLA and Engineering Students (LAES) Students in CLA, LS, and LAES are required to take four additional units (one course) in Area B. They may choose from B1, B2, B3 or B5. B5 was comprised of eight courses from 2009- 2013, and two additional courses were added in 2014. For the six-year period from 2009-2015, sections jumped from 31 to 33 per year from 2009-14 to 58 sections in AY 2014-15. Trends show that AP credit increased from 5% in AY 2013-14 to 8% in 2014-15. Average class size for the six-year period for most classes was 51 except BIO 302 which averaged 117.2. B6: Upper-Division Area B for Engineers Only All Engineering students are required to take 4 units (one course) in B6. Typically, eight to ten different courses are offered each year, with an average of 47 sections offered per year from 2009-2015. The average class size for the six-year period was 36. No AP credit is offered in this area.
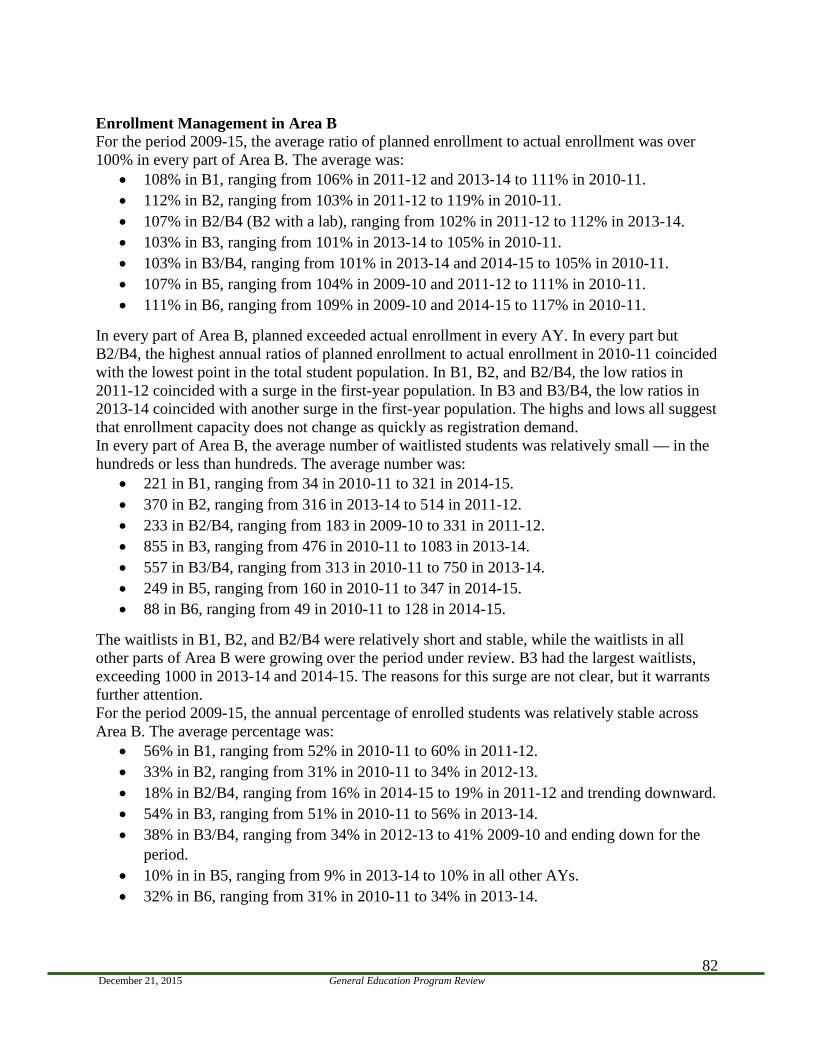
December 21, 2015 General Education Program Review
82
Enrollment Management in Area B For the period 2009-15, the average ratio of planned enrollment to actual enrollment was over 100% in every part of Area B. The average was:
• 108% in B1, ranging from 106% in 2011-12 and 2013-14 to 111% in 2010-11. • 112% in B2, ranging from 103% in 2011-12 to 119% in 2010-11. • 107% in B2/B4 (B2 with a lab), ranging from 102% in 2011-12 to 112% in 2013-14. • 103% in B3, ranging from 101% in 2013-14 to 105% in 2010-11. • 103% in B3/B4, ranging from 101% in 2013-14 and 2014-15 to 105% in 2010-11. • 107% in B5, ranging from 104% in 2009-10 and 2011-12 to 111% in 2010-11. • 111% in B6, ranging from 109% in 2009-10 and 2014-15 to 117% in 2010-11.
In every part of Area B, planned exceeded actual enrollment in every AY. In every part but B2/B4, the highest annual ratios of planned enrollment to actual enrollment in 2010-11 coincided with the lowest point in the total student population. In B1, B2, and B2/B4, the low ratios in 2011-12 coincided with a surge in the first-year population. In B3 and B3/B4, the low ratios in 2013-14 coincided with another surge in the first-year population. The highs and lows all suggest that enrollment capacity does not change as quickly as registration demand. In every part of Area B, the average number of waitlisted students was relatively small — in the hundreds or less than hundreds. The average number was:
• 221 in B1, ranging from 34 in 2010-11 to 321 in 2014-15. • 370 in B2, ranging from 316 in 2013-14 to 514 in 2011-12. • 233 in B2/B4, ranging from 183 in 2009-10 to 331 in 2011-12. • 855 in B3, ranging from 476 in 2010-11 to 1083 in 2013-14. • 557 in B3/B4, ranging from 313 in 2010-11 to 750 in 2013-14. • 249 in B5, ranging from 160 in 2010-11 to 347 in 2014-15. • 88 in B6, ranging from 49 in 2010-11 to 128 in 2014-15.
The waitlists in B1, B2, and B2/B4 were relatively short and stable, while the waitlists in all other parts of Area B were growing over the period under review. B3 had the largest waitlists, exceeding 1000 in 2013-14 and 2014-15. The reasons for this surge are not clear, but it warrants further attention. For the period 2009-15, the annual percentage of enrolled students was relatively stable across Area B. The average percentage was:
• 56% in B1, ranging from 52% in 2010-11 to 60% in 2011-12. • 33% in B2, ranging from 31% in 2010-11 to 34% in 2012-13. • 18% in B2/B4, ranging from 16% in 2014-15 to 19% in 2011-12 and trending downward. • 54% in B3, ranging from 51% in 2010-11 to 56% in 2013-14. • 38% in B3/B4, ranging from 34% in 2012-13 to 41% 2009-10 and ending down for the
period. • 10% in in B5, ranging from 9% in 2013-14 to 10% in all other AYs. • 32% in B6, ranging from 31% in 2010-11 to 34% in 2013-14.

December 21, 2015 General Education Program Review
83
These numbers are percentages of the total student population except for B6, which is a percentage of engineering students. There is some pattern of low annual percentages occurring in 2010-11, when both populations reached their lowest point. Among all the parts, B1 and B3/B4 exhibited the most variation in annual percentages of the total student population. The annual student percentages declined for B2/B4 and B3/B4 courses (life/physical sciences with lab), reflecting a move away from traditional laboratory instruction and towards studio classrooms in the sciences.
C. GE Area C: Arts and Humanities
C1: Literature (Writing Intensive) All students are required to take 4 units (one course) in Area C1: Literature. There are six courses offered in English and three courses offered in Modern Languages. From 2009 to 2015, the average number of sections was 62 per year. Class sizes varied widely, from 29 to as large as 145. AP credit increased from 10% in AY 2009-10 to 14% in 2014-15. C2: Philosophy (Writing Intensive) All students are required to take 4 units (one course) in Area C2: Philosophy. There are two courses offered in this area, Philosophy 230: Knowledge and Reality and Philosophy 231: Ethics and Political Philosophy. From 2009 to 2015, the average number of sections was 60 per year. Class sizes varied widely, from 35 to 146. There is no AP credit in this area. C3: Fine and Performing Arts All students are required to take 4 units (one course) in Area C2: Fine and Performing Arts. There are eighteen courses offered in this area. From 2009 to 2015, the average sections per year was 60. Class sizes ranged from 22 to 95. AP credit ranged from 2 to 3% percent in this time frame. C4: Arts and Humanities Upper-Division Elective (Writing Intensive) All students are required to take 4 units (one course) in Area C4: Arts and Humanities Upper-Division Elective. Course offerings increased in this area from 66 in AY 2009-10 to 71 in AY 2014-15, however not all courses are offered every quarter. From 2009 to 2015, the average number of sections per year was 175. The average class size was 30. There is no AP credit in this area. C5: Arts and Humanities Elective The Area C5 title was implemented in 2013 to provide a place for 200-level intermediate foreign language courses in Chinese, French, German, Japanese, and Spanish. In AY 2013-14, there were 31 sections offered, and in 2014-15, there were 34 sections offered. The average class size was 17 students. In AY 2014-15, 6% of students had AP credit in this area. Note: Students from four colleges—Architecture and Environmental Design; Agriculture, Food, and Environmental Sciences; Science and Mathematics; and the Orfalea College of Business must take an additional 3 units (one course) in Area C. Students may select from C1, C2, C3, C4 or C5.
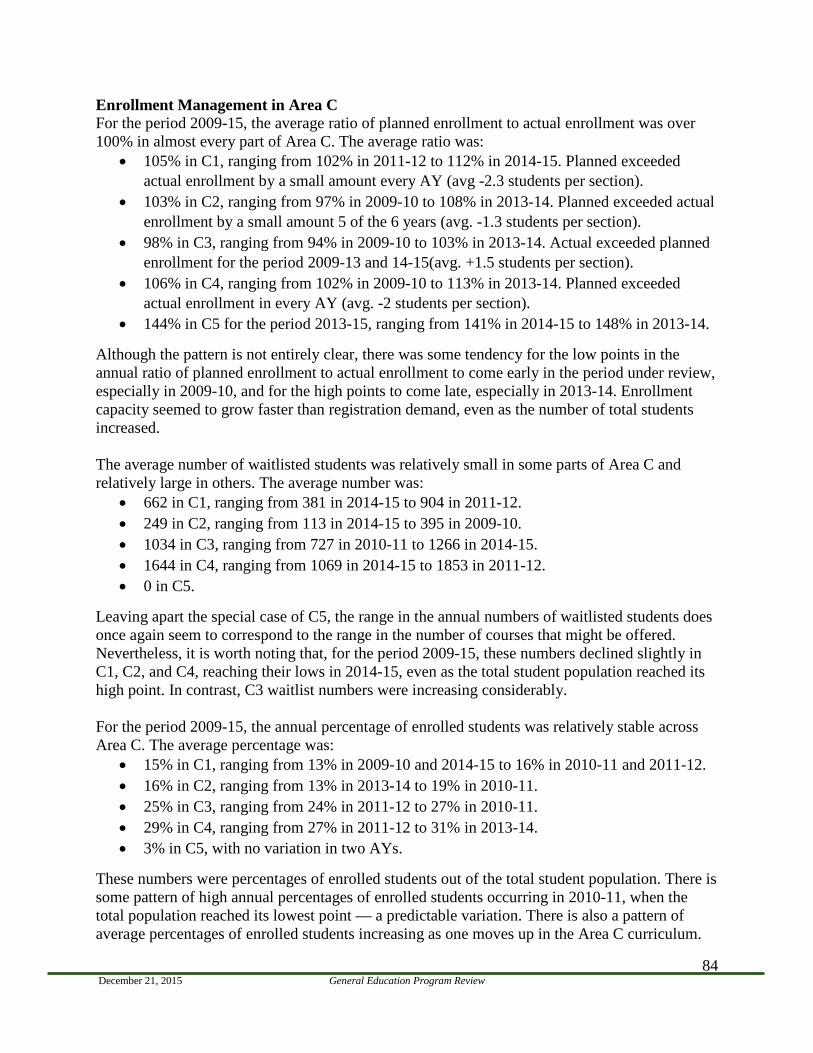
December 21, 2015 General Education Program Review
84
Enrollment Management in Area C For the period 2009-15, the average ratio of planned enrollment to actual enrollment was over 100% in almost every part of Area C. The average ratio was:
• 105% in C1, ranging from 102% in 2011-12 to 112% in 2014-15. Planned exceeded actual enrollment by a small amount every AY (avg -2.3 students per section).
• 103% in C2, ranging from 97% in 2009-10 to 108% in 2013-14. Planned exceeded actual enrollment by a small amount 5 of the 6 years (avg. -1.3 students per section).
• 98% in C3, ranging from 94% in 2009-10 to 103% in 2013-14. Actual exceeded planned enrollment for the period 2009-13 and 14-15(avg. +1.5 students per section).
• 106% in C4, ranging from 102% in 2009-10 to 113% in 2013-14. Planned exceeded actual enrollment in every AY (avg. -2 students per section).
• 144% in C5 for the period 2013-15, ranging from 141% in 2014-15 to 148% in 2013-14.
Although the pattern is not entirely clear, there was some tendency for the low points in the annual ratio of planned enrollment to actual enrollment to come early in the period under review, especially in 2009-10, and for the high points to come late, especially in 2013-14. Enrollment capacity seemed to grow faster than registration demand, even as the number of total students increased. The average number of waitlisted students was relatively small in some parts of Area C and relatively large in others. The average number was:
• 662 in C1, ranging from 381 in 2014-15 to 904 in 2011-12. • 249 in C2, ranging from 113 in 2014-15 to 395 in 2009-10. • 1034 in C3, ranging from 727 in 2010-11 to 1266 in 2014-15. • 1644 in C4, ranging from 1069 in 2014-15 to 1853 in 2011-12. • 0 in C5.
Leaving apart the special case of C5, the range in the annual numbers of waitlisted students does once again seem to correspond to the range in the number of courses that might be offered. Nevertheless, it is worth noting that, for the period 2009-15, these numbers declined slightly in C1, C2, and C4, reaching their lows in 2014-15, even as the total student population reached its high point. In contrast, C3 waitlist numbers were increasing considerably. For the period 2009-15, the annual percentage of enrolled students was relatively stable across Area C. The average percentage was:
• 15% in C1, ranging from 13% in 2009-10 and 2014-15 to 16% in 2010-11 and 2011-12. • 16% in C2, ranging from 13% in 2013-14 to 19% in 2010-11. • 25% in C3, ranging from 24% in 2011-12 to 27% in 2010-11. • 29% in C4, ranging from 27% in 2011-12 to 31% in 2013-14. • 3% in C5, with no variation in two AYs.
These numbers were percentages of enrolled students out of the total student population. There is some pattern of high annual percentages of enrolled students occurring in 2010-11, when the total population reached its lowest point — a predictable variation. There is also a pattern of average percentages of enrolled students increasing as one moves up in the Area C curriculum.
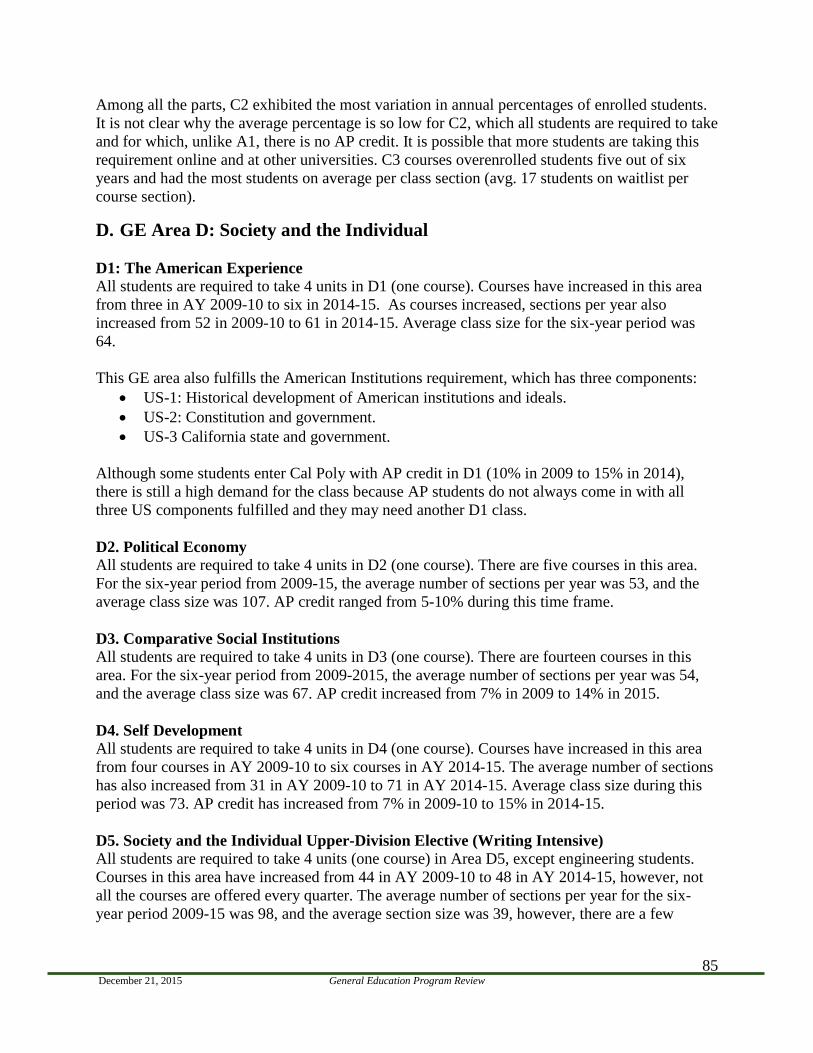
December 21, 2015 General Education Program Review
85
Among all the parts, C2 exhibited the most variation in annual percentages of enrolled students. It is not clear why the average percentage is so low for C2, which all students are required to take and for which, unlike A1, there is no AP credit. It is possible that more students are taking this requirement online and at other universities. C3 courses overenrolled students five out of six years and had the most students on average per class section (avg. 17 students on waitlist per course section).
D. GE Area D: Society and the Individual D1: The American Experience All students are required to take 4 units in D1 (one course). Courses have increased in this area from three in AY 2009-10 to six in 2014-15. As courses increased, sections per year also increased from 52 in 2009-10 to 61 in 2014-15. Average class size for the six-year period was 64. This GE area also fulfills the American Institutions requirement, which has three components:
• US-1: Historical development of American institutions and ideals. • US-2: Constitution and government. • US-3 California state and government.
Although some students enter Cal Poly with AP credit in D1 (10% in 2009 to 15% in 2014), there is still a high demand for the class because AP students do not always come in with all three US components fulfilled and they may need another D1 class. D2. Political Economy All students are required to take 4 units in D2 (one course). There are five courses in this area. For the six-year period from 2009-15, the average number of sections per year was 53, and the average class size was 107. AP credit ranged from 5-10% during this time frame. D3. Comparative Social Institutions All students are required to take 4 units in D3 (one course). There are fourteen courses in this area. For the six-year period from 2009-2015, the average number of sections per year was 54, and the average class size was 67. AP credit increased from 7% in 2009 to 14% in 2015. D4. Self Development All students are required to take 4 units in D4 (one course). Courses have increased in this area from four courses in AY 2009-10 to six courses in AY 2014-15. The average number of sections has also increased from 31 in AY 2009-10 to 71 in AY 2014-15. Average class size during this period was 73. AP credit has increased from 7% in 2009-10 to 15% in 2014-15. D5. Society and the Individual Upper-Division Elective (Writing Intensive) All students are required to take 4 units (one course) in Area D5, except engineering students. Courses in this area have increased from 44 in AY 2009-10 to 48 in AY 2014-15, however, not all the courses are offered every quarter. The average number of sections per year for the six-year period 2009-15 was 98, and the average section size was 39, however, there are a few
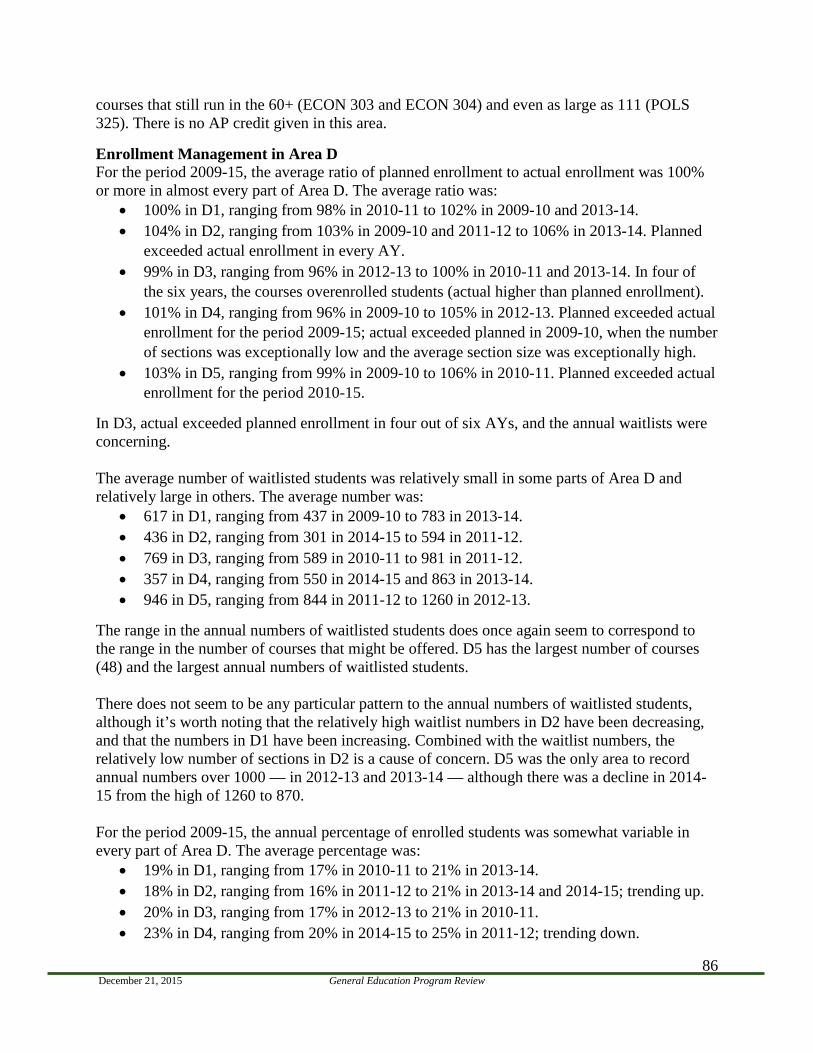
December 21, 2015 General Education Program Review
86
courses that still run in the 60+ (ECON 303 and ECON 304) and even as large as 111 (POLS 325). There is no AP credit given in this area. Enrollment Management in Area D For the period 2009-15, the average ratio of planned enrollment to actual enrollment was 100% or more in almost every part of Area D. The average ratio was:
• 100% in D1, ranging from 98% in 2010-11 to 102% in 2009-10 and 2013-14. • 104% in D2, ranging from 103% in 2009-10 and 2011-12 to 106% in 2013-14. Planned
exceeded actual enrollment in every AY. • 99% in D3, ranging from 96% in 2012-13 to 100% in 2010-11 and 2013-14. In four of
the six years, the courses overenrolled students (actual higher than planned enrollment). • 101% in D4, ranging from 96% in 2009-10 to 105% in 2012-13. Planned exceeded actual
enrollment for the period 2009-15; actual exceeded planned in 2009-10, when the number of sections was exceptionally low and the average section size was exceptionally high.
• 103% in D5, ranging from 99% in 2009-10 to 106% in 2010-11. Planned exceeded actual enrollment for the period 2010-15.
In D3, actual exceeded planned enrollment in four out of six AYs, and the annual waitlists were concerning. The average number of waitlisted students was relatively small in some parts of Area D and relatively large in others. The average number was:
• 617 in D1, ranging from 437 in 2009-10 to 783 in 2013-14. • 436 in D2, ranging from 301 in 2014-15 to 594 in 2011-12. • 769 in D3, ranging from 589 in 2010-11 to 981 in 2011-12. • 357 in D4, ranging from 550 in 2014-15 and 863 in 2013-14. • 946 in D5, ranging from 844 in 2011-12 to 1260 in 2012-13.
The range in the annual numbers of waitlisted students does once again seem to correspond to the range in the number of courses that might be offered. D5 has the largest number of courses (48) and the largest annual numbers of waitlisted students. There does not seem to be any particular pattern to the annual numbers of waitlisted students, although it’s worth noting that the relatively high waitlist numbers in D2 have been decreasing, and that the numbers in D1 have been increasing. Combined with the waitlist numbers, the relatively low number of sections in D2 is a cause of concern. D5 was the only area to record annual numbers over 1000 — in 2012-13 and 2013-14 — although there was a decline in 2014-15 from the high of 1260 to 870. For the period 2009-15, the annual percentage of enrolled students was somewhat variable in every part of Area D. The average percentage was:
• 19% in D1, ranging from 17% in 2010-11 to 21% in 2013-14. • 18% in D2, ranging from 16% in 2011-12 to 21% in 2013-14 and 2014-15; trending up. • 20% in D3, ranging from 17% in 2012-13 to 21% in 2010-11. • 23% in D4, ranging from 20% in 2014-15 to 25% in 2011-12; trending down.
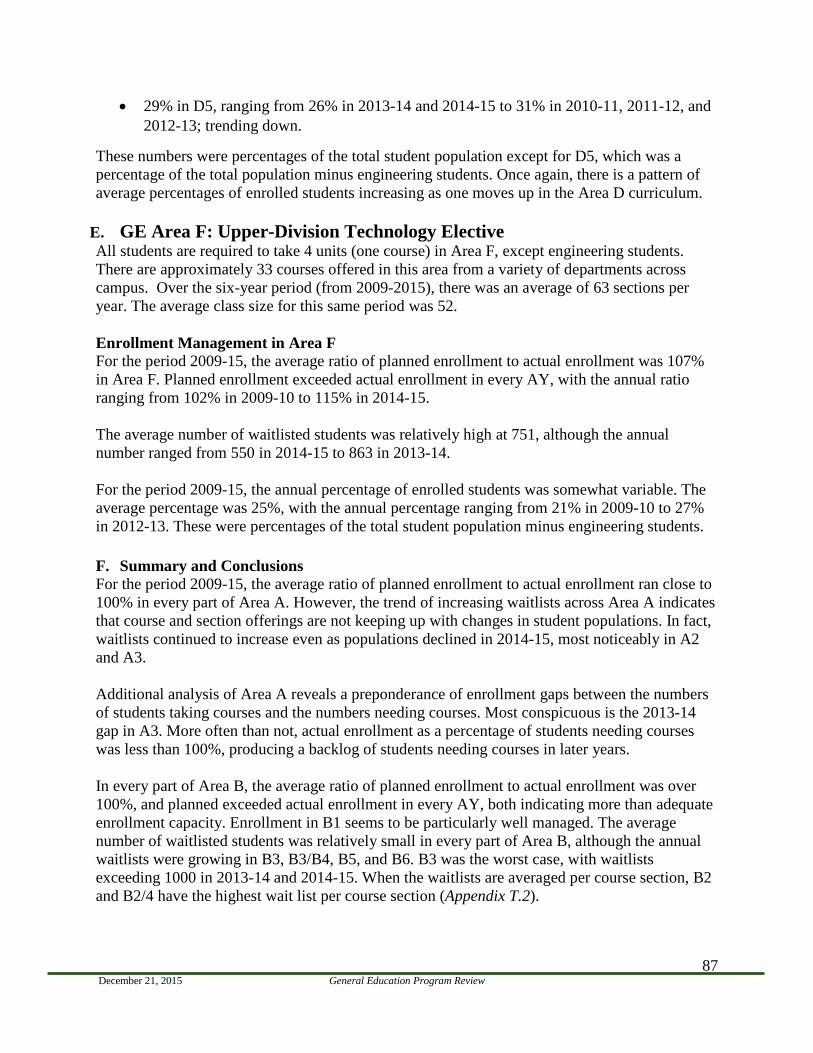
December 21, 2015 General Education Program Review
87
• 29% in D5, ranging from 26% in 2013-14 and 2014-15 to 31% in 2010-11, 2011-12, and 2012-13; trending down.
These numbers were percentages of the total student population except for D5, which was a percentage of the total population minus engineering students. Once again, there is a pattern of average percentages of enrolled students increasing as one moves up in the Area D curriculum.
E. GE Area F: Upper-Division Technology Elective All students are required to take 4 units (one course) in Area F, except engineering students. There are approximately 33 courses offered in this area from a variety of departments across campus. Over the six-year period (from 2009-2015), there was an average of 63 sections per year. The average class size for this same period was 52. Enrollment Management in Area F For the period 2009-15, the average ratio of planned enrollment to actual enrollment was 107% in Area F. Planned enrollment exceeded actual enrollment in every AY, with the annual ratio ranging from 102% in 2009-10 to 115% in 2014-15. The average number of waitlisted students was relatively high at 751, although the annual number ranged from 550 in 2014-15 to 863 in 2013-14. For the period 2009-15, the annual percentage of enrolled students was somewhat variable. The average percentage was 25%, with the annual percentage ranging from 21% in 2009-10 to 27% in 2012-13. These were percentages of the total student population minus engineering students. F. Summary and Conclusions For the period 2009-15, the average ratio of planned enrollment to actual enrollment ran close to 100% in every part of Area A. However, the trend of increasing waitlists across Area A indicates that course and section offerings are not keeping up with changes in student populations. In fact, waitlists continued to increase even as populations declined in 2014-15, most noticeably in A2 and A3. Additional analysis of Area A reveals a preponderance of enrollment gaps between the numbers of students taking courses and the numbers needing courses. Most conspicuous is the 2013-14 gap in A3. More often than not, actual enrollment as a percentage of students needing courses was less than 100%, producing a backlog of students needing courses in later years. In every part of Area B, the average ratio of planned enrollment to actual enrollment was over 100%, and planned exceeded actual enrollment in every AY, both indicating more than adequate enrollment capacity. Enrollment in B1 seems to be particularly well managed. The average number of waitlisted students was relatively small in every part of Area B, although the annual waitlists were growing in B3, B3/B4, B5, and B6. B3 was the worst case, with waitlists exceeding 1000 in 2013-14 and 2014-15. When the waitlists are averaged per course section, B2 and B2/4 have the highest wait list per course section (Appendix T.2).
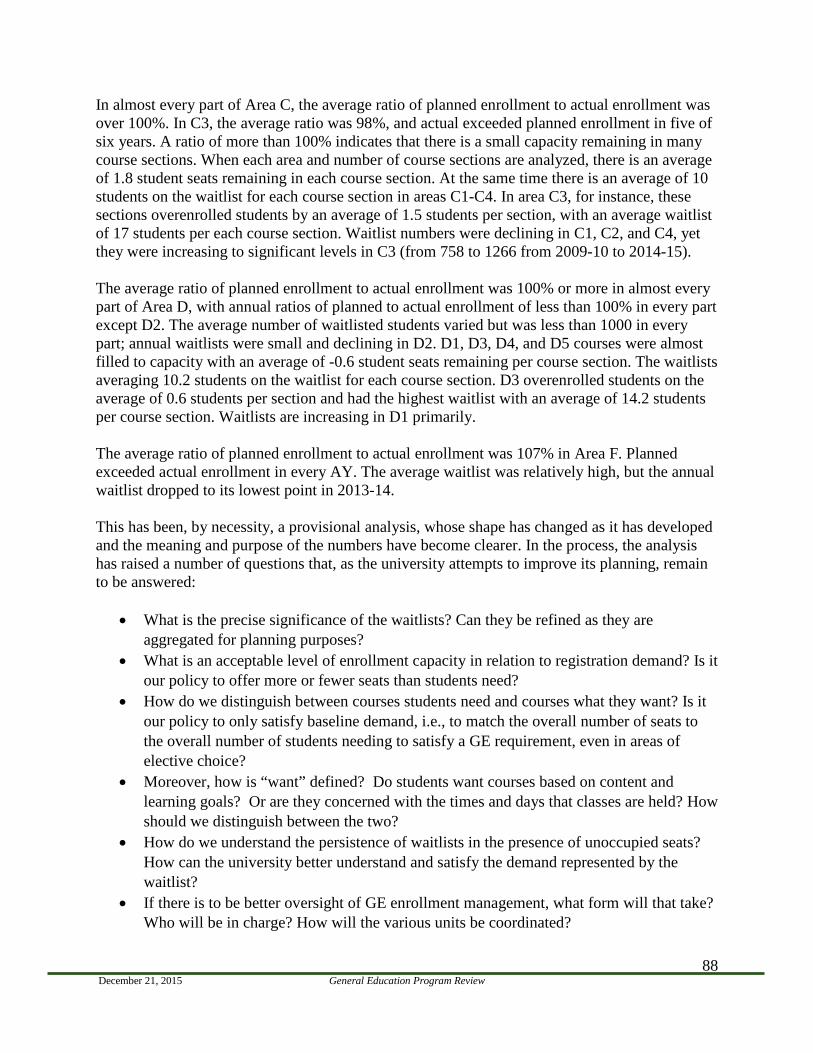
December 21, 2015 General Education Program Review
88
In almost every part of Area C, the average ratio of planned enrollment to actual enrollment was over 100%. In C3, the average ratio was 98%, and actual exceeded planned enrollment in five of six years. A ratio of more than 100% indicates that there is a small capacity remaining in many course sections. When each area and number of course sections are analyzed, there is an average of 1.8 student seats remaining in each course section. At the same time there is an average of 10 students on the waitlist for each course section in areas C1-C4. In area C3, for instance, these sections overenrolled students by an average of 1.5 students per section, with an average waitlist of 17 students per each course section. Waitlist numbers were declining in C1, C2, and C4, yet they were increasing to significant levels in C3 (from 758 to 1266 from 2009-10 to 2014-15). The average ratio of planned enrollment to actual enrollment was 100% or more in almost every part of Area D, with annual ratios of planned to actual enrollment of less than 100% in every part except D2. The average number of waitlisted students varied but was less than 1000 in every part; annual waitlists were small and declining in D2. D1, D3, D4, and D5 courses were almost filled to capacity with an average of -0.6 student seats remaining per course section. The waitlists averaging 10.2 students on the waitlist for each course section. D3 overenrolled students on the average of 0.6 students per section and had the highest waitlist with an average of 14.2 students per course section. Waitlists are increasing in D1 primarily. The average ratio of planned enrollment to actual enrollment was 107% in Area F. Planned exceeded actual enrollment in every AY. The average waitlist was relatively high, but the annual waitlist dropped to its lowest point in 2013-14. This has been, by necessity, a provisional analysis, whose shape has changed as it has developed and the meaning and purpose of the numbers have become clearer. In the process, the analysis has raised a number of questions that, as the university attempts to improve its planning, remain to be answered:
• What is the precise significance of the waitlists? Can they be refined as they are aggregated for planning purposes?
• What is an acceptable level of enrollment capacity in relation to registration demand? Is it our policy to offer more or fewer seats than students need?
• How do we distinguish between courses students need and courses what they want? Is it our policy to only satisfy baseline demand, i.e., to match the overall number of seats to the overall number of students needing to satisfy a GE requirement, even in areas of elective choice?
• Moreover, how is “want” defined? Do students want courses based on content and learning goals? Or are they concerned with the times and days that classes are held? How should we distinguish between the two?
• How do we understand the persistence of waitlists in the presence of unoccupied seats? How can the university better understand and satisfy the demand represented by the waitlist?
• If there is to be better oversight of GE enrollment management, what form will that take? Who will be in charge? How will the various units be coordinated?
December 21, 2015 General Education Program Review
89
These questions aside, it should be apparent from the above analysis that there are capacity and demand issues in parts of GE Area A, B, C, and D, which should be addressed. The university’s strategic plan calls for ambitious improvements to graduation rates, but it is doubtful that these can take place without addressing baseline enrollment needs.
IV. Conclusions
A. Taking Stock: The Self-Study’s Significant Findings While the GEGB believes the state of the Cal Poly’s General Education program is strong, we also see areas for growth and development. This section of the self-study will recount the GEGB’s discussions over the past year and discuss areas that we would like to see explored during the program review process. 1) Program Strengths • GE Courses are available to all students.
We believe one of the greatest strengths of our GE program is its ability to support students from all disciplines, thereby inviting diverse perspectives and experiences into the classrooms. Indeed, a GE classroom offers students an opportunity to engage with ideas that may clash directly with their own; this tension is a crucial aspect of a student’s education. The ability to navigate and sort through competing ideological perspectives helps students think more carefully about their own values and belief systems. Faculty who teach GE courses frequently site their enthusiasm for working with students from different disciplines as a prime motivator for continuing to teach GE classes. Because Cal Poly students declare a major upon entry, GE classes often become crucial spaces where students collaborate with peers who have different professional and personal aspirations and goals.
• The GE Program offers a variety of classes in most GE Areas.
Some GE Areas allow for more variation in course offerings than others. For instance, Area A: Communication focuses on students’ written and verbal communication skills at a foundational level, so the course offerings are more limited and tend to be housed in individual departments. As the numbers below show, there are more options for upper-division courses than for foundational courses. It must be noted that not all of these classes are taught every quarter, or even every AY. So while there is a myriad of course offerings, we still need to ensure that we offer enough GE courses in each GE area each quarter. In other words, if these courses have been approved for GE, but they are infrequently offered, then students are unable to take advantage of the kind of flexibility the GE program envisions. GE Courses Offered from 2009-2015 (Appendix S).
December 21, 2015 General Education Program Review
90
Area A: Communication A1: Expository Writing: 2 Courses (one of which supports second language learners) A2: Oral Communication: 2 Courses A3: Reasoning, Argumentation, and Writing: 5 Courses (1 course for ENG Only)
Area B: Science and Mathematics B1: Mathematics and Statistics: 20 Courses B2: Life Sciences: 13 (2 courses for ENG Only)
B3: Physical Science: 19 Courses B4: Lab Experience B5: Science and Mathematics Elective (for CLA, LS, and LAES) : 10 Courses B6: ABET Engineering Courses in Science and Mathematics: 10 Courses (ENG Only)
Area C: Arts and Humanities C1: Literature: 9 Courses (6 in Literature, 3 in Foreign Language Literature) C2: Philosophy: 2 Courses C3: Fine and Performing Arts: 20 Courses
C4: Arts and Humanities Upper-Division Elective: 74 Courses C5: Arts and Humanities Elective (GE Credit Option for students in CAED, CAFES, CSAM, and OCOB): 14 Courses
Area D/E: Society and the Individual D1: The American Experience: 6 Courses D2: Political Economy: 5 Courses
D3: Comparative Social Institutions: 14 Courses D4: Self-Development (CSU Area E): 6 Courses D5: Society and Individual Upper-Division Elective: 40 Courses
Area F: Technology – Upper Division Elective: 58 Courses
• Faculty from across all disciplines are invited to teach in the GE Program. While the CLA and the COSAM teach the most GE classes on campus (in part because of the foundational math and communications classes students take), faculty from all colleges are encouraged to teach in the GE program. In other words, the GE program sees itself as disciplinarily inclusive and invites course proposals that can help expand the ways in which the GE Areas are typically conceptualized. For instance, during the previous catalog cycle, the GEGB approved JOUR 218: Media, Self, and Society for GE Area D4: Self-Development. This is the first course that focuses on the relationship between media and self-development, and given the amount of media our students consume, the GEGB was excited to expand this GE Area to account for this new focus.
• Program Learning Outcomes (PLOs) bring greater structure and focus to GE.
The PLOs are a new component of the GE program. Cal Poly students should meet each of these objectives upon completion of their GE courses. We believe the PLOs bring greater
December 21, 2015 General Education Program Review
91
coherency to the program and enable us to communicate clearly the program’s goals and intentions to both students and faculty. The PLOs map directly onto the University Learning Objectives. In fall 2015, the PLOs were sent to all faculty teaching GE courses. The GEGB would also like to see the PLOs addressed when faculty propose GE courses, and is working with the Registrar’s office to explore this possibility for the 2017-2019 curriculum cycle.
• Cal Poly accounts for GE in its approach to university-wide assessment.
Cal Poly has made great strides in assessment by beginning to develop a sustainable and clear model for assessing learning outcomes in both GE and the majors. Assessment is approached with an eye toward students’ developing skill levels, and GE is seen as a crucial part of that growth. Indeed, in its response to Cal Poly’s Interim Assessment Report, the WASC Commission concluded:
The thoroughness of the Interim Report demonstrated that the university went far beyond what the Commission anticipated[,] illustrating that the institution is not just committed to meeting Commission expectations[,] but in improving educational effectiveness as part of its DNA beyond Commission expectations…The panel commends the university not just for thinking from an individual faculty perspective[,] but in keeping a focus on all three levels—program, department, and university—when universities typically focus on one or two. (July 14, 2015)
As GE courses are always included in university-wide assessment, the commission’s response can also be interpreted to mean that GE courses are being carefully and thoroughly assessed at the university level.
• GE policies are evenly and consistently applied. When reviewing course proposals, the GEGB works to review each proposal—regardless of discipline and area—using the same criteria. We use the CSU’s EO 1100 as a guide, along with our own Learning Outcomes, Criteria, and GE mission. If a course proposal looks promising but needs additional development, the GEGB chair and college representatives collaborate with faculty to ensure that the proposal fully demonstrates how the course addresses the GE program’s objectives and needs. In Fall 2015, the GEGB chair sent a memo to department chairs, curriculum chairs, and Assoc. Deans further clarifying the course review process (Appendix V). 2) Growth, Development, and Challenges • Develop a clearer relationship between GE and the major disciplines.
As it stands, GE and major programs do not inform one another as consistently as they could. Indeed, GE courses are often seen as interruptions to students’ major courses of study. However, the GEGB—along with many faculty and administrators across the university—regard GE courses as complementing students’ major disciplines by giving students more balanced and complex ways to situate their knowledge in the world around them.
December 21, 2015 General Education Program Review
92
On a polytechnic campus, it can be easy to focus more heavily on the STEM aspects of our students’ education, yet GE courses are intended to work alongside the majors, so that STEM classes and Humanities classes speak to one another in our students’ educational experiences. Increasingly, attention is being paid to the relationship between STEM and Humanities. For instance, the AAC&U regularly shares articles that argue for a healthy relationship between STEM and Humanities fields. It recently distributed a Salon article, “Liberal Arts Majors, Rejoice! Technologists are Learning They Need More than STEM to Create Appealing Products,” (August 8, 2015), highlighting the importance of collaboration, interpersonal skills, and empathy—teachable skills that are built into the Humanities. The AAC&U also distributed a Forbes piece, “STEM Study Starts with Liberal Arts,” (August 5, 2015) focusing on the ways in which the liberal arts “underpin” STEM fields. Furthermore, Debra Humphreys, AAC&U’s Vice President for Public Policy and Engagement, co-authored the study, “How Liberal Arts and Sciences Majors Fare in Employment,” which suggests, "the liberal arts and sciences play a major role in sustaining the social and economic fabric of our society.” These articles are worth highlighting in this self-study because they reveal a national conversation that Cal Poly could more explicitly tap into as we think about the role of the GE program on our comprehensive polytechnic campus, an identity that is showcased in Cal Poly’s own mission statement:
The Cal Poly Mission Statement describes the university's purpose as a comprehensive polytechnic, while affirming its historical commitment to Learn by Doing and stating its values as an academic community: Cal Poly fosters teaching, scholarship, and service in a learn-by-doing environment where students, staff, and faculty are partners in discovery. As a polytechnic university, Cal Poly promotes the application of theory to practice. As a comprehensive institution, Cal Poly provides a balanced education in the arts, sciences, and technology, while encouraging cross-disciplinary and co-curricular experiences. As an academic community, Cal Poly values free inquiry, cultural and intellectual diversity, mutual respect, civic engagement, and social and environmental responsibility.
While we must respect and honor the discipline-specific expertise that faculty bring to all of the courses they teach, it also seems imperative that we help students understand how their coursework fits together. Too often, we leave students to do this work on their own, assuming that skills and knowledge will cohere spontaneously. In short, both major and GE faculty can do a better job helping students make connections between all of the courses they take. At the moment, we see this gap between the disciplines and GE—and more specifically, between STEM and the Humanities—as being quite detrimental to our students’ overall education. GE courses are sometimes regarded as an island that students reluctantly visit during their years at Cal Poly; yet the GE program should be a key component of our students’
December 21, 2015 General Education Program Review
93
development into informed, well-rounded citizens that perform on a global stage. Or, to site one of Cal Poly’s own Learning Objectives, the GE program can help students “demonstrate expertise in a scholarly discipline and understand that discipline in relation to the larger world of the arts, sciences, and technology.”
• Encourage students to select GE courses with greater intentionality. Students often choose GE courses according to what is available, or according to specific days/times—not by focusing on the actual content of the course. If students regard GE as integral to helping them engage with their major courses in new ways, or to helping them explore new areas of interest, then they may think more carefully about which GE courses to take, especially at the upper-level.
Our own survey data show that most students (81.9% of respondents) select GE courses to fit their schedule after selecting major courses. Moreover, well under half of respondents (46%) select lower-level, foundational GE courses with the goal of completing them by their junior year, even though the GE program itself encourages students to complete foundational courses in their first and second years. Of course, students can only take the courses that are offered, so it behooves us to ensure that students have a variety of classes to choose from each year.
Cal Poly students enter the university with a major. Thus, students are steeped in the discussions of their chosen discipline from the beginning of their academic career, an element of their education that is generally regarded as one of the university’s strengths. Yet, this same policy could actually dissuade some students from exploring and being open to other avenues of study and inquiry, which makes the GE program that much more important. We can work with students—through stronger advising, clearer curricular flowcharts, etc.—to see the ways in which GE courses support them in their majors. In effect, the GE program will most benefit students if they:
1) Have flexibility in choosing their GE coursework. 2) Find ways to connect their GE courses to their major and vice-versa. 3) Regard their experience in GE courses as meaningful.
• Limit the double counting of GE courses. Over the past few years, Cal Poly (along with other CSU campuses) has struggled to respond to budget cuts and has felt pressure from the Chancellor’s Office to reduce units in majors with more than 180 units. In response, some major programs have looked for savings in the General Education program. More specifically, double-counting major courses as General Education courses has become more and more attractive to some programs. Yet, in some cases, simply counting a major course (which accommodates majors only) as a General Education course fails to offer students the same experiences they would have in a classroom populated by peers from diverse disciplinary perspectives. Moreover, it’s also important to note that the GE Student Survey revealed that only 8.2% of respondents felt that offering more major-specific GE classes would “improve” the GE program. The GEGB absolutely wants to continue working with major programs to develop a GE program that benefits both them and their students; yet, we have to be careful to support the overall philosophy of General Education courses, which are open to all students.
December 21, 2015 General Education Program Review
94
• Continue developing collaborative relationships with faculty across all disciplines. The GEGB regards faculty outreach as an area that needs more development. In fall 2015, the GEGB chair contacted all faculty who teach GE courses to share with them the GE program’s mission, PLOs, and overall goals (Appendix V), yet such communication must be sustained throughout the year. For instance, the GEGB would like to collaborate more frequently with the CTLT by co-sponsoring workshops on course and assignment design. In addition, the GEGB would like to collaborate more extensively with student advising, since this is one way to influence students as they select their GE classes. The challenge we have faced with such outreach efforts is simply time. While the GEGB chair receives four-units of release time each quarter, the other GEGB committee members do not receive any release time. Often, the committee is focused on curricular issues, like reviewing course proposals. If intensive outreach is to be a major focal point moving forward, we will need to develop strategies that can be sustained without overwhelming the GEGB members and its chair. • Develop a “GE Course Renewal” process to ensure GE course objectives are being met. As discussed earlier in this self-study, the newly proposed GE Course Renewal Process will be an exciting development for the GE program. Currently, no mechanism exists (for GE or any other university course) to revisit a course proposal after the course has been approved. Once the GEGB approves a course for the GE program, it becomes difficult to ascertain if that course continues to meet GE course objectives years later. For instance, many GE courses were approved in 2000 and have not been revisited since. In the upcoming year, the GEGB will coordinate with the Registrar’s office as well as the Academic Senate Curriculum Committee to develop a Renewal Process that doesn’t overburden faculty while still enabling the GEGB to assess if GE courses are meeting learning objectives. A renewal process will also help the GEGB gauge which GE classes are meeting their writing intensive (WI) requirements. WI classes can be found in Area A, where students write a minimum of 4000 words, and in Areas A3, C4, and D5, where students write a minimum of 3000 words. In all WI classes, at least 50% of final grades must be based on written work. While A1 and A3 classes (especially those housed in English) seem to be meeting the WI intensive requirements (due, in part, to reasonable class caps), the same cannot necessarily be said of all upper-level GE classes, especially those where caps have ballooned well past 60 students. (Indeed, it’s hard to imagine how a class could be considered WI with more than 28 students.) It seems that for a class to meet the WI requirement and for writing instruction to be handled responsibly, certain standards may need to be met, and class size may simply be one of them. Moreover, every other GE class is required to devote at least 10% of a student’s final grade to written work, and the GEGB may also need to ascertain if that requirement is being met. Cal Poly does not have a Writing Across the Curriculum program to address the needs of faculty across disciplines who teach WI courses, though the Center for Teaching Learning & Technology does its best to support faculty.
December 21, 2015 General Education Program Review
95
• Continue to assess GE learning outcomes. As the faculty survey results begin to reveal, faculty who teach GE classes may not regard assessment of the GE program as a shared responsibility. Furthermore, assessing GE classes is often regarded as a task separate from program/department assessment, even by departments and colleges that teach a high number of GE courses. Certainly, some departments (such as Mathematics and English) may need additional resources and support if they include GE assessment. Currently GE assessment is conducted in conjunction with University assessment (UNIV/GE Assessment Plan) lead by Academic Programs and Planning. Greater collaboration can be developed between this effort and department assessment efforts. Cal Poly has made great strides in developing clear and sustainable assessment practices, but some progress still needs to be made. Part of the issue here may be one of ownership. The GE program is not housed in a department or college, but instead falls under the purview of the Academic Senate. At the same time, colleges and departments are responsible for offering the courses themselves. • Establish clearer budgetary lines. When GE governance was moved to the Academic Senate, stable and clear budgetary lines did not necessarily follow. In some ways, centralizing the leadership in one senate committee with one chair who receives release time has been a cost saving measure; previously, area chairs, who oversaw the curriculum in the individual GE Areas, each received some release time (totaling more than the twelve units of the release time the GEGB chair currently receives). Further, the GE chair’s release time comes out of a finite pool of release time that the Academic Senate must distribute among other Academic Senate committees. Receiving four units of release time each quarter to administer a university-level curriculum program can create some limitations in terms of what the chair can accomplish during an AY.
Moreover, individual GE courses are supported by the colleges who offer them. Though the GEGB is an Academic Senate Committee, some additional funds to support the GEGB are provided by Academic Programs and Planning. These funds are limited; the GEGB chair generally can afford to attend one conference per year, but there is no guarantee that funds will be available if additional professional development opportunities arise. • Develop a clearer mechanism for determining if enrollment demand is met across all GE
Areas during the academic year. While some GE Areas are handled by individual departments (GE A1, GE A2, etc.), most areas, especially in upper-level GE classes, are shared across multiple disciplines (Area F). Since no one “owns” GE, Cal Poly does not currently have a mechanism in place to ensure that enough courses are being offered across all areas to meet enrollment demands.
December 21, 2015 General Education Program Review
96
B. Looking Forward: Strategic Thinking
While the state of the GE program is strong, we also know that the program may take on new forms as we look to the future. The GEGB strives for a program that is dynamic, responsive, meaningful, flexible, and progressive. The key is building on the many strengths of the current GE program while also looking for ways to enhance and move the program in new directions. The GEGB has discussed multiple options but has not settled on one direction. We hope that our external reviewers can help us consider ways to provide our students with a meaningful GE experience that will enable them to contribute to an increasingly globalized society with empathy, sensitivity, and great scholarly expertise. GE can be imagined and transformed in many different ways. While the GEGB must respect the CSU Chancellor’s Office (CO) mandates when we consider GE, we also know that the CO is open to campuses creating dynamic and exciting programs that make sense on individual campuses. Cal Poly has a unique comprehensive, Learn by Doing identity, and our GE program needs to be an important part of that identity. In effect, students can Learn by Doing GE, a message that can be communicated more strongly than it is right now. Some CSU campuses and universities across the county have adopted a more or less rigid pathways approach to GE. As stated earlier, Cal Poly students declare a major upon entry (even though some students may not be quite certain what they will actually study in that major). As such, every Cal Poly student already has a kind of pathway when they arrive on campus, a context that must be considered when we look for ways to grow our GE program. Yet, our major policy may open up possibilities for working with students to take a wide-array of GE classes that they can connect to their major courses of study in ways they hadn’t imagined. For instance, an Electrical Engineering major who takes “TH 305: Topics in Diversity on the American Stage” as their GE C4 requirement may develop new ways to think about issues of gendered and racial representations that can inform how she develops proposals for her own clients. Or, perhaps a History major chooses to take AG 315: Organic Agriculture for his Area F requirement. He may already have a budding interest in ancient agrarian societies, and this course could help him connect current trends to historical practices. In effect, we want to create a GE program that cultivates this kind of disciplinary overlap, and encourages opportunities for disciplinary integration. Yet, for these connections to work, all faculty—those teaching major courses and those teaching GE courses—need to create opportunities for students to reflect on and consider how these courses of study can inform one another. Moreover, we also want students to be free to take courses that interest them as they move through their education. A senior may not have the same interests as a first-year student and we want a GE program that can accommodate new curiosities and areas of inquiry as the students’ perceptions and interests shift. Perhaps above all, we want GE courses to be meaningful to students and faculty alike. Perhaps students could be offered an opportunity to earn a minor in an area that can work in tandem with
December 21, 2015 General Education Program Review
97
their major. In other words, a Humanities major may be interested in taking additional STEM-oriented GE courses to earn a STEM minor that could increase her marketability, or a STEM major may want to take additional Humanities-oriented GE courses to earn a Humanities minor (indeed, Cal Poly’s own Liberal Arts and Engineering Studies program could serve as a useful model). Such an approach would be optional and would leave available to students the wide array of GE courses we currently offer. Such emphasis areas could also help students see ways that their major courses and GE courses speak to one another outside of the university. In a sense, such minors would make the GE program “count” for students in new and concrete ways. The GE faculty survey discussed earlier in this self-study illustrates faculty interest in course experimentation, including linked courses. If students take a handful of linked courses throughout their education, they will be able to see avenues for knowledge-making that they wouldn’t have explored otherwise. Moreover, linked courses can provide opportunities for more explicit curricular scaffolding. For instance, cohorts of students simultaneously taking two related (but still distinct) courses—perhaps a major course and a GE course, or even two GE courses—will enable both faculty and the students to form new connections across disciplines. Faculty seem very open to this kind of experimentation, but the mechanism to encourage these relationships is not currently in place. “Team teaching” in this way seldom occurs on our campus, though this approach is rich with possibilities. This self-study has shown us that there are many avenues for growing our GE program. Some changes (stronger advising, the GE course renewal process, etc.) can be undertaken within the next year or two, while other changes will require more time for reflection and implementation. The potential of our GE program to support the talented and motivated students who attend Cal Poly is very strong and quite exciting to consider.