gene action and combining ability studies for grain yield ... · grain yield and related traits....
TRANSCRIPT
SOIL & CROP SCIENCES | RESEARCH ARTICLE
Gene action and combining ability studies for grainyield and its related traits in cowpea (Vignaunguiculata)Emmanuel YawOwusu1, Isaac Kodzo Amegbor1*, KwabenaDarkwa2,3, Richard Oteng-Frimpong1
and Emmanuel Kofi Sie1
Abstract: Identification of superior genotypes from variability generated via hybri-dization and understanding the nature of the gene action controlling grain yield andrelated traits are crucial for cowpea varietal improvement. A field experiment wasconducted at the Savannah Agricultural Research Institute, Tamale-Ghana in the2016 cropping season to examine the combining ability, genotypic and phenotypiccorrelations for grain yield and other agronomic characters in 25 cowpea genotypes(5 parents and 20 hybrids derived from a diallel cross of the parents). The resultindicated that the general combining ability and specific combining ability varied forall characters measured signifying the prominence of both additive and non-addi-tive genetic components in the present study. Non-additive gene action wasimportant for grain yield, canopy width at maturity, plant height (PLHTF), number ofseeds per pod, pod weight and days to 50% flowering (DFF). On the other hand,additive gene action was important for days to maturity (DM) and pod length.Parents PADI-TUYA and IT86D-610 were observed to be good general combiners forgrain yield and other traits while IT86D-610 × PADI-TUYA, SONGOTRA × PADI-TUYAand IT86D-610 × SARC 57–2 were identified as promising specific combiners for
ABOUT THE AUTHORThe authors are plant breeders with researchfocus on the assessment of genetic diversity incrops, particularly grain legumes to enhancegenetic improvement of yield as well as towardsresilience to climate variability. The group’sresearch activities seek to contribute to foodsecurity and poverty alleviation by increasing theproduction, productivity and utilization of cow-pea in Ghana. The authors are experienced inconducting participatory varietal selection, outscaling of improved cowpea varieties, develop-ment of climate smart technologies, nutritionalsensitization of cowpea, training of AgriculturalExtension Agents (AEAs), seed producers andfarmers on good agronomic practices for cow-pea production.
PUBLIC INTEREST STATEMENTCowpea is an important leguminous crops inGhana because of its crucial role in human diet forproteins, minerals and energy. The potential ofcowpea to address food and income security inGhana is well established. This is the first studythat evaluates yield performance and combiningability effects of cowpea genotypes in Guinea andSudan Savannah agro-ecological zones of Ghanausing diallel mating design. The research wasdesigned to elucidate the nature of gene actioncontrolling grain yield and related traits in cow-pea. The study revealed that the inheritance ofgrain yield and its related traits in cowpea isconditioned by both additive and non-additivegenetic actions. The information provided in thisstudy is useful to understand the interactionbetween grain yield and other traits in the cow-pea improvement programme. This is expected toboost cowpea production in Ghana throughdevelopment and deployment of high-yieldingclimate resilient varieties.
Owusu et al., Cogent Food & Agriculture (2018), 4: 1519973https://doi.org/10.1080/23311932.2018.1519973
© 2018 The Author(s). This open access article is distributed under a Creative CommonsAttribution (CC-BY) 4.0 license.
Received: 04 July 2018Accepted: 31 August 2018First Published: 05 September 2018
*Corresponding author: Isaac KodzoAmegbor, Savanna AgriculturalResearch Institute, P. O. Box TL 52,Tamale, GhanaE-mail: [email protected]
Reviewing editor:Manuel Tejada Moral, University ofSeville, Spain
Additional information is available atthe end of the article
Page 1 of 17
grain yield and related traits. Selection criteria to improve the grain yield of cowpeashould focus on plants with long peduncles, high canopy width and many pods perplant as these traits have high genetic correlation with grain yield.
Subjects: Agriculture & Environmental Sciences; Plant & Animal Ecology; Earth Sciences
Keywords: diallel mating design; heterosis; genotypic correlation; Vigna unguiculata
1. IntroductionCowpea (Vigna unguiculata L. Walp.) is one of the most important and native grain legumecrops in sub-Saharan Africa (SSA) which accounts for about 64% of the annual world produc-tion of 7.6 million tonnes (Sivakumar et al., 2013; Timko & Singh, 2008). An average of 143,000MT is produced annually on about 156,000 ha making Ghana the fifth highest producer ofcowpea in SSA (ICRISAT, 2012). In Ghana, the crop is predominantly cultivated by resourcelimited small holder farmers usually women with an average farm size of 0.5–1.0 ha and yieldof 0.5 t ha−1 (Wiggins, 2009; Wiggins and Sharada, 2013). It is essential to develop high-yielding cowpea varieties to help improve production and productivity of the crop in Ghana.
Grain yield is one of the most important but complex traits in crop improvement programmes. It isthe result of interaction of the environment with all growth and development processes that occurat vegetative and reproduction stages of the crop (Quarrie et al., 2006). Grain yield in cowpea directlydepends on yield components such as number of pod per plant, number of seeds per pod and 100seed weight, and is highly influenced by both genetic and environmental factors (Hassan et al., 2005;Wattoo et al., 2009). Therefore, selection on the basis of grain yield alone is usually not efficient.Hence, selection along with yield and its associated components can improve the efficiency ofselection in plant breeding programs (Romanus et al., 2008).
Different environmental conditions which result in yield variations in cowpea, have led to thedevelopment of cowpea improvement programmes that depend on selection of lines developedfrom potential parents (Romanus et al., 2008). According to Dar et al. (2014), the per se perfor-mance of parents is not always a true indicator of its potential to exploit the hybrid combination.The nature and magnitude of gene action controlling quantitative traits is very useful for success-ful development of crop varieties through proper choice of parents for hybridization programme(Baker, 1978; Falconer, 1989; Griffings, 1956). There is therefore the need to make a proper choiceof parents that will provide potential progenies.
Combining ability describes the breeding value of parental lines to produce hybrids. It helps toselect the parents and utilize them in the breeding programmes for production of superior hybrids.The concept of combining ability was first proposed by Sprague and Tatum (1942) in maize and hasbeen used successfully in several studies. The general combination ability refers to additive geneaction and is used to determine the performance of parents in general terms while specificcombining ability effect is determined by dominant gene action and is used to indicate the hybridperformance in specific terms. Breeders use these variance components to determine the geneaction and to assess the genetic potentials of parent in hybrid combinations. Diallel (Griffing, 1956)and line × tester (Kempthorne, 1956) matting designs provide reliable information about thegeneral and specific combining ability of parents and their cross combinations. Full diallel analysisis a mating design where selected parents are crossed in all possible combinations and is used inpredicting combining ability of the parents.
The knowledge of combining ability and gene action would help cowpea breeders to effectivelyidentify potential parents, breeding strategies and to select promising genotypes from the segre-gating populations to improve productivity of cowpea.
Owusu et al., Cogent Food & Agriculture (2018), 4: 1519973https://doi.org/10.1080/23311932.2018.1519973
Page 2 of 17
The objectives of this study were to: (i) determine the nature and the magnitude of gene actioncontrolling yields and its component traits, (ii) identify potential parents for hybridization andselection programme and (iii) determine the genetic relationships among these traits.
2. Materials and methodsThe research was conducted during the 2016 cropping season at the Council for Scientific andIndustrial Research Savannah Agricultural Research Institute (CSIR-SARI) Tamale. SARI is in theGuinea Savannah agro-ecological zone of Ghana, located on latitude 9º, 25′, 41N, longitude 0º, 58′,42W and about 183 m above sea level. The area is characterized by mono-modal rainfall with anaverage annual rainfall of about 1200 mm (Ndamani & Watanabe, 2013).
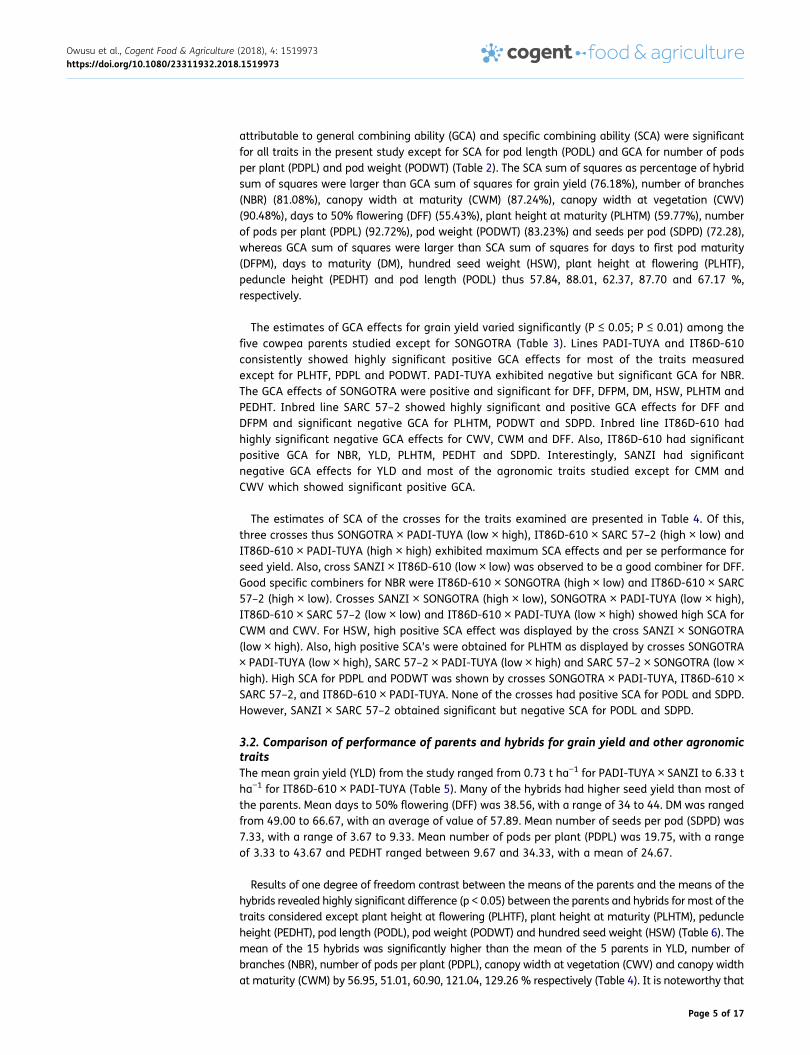
The present study examined five cowpea genotypes viz IT86D-610, SARC 1–57–2, Sanzi, Padi-tuyaand Songotra. The geneticmaterials used had phenotypic variation for yield and its related componenttraits (Table 1). Genotypes IT86D-610 and SARC 1–57–2 are advanced breeding lines fromInternational Institute of Tropical Agriculture (IITA) in Ibadan, Nigeria and CSIR-SARI, Ghana, respec-tively. Sanzi is a land race while Padi-tuya and Songotra are improved varieties released by CSIR-SARIin 2008. A full diallel cross was made using these five parents. A toal of 20 F1 individuals and their fiveparents were evaluated in a randomized complete block design with three replications at SARI duringthe 2016 cropping season. Seeds were planted at a spacing of 100 cm inter-row and 20 cmwithin row.Each plot was made up of two rows of 2 m length. Parents and F1’s were randomly assigned to eachplot and labelled accordingly. Observations were made on number of days to 50% flowering (DFF),plant height at flowering (cm) (PLHTF), number of branches (NBR), peduncle height (cm) (PEDHT),number of days to first pod maturity (DFPM), number of days to 90% podmaturity (DM), canopy widthat maturity (CWM), canopy width at vegetation (CWV), number of pods per plant (PDPL), number ofseeds per pod (SDPD), pod length (cm) (PODL), podweight (t ha−1) (PODWT), 100 seedweight (g) (HSW),and grain yield (t ha−1) (YLD). Five plants were randomly selected from each plot and tagged forphenotypic observations. Before the analysis, the data was subjected to normality test to ensure itconforms to basic assumptions of analysis of variance (ANOVA). All the count data were transformedusing the square root transformation method. Consequently, ANOVA was conducted using PROC GLMin Statistical Analysis System (SAS) using a RANDOM statement with the TEST option (SAS Institute,2011 version 9.3). Genotypes were considered fixed effects whilst replications and blocks wereconsidered random effects. GCA and SCA were estimated using Analysis of Genetic Designs (AGD-Rversion 3.0) the DIALLEL R program (Rodriguez et al., 2015) following Griffing’s Method II and Model I(fixed) of diallel analysis (Griffing, 1956).
3. Results
3.1. Analyses of variance and combining ability estimates for grain yield and other traitsAnalysis of variance revealed significant differences (p < 0.01; p < 0.05) among the cowpea geno-types for grain yield and all the other agronomic traits examined (Table 2). Mean squares
Table 1. Number of days to pod maturity, potential grain yield, seed coat colour, and growthhabit for the parental genotypes used for the study
Genotype Trait
Maturity Potential yieldt/ha
Seed coat colour Growth habit
Padi-tuya 75 days 2.0 White Erect with few vines
Songotra 65 Days 2.2 White Erect
Sanzi 50 Days 0.8 Molted Creping
IT86D-610 60 Days 2.6 Brown Semi erect
SARC-1–57–2 60 days 1.8 White Erect
Owusu et al., Cogent Food & Agriculture (2018), 4: 1519973https://doi.org/10.1080/23311932.2018.1519973
Page 3 of 17

Table2.
Ana
lysisof
varian
cean
dmea
nsq
uaresforgrainyieldan
dothe
rag
rono
mic
traits
ofdiallelc
rosses
invo
lvingfive
cowpe
alin
esev
alua
teddu
ring
2016
crop
ping
seas
onSo
urce
dfNBR
CWV
CWM
DF
DFP
MDM
YLD
HSW
PLHTM
PLHTF
PEDHT
PDPL
PODWT
PODL
SDPD
REP
20.16
NS
741.76
NS
373.76
**0.52
NS
0.09
NS
0.42
NS
0.68
**2.08
NS
9.65
NS
2.92
**0.61
NS
1.62
NS
0.09
NS
0.39
NS
3.21
NS
Cros
s24
4.50
**94
44.17**
6062
.27**
17.30**
23.78**
54.64**
7.02
**35
.47*
165.73
**12
3.51
**10
0.29
**20
1.11
**9.82
**4.69
**5.11
**
GCA
43.94
**56
43.70**
2960
.92**
31.11**
65.01**
170.75
**7.90
**10
2.16
**42
4.9**
203.75
**36
5.49
**63
.44N
S6.50
NS
13.01**
4.92
**
SCA
106.75
**15
,437
.22*
11,259
.42**
15.48**
18.96**
25.23**
10.11**
5.57
**11
4.42
**13
5.09
**20
.50**
323.32
**12
.90**
2.54
NS
5.13
**
Residu
al40
0.34
720.8
539.4
0.29
1.46
3.12
0.49
1.22
3.28
4.28
5.44
25.89
2.85
1.37
1.2
%GCA
SS18
.92
12.76
9.52
44.57
57.84
73.03
23.82
88.01
59.77
37.63
87.7
7.28
16.77
67.17
27.72
%SC
ASS
81.08
87.24
90.48
55.43
42.16
26.97
76.18
11.99
40.23
62.37
12.3
92.72
83.23
32.83
72.28
Herita
bility(Ha)
0.12
20.07
70.05
30.35
40.45
40.60
30.16
00.78
30.49
90.28
40.76
60.02
80.05
30.38
60.12
4
††NBR
,num
berof
bran
ches
;CWV,c
anop
ywidth
atVeg
etation(cm);CW
M,c
anop
ywidth
atmaturity(cm);DF,
Day
sto
50%
flowering;
DFP
M,D
aysto
first
podmaturity;
DM,D
aysto
maturity;
YLD,see
dyield(t
ha−1);HSW
,hun
dred
seed
weigh
t(g);PL
HTM
,plant
height
atmaturity(cm);PL
HTF
,plant
height
atflo
wering(cm);PE
DHT,
pedu
ncle
height
(cm);PD
PL,n
umbe
rof
pods
perplan
t;PO
DWT,
pod
weigh
t(t
ha−1);PO
DL;
podleng
th(cm);SD
PD,n
umbe
rof
seed
spe
rpo
d.
Owusu et al., Cogent Food & Agriculture (2018), 4: 1519973https://doi.org/10.1080/23311932.2018.1519973
Page 4 of 17
attributable to general combining ability (GCA) and specific combining ability (SCA) were significantfor all traits in the present study except for SCA for pod length (PODL) and GCA for number of podsper plant (PDPL) and pod weight (PODWT) (Table 2). The SCA sum of squares as percentage of hybridsum of squares were larger than GCA sum of squares for grain yield (76.18%), number of branches(NBR) (81.08%), canopy width at maturity (CWM) (87.24%), canopy width at vegetation (CWV)(90.48%), days to 50% flowering (DFF) (55.43%), plant height at maturity (PLHTM) (59.77%), numberof pods per plant (PDPL) (92.72%), pod weight (PODWT) (83.23%) and seeds per pod (SDPD) (72.28),whereas GCA sum of squares were larger than SCA sum of squares for days to first pod maturity(DFPM), days to maturity (DM), hundred seed weight (HSW), plant height at flowering (PLHTF),peduncle height (PEDHT) and pod length (PODL) thus 57.84, 88.01, 62.37, 87.70 and 67.17 %,respectively.
The estimates of GCA effects for grain yield varied significantly (P ≤ 0.05; P ≤ 0.01) among thefive cowpea parents studied except for SONGOTRA (Table 3). Lines PADI-TUYA and IT86D-610consistently showed highly significant positive GCA effects for most of the traits measuredexcept for PLHTF, PDPL and PODWT. PADI-TUYA exhibited negative but significant GCA for NBR.The GCA effects of SONGOTRA were positive and significant for DFF, DFPM, DM, HSW, PLHTM andPEDHT. Inbred line SARC 57–2 showed highly significant and positive GCA effects for DFF andDFPM and significant negative GCA for PLHTM, PODWT and SDPD. Inbred line IT86D-610 hadhighly significant negative GCA effects for CWV, CWM and DFF. Also, IT86D-610 had significantpositive GCA for NBR, YLD, PLHTM, PEDHT and SDPD. Interestingly, SANZI had significantnegative GCA effects for YLD and most of the agronomic traits studied except for CMM andCWV which showed significant positive GCA.
The estimates of SCA of the crosses for the traits examined are presented in Table 4. Of this,three crosses thus SONGOTRA × PADI-TUYA (low × high), IT86D-610 × SARC 57–2 (high × low) andIT86D-610 × PADI-TUYA (high × high) exhibited maximum SCA effects and per se performance forseed yield. Also, cross SANZI × IT86D-610 (low × low) was observed to be a good combiner for DFF.Good specific combiners for NBR were IT86D-610 × SONGOTRA (high × low) and IT86D-610 × SARC57–2 (high × low). Crosses SANZI × SONGOTRA (high × low), SONGOTRA × PADI-TUYA (low × high),IT86D-610 × SARC 57–2 (low × low) and IT86D-610 × PADI-TUYA (low × high) showed high SCA forCWM and CWV. For HSW, high positive SCA effect was displayed by the cross SANZI × SONGOTRA(low × high). Also, high positive SCA’s were obtained for PLHTM as displayed by crosses SONGOTRA× PADI-TUYA (low × high), SARC 57–2 × PADI-TUYA (low × high) and SARC 57–2 × SONGOTRA (low ×high). High SCA for PDPL and PODWT was shown by crosses SONGOTRA × PADI-TUYA, IT86D-610 ×SARC 57–2, and IT86D-610 × PADI-TUYA. None of the crosses had positive SCA for PODL and SDPD.However, SANZI × SARC 57–2 obtained significant but negative SCA for PODL and SDPD.
3.2. Comparison of performance of parents and hybrids for grain yield and other agronomictraitsThe mean grain yield (YLD) from the study ranged from 0.73 t ha−1 for PADI-TUYA × SANZI to 6.33 tha−1 for IT86D-610 × PADI-TUYA (Table 5). Many of the hybrids had higher seed yield than most ofthe parents. Mean days to 50% flowering (DFF) was 38.56, with a range of 34 to 44. DM was rangedfrom 49.00 to 66.67, with an average of value of 57.89. Mean number of seeds per pod (SDPD) was7.33, with a range of 3.67 to 9.33. Mean number of pods per plant (PDPL) was 19.75, with a rangeof 3.33 to 43.67 and PEDHT ranged between 9.67 and 34.33, with a mean of 24.67.
Results of one degree of freedom contrast between the means of the parents and the means of thehybrids revealed highly significant difference (p < 0.05) between the parents and hybrids for most of thetraits considered except plant height at flowering (PLHTF), plant height at maturity (PLHTM), peduncleheight (PEDHT), pod length (PODL), pod weight (PODWT) and hundred seed weight (HSW) (Table 6). Themean of the 15 hybrids was significantly higher than the mean of the 5 parents in YLD, number ofbranches (NBR), number of pods per plant (PDPL), canopy width at vegetation (CWV) and canopy widthat maturity (CWM) by 56.95, 51.01, 60.90, 121.04, 129.26 % respectively (Table 4). It is noteworthy that
Owusu et al., Cogent Food & Agriculture (2018), 4: 1519973https://doi.org/10.1080/23311932.2018.1519973
Page 5 of 17
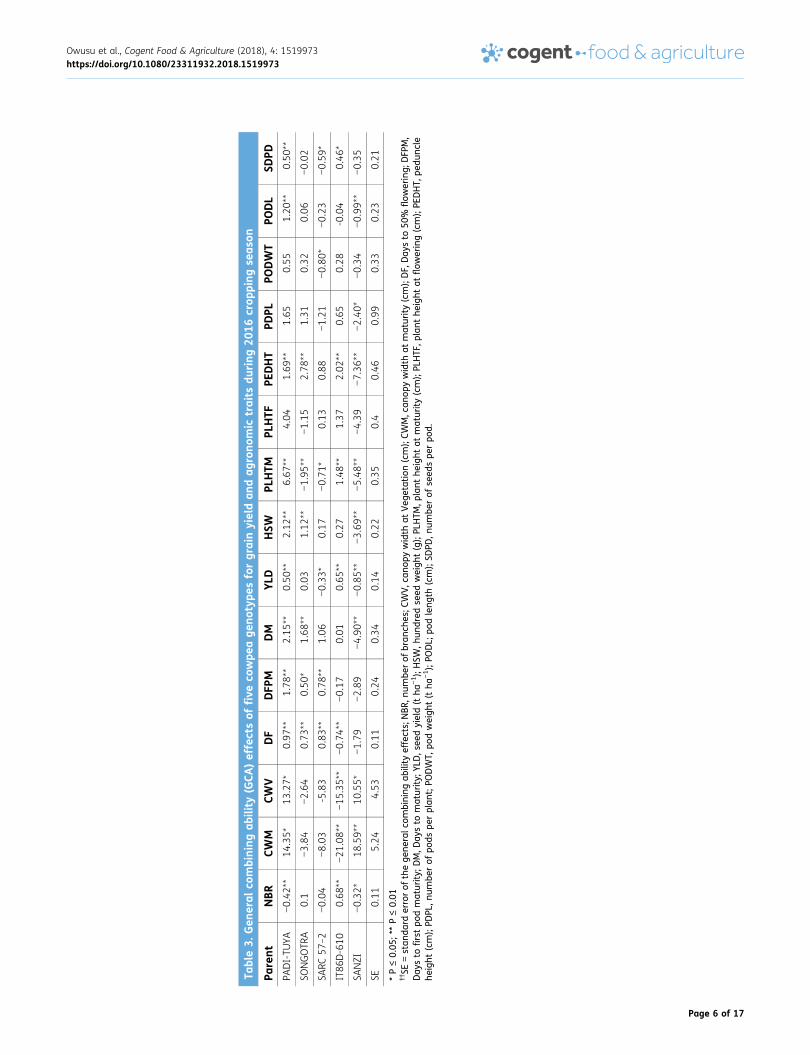
Table3.
Gen
eral
combining
ability
(GCA
)effectsof
five
cowpe
age
notype
sforgrainyieldan
dag
rono
mic
traits
during
2016
crop
ping
seas
on
Parent
NBR
CWM
CWV
DF
DFP
MDM
YLD
HSW
PLHTM
PLHTF
PEDHT
PDPL
PODWT
PODL
SDPD
PADI-TU
YA−0.42
**14
.35*
13.27*
0.97
**1.78
**2.15
**0.50
**2.12
**6.67
**4.04
1.69
**1.65
0.55
1.20
**0.50
**
SONGOTR
A0.1
−3.84
−2.64
0.73
**0.50
*1.68
**0.03
1.12
**−1.95
**−1.15
2.78
**1.31
0.32
0.06
−0.02
SARC
57–2
−0.04
−8.03
-5.83
0.83
**0.78
**1.06
−0.33
*0.17
−0.71
*0.13
0.88
−1.21
−0.80
*−0.23
−0.59
*
IT86
D-610
0.68
**−21
.08**
−15
.35**
−0.74
**−0.17
0.01
0.65
**0.27
1.48
**1.37
2.02
**0.65
0.28
-0.04
0.46
*
SANZI
−0.32
*18
.59**
10.55*
−1.79
−2.89
−4.90
**−0.85
**−3.69
**−5.48
**−4.39
−7.36
**−2.40
*−0.34
−0.99
**−0.35
SE0.11
5.24
4.53
0.11
0.24
0.34
0.14
0.22
0.35
0.4
0.46
0.99
0.33
0.23
0.21
*P≤0.05
;**P≤0.01
††SE
=stan
dard
errorof
thege
neralc
ombining
ability
effects;NBR
,num
berof
bran
ches
;CWV,c
anop
ywidth
atVeg
etation(cm);CW
M,c
anop
ywidth
atmaturity(cm);DF,
Day
sto
50%
flowering;
DFP
M,
Day
sto
first
podmaturity;
DM,D
aysto
maturity;
YLD,s
eedyield(t
ha−1);HSW
,hun
dred
seed
weigh
t(g);PL
HTM
,plant
height
atmaturity(cm);PL
HTF
,plant
height
atflo
wering(cm);PE
DHT,
pedu
ncle
height
(cm);PD
PL,n
umbe
rof
pods
perplan
t;PO
DWT,
podweigh
t(t
ha−1);PO
DL;
podleng
th(cm);SD
PD,n
umbe
rof
seed
spe
rpo
d.
Owusu et al., Cogent Food & Agriculture (2018), 4: 1519973https://doi.org/10.1080/23311932.2018.1519973
Page 6 of 17
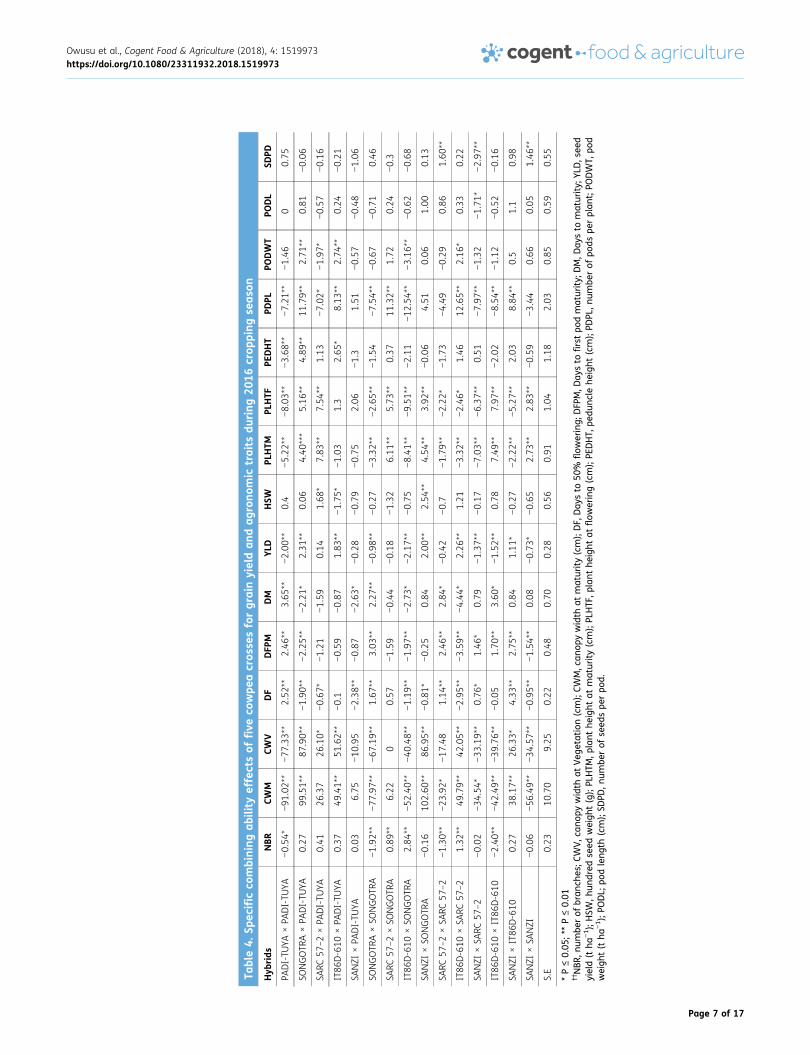
Table4.
Spec
ific
combining
ability
effectsof
five
cowpe
acros
sesforgrainyieldan
dag
rono
mic
traits
during
2016
crop
ping
seas
on
Hyb
rids
NBR
CWM
CWV
DF
DFP
MDM
YLD
HSW
PLHTM
PLHTF
PEDHT
PDPL
PODWT
PODL
SDPD
PADI-TU
YA×PA
DI-TU
YA−0.54
*−91
.02**
−77
.33**
2.52
**2.46
**3.65
**−2.00
**0.4
−5.22
**−8.03
**−3.68
**−7.21
**−1.46
00.75
SONGOTR
A×PA
DI-TU
YA0.27
99.51**
87.90**
−1.90
**−2.25
**−2.21
*2.31
**0.06
4.40
***
5.16
**4.89
**11
.79**
2.71
**0.81
−0.06
SARC
57–2×PA
DI-TU
YA0.41
26.37
26.10*
−0.67
*−1.21
−1.59
0.14
1.68
*7.83
**7.54
**1.13
−7.02
*−1.97
*−0.57
−0.16
IT86
D-610
×PA
DI-TU
YA0.37
49.41**
51.62**
−0.1
−0.59
−0.87
1.83
**−1.75
*−1.03
1.3
2.65
*8.13
**2.74
**0.24
−0.21
SANZI
×PA
DI-TU
YA0.03
6.75
−10
.95
−2.38
**−0.87
−2.63
*−0.28
−0.79
−0.75
2.06
−1.3
1.51
−0.57
−0.48
−1.06
SONGOTR
A×SO
NGOTR
A−1.92
**−77
.97**
−67
.19**
1.67
**3.03
**2.27
**−0.98
**−0.27
−3.32
**−2.65
**−1.54
−7.54
**−0.67
−0.71
0.46
SARC
57–2×SO
NGOTR
A0.89
**6.22
00.57
−1.59
−0.44
−0.18
−1.32
6.11
**5.73
**0.37
11.32**
1.72
0.24
−0.3
IT86
D-610
×SO
NGOTR
A2.84
**−52
.40**
−40
.48**
−1.19
**−1.97
**−2.73
*−2.17
**−0.75
−8.41
**−9.51
**−2.11
−12
.54**
−3.16
**−0.62
−0.68
SANZI
×SO
NGOTR
A−0.16
102.60
**86
.95**
−0.81
*−0.25
0.84
2.00
**2.54
**4.54
**3.92
**−0.06
4.51
0.06
1.00
0.13
SARC
57–2×SA
RC57
–2
−1.30
**−23
.92*
−17
.48
1.14
**2.46
**2.84
*−0.42
−0.7
−1.79
**−2.22
*−1.73
−4.49
−0.29
0.86
1.60
**
IT86
D-610
×SA
RC57
–2
1.32
**49
.79**
42.05**
−2.95
**−3.59
**−4.44
*2.26
**1.21
−3.32
**−2.46
*1.46
12.65**
2.16
*0.33
0.22
SANZI
×SA
RC57
–2
−0.02
−34
.54*
−33
.19**
0.76
*1.46
*0.79
−1.37
**−0.17
−7.03
**−6.37
**0.51
−7.97
**−1.32
−1.71
*−2.97
**
IT86
D-610
×IT86
D-610
−2.40
**−42
.49**
−39
.76**
−0.05
1.70
**3.60
*−1.52
**0.78
7.49
**7.97
**−2.02
−8.54
**−1.12
−0.52
−0.16
SANZI
×IT86
D-610
0.27
38.17**
26.33*
4.33
**2.75
**0.84
1.11
*−0.27
−2.22
**−5.27
**2.03
8.84
**0.5
1.1
0.98
SANZI
×SA
NZI
−0.06
−56
.49**
−34
.57**
−0.95
**−1.54
**0.08
−0.73
*−0.65
2.73
**2.83
**−0.59
−3.44
0.66
0.05
1.46
**
S.E
0.23
10.70
9.25
0.22
0.48
0.70
0.28
0.56
0.91
1.04
1.18
2.03
0.85
0.59
0.55
*P≤0.05
;**P≤0.01
††NBR
,num
berof
bran
ches
;CWV,c
anop
ywidth
atVeg
etation(cm);CW
M,c
anop
ywidth
atmaturity(cm);DF,
Day
sto
50%
flowering;
DFP
M,D
aysto
first
podmaturity;
DM,D
aysto
maturity;
YLD,see
dyield(t
ha−1);HSW
,hun
dred
seed
weigh
t(g);PL
HTM
,plant
height
atmaturity(cm);PL
HTF
,plant
height
atflo
wering(cm);PE
DHT,
pedu
ncle
height
(cm);PD
PL,n
umbe
rof
pods
perplan
t;PO
DWT,
pod
weigh
t(t
ha−1);PO
DL;
podleng
th(cm);SD
PD,n
umbe
rof
seed
spe
rpo
d.
Owusu et al., Cogent Food & Agriculture (2018), 4: 1519973https://doi.org/10.1080/23311932.2018.1519973
Page 7 of 17
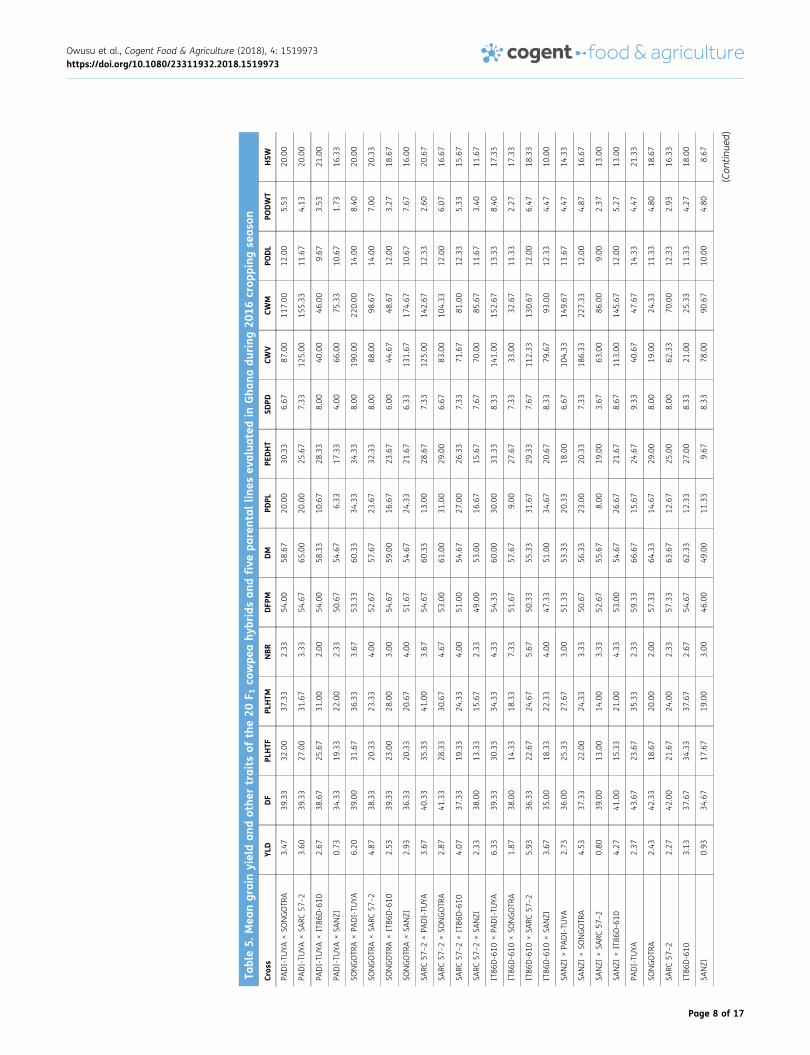
Table5.
Mea
ngrainyieldan
dothe
rtraits
ofthe20
F 1co
wpe
ahy
bridsan
dfive
parental
lines
evalua
tedin
Gha
nadu
ring
2016
crop
ping
seas
onCros
sYL
DDF
PLHTF
PLHTM
NBR
DFP
MDM
PDPL
PEDHT
SDPD
CWV
CWM
PODL
PODWT
HSW
PADI-TU
YA×SO
NGOTR
A3.47
39.33
32.00
37.33
2.33
54.00
58.67
20.00
30.33
6.67
87.00
117.00
12.00
5.53
20.00
PADI-TU
YA×SA
RC57
–2
3.60
39.33
27.00
31.67
3.33
54.67
65.00
20.00
25.67
7.33
125.00
155.33
11.67
4.13
20.00
PADI-TU
YA×IT86
D-610
2.67
38.67
25.67
31.00
2.00
54.00
58.33
10.67
28.33
8.00
40.00
46.00
9.67
3.53
21.00
PADI-TU
YA×SA
NZI
0.73
34.33
19.33
22.00
2.33
50.67
54.67
6.33
17.33
4.00
66.00
75.33
10.67
1.73
16.33
SONGOTR
A×PA
DI-TU
YA6.20
39.00
31.67
36.33
3.67
53.33
60.33
34.33
34.33
8.00
190.00
220.00
14.00
8.40
20.00
SONGOTR
A×SA
RC57
–2
4.87
38.33
20.33
23.33
4.00
52.67
57.67
23.67
32.33
8.00
88.00
98.67
14.00
7.00
20.33
SONGOTR
A×IT86
D-610
2.53
39.33
23.00
28.00
3.00
54.67
59.00
16.67
23.67
6.00
44.67
48.67
12.00
3.27
18.67
SONGOTR
A×SA
NZI
2.93
36.33
20.33
20.67
4.00
51.67
54.67
24.33
21.67
6.33
131.67
174.67
10.67
7.67
16.00
SARC
57–2×PA
DI-TU
YA3.67
40.33
35.33
41.00
3.67
54.67
60.33
13.00
28.67
7.33
125.00
142.67
12.33
2.60
20.67
SARC
57–2×SO
NGOTR
A2.87
41.33
28.33
30.67
4.67
53.00
61.00
31.00
29.00
6.67
83.00
104.33
12.00
6.07
16.67
SARC
57–2×IT86
D-610
4.07
37.33
19.33
24.33
4.00
51.00
54.67
27.00
26.33
7.33
71.67
81.00
12.33
5.33
15.67
SARC
57–2×SA
NZI
2.33
38.00
13.33
15.67
2.33
49.00
53.00
16.67
15.67
7.67
70.00
85.67
11.67
3.40
11.67
IT86
D-610
×PA
DI-TU
YA6.33
39.33
30.33
34.33
4.33
54.33
60.00
30.00
31.33
8.33
141.00
152.67
13.33
8.40
17.33
IT86
D-610
×SO
NGOTR
A1.87
38.00
14.33
18.33
7.33
51.67
57.67
9.00
27.67
7.33
33.00
32.67
11.33
2.27
17.33
IT86
D-610
×SA
RC57
–2
5.93
36.33
22.67
24.67
5.67
50.33
55.33
31.67
29.33
7.67
112.33
130.67
12.00
6.47
18.33
IT86
D-610
×SA
NZI
3.67
35.00
18.33
22.33
4.00
47.33
51.00
34.67
20.67
8.33
79.67
93.00
12.33
4.47
10.00
SANZI
×PA
DI-TU
YA2.73
36.00
25.33
27.67
3.00
51.33
53.33
20.33
18.00
6.67
104.33
149.67
11.67
4.47
14.33
SANZI
×SO
NGOTR
A4.53
37.33
22.00
24.33
3.33
50.67
56.33
23.00
20.33
7.33
186.33
227.33
12.00
4.87
16.67
SANZI
×SA
RC57
–2
0.80
39.00
13.00
14.00
3.33
52.67
55.67
8.00
19.00
3.67
63.00
86.00
9.00
2.37
13.00
SANZI
×IT86
D-610
4.27
41.00
15.33
21.00
4.33
53.00
54.67
26.67
21.67
8.67
113.00
145.67
12.00
5.27
13.00
PADI-TU
YA2.37
43.67
23.67
35.33
2.33
59.33
66.67
15.67
24.67
9.33
40.67
47.67
14.33
4.47
21.33
SONGOTR
A2.43
42.33
18.67
20.00
2.00
57.33
64.33
14.67
29.00
8.00
19.00
24.33
11.33
4.80
18.67
SARC
57–2
2.27
42.00
21.67
24.00
2.33
57.33
63.67
12.67
25.00
8.00
62.33
70.00
12.33
2.93
16.33
IT86
D-610
3.13
37.67
34.33
37.67
2.67
54.67
62.33
12.33
27.00
8.33
21.00
25.33
11.33
4.27
18.00
SANZI
0.93
34.67
17.67
19.00
3.00
46.00
49.00
11.33
9.67
8.33
78.00
90.67
10.00
4.80
8.67
(Con
tinue
d)
Owusu et al., Cogent Food & Agriculture (2018), 4: 1519973https://doi.org/10.1080/23311932.2018.1519973
Page 8 of 17
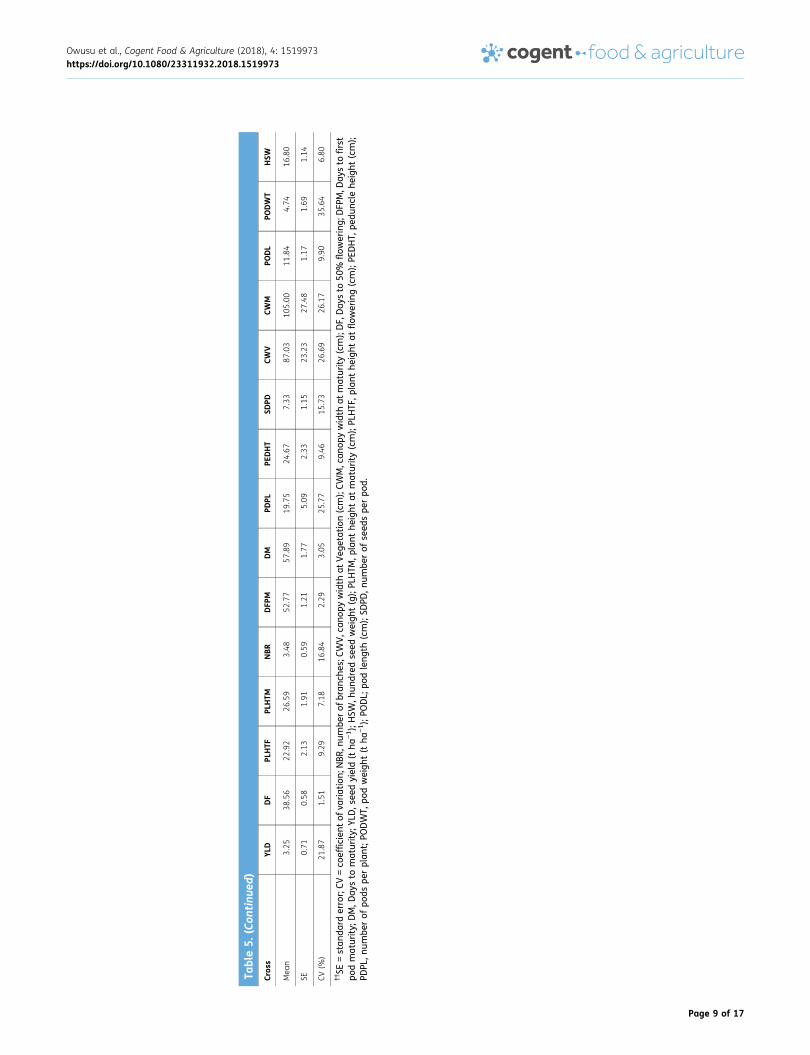
Table5.
(Con
tinu
ed)
Cros
sYL
DDF
PLHTF
PLHTM
NBR
DFP
MDM
PDPL
PEDHT
SDPD
CWV
CWM
PODL
PODWT
HSW
Mea
n3.25
38.56
22.92
26.59
3.48
52.77
57.89
19.75
24.67
7.33
87.03
105.00
11.84
4.74
16.80
SE0.71
0.58
2.13
1.91
0.59
1.21
1.77
5.09
2.33
1.15
23.23
27.48
1.17
1.69
1.14
CV(%
)21
.87
1.51
9.29
7.18
16.84
2.29
3.05
25.77
9.46
15.73
26.69
26.17
9.90
35.64
6.80
††SE
=stan
dard
error;CV
=co
effic
ient
ofva
riation;
NBR
,num
berof
bran
ches
;CWV,can
opywidth
atVeg
etation(cm);CW
M,can
opywidth
atmaturity(cm);DF,Day
sto
50%
flowering;
DFP
M,D
aysto
first
podmaturity;
DM,D
aysto
maturity;
YLD,s
eedyield(t
ha−1);HSW
,hun
dred
seed
weigh
t(g);PL
HTM
,plant
height
atmaturity(cm);PL
HTF
,plant
height
atflo
wering(cm);PE
DHT,
pedu
ncle
height
(cm);
PDPL
,num
berof
pods
perplan
t;PO
DWT,
podweigh
t(t
ha−1);PO
DL;
podleng
th(cm);SD
PD,n
umbe
rof
seed
spe
rpo
d.
Owusu et al., Cogent Food & Agriculture (2018), 4: 1519973https://doi.org/10.1080/23311932.2018.1519973
Page 9 of 17
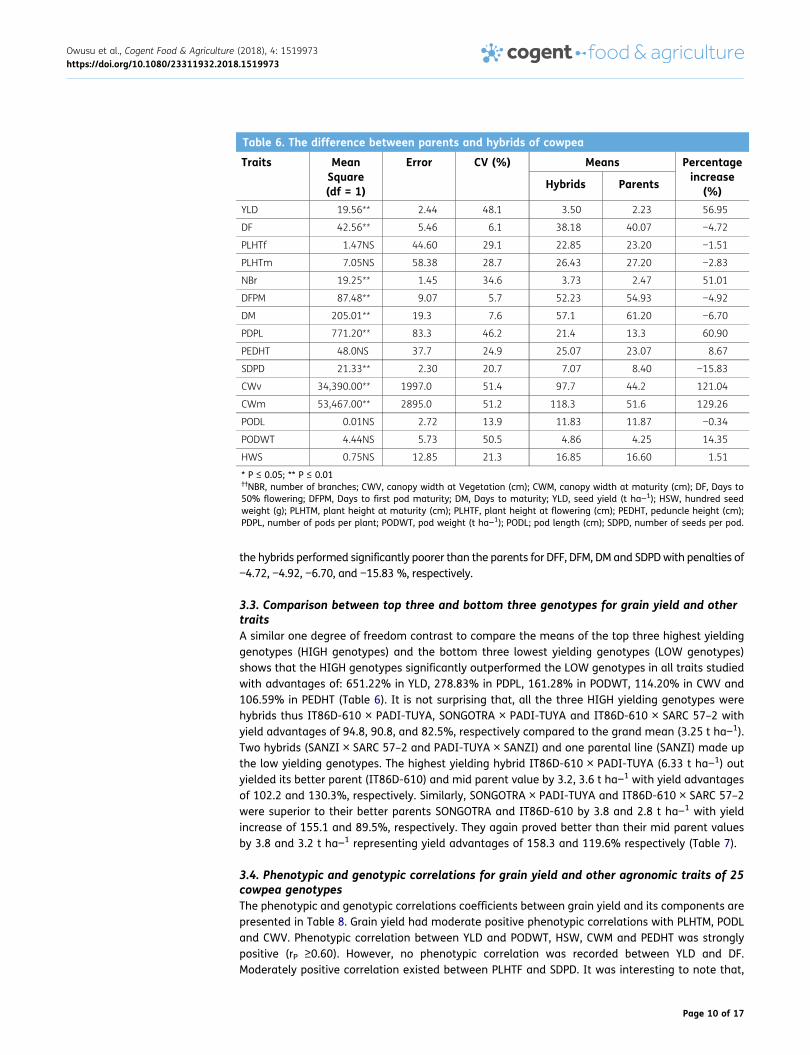
the hybrids performed significantly poorer than the parents for DFF, DFM, DM and SDPDwith penalties of−4.72, −4.92, −6.70, and −15.83 %, respectively.
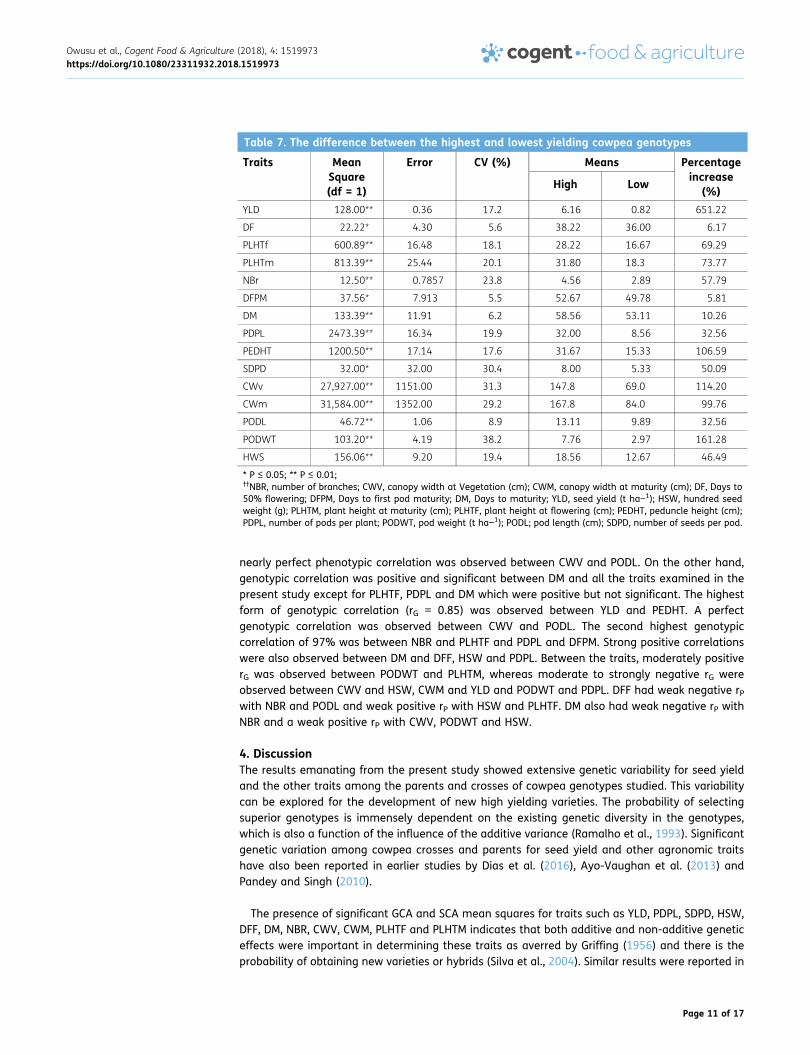
3.3. Comparison between top three and bottom three genotypes for grain yield and othertraitsA similar one degree of freedom contrast to compare the means of the top three highest yieldinggenotypes (HIGH genotypes) and the bottom three lowest yielding genotypes (LOW genotypes)shows that the HIGH genotypes significantly outperformed the LOW genotypes in all traits studiedwith advantages of: 651.22% in YLD, 278.83% in PDPL, 161.28% in PODWT, 114.20% in CWV and106.59% in PEDHT (Table 6). It is not surprising that, all the three HIGH yielding genotypes werehybrids thus IT86D-610 × PADI-TUYA, SONGOTRA × PADI-TUYA and IT86D-610 × SARC 57–2 withyield advantages of 94.8, 90.8, and 82.5%, respectively compared to the grand mean (3.25 t ha−1).Two hybrids (SANZI × SARC 57–2 and PADI-TUYA × SANZI) and one parental line (SANZI) made upthe low yielding genotypes. The highest yielding hybrid IT86D-610 × PADI-TUYA (6.33 t ha−1) outyielded its better parent (IT86D-610) and mid parent value by 3.2, 3.6 t ha−1 with yield advantagesof 102.2 and 130.3%, respectively. Similarly, SONGOTRA × PADI-TUYA and IT86D-610 × SARC 57–2were superior to their better parents SONGOTRA and IT86D-610 by 3.8 and 2.8 t ha−1 with yieldincrease of 155.1 and 89.5%, respectively. They again proved better than their mid parent valuesby 3.8 and 3.2 t ha−1 representing yield advantages of 158.3 and 119.6% respectively (Table 7).
3.4. Phenotypic and genotypic correlations for grain yield and other agronomic traits of 25cowpea genotypesThe phenotypic and genotypic correlations coefficients between grain yield and its components arepresented in Table 8. Grain yield had moderate positive phenotypic correlations with PLHTM, PODLand CWV. Phenotypic correlation between YLD and PODWT, HSW, CWM and PEDHT was stronglypositive (rP ≥0.60). However, no phenotypic correlation was recorded between YLD and DF.Moderately positive correlation existed between PLHTF and SDPD. It was interesting to note that,
Table 6. The difference between parents and hybrids of cowpea
Traits MeanSquare(df = 1)
Error CV (%) Means Percentageincrease
(%)Hybrids Parents
YLD 19.56** 2.44 48.1 3.50 2.23 56.95
DF 42.56** 5.46 6.1 38.18 40.07 −4.72
PLHTf 1.47NS 44.60 29.1 22.85 23.20 −1.51
PLHTm 7.05NS 58.38 28.7 26.43 27.20 −2.83
NBr 19.25** 1.45 34.6 3.73 2.47 51.01
DFPM 87.48** 9.07 5.7 52.23 54.93 −4.92
DM 205.01** 19.3 7.6 57.1 61.20 −6.70
PDPL 771.20** 83.3 46.2 21.4 13.3 60.90
PEDHT 48.0NS 37.7 24.9 25.07 23.07 8.67
SDPD 21.33** 2.30 20.7 7.07 8.40 −15.83
CWv 34,390.00** 1997.0 51.4 97.7 44.2 121.04
CWm 53,467.00** 2895.0 51.2 118.3 51.6 129.26
PODL 0.01NS 2.72 13.9 11.83 11.87 −0.34
PODWT 4.44NS 5.73 50.5 4.86 4.25 14.35
HWS 0.75NS 12.85 21.3 16.85 16.60 1.51
* P ≤ 0.05; ** P ≤ 0.01††NBR, number of branches; CWV, canopy width at Vegetation (cm); CWM, canopy width at maturity (cm); DF, Days to50% flowering; DFPM, Days to first pod maturity; DM, Days to maturity; YLD, seed yield (t ha−1); HSW, hundred seedweight (g); PLHTM, plant height at maturity (cm); PLHTF, plant height at flowering (cm); PEDHT, peduncle height (cm);PDPL, number of pods per plant; PODWT, pod weight (t ha−1); PODL; pod length (cm); SDPD, number of seeds per pod.
Owusu et al., Cogent Food & Agriculture (2018), 4: 1519973https://doi.org/10.1080/23311932.2018.1519973
Page 10 of 17
nearly perfect phenotypic correlation was observed between CWV and PODL. On the other hand,genotypic correlation was positive and significant between DM and all the traits examined in thepresent study except for PLHTF, PDPL and DM which were positive but not significant. The highestform of genotypic correlation (rG = 0.85) was observed between YLD and PEDHT. A perfectgenotypic correlation was observed between CWV and PODL. The second highest genotypiccorrelation of 97% was between NBR and PLHTF and PDPL and DFPM. Strong positive correlationswere also observed between DM and DFF, HSW and PDPL. Between the traits, moderately positiverG was observed between PODWT and PLHTM, whereas moderate to strongly negative rG wereobserved between CWV and HSW, CWM and YLD and PODWT and PDPL. DFF had weak negative rPwith NBR and PODL and weak positive rP with HSW and PLHTF. DM also had weak negative rP withNBR and a weak positive rP with CWV, PODWT and HSW.
4. DiscussionThe results emanating from the present study showed extensive genetic variability for seed yieldand the other traits among the parents and crosses of cowpea genotypes studied. This variabilitycan be explored for the development of new high yielding varieties. The probability of selectingsuperior genotypes is immensely dependent on the existing genetic diversity in the genotypes,which is also a function of the influence of the additive variance (Ramalho et al., 1993). Significantgenetic variation among cowpea crosses and parents for seed yield and other agronomic traitshave also been reported in earlier studies by Dias et al. (2016), Ayo-Vaughan et al. (2013) andPandey and Singh (2010).
The presence of significant GCA and SCA mean squares for traits such as YLD, PDPL, SDPD, HSW,DFF, DM, NBR, CWV, CWM, PLHTF and PLHTM indicates that both additive and non-additive geneticeffects were important in determining these traits as averred by Griffing (1956) and there is theprobability of obtaining new varieties or hybrids (Silva et al., 2004). Similar results were reported in
Table 7. The difference between the highest and lowest yielding cowpea genotypes
Traits MeanSquare(df = 1)
Error CV (%) Means Percentageincrease
(%)High Low
YLD 128.00** 0.36 17.2 6.16 0.82 651.22
DF 22.22* 4.30 5.6 38.22 36.00 6.17
PLHTf 600.89** 16.48 18.1 28.22 16.67 69.29
PLHTm 813.39** 25.44 20.1 31.80 18.3 73.77
NBr 12.50** 0.7857 23.8 4.56 2.89 57.79
DFPM 37.56* 7.913 5.5 52.67 49.78 5.81
DM 133.39** 11.91 6.2 58.56 53.11 10.26
PDPL 2473.39** 16.34 19.9 32.00 8.56 32.56
PEDHT 1200.50** 17.14 17.6 31.67 15.33 106.59
SDPD 32.00* 32.00 30.4 8.00 5.33 50.09
CWv 27,927.00** 1151.00 31.3 147.8 69.0 114.20
CWm 31,584.00** 1352.00 29.2 167.8 84.0 99.76
PODL 46.72** 1.06 8.9 13.11 9.89 32.56
PODWT 103.20** 4.19 38.2 7.76 2.97 161.28
HWS 156.06** 9.20 19.4 18.56 12.67 46.49
* P ≤ 0.05; ** P ≤ 0.01;††NBR, number of branches; CWV, canopy width at Vegetation (cm); CWM, canopy width at maturity (cm); DF, Days to50% flowering; DFPM, Days to first pod maturity; DM, Days to maturity; YLD, seed yield (t ha−1); HSW, hundred seedweight (g); PLHTM, plant height at maturity (cm); PLHTF, plant height at flowering (cm); PEDHT, peduncle height (cm);PDPL, number of pods per plant; PODWT, pod weight (t ha−1); PODL; pod length (cm); SDPD, number of seeds per pod.
Owusu et al., Cogent Food & Agriculture (2018), 4: 1519973https://doi.org/10.1080/23311932.2018.1519973
Page 11 of 17
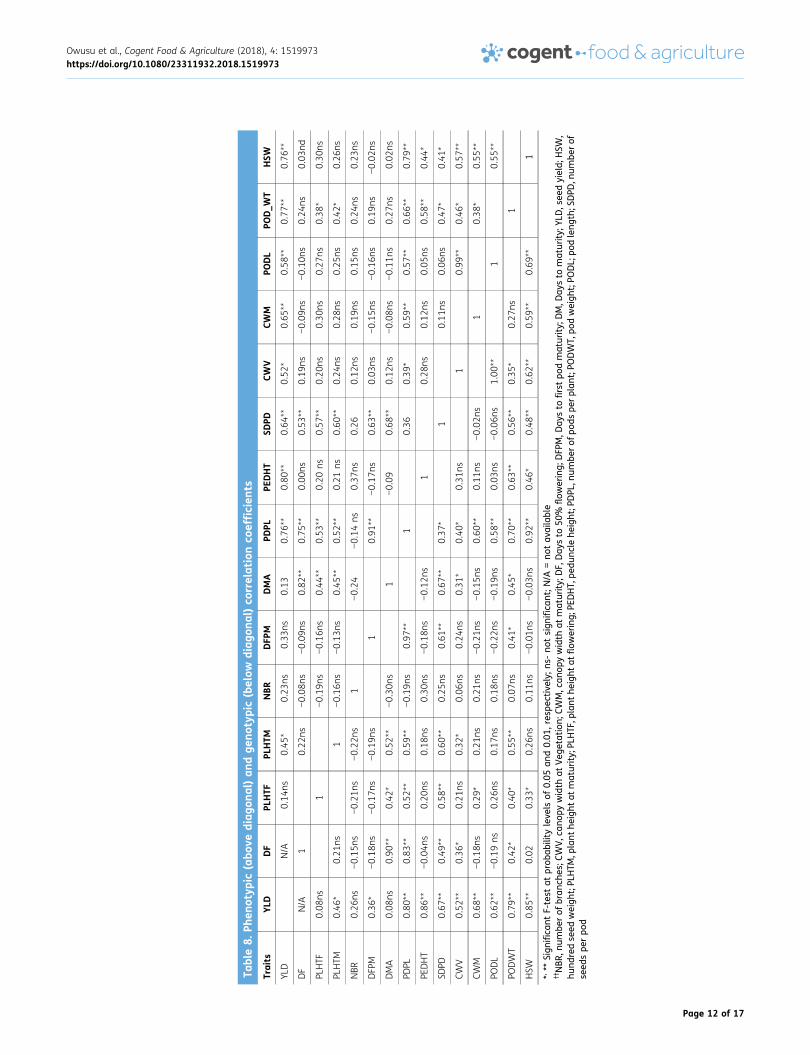
Table8.
Phen
otyp
ic(abo
vediag
onal)an
dge
notypic(below
diag
onal)co
rrelationco
efficien
ts
Traits
YLD
DF
PLHTF
PLHTM
NBR
DFP
MDMA
PDPL
PEDHT
SDPD
CWV
CWM
PODL
POD_W
THSW
YLD
N/A
0.14
ns0.45
*0.23
ns0.33
ns0.13
0.76
**0.80
**0.64
**0.52
*0.65
**0.58
**0.77
**0.76
**
DF
N/A
10.22
ns−0.08
ns−0.09
ns0.82
**0.75
**0.00
ns0.53
**0.19
ns−0.09
ns−0.10
ns0.24
ns0.03
nd
PLHTF
0.08
ns1
−0.19
ns−0.16
ns0.44
**0.53
**0.20
ns0.57
**0.20
ns0.30
ns0.27
ns0.38
*0.30
ns
PLHTM
0.46
*0.21
ns1
−0.16
ns−0.13
ns0.45
**0.52
**0.21
ns0.60
**0.24
ns0.28
ns0.25
ns0.42
*0.26
ns
NBR
0.26
ns−0.15
ns−0.21
ns−0.22
ns1
−0.24
−0.14
ns0.37
ns0.26
0.12
ns0.19
ns0.15
ns0.24
ns0.23
ns
DFP
M0.36
*−0.18
ns−0.17
ns−0.19
ns1
0.91
**−0.17
ns0.63
**0.03
ns−0.15
ns−0.16
ns0.19
ns−0.02
ns
DMA
0.08
ns0.90
**0.42
*0.52
**−0.30
ns1
−0.09
0.68
**0.12
ns−0.08
ns−0.11
ns0.27
ns0.02
ns
PDPL
0.80
**0.83
**0.52
**0.59
**−0.19
ns0.97
**1
0.36
0.39
*0.59
**0.57
**0.66
**0.79
**
PEDHT
0.86
**−0.04
ns0.20
ns0.18
ns0.30
ns−0.18
ns−0.12
ns1
0.28
ns0.12
ns0.05
ns0.58
**0.44
*
SDPD
0.67
**0.49
**0.58
**0.60
**0.25
ns0.61
**0.67
**0.37
*1
0.11
ns0.06
ns0.47
*0.41
*
CWV
0.52
**0.36
*0.21
ns0.32
*0.06
ns0.24
ns0.31
*0.40
*0.31
ns1
0.99
**0.46
*0.57
**
CWM
0.68
**−0.18
ns0.29
*0.21
ns0.21
ns−0.21
ns−0.15
ns0.60
**0.11
ns−0.02
ns1
0.38
*0.55
**
PODL
0.62
**−0.19
ns0.26
ns0.17
ns0.18
ns−0.22
ns−0.19
ns0.58
**0.03
ns−0.06
ns1.00
**1
0.55
**
PODWT
0.79
**0.42
*0.40
*0.55
**0.07
ns0.41
*0.45
*0.70
**0.63
**0.56
**0.35
*0.27
ns1
HSW
0.85
**0.02
0.33
*0.26
ns0.11
ns−0.01
ns−0.03
ns0.92
**0.46
*0.48
**0.62
**0.59
**0.69
**1
*,**
Sign
ifica
ntF-test
atprob
ability
leve
lsof
0.05
and0.01
,res
pectively;
ns-no
tsign
ifica
nt;N
/A=no
tav
ailable
††NBR
,num
berof
bran
ches
;CWV,c
anop
ywidth
atVeg
etation;
CWM,c
anop
ywidth
atmaturity;
DF,
Day
sto
50%
flowering;
DFP
M,D
aysto
first
podmaturity;
DM,D
aysto
maturity;
YLD,see
dyield;
HSW
,hu
ndredse
edweigh
t;PL
HTM
,plant
height
atmaturity;PL
HTF
,plant
height
atflo
wering;
PEDHT,
pedu
ncle
height;P
DPL
,num
berof
pods
perplan
t;PO
DWT,po
dweigh
t;PO
DL;
podleng
th;S
DPD
,num
berof
seed
spe
rpo
d
Owusu et al., Cogent Food & Agriculture (2018), 4: 1519973https://doi.org/10.1080/23311932.2018.1519973
Page 12 of 17
cowpea by Raut et al. (2017) for DFF, NBR, YLD and HSW; Ayo-Vaughan et al. (2013) for YLD, PDPLand HSW; and Pandey and Singh (2010) for PLHT, SDPD and YLD.
The predominance of SCA effects over GCA effects for YLD, NBR, CWV, CWM, DFF, PLHTM, PDPL,PODWT and SDPD suggests that non-additive gene action is more important in controlling theinheritance of the traits. These findings are in agreement with Raut et al. (2017) for YLD, NBR,PLHT, DFF and SDPD; and Singh et al. (2006) for YLD, SDPD, and PDL in cowpea. Contrary to resultsfrom the present study for the predominance of SCA over GCA, significant GCA effects over SCA wereobserved by Ayo-Vaughan et al. (2013) for PDPL, SDPD and YLD in cowpea. However, the differencesin the two results could be attributed to the differences in the genetic materials used and also theresearch conditions (environment) under which the studies were conducted. SCA represents thepredominance of non-additive gene action which occur between the hybridizing parents and it is amajor component that may be utilized in heterosis breeding. The significance of SCA effect empha-sises the existence of genetic diversity among parents tested and demonstrates the impact ofdominance and/or epistatic effect which signify the non-fixable components of the genetic variationrelated to heterosis (Pandey & Singh, 2010). Singh et al. (2006) postulated that non-additive geneaction can be exploited by multiple crosses followed by intermating among desirable segregants.Selection should therefore be deferred till later generations when these impacts are fixed in thehomozygous lines (Bicer & Sakar, 2008; Ertiro et al., 2013). The preponderant role of SCA effects thanGCA could be ascribed to repulsion phase linkage and linkage disequilibrium (Sokol & Baker, 1977).Furthermore, higher SCA than GCA can be elucidated by the usage of closely related parents (Azad etal., 2014; Neele et al., 1991), negative relations between genes (Sokol & Baker, 1977), precedingselection that narrowed the genetic base of the genotypes evaluated (Azad et al., 2014; Plaisted etal., 1962) and directional selection (Killick & Malcolmson, 1973). In the present study, some ofgenotypes used have been selected primarily for high yield which could have constricted the geneticbase. Also, most of the hybrids studied have common pedigrees, for instance, the common parent“PADI-TUYA”, which could have contributed to the narrow genetic base.
The preponderance of GCA effects over SCA effects for traits such as DFPM, DM, HSW, PLHTF, PEDHTand PODL indicates that additive genetic effects are more important than non-additive effects in theinheritance of these traits. These results are in agreement with earlier findings by Patij and Navale(2006) for PLHT and HSW; Raut et al. (2017) for DM and Pandey and Singh (2010) for PODL. Contrarily,higher SCA varianceswere found by Patij andNavale (2006) for NBR and PODL and by Raut et al. (2017)for PODL, HSW and PDPL. The prevalence of GCA variances over SCA variances suggests that earlygeneration testing of genotypes would be efficient and promising hybrids can be identified andselected based on their prediction from GCA effects (Amegbor et al., 2017; Fasahat, Rajabi, Rad, &Derere, 2016) since the additive effects of genes is fixable through direct selection (Ayo-Vaughan et al.,2013). High GCA values signify that the parental average is superior. This also designates a strongevidence of desirable gene flow from parents to progeny at high intensity and denotes informationregarding the concentration of predominantly additive genes (Franco et al., 2001). Accordingly, thesignificant positive and high GCA effects observed for YLD and other traits by PADI-TUYA and IT86D-610 imply that these parents possess favourable alleles for yield and other traits and would transmithigh yield to their offsprings. PADI-TUYA in particular seems to be themost desirable genotype for thegenetic improvement of most of the traits. It is therefore suggested that intermating among PADI-TUYA and IT86D-610 would produce superior progenies for seed yield. The non-significance of GCAeffects for PADI-TUYA for PDPL and PODWT shows that it had little contribution to additive gene actionof PDPL and PODWT exhibited by the crosses. Other parents found to be good general combiners forDFF andDFPM (SARC 57–2), CWM (SANZI) andDFF, DFPM, DM, HSWandPEDHT (SONGOTRA) could easilybe inherited by the offsprings.
The negative significant GCA estimates recorded by SANZI for nearly all the traits including YLD; andby IT86D-610 for CWM, CWV and DF; and by PADY-TUYA for NBR suggests that these genotypes havelow gene frequencies for the traits (Orawu et al., 2013) thereby making them undesirable for thegenetic improvement of these traits (Ayo-Vaughan et al., 2013; Daniel et al., 2006). The variable GCA
Owusu et al., Cogent Food & Agriculture (2018), 4: 1519973https://doi.org/10.1080/23311932.2018.1519973
Page 13 of 17
estimates observed in the parents for nearly all the traits (except PDWT, PDPL and PLHTF) points to theexistence of positive and negative (dominant and recessive) alleles among the parents leading todifferent levels of expression of the traits, a further confirmation of the genetic variation among theparents for the traits.
The high SCA effects and per se performance for seed yield displayed by IT86D-610 × PADI-TUYA,SONGOTRA × PADI-TUYA and IT86D-610 × SARC 57–2 crosses further confirms the preponderance ofnon-additive gene action governing the inheritance of this character. The high SCA effects ofSONGOTRA × PADI-TUYA and IT86D-610 × SARC 57–2 arising from parents with low × high and high× low GCA values, respectively, for yield and other traits might be due to complementation of high andlow combining loci (Raut et al., 2017). Parents of these crosses can be used for biparental mating orreciprocal recurrent selection for developing superior varieties with high yield (Azad et al., 2014).IT86D-610 × PADI-TUYA cross with high SCA effects for seed yield and other traits from parents withhigh × high GCA effects could be exploited by pedigree breeding method to get transgressive segre-gants (Azad et al., 2014). The existence of high SCA effects in high × high GCA group such as IT86D-610× PADI-TUYA might be as a result of the cumulative effect of high combining loci and no mutualannulment of gene effects between high general combining loci (Raut et al., 2017).
All the crosses possessing significant SCA effects for the traits studied involved parents with high× high, high × low or low × low combining ability. According to Patij and Navale (2006), such resultindicates the presence of allelic as well as non-allelic interaction in the expression of thesecharacters. Similar results of high SCA values for cowpea crosses have been reported in earlierstudies by Ayo-Vaughan et al. (2013) for PDPL and HSW; Dias et al. (2016) for YLD and SDPD; Pandyand Singh (2010) for PLHT and DFF and by Patil and Navale (2006) for NBR and DM.
The fact that the difference between the hybrids and the parents was significantly positive for alltraits, except DFF, DFPM, DM and SDPD shows that, the hybrids were superior to the parents in alltraits but were earlier in flowering and maturity and had fewer seeds per pod than the parents. Thesignificance of the mean square for parents and hybrids coupled with the vast difference inparental and hybrid means for YLD, NBR, PDPL, CWV and CWM but not for PLHTF, PLHTM, PODL,PODWT, PEDHT and HSW suggests the presence of heterosis and its absence respectively. The lowmean performance of the hybrids compared to the parents for DFF, DFMA, DM and SDPD suggestsnegative heterosis for these traits. It appears that PDPL, PODWT, CWV and PEDHT are goodselection criteria to identify high yielding cowpea genotypes based on the results of the compar-ison of the three highest and three lowest yielding genotypes. Crosses IT86D-610 × PADI-TUYA,SONGOTRA × PADI-TUYA and IT86D-610 × SARC 57–2 with yield advantages of 94.8, 90.8, and82.5%, respectively compared to the grand mean suggests these are promising combinations thatcould be advanced for further evaluations.
Generally, genotypic correlation coefficients were higher than its corresponding phenotypiccorrelation coefficients. This implied that the characters studied were mainly under genetic controlcorroborating the results of Adetiloye et al. (2017). The small difference between the phenotypicand genotypic correlation coefficients in some cases suggests that the environment had someinfluence on the correlated characters. The significant positive genotypic correlations between YLD,and PEDHT, CWV, CWM, PODL, SDPD, PDPL, PLHTM, HSW and PODWT suggest that these characterscontributed positively towards yield and should be considered when selecting for high grain yield incowpea. Similar results were reported by Adetiloye et al. (2017) for pods per plant, pod length andseeds per pod; Aliyu and Makinde (2016) for hundred seed weight; and Baghizadeh et al. (2010) forcanopy width. The significant genetic and phenotypic correlation observed for hundred seedweight and number of seeds per pod suggests that bigger seed size and many seeds per podcan be achieved contrary to the findings of Adetiloye et al. (2017), that increasing the number ofseeds resulted in smaller-sized seeds.
Owusu et al., Cogent Food & Agriculture (2018), 4: 1519973https://doi.org/10.1080/23311932.2018.1519973
Page 14 of 17
5. ConclusionThis study elucidated the inheritance of grain yield and its related traits in cowpea using a diallelmating design. Both additive and non-additive (dominance and or epistasis) genetic actions werefound to condition the inheritance of the characters studied. Non-additive genetic effects howeverproved to be more important than additive genetic effects for YLD, NBR, CWV, CWM, DFF, PLHTM,PDPL, PODWT and SDPD. PADI-TUYA and IT86D-610 were observed to be good general combinersfor grain yield and some other traits. Therefore, this could be exploited as donor parents since theypossess favourable alleles for grain yield and other traits directly associated with yield therebytransmitting high yield to their offsprings. IT86D-610 × PADI-TUYA, SONGOTRA × PADI-TUYA andIT86D-610 × SARC 57–2 were identified as superior and promising cross combinations having highper se performance, significant positive SCA effects coupled with high heterosis over better parentfor seed yield and other traits. It is therefore recommended that, these genotypes should beincluded in the cowpea improvement program in that, the likelihood of obtaining transgressivesegregants from segregating generations of these crosses is high and should therefore beexploited. Also, the superior crosses identified in this study should be further tested on a widerange of environments and consequently released to farmers to up-scale cowpea production inGhana. Selection criteria to improve the seed yield of cowpea should focus on plants with longpeduncles, bearing many big size seeds along with numerous pods per plant and high canopywidth as these traits have high genetic correlation with seed yield.
AcknowledgementsThe authors are grateful to the Management of CSIR-Savanna Agricultural Research Institute for their support.Special thanks and appreciations to Dr. S. K. Nutsugah(Director, CSIR-SARI) and the cowpea improvement pro-gramme for technical assistance.
Competing InterestThe authors declare no competing interests.
Author detailsEmmanuel Yaw Owusu1
E-mail: [email protected] Kodzo Amegbor1
E-mail: [email protected] Darkwa2,3
E-mail: [email protected] Oteng-Frimpong1
E-mail: [email protected] Kofi Sie1
E-mail: [email protected] CSIR-Savanna Agricultural Research Institute, Tamale,Ghana.
2 Department of Agronomy, Pan African University,Institute of Life and Earth Sciences (Including Health &Agriculture), University of Ibadan, Ibadan, Nigeria.
3 International Institute of Tropical Agriculture (IITA),Ibadan, Nigeria.
Citation informationCite this article as: Gene action and combining ability stu-dies for grain yield and its related traits in cowpea (Vignaunguiculata), Emmanuel YawOwusu, Isaac KodzoAmegbor,Kwabena Darkwa, Richard Oteng-Frimpong & EmmanuelKofi Sie, Cogent Food & Agriculture (2018), 4: 1519973.
ReferencesAdetiloye, I. S., Ariyo, O. J., & Awoyomi, O. L. (2017). Study
of genotypic and phenotypic correlation among 20accessions of Nigerian cowpea. IOSR Journal ofAgriculture and Veterinary Science (IOSR-JAVS), 10(2),36–39. doi:10.9790/2380-1002013639
Aliyu, O. M., & Makinde, B. O. (2016). Phenotypic analysisof seed yield and yield components in cowpea (Vigna
unguiculata LWalp). Plant Breeder Biotechnic, 4(2),252–261. doi:10.9787/PBB.2016.4.2.252
Amegbor, I. K., Badu-Apraku, B., & Annor, B. (2017).Combining ability and heterotic patterns of extra-earlymaturing white maize inbreds with genes from Zeadiploperennis under multiple environments. Euphytica,213(1), 1–16. doi:10.1007/s10681-016-1823-y
Ayo-Vaughan, M. A., Ariyo, O. J., & Olusanya, C. (2013).Combining ability and genetic components for podand seed traits in cowpea lines. Italian Journal ofAgronomy, 8(10), 73–78. doi:10.4081/ija.2013.e10
Azad, A. K., Hamid, A., Rafii, M. Y., & Malek, M. A. (2014).Combining ability of pod yield and related traits ofgroundnut (Arachis hypogaea L,) under salinity stress.The Scientific World Journal, 7. Article ID 589586.doi:10.1155/2014/589586
Baghizadeh, A., Taleei, E., & Guilan, O. (2010). Evaluationof genetic variability for yield and some of quantita-tive traits in Iran cowpea collection biotechnologydept, international center for science, high technol-ogy & environmental master of plant pathology,faculty of agriculture, university. Agriculture andBiology Journal of North America, 1(4), 625–629.
Baker, R. J. (1978). Issues in diallel analysis. Crop Science,18, 533–536. doi:10.2135/cropsci1978.0011183X001800040001x
Bicer, B. T., & Sakar, D. (2008). Heritability and geneeffects for yield and yield components in chickpea.Hereditas, 145(5), 220–224. doi:10.1111/j.1601-5223.2008.02061.x
Daniel, I. O., Oloyede, H. T., Adeniji, O. T., Ojo, D. K., &Adegbite, A. E. (2006). Genetic analysis of earliness andyield in elite parental lines and hybrids of tropicalmaize(Zea mays L.). Journal Genetics Breeder, 60, 289–296.
Dar, S. H., Rather, A. G., Ahanger, M. A., Sofi, N. R., & Talib, S.(2014). Gene action and combining ability studies foryield and component traits in rice (Oryza sativaL.). AReview Journal of Plant and Pest Science, 1(3), 110–127.
Dias, F. T. C., Bertini, C. H. C. M., & Filho, F. R. F. (2016).Genetic effects and potential parents in cowpea. CropBreeding and Applied Biotechnology, 16, 315–320.doi:10.1590/1984-70332016v16n4a47
Ertiro, B. T., Zeleke, H., Friesen, D., Blummel, M., &Twumasi, A. S. (2013). Relationship between theperformance of parental inbred lines and hybrids for
Owusu et al., Cogent Food & Agriculture (2018), 4: 1519973https://doi.org/10.1080/23311932.2018.1519973
Page 15 of 17
food-feed traits in maize (Zea mays L.) in Ethiopia.Field Crops Research, 153, 86–93. doi:10.1016/j.fcr.2013.02.008
Falconer, D. S. (1989). Introduction to quantitative genet-ics (3rd ed.). New York: Long-man, Scientific andTechnical Group Ltd, Wiley.
Fasahat, P., Rajabi, A., Rad, J. M., & Derere, J. (2016).Principles and utilization of combining ability in plantbreeding. Biometrics & Biostatistics InternationalJournal, 4(1), 1–24. doi:10.15406/bbij.2016.04.00085
Franco, M. C., Cassini, S. T., Oliveira, V. R., Vieira, C., & Tsai,S. M. (2001). Combining ability for nodulation incommon bean (Phaseolus vulgaris L.) genotypes fromAndean and Middle American gene pools. Euphytica,118(3), 265–270. doi:10.1023/A:1017560118666
Griffing, B. (1956). A generalized treatment of the use ofdiallel crosses in quantitative inheritance. Heredity,10, 31–50. doi:10.1038/hdy.1956.2
Hassan, M., Atta, M., Shah, B., Haq, T. M., Syed, H., & Sarwar,A. S. (2005). Correlation and path coefficient studies ininduced mutants of chickpea (Cicer Arietinum L.).Pakistan Journal of Botany, 37(2), 293–298.
International Crop Research Institute (ICRISAT) for Semi-Arid Tropics (ICRISAT) (2012) Cowpea farming inGhana. Bulletin of tropical legumes; www.icrisat.org/tropicallegumesII/pdfs/BTL16-20122712.
Kempthorne, O. (1956). The theory of diallel cross.Biometrics, 17, 229–250. doi:10.2307/2527989
Killick, R. J., & Malcolmson, J. F. (1973). Inheritance inpotatoes of field resistance to late blight[Phytophthora infestans (Mont.) de Bary],”.Physiological Plant Pathology, 3(1), 121–131.doi:10.1016/0048-4059(73)90028-3
Ndamani, F., & Watanabe, T. (2013) Rainfall variabilityand crop production in northern Ghana: The case ofLawra district. The 9th International Symposium onSocial Management Systems SSMS 2013, At Sydney,Australia, 9.
Neele, A. E. F., Nab, H. J., & Louwes, K. M. (1991).Identification of superior parents in a potato breed-ing programme. Theoretical and Applied Genetics, 82(3), 264–272. doi:10.1007/BF02190611
Orawu, M., Melis, R., Laing, M., & Derera, J. (2013). Geneticinheritance of resistance to cowpea aphid-bornemosaic virus in cowpea. Euphytica, 189, 191–201.doi:10.1007/s10681-012-0756-3
Pandey, B., & Singh, Y. V. (2010). Combining ability foryield over environment in cowpea (Vigna unguiculata(L.) Walp. Legume Research, 33(3), 190–195.
Patij, H. E., & Navale, P. A. (2006). Combining ability incowpea (Vigna unguiculata (L.) Walp.). LegumeResearch, 29(4), 270–273.
Plaisted, R. L., Sanford, L., Federer, W. T., Kehr, A. E., &Peterson, L. C. (1962). Specific and general combiningability for yield in potatoes. American Potato Journal,39,(5), 185–197. doi:10.1007/BF02871402
Quarrie, S., Pekic Quarrie, S., Radosevic, R., Rancic, D.,Kaminska, D., Barnes, J. D., . . . Dodig, D. (2006).Dissecting a wheat QTL for yield present in a range of
environments: From the QTL to candidate genes.Journal of Experimental Botany, 57, 2627–2637.doi:10.1093/jxb/erl026
Ramalho, M. A. P., Santos, J., & Zimmermann, M. J. O.(1993). Genética quantitativa em plantas autógamas:Aplicação ao melhoramento do feijoeiro (pp. 271).Goiânia: Editora UFG.
Raut, D. M., Tamnar, A. B., Burungale, S. V., & Badhe, P. L.(2017). Half diallel analysis in cowpea [Vigna ungui-culata (L.) Walp.]. International Journal of CurrentMicrobiology and Applied Sciences, 6(7), 1807–1819.doi:10.20546/ijcmas.2017.607.218
Rodriguez, F., Alvarado, G., Pacheco, A., Burueno, J., &Crossa, J. (2015) AGD-R (Analysis of Genetic Design inR.) version 3.0
Romanus, K. G., Hussein, S., & Mashela, W. P. (2008).Combining ability analysis and association of yieldand yield components among selected cowpea lines.Euphytica, 162(162), 205–210. doi:10.1007/s10681-007-9512-5
SAS Institute Inc. (2011). Base SAS 9.3 procedures guide.Cary: SAS Institute Inc.
Silva, M. P., Amaral, J. A. T., Rodrigues, R., Daher, R. F.,Leal, N. R., & Schuelter, A. R. (2004). Análise dialélicada capacidade combinatória em feijão- de-vagem.Horticultura Brasileira, 22, 277–280. doi:10.1590/S0102-05362004000200022
Singh, I., Badaya, S. N., & Tikka, S. B. S. (2006). Combiningability for yield over environments in cowpea. IndianJournal of Crop Science, 1(1–2), 205–206.
Sivakumar, V., Celine, V. A., Shrishail, D., Sanjeev, P., &Santosh, K. M. (2013). Genetic variability and herit-ability studies in bush cowpea (Vignaunguiculata (L.)Walp.). Legume Genomics and Genetics, 4, 27–31.
Sokol, M. J., & Baker, R. J. (1977). Evaluation of theassumptions required for the genetic interpretationof diallel experiments in self-pollinating crops.Canadian Journal of Plant Science, 57, 1185–1191.doi:10.4141/cjps77-174
Sprague, G. F., & Tatum, L. A. (1942). General vs. specificcombining ability in single crosses of corn. Journal ofAmerican Society of Agronomy, 34, 923–932.doi:10.2134/agronj1942.00021962003400100008x
Timko, M. P., & Singh, B. B. (2008). Cowpea, a multifunc-tional legume”. In P. H. Moore & R. Min (Eds.),Genomics of tropical crop plants (pp. 227–257). NewYork: Springer.
Wattoo, F. M., Saleem, M., Ahsan, M., Sajjad, M., & Ali, W.(2009). Genetic analysis for yield potential and qualitytraits in maize (Zeamays L.). American-Eura-sian Journalof Agriculture and Environmental Science, 6(6), 723–729.
Wiggins, S. (2009) Can the smallholder model deliverpoverty reduction and food security for a rapidlygrowing population in Africa? Paper for the ExpertMeeting on How to feed the World in 2050, Rome.
Wiggins, S., & Sharda, K. (2013). Looking back, peeringforward: What has been learned from the food-pricespike, 2007–2008.
Owusu et al., Cogent Food & Agriculture (2018), 4: 1519973https://doi.org/10.1080/23311932.2018.1519973
Page 16 of 17
©2018 The Author(s). This open access article is distributed under a Creative Commons Attribution (CC-BY) 4.0 license.
You are free to:Share — copy and redistribute the material in any medium or format.Adapt — remix, transform, and build upon the material for any purpose, even commercially.The licensor cannot revoke these freedoms as long as you follow the license terms.
Under the following terms:Attribution — You must give appropriate credit, provide a link to the license, and indicate if changes were made.You may do so in any reasonable manner, but not in any way that suggests the licensor endorses you or your use.No additional restrictions
Youmay not apply legal terms or technological measures that legally restrict others from doing anything the license permits.
Cogent Food & Agriculture (ISSN: 2331-1932) is published by Cogent OA, part of Taylor & Francis Group.
Publishing with Cogent OA ensures:
• Immediate, universal access to your article on publication
• High visibility and discoverability via the Cogent OA website as well as Taylor & Francis Online
• Download and citation statistics for your article
• Rapid online publication
• Input from, and dialog with, expert editors and editorial boards
• Retention of full copyright of your article
• Guaranteed legacy preservation of your article
• Discounts and waivers for authors in developing regions
Submit your manuscript to a Cogent OA journal at www.CogentOA.com
Owusu et al., Cogent Food & Agriculture (2018), 4: 1519973https://doi.org/10.1080/23311932.2018.1519973
Page 17 of 17