gender differences in bank loan access: an empirical analysis · gender differences in bank loan...
TRANSCRIPT
Ital Econ J (2015) 1:193–217DOI 10.1007/s40797-014-0004-1
RESEARCH PAPER
Gender Differences in Bank Loan Access: An EmpiricalAnalysis
Giorgio Calcagnini · Germana Giombini ·Elisa Lenti
Received: 23 April 2013 / Accepted: 27 February 2014 / Published online: 12 December 2014© Società Italiana degli Economisti (Italian Economic Association) 2014
Abstract Traditionally, female entrepreneurs report either difficulties or higher costsin accessing bank credit. These problems can be either the result of supply-side dis-crimination, or differences in profitability between female- and male-owned firms.This paper aims at analysing whether these differences are statistically significantin the case of Italian firms by means of a large dataset on lines of credit providedby three Italian banks over the period 2005–2008. Descriptive statistics show thatfemale-owned firms are significantly smaller and younger than male-owned ones, andhave—on average—a larger, but shorter, number of lending relationships. Addition-ally, the mean size of loans requested by female-owned firms is smaller, and morefrequently assisted with collateral, personal guarantees, or both. After controlling forloan, firm and bank characteristics, estimates show that gender does not affect thelikelihood of obtaining a bank loan. However, in the case of female-owned firms,guarantees are less powerful instruments in gaining access to credit and the probabil-ity of having to pledge collateral is higher than for male-owned firms. Our findingssuggest that differences in credit access are the result of discrimination and structuraldifferences between male- and female-owned firms. Policies designed to improve the
We thank Rebel Cole, Jose Liberti, Geoffrey Hirth, Rosa Ferrer, and participants to the Stockholm EALE2012 and to the Chicago MFA 2013, two anonymous referees, the editor Alberto Zazzaro, for usefulcomments and suggestions on the earlier version of this article. All remaining errors are ours.
G. Calcagnini · G. Giombini (B) · E. LentiDepartment of Economics, Society, Politics, Università di Urbino, Via Saffi 42,61029 Urbino, PU, Italye-mail: [email protected]
G. Calcagninie-mail: [email protected]
G. Calcagnini · G. GiombiniMo. Fi. R., Ancona, Italy
123
194 G. Calcagnini et al.
access of female-owned firms to bank loans should favor an increase in firm size thatis often associated with the adoption of more sophisticated business legal structures.
Keywords Access to credit · Gender discrimination · Bank loan
JEL Classification E43 · L26 · G21 · D82
1 Introduction
In the last 25 years the number of female entrepreneurs has been growing signifi-cantly in Italy, and thus the peculiarities and difficulties related to business conductedby female entrepreneurs are of central interest to policy markers (Istat 2013). Oneof the most serious problems usually reported concerns the access to credit (Biancoet al. 2013), which is one of the key elements in firm life. In the event of financialconstraints—credit rationing or, worse, a credit crunch—firms’ ability to undertakenew investment projects is seriously compromised, and their profit andgrowth opportu-nities are undermined. Therefore, a strand of the economic literature has been analysingwhether gender differences in credit access and use of funds actually exist.
A large number of papers show the existence of gender differences in the com-position of financial sources used by male- and female-owned firms. The latter arefinancially more fragile and face higher difficulties in accessing capital, whether inthe form of equity or debt, than male-owned firms. Furthermore, female-owned firmsmakemore intensive use of the entrepreneur’s personal funds and a lower utilisation ofbank loans (Carter and Shaw 2006; Coleman and Robb 2009).Moreover, other authorshighlight that financial obstacles significantly explain why female-owned firms aresmaller sized and have lower economic performance (lower profits and lower growthrates) than do male ones (Rosa et al. 1996; Fairlie and Robb 2009).
However, the same empirical findings do not provide us with a clear-cut explanationfor gender differences, and three main and non-mutually-exclusive hypotheses can beaddressed.
Briefly stated, gender differences in the use of funds may depend on: (i) structuraldifferences between male- and female-owned firms, such as their size, date of founda-tion, credit history, owner age, and the type of industry (Coin 2011); (ii) demand sidedifferences between female-owned and male-owned firms, such as owners’ aversionto risk and willingness to loosen control (Bönte and Piegeler 2012); (iii) supply-sidediscrimination1.
According to Becker (1971), financial discrimination exists when banks applyhigher interest rates on loans to female entrepreneurs, and these higher interest ratesdo not depend on lower credit worthiness, which is an assessment of the likelihoodthat a borrower will not default on its debt obligations. Credit worthiness is based ona borrower’s credit history and structural characteristics (firm size, sector of activity,and the quality of its assets and liabilities). A lower acceptance rate or higher refusalrate in granting loans may also be a sign of gender discrimination (Storey 2004). What
1 Cesaroni (2010) provides an extensive survey of the literature.
123
Gender Differences in Bank Loan Access 195
is more, banks could also discriminate by imposing heavier pre-contractual conditionson female-owned firms than on male-owned ones.
Empirically, Fay and Williams (1993) is one of the first studies that found someevidence of gender-related credit discrimination among start-ups. Muravyev et al.(2009) confirm this result by means of a cross-country analysis (Business Environ-ment and Enterprise Performance Survey—BEEPS) which show that female-ownedfirms have a lower probability of obtaining a bank loan, and are charged higher inter-est rates than male-owned firms. Recently, using US data from the Survey of SmallBusiness Finance—SSBF, Cole andMehran (2011) show that female-owned firms aresignificantly more likely to be credit constrained because they are more likely to bediscouraged from applying for credit and more likely to be denied credit when theydo apply. However, these differences are rendered insignificant in a multivariate set-ting, where they control for other firm and owner characteristics. Their results indicatethat gender-related disparity in credit market outcomes is not likely to be caused bytaste-based discrimination. Using the same dataset, Asiedu et al. (2012) reach similarconclusions, as they find that White female firms did not face discrimination in termsof access to loans, and paid a lower interest rate than White male firms. In the samedirection, Aterido et al. (2011) do not find evidence of a gender gap in the use offinancial services by businesses and individuals in Sub-Saharan Africa.
Diversely, Ongena and Popov (2013) investigate a detailed dataset on 6,000 smallbusiness firms from 17 countries and find that in countries with higher gender bias,female-owned firms are more frequently discouraged from applying for bank creditand reliant on informal finance. Furthermore, their findings are not driven by creditrisk differences between female- and male-owned firms in high-gender bias countriesor by any idiosyncrasies in the set of countries in their sample.
As for Italy, Calcagnini and Lenti (2008) show that for a sample of Italian small-sized firms gender discrimination exists given that, ceteris paribus, female entrepre-neurs are asked to pledge more guarantees that male entrepreneurs. Alesina et al.(2013) find that Italian female-owned firms are charged higher interest rates on theircredit lines, while Bellucci et al. (2010) show that Italian female entrepreneurs facetighter credit availability, even though they do not pay higher interest rates. Recently,Cesaroni et al. (2013), using data from the Credit Register at the Bank of Italy forthe period 2007–2009, found that female-owned firms faced more pronounced creditcontraction with respect to other firms. Finally, Stefani and Vacca (2013) argue thatfemale-owned firms apparently do experience tougher access to finance, but this evi-dence is almost completely explained by the fact that male- and female-owned firmsare structurally different.
This paper contributes to the ongoing empirical debate by analysing gender dif-ferences in the bank loan access of Italian firms by means of a large dataset on loanapplications provided by three Italian banks for the period 2005–2008. It improves onprevious gender discrimination studies by following a broader approach that involvesthe joint analysis of gender differences in credit access and guarantee requirements.Specifically, the paper tests whether female- and male-owned firms have the sameprobability of obtaining a loan, after controlling for their respective credit worthinessby means of a set of firm, loan, and bank characteristics. Furthermore, it also testswhether female-owned businesses are subject to more stringent pre-contractual con-
123
196 G. Calcagnini et al.
ditions in the form of heavier guarantee requirements than male-owned firms. To thebest of our knowledge, this paper improves on existing literature by analyzing theimpact of gender not only on collateral, but also on personal guarantees. Furthermore,banks in the sample identify female own firms both in the case of sole proprietorshipsand for corporations. In the latter case, banks adopted a narrow definition of femaleown firm according to the relative presence of women as partners or administrators.
Descriptive statistics show that female-owned firms are significantly smaller andyounger than male-owned ones, and have—on average—a larger, but shorter, numberof lending relationships. Additionally, the mean size of loans demanded by female-owned firms is smaller, and more frequently assisted with collateral, personal guaran-tees, or both. After controlling for loan, firm and bank characteristics, estimates showthat gender does not affect the likelihood of an applicant’s obtaining a bank loan. How-ever, in the case of female-owned firms, guarantees are less powerful instruments ingaining access to credit, and the probability of having to pledge collateral is higher thanfor male-owned firms. Our findings suggest that differences in credit access are theresult of discrimination and structural differences between male- and female-ownedfirms. Policies designed to improve the access of female-owned firms to bank loansshould favour an increase in firm size that is often associated with the adoption ofmore sophisticated business legal structures.
The paper is organized as follows. Section 2 describes the dataset used for modelestimation. Section 3 presents the empirical models and the estimation strategy, andSect. 4 discusses the main findings. Finally, Sect. 5 concludes.
2 Data Description
Data are provided by three Italian banks (Banca di Credito Cooperativo di Fano, SanPaolo—Banca Popolare dell’Adriatico (BPDA), and the Banca di Credito Coopera-tivo di Cesena), and refer to new loan applications made by firms during the years2005–20082.
Banks are located in the Italian provinces of Pesaro—Urbino, and Forlì—Cesena,as bank headquarters and most of their branches are active in those geographical areas.More than 50 % of the available information comes from one banking source, i.e. theBPDA3.
The dataset contains 12,663 observations and each observation represents a loanapplication of one firm to one of the banks mentioned above. Even though bankbranches are only located in two Italian provinces, the data are highly representa-tive of the Italian economy in terms of gender distribution, productive structure, andindustry composition.
Loan application information concerns whether the application was successful orrejected; the amount requested and the amount deliberated and, eventually, used; thetype of loan [loans backed by accounts receivable, term-loans, revocable-loans, (Bank
2 The number of credit lines granted in 2008 is significantly lower than in the previous years of our sample.3 Provincial market shares, calculated with respect to the number of bank branches, held by the threebanks, are 17 % for the Pesaro-Urbino province and 5 % for the Forlì-Cesena province.
123
Gender Differences in Bank Loan Access 197
of Italy 2010)]; the type of guarantee posted (collateral and/or personal guarantees), ifany. Unfortunately, for reasons of privacy, banks did not provide data on interest rates.
Furthermore, information gathered on firm characteristics consisted in the typeof company (sole proprietorship, partnerships, limited liability, public institutions,professional orders); the industry of activity; the provinces where firms are located;the distance (in kilometres) between each firm/loan and the headquarter of the bankthat provides credit; the firm/entrepreneur age; firm total sales; the number of thelending relationships held by each firm and the length of those relationships.
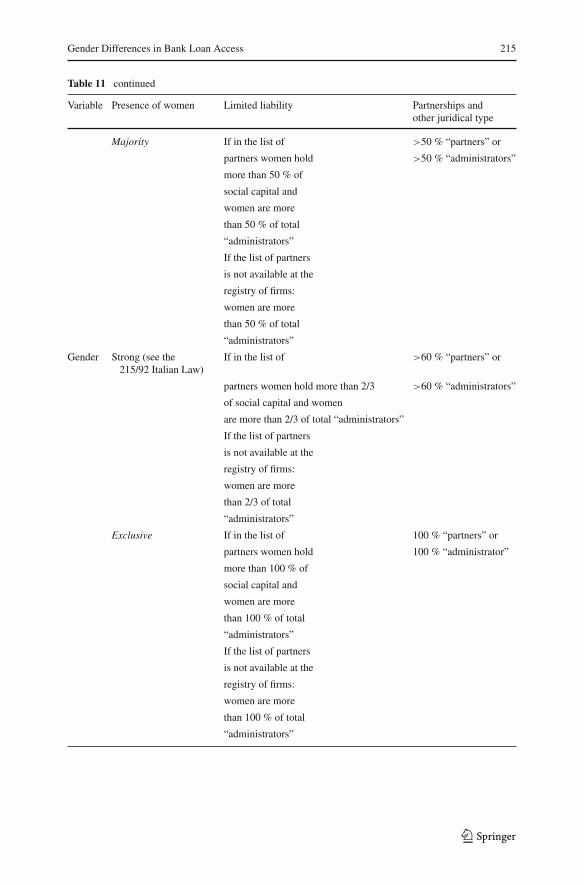
Finally, the dataset contains information on “firm gender”. Banks identify firmsas “female-owned” or “male-owned” as follows. In the case of sole proprietorshipsfemale-owned businesses are obviously identified by the owner’s gender. In all othercases, banks provided the identification of female-owned firms, according to the pres-ence of women in the list of partners and administrators (see Table 11 in the DataAppendix).
2.1 Firm Characteristics
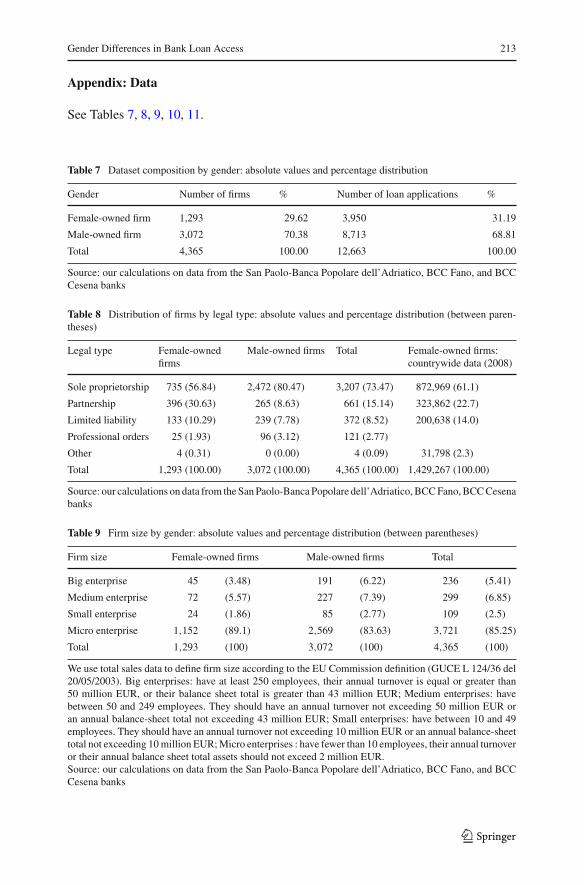
The dataset includes 4,365 firms, of which 1,293 (around 30 %) are female-ownedfirms. The total number of loan applications is 12,663, of which 3,950 (31 %) weresubmitted by female-owned businesses (see Table 7).
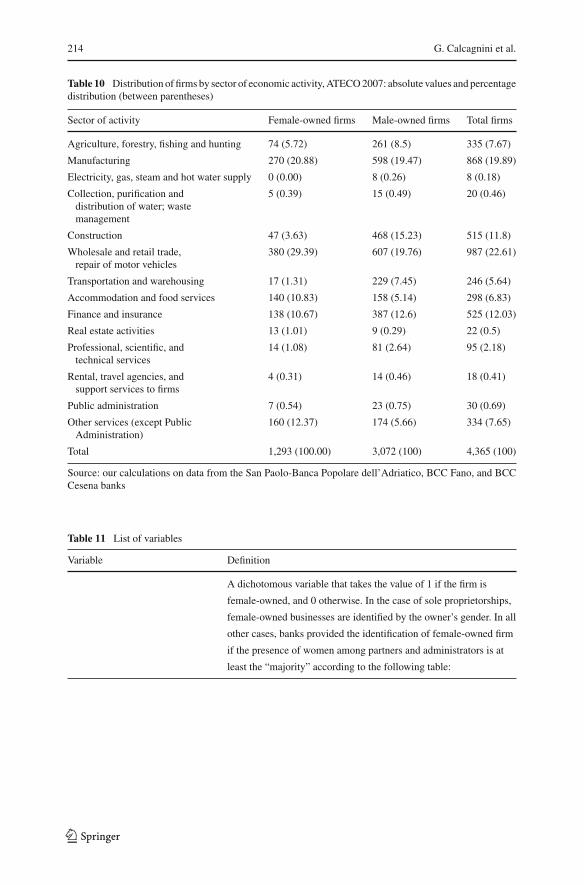
The distribution of firms by gender in our dataset is consistentwith that for thewholecountry: in Italy, in 2008, there were 1,429,267 female-owned firms, that is, 23 % ofthe total number of firms. Similarly, the distribution of firms by legal type, size andindustry in our sample and at the national level are broadly consistentwith countrywidedata (see Tables 8, 9, 10, Retecamere (2011) and Istat (2007)). Indeed, most of thefirms in the dataset were set up as sole proprietorships (around 73 %), followed bypartnerships (15 %) and limited liability companies (9 %). Professional orders andother business legal structures account for the remaining 3 % (see Table 8). As forfemale-owned firms, 57 % of them are organized as sole proprietorships, followed bypartnerships and limited liability companies (31 and 10 %, respectively) (see Table 8).Moreover, the size distribution of firms by sales shows that about 90 % of samplefirms are micro-sized, i.e. their sales are below e 2,000,000, and differences in firmsize by gender are relatively small (Table 9). Finally, the distribution of firms byindustry shows larger shares in the Wholesale and Retail Trade industry (relativelylarger for female-owned firms), Manufacturing and Construction (relatively larger formale-owned firms) (Table 10).4
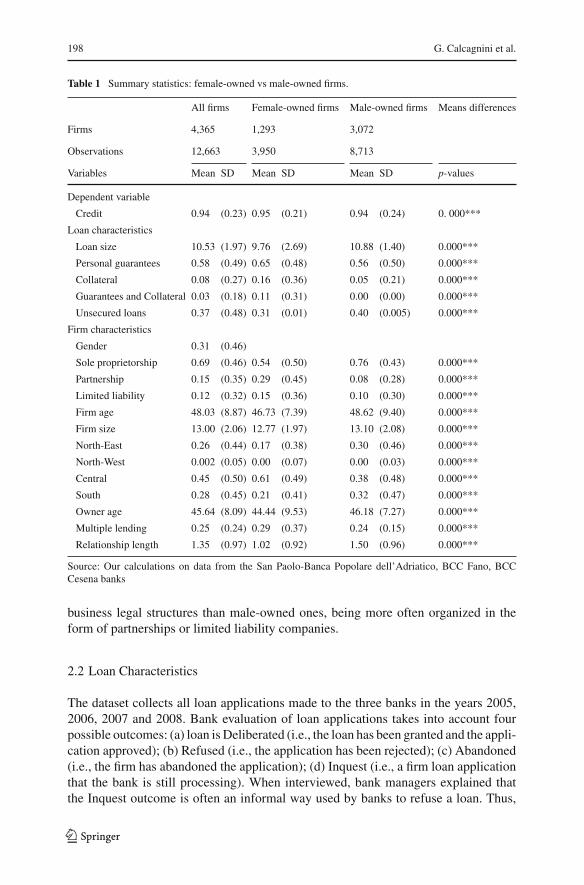
Table 1 provides summary statistics and t-tests for the variables used in the empiricalanalysis and shows that there are statistically significant structural differences betweenmale- and female-owned firms. The latter are considerably smaller and younger thanmale-owned ones, and have—on average—a larger, but shorter term, number of lend-ing relationships. However, female-owned firms appear to have a more sophisticated
4 This distribution is consistent with Italian data, according to which female firms are mainly concentratedin Commerce (32 %), and Agriculture (23 %), followed by Real Estate (10 %), Manufacturing (10 %) andServices (9%). Furthermore, female-owned firms operating in the Commerce industry are usually the oldestones (Retecamere (2011)).
123
198 G. Calcagnini et al.
Table 1 Summary statistics: female-owned vs male-owned firms.
All firms Female-owned firms Male-owned firms Means differences
Firms 4,365 1,293 3,072
Observations 12,663 3,950 8,713
Variables Mean SD Mean SD Mean SD p-values
Dependent variable
Credit 0.94 (0.23) 0.95 (0.21) 0.94 (0.24) 0. 000***
Loan characteristics
Loan size 10.53 (1.97) 9.76 (2.69) 10.88 (1.40) 0.000***
Personal guarantees 0.58 (0.49) 0.65 (0.48) 0.56 (0.50) 0.000***
Collateral 0.08 (0.27) 0.16 (0.36) 0.05 (0.21) 0.000***
Guarantees and Collateral 0.03 (0.18) 0.11 (0.31) 0.00 (0.00) 0.000***
Unsecured loans 0.37 (0.48) 0.31 (0.01) 0.40 (0.005) 0.000***
Firm characteristics
Gender 0.31 (0.46)
Sole proprietorship 0.69 (0.46) 0.54 (0.50) 0.76 (0.43) 0.000***
Partnership 0.15 (0.35) 0.29 (0.45) 0.08 (0.28) 0.000***
Limited liability 0.12 (0.32) 0.15 (0.36) 0.10 (0.30) 0.000***
Firm age 48.03 (8.87) 46.73 (7.39) 48.62 (9.40) 0.000***
Firm size 13.00 (2.06) 12.77 (1.97) 13.10 (2.08) 0.000***
North-East 0.26 (0.44) 0.17 (0.38) 0.30 (0.46) 0.000***
North-West 0.002 (0.05) 0.00 (0.07) 0.00 (0.03) 0.000***
Central 0.45 (0.50) 0.61 (0.49) 0.38 (0.48) 0.000***
South 0.28 (0.45) 0.21 (0.41) 0.32 (0.47) 0.000***
Owner age 45.64 (8.09) 44.44 (9.53) 46.18 (7.27) 0.000***
Multiple lending 0.25 (0.24) 0.29 (0.37) 0.24 (0.15) 0.000***
Relationship length 1.35 (0.97) 1.02 (0.92) 1.50 (0.96) 0.000***
Source: Our calculations on data from the San Paolo-Banca Popolare dell’Adriatico, BCC Fano, BCCCesena banks
business legal structures than male-owned ones, being more often organized in theform of partnerships or limited liability companies.
2.2 Loan Characteristics
The dataset collects all loan applications made to the three banks in the years 2005,2006, 2007 and 2008. Bank evaluation of loan applications takes into account fourpossible outcomes: (a) loan is Deliberated (i.e., the loan has been granted and the appli-cation approved); (b) Refused (i.e., the application has been rejected); (c) Abandoned(i.e., the firm has abandoned the application); (d) Inquest (i.e., a firm loan applicationthat the bank is still processing). When interviewed, bank managers explained thatthe Inquest outcome is often an informal way used by banks to refuse a loan. Thus,
123
Gender Differences in Bank Loan Access 199
Table 2 Requested and granted amount of loan broken down by gender. Granted loans
Percentile 10 % 25 % 50 % 75 % 90 %
Requested
Female-owned firms 2,500 10,000 28,544 73,248 183,050
Male-owned firms 10,000 20,386 50,900 127,026 292,600
Granted (as percentage of requested)
Female-owned firms 100 % 80 % 71 % 68 % 68 %
Male-owned firms 50 % 50 % 50 % 65 % 96 %
Source: our calculations on data from the San Paolo-Banca Popolare dell’Adriatico, BCCFano,BCCCesenabanks
in our analysis, granted loans are the deliberated loan applications, while non-grantedare the sum of refused, inquest, or abandoned loan applications.
Table 1 shows that the percentage distribution of female andmale positive outcomesis statistically significant, notwithstanding the fact that the two percentages are similar:roughly 95 and 94 % for female and male loan applications, respectively5.
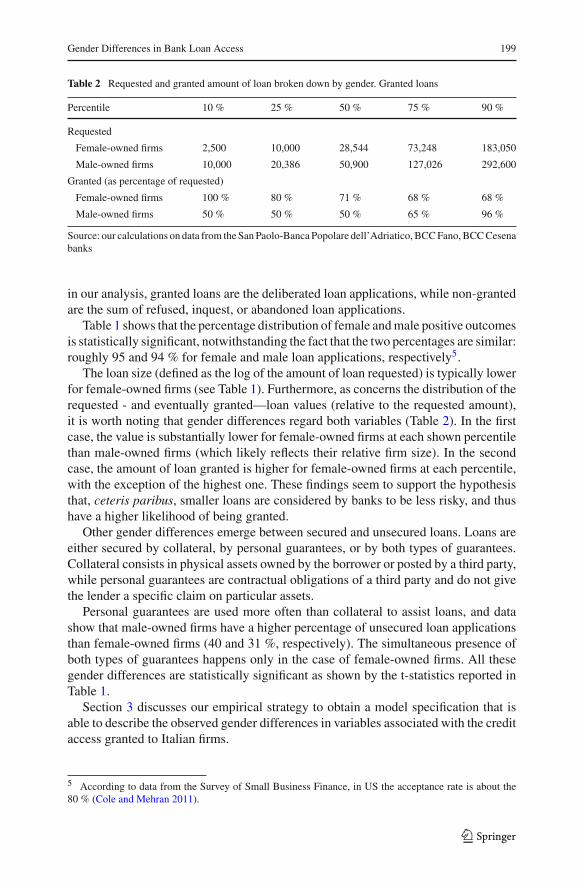
The loan size (defined as the log of the amount of loan requested) is typically lowerfor female-owned firms (see Table 1). Furthermore, as concerns the distribution of therequested - and eventually granted—loan values (relative to the requested amount),it is worth noting that gender differences regard both variables (Table 2). In the firstcase, the value is substantially lower for female-owned firms at each shown percentilethan male-owned firms (which likely reflects their relative firm size). In the secondcase, the amount of loan granted is higher for female-owned firms at each percentile,with the exception of the highest one. These findings seem to support the hypothesisthat, ceteris paribus, smaller loans are considered by banks to be less risky, and thushave a higher likelihood of being granted.
Other gender differences emerge between secured and unsecured loans. Loans areeither secured by collateral, by personal guarantees, or by both types of guarantees.Collateral consists in physical assets owned by the borrower or posted by a third party,while personal guarantees are contractual obligations of a third party and do not givethe lender a specific claim on particular assets.
Personal guarantees are used more often than collateral to assist loans, and datashow that male-owned firms have a higher percentage of unsecured loan applicationsthan female-owned firms (40 and 31 %, respectively). The simultaneous presence ofboth types of guarantees happens only in the case of female-owned firms. All thesegender differences are statistically significant as shown by the t-statistics reported inTable 1.
Section 3 discusses our empirical strategy to obtain a model specification that isable to describe the observed gender differences in variables associated with the creditaccess granted to Italian firms.
5 According to data from the Survey of Small Business Finance, in US the acceptance rate is about the80 % (Cole and Mehran 2011).
123
200 G. Calcagnini et al.
3 Model Specifications and Empirical Strategy
This section aims at testing for the presence of gender differences in the access to bankcredit by means of two empirical models.
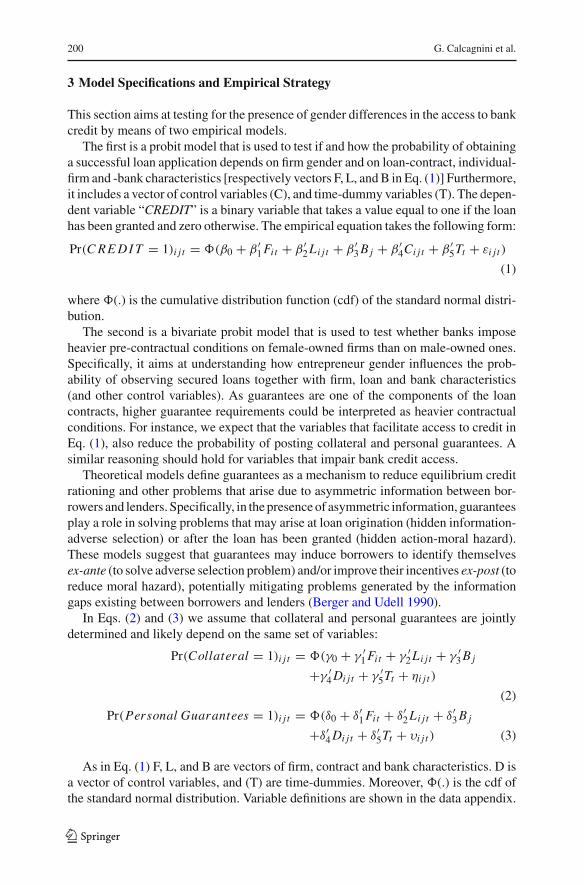
The first is a probit model that is used to test if and how the probability of obtaininga successful loan application depends on firm gender and on loan-contract, individual-firm and -bank characteristics [respectively vectors F, L, andB in Eq. (1)] Furthermore,it includes a vector of control variables (C), and time-dummy variables (T). The depen-dent variable “CREDIT” is a binary variable that takes a value equal to one if the loanhas been granted and zero otherwise. The empirical equation takes the following form:
Pr(CREDIT = 1)i j t = �(β0 + β ′1Fit + β ′
2Li jt + β ′3Bj + β ′
4Ci jt + β ′5Tt + εi j t )
(1)
where �(.) is the cumulative distribution function (cdf) of the standard normal distri-bution.
The second is a bivariate probit model that is used to test whether banks imposeheavier pre-contractual conditions on female-owned firms than on male-owned ones.Specifically, it aims at understanding how entrepreneur gender influences the prob-ability of observing secured loans together with firm, loan and bank characteristics(and other control variables). As guarantees are one of the components of the loancontracts, higher guarantee requirements could be interpreted as heavier contractualconditions. For instance, we expect that the variables that facilitate access to credit inEq. (1), also reduce the probability of posting collateral and personal guarantees. Asimilar reasoning should hold for variables that impair bank credit access.
Theoretical models define guarantees as a mechanism to reduce equilibrium creditrationing and other problems that arise due to asymmetric information between bor-rowers and lenders. Specifically, in the presence of asymmetric information, guaranteesplay a role in solving problems that may arise at loan origination (hidden information-adverse selection) or after the loan has been granted (hidden action-moral hazard).These models suggest that guarantees may induce borrowers to identify themselvesex-ante (to solve adverse selection problem) and/or improve their incentives ex-post (toreduce moral hazard), potentially mitigating problems generated by the informationgaps existing between borrowers and lenders (Berger and Udell 1990).
In Eqs. (2) and (3) we assume that collateral and personal guarantees are jointlydetermined and likely depend on the same set of variables:
Pr(Collateral = 1)i j t = �(γ0 + γ ′1Fit + γ ′
2Li jt + γ ′3Bj
+γ ′4Di jt + γ ′
5Tt + ηi j t )
(2)
Pr(Personal Guarantees = 1)i j t = �(δ0 + δ′1Fit + δ′
2Li jt + δ′3Bj
+δ′4Di jt + δ′
5Tt + υi j t ) (3)
As in Eq. (1) F, L, and B are vectors of firm, contract and bank characteristics. D isa vector of control variables, and (T) are time-dummies. Moreover, �(.) is the cdf ofthe standard normal distribution. Variable definitions are shown in the data appendix.
123
Gender Differences in Bank Loan Access 201
3.1 Firm Characteristics and Expected Signs
Vector F contains the following firm characteristics.
Gender is a dummy variable that takes a value equal to 1 for female firms and 0 formale firms. In the case of female discrimination in the bank loan market, the estimatedcoefficient of the dummy Gender should be statistically significant and negative inEq. (1), but positive in Eqs. (2) and (3). This is the simplest case. However, when theGender variable interacts with other firm or loan characteristics, gender discriminationcould exist even if the gender coefficient is not statistically significant, but some ofthe coefficients of the interaction variables are.
Firm age is years from firm foundation. As older firms have had time to buildup a reputation compared to younger firms, which therefore are considered riskier,informational opaqueness problems decrease (Berger and Udell 1998) with Firm age.Additionally, older firms have gained experience and survived under the threat ofcompetition for a longer period. Thus, a positive estimated coefficient of the Firmage variable in Eq. (1) is expected. The same reasoning applies to Owner age, whichmeasures the age of the entrepreneur or of the legally appointed Managing Directorin the case of partnerships or corporations.
As for Eqs. (2) and (3), when guarantees are used to solve moral hazard problems,the probability of posting guarantees should be inversely related with Firm age andits coefficient negative (Jimènez et al. 2006).
Firm size is the logarithm of the total sales of the firm. Size plays an importantrole in firms’ financial structure. Indeed, asymmetric information and informationalopaqueness are generally more severe for small-sized firms than larger ones, and thusthe former could turn out to be more financially constrained than the latter (Bergerand Udell 1998). Therefore, a positive estimated coefficient of the Firm size variablein Eq. (1) is expected.
It is also expected that the probability of posting guarantees, when they are usedto solve moral hazard problems, will be inversely related with the Firm size vari-able. Indeed, larger sized firms traditionally show stronger bargaining power and areconsidered typically less risky than smaller firms (Berger and Udell 1998).
The type of firm (sole proprietorship, partnership, limited liability) is controlled forby specific dummy variables. Berger and Udell (1998) show that partnership (Partner-ship) and limited liability companies (Limited liability) are considered less risky thansole proprietorships, as they suffer less from informational opaqueness. Therefore, theformer are expected to enjoy better access to credit and a lower probability of havingto pledge guarantees than the latter.
Equations (1), (2) and (3) include two controls for the number of loan applicationssubmitted each year (Multilending), and for the length of the lending relationship(Relationship length). While the number of lending relationships is expected to havea negative impact on the probability of being financed in Eq. (1), it likely increasesthe probability of pledging guarantees in Eqs. (2) and (3), as multiple applicationsare a signal of difficulty in accessing credit and, therefore, of borrower risk (Pozzolo2004).
123
202 G. Calcagnini et al.
The impact of the length of the lending relationship (Relationship length) on thelikelihood of obtaining a loan or posting guarantees is not defined a priori. The esti-mated coefficient of Relationship length in Eq. (1) is expected to be positive if itreduces asymmetric information problems, and negative if it generates hold-up prob-lems. At the same time, a long-term banking relationship may benefit the borrow-ers by helping to build trust between borrowers and lenders, and consequently toreducing moral hazard (Boot and Thakor (1994), Berger and Udell (1995)). How-ever, longer lending relationships could be associated with a higher use of collat-eral if long-term relationships generate more severe hold-up problems (Ogawa et al.(2010)).
Subsequently, we control for the sector of activity by means of the Sector dummiesand for firm location by means of the Regional dummies (North-west, North-east,Central and South).
As we are controlling for a full set of firm characteristics that, in the absenceof an explicit measure are proxies for firm risk, a statistically significant estimatedcoefficient of theGender variable, or its interaction with the other firm characteristics,is a signal of discrimination in the bank loan market.
3.2 Loan Characteristics and Expected Signs
Vector L contains the characteristics of each loan contract.
Loan size is the log of the amount of loan requested by the firm from each bank inthe database and proxies for the loan size. Larger loans, for a specified firm size, aretypically riskier than smaller- sized ones. Therefore, in Eq. (1) the impact of Loan sizeis expected to be negative, because larger loans should be riskier than smaller sizedones (and, consequently, they have a negative impact on the probability of obtaininga loan). However, this variable is also a proxy for relative firm size, given that small-sized firms apply for smaller loans than larger-sized firms. In this case the impact ofLoan size on the probability of obtaining a loan is positive. Similarly, in Eqs. (2) and(3) the probability of posting guarantees should increase with the loan size. Howeverthe expected sign could also be negative, as larger borrowers tend to be safer customers(Berger and Udell 1990).
Equation (1) makes use of additional information on the presence of guaranteesto control for customers and loans risk. Specifically, the vector L also includes threedummyvariables, one for collateral (Collateral), one for personal guarantees (Personalguarantees), and a dummy (Guarantees and Collateral) to capture the simultaneouspresence of both types of guarantee. These dummyvariables also interactwith theGen-der variable to capture potential gender differences. The impact of guarantees on theprobability of being financed is not defined a priori. On one hand, high quality borrow-ers may signal the bank by posting guarantees. Therefore, more guarantees increasethe probability of loans being granted. On the other, if riskier borrowers are thosewho post more guarantees, their impact on the probability of being financed dependson whether guarantees fully compensate—or do not—for borrower risk (Berger andUdell 1990).
123
Gender Differences in Bank Loan Access 203
In Eqs. (2) and (3) we also control for the Loan type: loans backed by accountsreceivable, term-loans, revocable-loans, bad debts and unpaid and protested own bills(Bank of Italy (2010))6.
3.3 Other Controls
Vector B contains bank dummies to identify each bank in the sample: Bank1, Bank2and Bank3 for Banca di Credito Cooperativo di Fano, San Paolo–Banca Popolaredell’Adriatico, and the Banca di Credito Cooperativo di Cesena, respectively.
4 Result Discussion
4.1 The Impact of Gender on the Probability of Granted Loans
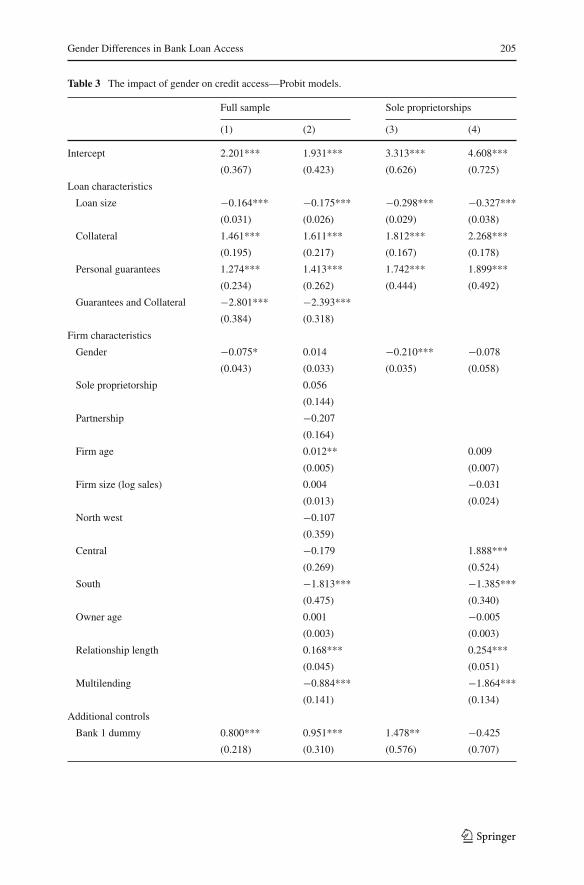
This section discusses findings of different versions of model (1).Table 3 shows estimated coefficients and marginal effects of two different speci-
fications. Column (1) reports estimates from the baseline specification, in which theprobability of successful loan application depends on gender and on loan character-istics, and bank, time and industry dummies. Findings suggest that there are genderdifferences in the access to credit, as the estimated coefficient and the marginal impactof Gender are both negative and statistically significant. However, once we controlfor a full set of firm characteristics, the Gender coefficient is no longer statisticallysignificant as shown in Column (2) of Table (3). Estimates for the subsample of soleproprietorships confirm previous results as shown in columns (3) and (4) of Table 3:Gender does not appear to affect firm access to credit when we control for firm char-acteristics. This finding is in line with Cole andMehran (2011), and Stefani and Vacca(2013) whose empirical analyses suggest that gender differences in access to creditare almost completely explained by male and female firms being structurally different(in terms of size, age, sector, proprietorship, on so on)7.
Indeed, estimates reported in columns (2) and (4) of Table 3 show that other vari-ables affect the probability of a successful loan application. Among loan character-istics, Loan size reduces the probability of getting credit (i.e. a 1 % increase in theamount of loan requested reduces the probability of obtaining credit of −1.23 andof −1.30 %, in columns (2) and (4) respectively), while the presence of Collateralor Personal Guarantees increases firms’ probability of obtaining a loan; the marginaleffects of those variables (not tabulated) are equal to 11.30 and 9.90 %, in column (2)respectively8. Thus, guarantees are used as a mechanism to reduce equilibrium credit
6 Equations (2) and (3) do not include the Loan type variable, which is endogenous to the dependentdichotomous variable Credit.7 For robustness check purposes, we dropped from the sample the observations for which the loan appli-cation outcome was “Inquest” and then we re-estimated model (1). Findings of columns (2) and (4) ofTable (3) are confirmed. Estimates available upon request from the authors.8 The marginal effects of Collateral and Personal guarantees are equal to 9 and 7.6 % respectively, incolumn (4).
123
204 G. Calcagnini et al.
rationing. However, the simultaneous presence of both types of guarantees reduces theprobability of credit access, as the estimated coefficient of Guarantees and Collateralis negative and statistically significant, and its marginal effect is equal to −16.78 %.In the dataset, only female-owned sole proprietorships post both types of guarantees.Thus, the estimated coefficient ofGuarantees and Collateral suggests that banks con-sider female-owned firms to be riskier than male-owned ones, especially in the caseof sole proprietorships.
While firms’ legal type does not affect access to credit, older firms have a marginaladvantage over younger ones: the estimated coefficient of Firm age in column (2) ispositive and significant, and its marginal effect is 0.09 %, which corresponds to theincreasing probability of obtaining a successful loan application if firm age increasesby 1. As expected, the number of lending relationships (Multiple lending) decreasesthe probability of being financed (i.e. if the number of lending relationships increasesby 1 the probability of obtaining credit reduces of −6.20 and 7.41 % in columns (2)and (4), respectively), while firms benefit from the length of the lending relationship(Relationship length), which increases firms’ probability of gaining access to creditby 1.18 and 1.01 % in columns (2) and (4), respectively.
Further, firm location matters, as firms from the South have a lower probabilityof being financed with respect to firms located in the North-East macro-region (theexcluded dummy)9. Finally, loan applications made in 2008 show a lower probabilityof being successful with respect to those submitted in 2005, likely economic crisisand the credit crunch.
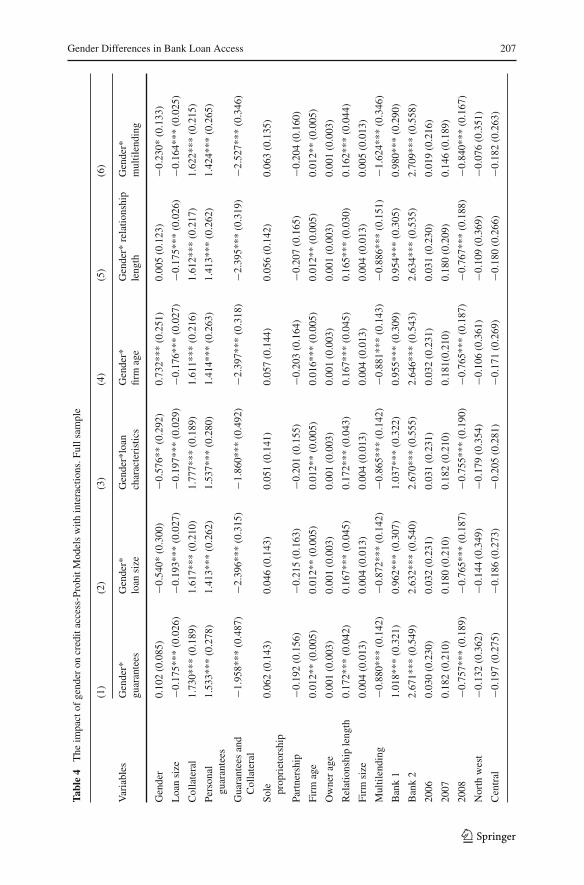
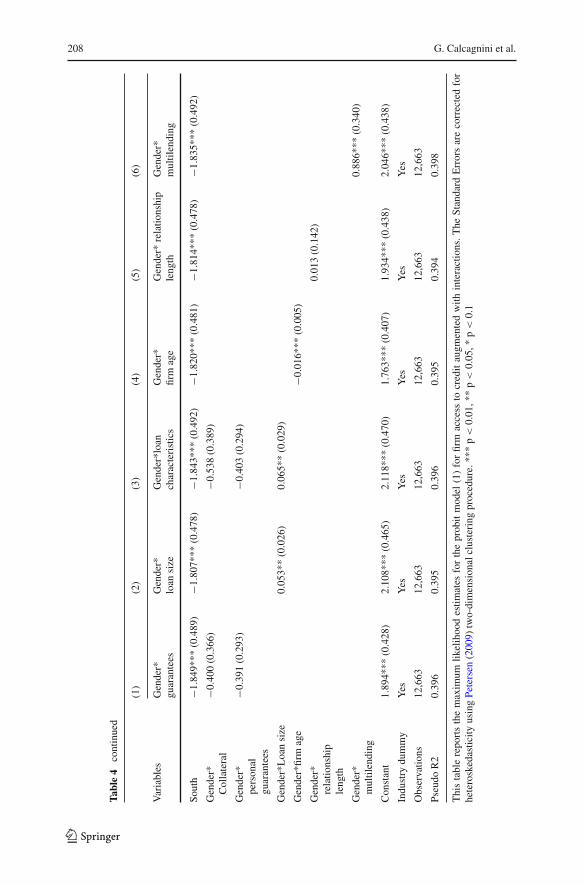
Table 4 shows the estimated coefficients of variables included in Eq. (1) augmentedfor interactions between the Gender variable and loan characteristics [columns (1)to (3)] and firm characteristics [columns (4) to (6)]. The aim of these models is toverify whether the role of the variables, whose coefficients in Table (3) are statisticallysignificant, differs according to gender. As the magnitude of the interaction effect innonlinear models does not equal the marginal effect of the interaction term, marginaleffects of the interaction variables (not tabulated) are computed following Ai andNorton (2003)10.
Column (1) in Table 4 focuses on guarantees. How does the marginal effect ofcollateral and personal guarantees change when Gender changes from 0 to 1?
First, in the case of female-ownedfirms, the coefficients of both interaction variablesCollateral*Gender and Personal guarantees*Gender are negative. Marginal effectsfor these variables show that the presence of Collateral increases the probability toobtain credit of male- and female-owned firms by 12.5 and 8.5 %, respectively. Thesameprobabilities forPersonal guarantees are 11 and7.3%, respectively. Therefore, inthe case of female-owned firms, collateral and personal guarantees seem less powerfulinstruments to obtain loans than for male-owned firms.
9 Differences in banking market concentration could account for observed differences in the availabilityof credit to female- and male-owned firms. Generally, the higher the level of competitiveness in the market,the lower the probability that banks will practice discrimination. The banking sector of the provinces ofPesaro and Urbino and Forlì-Cesena appears to be relatively more concentrated than other close financialmarkets (see Table 2.1 in Calcagnini and Lenti 2008).10 We used the Stata 11 margins command to calculate the marginal effects of the interaction variables.
123
Gender Differences in Bank Loan Access 205
Table 3 The impact of gender on credit access—Probit models.
Full sample Sole proprietorships
(1) (2) (3) (4)
Intercept 2.201*** 1.931*** 3.313*** 4.608***
(0.367) (0.423) (0.626) (0.725)
Loan characteristics
Loan size −0.164*** −0.175*** −0.298*** −0.327***
(0.031) (0.026) (0.029) (0.038)
Collateral 1.461*** 1.611*** 1.812*** 2.268***
(0.195) (0.217) (0.167) (0.178)
Personal guarantees 1.274*** 1.413*** 1.742*** 1.899***
(0.234) (0.262) (0.444) (0.492)
Guarantees and Collateral −2.801*** −2.393***
(0.384) (0.318)
Firm characteristics
Gender −0.075* 0.014 −0.210*** −0.078
(0.043) (0.033) (0.035) (0.058)
Sole proprietorship 0.056
(0.144)
Partnership −0.207
(0.164)
Firm age 0.012** 0.009
(0.005) (0.007)
Firm size (log sales) 0.004 −0.031
(0.013) (0.024)
North west −0.107
(0.359)
Central −0.179 1.888***
(0.269) (0.524)
South −1.813*** −1.385***
(0.475) (0.340)
Owner age 0.001 −0.005
(0.003) (0.003)
Relationship length 0.168*** 0.254***
(0.045) (0.051)
Multilending −0.884*** −1.864***
(0.141) (0.134)
Additional controls
Bank 1 dummy 0.800*** 0.951*** 1.478** −0.425
(0.218) (0.310) (0.576) (0.707)
123
206 G. Calcagnini et al.
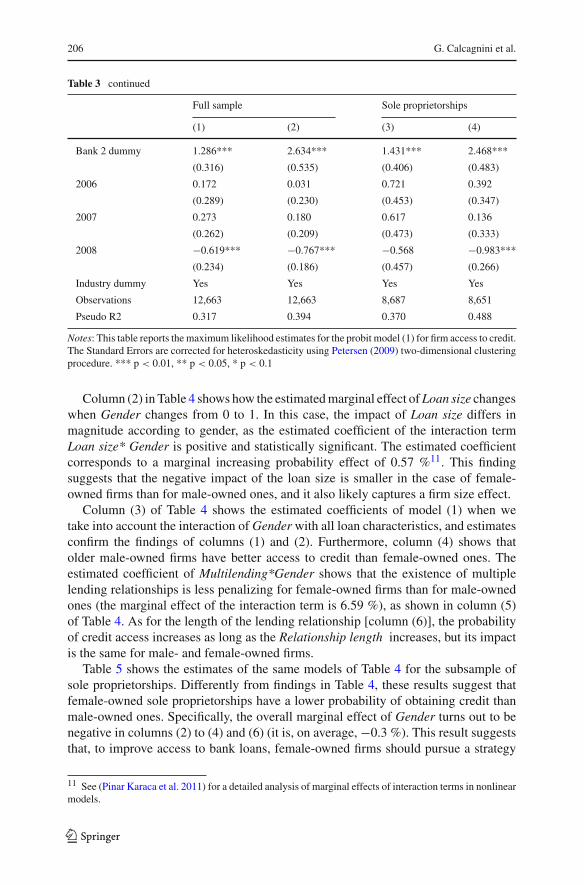
Table 3 continued
Full sample Sole proprietorships
(1) (2) (3) (4)
Bank 2 dummy 1.286*** 2.634*** 1.431*** 2.468***
(0.316) (0.535) (0.406) (0.483)
2006 0.172 0.031 0.721 0.392
(0.289) (0.230) (0.453) (0.347)
2007 0.273 0.180 0.617 0.136
(0.262) (0.209) (0.473) (0.333)
2008 −0.619*** −0.767*** −0.568 −0.983***
(0.234) (0.186) (0.457) (0.266)
Industry dummy Yes Yes Yes Yes
Observations 12,663 12,663 8,687 8,651
Pseudo R2 0.317 0.394 0.370 0.488
Notes: This table reports the maximum likelihood estimates for the probit model (1) for firm access to credit.The Standard Errors are corrected for heteroskedasticity using Petersen (2009) two-dimensional clusteringprocedure. *** p < 0.01, ** p < 0.05, * p < 0.1
Column (2) in Table 4 shows how the estimatedmarginal effect ofLoan size changeswhen Gender changes from 0 to 1. In this case, the impact of Loan size differs inmagnitude according to gender, as the estimated coefficient of the interaction termLoan size* Gender is positive and statistically significant. The estimated coefficientcorresponds to a marginal increasing probability effect of 0.57 %11. This findingsuggests that the negative impact of the loan size is smaller in the case of female-owned firms than for male-owned ones, and it also likely captures a firm size effect.
Column (3) of Table 4 shows the estimated coefficients of model (1) when wetake into account the interaction ofGenderwith all loan characteristics, and estimatesconfirm the findings of columns (1) and (2). Furthermore, column (4) shows thatolder male-owned firms have better access to credit than female-owned ones. Theestimated coefficient of Multilending*Gender shows that the existence of multiplelending relationships is less penalizing for female-owned firms than for male-ownedones (the marginal effect of the interaction term is 6.59 %), as shown in column (5)of Table 4. As for the length of the lending relationship [column (6)], the probabilityof credit access increases as long as the Relationship length increases, but its impactis the same for male- and female-owned firms.
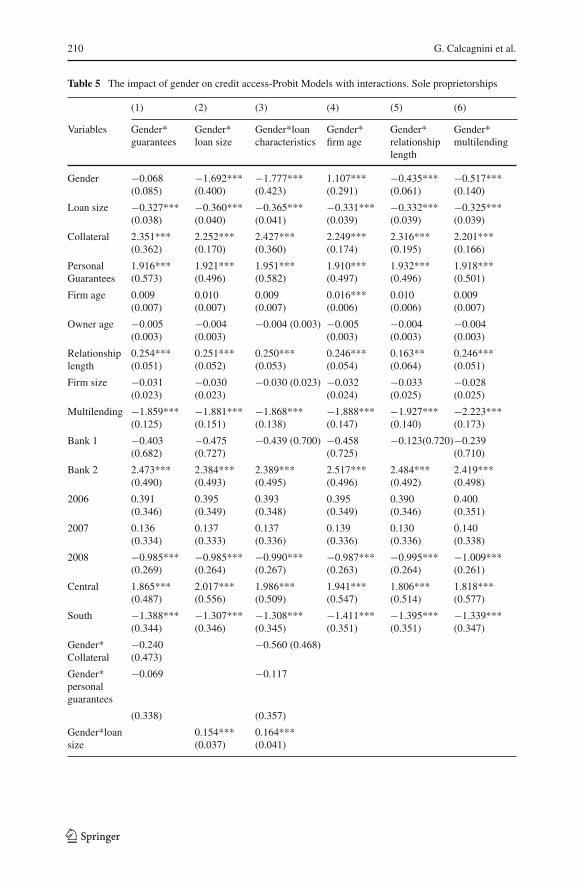
Table 5 shows the estimates of the same models of Table 4 for the subsample ofsole proprietorships. Differently from findings in Table 4, these results suggest thatfemale-owned sole proprietorships have a lower probability of obtaining credit thanmale-owned ones. Specifically, the overall marginal effect of Gender turns out to benegative in columns (2) to (4) and (6) (it is, on average, −0.3 %). This result suggeststhat, to improve access to bank loans, female-owned firms should pursue a strategy
11 See (Pinar Karaca et al. 2011) for a detailed analysis of marginal effects of interaction terms in nonlinearmodels.
123
Gender Differences in Bank Loan Access 207
Table4
The
impactof
gender
oncreditaccess-ProbitM
odelswith
interactions.F
ullsam
ple
(1)
(2)
(3)
(4)
(5)
(6)
Variables
Gender*
guarantees
Gender*
loan
size
Gender*loan
characteristics
Gender*
firm
age
Gender*
relatio
nship
leng
thGender*
multilending
Gender
0.10
2(0.085
)−0
.540
*(0.300
)−0
.576
**(0.292
)0.73
2***
(0.251
)0.00
5(0.123
)−0
.230
*(0.133
)
Loansize
−0.175
***(0.026
)−0
.193
***(0.027
)−0
.197
***(0.029
)−0
.176
***(0.027
)−0
.175
***(0.026
)−0
.164
***(0.025
)
Collateral
1.73
0***
(0.189
)1.61
7***
(0.210
)1.77
7***
(0.189
)1.61
1***
(0.216
)1.61
2***
(0.217
)1.62
2***
(0.215
)
Personal
guarantees
1.53
3***
(0.278
)1.41
3***
(0.262
)1.53
7***
(0.280
)1.41
4***
(0.263
)1.41
3***
(0.262
)1.42
4***
(0.265
)
Guaranteesand
Collateral
−1.958
***(0.487
)−2
.396
***(0.315
)−1
.860
***(0.492
)−2
.397
***(0.318
)−2
.395
***(0.319
)−2
.527
***(0.346
)
Sole prop
rietorship
0.06
2(0.143
)0.04
6(0.143
)0.05
1(0.141
)0.05
7(0.144
)0.05
6(0.142
)0.06
3(0.135
)
Partnership
−0.192
(0.156
)−0
.215
(0.163
)−0
.201
(0.155
)−0
.203
(0.164
)−0
.207
(0.165
)−0
.204
(0.160
)
Firm
age
0.01
2**(0.005
)0.01
2**(0.005
)0.01
2**(0.005
)0.01
6***
(0.005
)0.01
2**(0.005
)0.01
2**(0.005
)
Ownerage
0.00
1(0.003
)0.00
1(0.003
)0.00
1(0.003
)0.00
1(0.003
)0.00
1(0.003
)0.00
1(0.003
)
Relationshipleng
th0.17
2***
(0.042
)0.16
7***
(0.045
)0.17
2***
(0.043
)0.16
7***
(0.045
)0.16
5***
(0.030
)0.16
2***
(0.044
)
Firm
size
0.00
4(0.013
)0.00
4(0.013
)0.00
4(0.013
)0.00
4(0.013
)0.00
4(0.013
)0.00
5(0.013
)
Multilending
−0.880
***(0.142
)−0
.872
***(0.142
)−0
.865
***(0.142
)−0
.881
***(0.143
)−0
.886
***(0.151
)−1
.624
***(0.346
)
Bank1
1.01
8***
(0.321
)0.96
2***
(0.307
)1.03
7***
(0.322
)0.95
5***
(0.309
)0.95
4***
(0.305
)0.98
0***
(0.290
)
Bank2
2.67
1***
(0.549
)2.63
2***
(0.540
)2.67
0***
(0.555
)2.64
6***
(0.543
)2.63
4***
(0.535
)2.70
9***
(0.558
)
2006
0.03
0(0.230
)0.03
2(0.231
)0.03
1(0.231
)0.03
2(0.231
)0.03
1(0.230
)0.01
9(0.216
)
2007
0.18
2(0.210
)0.18
0(0.210
)0.18
2(0.210
)0.18
1(0.21
0)0.18
0(0.209
)0.14
6(0.189
)
2008
−0.757
***(0.189
)−0
.765
***(0.187
)−0
.755
***(0.190
)−0
.765
***(0.187
)−0
.767
***(0.188
)−0
.840
***(0.167
)
North
west
−0.132
(0.362
)−0
.144
(0.349
)−0
.179
(0.354
)−0
.106
(0.361
)−0
.109
(0.369
)−0
.076
(0.351
)
Central
−0.197
(0.275
)− 0
.186
(0.273
)−0
.205
(0.281
)−0
.171
(0.269
)−0
.180
(0.266
)−0
.182
(0.263
)
123
208 G. Calcagnini et al.
Table4
continued
(1)
(2)
(3)
(4)
(5)
(6)
Variables
Gender*
guarantees
Gender*
loan
size
Gender*loan
characteristics
Gender*
firm
age
Gender*
relatio
nship
leng
thGender*
multilending
South
−1.849
***(0.489
)−1
.807
***(0.478
)−1
.843
***(0.492
)−1
.820
***(0.481
)−1
.814
***(0.478
)−1
.835
***(0.492
)
Gender*
Collateral
−0.400
(0.366
)−0
.538
(0.389
)
Gender*
person
alguarantees
−0.391
(0.293
)−0
.403
(0.294
)
Gender*Loansize
0.05
3**(0.026
)0.06
5**(0.029
)
Gender*firm
age
−0.016
***(0.005
)
Gender*
relatio
nship
leng
th
0.01
3(0.142
)
Gender*
multilending
0.88
6***
(0.340
)
Con
stant
1.89
4***
(0.428
)2.10
8***
(0.465
)2.11
8***
(0.470
)1.76
3***
(0.407
)1.93
4***
(0.438
)2.04
6***
(0.438
)
Indu
stry
dummy
Yes
Yes
Yes
Yes
Yes
Yes
Observatio
ns12
,663
12,663
12,663
12,663
12,663
12,663
Pseudo
R2
0.39
60.39
50.39
60.39
50.39
40.39
8
Thistablerepo
rtsthemaxim
umlik
elihoo
destim
ates
fortheprob
itmod
el(1)forfirm
access
tocreditaugm
entedwith
interactions.T
heStandard
Errorsarecorrectedfor
heteroskedasticity
usingPetersen
(200
9)two-dimension
alclustering
procedure.**
*p
<0.01
,**p
<0.05
,*p
<0.1
123
Gender Differences in Bank Loan Access 209
oriented towards increasingly adopting a more structured legal form such as that ofpartnerships or limited liability companies.
4.2 The Impact of Gender on Personal Guarantees and Collateral
The estimated Eq. (1) provides evidence that gender differences in credit access areespecially linked to the role of guarantees in facilitating credit access.
To explore how gender interacts with guarantee requirements, in this section wetest whether female-owned firms have a different probability of posting guarantees(personal or collateral) than male-owned ones. Unfortunately, we do not have loanpricing data, and the implications of the relation between gender and guarantees istherefore more problematic to identify, as we cannot disentangle: (i) whether theborrower was required to have a guarantee or (ii) whether the guarantee is a wayto reduce the loan risk of the loan and this lower risk is reflected in the price. Thissecond effect could be particularly important, given that some borrowers who havean outside personal guarantor may prefer to provide the bank third party guaranteesin exchange for a lower interest rate (or contractual costs). What is more, womenmay have a lower risk tolerance and thus their preferences for the trade off betweenprice and guarantees may differ from the preferences of men (Bönte and Piegeler2012). However, Italian data on firm loans show that, on average, loans secured bypersonal guarantees are characterized by a higher price than unsecured loans, whileloans secured by collateral have a lower interest rate (Calcagnini et al. 2014; Rodanoet al. 2011).
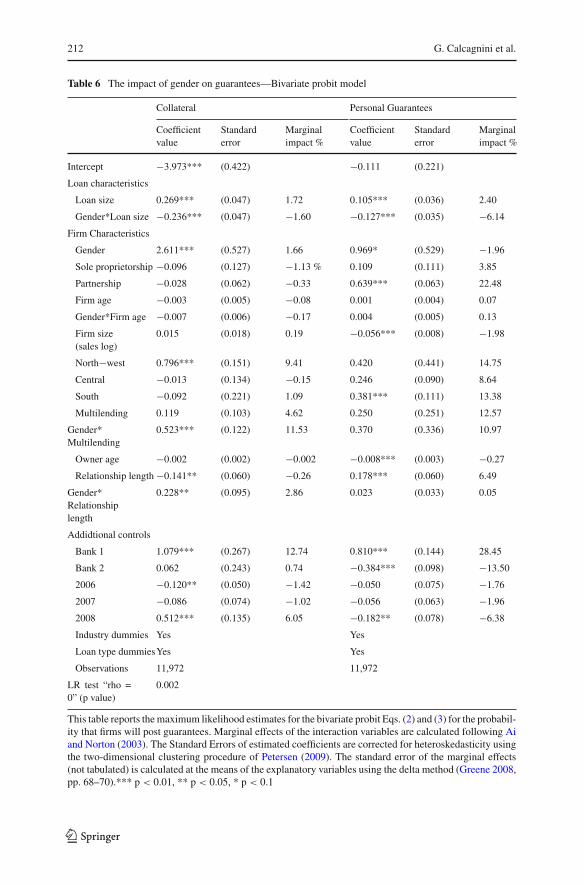
Table 6, columns (1) and (2), shows the estimated coefficients of the bivariateprobit model [Eqs. (2) and (3)], and the likelihood ratio test that rejects the null ofzero correlation between the errors of the two probit models (see row labelled as LRtest “rho = 0”) (Table 6).
Overall, the findings show that the probability of posting guarantees increases withthe Loan size, which is consistent with the prediction that observably riskier borrowersare more likely to pledge collateral to solve moral hazard problems (Boot et al. 1991).However, the effect of loan size is smaller in the case of female-owned firms, asthe estimated coefficient of the interaction term Loan size*Gender is negative andstatistically significant, and it also likely captures a firm-size effect as in Eq. (1) inTables (3) and (4). Moreover, estimates show that female-owned firms are required topost relatively more collateral than male-owned ones, but relatively fewer third-partyguarantees.
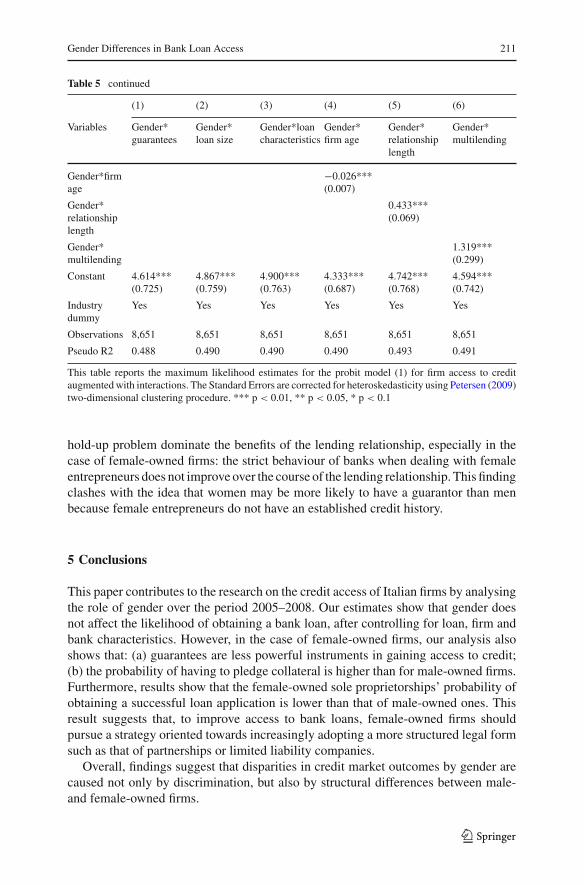
As expected, large firms (Firm size) have a lower probability of posting personalguarantees than do smaller firms. Among female-owned firms, increasing multipleloan applications (Multilending) positively affects the probability of posting collateral.Similarly, long-term lending relationships (Relationship length) between banks andcustomers positively affect the probability of posting both collateral and personalguarantees [column (1)]12. The last findings suggest that the negative effects of the
12 Specifically if the firm is female-owned, a long-term lending relationship increases the probability ofposting collateral, as the estimated coefficient of Relationship length *Gender is positive and statisticallysignificant and more than counterbalances the negative estimated coefficient of Relationship length.
123
210 G. Calcagnini et al.
Table 5 The impact of gender on credit access-Probit Models with interactions. Sole proprietorships
(1) (2) (3) (4) (5) (6)
Variables Gender*guarantees
Gender*loan size
Gender*loancharacteristics
Gender*firm age
Gender*relationshiplength
Gender*multilending
Gender −0.068(0.085)
−1.692***(0.400)
−1.777***(0.423)
1.107***(0.291)
−0.435***(0.061)
−0.517***(0.140)
Loan size −0.327***(0.038)
−0.360***(0.040)
−0.365***(0.041)
−0.331***(0.039)
−0.332***(0.039)
−0.325***(0.039)
Collateral 2.351***(0.362)
2.252***(0.170)
2.427***(0.360)
2.249***(0.174)
2.316***(0.195)
2.201***(0.166)
PersonalGuarantees
1.916***(0.573)
1.921***(0.496)
1.951***(0.582)
1.910***(0.497)
1.932***(0.496)
1.918***(0.501)
Firm age 0.009(0.007)
0.010(0.007)
0.009(0.007)
0.016***(0.006)
0.010(0.006)
0.009(0.007)
Owner age −0.005(0.003)
−0.004(0.003)
−0.004 (0.003) −0.005(0.003)
−0.004(0.003)
−0.004(0.003)
Relationshiplength
0.254***(0.051)
0.251***(0.052)
0.250***(0.053)
0.246***(0.054)
0.163**(0.064)
0.246***(0.051)
Firm size −0.031(0.023)
−0.030(0.023)
−0.030 (0.023) −0.032(0.024)
−0.033(0.025)
−0.028(0.025)
Multilending −1.859***(0.125)
−1.881***(0.151)
−1.868***(0.138)
−1.888***(0.147)
−1.927***(0.140)
−2.223***(0.173)
Bank 1 −0.403(0.682)
−0.475(0.727)
−0.439 (0.700) −0.458(0.725)
−0.123(0.720)−0.239(0.710)
Bank 2 2.473***(0.490)
2.384***(0.493)
2.389***(0.495)
2.517***(0.496)
2.484***(0.492)
2.419***(0.498)
2006 0.391(0.346)
0.395(0.349)
0.393(0.348)
0.395(0.349)
0.390(0.346)
0.400(0.351)
2007 0.136(0.334)
0.137(0.333)
0.137(0.336)
0.139(0.336)
0.130(0.336)
0.140(0.338)
2008 −0.985***(0.269)
−0.985***(0.264)
−0.990***(0.267)
−0.987***(0.263)
−0.995***(0.264)
−1.009***(0.261)
Central 1.865***(0.487)
2.017***(0.556)
1.986***(0.509)
1.941***(0.547)
1.806***(0.514)
1.818***(0.577)
South −1.388***(0.344)
−1.307***(0.346)
−1.308***(0.345)
−1.411***(0.351)
−1.395***(0.351)
−1.339***(0.347)
Gender*Collateral
−0.240(0.473)
−0.560 (0.468)
Gender*personalguarantees
−0.069 −0.117
(0.338) (0.357)
Gender*loansize
0.154***(0.037)
0.164***(0.041)
123
Gender Differences in Bank Loan Access 211
Table 5 continued
(1) (2) (3) (4) (5) (6)
Variables Gender*guarantees
Gender*loan size
Gender*loancharacteristics
Gender*firm age
Gender*relationshiplength
Gender*multilending
Gender*firmage
−0.026***(0.007)
Gender*relationshiplength
0.433***(0.069)
Gender*multilending
1.319***(0.299)
Constant 4.614***(0.725)
4.867***(0.759)
4.900***(0.763)
4.333***(0.687)
4.742***(0.768)
4.594***(0.742)
Industrydummy
Yes Yes Yes Yes Yes Yes
Observations 8,651 8,651 8,651 8,651 8,651 8,651
Pseudo R2 0.488 0.490 0.490 0.490 0.493 0.491
This table reports the maximum likelihood estimates for the probit model (1) for firm access to creditaugmentedwith interactions. The Standard Errors are corrected for heteroskedasticity using Petersen (2009)two-dimensional clustering procedure. *** p < 0.01, ** p < 0.05, * p < 0.1
hold-up problem dominate the benefits of the lending relationship, especially in thecase of female-owned firms: the strict behaviour of banks when dealing with femaleentrepreneurs does not improve over the course of the lending relationship. This findingclashes with the idea that women may be more likely to have a guarantor than menbecause female entrepreneurs do not have an established credit history.
5 Conclusions
This paper contributes to the research on the credit access of Italian firms by analysingthe role of gender over the period 2005–2008. Our estimates show that gender doesnot affect the likelihood of obtaining a bank loan, after controlling for loan, firm andbank characteristics. However, in the case of female-owned firms, our analysis alsoshows that: (a) guarantees are less powerful instruments in gaining access to credit;(b) the probability of having to pledge collateral is higher than for male-owned firms.Furthermore, results show that the female-owned sole proprietorships’ probability ofobtaining a successful loan application is lower than that of male-owned ones. Thisresult suggests that, to improve access to bank loans, female-owned firms shouldpursue a strategy oriented towards increasingly adopting a more structured legal formsuch as that of partnerships or limited liability companies.
Overall, findings suggest that disparities in credit market outcomes by gender arecaused not only by discrimination, but also by structural differences between male-and female-owned firms.
123
212 G. Calcagnini et al.
Table 6 The impact of gender on guarantees—Bivariate probit model
Collateral Personal Guarantees
Coefficientvalue
Standarderror
Marginalimpact %
Coefficientvalue
Standarderror
Marginalimpact %
Intercept −3.973*** (0.422) −0.111 (0.221)
Loan characteristics
Loan size 0.269*** (0.047) 1.72 0.105*** (0.036) 2.40
Gender*Loan size −0.236*** (0.047) −1.60 −0.127*** (0.035) −6.14
Firm Characteristics
Gender 2.611*** (0.527) 1.66 0.969* (0.529) −1.96
Sole proprietorship −0.096 (0.127) −1.13 % 0.109 (0.111) 3.85
Partnership −0.028 (0.062) −0.33 0.639*** (0.063) 22.48
Firm age −0.003 (0.005) −0.08 0.001 (0.004) 0.07
Gender*Firm age −0.007 (0.006) −0.17 0.004 (0.005) 0.13
Firm size(sales log)
0.015 (0.018) 0.19 −0.056*** (0.008) −1.98
North−west 0.796*** (0.151) 9.41 0.420 (0.441) 14.75
Central −0.013 (0.134) −0.15 0.246 (0.090) 8.64
South −0.092 (0.221) 1.09 0.381*** (0.111) 13.38
Multilending 0.119 (0.103) 4.62 0.250 (0.251) 12.57
Gender*Multilending
0.523*** (0.122) 11.53 0.370 (0.336) 10.97
Owner age −0.002 (0.002) −0.002 −0.008*** (0.003) −0.27
Relationship length −0.141** (0.060) −0.26 0.178*** (0.060) 6.49
Gender*Relationshiplength
0.228** (0.095) 2.86 0.023 (0.033) 0.05
Addidtional controls
Bank 1 1.079*** (0.267) 12.74 0.810*** (0.144) 28.45
Bank 2 0.062 (0.243) 0.74 −0.384*** (0.098) −13.50
2006 −0.120** (0.050) −1.42 −0.050 (0.075) −1.76
2007 −0.086 (0.074) −1.02 −0.056 (0.063) −1.96
2008 0.512*** (0.135) 6.05 −0.182** (0.078) −6.38
Industry dummies Yes Yes
Loan type dummiesYes Yes
Observations 11,972 11,972
LR test “rho =0” (p value)
0.002
This table reports themaximum likelihood estimates for the bivariate probit Eqs. (2) and (3) for the probabil-ity that firms will post guarantees. Marginal effects of the interaction variables are calculated following Aiand Norton (2003). The Standard Errors of estimated coefficients are corrected for heteroskedasticity usingthe two-dimensional clustering procedure of Petersen (2009). The standard error of the marginal effects(not tabulated) is calculated at the means of the explanatory variables using the delta method (Greene 2008,pp. 68–70).*** p < 0.01, ** p < 0.05, * p < 0.1
123
Gender Differences in Bank Loan Access 213
Appendix: Data
See Tables 7, 8, 9, 10, 11.
Table 7 Dataset composition by gender: absolute values and percentage distribution
Gender Number of firms % Number of loan applications %
Female-owned firm 1,293 29.62 3,950 31.19
Male-owned firm 3,072 70.38 8,713 68.81
Total 4,365 100.00 12,663 100.00
Source: our calculations on data from the San Paolo-Banca Popolare dell’Adriatico, BCC Fano, and BCCCesena banks
Table 8 Distribution of firms by legal type: absolute values and percentage distribution (between paren-theses)
Legal type Female-ownedfirms
Male-owned firms Total Female-owned firms:countrywide data (2008)
Sole proprietorship 735 (56.84) 2,472 (80.47) 3,207 (73.47) 872,969 (61.1)
Partnership 396 (30.63) 265 (8.63) 661 (15.14) 323,862 (22.7)
Limited liability 133 (10.29) 239 (7.78) 372 (8.52) 200,638 (14.0)
Professional orders 25 (1.93) 96 (3.12) 121 (2.77)
Other 4 (0.31) 0 (0.00) 4 (0.09) 31,798 (2.3)
Total 1,293 (100.00) 3,072 (100.00) 4,365 (100.00) 1,429,267 (100.00)
Source: our calculations on data from the San Paolo-Banca Popolare dell’Adriatico, BCCFano,BCCCesenabanks
Table 9 Firm size by gender: absolute values and percentage distribution (between parentheses)
Firm size Female-owned firms Male-owned firms Total
Big enterprise 45 (3.48) 191 (6.22) 236 (5.41)
Medium enterprise 72 (5.57) 227 (7.39) 299 (6.85)
Small enterprise 24 (1.86) 85 (2.77) 109 (2.5)
Micro enterprise 1,152 (89.1) 2,569 (83.63) 3,721 (85.25)
Total 1,293 (100) 3,072 (100) 4,365 (100)
We use total sales data to define firm size according to the EU Commission definition (GUCE L 124/36 del20/05/2003). Big enterprises: have at least 250 employees, their annual turnover is equal or greater than50 million EUR, or their balance sheet total is greater than 43 million EUR; Medium enterprises: havebetween 50 and 249 employees. They should have an annual turnover not exceeding 50 million EUR oran annual balance-sheet total not exceeding 43 million EUR; Small enterprises: have between 10 and 49employees. They should have an annual turnover not exceeding 10 million EUR or an annual balance-sheettotal not exceeding 10million EUR;Micro enterprises : have fewer than 10 employees, their annual turnoveror their annual balance sheet total assets should not exceed 2 million EUR.Source: our calculations on data from the San Paolo-Banca Popolare dell’Adriatico, BCC Fano, and BCCCesena banks
123
214 G. Calcagnini et al.
Table 10 Distribution of firms by sector of economic activity,ATECO2007: absolute values and percentagedistribution (between parentheses)
Sector of activity Female-owned firms Male-owned firms Total firms
Agriculture, forestry, fishing and hunting 74 (5.72) 261 (8.5) 335 (7.67)
Manufacturing 270 (20.88) 598 (19.47) 868 (19.89)
Electricity, gas, steam and hot water supply 0 (0.00) 8 (0.26) 8 (0.18)
Collection, purification anddistribution of water; wastemanagement
5 (0.39) 15 (0.49) 20 (0.46)
Construction 47 (3.63) 468 (15.23) 515 (11.8)
Wholesale and retail trade,repair of motor vehicles
380 (29.39) 607 (19.76) 987 (22.61)
Transportation and warehousing 17 (1.31) 229 (7.45) 246 (5.64)
Accommodation and food services 140 (10.83) 158 (5.14) 298 (6.83)
Finance and insurance 138 (10.67) 387 (12.6) 525 (12.03)
Real estate activities 13 (1.01) 9 (0.29) 22 (0.5)
Professional, scientific, andtechnical services
14 (1.08) 81 (2.64) 95 (2.18)
Rental, travel agencies, andsupport services to firms
4 (0.31) 14 (0.46) 18 (0.41)
Public administration 7 (0.54) 23 (0.75) 30 (0.69)
Other services (except PublicAdministration)
160 (12.37) 174 (5.66) 334 (7.65)
Total 1,293 (100.00) 3,072 (100) 4,365 (100)
Source: our calculations on data from the San Paolo-Banca Popolare dell’Adriatico, BCC Fano, and BCCCesena banks
Table 11 List of variables
Variable Definition
A dichotomous variable that takes the value of 1 if the firm is
female-owned, and 0 otherwise. In the case of sole proprietorships,
female-owned businesses are identified by the owner’s gender. In all
other cases, banks provided the identification of female-owned firm
if the presence of women among partners and administrators is at
least the “majority” according to the following table:
123
Gender Differences in Bank Loan Access 215
Table 11 continued
Variable Presence of women Limited liability Partnerships andother juridical type
Majority If in the list of >50 % “partners” or
partners women hold >50 % “administrators”
more than 50 % of
social capital and
women are more
than 50 % of total
“administrators”
If the list of partners
is not available at the
registry of firms:
women are more
than 50 % of total
“administrators”
Gender Strong (see the215/92 Italian Law)
If in the list of >60 % “partners” or
partners women hold more than 2/3 >60 % “administrators”
of social capital and women
are more than 2/3 of total “administrators”
If the list of partners
is not available at the
registry of firms:
women are more
than 2/3 of total
“administrators”
Exclusive If in the list of 100 % “partners” or
partners women hold 100 % “administrator”
more than 100 % of
social capital and
women are more
than 100 % of total
“administrators”
If the list of partners
is not available at the
registry of firms:
women are more
than 100 % of total
“administrators”
123
216 G. Calcagnini et al.
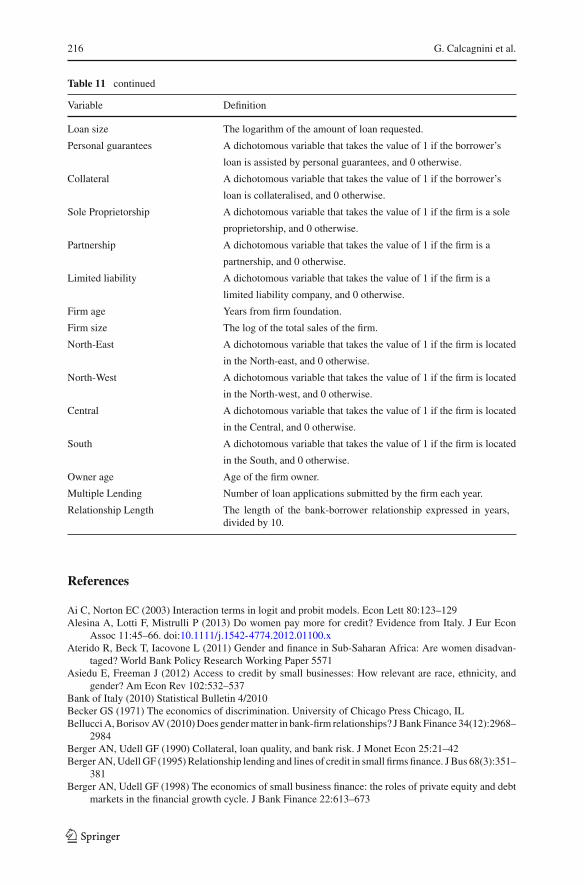
Table 11 continued
Variable Definition
Loan size The logarithm of the amount of loan requested.
Personal guarantees A dichotomous variable that takes the value of 1 if the borrower’s
loan is assisted by personal guarantees, and 0 otherwise.
Collateral A dichotomous variable that takes the value of 1 if the borrower’s
loan is collateralised, and 0 otherwise.
Sole Proprietorship A dichotomous variable that takes the value of 1 if the firm is a sole
proprietorship, and 0 otherwise.
Partnership A dichotomous variable that takes the value of 1 if the firm is a
partnership, and 0 otherwise.
Limited liability A dichotomous variable that takes the value of 1 if the firm is a
limited liability company, and 0 otherwise.
Firm age Years from firm foundation.
Firm size The log of the total sales of the firm.
North-East A dichotomous variable that takes the value of 1 if the firm is located
in the North-east, and 0 otherwise.
North-West A dichotomous variable that takes the value of 1 if the firm is located
in the North-west, and 0 otherwise.
Central A dichotomous variable that takes the value of 1 if the firm is located
in the Central, and 0 otherwise.
South A dichotomous variable that takes the value of 1 if the firm is located
in the South, and 0 otherwise.
Owner age Age of the firm owner.
Multiple Lending Number of loan applications submitted by the firm each year.
Relationship Length The length of the bank-borrower relationship expressed in years,divided by 10.
References
Ai C, Norton EC (2003) Interaction terms in logit and probit models. Econ Lett 80:123–129Alesina A, Lotti F, Mistrulli P (2013) Do women pay more for credit? Evidence from Italy. J Eur Econ
Assoc 11:45–66. doi:10.1111/j.1542-4774.2012.01100.xAterido R, Beck T, Iacovone L (2011) Gender and finance in Sub-Saharan Africa: Are women disadvan-
taged? World Bank Policy Research Working Paper 5571Asiedu E, Freeman J (2012) Access to credit by small businesses: How relevant are race, ethnicity, and
gender? Am Econ Rev 102:532–537Bank of Italy (2010) Statistical Bulletin 4/2010Becker GS (1971) The economics of discrimination. University of Chicago Press Chicago, ILBellucciA,BorisovAV (2010)Does gendermatter in bank-firm relationships? JBankFinance 34(12):2968–
2984Berger AN, Udell GF (1990) Collateral, loan quality, and bank risk. J Monet Econ 25:21–42BergerAN,Udell GF (1995) Relationship lending and lines of credit in small firms finance. J Bus 68(3):351–
381Berger AN, Udell GF (1998) The economics of small business finance: the roles of private equity and debt
markets in the financial growth cycle. J Bank Finance 22:613–673
123
Gender Differences in Bank Loan Access 217
BiancoM, Lotti F, Zizza R (2013) Le donne e l’economia Italiana. Banca d’Italia, n, Questioni di Economiae Finanza, p 171
Bönte W, Piegeler M (2012) Gender gap in latent and nascent entrepreneurship: driven by competitiveness.Small Bus Econ. doi:10.1007/s11187-012-9459-3
Boot AWA, Thakor AV (1994) Moral hazard and secured lending in an infinitely repeated credit marketgame. Int Econ Rev 35(4):899–920
Boot AWA, Thakor AV, Udell GF (1991) Secured lending and default risk: equilibrium analysis, policyimplications, and empirical results. Econ J 101(406):458–472
Calcagnini G, Lenti E (2008) Discriminazione nell’accesso al credito per l’imprenditoria femminile. In: Ivincoli finanziari alla crescita delle imprese, a cura di A. Zazzaro, Roma, Carocci Editore, pp 45–61
Calcagnini G, Farabullini F, Giombini G (2014) The impact of guarantees on bank loan interest rates. ApplFinanc Econ 6:397–412
Carter S, Shaw E (2006)Women’s Business Ownership: Recent Research and Policy Developments, Reportto the Small Business Service, November
Cesaroni F (2010) Donne Imprenditrici e Banche. Le Ragioni di un Rapporto Difficile. In: Calcagnini G,Favaretto I (eds.) L’Economia della Piccola Impresa, pp 131–167. FrancoAngeli: Milano
Cesaroni F, Lotti F, Mistrulli PE (2013) Female firms and banks’ lending behavior: what Happened Duringthe Great Recession? Banca d’Italia, n, Questioni di Economia e Finanza, p 177
Coin D (2011) Are Women Entrepreneurs better Payers than Men? Bank of Italy research paperCole RA, Mehran H (2011) Gender and the Availability of Credit to Privately Held Firms: Evidence from
the Surveys of Small Business Finances. FRB of New York Staff Report No. 383. Available at SSRN:http://ssrn.com/abstract=1799649 or http://dx.doi.org/10.2139/ssrn.1799649
Coleman S, Robb A (2009) A comparison of new firm financing by gender: evidence form the KauffmanFirm Survey Data. Small Bus Econ 33:397–411
Fairlie R, Robb A (2009) Gender differences in business performance: evidence from the Characteristicsof Business Owner Survey. Small Bus Econ 33:375–395
Fay M, Williams L (1993) Gender bias and the availability of business loans. J Bus Ventur 8(4):363–376.doi:10.1016/0883-9026(93)90005-P
Greene WH (2008) Econometric analysis, 6th edn. Pearson Prentice Hall, Upper Saddle River, NJIstat (2013). Rapporto annualeIstat (2007). La demografia d’impresa. http://www.istat.itJimènez G, Salas V (2006) Determinants of collateral. J Financ Econ 81:255–281MuravyevA,TalaveraO (2009) Entrepreneurs’ gender andfinancial constraints: evidence from international
data. J Comp Econ 37(2):270–286OgawaK,SterkenE,Tokutsu I (2010)The economics of imperfectmarkets, series contribution to economics.
In: Calcagnini G, Saltari E (eds) Multiple bank relationships and the main bank system. Physica:Springer, Berlin, pp 73–90
Ongena S, Popov A (2013) Take care of home and family, honey, and let me take care of the money. Genderbias and credit market barriers for female entrepreneurs, Electronic copy available at: http://ssrn.com/abstract=2148914
Petersen MA (2009) Estimating standard errors in finance panel data sets: comparing approaches. RevFinanc Stud 22:435–480
Pinar K-M, Norton EC, Dowd B (2011) Interaction terms in nonlinear models. Health Res Educ Trust.doi:10.1111/j.1475-6773.2011.01314
Pozzolo AF (2004) The role of guarantees in bank lending. Discussion Papers, 528. Bank of ItalyRetecamere (2011) Impresa in genere, secondo rapporto nazionale sull’imprenditoria femminileRodano G, Serrano-Velarde NAB, Tarantino E (2011) The Causal Effect of Bankruptcy Law on the Cost of
Finance. Available at SSRN: http://ssrn.com/abstract=1967485Rosa P, Carter S (1996) Gender as a determinant of small business performance: insights from a British
study. Small Bus Econ 8:463–478Stefani ML, Vacca E (2013) Credit access for female firms: Evidence from a survey on European SMEs.
Questioni di Economia e Finanza, Banca d’Italia, n.176Storey DJ (2004) Racial and gender discrimination in the micro firms credit market? Evidence from trinidad
and tobago. Small Bus Econ 23:401–422
123