gdo analytical report -...
TRANSCRIPT

GDO Analytical Report
Global Drought Observatory: http://edo.jrc.ec.europa.eu/gdo 1
Drought in India – June 2019 JRC Global Drought Observatory (GDO) and ERCC Analytical Team
24/06/2019
Table of Contents Executive summary ......................................................................................................................... 1
Risk of drought impact for agriculture (RDrI-Agri).......................................................................... 2
Precipitation .................................................................................................................................... 3
Standardized Precipitation Index (SPI) ........................................................................................... 5
SPI outlook .................................................................................................................................. 9
Temperature anomalies .................................................................................................................. 9
fAPAR anomaly .............................................................................................................................. 10
Soil moisture anomaly .................................................................................................................. 11
Reported impacts .......................................................................................................................... 13
Executive summary The Indian peninsula is facing a severe drought, due to a combination of monsoon failure in
the second half of 2018, sustained heatwaves between May and June, and underperforming rainfall in the first half of 2019.
States of Karnataka, Maharashtra, Tamil Nadu, Andhra Pradesh are the most affected, but most other parts of central and peninsular India are in dry conditions.
Food security is not at stake in general, but water supply to population, farming sector and ground water resources are. Internal migration, unavailability of drinking water and other drought related impacts are reported from multiple Indian states and several drought declarations are in force at both state and district level.
The precipitation outlook until September is within normal for most of India, with wetter than usual conditions foreseen in the central and eastern country, while to a lesser extent in the western and southern regions, currently the most affected areas. It is very unlikely that the multiannual cumulated deficits will be compensated by the incoming monsoon season.
This document is linked to the report published by GDO last December1, please refer to it for further insight on the roots of the current drought and former impacts. Figure 14 shows the map of Indian States that are mentioned in this report.
1 http://edo.jrc.ec.europa.eu/documents/news/GDODroughtNews201812_India.pdf

GDO Analytical Report
Global Drought Observatory: http://edo.jrc.ec.europa.eu/gdo 2
Drought in India – June 2019 JRC Global Drought Observatory (GDO) and ERCC Analytical Team
24/06/2019
Risk of drought impact for agriculture (RDrI-Agri) The indicator RDrI-Agri shows the risk of having impacts from a drought, by taking into account the exposure and socio-economic vulnerability of the area, with particular focus to the agricultural impacts.
Figure 1 shows the situation at the beginning of June. At this stage, the indicator still underestimates the magnitude of the drought, as the situation can be ascribed to the long tail of late 2018 drought, which has a smaller weight than the last few months in the computation of the risk indicator. In fact, the failed monsoon of 2018 is the strongest driver of current hydrological drought. Nonetheless, a worsening signal is detected since mid-May, in relation to the poor start of the wet season. The southernmost areas of peninsular India (Tamil Nadu, southern Andhra Pradesh) on the contrary show high risk of impacts, as the situation is driven by substantial lack of rain for the recent months (figure 2).
Overall, depending on the degree of severity considered, a number ranging from tens to more than a hundred million people are currently affected by hydrological drought.
Figure 1: Risk of drought impact for agriculture (RDrI-Agri) over India, 1st to 10th of June 2019.
Figure 2: Risk of drought impact (RDrI-Agri), evolution over time in Tamil Nadu (south India).

GDO Analytical Report
Global Drought Observatory: http://edo.jrc.ec.europa.eu/gdo 3
Drought in India – June 2019 JRC Global Drought Observatory (GDO) and ERCC Analytical Team
24/06/2019
Precipitation
Precipitation include total monthly values of both rainfall and snow. Underperforming monsoon precipitation at the end of 2018 is at the root of the ongoing drought for central and western regions affected (Figure 3). Some regions (e.g. most Karnataka) experienced more than a poor wet season in a row. Only the far south of India (Tamil Nadu) had almost average rainfall until December 2018, but long-term expectations were not met since (Figure 3).
Andhra Pradesh (long. 79.5, lat. 13.5)
Maharashtra (long. 74.1, lat: 19.9)

GDO Analytical Report
Global Drought Observatory: http://edo.jrc.ec.europa.eu/gdo 4
Drought in India – June 2019 JRC Global Drought Observatory (GDO) and ERCC Analytical Team
24/06/2019
Karnataka (long. 76, lat. 14.5)
Tamil Nadu (long. 78.6, lat. 9.3)
Figure 3: Monthly total precipitation near four selected locations (blue histogram) with slightly different annual precipitation patterns, compared against the long-term monthly averages (black line) (1981-2010).
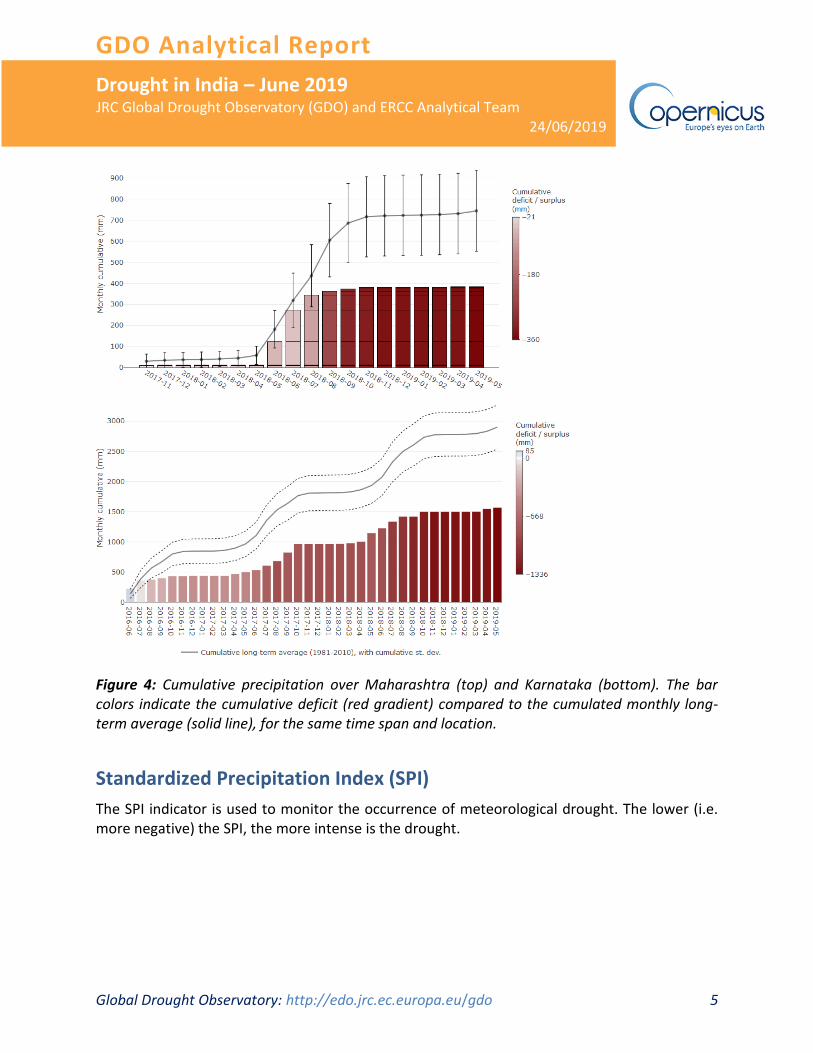
Figure 4 shows the wide deficits cumulated over a time span of three years and one and a half year in Karnataka and Maharashtra, respectively. In both case, precipitation reaches half of the expected average, well below the long-term variability. Such severe deficiencies expose completely the already strained Indian water resources, and require more than a good monsoon season for compensation and groundwater recharge.
GDO Analytical Report
Global Drought Observatory: http://edo.jrc.ec.europa.eu/gdo 5
Drought in India – June 2019 JRC Global Drought Observatory (GDO) and ERCC Analytical Team
24/06/2019
Figure 4: Cumulative precipitation over Maharashtra (top) and Karnataka (bottom). The bar colors indicate the cumulative deficit (red gradient) compared to the cumulated monthly long-term average (solid line), for the same time span and location.
Standardized Precipitation Index (SPI)
The SPI indicator is used to monitor the occurrence of meteorological drought. The lower (i.e. more negative) the SPI, the more intense is the drought.

GDO Analytical Report
Global Drought Observatory: http://edo.jrc.ec.europa.eu/gdo 6
Drought in India – June 2019 JRC Global Drought Observatory (GDO) and ERCC Analytical Team
24/06/2019
Figure 5: SPI for a cumulative period of 3 months (March – May 2019, top left), 9 months (September 2018 – May 2019, top right), 12 months (June 2018 – May 2019, bottom left).
The current situation is almost entirely rooted in the failure of late 2018 precipitation, as SPI of the last 9 and 12 cumulated months show (Figure 5). The only exception is found in Tamil Nadu (southern India), where deficit cumulated mostly since last December and throughout all subsequent months until June, as highlighted by SPI at 6 months block (Figure 6). Elsewhere, the weight of the inter-monsoon months (roughly January to May) is minimal for the yearly rainfall balance and the SPI-3 is much less meaningful, despite showing a situation close to normal for most of India.

GDO Analytical Report
Global Drought Observatory: http://edo.jrc.ec.europa.eu/gdo 7
Drought in India – June 2019 JRC Global Drought Observatory (GDO) and ERCC Analytical Team
24/06/2019
In the following bar charts, time-series of SPI are shown for different locations, highlighting the magnitude of the drought at different cumulative periods. For all bar charts, colors should be interpreted as follows:
Figure 6: SPI time series for cumulative periods of 6 months Tamil Nadu (long. 78.6, lat. 9.3).
The most impressive SPI figure comes from Karnataka (Figure 7), where the SPI-48 reaches extraordinary low values by cumulating over the past four years, distinguished by a sequence of largely underperforming wet seasons (cfr. SPI-3), unseen since the beginning of the seventies.

GDO Analytical Report
Global Drought Observatory: http://edo.jrc.ec.europa.eu/gdo 8
Drought in India – June 2019 JRC Global Drought Observatory (GDO) and ERCC Analytical Team
24/06/2019
Figure 7: SPI time series for cumulative periods of 3 months and 4 years, Karnataka (long. 75.5, lat. 14.7).
Precipitation deficits were not that extreme everywhere, but the stark drop of SPI mid-term in relation to poor 2018 monsoon is a common feature (Figure 8).
Figure 8: SPI time series for cumulative periods of 9 months (top, Maharashtra, long. 74.1, lat. 19.9) and 12 months (bottom, Andhra Pradesh, long. 79.5, lat. 15.5).

GDO Analytical Report
Global Drought Observatory: http://edo.jrc.ec.europa.eu/gdo 9
Drought in India – June 2019 JRC Global Drought Observatory (GDO) and ERCC Analytical Team
24/06/2019
SPI outlook The precipitation outlook at 3 months is within normal for most of India (Figure 9), with wetter than usual conditions foreseen in the central and eastern country, and to a lesser extent in western and southern regions, currently the most affected areas by drought. The 6 months ahead outlook interval is quite uncertain and does not highlight any deviation from normal precipitation, at present. The semester between June and November is paramount for the water balance in most of peninsular India and chances of relief from the drought rely entirely on this incoming period.
Figure 9: drought outlook for trimester June to August 2019, based on ECMWF S5 ensemble forecasts.
Temperature anomalies
High temperature greatly increases evaporation, thus enhancing water losses from soil and surface waters. Centre-eastern and northern India in particular were bashed by a strong and long-lasting heat wave, that accelerated further the depletion of surface waters, and indirectly that of ground waters due to higher abstraction. The heat wave started at the end of May and the peak

GDO Analytical Report
Global Drought Observatory: http://edo.jrc.ec.europa.eu/gdo 10
Drought in India – June 2019 JRC Global Drought Observatory (GDO) and ERCC Analytical Team
24/06/2019
was recorded at the beginning of June, but the situation remains concerning to date2 3 (Figure 10). The high temperatures contributed substantially to the escalation of pre-existing chronic water issues.
Figure 10: Temperature anomalies over India and surroundings up to mid-June (Source: NOAA).
fAPAR anomaly
The fraction of Absorbed Photosynthetically Active Radiation (fAPAR) represents the fraction of the solar energy absorbed by leaves. fAPAR anomalies, specifically the negative deviations from the long term average over the same period, are a good indicator of drought impacts on
2 https://erccportal.jrc.ec.europa.eu/ercmaps/ECDM_20190619_India_Heatwave.pdf 3 http://www.imd.gov.in/pages/heatwave.php

GDO Analytical Report
Global Drought Observatory: http://edo.jrc.ec.europa.eu/gdo 11
Drought in India – June 2019 JRC Global Drought Observatory (GDO) and ERCC Analytical Team
24/06/2019
vegetation. Negative anomalies of fAPAR are fairly weak but consistent with the locations most affected by the ongoing drought, over southeastern parts and centre-west of the Indian peninsula (Figure 11).
Figure 11: fAPAR anomaly in India for the ten-day interval 1st to 10th of June 2019.
Soil moisture anomaly
The aim of this indicator is to provide an assessment of the top soil water content, which is a direct measure of drought conditions, specifically the difficulty for plants to extract water from the soil.
At the end of May, soil moisture anomalies are not the most extreme, but widespread over all of Indian peninsula and beyond (Figure 12). The worsening of soil moisture can be detected progressively starting from mid of April, first in the southernmost Indian state of Tamil Nadu and then in central and western regions. For comparison, Figure 12 displays the soil moisture deficit at its peak in early November 2018, following the failed wet season. Despite the latter involving the opposite phase of the hydrological year, it is worth noting that spatial distribution of deficits is quite similar, with the addition of the southernmost parts of the peninsula, in relation to the different precipitation pattern recorded. Figure 13 shows the time series for three selected administrative areas.

GDO Analytical Report
Global Drought Observatory: http://edo.jrc.ec.europa.eu/gdo 12
Drought in India – June 2019 JRC Global Drought Observatory (GDO) and ERCC Analytical Team
24/06/2019
Figure 12: Soil moisture anomaly over India for April 2019 (upper left), early June 2019 (upper right), mid-November 2018 (bottom left).

GDO Analytical Report
Global Drought Observatory: http://edo.jrc.ec.europa.eu/gdo 13
Drought in India – June 2019 JRC Global Drought Observatory (GDO) and ERCC Analytical Team
24/06/2019
Figure 13: Soil moisture anomaly, evolution over time in three Indian states: Tamil Nadu (top), Maharashtra (middle), Andhra Pradesh (bottom).
Reported impacts4
Most of current impacts were manifest already at the end of 2018. In addition to cyclical climatic droughts, India is affected by widespread and recurrent water scarcity problems and ground waters are depleting due to both insufficient recharge and over-abstraction. Several state or district wide drought alerts are in place, with Karnataka, Maharashtra, Tamil Nadu, Andhra Pradesh among the most hit.
GDO Analytical Report
Global Drought Observatory: http://edo.jrc.ec.europa.eu/gdo 14
Drought in India – June 2019 JRC Global Drought Observatory (GDO) and ERCC Analytical Team
24/06/2019
Internal migrations were reported from several locations, with hundreds of villages evacuated due to the lack of water over vast areas, despite the efforts to supply water with tankers5 6 7. The risk of contamination and spread of water born disease is high. Food security and prices are not at stake, thanks to abundant grain reserves8 9 10, at least where government reach is effective.
The main reservoirs levels are significantly below the ten-year average of June in the southern and western regions of India, respectively at 11% (Andhra Pradesh, Telangana, Karnataka, Kerala, Tamil Nadu) and 10% (Gujarat and Maharashtra) of total capacity11 12. Deaths related to high temperatures were reported for western India13 14, as intense heatwaves persisted over several states15. Crop output are estimated lower than usual, due to the limited sowing induced by drought in late 2018, while the figures are roughly normal for sowing in current season, in spite of dry conditions16. Both nation and statewide initiatives are ongoing to cope with the emergency as well as the chronic water stress17. The drought drives desperation among farmers and suicides plague rural communities18. In Karnataka, the drought grips especially the inner and northern parts. Migrations, mass sales of livestock and serious drinking water issues were reported last
All links below accessed on 20/06/2019 5 https://www.theguardian.com/world/2019/jun/12/indian-villages-lie-empty-as-drought-forces-thousands-to-flee 6 https://timesofindia.indiatimes.com/city/vijayawada/in-prakasam-people-desert-villages-for-a-drop-of-water/articleshow/69816972.cms 7 https://timesofindia.indiatimes.com/city/nagpur/buldhana-water-crisis-drought-times-desperate-moves/articleshow/69795318.cms 8 https://indianexpress.com/article/business/govt-drought-cover-record-stock-pulses-food-inflation-monsoon-fci-5782717/ 9 http://fci.gov.in/stocks.php?view=46 10 https://timesofindia.indiatimes.com/business/india-business/foodgrain-stock-in-fci-kept-safe-ahead-of-monsoon-paswan/articleshow/69693164.cms 11 http://www.cwc.gov.in/file/7761/download?token=BA7A5730 12 https://indianexpress.com/article/explained/water-shortage-reservoir-drought-rains-monsoon-5783524/ 13 https://www.aljazeera.com/news/2019/06/india-reels-worst-drought-decades-heat-kills-dozens-190617084139066.html 14 https://tribuneonlineng.com/219207/ 15 http://www.imd.gov.in/pages/heatwave.php 16 https://timesofindia.indiatimes.com/city/mumbai/drought-hit-maharashtra-rabi-output-falls-63/articleshow/69698898.cms 17 https://timesofindia.indiatimes.com/india/at-niti-aayog-meet-centre-states-talk-on-steps-to-tackle-rain-deficit/articleshow/69818041.cms 18 https://www.newsclick.in/over-800-farmers-committed-suicide-maharashtra-year-says-report

GDO Analytical Report
Global Drought Observatory: http://edo.jrc.ec.europa.eu/gdo 15
Drought in India – June 2019 JRC Global Drought Observatory (GDO) and ERCC Analytical Team
24/06/2019
year and continue to date19 20 21. Water reservoirs are at critical low levels too22. The state Natural Disaster Monitoring Centre provides regular updates on the situation23. In Maharashtra, the situation has worsened since late 2018, when drought emergency was already declared and has not significantly improved since. As elsewhere, farmers are abandoning their farms, despite some support for cattle fodder, also due to shortage of drinking water, which is being supplied by tankers in many villages24 25. Tensions over water distribution were reported occasionally26.
The improving or worsening of impacts will heavily depend on the incoming semester. However, a full recovery from the recurring dry spells of past few years is not in sight, especially considering the complex and severe water scarcity issues of the whole Indian peninsula.
19 https://timesofindia.indiatimes.com/city/bengaluru/migration-sale-of-cattle-start-in-drought-hit-north-karnataka/articleshow/67019210.cms 20 https://scroll.in/article/927034/with-23-of-karnataka-30-districts-declared-drought-hit-farmers-are-selling-precious-cattle 21 https://indianexpress.com/article/explained/karnataka-nearly-9-in-10-talukas-hit-by-drought-2-3rds-of-irrigation-tanks-run-dry-5779828/ 22 http://www.ksndmc.org/Uploads/RL.pdf 23 http://www.ksndmc.org/default.aspx 24 https://indianexpress.com/article/explained/simply-put-5000-dry-villages-in-maharashtra-6500-tankers-5777789/ 25 https://www.eco-business.com/news/surviving-indias-drought-people-have-stopped-expecting-a-decent-life/ 26 https://www.dw.com/en/india-heat-wave-triggers-clashes-over-water/a-49110943

GDO Analytical Report
Global Drought Observatory: http://edo.jrc.ec.europa.eu/gdo 16
Drought in India – June 2019 JRC Global Drought Observatory (GDO) and ERCC Analytical Team
24/06/2019
Figure 14: The Indian States, identified as reporting units in GDO.

GDO Analytical Report
Global Drought Observatory: http://edo.jrc.ec.europa.eu/gdo 17
Drought in India – June 2019 JRC Global Drought Observatory (GDO) and ERCC Analytical Team
24/06/2019
Distribution: for ERCC and related partners use. Authors: D. Masantei, Cammalleri C. ii, Magni D.i, de Jager A.ii
Disclaimer and Legal Notice: this report by the Joint Research Centre (JRC) is a product under constant development and may change at any time without notice. It was generated using Copernicus Emergency Management Service information (2018). The views expressed may not be regarded as an official position of the European Commission (EC) in any circumstances. National borders are purely a graphical representation, only intended to be indicative, and do not reflect the official position of the EC. Neither the EC nor any person acting on behalf of the Commission are responsible for the use that might be made of this report.
i External consultant for the European Commission (Arcadia SIT, 27029 Vigevano, Italy) ii European Commission, Joint Research Centre, Ispra (VA), Italy