gcse graphic products information drawings summer examination 2011
TRANSCRIPT

GCSE Graphic ProductsGCSE Graphic ProductsInformation DrawingsInformation Drawings
Summer Examination 2011

Representing data in graphical formRepresenting data in graphical form
How can Data be presented?
When data is collected it needs to be collated and analysed. Putting numbers into a table can be hard to understand, so it is often transferred into graphical form, either by drawing graphs or by using ICT software such as Microsoft Excel. Data can be presented in a variety of ways:Bar chartsPie chartsLine graphsPictographs.
Bar charts are a great way of showing comparisons between data visually. Bars can be presented in horizontal or vertical form, and colours can help highlight specific data. Axes need to be labeled though.

Representing data in graphical formRepresenting data in graphical form
Pie Charts are great at showing proportions within data. In this way data is converted into percentages of the total to show segments of the circle that look like a slice of pie. The total number of degrees should add up to 360, and the segments each need labelling, individually or by using a key.
Line Graphs are used to show changes in particular data. With a line graph constant data must be represented along thebottom axes, and variable data is shown along the verticalaxes.
Pictographs are similar to bar chats but use symbols instead of bars to represent the data. This makes it easy to understand as the pictures can show what the data is representing easier. It is important that the overall value remains the same however.

Signs and labelsSigns and labels
Signs
Signs are there to give instructions or warnings. The best examples of these are road sign warnings.Signs may include a symbol to help a person understand what it is all about. The use of symbols also is a method of communicating for people who might not fully understand the written language. (such as visitors from abroad)signage such be clear and eye-catching. The symbols used on signage is known as a ‘pictogram’. These pictograms can become recognisable all over the world.
Labels
Labels are attached to everything that we buy, they explain a lot about the products we buy and how to take care of it. Labels can be attached to the product directly, to packaging or in the form of leaflets put inside packaging (so they can be recycled if possible).

Signs and Labels
The most common types of labels are those found on packaged food, it is now a legal requirement to label all food (except fresh meat and vegetables) with the following information:
The name of the food The name and address of the manufacturer or seller The storage instructions including the ‘use by’ and ‘best before’ dates Preparation and cooking instructions The weight and volume of a product, sometimes represented as ‘e’ which means
‘estimated’ A list of the ingredients, starting with the largest or main ingredient A list of any special claims and warnings (contents that link to allergies) Nutritional information, such as the amount of sugar and fat per 100g
Most of these labels contain symbols helping make the label easy to understand, for example freezing and cooking.
Another type of label would be the labels found in clothes. This helps the purchaser look after them by giving washing instructions, usually as a series of symbols and written instructions.

Signs and Labels
Other important logos include the ‘kite mark’ used to show the product has passed safety standards, and the ‘CE’ mark used to show that the product can be used anywhere in the European community.
Other types of signs and labels may include barcodes.
All products carry a barcode as part of the labeling or packaging. They are used by a retailer in several ways: scanning at the point of sale helps to name, and price

Corporate IdentityCorporate Identity
What is corporate identity?Corporate identity is about making sure a brand or organisation is identifiable using visual images that are easily remembered.
Organisations use logos to help the public recognise them. These logos often give an impression of the company and the quality of service or goods provided
A logogram is a logo that uses the initials of the company to promote themselves, such as IBM.Symbols, companies use a simplified image to represent themselves, such as Apple.Logotypes refers to different typefaces to become more distinctive such as Virgin.Background imagery are pictures that organisations use to communicate information about the product or services offered to the customer such as Cadbury's milk image next to the logo.

Symbols, Ideograms and Symbols, Ideograms and pictogramspictograms
Symbols
Symbols are used to help communicate information that could be instructions or simply an aid to help people recognise something.There are 3 types of symbols:Enactive or action symbols – these show something happening, such as the road sign for pedestrian crossings, which show people crossing the road. Iconic or pictorial symbols – often called pictograms, simple images or ideograms without language often used in public spaces.Symbolic or abstract symbols – these are used to represent something, that we can recognise from the concept they are portraying, such as the Olympic rings, which are five interlocking circles that represent the 5 inhabited continents of the world.

Symbols, Ideograms and Symbols, Ideograms and pictogramspictograms
Ideograms
Ideograms are simplified pictures which relate a message to other people. This type of communication has been used since the Egyptians began to write hieroglyphics and cave dwellers began to paint on cave walls.
Pictograms
These are similar to ideograms but are usually more stylised. They use block, contrasting colours and are wordless therefore eliminating the need for people to be able to read a language in order to understand the information. They are commonly used in public spaces or on packaging.

FlowchartsFlowcharts
Flowcharts
Input – Process – Output and Feedback
Everything that is made uses a linear way or working regardless of how complicated is it to make/manufacture. Systems always have
an input and are processed into outputs.
Your coursework is also a linear process!!
FlowchartsFlowcharts
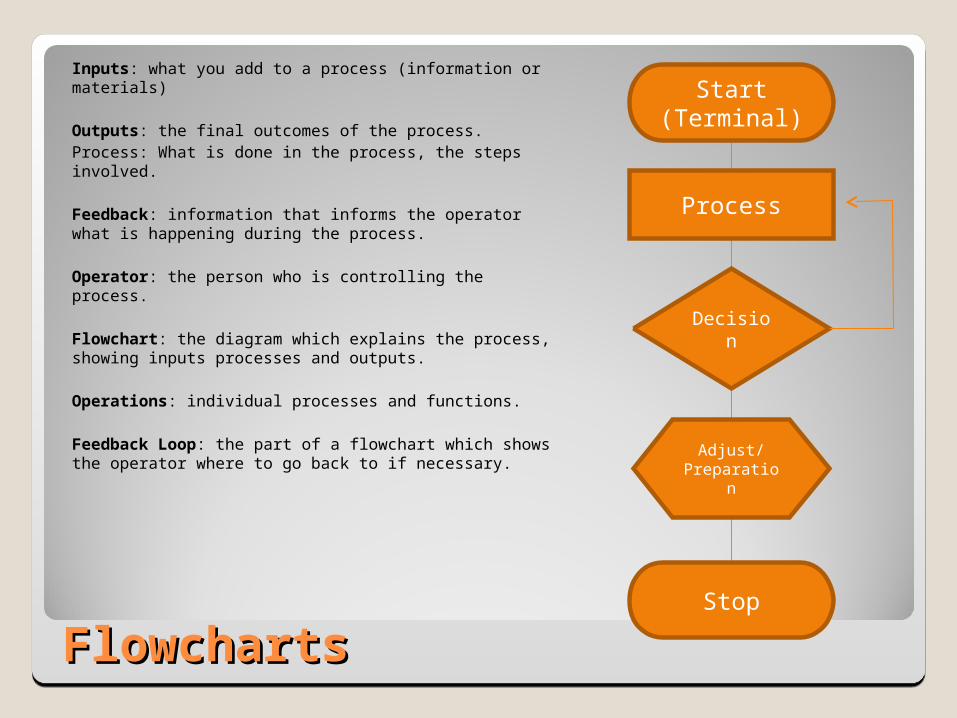
Inputs: what you add to a process (information or materials)
Outputs: the final outcomes of the process.Process: What is done in the process, the steps involved.
Feedback: information that informs the operator what is happening during the process.
Operator: the person who is controlling the process.
Flowchart: the diagram which explains the process, showing inputs processes and outputs.
Operations: individual processes and functions.
Feedback Loop: the part of a flowchart which shows the operator where to go back to if necessary.
Start(Terminal)
Process
Decision
Adjust/Preparation
Stop