gaseous mass transport in porous media through a stagnant gas
TRANSCRIPT
72 Ind. Eng. Chem. Res. 1987, 26, 72-77
xIw, xZw = as above, in water phase XAp, Xsp = adsorbed mass of AN and ST, respectively, per
unit mass of polymer, kg/kg of polymer XAW, XsW = dissolved mass of AN and ST, respectively, per
unit mass of water, kg/kg of water YA = p a / ( p A + p s ) , relative mole fraction of AN in the vapor
phase, mol of AN/mol of monomers 2 = global mass-fractional conversion ZAN = limiting conversion of AN in polymerization runs
(Figure 4) Zr, = limit mass-fractional conversion Greek Symbols u, /3,6 = liquid-liquid distribution coefficients of AN, ST, and
u’, p’ = adsorption equilibrium constants of AN and ST, mass
ylo, y20, yH2O0 = activity coefficients of AN, ST, and H20,
yIw, yZw, T~~~~ = activity coefficients of AN, ST, and H20,
7, t , u, = in Kelen-Tudos method, defined in the text Superscripts o = organic phase w = aqueous phase sat = saturation P = polymer Subscripts 1, A = acrylonitrile 2, S = styrene
H,O, respectively, mass-fraction basis, eq 5-7
basis, eq 21 and 22
respectively, in organic phase
respectively, in water phase
L = limii min, max = minimum and maximum values in Kelen-Tudos
method Registry No. (AN)(ST)(copolymer), 9003-54-7; ST, 100-42-5;
AN, 107-13-1.
Literature Cited Abbey, K. J. ACS Symp. Ser. 1981, 165, 345. Alonso, M.; Oliveres, M.; Puigjaner, L.; Recasens, F. Proceedings of
the 3rd Congress of International Information on Genie Chimique; Society of Chimie Industrielle: Paris, 1983; Vol. 1, p 47-1.
Ballard, M. J.; Napper, D. H.; Gilbert, R. G. J . Polym. Sci., Polym. Chem. Ed. 1981, 19, 934.
Comberbach, D. M.; Scharer, J. M.; Young, M.-Y. Chromatagr. Newsl. 1984, 12, 4.
Elias, H.-G. Macromolecules; Wiley: New York, 1977; Vol. 2. Fineman, M.; Ross, S. D. J . Polym. Sci. 1950, 5, 259. Gardon, J. L. Symp. Polym. React. Eng. 1972, 137. Guillot, J.; Rios, L. Makromol. Chem. 1982, 183, 1979. Guyot, A.; Guillot, J.; Pichot, C.; Rios, L. ACS Symp. Ser. 1981, 165,
Hanna, R. J. Ind. Eng. Chem. 1957, 49(2), 208. Haskell, V. C.; Settlage, P. H. Presented a t the AIChE Annual
Hatate, Y.; Nakashio, F.; Sakai, W. J . Chem. Eng. Jpn. 1971,4, 348. Hendy, B. N. Adv. Chem. Ser. 1975, 142, 115. Johnson, A. F.; Khaligh, B.; Ramsay, J. Presented at the National
Meeting of the American Chemical Society, New York, Aug 1981. Kelen, T.; Tudos, F. J . Macromol. Sci., Chem. 1975, A9, 1. Kikuta, T.; Omi, S.; Kubota, H. J . Chem. Eng. Jpn. 1976, 9, 64. Kiparissides, C.; McGregor, J. F.; Hamielec, A. E. Can. J . Chem.
Kolb, B. Applied Headspace Gas-Chromatography; Heyden: Lon-
Min, K. W.; Ray, W. H. J . Macromol. Sci., Chem. 1974, C I l , 177. Ray, W. H.; Gall, C. E. Macromolecules 1969, 2, 425. Redlich, 0.; Kister, A. T. Ind. Eng. Chem. 1948, 40, 345. Schork, F. J.; Ray, W. H. ACS Symp. Ser. 1981, 165, 505. Shaw, D. A.; Anderson, T. F. Ind. Eng. Chem. Fundam. 1983,22,79. Smith, W. V. J . Am. Chem. Sac. 1948, 70, 2177. Tirrell, M.; Gromley, K. Chem. Eng. Sci. 1981, 36, 367.
415.
Meeting Chicago, 1970.
Eng. 1980, 58, 48.
don, 1980.
Received for review April 22, 1985 Revised manuscript received January 21, 1986
Accepted March 13, 1986
Gaseous Mass Transport in Porous Media through a Stagnant Gas
Ali Una1 Department of Metallurgy and Materials Science, Imperial College of Science and Technology, London, SW7 2BP England
An analysis is presented for gas-phase mass transport in porous media through a stagnant gas. The natural flux ratio rule for isobaric conditions, which requires that the fluxes be inversely proportional to the square roots of the molecular weights, is not met in this system. Accordingly, a pressure difference develops and this superimposes viscous flow upon diffusion. Equations are derived for the flux and the pressure difference, and it is shown that even when the pressure difference is small, the contribution of viscous flow to the flux can be considerable. Flux and pressure difference measurements carried out on the transport of carbon dioxide through stagnant nitrogen in a septum of coarse pores (average pore size 2.5 pm) are in agreement, within experimental error, with those predicted by the equations and hence provide support for the theories available for describing combined transport in porous media.
Gas transport in porous media is an important factor in designing isotope separation equipment and nuclear reactors, in predicting reaction rates in catalysts and in gas and solid reactions, and in drying of porous solids. Accordingly, this field has received a considerable amount of attention over the past 2 decades, and the main prob- lems appear to have been sorted out. ”The dusty gas model” developed by Mason and Malinauskas (1983) has been instrumental in the attainment of the present level of understanding.
In transport under isobaric conditions (is., diffusion only), the fluxes of the components in a mixture are not
0S88-5SS5/81/2626-0072~0~.50/0
independent; they are related by
CNi(Mi)1/2 = 0 (1)
Nl/N, = -t(M2/M1)1”2 (2)
which, for binary mixture, becomes
This relationship, first reported by Graham (1833), has been verified experimentally, and its applicability is not restricted to the Knudsen diffusion regime; it applies also in the transition and mutual diffusion regimes. Indeed, deviations from this ratio are frequently regarded as prime evidence of surface effects in mass transport.
0 1987 American Chemical Society
Ind. Eng. Chem. Res. Vol. 26, No. 1, 1987 73
The isobaric flux ratio of eq 1 and 2 is exact, provided that the mean free path is much larger than the diameter of the pores, for then Knudsen diffusion mechanism will be operating and the diffusivity is inversely proportional to the square root of the molecular weight. In the mutual diffusion regime, the ratio holds for a different reason: the total momentum transferred to the walls, which is pro- portional to Ni and the mean molecular momentum (re- lated to the square root of the molecular weight), by all the molecular collisions must be zero for isobaric condi- tions. The ratio is approximate in this case, however, but as discussed by Mason and Malinauskas (1983), this is a good approximation. Hence, the flux ratio equations are applicable to gaseous diffusion in porous media over all pressures and pore sizes. When the ratio of fluxes is fixed externally, as is the case in chemical reactions or in drying, the system itself creates pressure gradients to satisfy the requirement of zero net momentum transfer to the walls of the pores. Gas transport in such cases then involves both diffusion and viscous flow. Flux equations for de- scribing combined transport were derived by Mason and Malinauskas (1983) and Gunn and King (1969), and the total flux was shown to be simply the sum of viscous and diffusive fluxes.
The general flux equations have been used to account for the pressure difference observed in equimolar coun- tercurrent transport (Jackson, 1977) and have provided good agreement with measurements. McGreavy and Asaeda (1982) applied them to unsteady-state diffusion in monodisperse porous solids and showed that diffusion fluxes can induce total pressure gradients. These authors used a nonisobaric model to interpret their data and showed that the general flux equations applied well. Mason and Malinauskas (1983) have reviewed the various applications of the equations.
In the present work, the transport of one gas (1) through a stagnant second gas (2) was investigated. Equations were derived for the created pressure difference and for calcu- lating the flux. These equations were tested by experi- mental measurements of the flux and the pressure dif- ference for the transport of carbon dioxide through stag- nant nitrogen in a porous septum of monodisperse pores (average pore size 2.5 pm). Reasonable agreement with theory was obtained when the values of the Knudsen diffusivity and the viscous flow parameter, determined separately from permeability measurements, were used in the calculations. The present system is of relevance to the drying of porous solids and calcination reactions and has been used in some previous work for measuring diffusiv- ities (Turkdogan et al., 1971; Unal, 1986). It also provides an effective and simple steady-state test for the general flux equations.
Theory Pressure Gradient. The flux equation for combined
diffusion and flow of a binary gas mixture may be written as
By making use of the identities P1 = X l P P2 = x,P x1 + x2 = 1
and noting that N2 = 0 for the transport of species 1 through stagnant gas 2, we obtain the following equation between the gradients of composition and pressure when
1 ,.' /
U L
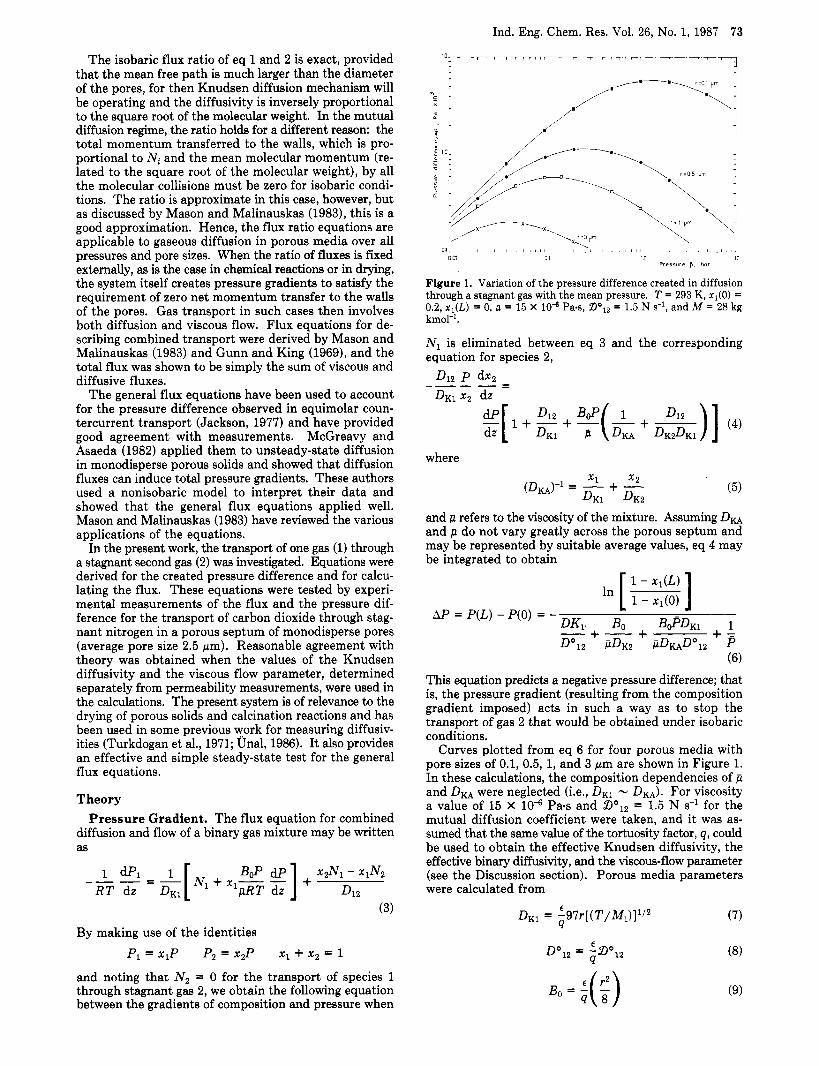
Figure 1. Variation of the pressure difference created in diffusion through a stagnant gas with the mean pressure. T = 293 K, x,(O) = 0.2, xl(L) = 0, p = 15 X 10" Paes, Bol2 = 1.5 N d, and M = 28 kg kmol-I.
N, is eliminated between eq 3 and the corresponding equation for species 2,
where x1 x2 (Dm)-l = - + -
DK1 DK2
and p refers to the viscosity of the mixture. Assuming DM and p do not vary greatly across the porous septum and may be represented by suitable average values, eq 4 may be integrated to obtain
(6)
This equation predicts a negative pressure difference; that is, the pressure gradient (resulting from the composition gradient imposed) acts in such a way as to stop the transport of gas 2 that would be obtained under isobaric conditions.
Curves plotted from eq 6 for four porous media with pore sizes of 0.1, 0.5, 1, and 3 pm are shown in Figure 1. In these calculations, the composition dependencies of p and D K A were neglected (Le., DK1 - DKA). For viscosity a value of 15 X lo4 Pas and Bol2 = 1.5 N s-l for the mutual diffusion coefficient were taken, and it was as- sumed that the same value of the tortuosity factor, q, could be used to obtain the effective Knudsen diffusivity, the effective binary diffusivity, and the viscous-flow parameter (see the Discussion section). Porous media parameters were calculated from
74 Ind. Eng. Chem. Res. Vol. 26, No. 1, 1987
It is seen that AP goes through a maximum. This occurs at
For large pores this maximum is at low pressures and, hence, is not of much industrial significance. But for small pores the maximum appears a t higher pressures and for the typical values used in the calculations, it is a t 1 bar for a pore radius of 0.134 pm. The maximum pressure difference is given by
-+ -+ - P m a x PDKZ 0’12
and in the case of very fine pores and large composition gradients it can be of the same order of magnitude as the average system pressure, as shown in Figure 1.
Flux Equation. To obtain an expression for the flux of species 1, the following equation is obtained by adding eq 3 and the corresponding equation for species 2 and noting that N2 = 0
Then, dPldz is eliminated between eq 4 and 12, and in- tegration gives N,RTL =
In the integrated flux, eq 13, and eq 6, p and DKA are average values obtained in the system and will have to be chosen carefully. When the variations of these terms across the septum are great, the differential form of eq 13 may be used and integration carried out by numerical methods. However, for gases of similar molecular weight and vis- cosity, this equation reduces to
where the term in the second brackets is the Bosanquet (1944) extrapolation expression for effective diffusivity in the intermediate diffusion regime. For !he limiting case of large pores or high pressures (i.e., B$/pDKA >> 1 and DK1 >> Dl2) the flux equation (13) simplifies to
NIRTL = DlZF In (15)
and for the other limiting case of fine pores or low pres- sures,
The limiting case flux equations (15) and (16) may now be compared with the isobaric flux equations for limiting cases, which may be obtained from eq 13 by setting dP/dz = 0 and integrating. These are
(17) NlRTL = -DK~P[x~(L) - ~1(0)1
5 0 1 LO L
01 02 U 06 08 10 20 LO 60 83 13 P o r e rodtus e r r
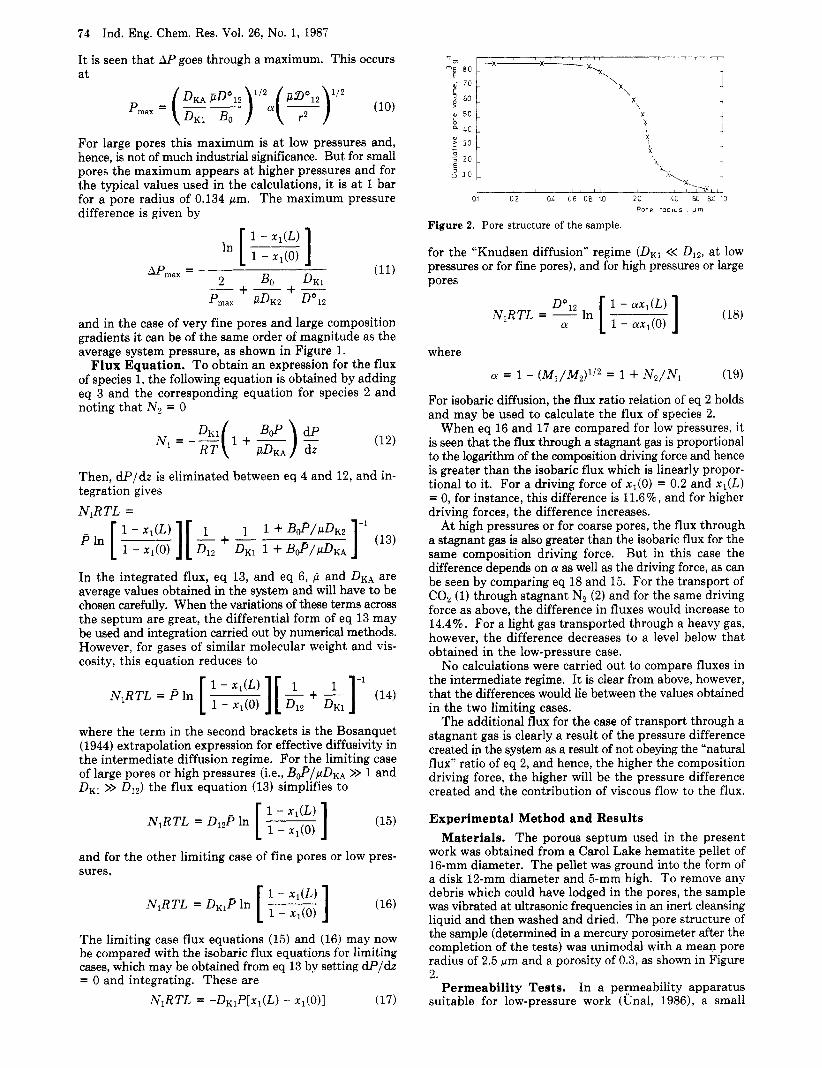
Figure 2. Pore structure of the sample.
for the “Knudsen diffusion” regime ( D K ~ << D12, at low pressures or for fine pores), and for high pressures or large pores
1 - ffXl(L) ff 1 - axl (0)
NIRTL = oo12 In [ ] (18)
where
CY = 1 - (M1/Mz)’/z = 1 + NZ/N, (19)
For isobaric diffusion, the flux ratio relation of eq 2 holds and may be used to calculate the flux of species 2.
When eq 16 and 17 are compared for low pressures, it is seen that the flux through a stagnant gas is proportional to the logarithm of the composition driving force and hence is greater than the isobaric flux which is linearly propor- tional to it. For a driving force of x, (O) = 0.2 and x,(L) = 0, for instance, this difference is 11.6%, and for higher driving forces, the difference increases.
A t high pressures or for coarse pores, the flux through a stagnant gas is also greater than the isobaric flux for the same composition driving force. But in this case the difference depends on a! as well as the driving force, as can be seen by comparing eq 18 and 15. For the transport of COz (1) through stagnant N2 (2) and for the same driving force as above, the difference in fluxes would increase to 14.4%. For a light gas transported through a heavy gas, however, the difference decreases to a level below that obtained in the low-pressure case.
No calculations were carried out to compare fluxes in the intermediate regime. It is clear from above, however, that the differences would lie between the values obtained in the two limiting cases.
The additional flux for the case of transport through a stagnant gas is clearly a result of the pressure difference created in the system as a result of not obeying the “natural flux” ratio of eq 2, and hence, the higher the composition driving force, the higher will be the pressure difference created and the contribution of viscous flow to the flux.
Experimental Method and Results Materials. The porous septum used in the present
work was obtained from a Carol Lake hematite pellet of 16-mm diameter. The pellet was ground into the form of a disk 12-mm diameter and 5-mm high. To remove any debris which could have lodged in the pores, the sample was vibrated at ultrasonic frequencies in an inert cleansing liquid and then washed and dried. The pore structure of the sample (determined in a mercury porosimeter after the completion of the tests) was unimodal with a mean pore radius of 2.5 hm and a porosity of 0.3, as shown in Figure 2.
In a permeability apparatus suitable for low-pressure work (Unal, 1986), a small
Permeability Tests.
Ind. Eng. Chem. Res. Vol. 26, No. 1, 1987 75
Table I. Permeability Coefficient ( K ) of the Sample at Various Total Pressures (P) (Gas: Ha, Paos, T = 293 K)
= 8.885 X 10“
P, Pa x io5 K , m2 s-l x P, Pa x io5 K , m2 s-l x 0.060 3.05 0.426 6.25 0.127 3.55 0.640 8.45 0.20 4.10 0.855 10.65 0.333 5.65 1.0 11.65
I I ? ? . t t ? / X I I P
LO*+ N2 I
( 0 1 I bl
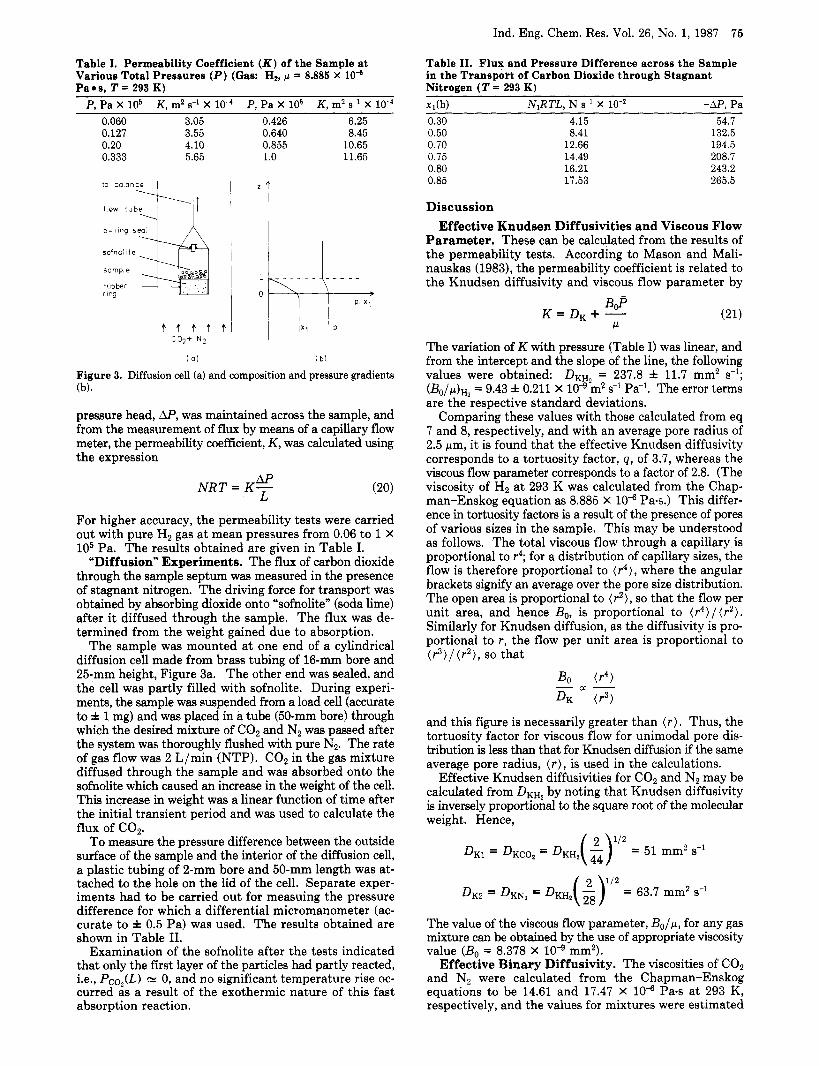
Figure 3. Diffusion cell (a) and composition and pressure gradients (b).
pressure head, AP, was maintained across the sample, and from the measurement of flux by means of a capillary flow meter, the permeability coefficient, K, was calculated using the expression
(20) AP NRT = K- L
For higher accuracy, the permeability tests were carried out with pure H2 gas at mean pressures from 0.06 to 1 X lo5 Pa. The results obtained are given in Table I.
“Diffusion” Experiments. The flux of carbon dioxide through the sample septum was measured in the presence of stagnant nitrogen. The driving force for transport was obtained by absorbing dioxide onto “sofnolite” (soda lime) after it diffused through the sample. The flux was de- termined from the weight gained due to absorption.
The sample was mounted at one end of a cylindrical diffusion cell made from brass tubing of 16-mm bore and 25-mm height, Figure 3a. The other end was sealed, and the cell was partly filled with sofnolite. During experi- ments, the sample was suspended from a load cell (accurate to f 1 mg) and was placed in a tube (50-mm bore) through which the desired mixture of C02 and N2 was passed after the system was thoroughly flushed with pure N2. The rate of gas flow was 2 L/min (NTP). C02 in the gas mixture diffused through the sample and was absorbed onto the sofnolite which caused an increase in the weight of the cell. This increase in weight was a linear function of time after the initial transient period and was used to calculate the flux of cop
To measure the pressure difference between the outside surface of the sample and the interior of the diffusion cell, a plastic tubing of 2-mm bore and 50-mm length was at- tached to the hole on the lid of the cell. Separate exper- iments had to be carried out for measuing the pressure difference for which a differential micromanometer (ac- curate to f 0.5 Pa) was used. The results obtained are shown in Table 11.
Examination of the sofnolite after the tests indicated that only the first layer of the particles had partly reacted, i.e., Pco,(L) 0, and no significant temperature rise oc- curred as a result of the exothermic nature of this fast absorption reaction.
Table 11. Flux and Pressure Difference across the Sample in the Transport of Carbon Dioxide through Stagnant Nitrogen (T = 293 K) xi(b) N,RTL. N 5-l X lo-* -AP. Pa 0.30 0.50 0.70 0.75 0.80 0.85
4.15 8.41
12.66 14.49 16.21 17.53
54.7 132.5 194.5 208.7 243.2 265.5
Discussion Effective Knudsen Diffusivities and Viscous Flow
Parameter. These can be calculated from the results of the permeability tests. According to Mason and Mali- nauskas (1983), the permeability coefficient is related to the Knudsen diffusivity and viscous flow parameter by
The variation of K with pressure (Table I) was linear, and from the intercept and the slope of the line, the following values were obtained: DKH, = 237.8 f 11.7 mm2 s-l; (BO/p)H, = 9.43 f 0.211 x lo4 m2 Pa-’. The error terms are the respective standard deviations.
Comparing these values with those calculated from eq 7 and 8, respectively, and with an average pore radius of 2.5 ym, it is found that the effective Knudsen diffusivity corresponds to a tortuosity factor, q, of 3.7, whereas the viscous flow parameter corresponds to a factor of 2.8. (The viscosity of H2 at 293 K was calculated from the Chap- man-Enskog equation as 8.885 X lo4 Pa.s.) This differ- ence in tortuosity factors is a result of the presence of pores of various sizes in the sample. This may be understood as follows. The total viscous flow through a capillary is proportional to r4; for a distribution of capillary sizes, the flow is therefore proportional to ( r 4 ) , where the angular brackets signify an average over the pore size distribution. The open area is proportional to ( r2 ) , so that the flow per unit area, and hence Bo, is proportional to ( r 4 ) / ( r 2 ) . Similarly for Knudsen diffusion, as the diffusivity is pro- portional to r , the flow per unit area is proportional to ( r 3 ) / ( r 2 ) , so that
Bo ( r 4 ) DK ( r 3 )
and this figure is necessarily greater than ( r ) . Thus, the tortuosity factor for viscous flow for unimodal pore dis- tribution is less than that for Knudsen diffusion if the same average pore radius, ( r ) , is used in the calculations.
Effective Knudsen diffusivities for C 0 2 and N2 may be calculated from DFH2 by noting that Knudsen diffusivity is inversely proportional to the square root of the molecular weight. Hence,
a- -
The value of the viscous flow parameter, Bo/?, for any gas mixture can be obtained by the use of appropriate viscosity value (Bo = 8.378 X mm2).
Effective Binary Diffusivity. The viscosities of COz and N2 were calculated from the Chapman-Enskog equations to be 14.61 and 17.47 x lo4 P a s at 293 K, respectively, and the values for mixtures were estimated
76 Ind. Eng. Chem. Res. Vol. 26, No. 1, 1987
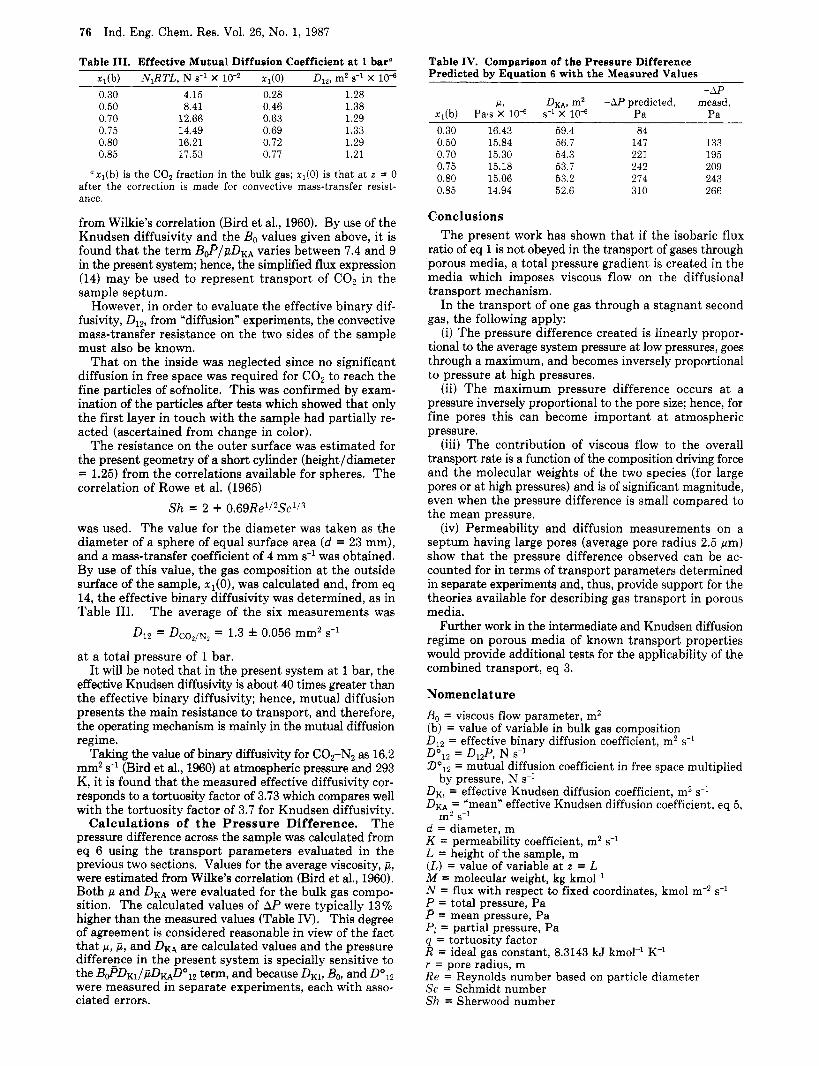
Table 111. Effective Mutual Diffusion Coefficient at 1 bar” r l (b) N,RTL, N s-l X lo‘* rl(0) m2 s-I X lo4 0.30 4.15 0.28 1.28 0.50 8.41 0.46 1.38 0.70 12.66 0.63 1.29 0.75 14.49 0.69 1.33 0.80 16.21 0.72 1.29 0.85 17.53 0.77 1.21
“r,(b) is the C 0 2 fraction in the bulk gas; nl(0) is that at z = 0 after the correction is made for convective mass-transfer resist- ance.
from Wilkie’s correlation (Bird et al., 1960). By use of the Knudsen diffusivity and the Bo values given above, it is found that the term B$/pDKA varies between 7.4 and 9 in the present system; hence, the simplified flux expression (14) may be used to represent transport of C 0 2 in the sample septum.
However, in order to evaluate the effective binary dif- fusivity, D12, from “diffusion” experiments, the convective mass-transfer resistance on the two sides of the sample must also be known.
That on the inside was neglected since no significant diffusion in free space was required for C 0 2 to reach the fine particles of sofnolite. This was confirmed by exam- ination of the particles after tests which showed that only the first layer in touch with the sample had partially re- acted (ascertained from change in color).
The resistance on the outer surface was estimated for the present geometry of a short cylinder (heightldiameter = 1.25) from the correlations available for spheres. The correlation of Rowe et al. (1965)
Sh = 2 + 0.69Re1/2Sc1/3 was used. The value for the diameter was taken as the diameter of a sphere of equal surface area (d = 23 mm), and a mass-transfer coefficient of 4 mm s-l was obtained. By use of this value, the gas composition a t the outside surface of the sample, xl(0), was calculated and, from eq 14, the effective binary diffusivity was determined, as in Table 111. The average of the six measurements was
DI2 = DCO2/N2 = 1.3 f 0.056 mm2 s-l
a t a total pressure of 1 bar. It will be noted that in the present system at 1 bar, the
effective Knudsen diffusivity is about 40 times greater than the effective binary diffusivity; hence, mutual diffusion presents the main resistance to transport, and therefore, the operating mechanism is mainly in the mutual diffusion regime.
Taking the value of binary diffusivity for C02-N2 as 16.2 mm2 s-l (Bird et al., 1960) at atmospheric pressure and 293 K, it is found that the measured effective diffusivity cor- responds to a tortuosity factor of 3.73 which compares well with the tortuosity factor of 3.7 for Knudsen diffusivity.
Calculations of the Pressure Difference. The pressure difference across the sample was calculated from eq 6 using the transport parameters evaluated in the previous two sections. Values for the average viscosity, p, were estimated from Wilke’s correlation (Bird et al., 1960). Both p and DKA were evaluated for the bulk gas compo- sition. The calculated values of AP were typically 13% higher than the measured values (Table IV). This degree of agreement is considered reasonable in view of the fact that p, p, and DKA are calculated values and the pressure differe_nce in the present system is specially sensitive to the B $ ‘ D K ~ / ~ D ~ D ~ ~ ~ term, and because DK1, Bo, and DO,, were measured in separate experiments, each with asso- ciated errors.
Table IV. Comparison of the Pressure Difference Predicted by Eauation 6 with the Measured Values
-AP P , D K A , m2 -A€’ predicted, measd,
q ( b ) Pa.9 x lo4 s-l X IO4 Pa Pa 0.30 16.43 59.4 84 0.50 15.84 56.7 147 133 0.70 15.30 54.3 221 195 0.75 15.18 53.7 242 209 0.80 15.06 53.2 274 243 0.85 14.94 52.6 310 266
Conclusions The present work has shown that if the isobaric flux
ratio of eq 1 is not obeyed in the transport of gases through porous media, a total pressure gradient is created in the media which imposes viscous flow on the diffusional transport mechanism.
In the transport of one gas through a stagnant second gas, the following apply:
(i) The pressure difference created is linearly propor- tional to the average system pressure at low pressures, goes through a maximum, and becomes inversely proportional to pressure at high pressures.
(ii) The maximum pressure difference occurs at a pressure inversely proportional to the pore size; hence, for fine pores this can become important at atmospheric pressure.
(iii) The contribution of viscous flow to the overall transport rate is a function of the composition driving force and the molecular weights of the two species (for large pores or at high pressures) and is of significant magnitude, even when the pressure difference is small compared to the mean pressure.
(iv) Permeability and diffusion measurements on a septum having large pores (average pore radius 2.5 pm) show that the pressure difference observed can be ac- counted for in terms of transport parameters determined in separate experiments and, thus, provide support for the theories available for describing gas transport in porous media.
Further work in the intermediate and Knudsen diffusion regime on porous media of known transport properties would provide additional tests for the applicability of the combined transport, eq 3.
Nomenclature Bo = viscous flow parameter, m2 (b) = value of variable in bulk gas composition D12 = effective binary diffusion coefficient, m2 s-l
Dol2 = mutual diffusion coefficient in free space multiplied
DKI = effective Knudsen diffusion coefficient, m2 s-l DKA = ”mean” effective Knudsen diffusion coefficient, eq 5 ,
ci = diameter, m K = permeability coefficient, m2 sml L = height of the sample, m ( L ) = value of variable at z = L M = molecular weight, kg kmol-’ N = flux with respect to fixed coordinates, kmol m-2 s-’ P = total pressure, Pa P = mean pressure, Pa PI = partial pressure, Pa q = tortuosity factor R = ideal gas constant, 8.3143 kJ kmol-’ K-’ r = pore radius, m Re = Reynolds number based on particle diameter Sc = Schmidt number Sh = Sherwood number
0 ’ 1 2 = D12P, N s - ~
by pressure, N s-l
m2 s-*
Ind. Eng. Chem. Res. 1987,26, 77-81 77
T = temperature, K r = mole fraction z = distance (0) = value of variable at z = 0 Greek Symbols a = defined by eq 19 p = viscosity of pure gas, Pa-s p = mean viscosity of a gas mixture, Paes Subscripts i , 1, 2 = species transported through a porous medium
Literature Cited
Bird, R. B.; Stewart, W. E.; Lightfoot, E. N. Transport Phenomena;
Bosanquet, C. H.; British, T. A. Report BR-507, 1944. Wiley International: New York, 1960; pp 22, 511.
Graham, T. Philos. Mag. 1833,2, 175, 269, 351. Gunn, R. D.; King, C. J. AIChE J. 1969, 15, 507. Jackson, R. Transport in Porous Catalysts; Elsevier: Amsterdam,
1977; p 50. Mason, E. A,; Malinauskas, A. P. Gas Transport in Porous Media:
The Dusty Gas Model; Elsevier: Amsterdam, 1983; pp 21, 51,92. McGreavy, C.; Asaeda, M. Presented at the 184th National Meeting
of the American Chemical Society, Seattle, 1982, ORGN 473. Olsson, R. G.; McKewan, W. M. Trans. Am. Inst. Min., Metall. Pet.
Eng. 1966, 236, 1518. Olsson, R. G.; McKewan, W. M. Metall. Trans. 1970, 1 , 1507. Rowe, P. N.; Claxton, K. T.; Lewis, J. B. Trans. Inst. Chem. Eng.
Turkdogan, E. T.; Olsson, R. G.; Vintners, J. V. Metall. Trans. 1971,
Unal, A. Trans.-Inst. Min. Metall., Sect. C , in press.
1965, 43, 14.
2, 3189.
Received for review May 7 , 1985 Accepted April 17, 1986
Minimum Agitator Speeds for Complete Liquid-Liquid Dispersion
A. H. P. Skel land* and George G. Ramsay School of Chemical Engineering, T h e Georgia Insti tute of Technology, Atlanta, Georgia 30332
Data from three different sources have been pooled to obtain an empirical correlation of the minimum agitator speed needed to obtain complete liquid-liquid dispersion in baffled vessels. The variables include 5 common types of impellers, 2 generating axial flow and 3 radial flow, in 4 locations, fluid properties in 11 systems, tank diameter, liquid height, and volume fraction of the disperse phase. Observations from 481 runs were correlated with an average absolute deviation of 12.7% by the expression (NFJmin = C2( T/D)2*~0.106(NGaN~o)-0.084 where C and a are tabulated according to the impeller type, location, and-in some cases-the ratio H/ T. Scale-up relationships are developed from the above expression.
Liquid-liquid dispersion in agitated vessels finds ex- tensive application in mixer-settler design in extraction operations and in emulsion polymerization processes. In such work, it is necessary to ensure that the agitator speed is high enough to achieve complete dispersion of one liquid in the other. Skelland and Seksaria (1978) showed that, in some cases, impeller speeds of lo00 rpm are insufficient to ensure complete dispersion.
The few previous studies began with Nagata's (1950) work; he used an unbaffled, flat-bottomed vessel, with a centrally mounted, four-bladed flat-blade turbine agitator, with TID of 3 and a blade width of 0.06T. He obtained the empirical expression
and he reported that Nmin is independent of interfacial tension.
Van Heuven and Beek (1971) studied dispersion with a six-bladed disk turbine in a baffled vessel. From a combination of theory and experiment, they obtained
where DIT was constant at 0.333. The study by Skelland and Seksaria (1978) included a
variety of impellers-propellers, pitched-blade turbines, flabblade turbines, and curved-blade turbines-in a baffled vessel. They found
N min . = C ~ a O ~ L c ' / S ~ d - 1 / 9 u 0 . 3 A p 0 . 2 5 (3)
where H I T = 1 and 4 = 0.5; T did not vary. The constants Co and cyo were functions of the impeller type and location.
A related phenomenon is the minimum impeller speed required to suspend solid particles off the bottom of the vessel in an agitated solid-liquid suspension. Zwietering (1958) used turbines, paddles, propellers, and vaned disks to suspend sand and sodium chloride particles in liquids in baffled vessels. He presents
g0 .45~p0 .45Fc0 .1g ,0 .2 ( 100R)O.13
g0.85 0.55 (4) Nmin = Cr( g) P c
Pavlushenko et al. (1957) used three-bladed square-pitch propellers for sand and iron suspensions to obtain
g0 ,6pd0 .8g 0.4
Nmin = 0.105( g) g 0 . 6 Pc 0.6 F c 0.2 (5) P
Differences in the exponents on a given variable in eq 4 and 5 are noteworthy, including the conflicting direc- tional effect of gC indicated by the two expressions.
Experimental Apparatus and Procedure Fluids Used. Deionized water formed one phase in all
runs; the other phase consisted of one of the following presaturated with water in all cases: ethyl acetate, benz- aldehyde, chlorobenzene, and carbon tetrachloride.
Fluid properties appear in Table I. Interfacial tensions for ethyl acetate and benzaldehyde are from Skelland and Seksaria (1978), chlorobenzene from Moeti (1984), and carbon tetrachloride from the International Critical Tables (1928).
0888-5885/87/2626-0077$01.50/0 0 1987 American Chemical Society