gas chromatography-mass spectrometry: applicationscorresponding author: sahil kataria, email:...
TRANSCRIPT
*Corresponding Author: Sahil Kataria, Email: [email protected]
ISSN 0976 – 3333
REVIEW ARTICLE
Available Online at www.ijpba.info
International Journal of Pharmaceutical & Biological Archives 2011; 2(6):1544-1560
Gas Chromatography-Mass Spectrometry: Applications
Kataria Sahil*1, Beniwal Prashant1, Middha Akanksha1, Sandhu Premjeet1, Rathore Devashish2
1Seth G. L. Bihani S.D. College of Technical Education, Institute of Pharmaceutical Sciences and Drug Research,
Sri Ganganagar, Rajasthan, India 2
Gas chromatography–mass spectrometry (GC-MS) is a method that combines the features of
School of Pharmacy, Devi Ahilya Vishvavidyalya, Khandwa road, Indore, Madhya Pradesh, India
Received 23 Aug 2011; Revised 25 Oct 2011; Accepted 29 Oct 2011 ABSTRACT
gas-liquid chromatography and mass spectrometry to identify different substances within a test sample. Applications of GC-MS include drug detection, fire investigation, environmental analysis, explosives investigation, and identification of unknown samples. GC-MS can also be used in airport security to detect substances in luggage or on human beings. Additionally, it can identify trace elements in materials that were previously thought to have disintegrated beyond identification. GC-MS has been widely heralded as a "gold standard" for forensic substance identification because it is used to perform a specific test. A specific test positively identifies the actual presence of a particular substance in a given sample. A non-specific test merely indicates that a substance falls into a category of substances. Although a non-specific test could statistically suggest the identity of the substance, this could lead to false positive identification . Key Words: Gas chromatography–mass spectrometry, Environmental analysis, Trace elements Identification, Forensic substance identification Hyphenated Techniques in Analytical World A hyphenated technique in analytical chemistry is ‘the marriage of two separate analytical techniques via appropriate interfaces, usually with backup of a computer tying everything together’. This term was first coined by Hirschfield although idea itself began with coupling of GC & MS in the early 1970.[9]
The use of a mass spectrometer as the detector in gas chromatography was developed during the 1950s by Roland Gohlke and
History
Fred McLafferty These sensitive devices were bulky, fragile, and originally limited to laboratory settings. The development of affordable and miniaturized computers has helped in the simplification of the use of this instrument, as well as allowed great improvements in the amount of time it takes to analyze a sample. In 1996 the top-of-the-line high-speed GC-MS units completed analysis of fire accelerants in less than 90 seconds, whereas first-generation GC-MS would have required at least 16 minutes. This has led to their widespread adoption in a number of fields
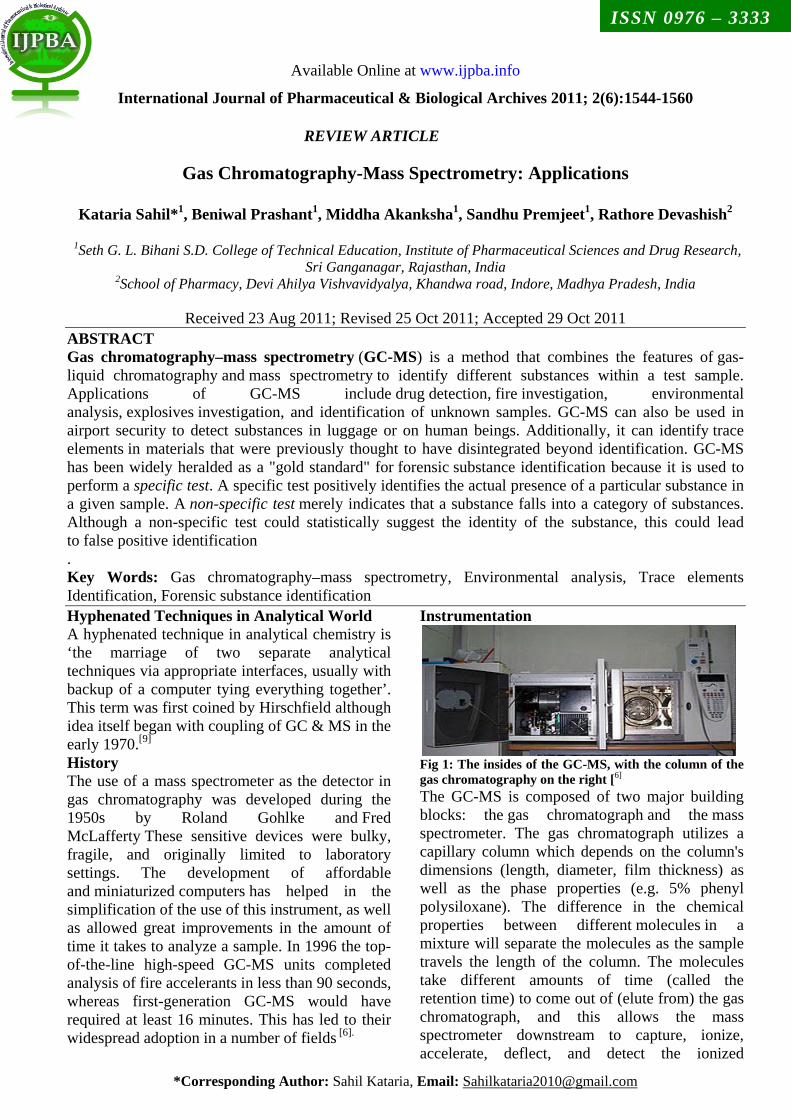
Instrumentation
[6].
Fig 1: The insides of the GC-MS, with the column of the gas chromatography on the right [The GC-MS is composed of two major building blocks: the
6]
gas chromatograph and the mass spectrometer. The gas chromatograph utilizes a capillary column which depends on the column's dimensions (length, diameter, film thickness) as well as the phase properties (e.g. 5% phenyl polysiloxane). The difference in the chemical properties between different molecules in a mixture will separate the molecules as the sample travels the length of the column. The molecules take different amounts of time (called the retention time) to come out of (elute from) the gas chromatograph, and this allows the mass spectrometer downstream to capture, ionize, accelerate, deflect, and detect the ionized
Sahil Kataria et al. / Gas Chromatography-Mass Spectrometry: Applications
1545 © 2010, IJPBA. All Rights Reserved.
molecules separately. The mass spectrometer does this by breaking each molecule into ionized fragments and detecting these fragments using their mass to charge ratio.
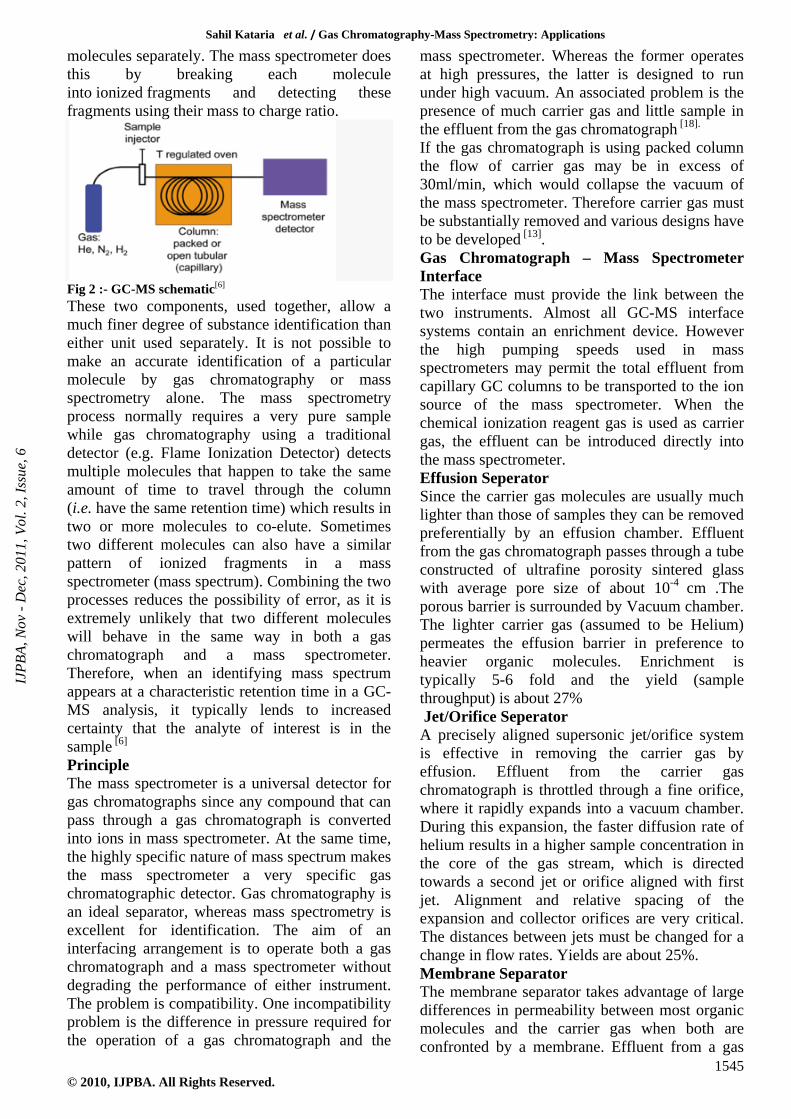
Fig 2 :- GC-MS schematicThese two components, used together, allow a much finer degree of substance identification than either unit used separately. It is not possible to make an accurate identification of a particular molecule by gas chromatography or mass spectrometry alone. The mass spectrometry process normally requires a very pure sample while gas chromatography using a traditional detector (e.g. Flame Ionization Detector) detects multiple molecules that happen to take the same amount of time to travel through the column (i.e. have the same retention time) which results in two or more molecules to co-elute. Sometimes two different molecules can also have a similar pattern of ionized fragments in a mass spectrometer (mass spectrum). Combining the two processes reduces the possibility of error, as it is extremely unlikely that two different molecules will behave in the same way in both a gas chromatograph and a mass spectrometer. Therefore, when an identifying mass spectrum appears at a characteristic retention time in a GC-MS analysis, it typically lends to increased certainty that the analyte of interest is in the sample
[6]
The mass spectrometer is a universal detector for gas chromatographs since any compound that can pass through a gas chromatograph is converted into ions in mass spectrometer. At the same time, the highly specific nature of mass spectrum makes the mass spectrometer a very specific gas chromatographic detector. Gas chromatography is an ideal separator, whereas mass spectrometry is excellent for identification. The aim of an interfacing arrangement is to operate both a gas chromatograph and a mass spectrometer without degrading the performance of either instrument. The problem is compatibility. One incompatibility problem is the difference in pressure required for the operation of a gas chromatograph and the
mass spectrometer. Whereas the former operates at high pressures, the latter is designed to run under high vacuum. An associated problem is the presence of much carrier gas and little sample in the effluent from the gas chromatograph
[6] Principle
[18].
If the gas chromatograph is using packed column the flow of carrier gas may be in excess of 30ml/min, which would collapse the vacuum of the mass spectrometer. Therefore carrier gas must be substantially removed and various designs have to be developed [13]. Gas Chromatograph – Mass Spectrometer Interface The interface must provide the link between the two instruments. Almost all GC-MS interface systems contain an enrichment device. However the high pumping speeds used in mass spectrometers may permit the total effluent from capillary GC columns to be transported to the ion source of the mass spectrometer. When the chemical ionization reagent gas is used as carrier gas, the effluent can be introduced directly into the mass spectrometer. Effusion Seperator Since the carrier gas molecules are usually much lighter than those of samples they can be removed preferentially by an effusion chamber. Effluent from the gas chromatograph passes through a tube constructed of ultrafine porosity sintered glass with average pore size of about 10-4
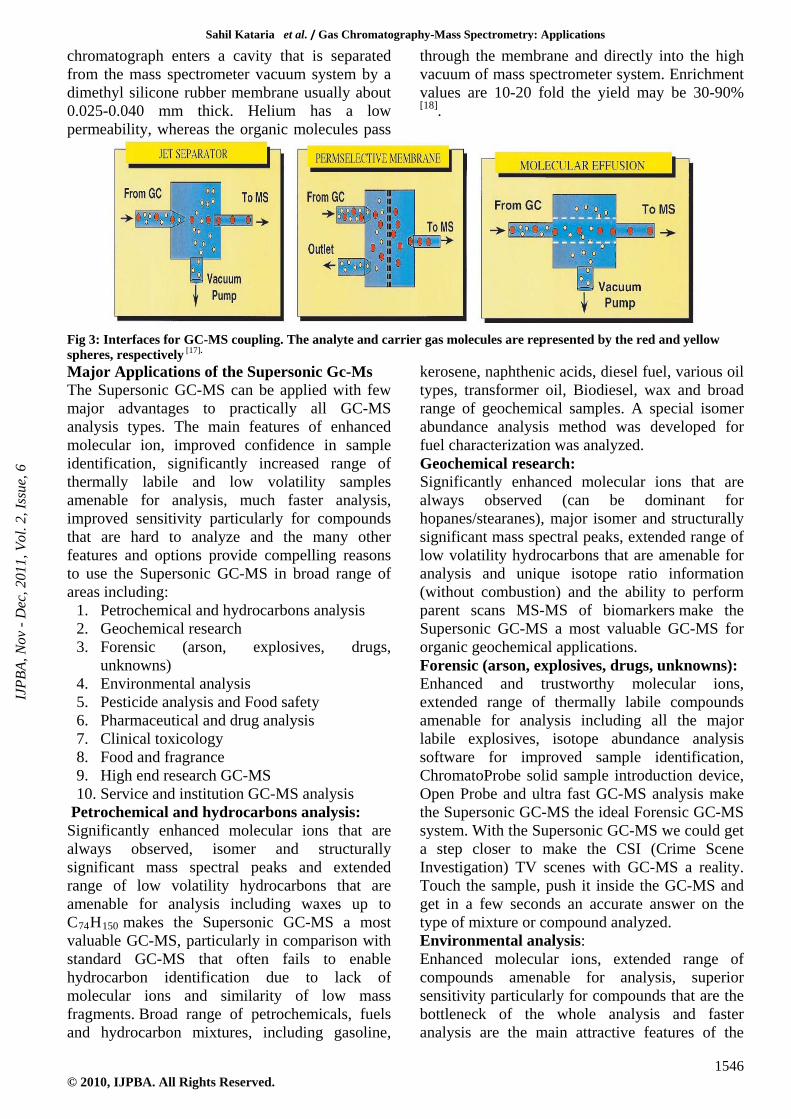
The membrane separator takes advantage of large differences in permeability between most organic molecules and the carrier gas when both are confronted by a membrane. Effluent from a gas
cm .The porous barrier is surrounded by Vacuum chamber. The lighter carrier gas (assumed to be Helium) permeates the effusion barrier in preference to heavier organic molecules. Enrichment is typically 5-6 fold and the yield (sample throughput) is about 27% Jet/Orifice Seperator A precisely aligned supersonic jet/orifice system is effective in removing the carrier gas by effusion. Effluent from the carrier gas chromatograph is throttled through a fine orifice, where it rapidly expands into a vacuum chamber. During this expansion, the faster diffusion rate of helium results in a higher sample concentration in the core of the gas stream, which is directed towards a second jet or orifice aligned with first jet. Alignment and relative spacing of the expansion and collector orifices are very critical. The distances between jets must be changed for a change in flow rates. Yields are about 25%. Membrane Separator
IJPB
A, N
ov -
Dec
, 201
1, V
ol. 2
, Iss
ue, 6
Sahil Kataria et al. / Gas Chromatography-Mass Spectrometry: Applications
1546 © 2010, IJPBA. All Rights Reserved.
chromatograph enters a cavity that is separated from the mass spectrometer vacuum system by a dimethyl silicone rubber membrane usually about 0.025-0.040 mm thick. Helium has a low permeability, whereas the organic molecules pass
through the membrane and directly into the high vacuum of mass spectrometer system. Enrichment values are 10-20 fold the yield may be 30-90% [18]
.
Fig 3: Interfaces for GC-MS coupling. The analyte and carrier gas molecules are represented by the red and yellow spheres, respectively
The Supersonic GC-MS can be applied with few major advantages to practically all GC-MS analysis types. The main features of enhanced molecular ion, improved confidence in sample identification, significantly increased range of thermally labile and low volatility samples amenable for analysis, much faster analysis, improved sensitivity particularly for compounds that are hard to analyze and the many other features and options provide compelling reasons to use the Supersonic GC-MS in broad range of areas including:
[17]. Major Applications of the Supersonic Gc-Ms
1. Petrochemical and hydrocarbons analysis 2. Geochemical research 3. Forensic (arson, explosives, drugs,
unknowns) 4. Environmental analysis 5. Pesticide analysis and Food safety 6. Pharmaceutical and drug analysis 7. Clinical toxicology 8. Food and fragrance 9. High end research GC-MS 10. Service and institution GC-MS analysis
Petrochemical and hydrocarbons analysis: Significantly enhanced molecular ions that are always observed, isomer and structurally significant mass spectral peaks and extended range of low volatility hydrocarbons that are amenable for analysis including waxes up to C74H150
Enhanced molecular ions, extended range of compounds amenable for analysis, superior sensitivity particularly for compounds that are the bottleneck of the whole analysis and faster analysis are the main attractive features of the
makes the Supersonic GC-MS a most valuable GC-MS, particularly in comparison with standard GC-MS that often fails to enable hydrocarbon identification due to lack of molecular ions and similarity of low mass fragments. Broad range of petrochemicals, fuels and hydrocarbon mixtures, including gasoline,
kerosene, naphthenic acids, diesel fuel, various oil types, transformer oil, Biodiesel, wax and broad range of geochemical samples. A special isomer abundance analysis method was developed for fuel characterization was analyzed. Geochemical research: Significantly enhanced molecular ions that are always observed (can be dominant for hopanes/stearanes), major isomer and structurally significant mass spectral peaks, extended range of low volatility hydrocarbons that are amenable for analysis and unique isotope ratio information (without combustion) and the ability to perform parent scans MS-MS of biomarkers make the Supersonic GC-MS a most valuable GC-MS for organic geochemical applications. Forensic (arson, explosives, drugs, unknowns): Enhanced and trustworthy molecular ions, extended range of thermally labile compounds amenable for analysis including all the major labile explosives, isotope abundance analysis software for improved sample identification, ChromatoProbe solid sample introduction device, Open Probe and ultra fast GC-MS analysis make the Supersonic GC-MS the ideal Forensic GC-MS system. With the Supersonic GC-MS we could get a step closer to make the CSI (Crime Scene Investigation) TV scenes with GC-MS a reality. Touch the sample, push it inside the GC-MS and get in a few seconds an accurate answer on the type of mixture or compound analyzed. Environmental analysis:
IJPB
A, N
ov -
Dec
, 201
1, V
ol. 2
, Iss
ue, 6

Sahil Kataria et al. / Gas Chromatography-Mass Spectrometry: Applications
1547 © 2010, IJPBA. All Rights Reserved.
Supersonic GC-MS. Examples include much lower LOD for phthalates such as dinonylphthalate and didecylphthalate in the method analysis or much larger PAHs amenable for analysis such as decacyclene, ovalene and even C60,
Enhanced molecular ions, extended range of compounds amenable for analysis, superior sensitivity for those pesticides that are the bottleneck of the whole analysis and faster analysis are the main attractive features of the Supersonic GC-MS. The enhanced molecular ion and lack of ion source peak tailing and degradation can further serve for improved sensitivity in MS-MS. Isotope abundance analysis provides greater confidence level in the pesticide identification. Pulsed flow modulation GCxGC-MS can further improve pesticide analysis via the reduction of matrix interferences. The ability to analyze the full range of carbamate pesticides and many of the LC-MS pesticides makes the Supersonic GC-MS the ideal system to provide confirmatory pesticide identification to supplement and complement LC-MS and further analyze those few pesticides that are difficult by both LC-MS and GC-MS Pharmaceutical and drug analysis: The supersonic GC-MS is the only GC-MS that can analyze medium size drugs that are not amenable for standard GC-MS analysis including Reserpine Itraconazole, underivatized steroids etc. In addition, unlike LC-MS the Supersonic GC-MS provides quantitative information on drug synthesis yield and on the abundance of drug contamination, it has no ion suppression effects and the analysis are fast, under 8 min analysis cycle time. Clinical toxicology: Enhanced molecular ions, extended range of compounds amenable for analysis, superior sensitivity for compounds that are the bottleneck of the whole analysis and faster analysis are the main attractive features of the Supersonic GC-MS for clinical toxicology. In addition, the Supersonic GC-MS can serve to confirm (or reject) LC-MS identifications. Food and fragrance:
degradation free analysis of carbamazepine and its metabolites in treated sewage water and steroid analysis without derivatization. Pesticide analysis and food safety:
Enhanced molecular ions, isotope abundance analysis software for improved unknown sample identification, unique isomer mass spectral effects and compatibility with pulsed flow modulation
GCxGC-MS make the Supersonic GC-MS the ideal GC-MS for the food and fragrance industry as an information generation machine. High end research GC-MS: As a unique and powerful new technology the Supersonic GC-MS provides a rare opportunity to perform GC-MS related research and obtain unique, insightful and publishable results. The Supersonic GC-MS can be used in all types of research and enable to lead the way and obtain cutting edge new results. Service and institution GC-MS: Enhanced and trustworthy molecular ions, significant structural and isomer mass spectral effects, isotope abundance analysis software for improved sample identification and for the provision of elemental formulas (as required for journal publications) and extended range of low volatility and thermally labile compounds amenable for analysis are all attractive features of the Supersonic GC-MS for service and institution GC-MS [10]
GC/MS in Forensic Toxicology .
FORENSIC toxicology is the branch of forensic science that seeks to identify and quantify the presence of toxins (poisons) primarily in the human body. Samples examined for toxicological purposes can include blood, urine, various other biological fluids, hair, nails and other tissues. Toxicological investigations are typically carried out in forensic laboratories under the jurisdiction of government agencies, or in private laboratories certified for such practices. Agents screened in a toxicological assay can include carbon monoxide, cyanide, heavy metals, ethanol (grain alcohol), methanol (wood alcohol), huffing agents (aerosol propellants), drugs of abuse and other controlled substances such as prescription drugs, as well as a host of poisonous industrial and household chemicals. A negative result eliminates the need for further testing while a positive result must be confirmed by a more rigorous analysis based on a chemical principle different from the initial screen. The confirmation requirement helps eliminate false positives resulting from defects in test materials or the possibility that a non-target substance has produced a positive response [2]
An accurate, simple, and rapid method for analyzing urine for methamphetamine and its principal metabolite, amphetamine, using heated headspace SPME and capillary GC/MS The investigators seal a 1mL urine sample in a 12mL vial, add internal standard (5μg pentadeuterated
. Drugs of Abuse like Amphetamines in Urine:
IJPB
A, N
ov -
Dec
, 201
1, V
ol. 2
, Iss
ue, 6

Sahil Kataria et al. / Gas Chromatography-Mass Spectrometry: Applications
1548 © 2010, IJPBA. All Rights Reserved.
methamphetamine, prepared according to reference) and 0.7g potassium carbonate, and heat the sample at 80°C for 20 minutes on a block heater. They then expose an SPME fiber coated with 100μm of PDMS to the headspace above the sample for 5 minutes, then introduce the fiber into the injection port of the chromatograph. In a system equipped with mass spectrometry/chemical ionization selected ion monitoring (GC-MS/CI-SIM), this analysis was 20 times as sensitive as a method incorporating conventional headspace extraction [14]. The free amines are extracted with an organic solvent and sample is analysed by gas chromatography. If retention time of the suspected stimulant coincides with the known compound the sample is analysed by GC/MS to confirm the identityThe most significant limitation of GC/MS applications is the need to convert all compounds to a vaporisable form. LC/MS has no such requirement since samples are run in a liquid medium. On the other hand, GC/MS produces a very consistent ionization that makes possible very large electronic libraries of verified standards for sample matching and confirmation of identity. Accordingly, one can see that these techniques are likely to be deployed in tandem, so as to extend the range of analytical applications in forensic toxicology
[7].
[2]
Geochemical analysis, and more specially chromatography, is concerned with samples derived from two different sources: those of relatively recent origin, related to environmental problems; and those of a much greater geological age, related to fossil fuel exploration and exploitation. The chromatographic techniques utilized to analyse and characterize such samples are virtually identical regardless of the age and origin of the sample. The extracts from geochemical samples, whether they are rocks, soils, crude oil spills, contaminated wildlife or spills of refined products, are very complex mixtures of a wide variety of organic compounds. Compounds derived from fossil fuels typically will be complex mixtures of hydrocarbons, and the environmental samples from more recent sediments probably will contain a variety of other
compounds such as chlorinated compounds, pesticides While GC can provide a great deal of information that is of interest and useful from a geochemical perspective, it should also be noted that in most cases GC only provides information on the distribution of the major components in the sample, and for the most part these are generally dominated by the n-alkanes. The more useful compounds are the more complex molecules, or biomarkers, which are typically present in relatively low concentrations and which require the use of GC-MS and more specifically single ion or multiple ion detection (MID) in order to determine their distributions. While there are many classes of biomarkers that are commonly used for correlation and other purposes, compounds such as the steranes and terpanes will typically provide the greatest amounts of useful information for both an environmental and exploration context. To illustrate the utility of the biomaker fingerprints, the gas chromatograms of three oils are shown in Fig 4.
. Geochemical Analysis: Introduction
Fig 4: Gas chromatograms of three oils From the gas chromatograms alone it is virtually impossible to determine what relationship, if any, exists between these samples. In other words, are they from the same source rock or can they be correlated with each other? The effects of biodegradation are clearly evident in sample B since all of the n-alkanes have been removed, making it appear even more significantly different from the other two samples. Detailed analyses of the same samples by GC-MS and MID using the characteristic ions for the sterane and terpane biomarkers at m/z 217 and 191, respectively, produces the additional data shown in Fig 5.
IJPB
A, N
ov -
Dec
, 201
1, V
ol. 2
, Iss
ue, 6

Sahil Kataria et al. / Gas Chromatography-Mass Spectrometry: Applications
1549 © 2010, IJPBA. All Rights Reserved.
Fig 5: Chromatograph of Oils
On the basis of the chromatograms shown in Fig 5, samples B and C are in all probability related to each other. It is not necessary to identify each component, rather one should think of the mass chromatograms as fingerprints. If two samples are derived from the same source, then their fingerprints should be the same, or at least very similar; samples from different sources will be different from each other. Hence when the fingerprint for sample A is compared with those for B and C in Figure 5, there are a number of significant differences between these samples that permit one to conclude that A is from a different source than B or C. The biomarker fingerprints obtained in this way are very specific for a variety of applications, in addition to this type of correlation. The presence of individual compounds, for example oleanane and gammacerane, can provide information on the presence of specific types of source materials or the nature of themdepositional environment. To illustrate this type of application, Fig 6 shows the m/z 191 and 217 mass chromatograms of oil that is derived from source material dominated by higher plant or terrestrial source material. This evidence is contained in the fact that the predominant component in the m/z 191 mass
chromatogram is the terpane called 18_(H)-oleanane. It has been established that this compound has its precursor in higher plant material and hence the presence of this compound in oil will indicate that the sample is derived from such material.
Fig 6: Mass chromatograph of different Components of oil In support of such evidence is the fact that the sterane chromatogram is dominated by the C29 steranes. For oils of this nature it has been clearly established that the C29 steranes are also associated with higher plant source materials. In this manner, pieces of evidence can be put together that in many cases will provide a very clear indication as to the origin of the material being analysed.
Fig 7: Chromatograph to determine presence of certain compounds
The presence of another very specific compound, gammacerane, can also be very clearly seen in the m/z 191 chromatogram. This compound is a very specific indicator of depositional environments of enhanced salinity. Recent attempts have been
made to relate the presence of certain compounds, for example, dinosterane to the age of the source rock from which the sample was generated. Specific ratios of different sterane isomers or terpane isomers are also used extensively for
IJPB
A, N
ov -
Dec
, 201
1, V
ol. 2
, Iss
ue, 6
Sahil Kataria et al. / Gas Chromatography-Mass Spectrometry: Applications
1550 © 2010, IJPBA. All Rights Reserved.
determining the relative maturity of oils or source rocks. The isotopic composition of individual compounds is also of importance from an environmental viewpoint. For example, analysis of whole oil, or the saturate fraction of whole oil, allows the ready determination of δ13
C values of
the n-alkanes and themajor isoprenoids, pristane and phytane. These values can be used for correlation purposes, to distinguish oils from different sources, to correlate oil spills with their suspected sources, or to determine the source of hydrocarbons that have contaminated wildlife.
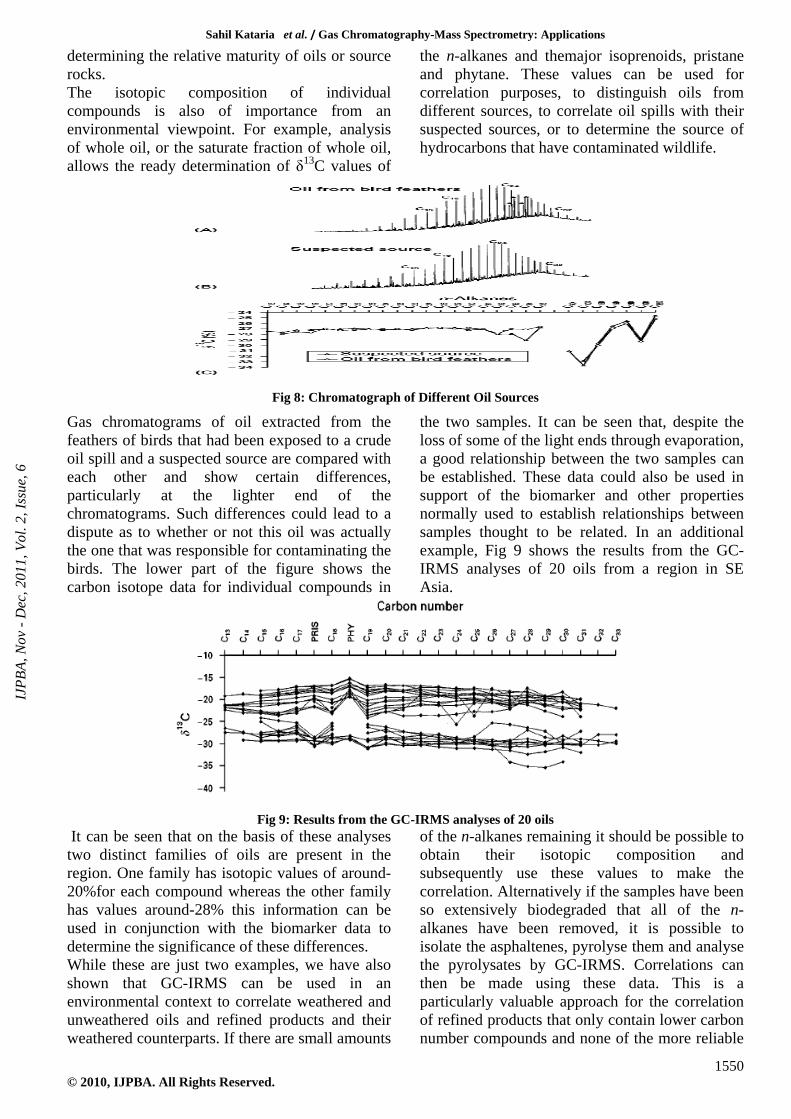
Fig 8: Chromatograph of Different Oil Sources
Gas chromatograms of oil extracted from the feathers of birds that had been exposed to a crude oil spill and a suspected source are compared with each other and show certain differences, particularly at the lighter end of the chromatograms. Such differences could lead to a dispute as to whether or not this oil was actually the one that was responsible for contaminating the birds. The lower part of the figure shows the carbon isotope data for individual compounds in
the two samples. It can be seen that, despite the loss of some of the light ends through evaporation, a good relationship between the two samples can be established. These data could also be used in support of the biomarker and other properties normally used to establish relationships between samples thought to be related. In an additional example, Fig 9 shows the results from the GC-IRMS analyses of 20 oils from a region in SE Asia.
Fig 9: Results from the GC-IRMS analyses of 20 oils
It can be seen that on the basis of these analyses two distinct families of oils are present in the region. One family has isotopic values of around-20%for each compound whereas the other family has values around-28% this information can be used in conjunction with the biomarker data to determine the significance of these differences. While these are just two examples, we have also shown that GC-IRMS can be used in an environmental context to correlate weathered and unweathered oils and refined products and their weathered counterparts. If there are small amounts
of the n-alkanes remaining it should be possible to obtain their isotopic composition and subsequently use these values to make the correlation. Alternatively if the samples have been so extensively biodegraded that all of the n-alkanes have been removed, it is possible to isolate the asphaltenes, pyrolyse them and analyse the pyrolysates by GC-IRMS. Correlations can then be made using these data. This is a particularly valuable approach for the correlation of refined products that only contain lower carbon number compounds and none of the more reliable
IJPB
A, N
ov -
Dec
, 201
1, V
ol. 2
, Iss
ue, 6

Sahil Kataria et al. / Gas Chromatography-Mass Spectrometry: Applications
1551 © 2010, IJPBA. All Rights Reserved.
biomarker compounds that are typically used for correlation purposes [13]
Pesticide contamination of foodstuffs has become a worldwide concern, prompting various levels of regulation and monitoring. Traditionally, pesticides are quantified with gas chromatography (GC) combined with selective detectors (ECD, FID, etc.). Selective GC detectors are great tools to quantify one or two pesticide classes at a time. However, screening for a number of different pesticides requires multiple runs utilizing various GC configurations. Chromatographic run times are often long because of the need to achieve sufficient chromatographic resolution for unambiguous quantification. Gas chromatography/mass spectrometry (GC/MS) provides positive confirmation of various pesticides in a single analytical run; its superior selectivity allows interference-free quantification even with peak co elution. As a result, GC/MS has become a preferred technique for pesticide analysis because of its single-run capability.
. Analysis of Pesticides in Foodstuffs Introduction
It is a GC/MS method, allowing for the quantification of low-level pesticides with SIM (selected ion monitoring), while simultaneously performing quantification of higher concentrations using full-scan acquisition (SIFI - single ion and full ion scanning). It also demonstrates the throughput benefits of fast GC oven cool-down. Experimental Sample volumes of 1.0 μL were injected into the programmable split/splitless injector, incorporating a 2-mm i.d. deactivated fused-silica liner. The injection-port temperature was set at 275 °C (isothermal). The capillary column used incorporated a proprietary phase specifically suited for pesticides (Elite-CLPesticides) with the dimensions of 30 m x 0.25 mm x 0.25 μm . The helium carrier gas was programmed with a constant velocity of 30 cm/sec. The oven-temperature program was initially set at 80 °C with no hold and ramped to 290 °C at 20 °C/min with a hold of 4.5 minutes. The total oven program is 15 minutes, with an injection-to-injection time of less than 20 minutes.
Table 1: Instrument Conditions For Analysis of Pesticides in Foodstuffs Gas chromatograph GC Instrument Mass spectrometer MS Instrument Analytical Column 30m*.25mm*.25um GC inlet line temp. 2750c Carrier gas helium(30cm/sec) Ion source temp. 2750c Injector temprature 2750 Function type SIFI c Injection type Splitless Scan range m/z 40-450 Oven program Temp. Hold time Rate 800c 0 min. 200c/min 2900
Scan time 0.2 sec
c 4.75 min end
Interscan Delay 0.1 sec
The MS method contained multiple SIM functions overlapped by a m/z 40 to m/z 450 full-scan function. The timing and selected ions of each individual SIM function are dependent on the elution time and fragmentation of each pesticide of interest. The mass spectrometer transfer line and ion source were heated to 275 °C.
Fig 10: Extracted ion chromatogram of 100-ppm pesticide standard
IJPB
A, N
ov -
Dec
, 201
1, V
ol. 2
, Iss
ue, 6

Sahil Kataria et al. / Gas Chromatography-Mass Spectrometry: Applications
1552 © 2010, IJPBA. All Rights Reserved.
Fig11: Background subtracted spectra of Fenarimol (left) and Fluridone (right).
Discussion The maximum allowable level of pesticide residues in foodstuffs varies between countries. Japan, for example, has set a low level of 0.01 ppm. In this study, analytical standards comprised of organochlorine, organonitrogen and organophosphorous pesticides were analyzed between 0.01 ppm and 100 ppm. The standards analyzed here contain over 50 pesticides; of which 25 are pictured the chromatogram is a composite of extracted ions from the full-scan acquisition of a 100-ppm standard. The spectral data provided by the mass spectrometer allows for the use of chromatographic conditions that resolve only peaks with similar spectra, allowing for faster oven programs and short analysis times. Pictured in Figure are the background-subtracted spectra of Fenarimol and Fluridone. The spectra of Fenarimol are quite complex and fragment into many different ions, while Fluridone is quite simple with only three major ions. When analyzing for pesticides with high levels of fragmentation, such as Fenarimol, achieving detection limits may become a challenge. The SIFI capabilities of the MS will aid in overcoming these challenges. Additionally, SIFI will allow the acquisition of both full scan and SIM data simultaneously; the full scan data will give library-searchable spectra, while SIM will allow for low-level quantitation. Conclusion The adaptation of pesticide screening of foodstuffs from multiple GC analyses to a single GC/MS analysis will allow faster analysis of a wide range of pesticide classes. The GC/MS provides a robust and efficient platform to perform this analysis. The SIFI mass spectral data allow positive confirmation and quantification of various classes
of pesticides in a single analytical run. Furthermore, GC/MS data will not only allow for the positive identification of known peaks, but will also provide the analyst the ability to execute a library search of unknown peaks [16]. PHARMACEUTICAL & DRUG ANALYSIS Determination of Gamma-Hydroxybutyrate (Ghb) By Headspace-Gc/Ms (Fid) GHB is of interest for forensic chemists due to the compounds illegal use, where several deaths have been observed. GHB is used by bodybuilders/athletes, as new hot club drug (“fantasy”) and implicated in sexual assault cases Sample preparation 0.5 g NaHSO4 was added to 1 ml blood or urine in a headspace vial sealed with PTFE-coated silicone rubber septa. Chromatographic conditions Method development was done using PE Autosystem GC equipped with a HS , a column (50 m, 0.32 mm, 1.2 μm) and a flame ionisation detector. The HS heating conditions was: thermostatting time 20 min at 125°C, pressurizing time 4 min., injection time 0.5 min, withdrawal time 0.2 min, jet needle at 135°C, transfer line at 140°C. A PE cryofocusing accessory was used with pre-cryotime of 2 min. The GC settings were: injector temp. 140°C, detector temp. 220°C, oven temp. 50°C in 5 min then 15°/min to 200°C held for 5 min, carrier gas (nitrogen) 1 ml/min.. Verification was done using PE Autosystem GC equipped with MASS 910 mass spectrometer. The MS is operated in full scan mode .GBL m/z 86, 56 and 42. Discussion GHB is converted to its lactonic form gammabutyrolactone (GBL) under acidic conditions and high temperatures. This reaction takes place in a headspace vial during the thermostatting of the sample in the autosampler HS storing the semi-volatile product GBL.
IJPB
A, N
ov -
Dec
, 201
1, V
ol. 2
, Iss
ue, 6
Sahil Kataria et al. / Gas Chromatography-Mass Spectrometry: Applications
1553 © 2010, IJPBA. All Rights Reserved.
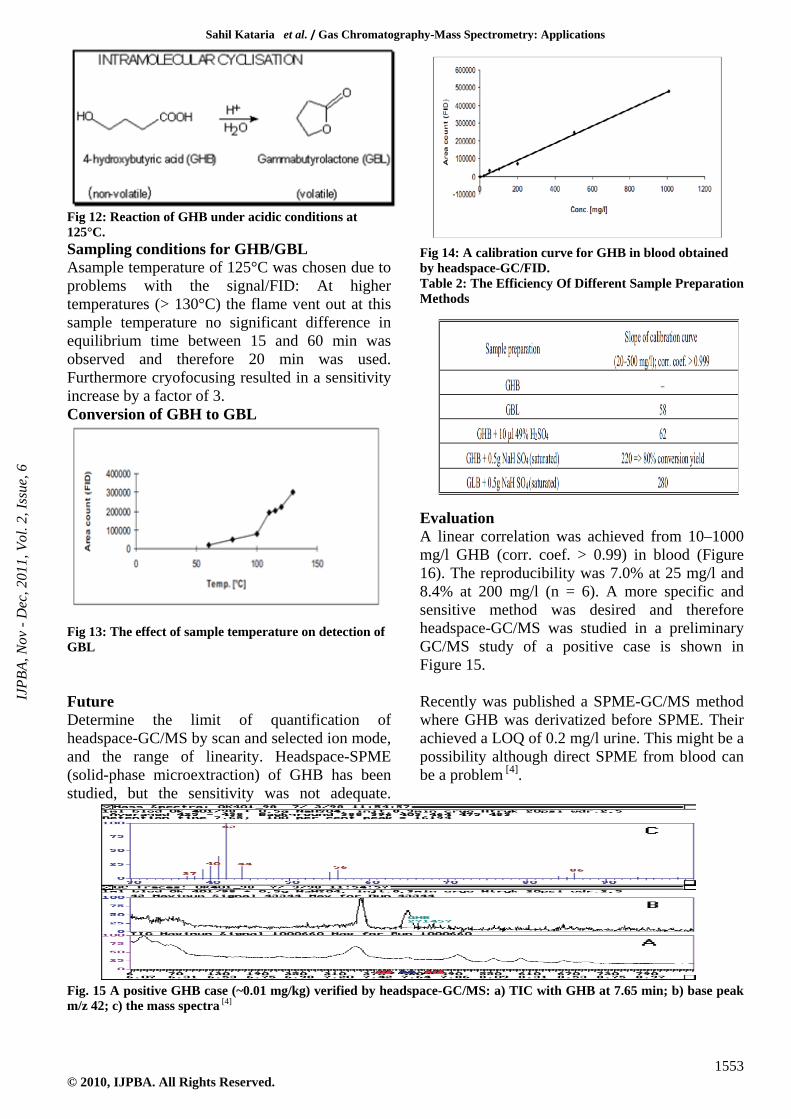
Fig 12: Reaction of GHB under acidic conditions at 125°C. Sampling conditions for GHB/GBL Asample temperature of 125°C was chosen due to problems with the signal/FID: At higher temperatures (> 130°C) the flame vent out at this sample temperature no significant difference in equilibrium time between 15 and 60 min was observed and therefore 20 min was used. Furthermore cryofocusing resulted in a sensitivity increase by a factor of 3. Conversion of GBH to GBL
Fig 13: The effect of sample temperature on detection of GBL
Fig 14: A calibration curve for GHB in blood obtained by headspace-GC/FID. Table 2: The Efficiency Of Different Sample Preparation Methods
Evaluation A linear correlation was achieved from 10–1000 mg/l GHB (corr. coef. > 0.99) in blood (Figure 16). The reproducibility was 7.0% at 25 mg/l and 8.4% at 200 mg/l (n = 6). A more specific and sensitive method was desired and therefore headspace-GC/MS was studied in a preliminary GC/MS study of a positive case is shown in Figure 15.
Future Determine the limit of quantification of headspace-GC/MS by scan and selected ion mode, and the range of linearity. Headspace-SPME (solid-phase microextraction) of GHB has been studied, but the sensitivity was not adequate.
Recently was published a SPME-GC/MS method where GHB was derivatized before SPME. Their achieved a LOQ of 0.2 mg/l urine. This might be a possibility although direct SPME from blood can be a problem [4]
.
Fig. 15 A positive GHB case (~0.01 mg/kg) verified by headspace-GC/MS: a) TIC with GHB at 7.65 min; b) base peak m/z 42; c) the mass spectra
[4]
IJPB
A, N
ov -
Dec
, 201
1, V
ol. 2
, Iss
ue, 6
Sahil Kataria et al. / Gas Chromatography-Mass Spectrometry: Applications
1554 © 2010, IJPBA. All Rights Reserved.
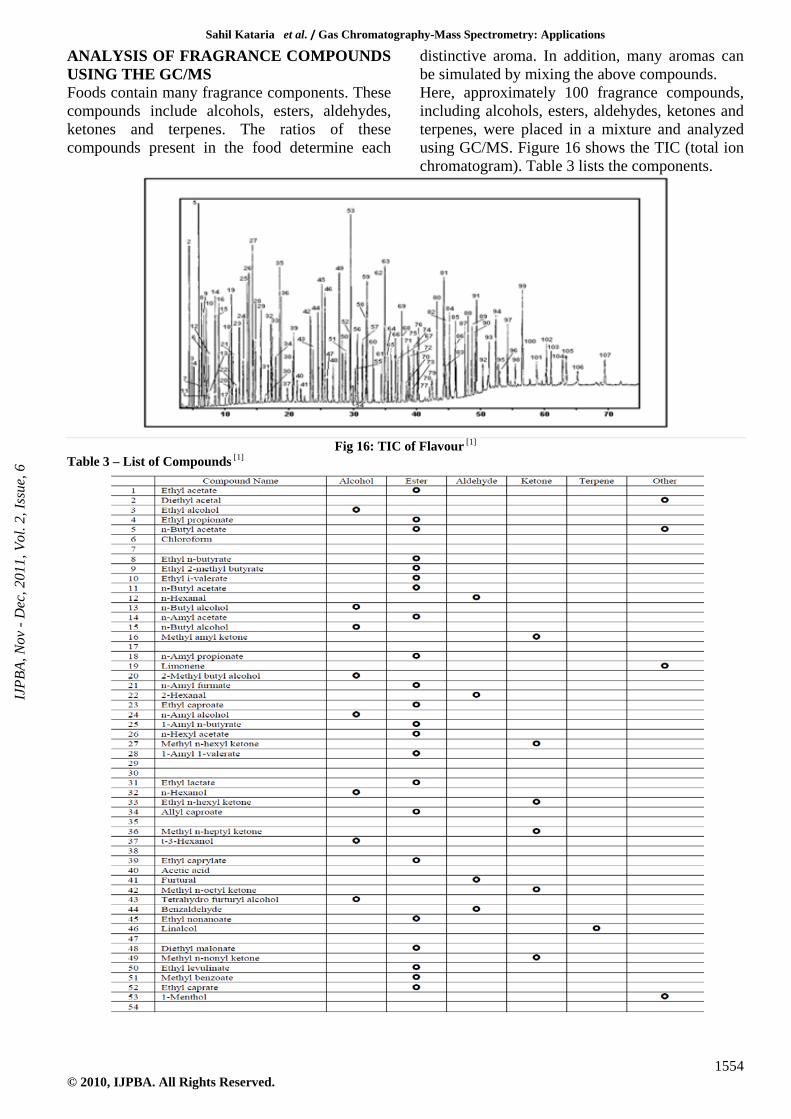
ANALYSIS OF FRAGRANCE COMPOUNDS USING THE GC/MS Foods contain many fragrance components. These compounds include alcohols, esters, aldehydes, ketones and terpenes. The ratios of these compounds present in the food determine each
distinctive aroma. In addition, many aromas can be simulated by mixing the above compounds. Here, approximately 100 fragrance compounds, including alcohols, esters, aldehydes, ketones and terpenes, were placed in a mixture and analyzed using GC/MS. Figure 16 shows the TIC (total ion chromatogram). Table 3 lists the components.
Fig 16: TIC of Flavour [1]
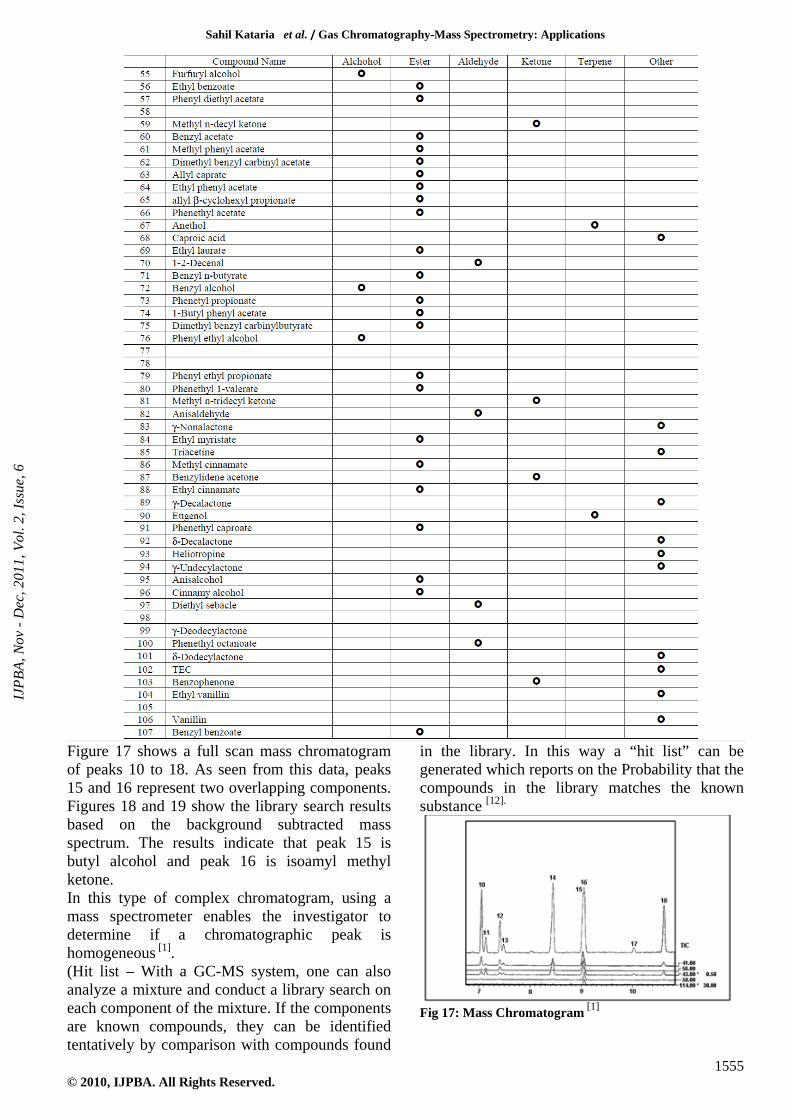
Table 3 – List of Compounds
[1]
IJPB
A, N
ov -
Dec
, 201
1, V
ol. 2
, Iss
ue, 6
Sahil Kataria et al. / Gas Chromatography-Mass Spectrometry: Applications
1555 © 2010, IJPBA. All Rights Reserved.
Figure 17 shows a full scan mass chromatogram of peaks 10 to 18. As seen from this data, peaks 15 and 16 represent two overlapping components. Figures 18 and 19 show the library search results based on the background subtracted mass spectrum. The results indicate that peak 15 is butyl alcohol and peak 16 is isoamyl methyl ketone. In this type of complex chromatogram, using a mass spectrometer enables the investigator to determine if a chromatographic peak is homogeneous [1]
(Hit list – With a GC-MS system, one can also analyze a mixture and conduct a library search on each component of the mixture. If the components are known compounds, they can be identified tentatively by comparison with compounds found
in the library. In this way a “hit list” can be generated which reports on the Probability that the compounds in the library matches the known substance
.
Fig 17: Mass Chromatogram
[12].
[1]
IJPB
A, N
ov -
Dec
, 201
1, V
ol. 2
, Iss
ue, 6

Sahil Kataria et al. / Gas Chromatography-Mass Spectrometry: Applications
1556 © 2010, IJPBA. All Rights Reserved.
Fig18: Library Search of Peak 15
[1]
Fig 19: Library Search of Peak 16
Due to their highly polar nature, barbiturates require derivatization prior to analysis by GC–MS. In such cases, the sample is dissolved in methanol, centrifuged, the supernatant recovered and placed in a derivatizing vial and is then ‘blown down’ under nitrogen. The derivatization procedure, using 0.2 M trimethylanilinium hydroxide in methanol, is, in principle, the same as that used for other pre-column derivatizations.
However, with this system the reaction does not occur immediately because insufficient activation energy is available at ambient temperature for this to take place. Direct transfer of the reaction mixture onto the heated injection block of the gas chromatograph overcomes this problem and the derivatization reaction can then proceed. Such a reaction, an example of ‘flash alkylation’ is illustrated
[1]
THE ANALYSIS OF CONTROLLED PHARMACEUTICAL DRUGS – BARBITURATES AND BENZODIAZEPINES Both barbiturates and benzodiazepines can be identified by using GC–MS methodologies, although each drug class requires a different pre-treatment routine prior to analysis.
Table 4: GC operating conditions and parameters used for the GC–MS analysis of barbiturate derivatives
Table 5 : GC operating conditions and parameters used for the GC–MS analysis of benzodiazepines
IJPB
A, N
ov -
Dec
, 201
1, V
ol. 2
, Iss
ue, 6
Sahil Kataria et al. / Gas Chromatography-Mass Spectrometry: Applications
1557 © 2010, IJPBA. All Rights Reserved.
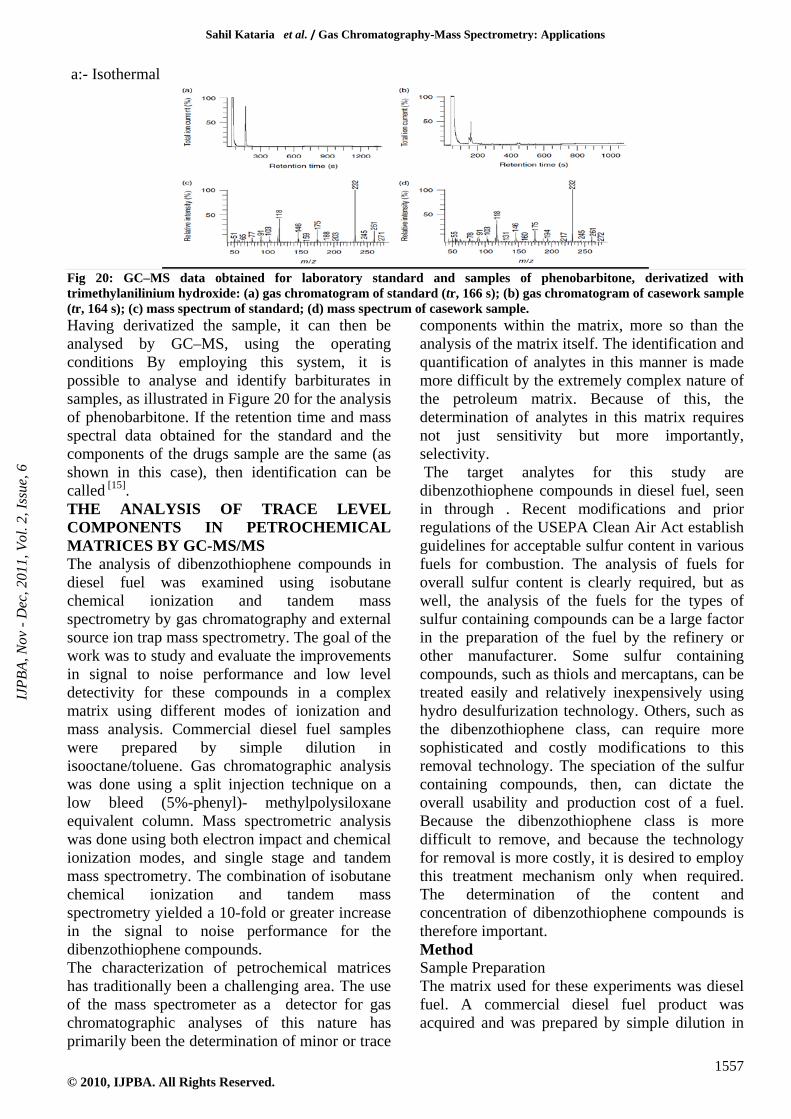
a:- Isothermal
Fig 20: GC–MS data obtained for laboratory standard and samples of phenobarbitone, derivatized with trimethylanilinium hydroxide: (a) gas chromatogram of standard (tr, 166 s); (b) gas chromatogram of casework sample (tr, 164 s); (c) mass spectrum of standard; (d) mass spectrum of casework sample. Having derivatized the sample, it can then be analysed by GC–MS, using the operating conditions By employing this system, it is possible to analyse and identify barbiturates in samples, as illustrated in Figure 20 for the analysis of phenobarbitone. If the retention time and mass spectral data obtained for the standard and the components of the drugs sample are the same (as shown in this case), then identification can be called [15]
The characterization of petrochemical matrices has traditionally been a challenging area. The use of the mass spectrometer as a detector for gas chromatographic analyses of this nature has primarily been the determination of minor or trace
components within the matrix, more so than the analysis of the matrix itself. The identification and quantification of analytes in this manner is made more difficult by the extremely complex nature of the petroleum matrix. Because of this, the determination of analytes in this matrix requires not just sensitivity but more importantly, selectivity. The target analytes for this study are dibenzothiophene compounds in diesel fuel, seen in through . Recent modifications and prior regulations of the USEPA Clean Air Act establish guidelines for acceptable sulfur content in various fuels for combustion. The analysis of fuels for overall sulfur content is clearly required, but as well, the analysis of the fuels for the types of sulfur containing compounds can be a large factor in the preparation of the fuel by the refinery or other manufacturer. Some sulfur containing compounds, such as thiols and mercaptans, can be treated easily and relatively inexpensively using hydro desulfurization technology. Others, such as the dibenzothiophene class, can require more sophisticated and costly modifications to this removal technology. The speciation of the sulfur containing compounds, then, can dictate the overall usability and production cost of a fuel. Because the dibenzothiophene class is more difficult to remove, and because the technology for removal is more costly, it is desired to employ this treatment mechanism only when required. The determination of the content and concentration of dibenzothiophene compounds is therefore important. Method Sample Preparation
. THE ANALYSIS OF TRACE LEVEL COMPONENTS IN PETROCHEMICAL MATRICES BY GC-MS/MS The analysis of dibenzothiophene compounds in diesel fuel was examined using isobutane chemical ionization and tandem mass spectrometry by gas chromatography and external source ion trap mass spectrometry. The goal of the work was to study and evaluate the improvements in signal to noise performance and low level detectivity for these compounds in a complex matrix using different modes of ionization and mass analysis. Commercial diesel fuel samples were prepared by simple dilution in isooctane/toluene. Gas chromatographic analysis was done using a split injection technique on a low bleed (5%-phenyl)- methylpolysiloxane equivalent column. Mass spectrometric analysis was done using both electron impact and chemical ionization modes, and single stage and tandem mass spectrometry. The combination of isobutane chemical ionization and tandem mass spectrometry yielded a 10-fold or greater increase in the signal to noise performance for the dibenzothiophene compounds.
The matrix used for these experiments was diesel fuel. A commercial diesel fuel product was acquired and was prepared by simple dilution in
IJPB
A, N
ov -
Dec
, 201
1, V
ol. 2
, Iss
ue, 6

Sahil Kataria et al. / Gas Chromatography-Mass Spectrometry: Applications
1558 © 2010, IJPBA. All Rights Reserved.
isoctane/toluene (1:19). No other sample preparation was utilized. Gas Chromatograph Conditions GC Inlet
Standard split style injection usinga4mmIDdeactivated glass liner. Split ratio of 1:150 with an inlet temperature of 300° C.
GC Conditions 60mx 0.25mm 1.0µmfilm thickness. 150°C for 1 minute, ramp at 4°C/min to 320°C, hold 20 minutes.
Electronic Pressure Control (EPC) - constant velocity mode at 40 cm/sec Transfer line temperature was 300°C.
Table 6: Mass Spectrometer Conditions EI CI CI-MS/MS Electron energy (Ev ) 70 70 70 Emission Current (μA) 250 250 250 Source Temperature o 200 C 200 200 Ionization Waveform Off On Off High mass Adjustment 75% 100% NA Scan Range (m/z) 50-450 50-450 0.25Mp- Mp Scan Rate (sec/scan) 0.50 0.50 0.50
Table 7: Characteristic ions [5]
Table 8: Signal to noise ratio
[5]
The figures illustrate the improvements in signal to noise for the targeted isomersCASE STUDIES
[5]
It have shown that there can be a significant number of samples which do not provide enough information when analyzed by standard GC/MS yet can be confirmed and proven to be positive with an additional test using our GC/MS/MS technology. This is due to the significant increase in sensitivity and ability to tune the MS/MS method to be specific for indications of ignitable liquids. Although GC/MS/MS is a well established and understood technique it is not generally well known as it is found in only the most progressive laboratories. This second confirmatory analysis on fire debris samples was reviewed by forensic scientists, accepted, and was
subsequently published in the Canadian Journal of Forensic Sciences. GC/MS/MS in Court
With the introduction of our GC/MS confirmatory analysis, The execution of this method has been used successfully in significant courtroom proceedings. GC/MS provides extra assurance that traces of ignitable liquids, as important evidence in cases against arson, will not be missed and adds the highest level of confidence to the results.
Case 1: Fire Debris Analysis for Ignitable Liquids The analysis of fire debris samples by GC/MS and GC/MS/MS was part of the testimony in a first-degree murder trial in January of 2002. As an expert witness, Dale Sutherland testified that GC/MS/MS had been used to confirm a positive result for the presence of gasoline in a highly weathered sample. This sample was originally analyzed by GC/MS where some characteristics of an Ignitable liquid were detected but were insufficient to declare a positive result. A second analysis using GC/MS/MS conclusively proved that this fire debris sample was in fact positive for the presence of gasoline.
Agent Martz and the FBI's research laboratory developed a method using GC/MS to determine whether the blood stained cloth swatch and socks
Case 2: Analysis of EDTA in Blood by the FBI Forensic Science Research Unit in the O.J.Simpson Trial
IJPB
A, N
ov -
Dec
, 201
1, V
ol. 2
, Iss
ue, 6
Sahil Kataria et al. / Gas Chromatography-Mass Spectrometry: Applications
1559 © 2010, IJPBA. All Rights Reserved.
found at the O.J. Simpson residence contained the blood preservative EDTA (Ethylenediaminetetraacetic acid). GC/MS Successfuly determined that EDTA was not present in the evidence at levels indicating its use as a preservative. It was thus determined that police authorities had not tampered with the evidence. In support of the specificity of MS/MS, scientists at Cornell University published their findings in Analytical Chemistry (1997, 69, 477A-480A) for "Determining EDTA in Blood". They found that the use of MS/MS removes the chemical background or interference's from the targeted compounds of interest, in fact in their experiments "the blank blood plasma sample is free of all matrix peaks" or potential interference's. They stated that GC/MS "provides the highest specificity and the best detection level of any method currently published". Also, in their conclusions in reference to the O.J. Simpson trial, "The question of blood-evidence tampering in a criminal trial has led not only to improved analytical techniques for the determination of EDTA, but also to the demonstration that a relatively new technique (MS/MS) is ready to be used as credible evidence in the courtroom". Case 3: GC/MS/MS Confirmation of Unusually High D9-Tetrahydrocannabinol (THC or Marijuana) Levels in Two Postmortem Blood Samples This case was published in the Journal of Analytical Toxicology (V21, Number 7, Dec. 1997). Unusually high levels of THC were detected in two postmortem blood samples. In this method a major metabolite is also analyzed for as a confirmation of the presence of the parent compound, THC. However, because of the sample decomposition in these post mortem samples, the routine GC/MS method was insufficient and could not confirm the presence of the metabolite. Thus some doubt was cast on the presence of the high levels of THC found. Re-analysis of the samples using GC/MS/MS confirmed the identification of the high THC levels due to the higher specificity and confidence of the MS/MS technique [3]
1. Analysis of Fragrance Compounds using the QP-5000 GC/MS Available from URL
. REFERENCES
http://www.shimadzu.com/apps/appnotes/scapgcms0171.pdf (Accessed on 10-Aug.-2011)
2. Blood, Sweat and tears - GC/MS in forensic toxicology Available from URL
http://www.labnews.co.uk/feature_archive.php/2079/5/blood,-sweat-and-tears---gc/ ms-in-forensic-toxicology (Accessed on 21-July-2011)
3. Case studies GC/MS/MS in Court Available from URL http://www.actlabs.com/page.aspx?menu=65&app=221&cat1=547&tp=2&lk=no (Accessed on 27-July-2011)
4. Determination of Gamma-Hydroxybutyrate(GHB) by Head Space-GC/MS (FID) in Forensic Samples Available from URL http://www.forensicscience.pl/pfs/43_ johansen.pdf(Accessed on 10-Aug.-2011)
5. Edwards B.James “The Analysis of Trace Level Components in Petrochemical Matrices by GC-MS/MS” Available from URL http://www.thermo. com/ethermo/ CMA/pdf’s.../articlefile-1000001009426.pdf
6. Gas Chromatography-mass spectrometry Available from URL http:// en .wikipedia.org/wiki/Gas_chromatography–mass_spectrometry (Accessed on 25-July-2011)
(Accessed on 11-Aug.-2011)
7. Kalsi P.S. “Spectroscopy of Organic Compounds” sixth edition,2004 Published by New Age International Pvt. Ltd. P.NO.- 512-513
8. Kemp William “ Organic Spectroscopy” third edition, 2007 Palgrave Foundations, P.NO.- 328-329
9. Londhe S.V., Mulgund S.V. et al “Hyphenated techniques in analytical World”, Indian Journal of Pharmaceutical Education & Research, Volume 42(4) Oct-Dec. 2008. The official Publication of Association of Pharmaceutical Teachers of India(APTI) P.NO.- 395
10. Major Applications of Supersonic GC-MS Available from URL http:// www.actlabs.com/page.aspx?page=368&app=228... (Accessed on 21-July-2011)
11. Mendham J., Denney R.C. et al “Vogel’s Text book of Quantitative Chemical Analysis”, November 1989 John Wiley & Sons Inc P.NO.- 781
12. Pavia L.Donald, Lampan M.Gary, Kriz S.George “Introduction to Spectroscopy- A Guide for Students of Organic Chemistry” 3rd Edition,2001 Thomson Learning Academic Resource Centre P.NO.- 393-394
IJPB
A, N
ov -
Dec
, 201
1, V
ol. 2
, Iss
ue, 6
Sahil Kataria et al. / Gas Chromatography-Mass Spectrometry: Applications
1560 © 2010, IJPBA. All Rights Reserved.
13. Philp. R.P. “Geochemical Analysis: Gas Chromatography and GC-MS” Available fromURLhttp://www.myanmarelibrary.com/elibrary/document/...2825.../ 9000681.pdf (Accessed on 28-July-2011)
14. SPME/GC for Forensic Applications: Explosives, Fire Debris, and Drugs of Abuse Available from URL http://www.sigmaaldrich .com/Graphics/ superleco /objects / 46 00/4546.pdf (Accessed on 12-Aug.-2011)
15. The Analysis of Controlled Pharmaceutical Drugs – Barbiturates and Benzodiazepines Available from URL http://www.monzir-pal.net/poisons%20 and%20drugs/…/ (Accessed on 10-Aug.-2011)
16. The Application of GC-MS to the Analysis of Pesticides in Food Stuffs Available fromURL http://www.perkinelmer.com/applicationnotes/app... (Accessed on 27-July-2011)
17. The coupling of gas and liquid chromatography With mass spectrometry Available from URL http://www. spectroscopynow.com /FCKeditor/ UserFiles/ File/ specNOW /JMS 34157.pdf
18. Willard H. Hobart, Meritt L.Lyme et al “Instrumental Methods of Analysis” Published by CBS Publishers & Distributors P.NO.- 569-571
(Accessed on 09-Sep.-2011)