gao-13-603, u.s.-mexico border: cbp action needed … to the ranking member, committee on the...
TRANSCRIPT
U.S.-MEXICO BORDER
CBP Action Needed to Improve Wait Time Data and Measure Outcomes of Trade Facilitation Efforts
Report to the Ranking Member, Subcommittee on Immigration, Refugees and Border Security, Committee on the Judiciary, U.S. Senate
July 2013
GAO-13-603
United States Government Accountability Office
United States Government Accountability Office
Highlights of GAO-13-603, a report to Ranking Member, Subcommittee on Immigration, Refugees and Border Security, Committee on the Judiciary, U.S. Senate.
July 2013
U.S.-MEXICO BORDER CBP Action Needed to Improve Wait Time Data and Measure Outcomes of Trade Facilitation Efforts
Why GAO Did This Study
Trade with Mexico is important to the United States’ economy. Most of this trade crosses the border by truck, and studies have shown that long waits at border crossings can negatively affect the U.S. economy. CBP is responsible for securing U.S. borders at ports of entry to prevent illegal entry of persons and contraband while also facilitating legitimate trade and travel. GAO was asked to examine CBP data on and actions taken to address wait times at southwest border crossings. This report addresses the extent to which (1) CBP wait time data are reliable for public reporting and informing CBP decisions, (2) CBP has identified infrastructure and staffing needed to process current commercial traffic volumes, and (3) CBP performance measures assess progress toward its trade facilitation goal. GAO assessed the reliability of CBP’s wait time data; visited six land border crossings (not generalizable, but selected largely for high traffic volume); analyzed CBP documentation, including needs assessments; and interviewed stakeholders and CBP officials.
What GAO Recommends
GAO recommends that CBP (1) determine and take steps to help ensure consistent implementation of existing wait time data collection methodologies, (2) assess the feasibility of replacing current methodologies with automated methods, (3) document its staff allocation process and rationale, and (4) develop outcome-oriented performance measures. DHS agreed with these four recommendations and identified steps to address them, although the planned actions will not address the intent of one.
What GAO Found
Within the Department of Homeland Security (DHS), U.S. Customs and Border Protection’s (CBP) data on commercial vehicle wait times—the time it takes to travel from the end of the queue to the CBP primary inspection point at land border crossings—are unreliable for public reporting and CBP management decisions across border crossings. These data—which are collected manually by CBP officers—are unreliable because CBP officers inconsistently implement an approved data collection methodology, and the methodologies used vary by crossing. For example, five of the six crossings GAO visited require observation of the end of the queue to estimate wait times, but officials at these crossings reported the lines extended beyond their view at times. As a result, these data are generally not used by the private sector and are of limited usefulness for CBP management decisions on staffing and infrastructure investments. Determining and taking steps to help CBP officials overcome challenges to consistent implementation of existing methodologies could improve the reliability and usefulness of CBP’s current wait time data. CBP officials have identified automated wait time data collection technology as the best way to improve data reliability. The Department of Transportation (DOT), in coordination with state DOTs and CBP, has ongoing pilot projects to use technology to gather more reliable wait time data at some border crossings. However, CBP has not assessed the feasibility of replacing current methods with automated data collection. Doing so, consistent with program management standards, could help CBP determine how to best improve data reliability.
CBP officials report and analyses indicate infrastructure and staff needs, but documenting CBP’s staff allocation process could improve transparency and facilitate review and validation by CBP and others. CBP officials and analyses identify needs for additional infrastructure—such as more lanes—at some crossings, and GAO analysis of CBP data on lane use generally supported agency views on the extent to which CBP opens lanes at the six crossings GAO visited. Further, GAO analysis of lane use and traffic volume data generally supported CBP officials’ statements that they open and close primary inspection lanes in response to fluctuations in commercial traffic volume. CBP analyses identified a need for 3,811 additional officers, and CBP headquarters officials told GAO all southwest border ports require additional staff, but CBP field and port managers at three of six crossings GAO visited reported having sufficient staff. CBP human capital officials reported that they adjust staff allocations across locations to better ensure that staff levels match areas of greatest need, but CBP has not documented this process, and there is no guidance defining the methodology used or factors considered when allocating staff across ports. Documenting this process, consistent with internal control standards, could improve transparency, helping CBP and others to better ensure that scarce staff resources are effectively allocated to fulfill mission needs across ports.
CBP does not have outcome-oriented performance measures to determine the extent to which the agency is facilitating trade. The Office of Management and Budget and GAO guidance recommend using outcome-oriented measures to promote accountability for results. In the absence of such measures, it is difficult for the agency or others to gauge CBP’s progress in meeting its stated goal of facilitating trade.
View GAO-13-603. For more information, contact Rebecca Gambler at (202) 512-8777 or [email protected].
Page i GAO-13-603 U.S.-Mexico Border
Letter 1
Background 7 CBP’s Wait Time Data Are Unreliable for Informing the Public and
CBP Management Decisions, and CBP Has Not Assessed the Feasibility of Automated Data Collection Options 14
CBP Analyses and Officials Identified Some Infrastructure and Staff Needs, but the Methodology Used to Allocate Staff across Ports of Entry Has Not Been Documented 24
CBP Performance Measures Do Not Reflect Progress in Achieving Trade Facilitation Goals 35
Conclusions 39 Recommendations for Executive Action 40 Agency Comments and Our Evaluation 41
Appendix I Results of Studies on the Economic Impact of Wait Times on Cross-Border Commerce 44
Appendix II Objectives, Scope, and Methodology 51
Appendix III U.S. Customs and Border Protection’s Capital Investment Planning Process 57
Appendix IV Ongoing, Planned, or Completed Land Port of Entry Renovation Projects, Fiscal Years 2008 through 2012 61
Appendix V Average Hourly Traffic Volume and Average Hourly Percentage of Lanes Open Per Month, Fiscal Years 2008-2012 65
Appendix VI Performance Measures for U.S. Customs and Border Protection Activities, Fiscal Year 2013 86
Contents
Page ii GAO-13-603 U.S.-Mexico Border
Appendix VII Comments from the Department of Homeland Security 89
Appendix VIII GAO Contact and Staff Acknowledgments 93
Tables
Table 1: Infrastructure Needs as Identified in Customs and Border Protection (CBP) and General Services Administration Assessments (GSA) and by CBP Officials at the Six Crossings We Visited 26
Table 2: Studies of the Economic Impact of Commercial Vehicle Wait Times on the Southwest Border 47
Table 3: Categories of Criteria Customs and Border Protection Uses to Prioritize Land Port of Entry Projects 58
Table 4: Prioritization Rank of Infrastructure Needs at Commercial Southwest Border Crossings 58
Table 5: Completed Infrastructure Improvement Projects at Southwest Border Land Ports of Entry That Process Commercial Vehicle Traffic, Fiscal Years 2008 through 2012 62
Table 6: Ongoing Infrastructure Improvement Projects at Southwest Border Land Ports of Entry That Process Commercial Vehicle Traffic as of May 2013 63
Table 7: Planned Infrastructure Improvement Projects at Southwest Border Land Ports of Entry That Process Commercial Vehicle Traffic, as of May 2013 64
Table 8: Descriptions of Six Selected Crossings including Year Built and Renovated, and the Number of Available Commercial Lanes, Fiscal Years 2008 through 2012 65
Table 9: Average Hourly Traffic Volume and Average Hourly Percentage of Lanes Open Per Month at Otay Mesa Crossing near San Diego, California, Fiscal Years 2008 through 2012 69
Table 10: Average Hourly Traffic Volume and Average Hourly Percentage of Lanes Open Per Month at Mariposa Crossing in Nogales, Arizona, Fiscal Years 2008 through 2012 71
Table 11: Average Hourly Traffic Volume and Average Hourly Percentage of Lanes Open Per Month at Bridge of the
Page iii GAO-13-603 U.S.-Mexico Border
Americas Crossing in El Paso, Texas, Fiscal Years 2008 through 2012 72
Table 12: Average Hourly Traffic Volume and Average Hourly Percentage of Lanes Open Per Month at Ysleta Crossing in El Paso, Texas, Fiscal Years 2008 through 2012 74
Table 13: Average Hourly Traffic Volume and Average Hourly Percentage of Lanes Open Per Month at Columbia Solidarity Bridge Crossing in Laredo, Texas, Fiscal Years 2008 through 2012 76
Table 14: Average Hourly Traffic Volume and Average Hourly Percentage of Lanes Open Per Month at World Trade Bridge Crossing in Laredo, Texas, Fiscal Years 2008 through 2012 78
Table 15: U.S. Customs and Border Protection-Focused Performance Measures, Fiscal Year 2013 87
Figures
Figure 1: Commercial Vehicles in Line to Enter the United States at Otay Mesa near San Diego, California 8
Figure 2: Commercial Vehicle Inspection Process at a Land Port of Entry 10
Figure 3: Average Hourly Traffic Volume and Average Hourly Percentage of Lanes Open Per Month at Selected Southwest Border Crossings, Fiscal Years 2008-2012 30
Figure 4: The Otay Mesa Crossing near San Diego, California 66 Figure 5: Commercial Vehicle Primary Inspection Lanes at the
Mariposa Crossing in Nogales, Arizona 66 Figure 6: The Bridge of the Americas Crossing in El Paso, Texas 67 Figure 7: The Ysleta Crossing in El Paso, Texas 67 Figure 8: The Columbia Solidarity Bridge Crossing in Laredo, Texas 68 Figure 9: The World Trade Bridge Crossing in Laredo, Texas 68 Figure 10: Average Hourly Traffic Volume and Average Hourly
Percentage of Lanes Open Per Month at Otay Mesa Crossing near San Diego, California, Fiscal Year 2008 through 2012 80
Figure 11: Average Hourly Traffic Volume and Average Hourly Percentage of Lanes Open Per Month at the Mariposa Crossing in Nogales, Arizona, Fiscal Year 2008 through 2012 81
Figure 12: Average Hourly Traffic Volume and Average Hourly Percentage of Lanes Open Per Month at the Bridge of the
Page iv GAO-13-603 U.S.-Mexico Border
Americas Crossing in El Paso, Texas, Fiscal Year 2008 through 2012 82
Figure 13: Average Hourly Traffic Volume and Average Hourly Percentage of Lanes Open Per Month at Ysleta Crossing in El Paso, Texas, Fiscal Year 2008 through 2012 83
Figure 14: Average Hourly Traffic Volume and Average Hourly Percentage of Lanes Open Per Month at Columbia Solidarity Bridge Crossing in Laredo, Texas, Fiscal Year 2008 through 2012 84
Figure 15: Average Hourly Traffic Volume and Average Hourly Percentage of Lanes Open Per Month at World Trade Bridge Crossing in Laredo, Texas, Fiscal Year 2008 through 2012 85
Page v GAO-13-603 U.S.-Mexico Border
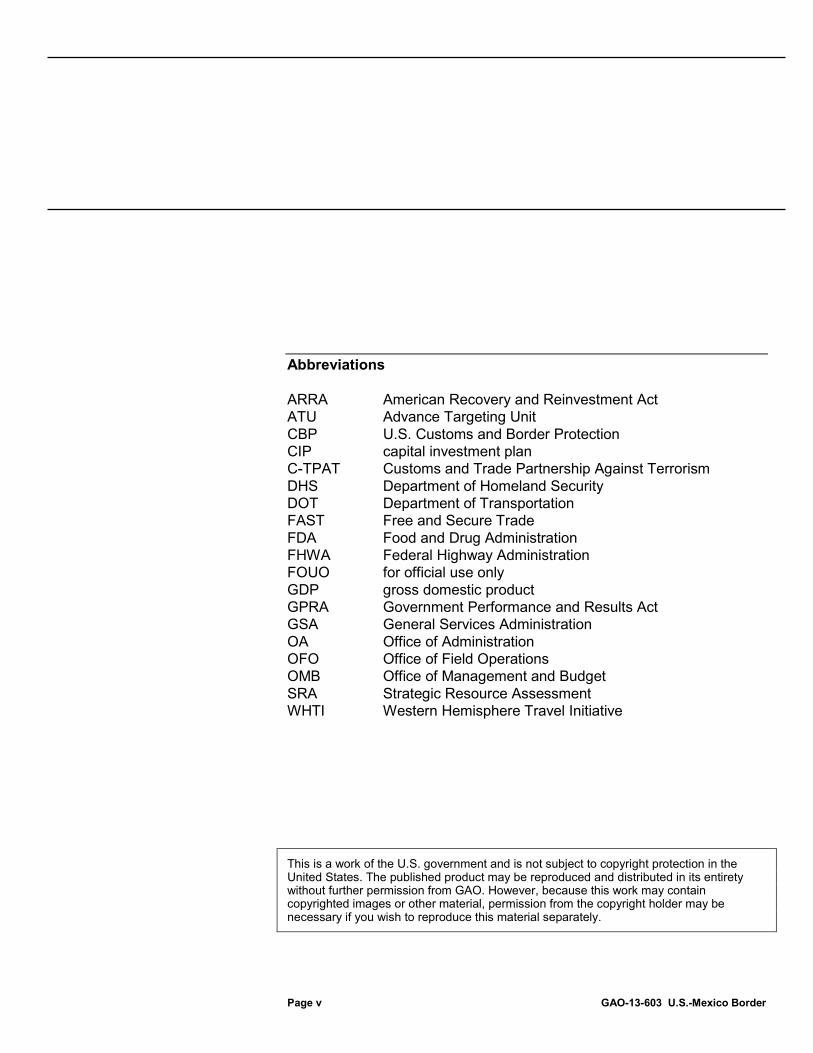
Abbreviations ARRA American Recovery and Reinvestment Act ATU Advance Targeting Unit CBP U.S. Customs and Border Protection CIP capital investment plan C-TPAT Customs and Trade Partnership Against Terrorism DHS Department of Homeland Security DOT Department of Transportation FAST Free and Secure Trade FDA Food and Drug Administration FHWA Federal Highway Administration FOUO for official use only GDP gross domestic product GPRA Government Performance and Results Act GSA General Services Administration OA Office of Administration OFO Office of Field Operations OMB Office of Management and Budget SRA Strategic Resource Assessment WHTI Western Hemisphere Travel Initiative
This is a work of the U.S. government and is not subject to copyright protection in the United States. The published product may be reproduced and distributed in its entirety without further permission from GAO. However, because this work may contain copyrighted images or other material, permission from the copyright holder may be necessary if you wish to reproduce this material separately.
Page 1 GAO-13-603 U.S.-Mexico Border
441 G St. N.W. Washington, DC 20548
July 24, 2013
The Honorable John Cornyn Ranking Member Subcommittee on Immigration, Refugees and Border Security Committee on the Judiciary United States Senate
Dear Senator Cornyn:
Trade with Mexico, the nation’s third-largest trade partner behind Canada and China, is important to the United States’ economic health, and timely access to Mexican goods is important to both U.S. manufacturers and consumers. The value of goods imported into the United States from Mexico has increased over 30 percent in the last 5 years, and in 2012 imports from Mexico were valued at nearly $278 billion. Most of this trade crosses the border by commercial truck, and in 2012 there were over 5 million truck crossings into the United States from Mexico. Industry representatives who rely on commercial vehicles to quickly transport goods across the U.S.-Mexico border have raised concerns about long waits at border crossings, and several studies have shown that the time that commercial vehicles spend waiting to cross into the United States from Mexico can have a negative impact on the U.S. economy in terms of lost revenue and jobs.
The Department of Homeland Security’s (DHS) U.S. Customs and Border Protection (CBP) is the lead federal agency charged with a dual mission of keeping terrorists, criminals, and inadmissible aliens out of the country while facilitating the flow of legitimate travel and commerce at the nation’s borders.1
1The agency’s trade facilitation goals are articulated in DHS’s February 2010 Quadrennial Homeland Security Review Report, which outlined a strategic framework for homeland security. The two relevant mission goals are to (1) prevent the illegal flow of people and goods across U.S. air, land, and sea borders while expediting the safe flow of lawful travel and commerce, and (2) ensure security and resilience of global movement systems (which includes global trading and transportation networks). See DHS, Quadrennial Homeland Security Review Report: A Strategic Framework for a Secure Homeland (Washington, D.C.: February 2010).
CBP’s Office of Field Operations (OFO) is responsible for cargo and passenger processing activities related to security, trade,
Page 2 GAO-13-603 U.S.-Mexico Border
immigration, and agricultural inspection at air, land, and sea ports of entry, and CBP’s Office of Administration (OA) is responsible for real estate management, including the construction, maintenance, and leasing of facilities, such as land ports of entry.2
We previously reported that CBP has faced challenges balancing the goals of security and trade facilitation, and some information necessary to assess its trade facilitation efforts has not been available.
CBP’s focus has historically been on security; however, CBP has also undertaken specific efforts to facilitate legitimate travel and trade, such as launching the Free and Secure Trade (FAST) program in 2002 to expedite the travel of low-risk screened shipments across the border, and publishing border crossing wait times on a website to inform public and private sector border crossing decisions.
3 Specifically, we reported in July 2010 that CBP’s Automated Commercial Environment collected data on freight processing but did not differentiate between FAST and non-FAST shipments—information needed to help CBP determine the extent to which FAST program participants experience intended benefits.4
2The General Services Administration (GSA) also has responsibilities related to the construction and maintenance of GSA-owned facilities that include land ports of entry. Ports of entry are the facilities that provide for the controlled entry into or departure from the United States for persons and materials. Specifically, a port of entry is any officially designated location (seaport, airport, or land border location) where DHS officers or employees are assigned to clear passengers and merchandise, collect duties, and enforce customs laws. A single land port of entry may be composed of one or more crossings. For example, the Port of Laredo, Texas, headed by a port director, oversees operations at four separate border crossings, one rail crossing, and one airport. CBP operates 168 land border crossings, 46 of which are located on the southwest border.
We recommended that CBP (1) develop milestones for completing enhancement of the database used to capture data on FAST program benefits, and (2) conduct a study to determine if program benefits are being realized that could help CBP determine what program adjustments, if any, are needed. CBP agreed with these recommendations; took action to collect the needed data; and, as of June 2013, drafted an evaluation of FAST lanes and commercial traffic at select crossings on the northern border to determine whether there is a need to expand the usage of FAST lanes. This study is currently under
3GAO, Border Security: CBP Lacks the Data Needed to Assess the FAST Program at U.S. Northern Border Ports, GAO-10-694 (Washington, D.C.: July 19, 2010). 4CBP’s Automated Commercial Environment is CBP’s commercial trade processing system—one of several databases and tools used by CBP to screen and assign risk levels to travelers and cargo entering the United States.
Page 3 GAO-13-603 U.S.-Mexico Border
review and CBP expects to fully implement this recommendation by December 30, 2013.
You asked us to review what data CBP collects and reports on wait times for commercial vehicles at southwest border land ports of entry and actions CBP has taken to reduce those wait times. This report addresses the following questions:
• To what extent are CBP wait time data reliable for public reporting and informing CBP decisions on staffing and infrastructure investments?
• To what extent has CBP identified infrastructure and staffing needed to process current commercial traffic volume at select southwest border crossings with high traffic volume?
• To what extent do CBP performance measures assess progress toward its goal of facilitating trade?
This report also presents information on the results of studies that have quantified the economic impact of commercial vehicle wait times on cross border commerce. This information, including the methodology used to identify these studies, is presented in appendix I.
To inform our analysis of the first and second objectives, we visited six border crossings—Bridge of the Americas and Ysleta in El Paso, Texas; World Trade Bridge and Columbia Solidarity Bridge in Laredo, Texas; Mariposa in Nogales, Arizona; and Otay Mesa near San Diego, California—selected based on their commercial traffic volume, geographic diversity, and representation of a mix of recent or ongoing infrastructure modernization projects. At each location, we interviewed CBP management, toured the facility, and convened a roundtable of local industry representatives and local government officials. To obtain a range of perspectives on commercial vehicle traffic at southwest border crossings, we met with representatives of 21 companies and associations (who were identified to us as knowledgeable stakeholders representing industries that rely on cross-border commerce, including customs brokers, trucking companies, and distributors) as well as bridge directors and representatives of four local government entities (the Mayors of El Paso and San Diego, the Laredo City Manager, and representatives of the San Diego Association of Governments) at all four cities we visited or
Page 4 GAO-13-603 U.S.-Mexico Border
by teleconference.5 We also interviewed officials from federal agencies involved in securing the border and facilitating trade at land ports of entry. Although the results of our site visits and interviews are not generalizable, they provided us with perspectives on operations at ports of entry that accounted for a total of approximately 70 percent of the commercial vehicle crossings into the United States from Mexico for fiscal year 2008 through July 2012. Over the course of our work, we also interviewed other stakeholders, including officials from the Mexican Foreign Ministry, academics, and representatives of national trade associations, such as the American Trucking Associations and the Border Trade Alliance, to obtain a broader range of perspectives on commercial vehicle traffic at southwest border crossings.6
To address the first objective, we reviewed and analyzed CBP’s policies and guidance for calculating and reporting wait times and CBP evaluations of its wait time data, including a fiscal year 2008 CBP Commercial Wait Times Analysis Report completed by CBP’s Western Hemisphere Travel Initiative (WHTI) Office.
7
5The San Diego Association of Governments is a public planning, transportation, transit construction, and research agency.
We also reviewed CBP’s fiscal year 2012 wait time data for the six crossings we visited and compared documentary and testimonial evidence of how wait times are currently being calculated by officials at land ports of entry on the southwest border against CBP policies and guidance to identify any discrepancies. We also compared CBP’s policies and guidance with
6These organizations and officials were identified to us as knowledgeable stakeholders who could provide us with a range of perspectives on commercial vehicle traffic at southwest border crossings. The American Trucking Associations is a national trade and safety organization representing the U.S. trucking industry. The Border Trade Alliance is a nonprofit organization that serves as a forum for participants to address key issues affecting trade, travel, and security in North America. 7CBP reported on the reliability of wait time calculations in its Western Hemisphere Travel Initiative, Commercial Wait Times Analysis Final Report, October 2007-September 2008. The goal of WHTI is to facilitate entry for U.S. citizens and legitimate foreign visitors while strengthening U.S. border security. The WHTI Program Office sponsored this evaluation of commercial vehicle wait times to validate the current wait time reporting systems at individual crossings and to determine if a national standard for reporting wait times can be established.
Page 5 GAO-13-603 U.S.-Mexico Border
criteria in Standards for Internal Control in the Federal Government.8 Our assessment of the reliability of these data is discussed later in this report. To determine the status of the Department of Transportation’s (DOT) pilot projects to automate wait time data at the southwest border, we interviewed officials at DOT’s Federal Highway Administration (FHWA), Texas Department of Transportation, and Texas A&M University and reviewed documentary evidence they provided, such as written updates on the status of certain pilot projects.9 We compared CBP’s plans to automate wait times with standards for program management.10
To address the second objective, we reviewed and analyzed CBP and General Services Administration (GSA) assessments of land port of entry capacity, such as CBP’s Strategic Resource Assessments (SRA), and reviewed documentation of CBP’s Workload Staffing Model, used to determine staff needs at land ports of entry.
11
8GAO, Standards for Internal Control in the Federal Government,
We also interviewed CBP and GSA officials about infrastructure needs at land border crossings and how these needs are identified and prioritized. We interviewed CBP officials about the agency’s staff allocation policies and processes and compared these with criteria in our previous work on human capital management and Standards for Internal Control in the Federal
GAO/AIMD-00-21.3.1 (Washington, D.C.: November 1999). These standards, issued pursuant to the requirements of the Federal Managers’ Financial Integrity Act of 1982, Pub. L. No. 97-255, 96 Stat. 814, provide the overall framework for establishing and maintaining internal control in the federal government. 9As described later in this report, automation of wait time data collection relies on Radio-Frequency Identification readers to read the unique signals from passing vehicles at several points along the border-crossing route. These data points are then automatically matched and analyzed to estimate the current wait time at that crossing. 10Project Management Institute, The Standard for Program Management©, Second Edition, (Newton Square, Pennsylvania: 2008). 11The SRA is a needs assessment process by which CBP collects and analyzes information about the infrastructure at each crossing along the northern and southwestern borders, identifies needs, and prioritizes infrastructure improvement projects. CBP officials reported conducting these assessments fiscal years 2003 through 2006.
Page 6 GAO-13-603 U.S.-Mexico Border
Government.12
To address the third objective, we reviewed documentation of CBP’s fiscal year 2013 performance goals, measures, and reports. We assessed CBP’s measures against criteria in Office of Management and Budget (OMB) Circular No. A-11 and useful practices GAO previously identified to enhance performance management and measurement processes.
We also analyzed CBP data on traffic volume and the number of primary lanes open during operating hours at the six crossings from fiscal years 2008 through 2012. We selected this time period for our data analyses to permit a trend analysis. Our data analyses are not generalizable to the entire southwest border, but represent trends at six high-volume crossings. To assess the reliability of these data sources, we reviewed documentation, interviewed agency officials, electronically tested the data, reviewed internal controls, and traced a selection of data to source files. We determined that the data were sufficiently reliable for the purposes of our report.
13
We also identified studies that quantified the economic impact of commercial vehicle wait times on cross-border commerce by searching literature and asking relevant interviewees whether they were aware of any such studies. We reviewed over 100 identified studies and analyzed the 6 studies that determined an economic impact of commercial vehicle
We also interviewed relevant DHS and CBP officials regarding CBP’s current performance measures and the extent to which CBP uses its wait time data to measure progress, among other things.
12See GAO, A Model of Strategic Human Capital Management, GAO-02-373SP (Washington, D.C.: March 2002), and GAO/AIMD-00-21.3.1. The first report describes a human capital model we developed that identifies eight critical success factors for managing human capital strategically. In developing this model, we built upon GAO’s Human Capital: A Self-Assessment Checklist for Agency Leaders, GAO/OCG-00-14G (Washington, D.C.: September 2000). Among other steps, we also considered lessons learned from GAO reports on public and private organizations that are viewed as leaders in strategic human capital management and managing for results. 13See OMB Circular No. A-11, Preparation, Submission, and Execution of the Budget (Washington, D.C.: Aug. 3, 2012). See also GAO, Managing for Results: Strengthening Regulatory Agencies’ Performance Management Practices, GAO/GGD-00-10 (Washington, D.C.: Oct. 28, 1999). In this report we gathered information from 23 federal and state organizations that we or other credible sources identified as using or planning to use a variety of useful practices to enhance specific aspects of their performance management and measurement processes. The organizations, although they had different missions, sizes, and organizational structures, said they consistently recognized that these practices are important in their efforts to develop a stronger results orientation.
Page 7 GAO-13-603 U.S.-Mexico Border
wait times on the southwest border. A more detailed description of our methodology and the results of these studies are presented in appendix I.
We conducted this performance audit from July 2012 to July 2013 in accordance with generally accepted government auditing standards. Those standards require that we plan and perform the audit to obtain sufficient, appropriate evidence to provide a reasonable basis for our findings and conclusions based on our audit objectives. We believe that the evidence obtained provides a reasonable basis for our findings and conclusions based on our audit objectives. Additional details on our scope and methodology are contained in appendix II.
In addition to CBP, various agencies have responsibilities for facilitating trade at land ports of entry and conducting inspections of commercial vehicles. GSA oversees design, construction, and maintenance for all ports of entry in consultation with CBP. In consultation with GSA, CBP develops an investment plan to manage the modernization of the land ports of entry inventory. Within DOT, FHWA provides funding for highway and road construction. In addition, the Federal Motor Carrier Safety Administration and state DOTs in some states—Arizona, Texas, and California on the southwest border—may conduct commercial vehicle inspections at or adjacent to land ports of entry to ensure compliance with federal and state-specific safety standards.
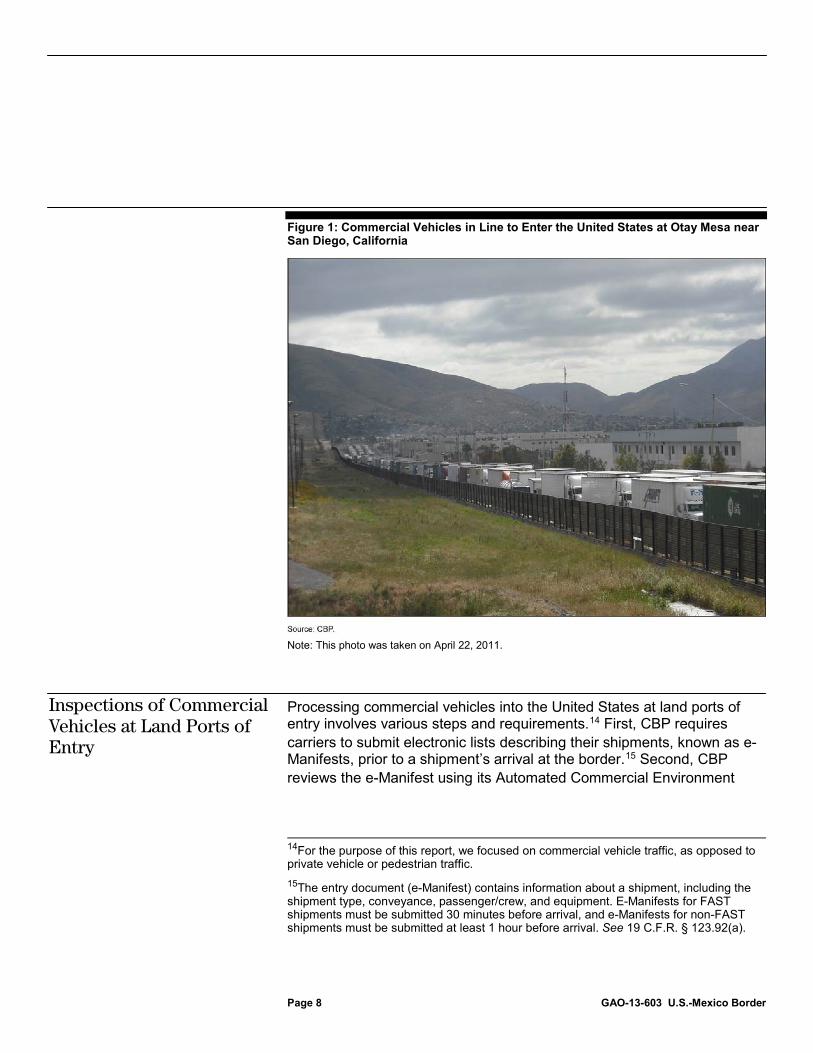
In executing its mission, CBP operates 168 land border crossings, which vary in size, location, and commercial traffic volume. Of these, 46 crossings are located on the southwest border, and 24 of these crossings process commercial vehicle traffic. The four largest land border ports of entry on the southwest border by commercial vehicle traffic volume are Laredo, Texas; Otay Mesa, California; El Paso, Texas; and Calexico East, California. See figure 1 for a picture of commercial vehicles in line to enter the United States at the Otay Mesa border crossing near San Diego, California.
Background
Agencies’ Responsibilities at Land Ports of Entry
Page 8 GAO-13-603 U.S.-Mexico Border
Figure 1: Commercial Vehicles in Line to Enter the United States at Otay Mesa near San Diego, California
Note: This photo was taken on April 22, 2011.
Processing commercial vehicles into the United States at land ports of entry involves various steps and requirements.14 First, CBP requires carriers to submit electronic lists describing their shipments, known as e-Manifests, prior to a shipment’s arrival at the border.15
14For the purpose of this report, we focused on commercial vehicle traffic, as opposed to private vehicle or pedestrian traffic.
Second, CBP reviews the e-Manifest using its Automated Commercial Environment
15The entry document (e-Manifest) contains information about a shipment, including the shipment type, conveyance, passenger/crew, and equipment. E-Manifests for FAST shipments must be submitted 30 minutes before arrival, and e-Manifests for non-FAST shipments must be submitted at least 1 hour before arrival. See 19 C.F.R. § 123.92(a).
Inspections of Commercial Vehicles at Land Ports of Entry
Page 9 GAO-13-603 U.S.-Mexico Border
database, among others, and assigns a risk level to the shipment.16 Next, the commercial vehicle proceeds into the United States and to a primary inspection booth at the U.S. port of entry, where a CBP officer reviews documentation on the exporter, importer, and goods being transported. If the documentation is consistent with CBP requirements and no further inspections are required, the truck is allowed to pass through the port. Depending on the port of entry, goods imported, or law enforcement requirements, CBP may direct the commercial truck to secondary inspection. According to CBP, trucks are referred to secondary inspection for numerous reasons, such as officer’s initiative, targeted inspection, or random inspection.17 Secondary inspection involves more detailed document processing and examinations using other methods including gamma ray imaging systems and advanced radiation portal monitors or unloading and physical inspection.18 Trucks that require secondary inspection may be inspected by more than one federal agency, depending on their cargo.19
16CBP uses various databases and tools, including the Automated Targeting System, Automated Commercial Environment, and local Advance Targeting Units (ATU) to screen and assign risk levels to travelers and cargo entering the United States.
See figure 2 for an illustration of the steps in the commercial vehicle inspection process at land ports of entry.
17According to CBP, officers select shipments for targeted inspection based on several factors. Specifically, shipments may be selected for targeted inspection based on information provided by the ATUs, Manifest Review Units, Document Analysis Units, and other specialized enforcement units. The ATUs use information from the Automated Targeting System or Automated Commercial Environment to review manifest data prior to the shipments crossing into the United States. The Manifest Review Units are responsible for analyzing manifests, which list in detail the total cargo of shipments. Examples of data elements on a manifest include shipper, point and country of origin of goods, export carrier, and description of packages and goods. The Document Analysis Units are responsible for analyzing fraudulent documents. 18Prior to the primary inspection booths, CBP also screens commercial traffic using radiation portal monitors to detect nuclear and radiological materials. Radiation portals are capable of detecting various types of radiation emanating from nuclear devices, dirty bombs, special nuclear materials, natural sources, and isotopes commonly used in medicine and industry. Unlike gamma ray imaging systems—such as CBP’s Vehicle and Cargo Inspection System—these devices do not produce images, but are passive systems that alert when energy emitted by radioactive sources is detected. 19For example, according to officials with the U.S. Department of Health and Human Services’ Food and Drug Administration (FDA), FDA personnel conduct public health inspections on incoming commercial vehicles on the southwest border in an effort to ensure that food and food products from abroad meet U.S. standards.
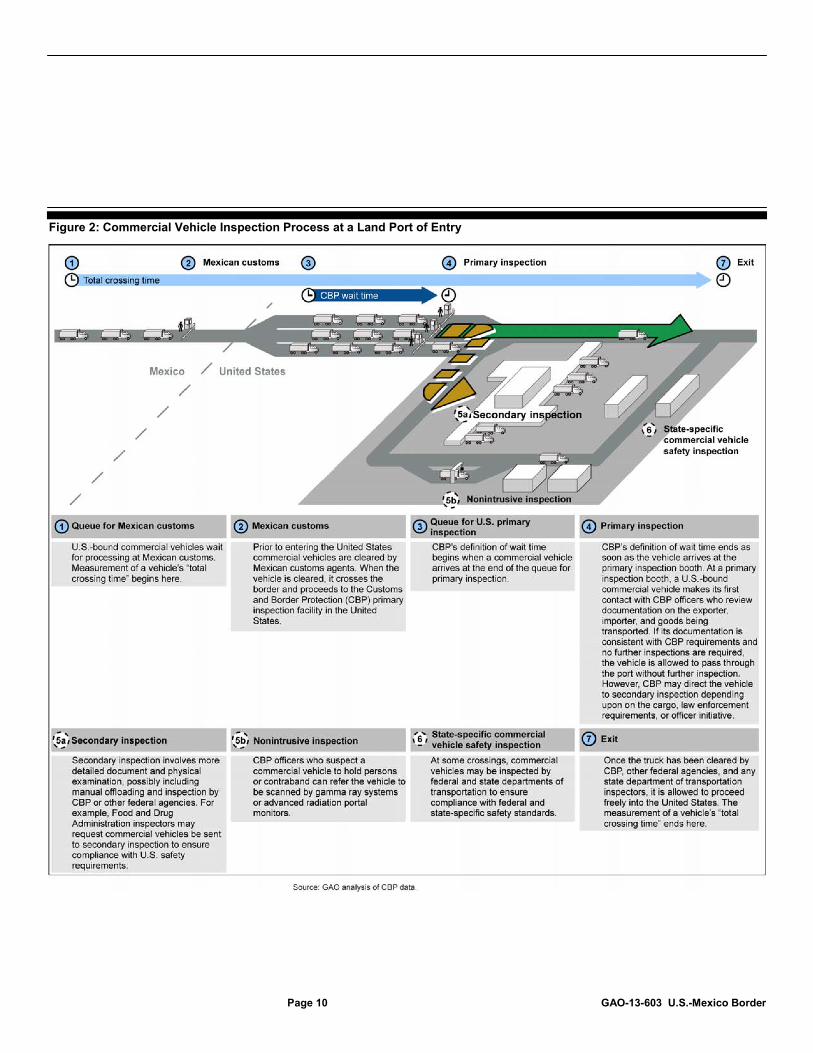
Page 10 GAO-13-603 U.S.-Mexico Border
Figure 2: Commercial Vehicle Inspection Process at a Land Port of Entry
Page 11 GAO-13-603 U.S.-Mexico Border
To facilitate the travel of low-risk screened shipments across the border, CBP created the FAST program, which is intended to secure and facilitate legitimate trade by providing expedited processing of participants’ merchandise in designated traffic lanes at select border crossings, fewer referrals to secondary inspections, “front-of-the-line” processing for CBP secondary inspections, and enhanced security.20 To be eligible to receive the benefits of the FAST program, every link in the supply chain—the carrier, the importer, and the manufacturer—is required to be certified under the Customs and Trade Partnership Against Terrorism (C-TPAT) program and the driver must be preapproved for participation in the FAST program.21
CBP defines border wait time as the time it takes for a vehicle to travel from the end of the queue—which may be in Mexico or the United States, depending on the length of the line—to the CBP primary inspection point in the United States. See figure 2 for an illustration of these points in the border-crossing process. As a service to the traveling public and the trade community, CBP began publicly reporting hourly wait time data through a web page on CBP.gov in early 2004, and currently reports these data for 42 of 46 crossings on the southwest border. CBP began formally collecting commercial and private passenger vehicle wait times on a daily basis in late September 2001 in response to the delays experienced immediately after September 11, 2001, when heightened enforcement efforts resulted in significant delays at many land border ports of entry. Over time, the collection of wait time data evolved as additional crossings were added and the amount of information collected was expanded. CBP reported that it is important that the trade community have current and consistent wait times on the CBP web site, noting that the web site is the only source of wait time information at many locations.
20Front-of-the-line processing refers to opportunities at some crossings for FAST vehicles to begin their secondary inspection before non-FAST vehicles when there is a backup of traffic waiting for secondary inspection. 21C-TPAT is a customs-to-business partnership program that provides benefits to supply chain companies that agree to comply with predetermined security measures.
CBP Public Reporting of Border Crossing Wait Time Data
Page 12 GAO-13-603 U.S.-Mexico Border
Some border stakeholders, such as those in the private sector, find “total crossing time” to be a more useful measure than CBP’s definition of wait time. Unlike CBP’s narrower “wait time” measure, which captures the time it takes for a vehicle to travel from the end of the queue to the CBP primary inspection point, total crossing time is generally defined as the total time elapsed from entering the line in Mexico leading to Mexican export inspection through exit from U.S. inspection facilities, including any U.S. state-conducted inspections. See figure 2 for an illustration of the differences between these two measurements.
CBP has developed a workload staffing model to determine the optimum number of CBP officers that each port of entry needs to accomplish its mission responsibilities at its land, air, and sea ports of entry. This model existed in different versions, beginning in fiscal year 2006. The conference report for the fiscal year 2007 DHS appropriations act, expressing concern regarding CBP’s ability to align staffing resources to mission requirements, directed CBP to submit a resource allocation model for staffing requirements that would explain CBP’s methodology for aligning staffing levels with threats, vulnerabilities, and workload across all mission areas.22 In April 2013, CBP submitted the most recent version of its workload staffing model to Congress in response to language in the conference and committee reports for the fiscal year 2012 DHS appropriations.23
DHS has received appropriations to support increased staffing levels for CBP officers on the southwest border over the last 5 fiscal years. For example, the conference report accompanying the fiscal year 2009 supplemental appropriation indicated that it included $30 million to fund the hiring of up to 125 CBP officers for the southwest border, and the fiscal year 2010 emergency supplemental appropriation for border
22H.R. Rep. No. 109-699, at 126 (2006) (Conf. Rep.). The explanatory statement for the fiscal year 2008 consolidated appropriations act noted that CBP had submitted the resource allocation model and had developed a workload staffing model to generate estimates of staffing needed to meet workload and mission requirements. 23H.R. Rep. No. 112-331, at 958 (2011) (Conf. Rep.); H.R. Rep. No. 112-91, at 27-28 (2011); S. Rep. No. 112-74, at 31 (2011).
CBP Staff at Land Border Crossings
Page 13 GAO-13-603 U.S.-Mexico Border
security included $29 million for hiring additional CBP officers for southwest border land ports of entry.24
CBP and GSA have assessed infrastructure needs at all land border crossings over the last 9 fiscal years. From fiscal years 2004 to 2006, CBP assessed its complete portfolio of land port of entry facilities and identified infrastructure investment needs through its SRA process. The SRA includes architectural and analytical assessments of land port of entry inspection facilities’ condition and operations as well as relevant regional planning data and studies. Appendix III provides more information regarding CBP’s SRA process.
GSA has also assessed land port of entry infrastructure needs when planning and designing land port of entry renovation projects. For example, before undertaking construction, GSA evaluates the design of projects to renovate, expand, or construct a new land port of entry using its BorderWizardTM program—a program used to simulate projected traffic flow through the proposed facility to help identify potential deficiencies, such as insufficient primary inspection lanes.25
See appendix IV for more information on completed, ongoing, or planned infrastructure improvement projects at southwest border land ports of entry for fiscal years 2008 through 2012.
24H.R. Rep. No. 111-151, at 110 (2009) (Conf. Rep.); Pub. L. No. 111-230, 124 Stat. 2485, 2485 (2010). 25BorderWizardTM analyses include factors such as projected traffic volume, workload processing time, and the proposed infrastructure improvements. The analysis does not take into account staffing levels at the port of entry.
Assessments of Port Infrastructure
Page 14 GAO-13-603 U.S.-Mexico Border
CBP policy identifies two methodologies to be used by ports of entry for manually calculating wait times for commercial vehicles; however, challenges in implementing these methodologies contribute to CBP wait time data being of limited usefulness for public reporting and management decision making across border crossings. Specifically, CBP policy provides port directors two options for manually calculating wait times at the border crossings they oversee: (1) line-of-sight and (2) driver survey. Port directors for each crossing are to choose which methodology to use based primarily on a consideration of the infrastructure layout of each crossing. CBP officers at border crossings are to use the first methodology when the end of the line is visible via the naked eye or camera. In accordance with this methodology, the CBP supervisor at the crossing is to estimate wait time based on traffic volume, number of lanes open, and where the end of the queue occurs relative to landmarks (i.e., foot of bridge, building, or intersection). When the end of the line is not visible, CBP policy recommends that officials estimate wait times using the second methodology—asking at least five drivers how long they have been waiting in the queue, dropping the highest and lowest responses, and averaging the rest.
CBP’s October 2007 interim guidance, which prescribes these two methodologies to calculate wait times, states that “it is critically important that all locally posted wait times for ports or crossings are reasonably accurate and are uniformly reported by all stakeholders.” In addition, CBP’s May 2008 memorandum on land border wait time measurement states that “the importance of accurate land border wait time measures cannot be understated. Efficient and reliable land border wait time measures help to facilitate the movement of people and goods across our
CBP’s Wait Time Data Are Unreliable for Informing the Public and CBP Management Decisions, and CBP Has Not Assessed the Feasibility of Automated Data Collection Options
Wait Time Data Are Unreliable and of Limited Usefulness; CBP Has Not Taken Steps to Improve Its Current Wait Time Estimation Methodology
Page 15 GAO-13-603 U.S.-Mexico Border
border and directly impact the economic health of border communities and the nation as a whole.” Among the six crossings we visited, Mariposa used driver surveys, and the remaining five crossings used line of sight to estimate wait times. However, CBP’s wait time data are of limited usefulness for public reporting and management decision making across border crossings because of three key factors: (1) CBP officers inconsistently implemented the line-of-sight methodology; (2) the other CBP-approved methodology, driver surveys, is inherently unreliable; and (3) CBP officials use different methodologies to calculate wait times across land border crossings.26
Inconsistent implementation of line-of-sight methodology: Port directors at the five crossings we visited that primarily used the line-of-sight methodology cited implementation challenges resulting in data that are not reliable for management decisions and informing the public.
27
• At all five of the crossings, the end of the queue at times extended beyond the landmarks used in the line-of-sight methodology and none had a camera system in place with the capacity to consistently view the end of queues. Two crossings—World Trade Bridge and Columbia Solidarity Bridge—had camera systems that allowed officials to view the queue several miles into Mexico, but CBP officers noted that it could not be used to see the end of the queue on hazy and dusty days. CBP previously reported in a fiscal year 2008 WHTI program office study on the reliability of CBP’s methods for calculating commercial vehicle wait times that if officials cannot see the end of the line, they cannot accurately gauge the full duration of wait times.
Specifically:
• At two crossings—World Trade Bridge and Columbia Solidarity Bridge—senior field office and port officials noted that there were frequently gaps between groups of trucks in the queue and that at one of these crossings trucks comingled with private cars on the bridge
26CBP officials responsible for maintaining CBP’s wait time data and others noted that they do not maintain information on the wait time calculation methodologies used at each crossing. They reported that they would have to ask officials at each crossing to develop such a list. 27CBP officials at three of the five crossings that reported primarily using the line-of-sight methodology also reported using the driver survey methodology at times, such as during construction or to routinely check their line-of-sight methodology.
Page 16 GAO-13-603 U.S.-Mexico Border
leading up to the primary inspection booths for commercial traffic. According to these officials, these factors hinder officers’ ability to accurately determine the full duration of wait times as gaps or cars between commercial vehicles may make wait times appear to be longer or shorter than they actually are.
• At one crossing—Otay Mesa—CBP officers used the line-of-sight methodology but did not consider the number of primary inspection lanes open, as required by CBP policy.28
Driver survey methodology is unreliable: CBP’s fiscal year 2008 WHTI study on the reliability of CBP’s methods for calculating commercial vehicle wait times stated that driver surveys have been shown to be consistently inaccurate when measuring wait time in part because they measure the wait time of travelers currently at the front of the queue, not the expected wait time of travelers currently at the end of the queue. As a result, if queuing conditions quickly change, the wait times collected using this methodology become inaccurate. In addition, Port officials at Mariposa used driver surveys as the crossing’s primary method of estimating wait times, but noted that the methodology produced unreliable wait time data. Senior CBP officials at this crossing reported that officers had to use driver surveys to estimate wait times because a curve in the road leading up to the crossing obstructs officers’ view of the queue, thereby preventing the crossing from using the line-of-sight approach. Senior CBP officials at this crossing stated that driver survey is an unreliable methodology because of survey bias—drivers may be inclined to report longer or shorter wait times than they actually experienced.
The number of lanes open to commercial vehicle traffic influences the rate at which traffic moves through primary inspection. CBP’s fiscal year 2008 WHTI study on the reliability of CBP’s methods for calculating commercial vehicle wait times notes that the number of lanes open greatly affects wait time, so not considering the number of lanes open limits CBP’s ability to accurately estimate wait times using the line-of-sight methodology.
Different methodologies across land border crossings: Port directors choose between the two CBP-approved methodologies to estimate wait times in accordance with CBP policy; however, OFO and OA headquarters officials stated that the use of different methodologies at
28CBP officials at Otay Mesa did not respond to our question about why the number of primary inspection lanes was not considered.
Page 17 GAO-13-603 U.S.-Mexico Border
crossings precludes comparison of data across locations in making management decisions. Although officials at each crossing determine which of the two methodologies to use based on the layout of each crossing and other local characteristics, the use of different methodologies at crossings makes CBP’s wait time data unreliable for comparison across southwest border crossings, as they may produce different results. OFO and OA headquarters officials told us that because of the different methodologies used at different crossings, the wait time data are not comparable across crossings and therefore are of limited use in making resource allocation decisions.
In light of these challenges in implementing CBP’s approved methodologies for estimating wait times, CBP’s wait time data do not allow for reliable trend analysis to show the extent of wait times within or across southwest border crossings. Industry representatives at two of the six crossings we visited reported that, in their view, the actual wait times commercial vehicle drivers experienced were often longer than those CBP publicly reported. For example, industry representatives at the roundtable we convened in Nogales reported their view that wait times, as defined by CBP, were at times up to 2 hours longer than those CBP publicly reported. Industry representatives at two other crossings reported that CBP’s wait time data were generally accurate.29
Wait time data currently reported on CBP’s public website are of limited usefulness to inform industry and the public because of the data
In addition, three organizations that commissioned studies to quantify the economic impact of wait times at southwest border crossings did not use CBP’s wait time data as the basis for their studies but rather collected original wait time data by, for example, using cameras to photograph trucks’ license plates at various points along the border-crossing routes and then matching these photographs to identify the wait time of each vehicle. (See appendix I for the results of these studies.) Because of these various limitations, we and others cannot use CBP’s wait time data to analyze the extent of current wait times across border crossings on the southwest border or determine historical trends.
29Officials at these two crossings noted that CBP’s wait time data are of limited usefulness because they do not capture total crossing time. Industry representatives we met with at the remaining two of six crossings indicated the need for a standardized system for wait time measurement but did not specifically indicate whether CBP’s wait time data were longer or shorter than actual waits they experienced.
Page 18 GAO-13-603 U.S.-Mexico Border
limitations we identified and because they do not reflect the total border crossing time. None of the industry stakeholders representing 21 companies and associations we met with over the course of our study reported using CBP’s wait time data because they questioned the accuracy of the data. Industry representatives at the roundtables we convened in Nogales, San Diego, and Laredo said that more reliable wait time data would be useful to, for example, help businesses improve the efficiency of their operations and to make informed decisions including where to build new facilities, how much inventory to maintain, when and how frequently to send shipments across the border, and when to schedule truckers’ or manufacturing plant employees’ shifts. In addition, industry representatives at our roundtables in El Paso and San Diego noted that they did not use CBP’s wait time data because the data did not provide information on the duration of the complete border-crossing experience—total crossing time—a more comprehensive measure that would be helpful in making business decisions.30
In addition, according to CBP headquarters officials, these wait time data are also not sufficiently reliable to inform CBP management decisions—more specifically, decisions on staffing and infrastructure investments—and officers at the six crossings we visited told us that they use the wait time data in limited ways. At the headquarters level, OFO officials stated that because of data limitations, CBP’s wait time data are not useful for comparison across crossings and explained that they do not use the data as a basis for determining staffing needs or allocating staff across field offices but rather rely on CBP’s traffic volume data as a proxy.
A 2008 study commissioned by the Department of Commerce also found it was important to use a measure of total crossing time to capture the border-crossing system as a whole, and to account for the fact that wait time associated with U.S. primary inspection was not the sole driver of total wait time for commercial vehicles. Instead, they reported that delays were due to several factors, including many outside U.S. federal control. FHWA officials acknowledge the value of total crossing time and are piloting projects to automate such data collection.
31
30CBP officials report that industry’s interest in total crossing time may present an opportunity for CBP to engage in a public-private partnership.
A senior
31According to CBP officials and documents, CBP’s workload staffing model does not (1) consider CBP’s current wait time data as an input, or (2) assume a certain wait time goal because the model is not designed to calculate different results depending on performance-related goals, such as meeting wait time service goals.
Page 19 GAO-13-603 U.S.-Mexico Border
OFO human capital official explained that the wait time data are not systematically compared across ports but ports with known chronic wait time problems do get consideration in staff allocation decisions. Similarly, OA headquarters officials stated that they do not use wait time data to prioritize infrastructure improvement projects because of concerns about the reliability of CBP’s wait time data. However, CBP field office and port officials reported using their existing wait time data to a limited extent to inform management decisions in the field. Specifically, senior CBP officials at the six crossings we visited reported using wait time data as one of various factors considered when, for example, allocating staff across crossings and shifts, overtime decisions, and as support for white papers sent to headquarters requesting funding for infrastructure improvement projects. CBP officials at the six crossings we visited reported that more reliable wait time data would be useful to them in making such decisions. For example, CBP officials at each of these crossings stated that more reliable wait time data would help them in making staffing decisions.
CBP does not have efforts underway or planned to help port officials overcome challenges to consistent implementation of existing wait time estimation methodologies. For example, CBP has not fully implemented recommendations from a fiscal year 2008 CBP study that could help the agency implement its current wait time estimation methodologies more reliably. In fiscal year 2008, CBP’s WHTI program office studied the reliability of CBP’s methods for calculating commercial vehicle wait times and identified six recommendations, three of which could, in part, help address the limitations discussed above. The recommendations directed CBP to, among other things (1) use closed-circuit television cameras to measure wait time in real time; (2) provide a standardized measurement and validation tool, such as a useful and well-documented benchmarking system; and (3) continue to monitor and evaluate applications of transportation technologies at the border that allow for better
Page 20 GAO-13-603 U.S.-Mexico Border
measurement and reporting of wait times.32
CBP guidance identifies the importance of reliable wait time measurement to facilitate the movement of people and goods across the border. Further, Standards for Internal Control in the Federal Government calls for agencies to establish controls, such as those provided through policies and procedures, to ensure the accuracy and timeliness of data. Control activities that ensure the prompt, complete, and accurate recording of data help to maintain their relevance and value to
CBP headquarters officials from three offices—the office that sponsored the report (Land Border Integration), the office in charge of cargo operations (Cargo Conveyance and Security), and the office that maintains the agency’s wait time data (Planning Program Analysis and Evaluation)—were all unclear as to the steps, if any, that had been taken to address the first two recommendations and which office was responsible for implementing them. With regard to the first recommendation, an official we met with in Cargo Conveyance and Security said that some crossings had access to cameras that helped them view the end of the line, but this official did not know how many crossings on the southern border had cameras for this purpose and further stated that there were no plans to expand camera availability to improve wait time data reliability. With regard to the second recommendation, this Cargo Conveyance and Security official stated that CBP had not taken steps to develop a standardized wait time measurement and validation tool and had no plans to do so. However, CBP officials with Land Border Integration and Planning, Program Analysis, and Evaluation stated that CBP had implemented the third recommendation by continuing to monitor and evaluate applications of transportation technologies in its work with FHWA to pilot projects for automating data collection.
32In making the first recommendation, the report notes that for various geographical reasons it is often difficult for cameras positioned on the U.S. side to provide adequate views of queues. Therefore, the report recommends that, where possible, CBP work to leverage use of cameras in use by stakeholders on or near land border crossings. With regard to the second recommendation to provide a standardized measurement and validation tool, the report further specifies that such a tool could include a spreadsheet with formulas taking into account the local benchmarks used to identify the end of the line, the number of inbound lanes, the average processing time, and the number of open primary booths, among other variables, in order to determine wait time. The report also included three other recommendations including the following: (1) provide administrative support to ensure accurate wait time reporting and reduce CBP officer workload, (2) increase the timeliness and frequency of wait time updates on CBP’s website to a minimum of 30 minutes or less, and (3) provide video feeds to the CBP website.
Page 21 GAO-13-603 U.S.-Mexico Border
management in controlling operations and making decisions. In the near term, identifying and carrying out steps that can be taken to help CBP officials overcome challenges to consistent implementation of existing wait time estimation methodologies—such as implementing past CBP recommendations to expand the use of cameras to see the ends of queues and providing standardized wait time measurement and validation tools—could improve the reliability and usefulness of CBP’s current wait time data.
In February 2008, FHWA, in coordination with state DOTs and CBP, initiated pilot projects to develop automated wait time data collection methods at select southwest border crossings. Automation of wait time data collection relies on Radio-Frequency Identification readers to read the unique signals from passing vehicles at several points along the border-crossing route. These data points are then automatically matched and analyzed to estimate the current wait time at that crossing. As of March 2013, FHWA and state DOTs in Arizona, California, and Texas had eight pilot projects under way or completed to automate and standardize calculation of both wait time and total crossing time at eight crossings on the southwest border, including projects at each of the six crossings we visited.33 Wait time data resulting from some of these pilots is currently shared on a publicly available website with updates every 10 minutes.34 These eight projects were initiated on a crossing-by-crossing basis and are in various stages of implementation—one completed and seven ongoing. Two additional projects are planned so senior FHWA officials expect automated wait time data to be available at 10 crossings by 2015 at which point current federal funding commitments for these projects end.35
CBP headquarters and field officials, as well as FHWA and a Texas Department of Transportation official, cited a range of potential benefits
33The completed pilot project was at Otay Mesa (Otay Mesa, California) and the ongoing projects are at Pharr (Pharr, Texas), Bridge of the Americas (El Paso, Texas), Ysleta (El Paso, Texas), World Trade Bridge (Laredo, Texas), Columbia Solidarity Bridge (Laredo, Texas), Veterans (Brownsville, Texas), and Mariposa (Nogales, Arizona). 34The website is http://bcis.tamu.edu. 35Automation projects are planned at Santa Teresa (Santa Teresa, New Mexico) and Camino Real International Bridge (Eagle Pass, Texas).
CBP Has Not Assessed the Feasibility of New Automation Options
Page 22 GAO-13-603 U.S.-Mexico Border
that could result from automating border wait time measurement. CBP’s fiscal year 2008 WHTI report found that the long-term solution to standardize wait time measurement is to take advantage of automation technology. CBP headquarters, field office, and port officials told us that automation would reduce the burden on staff of manually collecting wait time data and increase staff availability for security efforts and other tasks. OFO headquarters officials also stated that automation would increase the accuracy, reliability, and timeliness of the wait time data that are collected and disseminated. Moreover, they stated that automated data would come from a more independent source, and thus the data may be perceived by industry organizations as more accurate than CBP’s current data. This would reduce the burden on CBP officials to respond to queries about their wait time data, according to CBP officials. OFO headquarters officials and senior CBP officials at the six crossings we visited reported that accurate wait time data would facilitate CBP management decisions such as staffing needs, infrastructure investment, performance management (such as evaluating efforts to mitigate wait times), and operations planning at land ports of entry. In addition, CBP officials at four of the six crossings reported automation could provide data on CBP’s definition of wait time as well as total border-crossing time. This could provide CBP with more holistic information on the complete border-crossing experience, thereby improving CBP’s ability to identify and address bottlenecks and providing industry stakeholders with more useful data to inform their business processes.
At the same time, CBP officials reported limitations of the current automation pilot projects. In 2011, CBP commissioned a study to review the quality of the data resulting from the Texas-based pilot projects and found the automated wait time data were not yet sufficiently accurate for CBP’s purposes. In response to these findings, CBP worked with pilot project officials to modify the algorithm used to calculate the wait times, with the intention to improve the accuracy of the data. Another concern raised by CBP officials is that none of the pilots are yet able to consistently differentiate between wait times for FAST and non-FAST traffic. Not capturing separate wait time data for FAST and non-FAST traffic could limit the usefulness for key industry stakeholders and limit CBP’s ability to measure whether FAST participants are experiencing reduced wait times, as set forth in FAST program goals. FHWA officials reported that the technology solutions used in the current pilot projects are flexible enough to enable adding more readers to differentiate results for FAST and non-FAST traffic, but none of the current pilot projects are gathering data for this purpose, and FHWA officials reported that they have no plans to conduct additional research on solutions that
Page 23 GAO-13-603 U.S.-Mexico Border
differentiate between FAST and non-FAST traffic. In addition, CBP officials note that there are no pilot programs to automate wait time data collection at 34 of the 42 southwest border crossings where CBP currently reports hourly wait times.
CBP, as the lead agency in collecting and reporting wait time data and the sole source of wait time data across the southwest border, does not have plans to oversee or manage these automation projects, although FHWA and others are anticipating an expanded CBP role once the pilot phases conclude. FHWA officials have led the research phase of these projects but expect their role to decline as the pilot phases end, and they are looking to others to manage these efforts in the longer term. FHWA has taken a lead role in the research, testing, and evaluation of wait time automation technology including fully funding the pilot projects at the Bridge of the Americas and Otay Mesa and providing limited financial support for others. However, FHWA officials stated that they do not plan to fund these projects after the pilot phases end. CBP has coordinated with FHWA by, for example, consulting on the algorithms used to project wait times, but CBP has not provided funding for the projects on the southwest border. CBP officials reported that they do not intend to fund, adopt, or otherwise oversee these wait time automation projects once the pilot phases supported by FHWA and state DOTs conclude because CBP officials stated that they want another entity, such as FHWA or state DOTs, to do so. Texas Department of Transportation officials report that they are committed to continuing the Texas-based pilot projects in the short term, but are looking for another source of funding, possibly CBP or others to support the projects in the future. There are no other such commitments for the pilots in other states. CBP officials report that they are in discussion with FHWA about collaborative approaches to continuing these efforts, such as public-private partnerships.
CBP officials stated that the agency has not taken action to improve or modify its current methods for collecting and reporting wait time data in the short-term because officials believe that automated collection of wait time data is the most effective way to obtain reliable, standardized data, and the current automation projects are still in development. However, CBP has not assessed the feasibility of replacing or supplementing current methods of manually calculating wait times with the automated methods piloted by DOT or other means. Assessing the feasibility could include assessing all of the associated costs and benefits, options for how the agency will use and publicly report the results of automated data collection, the potential trade-offs associated with moving to this new system, and other factors such as those influencing the possible
Page 24 GAO-13-603 U.S.-Mexico Border
expansion of automation efforts to the 34 other locations that currently report wait times but have no automation project under way. OFO officials stated that CBP has not considered assessing the feasibility of automating wait time data collection and does not have estimates of potential costs or time frames because the pilot projects are still in development and CBP management has not committed to automating wait time data collection. However, standards for program management call for the feasibility of programs to be assessed early on.36
Given that CBP officials have stated that automated data collection is the most effective method for obtaining standardized and reliable wait time data, conducting an assessment of the feasibility of the methods piloted by FHWA or other automation methods, in consultation with FHWA and state DOTs, could help CBP determine how to best achieve its goal of improving the reliability of its publicly reported wait time data.
36Project Management Institute, The Standard for Program Management©, Second Edition.
CBP Analyses and Officials Identified Some Infrastructure and Staff Needs, but the Methodology Used to Allocate Staff across Ports of Entry Has Not Been Documented
Page 25 GAO-13-603 U.S.-Mexico Border
CBP analyses and port officials identified needs for additional infrastructure—such as more lanes—at some border crossings, and our analysis of CBP data on lane use generally supported agency views on the extent to which CBP opens lanes at the six crossings we visited. Further, our analysis supports CBP officials’ statements that they generally open and close primary inspection lanes in response to fluctuations in commercial traffic volume, but some port officials cited constraints to opening more lanes during times of peak traffic.
CBP and GSA assessments and officials identified current infrastructure limitations affecting commercial vehicle processing at three of the six crossings we visited. Specifically, CBP and GSA assessments and CBP officials cited infrastructure limitations related to an insufficient number of primary lanes at Otay Mesa, insufficient space for secondary inspections at Otay Mesa and World Trade Bridge, and poor facility layout as well as an insufficient number of exit gates at Bridge of the Americas.37
CBP port of entry officials for two of the three remaining crossings we visited stated that current infrastructure was sufficient to process commercial traffic at Columbia Solidarity Bridge and Ysleta. At the last crossing, Mariposa, CBP port officials reported that infrastructure would be sufficient once GSA’s ongoing project to replace and expand the port is completed in the fall of 2014. Table 1 summarizes the infrastructure needs identified in CBP or GSA assessments as well as those identified by CBP port officials at the six crossings we visited.
37Upon arriving at the border crossing, traffic waiting to enter the United States queues up in primary inspection lanes that lead to primary inspection booths where a CBP officer reviews documentation on the exporter, importer, and goods being transported. If no further inspections are required, the vehicle is allowed to enter the United States. Secondary inspections occur when a vehicle is referred by the primary line officer for further inspection, including gamma ray scans, paperwork, and physical examinations.
CBP Analyses and Officials Indicated Need for Additional Infrastructure at Some Crossings, and Our Analysis of Data on Primary Lane Use Generally Supported These Assessments
Page 26 GAO-13-603 U.S.-Mexico Border
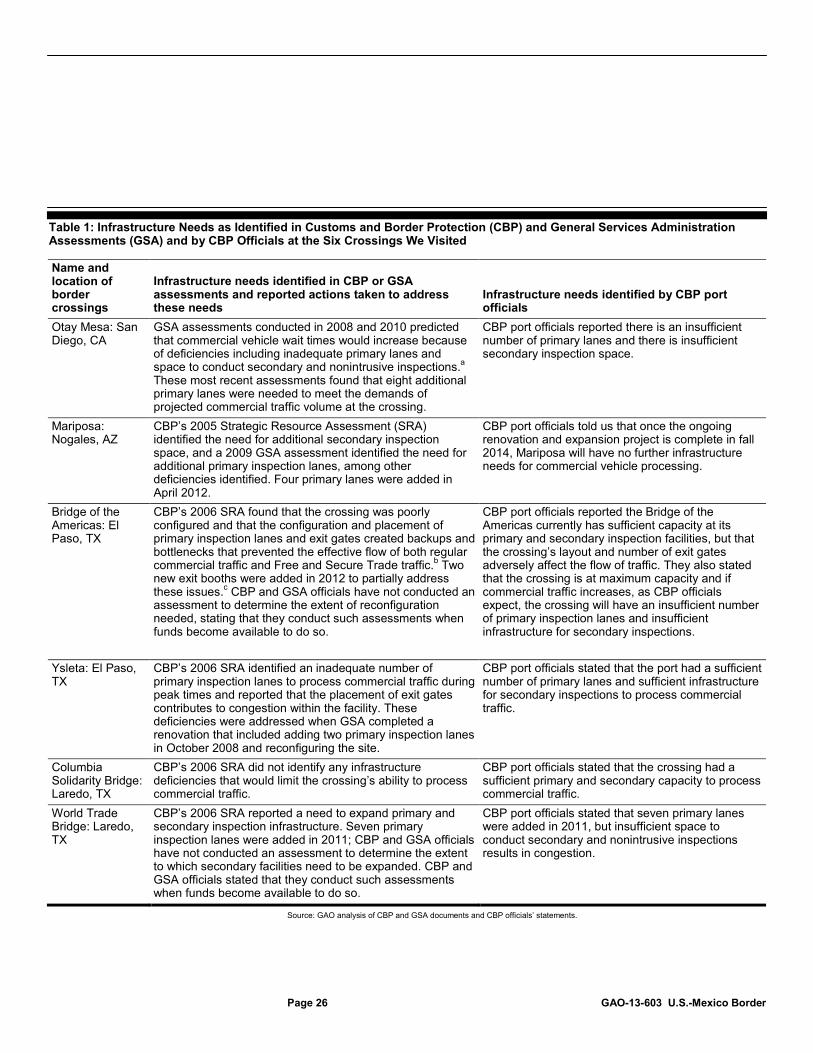
Table 1: Infrastructure Needs as Identified in Customs and Border Protection (CBP) and General Services Administration Assessments (GSA) and by CBP Officials at the Six Crossings We Visited
Name and location of border crossings
Infrastructure needs identified in CBP or GSA assessments and reported actions taken to address these needs
Infrastructure needs identified by CBP port officials
Otay Mesa: San Diego, CA
GSA assessments conducted in 2008 and 2010 predicted that commercial vehicle wait times would increase because of deficiencies including inadequate primary lanes and space to conduct secondary and nonintrusive inspections.a These most recent assessments found that eight additional primary lanes were needed to meet the demands of projected commercial traffic volume at the crossing.
CBP port officials reported there is an insufficient number of primary lanes and there is insufficient secondary inspection space.
Mariposa: Nogales, AZ
CBP’s 2005 Strategic Resource Assessment (SRA) identified the need for additional secondary inspection space, and a 2009 GSA assessment identified the need for additional primary inspection lanes, among other deficiencies identified. Four primary lanes were added in April 2012.
CBP port officials told us that once the ongoing renovation and expansion project is complete in fall 2014, Mariposa will have no further infrastructure needs for commercial vehicle processing.
Bridge of the Americas: El Paso, TX
CBP’s 2006 SRA found that the crossing was poorly configured and that the configuration and placement of primary inspection lanes and exit gates created backups and bottlenecks that prevented the effective flow of both regular commercial traffic and Free and Secure Trade traffic.b Two new exit booths were added in 2012 to partially address these issues.c CBP and GSA officials have not conducted an assessment to determine the extent of reconfiguration needed, stating that they conduct such assessments when funds become available to do so.
CBP port officials reported the Bridge of the Americas currently has sufficient capacity at its primary and secondary inspection facilities, but that the crossing’s layout and number of exit gates adversely affect the flow of traffic. They also stated that the crossing is at maximum capacity and if commercial traffic increases, as CBP officials expect, the crossing will have an insufficient number of primary inspection lanes and insufficient infrastructure for secondary inspections.
Ysleta: El Paso, TX
CBP’s 2006 SRA identified an inadequate number of primary inspection lanes to process commercial traffic during peak times and reported that the placement of exit gates contributes to congestion within the facility. These deficiencies were addressed when GSA completed a renovation that included adding two primary inspection lanes in October 2008 and reconfiguring the site.
CBP port officials stated that the port had a sufficient number of primary lanes and sufficient infrastructure for secondary inspections to process commercial traffic.
Columbia Solidarity Bridge: Laredo, TX
CBP’s 2006 SRA did not identify any infrastructure deficiencies that would limit the crossing’s ability to process commercial traffic.
CBP port officials stated that the crossing had a sufficient primary and secondary capacity to process commercial traffic.
World Trade Bridge: Laredo, TX
CBP’s 2006 SRA reported a need to expand primary and secondary inspection infrastructure. Seven primary inspection lanes were added in 2011; CBP and GSA officials have not conducted an assessment to determine the extent to which secondary facilities need to be expanded. CBP and GSA officials stated that they conduct such assessments when funds become available to do so.
CBP port officials stated that seven primary lanes were added in 2011, but insufficient space to conduct secondary and nonintrusive inspections results in congestion.
Source: GAO analysis of CBP and GSA documents and CBP officials’ statements.
Page 27 GAO-13-603 U.S.-Mexico Border
Notes: Primary inspections are conducted by a CBP officer at a primary inspection booth. Secondary inspections occur when a vehicle is referred for further inspection, including gamma ray scans, paperwork, and physical examinations. aNonintrusive inspection includes the use of gamma ray technologies to detect contraband in commercial trucks. bCBP initiated the Free and Secure Trade (FAST) program in 2002 to expedite the travel of known low-risk screened shipments across the border. Seventeen out of the 24 land border crossings on the southwest border have dedicated FAST lanes to expedite FAST traffic. cAccording to CBP officials, this infrastructure improvement project at the Bridge of the Americas was funded out of the Office of Field Operations’ operating budget at a cost of approximately $264,500. Further, our analysis of CBP data on lane use generally supported CBP officials’ statements regarding the extent to which CBP officials open existing primary inspection lanes at the six crossings we visited. The number of primary inspection lanes available and open at each crossing was frequently cited by CBP and industry officials as a critical variable affecting wait times for commercial vehicles and, further, as evidence of whether a crossing’s primary lane infrastructure was sufficient to process current traffic volumes. For example, at all the locations we visited, industry representatives expressed concern that CBP had an insufficient number of primary inspection lanes to process current traffic volumes or was not fully utilizing existing lanes.38
• In fiscal year 2012, lane use data for two of the six crossings we visited suggest that these crossings—Otay Mesa and Mariposa—were at times operating at or near full capacity, as reported by agency officials. In fiscal year 2012, Otay Mesa opened an hourly average of 82 to 89 percent of its primary inspection lanes per month. At Mariposa, our analysis of lane use data for the first half of fiscal year 2012, prior to the addition of four new primary inspection lanes in April 2012, showed that during months of peak traffic, port officials opened
To determine the extent to which CBP was opening its existing primary inspection lanes, we analyzed CBP data on the average hourly percentage of primary inspection lanes open per month during operating hours over the last 5 fiscal years (October 2007-September 2012). This analysis showed the following:
38For example, industry representatives and Mexican officials in Laredo, Texas told us that seven new primary inspection lanes were added at the World Trade Bridge in 2011 to reduce wait times for commercial vehicles, but the new lanes were often not opened.
Page 28 GAO-13-603 U.S.-Mexico Border
an hourly average of between 80 and 84 percent of Mariposa’s primary lanes per month.39
• The average hourly percentage of primary lanes open per month at the remaining four crossings we visited—Bridge of the Americas, Ysleta, Columbia Solidarity Bridge, and World Trade Bridge—were all lower.40
Our analysis also supports CBP officials’ statements that they generally open and close primary inspection lanes in response to fluctuations in commercial traffic volume—a practice CBP calls active lane management; however, some port officials cited constraints in opening more lanes during times of peak traffic. Port officials at all six crossings we visited reported that they consider commercial traffic volume, among other factors, when deciding to open and close primary inspection lanes. We compared trends in CBP’s data on lane use and commercial traffic volume and found that the two were generally consistent at five of the six crossings we visited, supporting CBP officers’ statements that they generally open more lanes when traffic volume rises and close lanes when traffic decreases.
This generally supported CBP officials’ statements that they have the capacity to open more primary inspection lanes at these crossings.
41
39Mariposa is a major crossing for agricultural products and therefore has high seasonal variability in commercial traffic volume. Prior to the addition of new primary inspection lanes, the peak months in fiscal year 2012 were January, February, March, and April, when average monthly commercial vehicle traffic volume exceeded that of nonpeak months by approximately 20 percent. The monthly average percentage of lanes opened on average per hour for the nonpeak months in fiscal year 2012, prior to the opening of new lanes on April, 30 2012—October 2011 to December 2011—ranged from 61 to 79 percent. Following the addition of new lanes in April 2012, this rate dropped to a monthly average of between 41 and 48 percent. However, it is important to note that this period (May-September 2012) is generally a period of low traffic volume, which, together with the availability of four new lanes, may account for this decrease.
However, CBP officials at one of these five crossings—World Trade Bridge—explained that other factors kept them from opening all primary inspection lanes during periods of high traffic. Specifically, these officials said that bottlenecks would form if all primary
40In fiscal year 2012, the average monthly percentage of primary lanes open on average per hour at these crossings was 39-79 percent at Bridge of the Americas, 27-48 percent at Ysleta, 36-38 percent at Columbia Solidarity Bridge, and 48-58 percent at World Trade Bridge. 41Our analysis does not indicate whether CBP is maximizing use of its lanes, but rather allows us to observe how closely the average hourly traffic volume per month corresponds to the average number of hourly lanes open per month.
Page 29 GAO-13-603 U.S.-Mexico Border
lanes were opened, causing congestion throughout the facility because of limited space at secondary inspection.42
The one crossing where the lane use and commercial traffic volume did not appear to track as closely was Columbia Solidarity Bridge. However, CBP officials at Columbia Solidarity Bridge explained that traffic volumes and wait times there were so low that they generally did not need to open or close lanes in response. Figure 3, an interactive graphic, summarizes our analysis and includes additional information for each of the six crossings we selected.
42In addition, CBP officials at the World Trade Bridge said they previously had insufficient staff to open all primary lanes during the midday rush but they have since added 20 new staff, which allowed them to add a new shift in January 2013 to minimize the effect of officer lunch breaks on their ability to open primary lanes. Because this initiative is relatively new, it is too early to assess its impact on lane utilization.
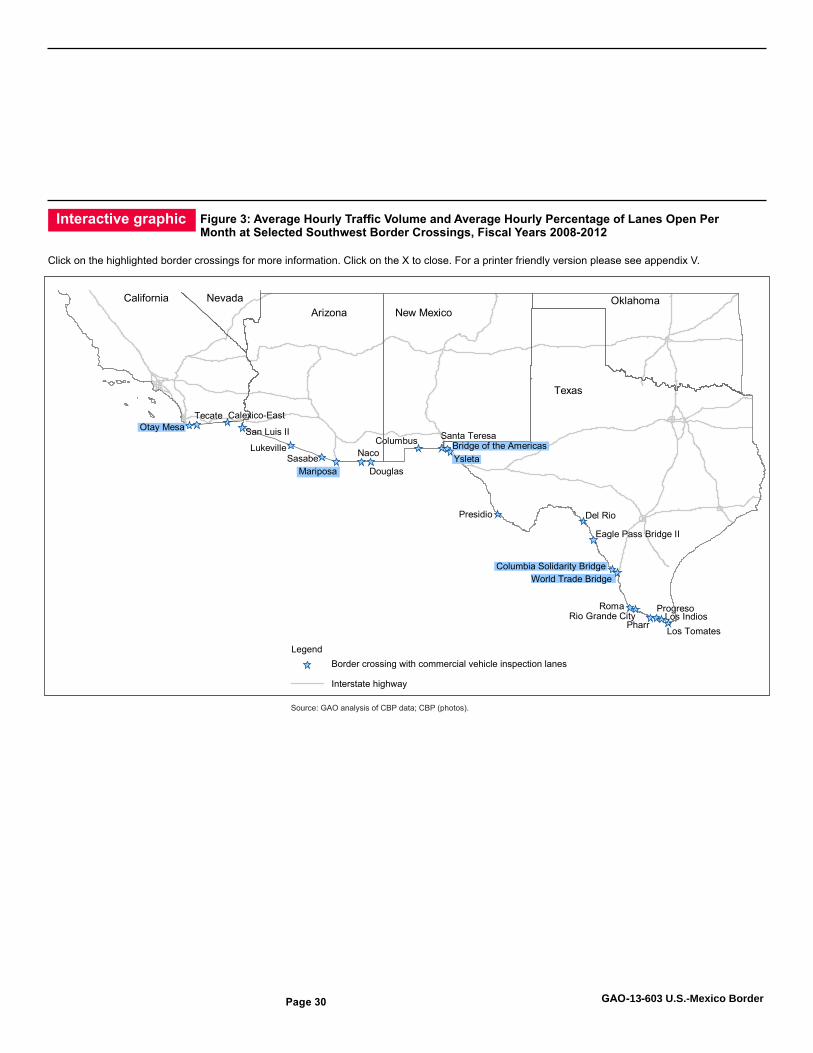
Page 30 GAO-13-603 U.S.-Mexico Border
Source: GAO analysis of CBP data; CBP (photos).
Texas
New MexicoArizonaOklahoma
ProgresoLos Indios
PharrRio Grande City
Roma
World Trade Bridge
Presidio
Columbus
DouglasMariposa
NacoSasabeLukeville
Calexico-EastTecate
Santa Teresa
Del Rio
Eagle Pass Bridge II
NevadaCalifornia
San Luis II
Los Tomates
Border crossing with commercial vehicle inspection lanes
Interstate highway
Legend
Bridge of the Americas
Otay Mesa
Ysleta
Columbia Solidarity Bridge
Interactive graphic Figure 3: Average Hourly Traffic Volume and Average Hourly Percentage of Lanes Open Per Month at Selected Southwest Border Crossings, Fiscal Years 2008-2012
Click on the highlighted border crossings for more information. Click on the X to close. For a printer friendly version please see appendix V.
Page 31 GAO-13-603 U.S.-Mexico Border
CBP officials at headquarters and in the field cited various ways they are working to address infrastructure limitations given challenges caused by budgetary and geographic constraints, among others. In regard to budgetary constraints, CBP and GSA officials stated that GSA has not received funding to conduct additional expansion projects in the last 2 fiscal years, and as a result, they have not been able to execute new projects to address infrastructure needs at land ports of entry on the southwest border. GSA officials reported that the agency has used alternative funding sources to pay for prioritized infrastructure projects.43 For example, GSA and CBP officials reported using funds from the city of Laredo to support the expansion of primary inspection lanes at the World Trade Bridge crossing in 2011.44 In regard to geographic constraints, port officials at the Bridge of the Americas stated that the urban area around that crossing limits opportunities to expand the crossing’s footprint. Officials with the city of El Paso told us that they are promoting a plan to divert all commercial traffic to the nearby Ysleta crossing because it has greater capacity to process commercial traffic and a larger footprint that can accommodate future expansion. CBP field office and port officials stated that they support this plan. In another example, CBP officials at headquarters and in the field reported participating in binational working groups in an effort to address the infrastructure limitations of ports of entry along the southwest border. For example, senior CBP officials reported participating in the U.S.-Mexico Joint Working Committee to develop regional master plans to better ensure the development of a well-coordinated land transportation and infrastructure planning process along the border.45
43According to GSA and CBP officials, GSA has statutory authority under 40 U.S.C. § 3175 to accept gifts from the private sector to fund expenses such as infrastructure renovation, but CBP does not have this authority. These officials also reported that GSA has accepted private sector gifts to fund the construction or renovation of land ports of entry.
44This primary lane expansion project was primarily funded by the city of Laredo. The city provided $7.5 million, GSA provided $1.3 million, and CBP provided $1.6 million. 45Regional border master plans are comprehensive long-range plans to identify and prioritize port of entry infrastructure needs and projects within a defined area. These plans represent binational stakeholder efforts to (1) prioritize port of entry and related transportation projects leading to ports of entry, (2) inform decision making, (3) allocate limited funding sources, and (4) ensure continued dialogue and coordination on future infrastructure needs and projects. In the near future, six regional border master plans will have been completed in California (1), Arizona (1), New Mexico (1), and Texas (3).
Page 32 GAO-13-603 U.S.-Mexico Border
CBP’s workload staffing model—CBP’s primary tool for determining the number of CBP officers needed at the nation’s air, land, and sea ports—found that additional CBP officers are needed to meet CBP’s mission requirements. CBP submitted the most recent version of its workload staffing model to Congress in response to language in the conference and committee reports for the fiscal year 2012 DHS appropriations.46 According to CBP documents submitted to Congress, the workload staffing model found that 3,811 additional CBP officers are needed to meet CBP’s mission requirements in fiscal year 2014.47
In addition, CBP field and port officials at three of the six crossings we visited reported having insufficient staff to process commercial traffic. Specifically, CBP field office and port officials reported insufficient staff at the World Trade Bridge, Columbia Solidarity Bridge, and Mariposa crossings and noted that insufficient staff at these crossings contributed to commercial vehicle wait times and reduced their ability to conduct secondary inspections, among other effects.
48
46H.R. Rep. No. 112-331, at 958 (2011) (Conf. Rep.); H.R. Rep. No. 112-91, at 27-28 (2011); S. Rep. No. 112-74, at 31 (2011) and Department of Homeland Security, U.S. Customs and Border Protection, Resource Optimization at Ports of Entry: Fiscal Year 2012 Report to Congress (Washington, D.C.: April 10, 2013).
Officials at the remaining three crossings—Otay Mesa, Bridge of the Americas, and Ysleta—reported having a sufficient number of staff to process commercial traffic. However, senior OFO headquarters officials reported that all southwest
47 We did not evaluate CBP’s workload staffing model as part of this review; however, we did review CBP documentation of the model. CBP officials and documentation indicated that the workload staffing model’s purpose is to inform CBP budget decisions, such as the development of CBP budget requests, as well as its staffing allocation process. In addition, CBP documentation also indicated that the model’s methodology assesses staffing needs based on workload data, processing times, and complexity. To arrive at the number of full-time-equivalent officers needed to complete the work, the model assumes a baseline number of hours per year are available for a CBP officer to focus on core mission work. The model then calculates the volume of core mission work using transactional data for each business process that CBP officers carry out—e.g., number of truck primary exams, number of truck container nonintrusive inspection exams, and so forth. CBP then uses data on the level of effort in minutes or hours expended each time an officer performs these activities to calculate the volume per hour, per inspection booth, per officer, and the equivalent officer hours to accomplish the mission. 48More specifically, CBP officials at these crossings told us that because of staffing shortages, they have had to reassign CBP officers from secondary inspection and other activities such as K-9 patrols to open additional primary lanes during periods of high traffic volume.
CBP Cites Need for Additional CBP Officers to Process Commercial Traffic at Some Crossings but Documentation Could Increase Transparency of Staff Allocations across Locations
Page 33 GAO-13-603 U.S.-Mexico Border
border land ports of entry require additional staff to perform at optimal levels.
CBP headquarters and field office officials cited efforts to mitigate the effect of reported staffing shortages on ports’ ability to process commercial vehicle traffic. CBP officials reported that these staffing shortages, caused in part by budget constraints and the time needed to train and assign new CBP officers, challenged their ability to increase the numbers of officers at the ports of entry. Specifically, CBP officials reported that since fiscal year 2009, CBP has not received sufficient funding to hire the number of CBP officers that it requires at land ports of entry. In response to budgetary constraints, CBP headquarters officials reported working to identify alternative funding strategies as well as reviewing user fees to ensure they effectively support operations. For example, DHS’s fiscal year 2014 congressional budget request included a proposed increase for 1,877 fee-funded full-time-equivalent positions in addition to a funding increase of approximately $210 million for 1,600 additional CBP officers. In response to staffing shortages related to the length of time it takes for new CBP officers to complete required training and to be available for duty at their assigned ports of entry, CBP headquarters officials reported considering the extent that new CBP officers have completed their training and are available for duty when allocating staff. They further reported actively working to adjust staff allocations across locations to better ensure that staffing levels are matched to areas of greatest need. For example, a senior OFO official reported prioritizing allocations to field offices with the highest discrepancy between current staffing levels and workload staffing model results when developing fiscal year 2012 annual staffing allocation. Finally, port officials at all six crossings we visited reported using overtime to mitigate the effect of any staffing shortages on ports’ capacity to process commercial traffic. For example, port officials in El Paso said that using overtime pay was an effective and efficient solution to provide increased coverage to process commercial traffic during peak times on weekdays and on weekends.49
49Officials with the Port of El Paso, for example, stated that Mexican and U.S. business practices generally result in peak times for commercial traffic that require increased staffing for only 2 hours or so in the morning and afternoon, but union requirements state that CBP officers must work in uninterrupted 8-hour shifts. Senior CBP officials also reported that the use of overtime allows coverage of peak times without hiring additional staff that are not needed to cover a full shift.
However, officials at the Otay Mesa port of
Page 34 GAO-13-603 U.S.-Mexico Border
entry noted that the availability of overtime funds has decreased because of budget constraints in recent years.50
In fiscal year 2013, CBP revised its process to allocate available CBP officers to its field offices, ports of entry and border crossings. However, CBP has not yet documented this process or its methodology, including the factors and underlying rationale considered in making staff allocation decisions. A senior official in CBP’s Human Capital Division reported that CBP’s most recent staff allocation process consisted of the following six steps: (1) OFO’s Human Capital Division obtained the workload staffing model’s findings to determine the number of officers ideally needed to meet the expected workload; (2) Human Capital Division staff conducted a “gap analysis” by comparing the model’s findings to current staff levels to identify the locations with the greatest gap between current and the staff levels identified by the workload staffing model; (3) Human Capital Division staff drafted a proposed staff allocation that realigned staff to those field offices with the greatest gap; (4) OFO leadership made adjustments to the proposal based on institutional priorities including mission, priorities, and threats before approving the allocation; (5) on receiving approval from leadership, OFO staff communicated the authorized staffing levels to each field office; and (6) the field offices then allocated their authorized staff to the individual ports of entry under their purview. However, this official explained that this process is not documented and there is no guidance clearly defining this methodology, the factors considered, or the rationale for making staff allocation decisions.
OFO Human Capital officials acknowledged the need to document this process and stated that they had not yet done so because, historically, such decisions were made informally and the current, more formalized process is still evolving. In addition, these officials noted that the last fiscal year was the first time OFO used the process described above and they planned to make further changes to the process within the next 2 fiscal years.
50CBP’s Fiscal Year 2012 Resource Optimization at Ports of Entry report states that OFO’s overtime budget has decreased by 8.2 percent from fiscal year 2008 through fiscal year 2013, thereby lessening the agency’s ability to use overtime as a means of leveraging existing resources.
Page 35 GAO-13-603 U.S.-Mexico Border
Best practices for strategic workforce planning identified by GAO emphasize the importance of ensuring that the methodology underlying staffing decisions is well documented.51 Standards for Internal Control in the Federal Government also calls for clear documentation of policies and procedures that are readily available for examination.52
These standards state that such control activities are an integral part of an entity’s accountability for stewardship of government resources and achieving effective results. Without documented policies and procedures including its rationale and factors considered in allocating staff, OFO’s staff allocation process lacks transparency and is therefore difficult for CBP officials or others to review and validate. As a result, CBP and its stakeholders do not have reasonable assurance that its staffing processes most effectively and efficiently allocate scarce resources to fulfill mission needs across ports.
In fiscal year 2013, CBP identified 28 performance measures to assess and report on progress toward CBP’s security and trade facilitation goals.53
51See
Nine measures were selected by DHS as Government Performance and Results Act (GPRA) measures (these are also called strategic measures within the department); 15 management measures are used to inform agency decisions on program priorities and resource allocation, and to monitor progress and performance; and 4 operational measures are maintained by OFO to capture former GPRA measures that
GAO-02-373SP. 52See GAO/AIMD-00-21.3.1. 53As mentioned previously, the agency’s trade facilitation goals are articulated in DHS’s February 2010 Quadrennial Homeland Security Review Report, which outlined a strategic framework for homeland security. DHS’s two goals related to trade facilitation are (1) prevent the illegal flow of people and goods across U.S. air, land, and sea borders while expediting the safe flow of lawful travel and commerce, and (2) ensure security and resilience of global movement systems. See DHS, Quadrennial Homeland Security Review Report: A Strategic Framework for a Secure Homeland.
CBP Performance Measures Do Not Reflect Progress in Achieving Trade Facilitation Goals
Page 36 GAO-13-603 U.S.-Mexico Border
OFO continues to use internally.54
Two of these 28 performance measures address the level of participation in CBP’s trade facilitation programs but none gauge the impact of CBP’s trade facilitation efforts. Of the 28 measures, 26 are focused on security, enforcement, and compliance with trade laws, and 2 are focused on the agency’s trade facilitation goals. These 2 measures include (1) the percent of cargo by value imported to the United States by participants in CBP trade partnership programs, and (2) the percent increase in travelers to the United States enrolled in a Trusted Traveler program.
(See appendix IV for a list of CBP’s fiscal year 2013 performance measures.)
55 These 2 measures can serve as indicators of the level of participation in CBP trade facilitation programs, such as FAST, and thus are important for CBP to track, but they do not provide information on whether these programs are facilitating trade because they do not measure desired outcomes for the programs.56 OMB defines outcome as an event or condition that is of direct importance to the intended beneficiaries or the public, such as facilitated trade.57
54Pub. L. No. 103-62, 107 Stat. 285 (1993). GPRA seeks to improve the management of federal programs, as well as their effectiveness and efficiency, by establishing a system under which agencies set goals for program performance and measure their results. Specifically, GPRA requires executive agencies to prepare multiyear strategic plans, annual performance plans, and annual performance reports. The GPRA Modernization Act of 2010, Pub. L. No. 111-352, 124 Stat. 3866 (2011), amended GPRA to establish a framework aimed at taking a more crosscutting and integrated approach to focusing on results and improving government performance. Under this framework, organizational components of agencies, such as CBP, are not treated separately; rather, agencies are to work with their components to identify priorities, goals, and performance indicators relative to the mission and strategic objectives of the agency. See OMB Circular No. A-11, Section 200.1 (2012). In fiscal year 2013, DHS has designated 84 GPRA performance measures—9 of which focus on CBP efforts.
DHS’s Quadrennial Homeland Security Review Report
55The percent of cargo by value imported to the United States by participants in CBP trade partnership programs is a GPRA or strategic measure, and the percent increase in travelers to the United States enrolled in a Trusted Traveler program is a CBP operational measure. CBP’s Trusted Traveler programs provide expedited travel for preapproved, low-risk travelers through dedicated lanes and kiosks. FAST is one of several such programs. 56According to CBP, the intended benefits to participants in the FAST trade partnership program include (1) access to dedicated lanes for greater speed and efficiency in processing transborder shipments; (2) reduced number of inspections resulting in reduced delays at the border; (3) priority, front-of-the-line processing for CBP inspections; and (4) enhanced supply chain security while promoting the economic prosperity of the United States, Canada, and Mexico. 57This definition of outcome comes from OMB Circular No. A-11, Preparation, Submission, and Execution of the Budget (Washington, D.C.: June 26, 2008).
Page 37 GAO-13-603 U.S.-Mexico Border
stated that DHS would improve measurement of desired mission outcomes and the contribution of programs, activities, and resources to them. OFO and OA officials stated that CBP’s existing performance measures imply that trade will be facilitated through increased participation in trade partnership programs rather than by directly measuring the desired outcomes. More specifically, OFO and OA officials stated that the measure percent of cargo by value imported to the United States by participants in CBP trade partnership programs implies that trade will be facilitated through participation in the programs, rather than directly measuring the desired outcomes of shorter wait times, for example. Similarly, OFO and OA officials told us that the measure percent increase in travelers to the United States enrolled in a Trusted Traveler program is not intended to capture the benefits to the program participants or trade facilitation, but, rather, is primarily an internal program measure that captures progress toward CBP’s goal of growing enrollment in Trusted Traveler programs, including FAST.
DHS and CBP officials stated that they have not developed more performance measures for trade facilitation primarily because key stakeholders, including DHS leadership and Congress, have not pushed for this, and trade facilitation measures are difficult to develop. DHS and CBP officials reported that they have more performance measures focused on security and enforcement because these have been more of a focus for stakeholders than trade facilitation. In addition, CBP officials report that they have not created outcome-oriented measures for trade facilitation because the results of their trade facilitation efforts are difficult to capture in one or two measures. OFO and OA officials told us that it can be hard to articulate trade facilitation to external stakeholders because trade facilitation means different things to different stakeholders, each with its own interests. However, these same concerns could apply to outcome-oriented measures for CBP’s security and enforcement efforts, and CBP has developed an outcome-oriented measure in that area—the land border interdiction rate for major violations. OFO and OA officials told us that this measure is the single best outcome measure for security, though they note that it is limited to passenger vehicles.58
58OFO and OA officials explained that there is no such measure for commercial vehicles because the commercial environment is much more complex with more layers of review and the threshold that triggers an examination is much lower in the commercial setting.
In addition, OMB guidance states that proxy measures that are closely tied to the desired outcome can be used to indirectly measure program outcomes
Page 38 GAO-13-603 U.S.-Mexico Border
when programs are difficult to measure because data are not available.59
In the absence of outcome-oriented or proxy measures, CBP’s ability to identify and publicly report the impact of the agency’s trade facilitation programs is limited. OFO and OA officials reported that as a result of not having more outcome-oriented measures for trade facilitation, the agency is less prepared to identify and report the positive impact of its trade facilitation efforts to the public, and industry representatives we met with noted a lack of information on the impact of CBP’s trade facilitation efforts. CBP officials at headquarters and in the field have stated that participation in the FAST program has resulted in shorter wait times for program participants, but Border Trade Alliance officials and industry representatives at two of the roundtables we held raised concerns that FAST program participants were not receiving these benefits and were unclear about the impact of this particular trade facilitation program.
Potential outcome-oriented measures or proxy measures for trade facilitation could include, for example, measures to determine the extent to which CBP trusted shipper programs have met their goal, such as the percentage of time FAST traffic waits a certain percentage less time than regular commercial traffic or the ratio of FAST to non-FAST referrals to secondary inspection.
OMB and our guidance recommend the use of outcome-oriented performance measures to promote accountability for results. Our guidance states that leading organizations promote accountability by establishing results-oriented outcome goals and corresponding measures by which to gauge progress.60
59Office of Management and Budget, Performance Measurement Challenges and Strategies, (Washington, D.C.: June 18, 2003).
This guidance further states that measuring performance allows organizations to track the progress they are making toward their goals and gives managers critical information on which to base decisions for improving their progress. More specifically, we identified establishing performance goals and measures to better translate activities into results as a useful practice to enhance performance management and measurement processes, and we have previously issued guidance that agencies should identify and use
60See, for example, GAO, Executive Guide: Effectively Implementing the Government Performance and Results Act, GAO/GGD-96-118 (Washington, D.C.: June 1996).
Page 39 GAO-13-603 U.S.-Mexico Border
outcome goals wherever possible to reflect the results of their activities.61 In addition, OMB guidance encourages the use of outcome measures because they are much more meaningful to the public.62
In the absence of meaningful outcome-oriented performance measures, or proxy measures, for trade facilitation—such as measures capturing whether FAST participants are receiving their intended benefits of quicker processing time and fewer inspections—it is difficult for CBP, decision makers, and other stakeholders to gauge CBP progress in achieving the agency’s stated trade facilitation goals.
Trade between Mexico and the United States is important to the United States’ economic health, and the value of goods imported into the U.S. from Mexico is on the rise. The length of time commercial vehicles wait in line at the border affects this trade activity. However, CBP’s current wait time data are unreliable, limiting the extent to which CBP can use wait time data across border crossings to inform management decisions about infrastructure investment and staffing allocation and industry stakeholders can rely on publicly reported data. Taking steps to help CBP port officials implement CBP’s existing mechanisms for collecting wait time data, consistent with agency guidance, could improve data reliability and usefulness for these purposes. Moreover, assessing the feasibility of options for automating wait time data consistent with program management standards could help CBP consider ways to reduce port officials’ current burden in manually collecting the data and provide CBP with more reliable and comprehensive data it can use to identify and address challenges to trade facilitation.
61See GAO, Managing for Results: Strengthening Regulatory Agencies’ Performance Management Practices, GAO/GGD-00-10 (Washington, D.C.: Oct. 28, 1999). In this report we gathered information from 23 federal and state organizations that we or other credible sources identified as using or planning to use a variety of useful practices to enhance specific aspects of their performance management and measurement processes. The organizations, although they had different missions, sizes, and organizational structures, said they consistently recognized that these practices are important in their efforts to develop a stronger results orientation. See also The Results Act: An Evaluator’s Guide to Assessing Agency Annual Performance Plans, (GAO, GGD.10.1.20 (Washington, D.C.: April 1998). 62See OMB Circular No. A-11, Preparation, Submission, and Execution of the Budget (Washington, D.C.: Aug. 3, 2012). See also OMB, Performance Measurement Challenges and Strategies (Washington, D.C.: June 18, 2003).
Conclusions
Page 40 GAO-13-603 U.S.-Mexico Border
CBP’s ability to meet its mission goals—including both security and trade facilitation—are affected by its allocation of staff across the southwest border, among other things. In the absence of transparency about the methodology and process by which CBP allocates staff resources across ports of entry, it is difficult for CBP and others to evaluate whether existing staff have been allocated to most effectively address CBP’s mission needs. Documenting CBP’s staff allocation methodology in accordance with best practices for strategic workforce planning could help better position CBP to ensure that it is allocating its staff efficiently and effectively across ports of entry and border crossings.
In addition, it is difficult for CBP or others to gauge the agency’s progress in meeting its trade facilitation goal because CBP does not have outcome-oriented measures for its trade facilitation efforts. Developing outcome-oriented, or proxy, performance measures that capture the impact of CBP’s trade facilitation efforts, consistent with OMB and our guidance, could help CBP officials, Congress, and other stakeholders better assess the effectiveness of CBP’s trade facilitation programs in supporting the agency’s overall mission and goals.
We recommend that the Commissioner of CBP take four actions.
To improve the usefulness of southwest border crossing wait time data for informing public and management decisions, the Commissioner of CBP should take the following two actions:
• Identify and carry out steps that can be taken to help CBP port officials overcome challenges to consistent implementation of existing wait time estimation methodologies. Steps for ensuring consistent implementation of these methodologies could include, for example, implementing the fiscal year 2008 WHTI report recommendations to use closed-circuit television cameras to measure wait time in real time and provide a standardized measurement and validation tool.
• In consultation with FHWA and state DOTs, assess the feasibility of replacing current methods of manually calculating wait times with automated methods, which could include assessing all of the associated costs and benefits, options for how the agency will use and publicly report the results of automated data collection, the potential trade-offs associated with moving to this new system, and other factors such as those influencing the possible expansion of
Recommendations for Executive Action
Page 41 GAO-13-603 U.S.-Mexico Border
existing automation efforts to the 34 other locations that currently report wait times but have no automation projects under way.
To better ensure that CBP’s OFO’s staffing processes are transparent and to help ensure CBP can demonstrate that these resource decisions have effectively addressed CBP’s mission needs, we recommend that the Commissioner of CBP document the methodology and process OFO uses to allocate staff to land ports of entry on the southwest border, including the rationales and factors considered in making these decisions.
To facilitate transparency and performance accountability for its trade facilitation programs and meeting CBP’s goal of balancing its trade and security missions, we recommend that the Commissioner of CBP develop outcome-oriented performance measures or proxy measures to capture the impact of CBP’s trade facilitation efforts, such as measures to determine the extent to which CBP trusted shipper programs have met their goals.
We provided a draft of this report to DHS, GSA, DOT, the Department of Commerce, and the Department of Health and Human Services for their review and comment. GSA, DOT, the Department of Commerce, and Department of Health and Human Services did not have any comments on the draft of the report. DHS provided written comments, which are summarized below and reproduced in full in appendix VII. In the written comments, DHS concurred with our four recommendations and discussed actions to address them. However, the actions DHS identified will not address the intent of one of these recommendations. DHS also provided technical comments, which we incorporated, as appropriate.
DHS agreed with our first recommendation that CBP identify and carry out steps to help CBP port officials overcome challenges to consistent implementation of existing wait time estimation methodologies. In written comments, DHS officials explained that if funding is available, CBP has a goal to automate the estimation and reporting of border wait times. To this end, they plan to establish an internal and external stakeholder group and identify the best candidate technologies to pilot. These steps will help further CBP’s longer-term plans to automate wait time data collection, but do not address the intent of our recommendation that CBP take steps to help port officials more consistently implement existing manual wait time estimation methodologies.
Agency Comments and Our Evaluation
Page 42 GAO-13-603 U.S.-Mexico Border
DHS agreed with our second recommendation that CBP assess the feasibility of replacing current methods of manually calculating wait times with automated methods. In commenting on a draft of this report, DHS officials noted that CBP has taken some steps to assess options for automating wait time data collection at northern and southern land border crossings and provided us with supplemental documents that included rough cost estimates for piloting, deploying, and maintaining automation technology. Based on this information, DHS requested that we consider this recommendation closed. While DHS has taken positive initial steps to address this recommendation, DHS should complete additional feasibility analysis to fully address the intent of our recommendation and better position the agency to decide whether and how to automate data collection. For example, DHS written comments stated that the feasibility of financing, funding, and operating automation technology is “reduced.” More detailed and comprehensive cost analysis—such as estimating and comparing the costs of different technology solutions and analyzing potential funding sources—could help CBP assess the feasibility of wait time automation. In addition, DHS officials noted in their written comments that CBP has not yet identified the best technologies to pilot. Determining the best technology, if any, for use at each border crossing could influence the overall feasibility of planned automation across southwest border land ports of entry.
With regard to our third recommendation that CBP document the methodology and process OFO uses to allocate staff to land ports of entry, DHS agreed and stated that CBP will develop and document a standardized process for allocating CBP officers that includes assumptions, factors, and concerns to guide the decision-making process. If implemented effectively, these actions should meet the intent of our recommendation.
With regard to our fourth recommendation that CBP develop outcome-oriented performance measures or proxy measures to capture the impact of CBP’s trade facilitation efforts, DHS concurred and stated that they plan to create a team of subject matter experts from OFO trade-related programs to identify at least two outcome measures or acceptable proxy measures for trade facilitation. They also noted plans to collaborate with private sector entities in order to identify metrics of greatest concern. If implemented effectively, these actions should meet the intent of our recommendation.
We are sending copies of this report to the Departments of Homeland Security, Commerce, Transportation, and Health and Human Services;
Page 43 GAO-13-603 U.S.-Mexico Border
and the General Services Administration. The report is also available at no charge on the GAO website at http://www.gao.gov.
If you or your staff have any questions about this report, please contact me at (202) 512-8777, or at [email protected]. Contact points for our Office of Congressional Relations and Public Affairs may be found on the last page of this report. GAO staff who made major contributions to this report are listed in appendix VIII.
Sincerely yours,
Rebecca Gambler Director Homeland Security and Justice Issues
Appendix I: Results of Studies on the Economic Impact of Wait Times on Cross-Border Commerce
Page 44 GAO-13-603 U.S.-Mexico Border
To determine what is known about the economic impact of wait time on cross-border commerce, we identified and analyzed relevant studies.1 We searched academic, government, and other literature published from January 1, 2000, to June 30, 2012, to capture a wide array of recently published literature, and asked all relevant interviewees—including officials with the Department of Homeland Security’s (DHS) U.S. Customs and Border Protection (CBP), Department of Commerce, trade associations, private industry, and academics—whether they were aware of any such studies.2 We reviewed over 100 identified studies and narrowed our focus to the 6 studies that determined an economic impact of commercial vehicle wait times on the southwest border. We interviewed officials at the organizations that sponsored each of the qualifying studies to better understand the methodologies and limitations. We then analyzed the studies by comparing their methodologies with best practices for economic impact studies, including cost-benefit criteria in Office of Management and the Budget (OMB) Circular A-94 and comparing and contrasting the studies’ scopes, methodologies, and findings.3
1Throughout this report, we use Customs and Border Protection’s definition of wait time—the time it takes for a vehicle to travel from the end of the queue to the primary inspection point in the United States. 2We conducted both subject and key word literature searches utilizing more than 20 subject-specific bibliographic databases to systematically scan and identify academic, government, and other sources. Other sources scanned include gray literature—informally published written material—and government sources. We searched all sources for scholarly and peer-reviewed material, government reports, trade and industry articles, association and think tank publications, and working papers. As with any such literature search, there are a number of limitations to consider. This scan is a sample and does not attempt to review all published or gray literature on this topic. Attempting to scan all published and gray literature would be an immense task, and searching bibliographic databases represents a transparent and well-documented proxy for what is being expressed across the broader subject community. We recognize that there is a lag time in ideas and research findings making their way into the indexing of bibliographic databases as well as a growing amount of peer-reviewed material being retracted. 3OMB Circular A-94 Revised, Guidelines and Discount Rates for Benefit-Cost Analysis of Federal Programs (Washington, D.C.: Oct. 29, 1992).
Appendix I: Results of Studies on the Economic Impact of Wait Times on Cross-Border Commerce
Appendix I: Results of Studies on the Economic Impact of Wait Times on Cross-Border Commerce
Page 45 GAO-13-603 U.S.-Mexico Border
An April 2013 CBP-commissioned study found that reduced waits at select border crossings would result in benefits to the U.S. economy in terms of increased gross domestic product (GDP) and jobs.4 This study, conducted by the National Center for Risk and Economic Analysis of Terrorism, estimates the benefit of adding one CBP officer to select border land and air border crossings—assuming these added staff would each open one additional primary inspection lane—in terms of reduced waits and resulting benefits to the U.S. economy. The study found, for example, that at seven of the biggest southwest border commercial vehicle crossings, having one additional staff member open one additional primary inspection lane during the 8 most congested hours of the day would result in wait time reductions ranging from 1.5 minutes to 7.2 minutes for commercial vehicle traffic during those hours. The study then estimated that over the course of a year, these wait time reductions for commercial vehicles at these seven crossings would lead to direct economic benefits of $915,000 in GDP (in 2011 dollars) and 9.3 additional jobs.5
However, we identified three limitations to consider regarding the reported economic benefits. First, this study estimated the benefits of this change but not the costs. CBP officials state that the study was not intended to be a cost-benefit analysis and noted that the types of costs that would have
CBP officials report that they plan to use the results of this study to demonstrate the benefit of adding CBP officers. These officials report that CBP has typically demonstrated its benefit in terms of number of seizures and arrests, for example, but this study will permit CBP to show an officer’s trickledown effect on the U.S. economy.
4National Center for Risk and Economic Analysis of Terrorism Events, The Impact on the U.S. Economy of Changes in Wait Times at Port of Entry, April 4, 2013, a report prepared for DHS. The National Center for Risk and Economic Analysis of Terrorism Events is a university-based center of excellence funded by the Office of University Programs of the Science and Technology Directorate of DHS. The Center’s mission is to improve U.S. security through research and development of models and tools to evaluate risks, costs, and consequences of terrorism and natural and manmade hazards, and to guide economically viable investments in homeland security. 5For the six commercial vehicle crossings we visited in the course of our study—Bridge of the Americas and Ysleta in El Paso, Texas; World Trade Bridge and Columbia Solidarity Bridge in Laredo, Texas; Mariposa in Nogales, Arizona; and Otay Mesa near San Diego, California—CBP’s study found that having one additional staff member open one additional primary inspection lane during the 8 most congested hours of the day would result in wait time reductions ranging from 1.5 minutes to 6.3 minutes and would lead to direct economic benefits of $645,000 in GDP (in 2011 dollars) and 6.5 additional jobs. The estimated number of jobs created does not include the CBP officers added.
CBP Study Estimated the Effect of Additional Staff at Ports of Entry on Wait Times and the U.S. Economy
Appendix I: Results of Studies on the Economic Impact of Wait Times on Cross-Border Commerce
Page 46 GAO-13-603 U.S.-Mexico Border
to be considered in a cost-benefit analysis include staff salaries, inspection booth and lane maintenance, and equipment. Second, the study assumes that one additional primary processing lane is available to be opened during the busiest 8 hours of the day. However, CBP officials report that at some crossings they already open all primary inspection lanes during peak hours. Therefore, this assumption is unrealistic or would require CBP investment in additional primary inspection lanes. Third, the study used CBP’s reported wait time data for fiscal year 2012, which, as described earlier in this report, we determined are not sufficiently reliable for analysis across crossings, among other things.6
Officials who conducted this study told us that they did not test the reliability of CBP’s wait time data but found the basic data pattern plausible and therefore determined that the data were sufficiently reliable for their analysis.
Five other studies, one of which was commissioned by DHS, have quantified the effects of commercial vehicle wait times on cross-border commerce and also found evidence of lost revenue and jobs. The studies’ findings are not comparable because of their differing scopes and methodologies, but they estimate direct impacts ranging from $452 million in the San Diego area to $1.9 billion across five cities with major border crossings. All five studies have limitations that may have led to an overstatement of the economic impacts of wait times. In particular, four of these studies used economic multipliers to quantify the effect of wait time delays on the U.S. economy. As stated in OMB Circular A-94, these secondary effects should not be used when measuring social benefits or costs. Rather, the reported effects should be limited to direct effects only. Therefore, we included only the direct impacts in our summary of these studies. The five studies’ findings and limitations are summarized in table 2.
6CBP staff at each crossing manually collect and report hourly wait time data into CBP’s Border Wait Time Administrative Tool.
Other Commissioned Studies Reported That Wait Times Directly Affect the U.S. Economy, Resulting in Lost Revenue and Jobs
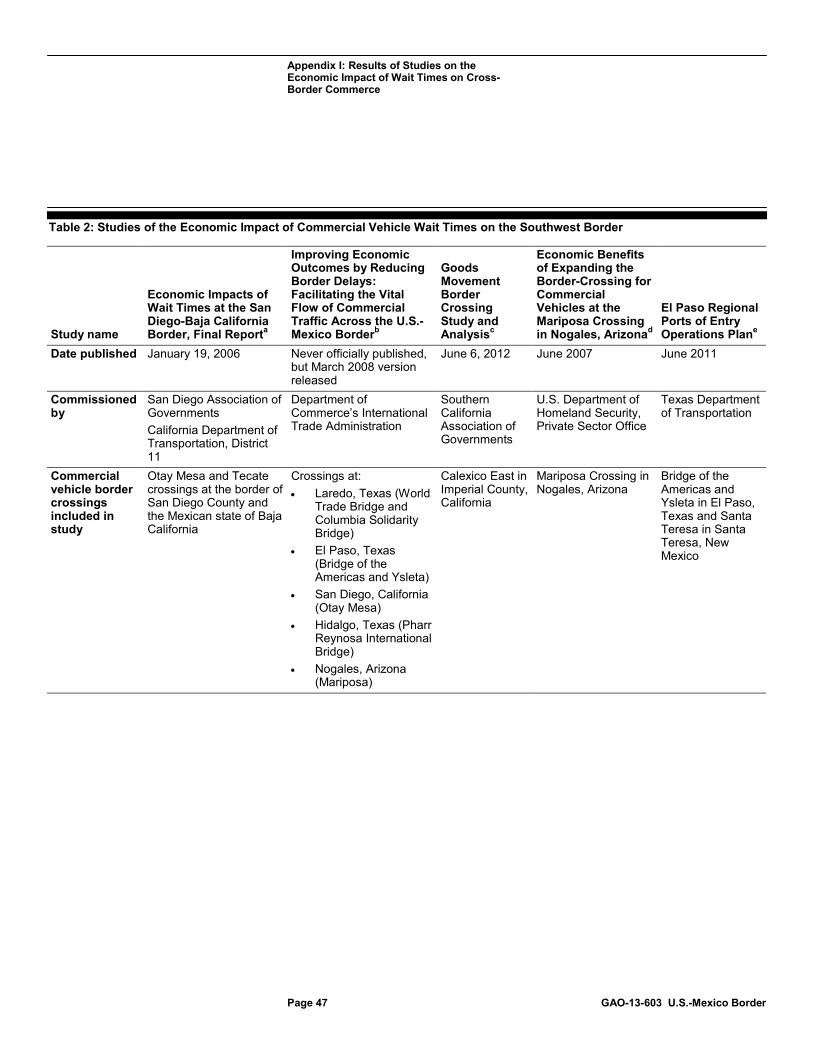
Appendix I: Results of Studies on the Economic Impact of Wait Times on Cross-Border Commerce
Page 47 GAO-13-603 U.S.-Mexico Border
Table 2: Studies of the Economic Impact of Commercial Vehicle Wait Times on the Southwest Border
Study name
Economic Impacts of Wait Times at the San Diego-Baja California Border, Final Reporta
Improving Economic Outcomes by Reducing Border Delays: Facilitating the Vital Flow of Commercial Traffic Across the U.S.-Mexico Borderb
Goods Movement Border Crossing Study and Analysisc
Economic Benefits of Expanding the Border-Crossing for Commercial Vehicles at the Mariposa Crossing in Nogales, Arizonad
El Paso Regional Ports of Entry Operations Plane
Date published January 19, 2006 Never officially published, but March 2008 version released
June 6, 2012 June 2007 June 2011
Commissioned by
San Diego Association of Governments California Department of Transportation, District 11
Department of Commerce’s International Trade Administration
Southern California Association of Governments
U.S. Department of Homeland Security, Private Sector Office
Texas Department of Transportation
Commercial vehicle border crossings included in study
Otay Mesa and Tecate crossings at the border of San Diego County and the Mexican state of Baja California
Crossings at: • Laredo, Texas (World
Trade Bridge and Columbia Solidarity Bridge)
• El Paso, Texas (Bridge of the Americas and Ysleta)
• San Diego, California (Otay Mesa)
• Hidalgo, Texas (Pharr Reynosa International Bridge)
• Nogales, Arizona (Mariposa)
Calexico East in Imperial County, California
Mariposa Crossing in Nogales, Arizona
Bridge of the Americas and Ysleta in El Paso, Texas and Santa Teresa in Santa Teresa, New Mexico
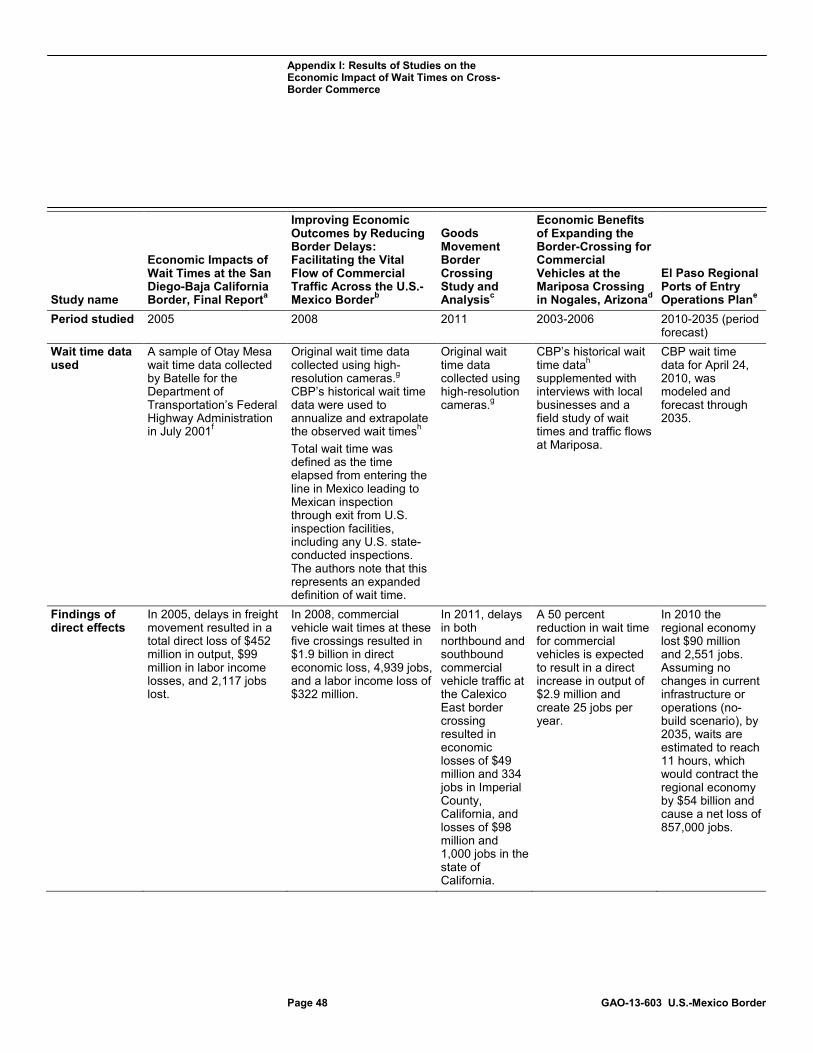
Appendix I: Results of Studies on the Economic Impact of Wait Times on Cross-Border Commerce
Page 48 GAO-13-603 U.S.-Mexico Border
Study name
Economic Impacts of Wait Times at the San Diego-Baja California Border, Final Reporta
Improving Economic Outcomes by Reducing Border Delays: Facilitating the Vital Flow of Commercial Traffic Across the U.S.-Mexico Borderb
Goods Movement Border Crossing Study and Analysisc
Economic Benefits of Expanding the Border-Crossing for Commercial Vehicles at the Mariposa Crossing in Nogales, Arizonad
El Paso Regional Ports of Entry Operations Plane
Period studied 2005 2008 2011 2003-2006 2010-2035 (period forecast)
Wait time data used
A sample of Otay Mesa wait time data collected by Batelle for the Department of Transportation’s Federal Highway Administration in July 2001f
Original wait time data collected using high-resolution cameras.g CBP’s historical wait time data were used to annualize and extrapolate the observed wait timesh Total wait time was defined as the time elapsed from entering the line in Mexico leading to Mexican inspection through exit from U.S. inspection facilities, including any U.S. state-conducted inspections. The authors note that this represents an expanded definition of wait time.
Original wait time data collected using high-resolution cameras.g
CBP’s historical wait time datah supplemented with interviews with local businesses and a field study of wait times and traffic flows at Mariposa.
CBP wait time data for April 24, 2010, was modeled and forecast through 2035.
Findings of direct effects
In 2005, delays in freight movement resulted in a total direct loss of $452 million in output, $99 million in labor income losses, and 2,117 jobs lost.
In 2008, commercial vehicle wait times at these five crossings resulted in $1.9 billion in direct economic loss, 4,939 jobs, and a labor income loss of $322 million.
In 2011, delays in both northbound and southbound commercial vehicle traffic at the Calexico East border crossing resulted in economic losses of $49 million and 334 jobs in Imperial County, California, and losses of $98 million and 1,000 jobs in the state of California.
A 50 percent reduction in wait time for commercial vehicles is expected to result in a direct increase in output of $2.9 million and create 25 jobs per year.
In 2010 the regional economy lost $90 million and 2,551 jobs. Assuming no changes in current infrastructure or operations (no-build scenario), by 2035, waits are estimated to reach 11 hours, which would contract the regional economy by $54 billion and cause a net loss of 857,000 jobs.
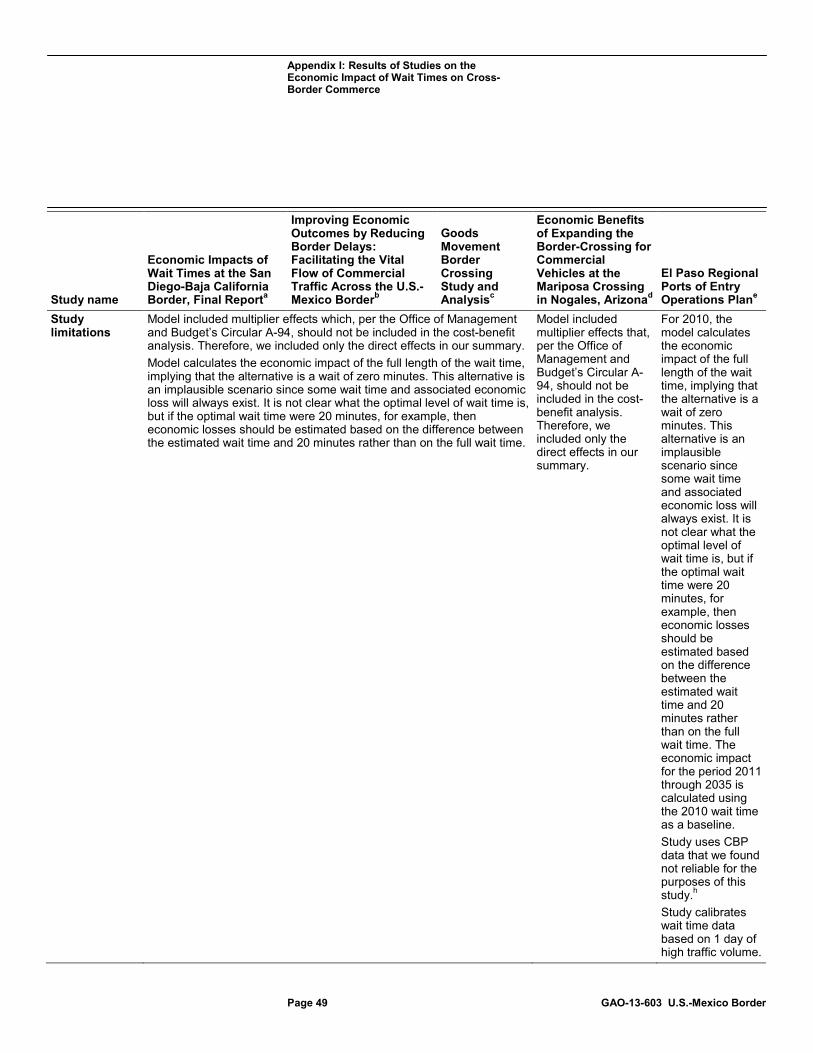
Appendix I: Results of Studies on the Economic Impact of Wait Times on Cross-Border Commerce
Page 49 GAO-13-603 U.S.-Mexico Border
Study name
Economic Impacts of Wait Times at the San Diego-Baja California Border, Final Reporta
Improving Economic Outcomes by Reducing Border Delays: Facilitating the Vital Flow of Commercial Traffic Across the U.S.-Mexico Borderb
Goods Movement Border Crossing Study and Analysisc
Economic Benefits of Expanding the Border-Crossing for Commercial Vehicles at the Mariposa Crossing in Nogales, Arizonad
El Paso Regional Ports of Entry Operations Plane
Study limitations
Model included multiplier effects which, per the Office of Management and Budget’s Circular A-94, should not be included in the cost-benefit analysis. Therefore, we included only the direct effects in our summary. Model calculates the economic impact of the full length of the wait time, implying that the alternative is a wait of zero minutes. This alternative is an implausible scenario since some wait time and associated economic loss will always exist. It is not clear what the optimal level of wait time is, but if the optimal wait time were 20 minutes, for example, then economic losses should be estimated based on the difference between the estimated wait time and 20 minutes rather than on the full wait time.
Model included multiplier effects that, per the Office of Management and Budget’s Circular A-94, should not be included in the cost-benefit analysis. Therefore, we included only the direct effects in our summary.
For 2010, the model calculates the economic impact of the full length of the wait time, implying that the alternative is a wait of zero minutes. This alternative is an implausible scenario since some wait time and associated economic loss will always exist. It is not clear what the optimal level of wait time is, but if the optimal wait time were 20 minutes, for example, then economic losses should be estimated based on the difference between the estimated wait time and 20 minutes rather than on the full wait time. The economic impact for the period 2011 through 2035 is calculated using the 2010 wait time as a baseline. Study uses CBP data that we found not reliable for the purposes of this study.h
Study calibrates wait time data based on 1 day of high traffic volume.
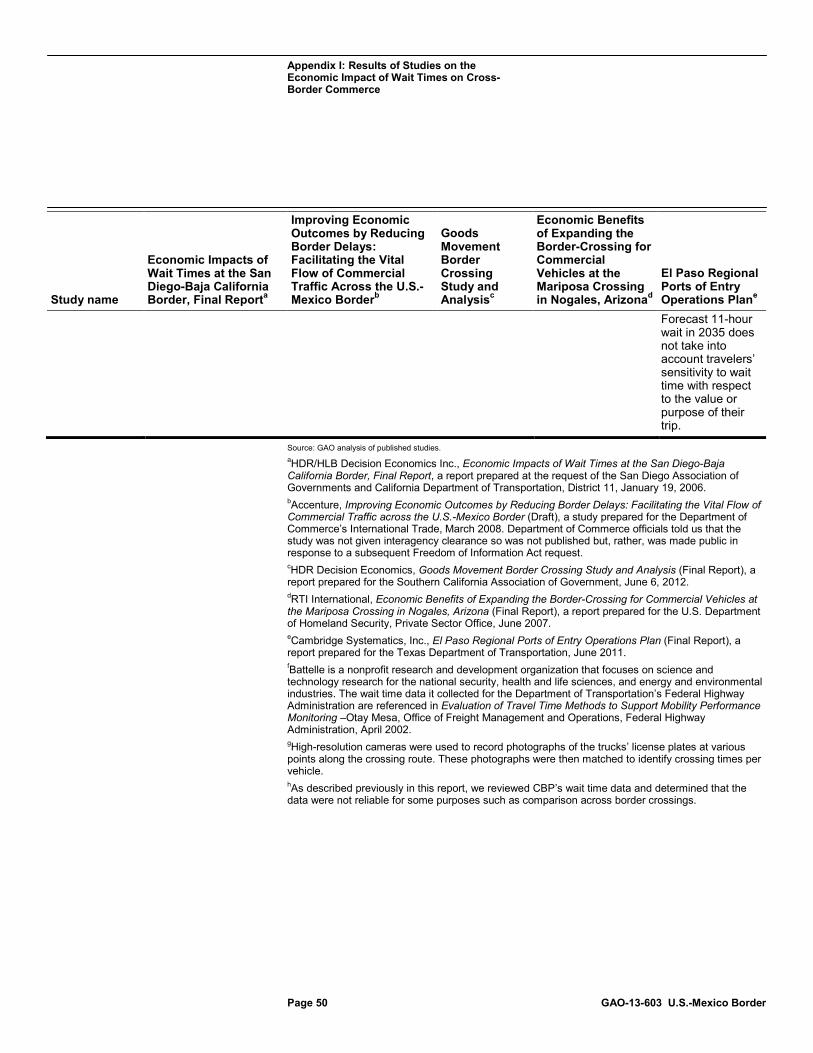
Appendix I: Results of Studies on the Economic Impact of Wait Times on Cross-Border Commerce
Page 50 GAO-13-603 U.S.-Mexico Border
Study name
Economic Impacts of Wait Times at the San Diego-Baja California Border, Final Reporta
Improving Economic Outcomes by Reducing Border Delays: Facilitating the Vital Flow of Commercial Traffic Across the U.S.-Mexico Borderb
Goods Movement Border Crossing Study and Analysisc
Economic Benefits of Expanding the Border-Crossing for Commercial Vehicles at the Mariposa Crossing in Nogales, Arizonad
El Paso Regional Ports of Entry Operations Plane
Forecast 11-hour wait in 2035 does not take into account travelers’ sensitivity to wait time with respect to the value or purpose of their trip.
Source: GAO analysis of published studies. aHDR/HLB Decision Economics Inc., Economic Impacts of Wait Times at the San Diego-Baja California Border, Final Report, a report prepared at the request of the San Diego Association of Governments and California Department of Transportation, District 11, January 19, 2006. bAccenture, Improving Economic Outcomes by Reducing Border Delays: Facilitating the Vital Flow of Commercial Traffic across the U.S.-Mexico Border (Draft), a study prepared for the Department of Commerce’s International Trade, March 2008. Department of Commerce officials told us that the study was not given interagency clearance so was not published but, rather, was made public in response to a subsequent Freedom of Information Act request. cHDR Decision Economics, Goods Movement Border Crossing Study and Analysis (Final Report), a report prepared for the Southern California Association of Government, June 6, 2012. dRTI International, Economic Benefits of Expanding the Border-Crossing for Commercial Vehicles at the Mariposa Crossing in Nogales, Arizona (Final Report), a report prepared for the U.S. Department of Homeland Security, Private Sector Office, June 2007. eCambridge Systematics, Inc., El Paso Regional Ports of Entry Operations Plan (Final Report), a report prepared for the Texas Department of Transportation, June 2011. fBattelle is a nonprofit research and development organization that focuses on science and technology research for the national security, health and life sciences, and energy and environmental industries. The wait time data it collected for the Department of Transportation’s Federal Highway Administration are referenced in Evaluation of Travel Time Methods to Support Mobility Performance Monitoring –Otay Mesa, Office of Freight Management and Operations, Federal Highway Administration, April 2002. gHigh-resolution cameras were used to record photographs of the trucks’ license plates at various points along the crossing route. These photographs were then matched to identify crossing times per vehicle. hAs described previously in this report, we reviewed CBP’s wait time data and determined that the data were not reliable for some purposes such as comparison across border crossings.
Appendix II: Objectives, Scope, and Methodology
Page 51 GAO-13-603 U.S.-Mexico Border
This report addresses the following questions:
• To what extent are CBP wait time data reliable for public reporting and informing CBP decisions on staffing and infrastructure investments?
• To what extent has CBP identified infrastructure and staffing needed to process current commercial traffic volume at southwest border crossings with high traffic volume?
• To what extent do CBP performance measures address progress toward its goal of facilitating trade?
This report also presents information on the results of studies that have quantified the economic impact of commercial vehicle wait times on cross-border commerce. This information, including the methodology used to identify these studies, is presented in appendix I.
To inform our analysis of the first and second objectives, we visited six crossings at four land ports of entry: Bridge of the Americas and Ysleta at El Paso, Texas; World Trade Bridge and Columbia Solidarity Bridge at Laredo, Texas; Mariposa at Nogales, Arizona; and Otay Mesa near San Diego, California. We selected these crossings based on their commercial traffic volume, and geographic diversity, and to include representation of crossings with a mix of recent or ongoing infrastructure modernization projects. At each location, we interviewed CBP management, toured the facility, and convened a roundtable of local industry representatives and local government officials. To obtain a range of perspectives on commercial vehicle traffic at southwest border crossings, we met with representatives of 21 companies and associations (who were identified to us as knowledgeable stakeholders) representing industries that rely on cross-border commerce including customs brokers, trucking companies, and distributors), as well as bridge directors and representatives of four local government entities (the Mayors of El Paso and San Diego, the Laredo City Manager, and representatives of the San Diego Association of Governments) at all four cities we visited or by teleconference.1
1The San Diego Association of Governments is a public planning, transportation, transit construction, and research agency.
Because we focused on four land ports of entry with six commercial vehicle crossings, our findings are not generalizable to the entire southwest border. However, the ports we visited accounted for, in total,
Appendix II: Objectives, Scope, and Methodology
Appendix II: Objectives, Scope, and Methodology
Page 52 GAO-13-603 U.S.-Mexico Border
approximately 70 percent of the commercial vehicle crossings into the United States from Mexico in fiscal years 2008 through July 2012. Over the course of our work, we also interviewed officials from agencies involved in securing the border and facilitating trade at land ports of entry, including officials from CBP’s Office of Administration and Office of Field Operations, the General Services Administration (GSA), the Department of Transportation’s (DOT) Federal Highway Administration and Federal Motor Carrier Safety Administration, the Department of Commerce (Commerce), the Department of Health and Human Service’s Food and Drug Administration, and the Department of State. We also interviewed other stakeholders, including officials from the Mexican Foreign Ministry, academics, and representatives of national trade associations, including the American Trucking Associations and the Border Trade Alliance, to obtain a broader range of perspectives on commercial vehicle traffic at southwest border crossings.2
To address the first objective, we reviewed and analyzed CBP’s policies and guidance for calculating and reporting wait times to determine the source of these data and the agency’s control over these data. We interviewed CBP headquarters officials about the wait time data, including data quality, data entry protocols, quality assurance procedures, and any steps taken to improve the reliability of these data. We also interviewed officials at the six crossings we visited about how they collect and report wait time data. We reviewed CBP documents evaluating the quality of CBP’s wait time data on the southwest border, including a fiscal year 2008 CBP Commercial Wait Times Analysis Report.
3
2These organizations and officials were identified to us as knowledgeable stakeholders who could provide us with a range of perspectives on commercial vehicle traffic at southwest border crossings. The American Trucking Associations is a national trade and safety organization representing the U.S. trucking industry. The Border Trade Alliance is a nonprofit organization that serves as a forum for participants to address key issues affecting trade, travel, and security in North America.
We compared documentary and testimonial evidence of how wait times are currently being calculated by officials at land ports of entry on the southwest border
3CBP reported on the reliability of wait time calculations in its Western Hemisphere Travel Initiative (WHTI), Commercial Wait Times Analysis Final Report, October 2007 – September 2008. The goal of WHTI is to facilitate entry for U.S. citizens and legitimate foreign visitors while strengthening U.S. border security. The WHTI Program Office sponsored this evaluation of commercial vehicle wait times to validate the current wait time reporting systems at individual crossings and to determine if a national standard for reporting wait times can be established.
Appendix II: Objectives, Scope, and Methodology
Page 53 GAO-13-603 U.S.-Mexico Border
against CBP policies and guidance to identify any discrepancies. We reviewed CBP’s data and reports on wait times for the six crossings for fiscal year 2012. In addition, to obtain non-CBP perspectives on CBP’s methods for calculating wait times and the quality and usefulness of CBP’s wait time data, we interviewed DOT officials, local officials, industry groups, and a Mexican official.4 We compared CBP’s policies and procedures for collecting and maintaining wait times data with criteria in Standards for Internal Control in the Federal Government.5 According to the assessment, the usefulness of the wait time data is limited and the reliability of the data is not insufficient for certain purposes, such as for comparisons across ports. To determine how CBP officials use the agency’s wait time data to inform management decisions, we analyzed CBP guidance, policy, and other documents as well as interviewed CBP officials from headquarters and the six crossings to determine the extent to which wait times are a factor in CBP staff allocation decisions and infrastructure investment requests and decisions. To determine the status of DOT’s pilot projects to automate wait time data at the southwest border, we interviewed officials at DOT’s Federal Highway Administration, Texas Department of Transportation, and Texas A&M University and reviewed documentary evidence they provided. We compared evidence of CBP’s stated plans to automate wait times with criteria on standards for program management.6
To address the second objective, we reviewed and analyzed CBP and GSA assessments of land port of entry condition and capacity, such as CBP’s Strategic Resource Assessments and GSA’s BorderWizardTM
4We selected these non-CBP stakeholders to provide us with a range of perspectives on commercial vehicle traffic at southwest border crossings. The results of these interviews are not generalizable but rather provide context for CBP officials’ perspectives on these issues. 5GAO, Standards for Internal Control in the Federal Government, GAO/AIMD-00-21.3.1 (Washington, D.C.: November 1999). These standards, issued pursuant to the requirements of the Federal Managers’ Financial Integrity Act of 1982, Pub. L. No. 97-255, 96 Stat. 814, provide the overall framework for establishing and maintaining internal control in the federal government. 6Project Management Institute, The Standard for Program Management©, Second Edition, (Newton Square, Pennsylvania: 2008).

Appendix II: Objectives, Scope, and Methodology
Page 54 GAO-13-603 U.S.-Mexico Border
reports.7 We also interviewed CBP and GSA officials about infrastructure needs at land border crossings and how these needs are identified and prioritized. We reviewed documentation of CBP’s workload staffing model, which is used to determine staff needs at land ports of entry, and interviewed CBP officials about the agency’s staff allocation policies and processes and compared these with criteria in our previous work on human capital management and Standards for Internal Control in the Federal Government.8 In addition, we conducted an analysis of CBP’s hourly data on traffic volume and number of primary lanes open at the six selected crossings to determine the extent to which CBP has utilized primary lanes for commercial vehicle traffic from fiscal years 2008 through 2012. We selected this 5-year period to provide a sufficiently long time period for trend analysis. As our analysis focused on identifying trends in routine commercial vehicle traffic by crossing, we included both Free and Secure Trade (FAST) and non-FAST traffic volume and lanes, but excluded hazardous materials traffic.9
7The strategic resource assessment is a needs assessment process by which CBP collects and analyzes information about the infrastructure at each crossing, identifies needs, and prioritizes infrastructure improvement projects along the northern and southern borders. CBP officials reported conducting these assessments fiscal years 2003 through 2006. BorderWizardTM analyses serve as a decision-making resource/reference for GSA and assist GSA in planning and designing land ports of entry.
To ensure data reliability, we did not include any records on traffic volume or lanes open that fell outside CBP’s reported hours of operation. In addition, within the reported hours of operation, we included the data in our analysis for any given hour if CBP provided records for both traffic volume and lanes open. We conducted this analysis for the six crossings we visited; thus our findings are not generalizable to the entire southwest border. However, these six crossings processed approximately 70 percent of commercial vehicle
8For prior work on human capital management see GAO, A Model of Strategic Human Capital Management, GAO-02-373SP (Washington, D.C.: March 2002), and GAO/AIMD-00-21.3.1. This report describes a human capital model we developed that identifies eight critical success factors for managing human capital strategically. In developing this model, we built upon GAO’s Human Capital: A Self-Assessment Checklist for Agency Leaders (GAO/OCG-00-14G, September 2000). Among other steps, we also considered lessons learned from GAO reports on public and private organizations that are viewed as leaders in strategic human capital management and managing for results. See also GAO, Standards for Internal Control in the Federal Government, GAO/AIMD-00-21.3.1 9CBP initiated the FAST program in 2002 to expedite the travel of low-risk screened shipments across the border. Many land border crossings have dedicated FAST lanes to expedite FAST traffic.
Appendix II: Objectives, Scope, and Methodology
Page 55 GAO-13-603 U.S.-Mexico Border
traffic coming into the United States from Mexico for fiscal year 2008 through July 2012. To assess the reliability of these data, we reviewed relevant documentation; interviewed knowledgeable agency officials; and electronically tested for missing data during hours of operation, outlier records outside of hours of operation, and obvious errors (such as data records showing traffic being processed when no lanes were reportedly open). We also reviewed related internal controls and traced a selection of data to source files. We determined that the data were sufficiently reliable for the purposes of our report.
In addition, to address the second objective, we asked CBP officials at headquarters, field offices, and ports of entry about (1) the sufficiency of staffing levels and infrastructure capacity to process the current volume of commercial traffic at the six crossings we visited, (2) CBP assessment and consideration of any staffing or infrastructure gaps when making resource allocation decisions, (3) CBP actions and plans to address any of these gaps, and (4) any challenges to effectively responding to any gaps that CBP identified. We also discussed CBP processes for determining staff needs at land ports of entry and allocating staff to the ports of entry. We then compared CBP’s staffing policies and processes with criteria in our previous work on human capital management and Standards for Internal Control in the Federal Government.10
To address the third objective, we reviewed documentation of CBP’s fiscal year 2013 performance goals, measures, and reports. We then assessed CBP’s measures against criteria in OMB Circular No. A-11 and useful practices GAO previously identified to enhance performance management and measurement processes to determine the extent to which CBP’s existing performance measures capture progress toward
In addition, we discussed CBP’s workload staffing model and how it has been used to inform staffing processes with CBP officials responsible for the model. In addition, we interviewed relevant GSA, state, and local officials, as well as nongovernmental stakeholders regarding any coordinated efforts to identify, prioritize, and implement infrastructure improvements at land ports of entry on the southwest border.
10See GAO-02-373SP and GAO/AIMD-00-21.3.1.
Appendix II: Objectives, Scope, and Methodology
Page 56 GAO-13-603 U.S.-Mexico Border
goals and incorporate successful practices.11
We also identified studies that quantified the economic impact of commercial vehicle wait times on cross-border commerce by searching literature and asking relevant interviewees whether they were aware of any such studies. We reviewed over 100 identified studies and analyzed the six studies that determined an economic impact of commercial vehicle wait times on the southwest border. A more detailed description of our methodology and the results of these studies are presented in appendix I.
We also interviewed relevant DHS and CBP officials about CBP’s current performance measures, the adequacy of these measures, their perspectives on the balance between the agency’s security and trade facilitation goals, and the extent to which CBP uses its wait time data to measure progress.
We conducted this performance audit from July 2012 to July 2013 in accordance with generally accepted government auditing standards. Those standards require that we plan and perform the audit to obtain sufficient, appropriate evidence to provide a reasonable basis for our findings and conclusions based on our audit objectives. We believe that the evidence obtained provides a reasonable basis for our findings and conclusions based on our audit objectives.
11See OMB Circular No. A-11, Preparation, Submission, and Execution of the Budget (Washington, D.C.: Aug. 3, 2012). See also GAO, Managing for Results: Strengthening Regulatory Agencies’ Performance Management Practices, GAO/GGD-00-10 (Washington, D.C.: Oct. 28, 1999). In this report we gathered information from 23 federal and state organizations that we or other credible sources identified as using or planning to use a variety of useful practices to enhance specific aspects of their performance management and measurement processes. The organizations, although they had different missions, sizes, and organizational structures, said they consistently recognized that these practices are important in their efforts to develop a stronger results orientation.
Appendix III: U.S. Customs and Border Protection’s Capital Investment Planning Process
Page 57 GAO-13-603 U.S.-Mexico Border
This appendix describes CBP’s reported process for identifying and prioritizing its infrastructure investment needs at land ports of entry on the northern and southwestern land borders.
According to CBP documents, CBP identifies and prioritizes the infrastructure needs of land ports of entry through a six-part process that culminates in a 5-year-plan.1 The Department of Homeland Security Appropriations Act for fiscal year 2009 required beginning in fiscal year 2010 and every year thereafter, that CBP’s annual budget submission for construction include, in consultation with GSA, a detailed 5-year plan for all federal land port of entry projects with a yearly update of total projected future funding needs.2
1. Strategic Resource Assessments
This process, known as the capital investment plan (CIP), includes gathering data through Strategic Resource Assessments (SRA), scoring identified needs at each land port of entry using data and information gathered from the SRA, conducting a sensitivity analysis on the initial ranking of needs, assessing projects’ feasibility and risk, using the information gathered from the previous steps in the process to develop and issue CBP’s 5-year capital investment plan, and assessing the CIP process. Each step is described in further detail below.
According to CBP, the first stage in the CIP is to conduct SRAs, which are infrastructure needs assessments intended to gather and present data to support the prioritization of CBP’s facility projects on a national level. The SRA includes internal and external stakeholder input, workload and personnel forecasts, space capacity analyses, architectural evaluation of port facilities, and recommended options to meet current and future space needs.
1Department of Homeland Security, U.S. Customs and Border Protection, Land Port of Entry Modernization: Promoting Security, Travel and Trade Fiscal Year 2012 Report to Congress, (Washington, D.C.: June 2012). 2Pub. L. No. 110-329, div. D, 122 Stat. 3652, 3658 (2008). The fiscal year 2010 DHS appropriation included the same language. See Pub. L. No. 111-83, 123 Stat. 2142, 2148 (2009). In fiscal year 2012, the DHS appropriation included similar language but also required that the projected future funding needs be delineated by land port of entry. See Pub. L. No. 112-74, div. D., 125 Stat. 943, 949 (2011). The fiscal year 2011 continuing resolution and the fiscal year 2013 DHS appropriation did not include this language. See Pub. L. No. 112-10, 125 Stat. 38, 140; Pub. L. No. 113-6, div. D, 127 Stat. 342, 346.
Appendix III: U.S. Customs and Border Protection’s Capital Investment Planning Process
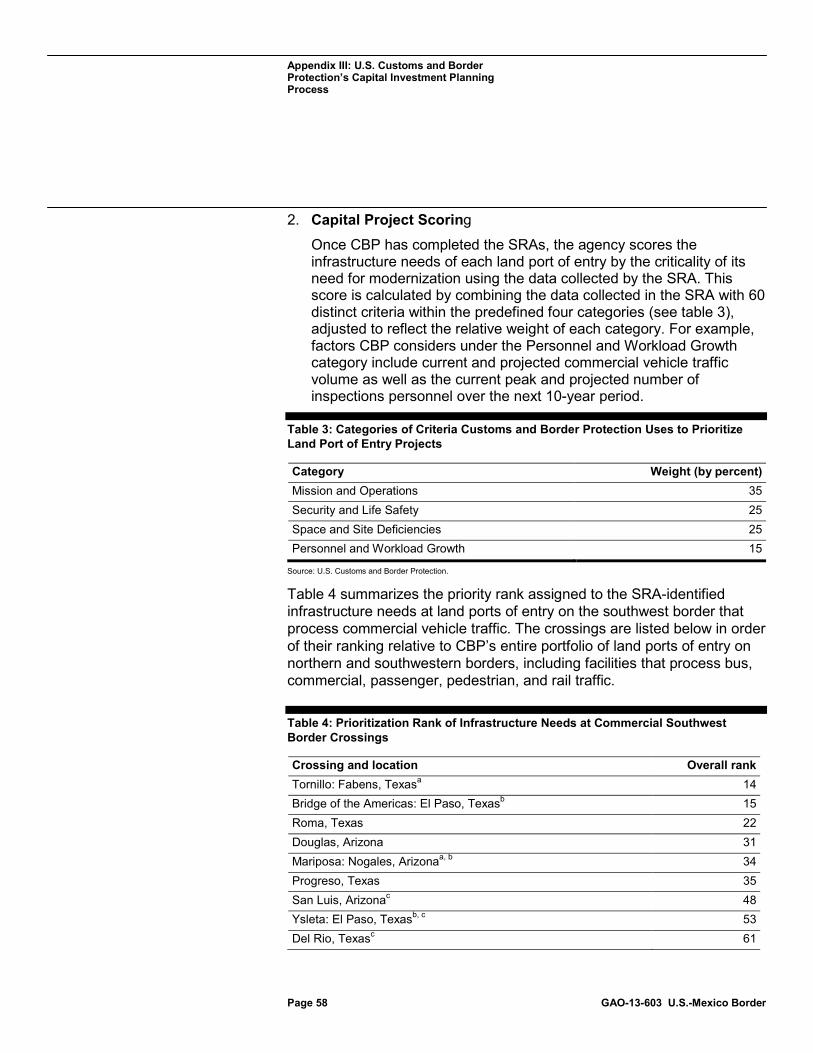
Appendix III: U.S. Customs and Border Protection’s Capital Investment Planning Process
Page 58 GAO-13-603 U.S.-Mexico Border
2. Capital Project Scoring
Once CBP has completed the SRAs, the agency scores the infrastructure needs of each land port of entry by the criticality of its need for modernization using the data collected by the SRA. This score is calculated by combining the data collected in the SRA with 60 distinct criteria within the predefined four categories (see table 3), adjusted to reflect the relative weight of each category. For example, factors CBP considers under the Personnel and Workload Growth category include current and projected commercial vehicle traffic volume as well as the current peak and projected number of inspections personnel over the next 10-year period.
Table 3: Categories of Criteria Customs and Border Protection Uses to Prioritize Land Port of Entry Projects
Category Weight (by percent) Mission and Operations 35 Security and Life Safety 25 Space and Site Deficiencies 25 Personnel and Workload Growth 15
Source: U.S. Customs and Border Protection.
Table 4 summarizes the priority rank assigned to the SRA-identified infrastructure needs at land ports of entry on the southwest border that process commercial vehicle traffic. The crossings are listed below in order of their ranking relative to CBP’s entire portfolio of land ports of entry on northern and southwestern borders, including facilities that process bus, commercial, passenger, pedestrian, and rail traffic.
Table 4: Prioritization Rank of Infrastructure Needs at Commercial Southwest Border Crossings
Crossing and location Overall rank Tornillo: Fabens, Texasa 14 Bridge of the Americas: El Paso, Texasb 15 Roma, Texas 22 Douglas, Arizona 31 Mariposa: Nogales, Arizonaa, b 34 Progreso, Texas 35 San Luis, Arizonac 48 Ysleta: El Paso, Texasb, c 53 Del Rio, Texasc 61
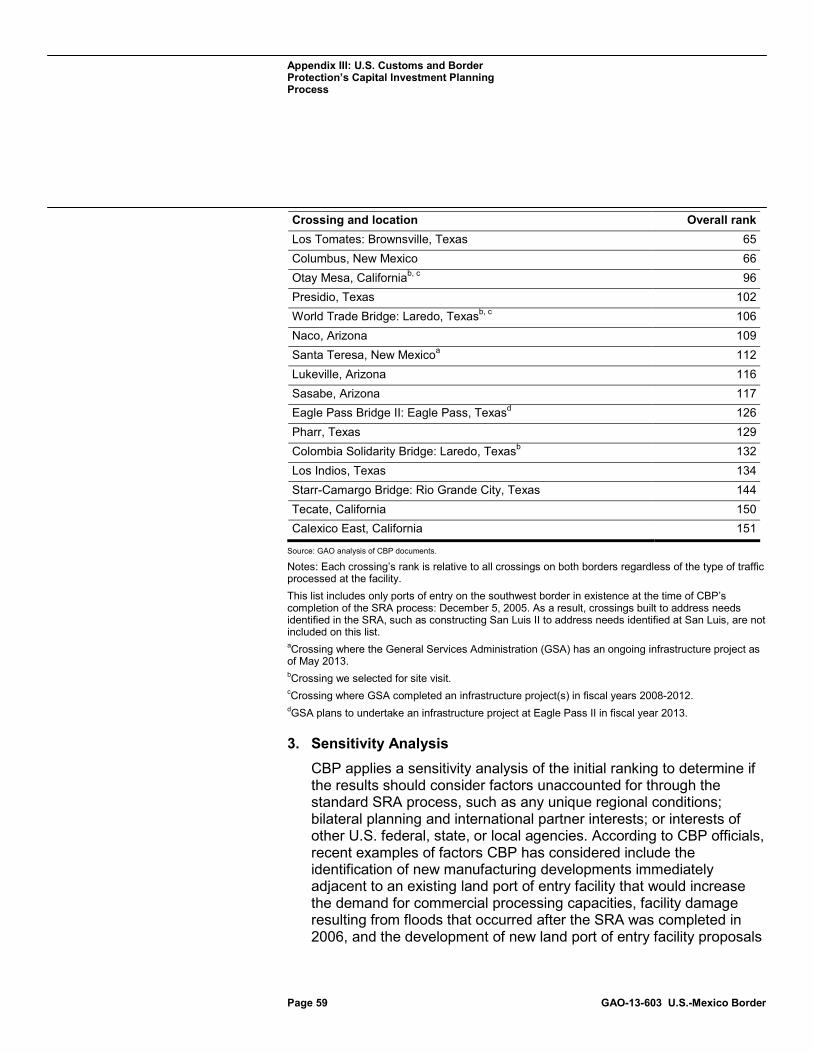
Appendix III: U.S. Customs and Border Protection’s Capital Investment Planning Process
Page 59 GAO-13-603 U.S.-Mexico Border
Crossing and location Overall rank Los Tomates: Brownsville, Texas 65 Columbus, New Mexico 66 Otay Mesa, Californiab, c 96 Presidio, Texas 102 World Trade Bridge: Laredo, Texasb, c 106 Naco, Arizona 109 Santa Teresa, New Mexicoa 112 Lukeville, Arizona 116 Sasabe, Arizona 117 Eagle Pass Bridge II: Eagle Pass, Texasd 126 Pharr, Texas 129 Colombia Solidarity Bridge: Laredo, Texasb 132 Los Indios, Texas 134 Starr-Camargo Bridge: Rio Grande City, Texas 144 Tecate, California 150 Calexico East, California 151
Source: GAO analysis of CBP documents.
Notes: Each crossing’s rank is relative to all crossings on both borders regardless of the type of traffic processed at the facility. This list includes only ports of entry on the southwest border in existence at the time of CBP’s completion of the SRA process: December 5, 2005. As a result, crossings built to address needs identified in the SRA, such as constructing San Luis II to address needs identified at San Luis, are not included on this list. aCrossing where the General Services Administration (GSA) has an ongoing infrastructure project as of May 2013. bCrossing we selected for site visit. cCrossing where GSA completed an infrastructure project(s) in fiscal years 2008-2012. dGSA plans to undertake an infrastructure project at Eagle Pass II in fiscal year 2013.
3. Sensitivity Analysis CBP applies a sensitivity analysis of the initial ranking to determine if the results should consider factors unaccounted for through the standard SRA process, such as any unique regional conditions; bilateral planning and international partner interests; or interests of other U.S. federal, state, or local agencies. According to CBP officials, recent examples of factors CBP has considered include the identification of new manufacturing developments immediately adjacent to an existing land port of entry facility that would increase the demand for commercial processing capacities, facility damage resulting from floods that occurred after the SRA was completed in 2006, and the development of new land port of entry facility proposals
Appendix III: U.S. Customs and Border Protection’s Capital Investment Planning Process
Page 60 GAO-13-603 U.S.-Mexico Border
in the same transportation region as an existing facility. CBP officials report that this information helps CBP identify additional drivers, constraints, and legislative mandates that may change the critical needs ranking.
4. Risk and Feasibility Assessments In this phase, CBP coordinates with key project stakeholders such as GSA to evaluate the feasibility and risk associated with project implementation including environmental, cultural, and historic preservation requirements as well as land acquisition requirements. Additionally, according to senior CBP officials, CBP considers the likelihood of obtaining the necessary resources to fund the proposed project.
5. 5-Year Capital Investment Plan Once CBP has taken the previous steps, it uses the information and analyses to develop its capital investment plan, in coordination with GSA. CBP and GSA update the capital investment plan annually, taking into account any changes in DHS’s mission and strategy, the changing conditions at land ports of entry, and any other factors discovered in the course of projects already under way. With each update, CBP identifies which projects are of highest priority. GSA then works with CBP to identify which projects may be considered for near-term design and construction funding, which require an initial or updated feasibility study, or which require further evaluation to account for issues such as environmental and local community concerns.
6. Assessment of the CIP Methodology In response to expected budget constraints and as a general revalidation of its existing planning cycle, according to CBP Office of Administration officials and CBP documents, CBP is revisiting the process it uses to develop the 5-year plan. Although the assessment is in development, CBP aims to better incorporate up-front stakeholder involvement, place additional emphasis on state and local government-driven master planning fed by regional trend analyses, adopt a consistent and comprehensive communications approach, evaluate alternative funding mechanisms, assess broader programmatic needs, and target high-impact and lower-cost investments.
Appendix IV: Ongoing, Planned, or Completed Land Port of Entry Renovation Projects, Fiscal Years 2008 through 2012
Page 61 GAO-13-603 U.S.-Mexico Border
The tables in this appendix summarize infrastructure improvement projects that CBP and GSA officials reported were completed from fiscal year 2008 through 2012 at southwest border land ports of entry that process commercial traffic as well as infrastructure improvement projects GSA and CBP reported to be ongoing or in planning or design phases as of May 2013.1 GSA’s Federal Buildings Fund included $564 million for land port of entry infrastructure improvement projects in fiscal years 2008 through 2010 and none in fiscal years 2011 and 2012. In addition, the American Recovery and Reinvestment Act (ARRA) of 2009 allocated $300 million for the GSA-owned land ports of entry that is being used to provide design or construction funds to seven new or ongoing capital projects.2
Table 5 summarizes the five infrastructure improvement projects GSA completed at southwest border land ports of entry that process commercial traffic in the period of fiscal years 2008 through 2012. Three of these projects were at crossings we visited—World Trade Bridge in Laredo, Texas; Ysleta in El Paso, Texas; and Otay Mesa near San Diego, California.
CBP officials reported that the completed projects presented in table 4 cost a total of approximately $115 million and estimates that ongoing and planned projects to renovate these land ports of entry, presented in table 5, will cost approximately $370 million.
1We included projects completed or in development over the last 5 fiscal years to provide a perspective on the most recent projects completed or under way. We excluded small-scale projects, such as the addition of two exit booths at the Bridge of Americas in El Paso, Texas, in 2012, because these projects are primarily funded out of CBP’s Office of Field Operation’s operation budget—not GSA’s Federal Building Fund or American Reconstruction and Recovery Act. 2Pub. L. No. 111-5, 123 Stat. 115, 149. Two of the seven GSA-owned land port of entry ARRA-funded projects were for crossings that process commercial traffic on the southwest border: Mariposa in Arizona, and Santa Teresa in New Mexico. The remainder of the funds were for crossings that are located on the northern border or do not process commercial traffic. In addition, ARRA also allocated another $420 million to modernize 31 existing land crossings owned by CBP. See 123 Stat. at 162. However, all but three of these projects were for crossings on the northern border, and none of the projects were for crossings on the southwest border that process commercial traffic.
Appendix IV: Ongoing, Planned, or Completed Land Port of Entry Renovation Projects, Fiscal Years 2008 through 2012
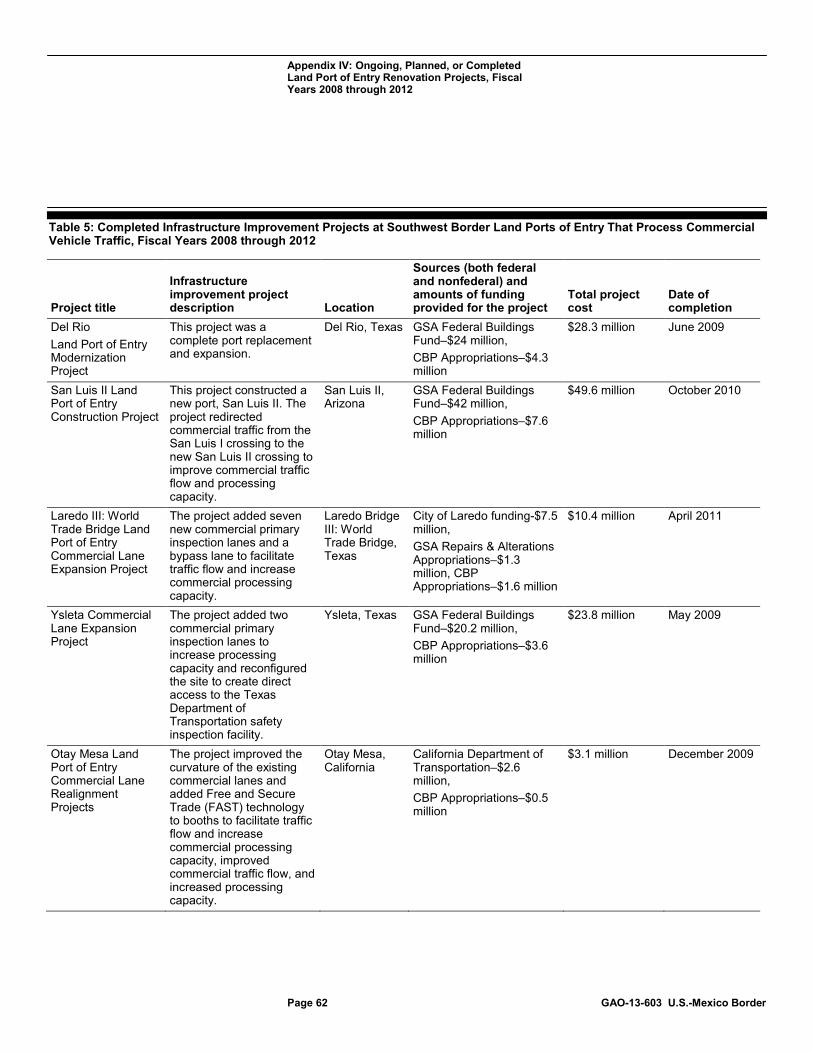
Appendix IV: Ongoing, Planned, or Completed Land Port of Entry Renovation Projects, Fiscal Years 2008 through 2012
Page 62 GAO-13-603 U.S.-Mexico Border
Table 5: Completed Infrastructure Improvement Projects at Southwest Border Land Ports of Entry That Process Commercial Vehicle Traffic, Fiscal Years 2008 through 2012
Project title
Infrastructure improvement project description Location
Sources (both federal and nonfederal) and amounts of funding provided for the project
Total project cost
Date of completion
Del Rio Land Port of Entry Modernization Project
This project was a complete port replacement and expansion.
Del Rio, Texas GSA Federal Buildings Fund–$24 million, CBP Appropriations–$4.3 million
$28.3 million June 2009
San Luis II Land Port of Entry Construction Project
This project constructed a new port, San Luis II. The project redirected commercial traffic from the San Luis I crossing to the new San Luis II crossing to improve commercial traffic flow and processing capacity.
San Luis II, Arizona
GSA Federal Buildings Fund–$42 million, CBP Appropriations–$7.6 million
$49.6 million October 2010
Laredo III: World Trade Bridge Land Port of Entry Commercial Lane Expansion Project
The project added seven new commercial primary inspection lanes and a bypass lane to facilitate traffic flow and increase commercial processing capacity.
Laredo Bridge III: World Trade Bridge, Texas
City of Laredo funding-$7.5 million, GSA Repairs & Alterations Appropriations–$1.3 million, CBP Appropriations–$1.6 million
$10.4 million April 2011
Ysleta Commercial Lane Expansion Project
The project added two commercial primary inspection lanes to increase processing capacity and reconfigured the site to create direct access to the Texas Department of Transportation safety inspection facility.
Ysleta, Texas GSA Federal Buildings Fund–$20.2 million, CBP Appropriations–$3.6 million
$23.8 million May 2009
Otay Mesa Land Port of Entry Commercial Lane Realignment Projects
The project improved the curvature of the existing commercial lanes and added Free and Secure Trade (FAST) technology to booths to facilitate traffic flow and increase commercial processing capacity, improved commercial traffic flow, and increased processing capacity.
Otay Mesa, California
California Department of Transportation–$2.6 million, CBP Appropriations–$0.5 million
$3.1 million December 2009
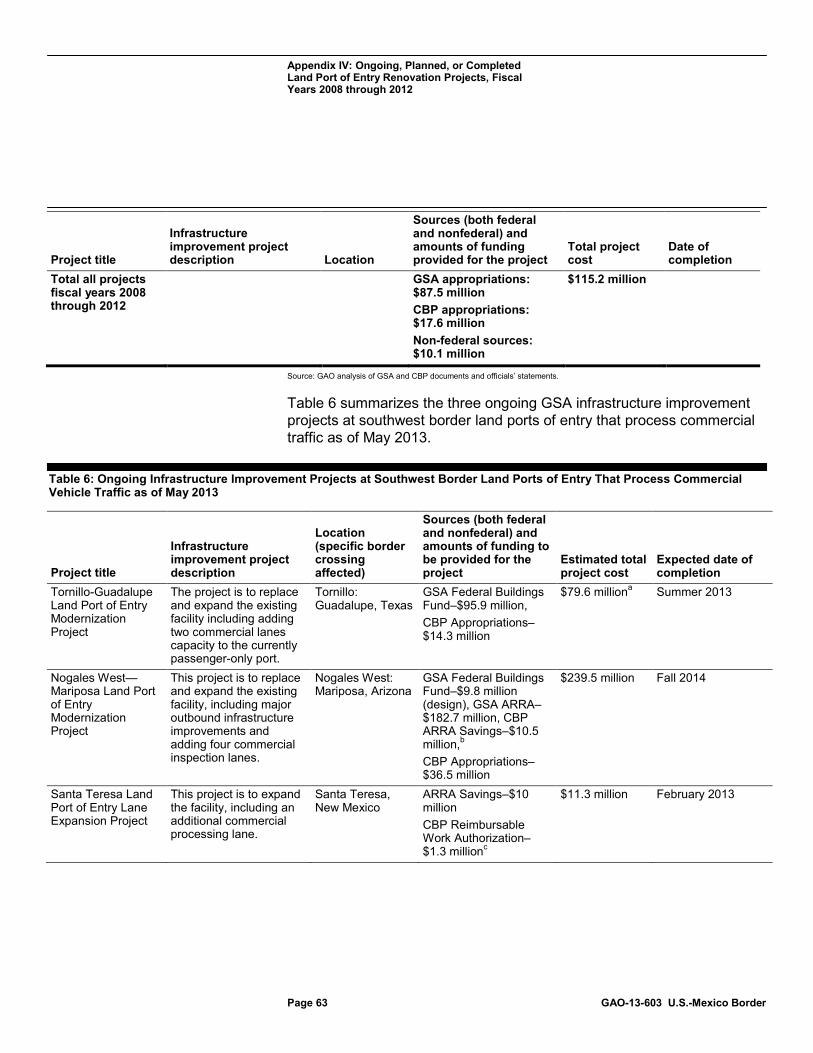
Appendix IV: Ongoing, Planned, or Completed Land Port of Entry Renovation Projects, Fiscal Years 2008 through 2012
Page 63 GAO-13-603 U.S.-Mexico Border
Project title
Infrastructure improvement project description Location
Sources (both federal and nonfederal) and amounts of funding provided for the project
Total project cost
Date of completion
Total all projects fiscal years 2008 through 2012
GSA appropriations: $87.5 million CBP appropriations: $17.6 million Non-federal sources: $10.1 million
$115.2 million
Source: GAO analysis of GSA and CBP documents and officials’ statements.
Table 6 summarizes the three ongoing GSA infrastructure improvement projects at southwest border land ports of entry that process commercial traffic as of May 2013.
Table 6: Ongoing Infrastructure Improvement Projects at Southwest Border Land Ports of Entry That Process Commercial Vehicle Traffic as of May 2013
Project title
Infrastructure improvement project description
Location (specific border crossing affected)
Sources (both federal and nonfederal) and amounts of funding to be provided for the project
Estimated total project cost
Expected date of completion
Tornillo-Guadalupe Land Port of Entry Modernization Project
The project is to replace and expand the existing facility including adding two commercial lanes capacity to the currently passenger-only port.
Tornillo: Guadalupe, Texas
GSA Federal Buildings Fund–$95.9 million, CBP Appropriations–$14.3 million
$79.6 milliona Summer 2013
Nogales West—Mariposa Land Port of Entry Modernization Project
This project is to replace and expand the existing facility, including major outbound infrastructure improvements and adding four commercial inspection lanes.
Nogales West: Mariposa, Arizona
GSA Federal Buildings Fund–$9.8 million (design), GSA ARRA–$182.7 million, CBP ARRA Savings–$10.5 million,b CBP Appropriations–$36.5 million
$239.5 million Fall 2014
Santa Teresa Land Port of Entry Lane Expansion Project
This project is to expand the facility, including an additional commercial processing lane.
Santa Teresa, New Mexico
ARRA Savings–$10 million CBP Reimbursable Work Authorization–$1.3 millionc
$11.3 million February 2013
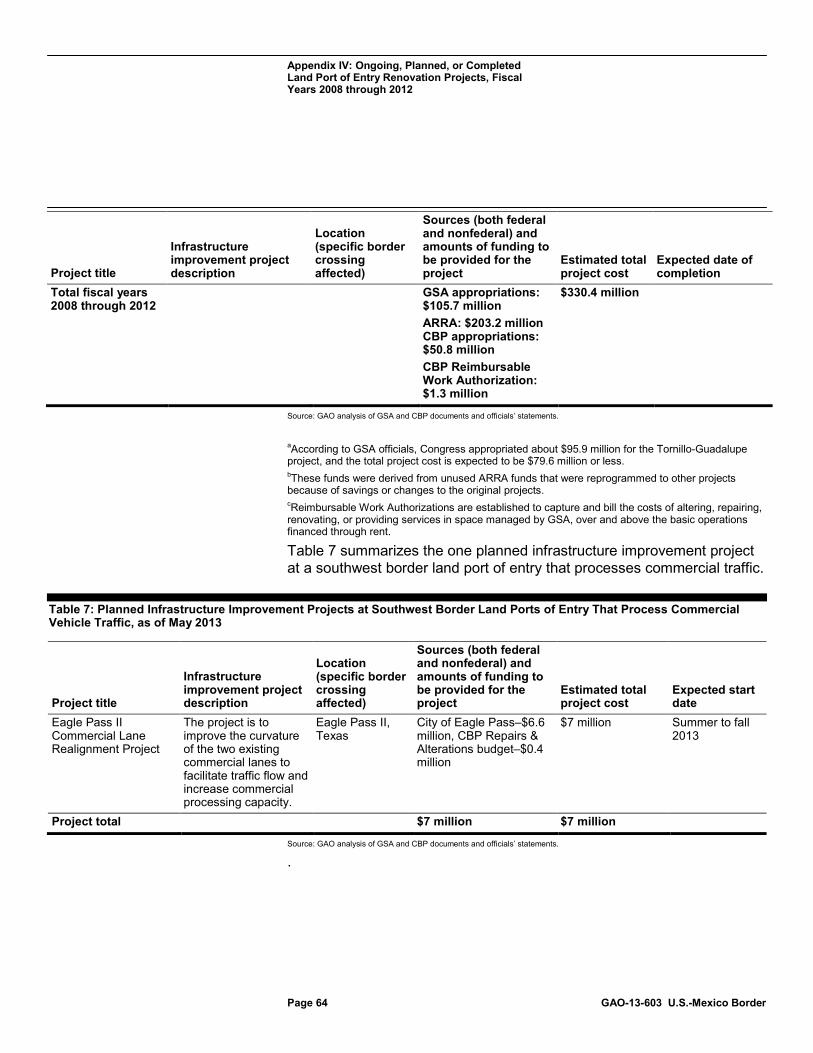
Appendix IV: Ongoing, Planned, or Completed Land Port of Entry Renovation Projects, Fiscal Years 2008 through 2012
Page 64 GAO-13-603 U.S.-Mexico Border
Project title
Infrastructure improvement project description
Location (specific border crossing affected)
Sources (both federal and nonfederal) and amounts of funding to be provided for the project
Estimated total project cost
Expected date of completion
Total fiscal years 2008 through 2012
GSA appropriations: $105.7 million ARRA: $203.2 million CBP appropriations: $50.8 million CBP Reimbursable Work Authorization: $1.3 million
$330.4 million
Source: GAO analysis of GSA and CBP documents and officials’ statements.
aAccording to GSA officials, Congress appropriated about $95.9 million for the Tornillo-Guadalupe project, and the total project cost is expected to be $79.6 million or less. bThese funds were derived from unused ARRA funds that were reprogrammed to other projects because of savings or changes to the original projects. cReimbursable Work Authorizations are established to capture and bill the costs of altering, repairing, renovating, or providing services in space managed by GSA, over and above the basic operations financed through rent.
Table 7 summarizes the one planned infrastructure improvement project at a southwest border land port of entry that processes commercial traffic.
Table 7: Planned Infrastructure Improvement Projects at Southwest Border Land Ports of Entry That Process Commercial Vehicle Traffic, as of May 2013
Project title
Infrastructure improvement project description
Location (specific border crossing affected)
Sources (both federal and nonfederal) and amounts of funding to be provided for the project
Estimated total project cost
Expected start date
Eagle Pass II Commercial Lane Realignment Project
The project is to improve the curvature of the two existing commercial lanes to facilitate traffic flow and increase commercial processing capacity.
Eagle Pass II, Texas
City of Eagle Pass–$6.6 million, CBP Repairs & Alterations budget–$0.4 million
$7 million
Summer to fall 2013
Project total $7 million $7 million
Source: GAO analysis of GSA and CBP documents and officials’ statements.
.
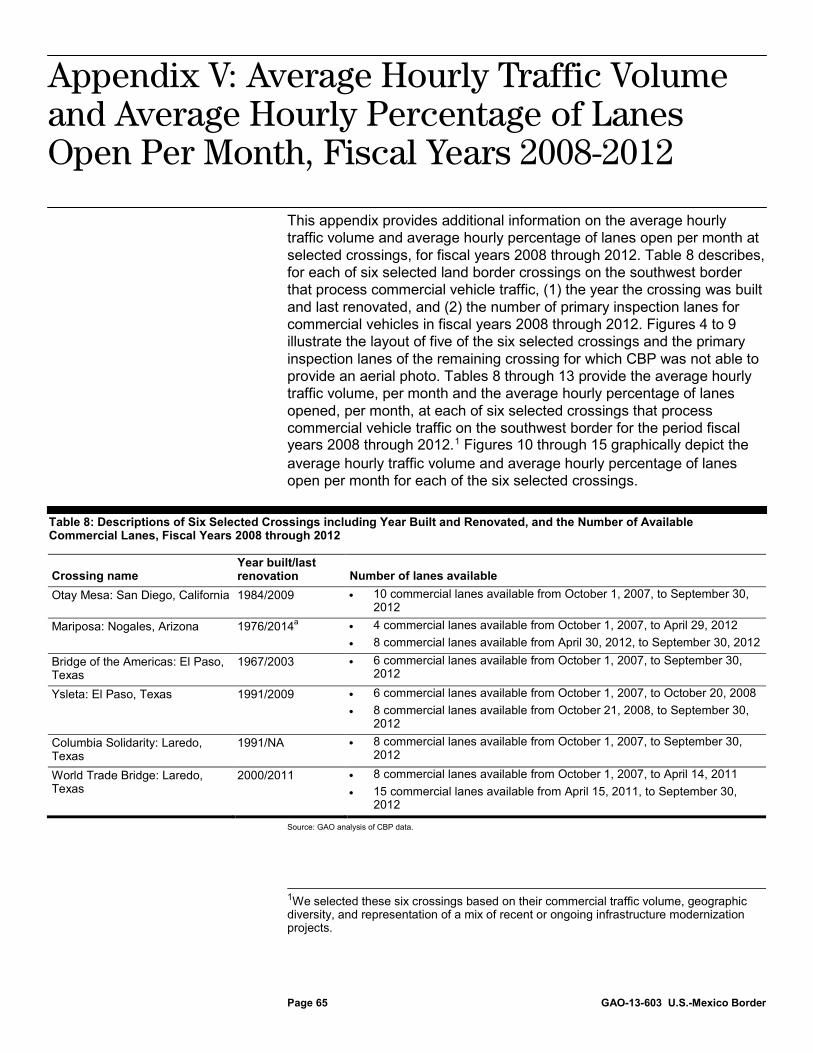
Appendix V: Average Hourly Traffic Volume and Average Hourly Percentage of Lanes Open Per Month, Fiscal Years 2008-2012
Page 65 GAO-13-603 U.S.-Mexico Border
This appendix provides additional information on the average hourly traffic volume and average hourly percentage of lanes open per month at selected crossings, for fiscal years 2008 through 2012. Table 8 describes, for each of six selected land border crossings on the southwest border that process commercial vehicle traffic, (1) the year the crossing was built and last renovated, and (2) the number of primary inspection lanes for commercial vehicles in fiscal years 2008 through 2012. Figures 4 to 9 illustrate the layout of five of the six selected crossings and the primary inspection lanes of the remaining crossing for which CBP was not able to provide an aerial photo. Tables 8 through 13 provide the average hourly traffic volume, per month and the average hourly percentage of lanes opened, per month, at each of six selected crossings that process commercial vehicle traffic on the southwest border for the period fiscal years 2008 through 2012.1
Table 8: Descriptions of Six Selected Crossings including Year Built and Renovated, and the Number of Available Commercial Lanes, Fiscal Years 2008 through 2012
Figures 10 through 15 graphically depict the average hourly traffic volume and average hourly percentage of lanes open per month for each of the six selected crossings.
Crossing name Year built/last renovation Number of lanes available
Otay Mesa: San Diego, California 1984/2009 • 10 commercial lanes available from October 1, 2007, to September 30, 2012
Mariposa: Nogales, Arizona 1976/2014a • 4 commercial lanes available from October 1, 2007, to April 29, 2012 • 8 commercial lanes available from April 30, 2012, to September 30, 2012
Bridge of the Americas: El Paso, Texas
1967/2003 • 6 commercial lanes available from October 1, 2007, to September 30, 2012
Ysleta: El Paso, Texas 1991/2009 • 6 commercial lanes available from October 1, 2007, to October 20, 2008 • 8 commercial lanes available from October 21, 2008, to September 30,
2012 Columbia Solidarity: Laredo, Texas
1991/NA • 8 commercial lanes available from October 1, 2007, to September 30, 2012
World Trade Bridge: Laredo, Texas
2000/2011 • 8 commercial lanes available from October 1, 2007, to April 14, 2011 • 15 commercial lanes available from April 15, 2011, to September 30,
2012
Source: GAO analysis of CBP data.
1We selected these six crossings based on their commercial traffic volume, geographic diversity, and representation of a mix of recent or ongoing infrastructure modernization projects.
Appendix V: Average Hourly Traffic Volume and Average Hourly Percentage of Lanes Open Per Month, Fiscal Years 2008-2012
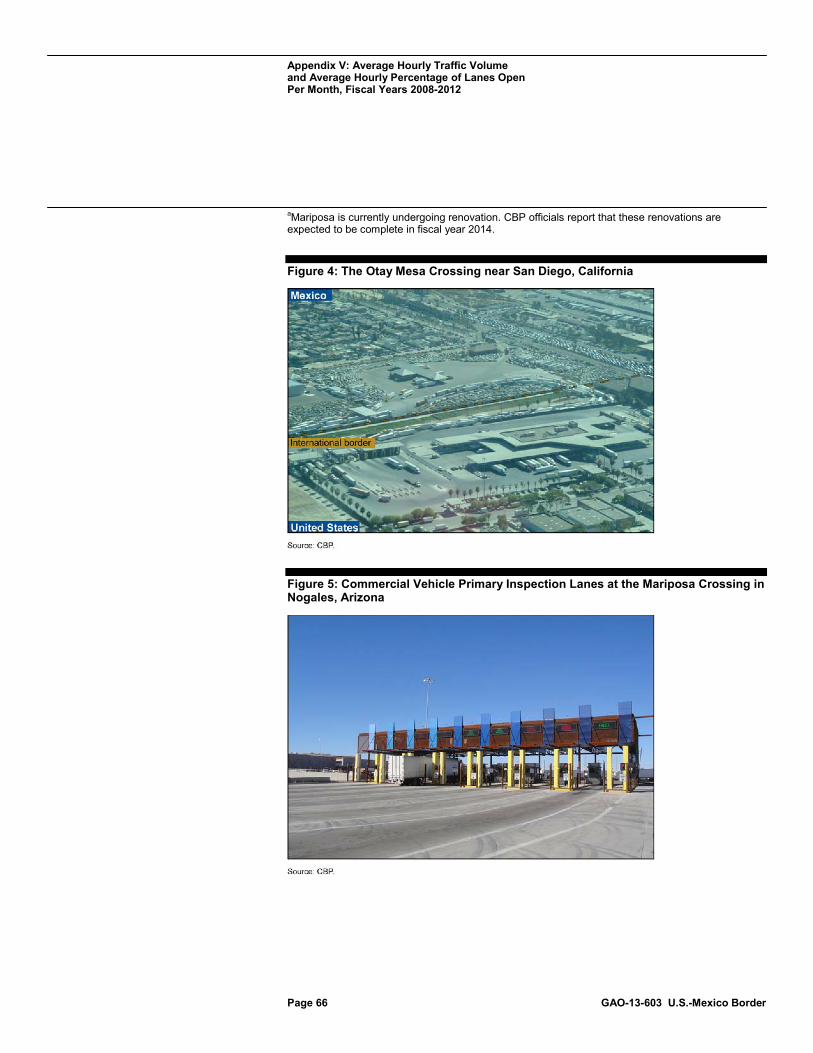
Appendix V: Average Hourly Traffic Volume and Average Hourly Percentage of Lanes Open Per Month, Fiscal Years 2008-2012
Page 66 GAO-13-603 U.S.-Mexico Border
aMariposa is currently undergoing renovation. CBP officials report that these renovations are expected to be complete in fiscal year 2014.
Figure 4: The Otay Mesa Crossing near San Diego, California
Figure 5: Commercial Vehicle Primary Inspection Lanes at the Mariposa Crossing in Nogales, Arizona
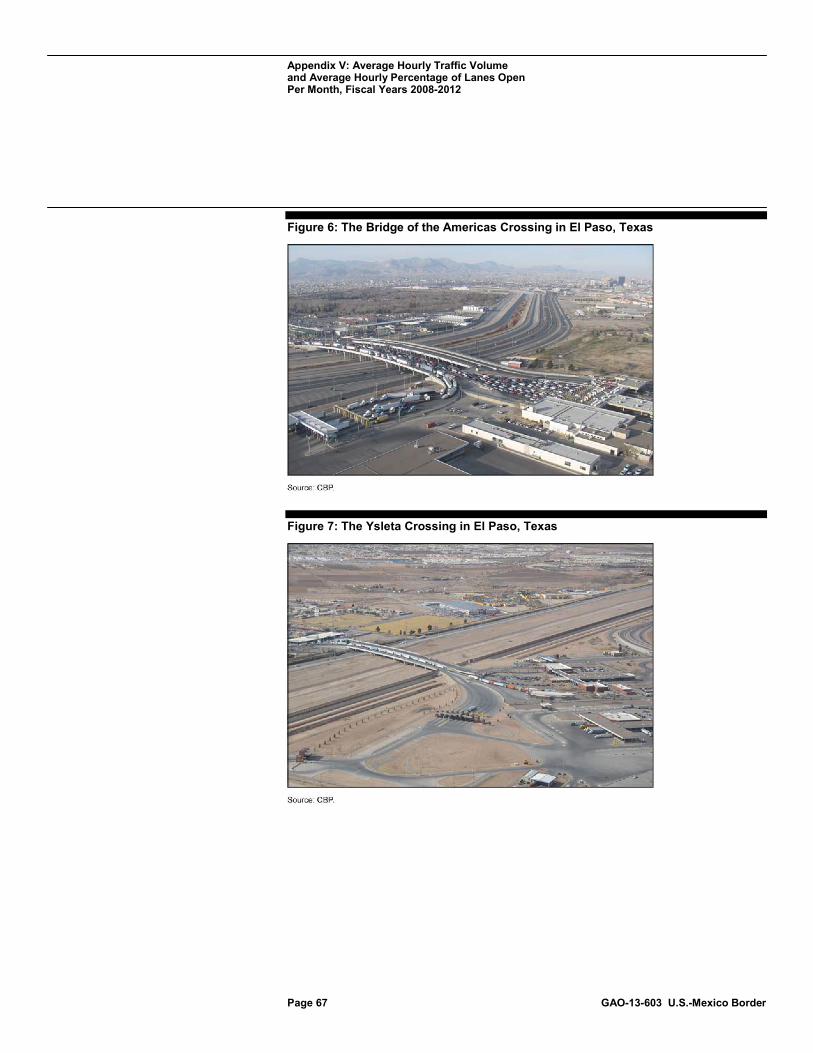
Appendix V: Average Hourly Traffic Volume and Average Hourly Percentage of Lanes Open Per Month, Fiscal Years 2008-2012
Page 67 GAO-13-603 U.S.-Mexico Border
Figure 6: The Bridge of the Americas Crossing in El Paso, Texas
Figure 7: The Ysleta Crossing in El Paso, Texas
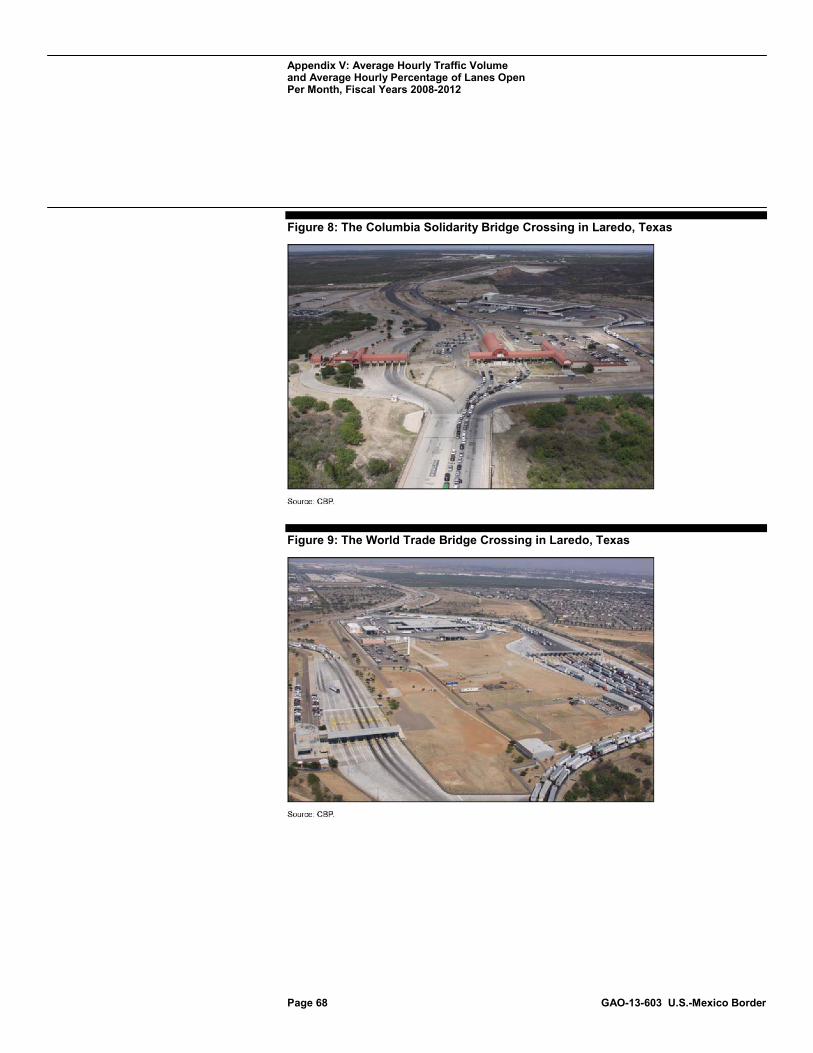
Appendix V: Average Hourly Traffic Volume and Average Hourly Percentage of Lanes Open Per Month, Fiscal Years 2008-2012
Page 68 GAO-13-603 U.S.-Mexico Border
Figure 8: The Columbia Solidarity Bridge Crossing in Laredo, Texas
Figure 9: The World Trade Bridge Crossing in Laredo, Texas
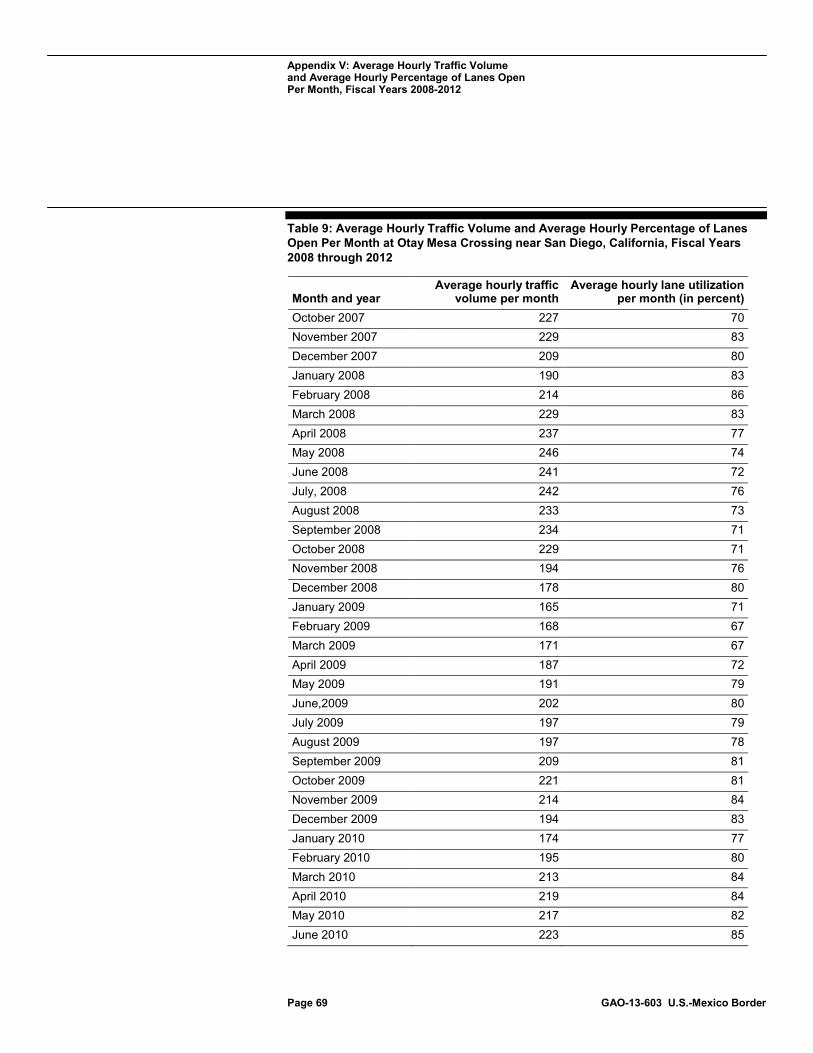
Appendix V: Average Hourly Traffic Volume and Average Hourly Percentage of Lanes Open Per Month, Fiscal Years 2008-2012
Page 69 GAO-13-603 U.S.-Mexico Border
Table 9: Average Hourly Traffic Volume and Average Hourly Percentage of Lanes Open Per Month at Otay Mesa Crossing near San Diego, California, Fiscal Years 2008 through 2012
Month and year Average hourly traffic
volume per month Average hourly lane utilization
per month (in percent) October 2007 227 70 November 2007 229 83 December 2007 209 80 January 2008 190 83 February 2008 214 86 March 2008 229 83 April 2008 237 77 May 2008 246 74 June 2008 241 72 July, 2008 242 76 August 2008 233 73 September 2008 234 71 October 2008 229 71 November 2008 194 76 December 2008 178 80 January 2009 165 71 February 2009 168 67 March 2009 171 67 April 2009 187 72 May 2009 191 79 June,2009 202 80 July 2009 197 79 August 2009 197 78 September 2009 209 81 October 2009 221 81 November 2009 214 84 December 2009 194 83 January 2010 174 77 February 2010 195 80 March 2010 213 84 April 2010 219 84 May 2010 217 82 June 2010 223 85
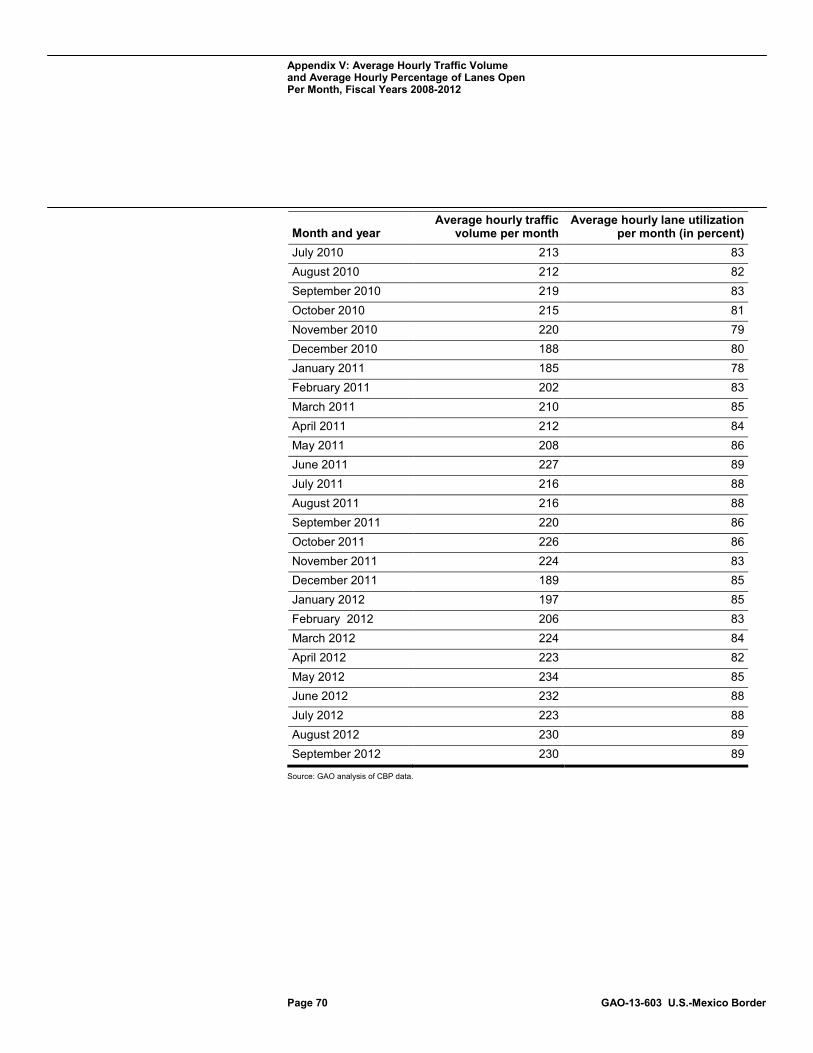
Appendix V: Average Hourly Traffic Volume and Average Hourly Percentage of Lanes Open Per Month, Fiscal Years 2008-2012
Page 70 GAO-13-603 U.S.-Mexico Border
Month and year Average hourly traffic
volume per month Average hourly lane utilization
per month (in percent) July 2010 213 83 August 2010 212 82 September 2010 219 83 October 2010 215 81 November 2010 220 79 December 2010 188 80 January 2011 185 78 February 2011 202 83 March 2011 210 85 April 2011 212 84 May 2011 208 86 June 2011 227 89 July 2011 216 88 August 2011 216 88 September 2011 220 86 October 2011 226 86 November 2011 224 83 December 2011 189 85 January 2012 197 85 February 2012 206 83 March 2012 224 84 April 2012 223 82 May 2012 234 85 June 2012 232 88 July 2012 223 88 August 2012 230 89 September 2012 230 89
Source: GAO analysis of CBP data.
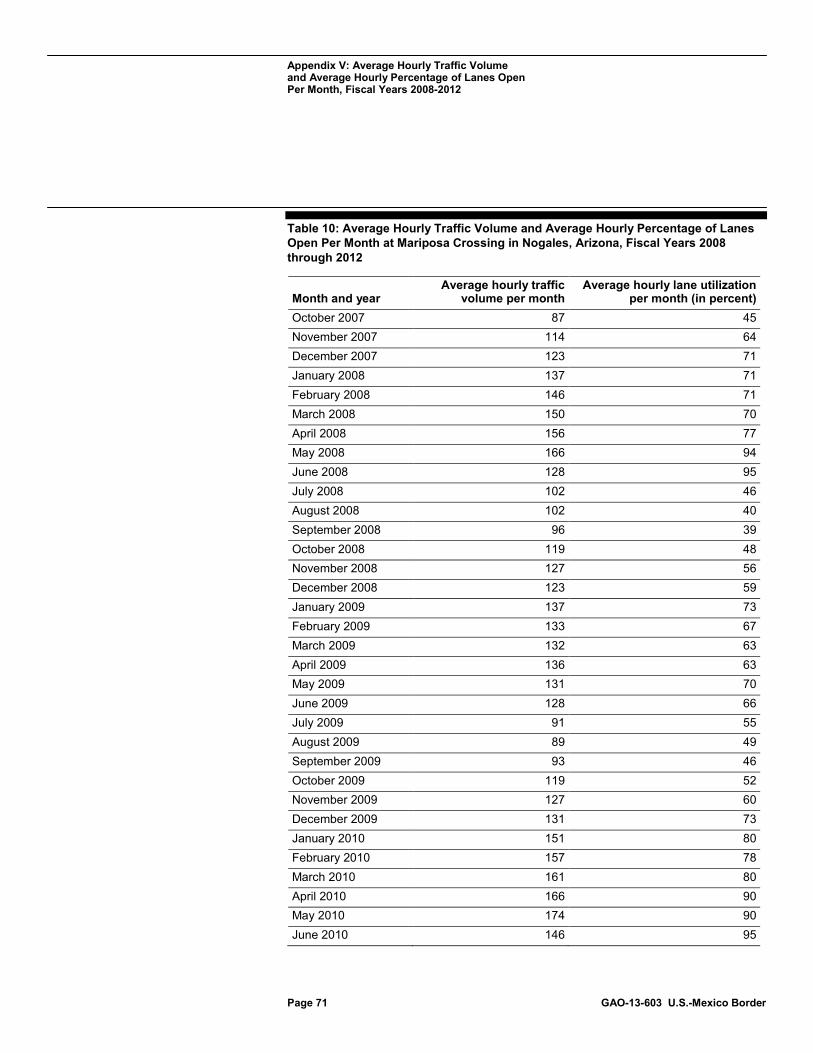
Appendix V: Average Hourly Traffic Volume and Average Hourly Percentage of Lanes Open Per Month, Fiscal Years 2008-2012
Page 71 GAO-13-603 U.S.-Mexico Border
Table 10: Average Hourly Traffic Volume and Average Hourly Percentage of Lanes Open Per Month at Mariposa Crossing in Nogales, Arizona, Fiscal Years 2008 through 2012
Month and year Average hourly traffic
volume per month Average hourly lane utilization
per month (in percent) October 2007 87 45 November 2007 114 64 December 2007 123 71 January 2008 137 71 February 2008 146 71 March 2008 150 70 April 2008 156 77 May 2008 166 94 June 2008 128 95 July 2008 102 46 August 2008 102 40 September 2008 96 39 October 2008 119 48 November 2008 127 56 December 2008 123 59 January 2009 137 73 February 2009 133 67 March 2009 132 63 April 2009 136 63 May 2009 131 70 June 2009 128 66 July 2009 91 55 August 2009 89 49 September 2009 93 46 October 2009 119 52 November 2009 127 60 December 2009 131 73 January 2010 151 80 February 2010 157 78 March 2010 161 80 April 2010 166 90 May 2010 174 90 June 2010 146 95
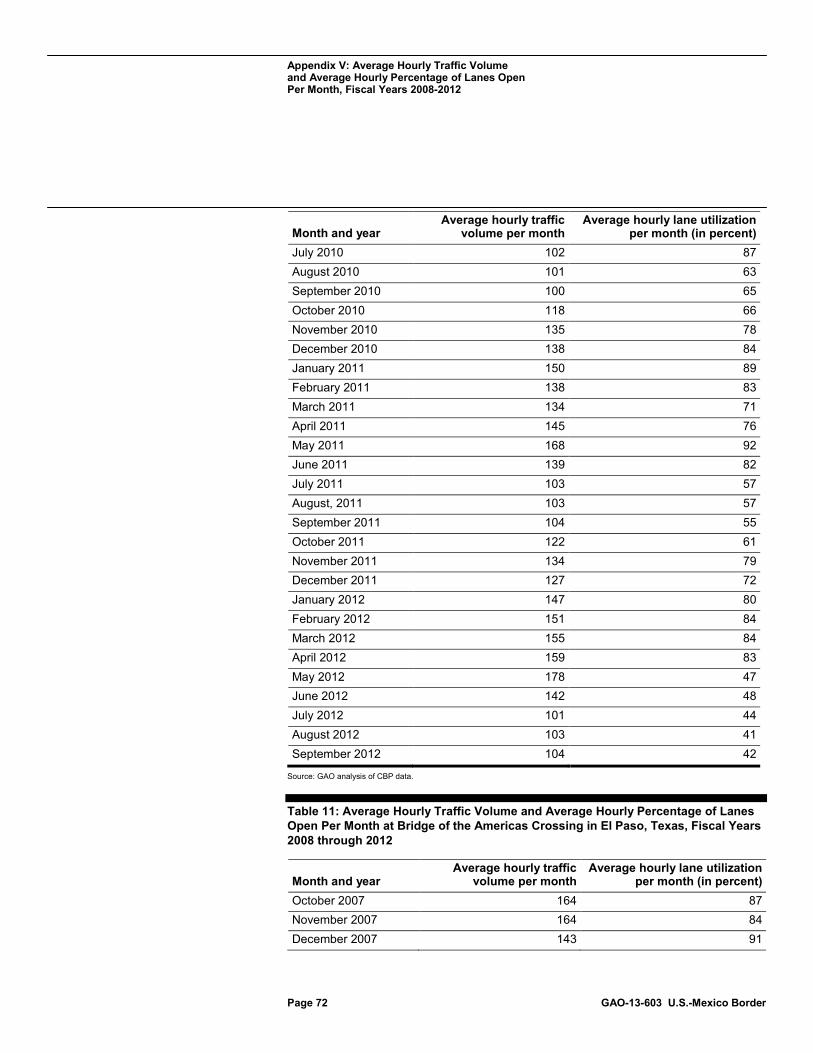
Appendix V: Average Hourly Traffic Volume and Average Hourly Percentage of Lanes Open Per Month, Fiscal Years 2008-2012
Page 72 GAO-13-603 U.S.-Mexico Border
Month and year Average hourly traffic
volume per month Average hourly lane utilization
per month (in percent) July 2010 102 87 August 2010 101 63 September 2010 100 65 October 2010 118 66 November 2010 135 78 December 2010 138 84 January 2011 150 89 February 2011 138 83 March 2011 134 71 April 2011 145 76 May 2011 168 92 June 2011 139 82 July 2011 103 57 August, 2011 103 57 September 2011 104 55 October 2011 122 61 November 2011 134 79 December 2011 127 72 January 2012 147 80 February 2012 151 84 March 2012 155 84 April 2012 159 83 May 2012 178 47 June 2012 142 48 July 2012 101 44 August 2012 103 41 September 2012 104 42
Source: GAO analysis of CBP data.
Table 11: Average Hourly Traffic Volume and Average Hourly Percentage of Lanes Open Per Month at Bridge of the Americas Crossing in El Paso, Texas, Fiscal Years 2008 through 2012
Month and year Average hourly traffic
volume per month Average hourly lane utilization
per month (in percent) October 2007 164 87 November 2007 164 84 December 2007 143 91

Appendix V: Average Hourly Traffic Volume and Average Hourly Percentage of Lanes Open Per Month, Fiscal Years 2008-2012
Page 73 GAO-13-603 U.S.-Mexico Border
Month and year Average hourly traffic
volume per month Average hourly lane utilization
per month (in percent) January 2008 153 93 February 2008 164 93 March 2008 161 89 April 2008 168 94 May 2008 168 93 June 2008 175 93 July 2008 163 94 August 2008 168 89 September 2008 154 92 October 2008 154 91 November 2008 142 86 December 2008 120 83 January 2009 134 88 February 2009 132 77 March 2009 129 78 April 2009 118 75 May 2009 114 73 June 2009 117 76 July 2009 118 76 August 2009 122 77 September 2009 129 80 October 2009 129 81 November 2009 137 86 December 2009 122 82 January 2010 137 86 February 2010 144 91 March 2010 139 88 April 2010 140 90 May 2010 66 40 June 2010 126 70 July 2010 125 49 August 2010 129 48 September 2010 131 53 October 2010 130 63 November 2010 131 63 December 2010 111 63
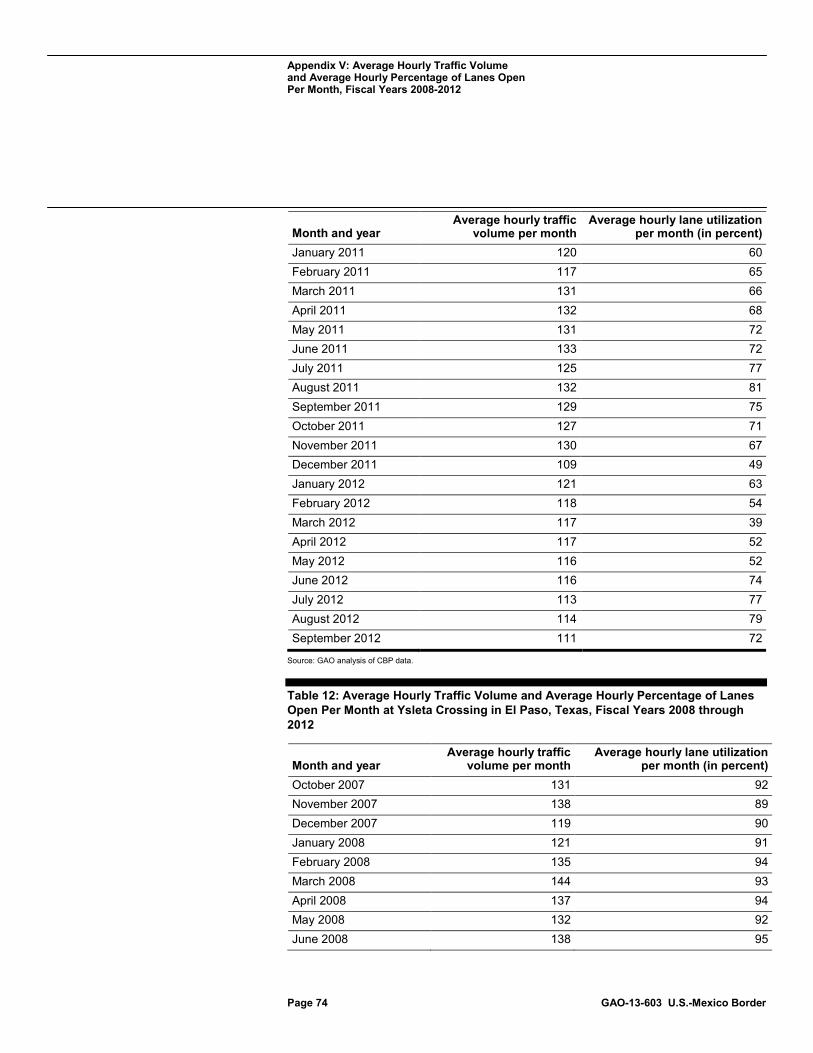
Appendix V: Average Hourly Traffic Volume and Average Hourly Percentage of Lanes Open Per Month, Fiscal Years 2008-2012
Page 74 GAO-13-603 U.S.-Mexico Border
Month and year Average hourly traffic
volume per month Average hourly lane utilization
per month (in percent) January 2011 120 60 February 2011 117 65 March 2011 131 66 April 2011 132 68 May 2011 131 72 June 2011 133 72 July 2011 125 77 August 2011 132 81 September 2011 129 75 October 2011 127 71 November 2011 130 67 December 2011 109 49 January 2012 121 63 February 2012 118 54 March 2012 117 39 April 2012 117 52 May 2012 116 52 June 2012 116 74 July 2012 113 77 August 2012 114 79 September 2012 111 72
Source: GAO analysis of CBP data.
Table 12: Average Hourly Traffic Volume and Average Hourly Percentage of Lanes Open Per Month at Ysleta Crossing in El Paso, Texas, Fiscal Years 2008 through 2012
Month and year Average hourly traffic
volume per month Average hourly lane utilization
per month (in percent) October 2007 131 92 November 2007 138 89 December 2007 119 90 January 2008 121 91 February 2008 135 94 March 2008 144 93 April 2008 137 94 May 2008 132 92 June 2008 138 95
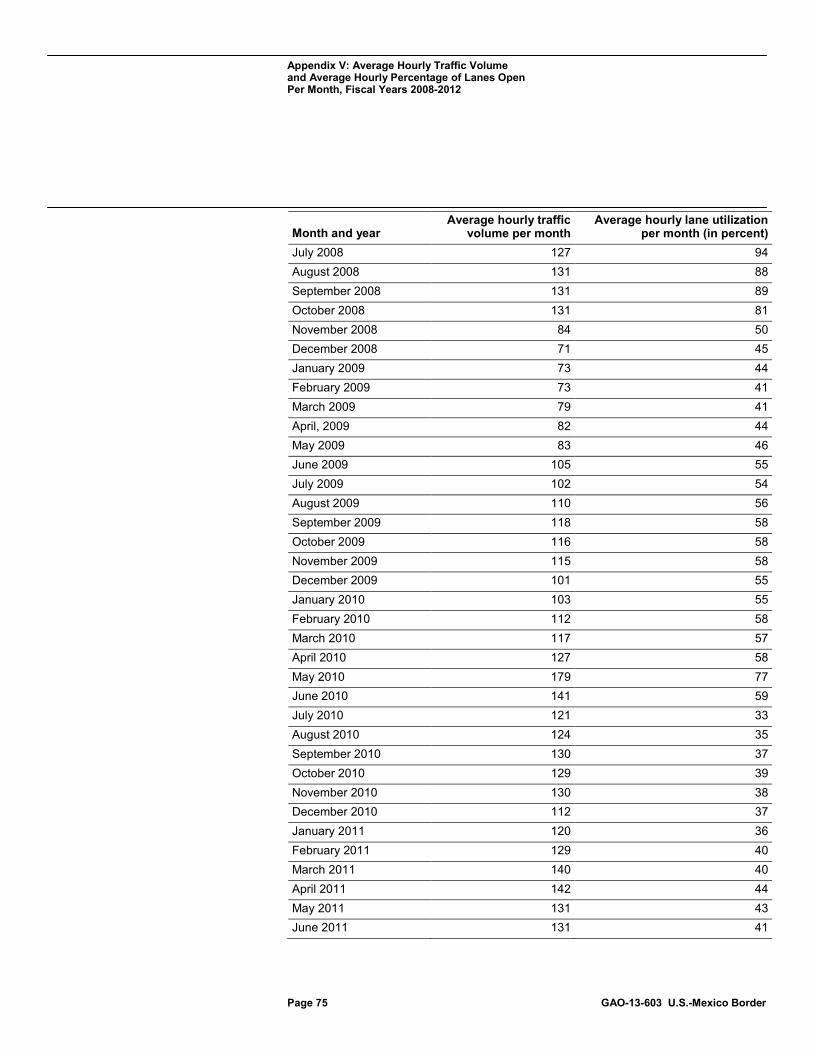
Appendix V: Average Hourly Traffic Volume and Average Hourly Percentage of Lanes Open Per Month, Fiscal Years 2008-2012
Page 75 GAO-13-603 U.S.-Mexico Border
Month and year Average hourly traffic
volume per month Average hourly lane utilization
per month (in percent) July 2008 127 94 August 2008 131 88 September 2008 131 89 October 2008 131 81 November 2008 84 50 December 2008 71 45 January 2009 73 44 February 2009 73 41 March 2009 79 41 April, 2009 82 44 May 2009 83 46 June 2009 105 55 July 2009 102 54 August 2009 110 56 September 2009 118 58 October 2009 116 58 November 2009 115 58 December 2009 101 55 January 2010 103 55 February 2010 112 58 March 2010 117 57 April 2010 127 58 May 2010 179 77 June 2010 141 59 July 2010 121 33 August 2010 124 35 September 2010 130 37 October 2010 129 39 November 2010 130 38 December 2010 112 37 January 2011 120 36 February 2011 129 40 March 2011 140 40 April 2011 142 44 May 2011 131 43 June 2011 131 41
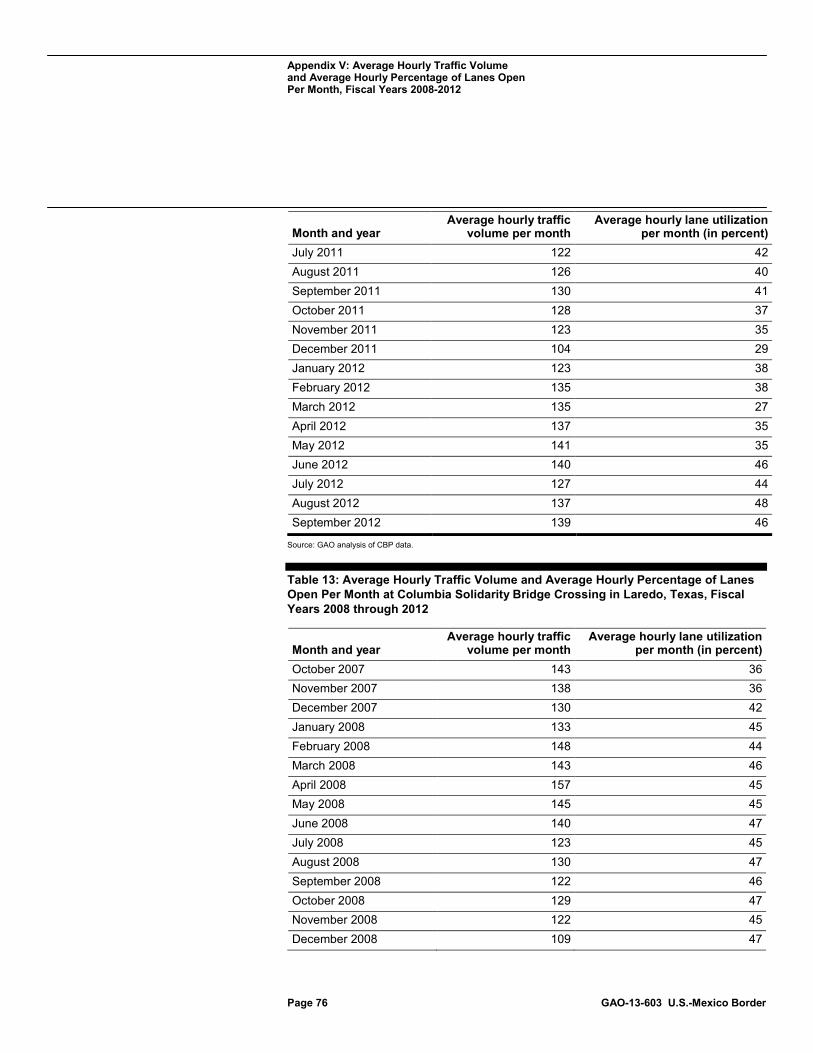
Appendix V: Average Hourly Traffic Volume and Average Hourly Percentage of Lanes Open Per Month, Fiscal Years 2008-2012
Page 76 GAO-13-603 U.S.-Mexico Border
Month and year Average hourly traffic
volume per month Average hourly lane utilization
per month (in percent) July 2011 122 42 August 2011 126 40 September 2011 130 41 October 2011 128 37 November 2011 123 35 December 2011 104 29 January 2012 123 38 February 2012 135 38 March 2012 135 27 April 2012 137 35 May 2012 141 35 June 2012 140 46 July 2012 127 44 August 2012 137 48 September 2012 139 46
Source: GAO analysis of CBP data.
Table 13: Average Hourly Traffic Volume and Average Hourly Percentage of Lanes Open Per Month at Columbia Solidarity Bridge Crossing in Laredo, Texas, Fiscal Years 2008 through 2012
Month and year Average hourly traffic
volume per month Average hourly lane utilization
per month (in percent) October 2007 143 36 November 2007 138 36 December 2007 130 42 January 2008 133 45 February 2008 148 44 March 2008 143 46 April 2008 157 45 May 2008 145 45 June 2008 140 47 July 2008 123 45 August 2008 130 47 September 2008 122 46 October 2008 129 47 November 2008 122 45 December 2008 109 47
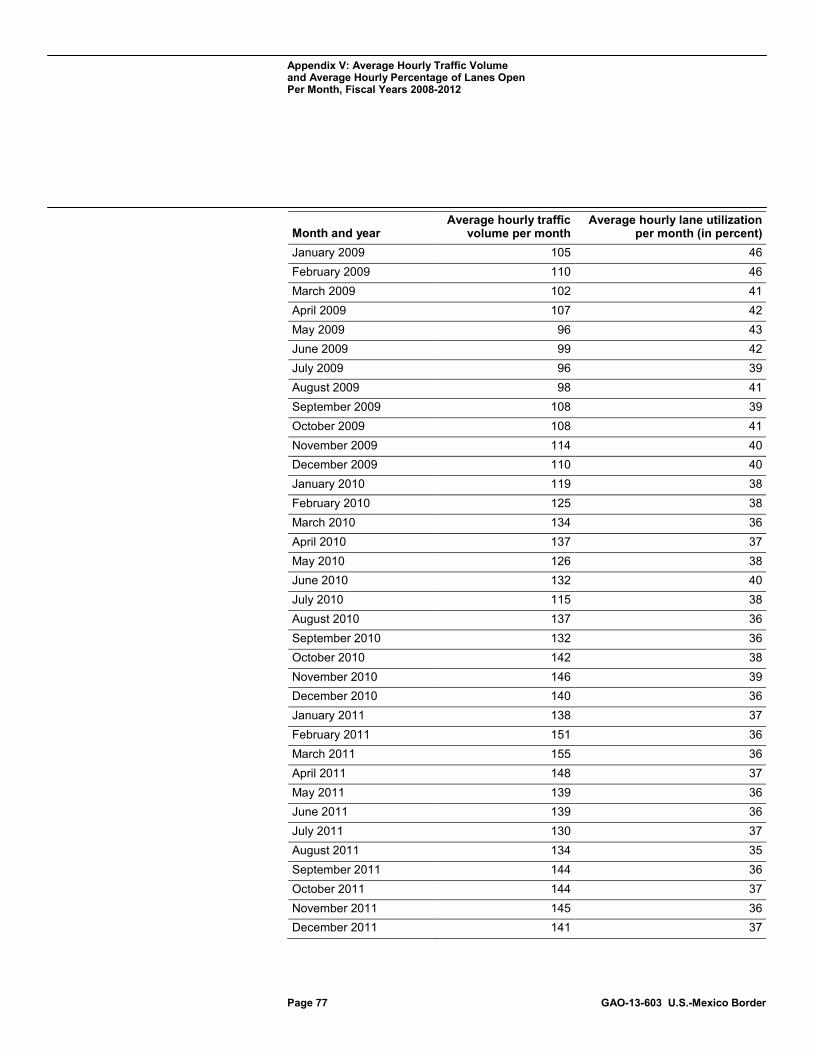
Appendix V: Average Hourly Traffic Volume and Average Hourly Percentage of Lanes Open Per Month, Fiscal Years 2008-2012
Page 77 GAO-13-603 U.S.-Mexico Border
Month and year Average hourly traffic
volume per month Average hourly lane utilization
per month (in percent) January 2009 105 46 February 2009 110 46 March 2009 102 41 April 2009 107 42 May 2009 96 43 June 2009 99 42 July 2009 96 39 August 2009 98 41 September 2009 108 39 October 2009 108 41 November 2009 114 40 December 2009 110 40 January 2010 119 38 February 2010 125 38 March 2010 134 36 April 2010 137 37 May 2010 126 38 June 2010 132 40 July 2010 115 38 August 2010 137 36 September 2010 132 36 October 2010 142 38 November 2010 146 39 December 2010 140 36 January 2011 138 37 February 2011 151 36 March 2011 155 36 April 2011 148 37 May 2011 139 36 June 2011 139 36 July 2011 130 37 August 2011 134 35 September 2011 144 36 October 2011 144 37 November 2011 145 36 December 2011 141 37
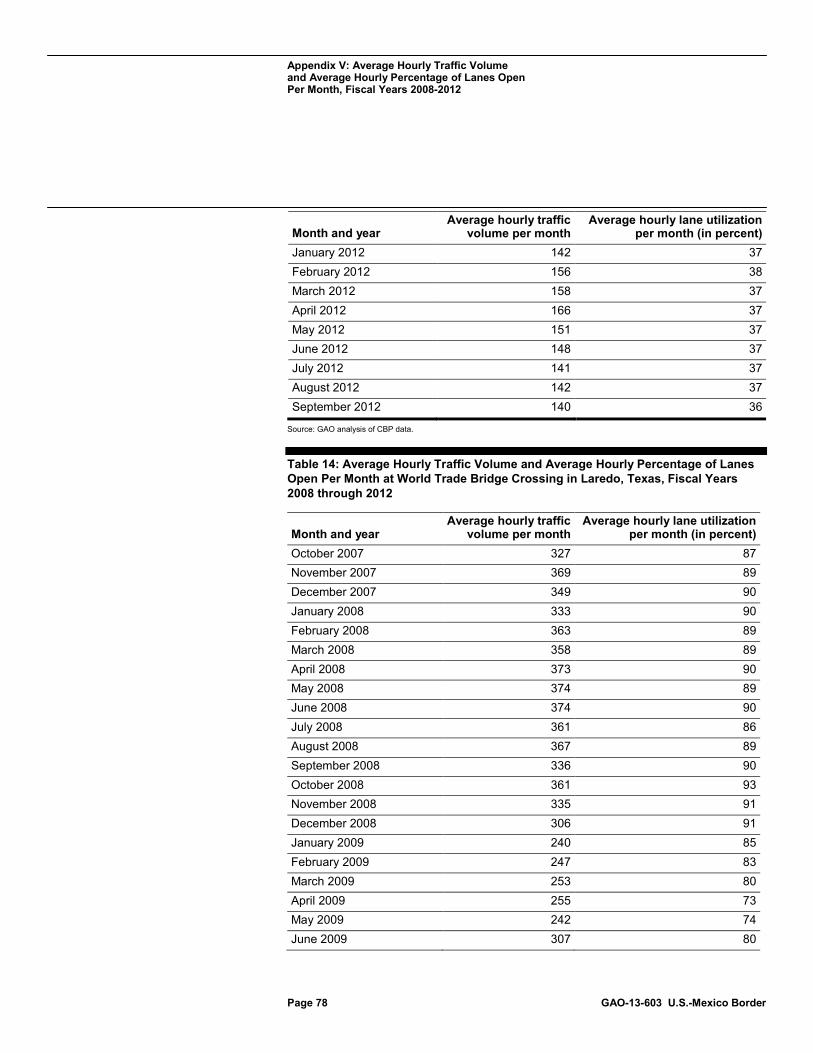
Appendix V: Average Hourly Traffic Volume and Average Hourly Percentage of Lanes Open Per Month, Fiscal Years 2008-2012
Page 78 GAO-13-603 U.S.-Mexico Border
Month and year Average hourly traffic
volume per month Average hourly lane utilization
per month (in percent) January 2012 142 37 February 2012 156 38 March 2012 158 37 April 2012 166 37 May 2012 151 37 June 2012 148 37 July 2012 141 37 August 2012 142 37 September 2012 140 36
Source: GAO analysis of CBP data.
Table 14: Average Hourly Traffic Volume and Average Hourly Percentage of Lanes Open Per Month at World Trade Bridge Crossing in Laredo, Texas, Fiscal Years 2008 through 2012
Month and year Average hourly traffic
volume per month Average hourly lane utilization
per month (in percent) October 2007 327 87 November 2007 369 89 December 2007 349 90 January 2008 333 90 February 2008 363 89 March 2008 358 89 April 2008 373 90 May 2008 374 89 June 2008 374 90 July 2008 361 86 August 2008 367 89 September 2008 336 90 October 2008 361 93 November 2008 335 91 December 2008 306 91 January 2009 240 85 February 2009 247 83 March 2009 253 80 April 2009 255 73 May 2009 242 74 June 2009 307 80
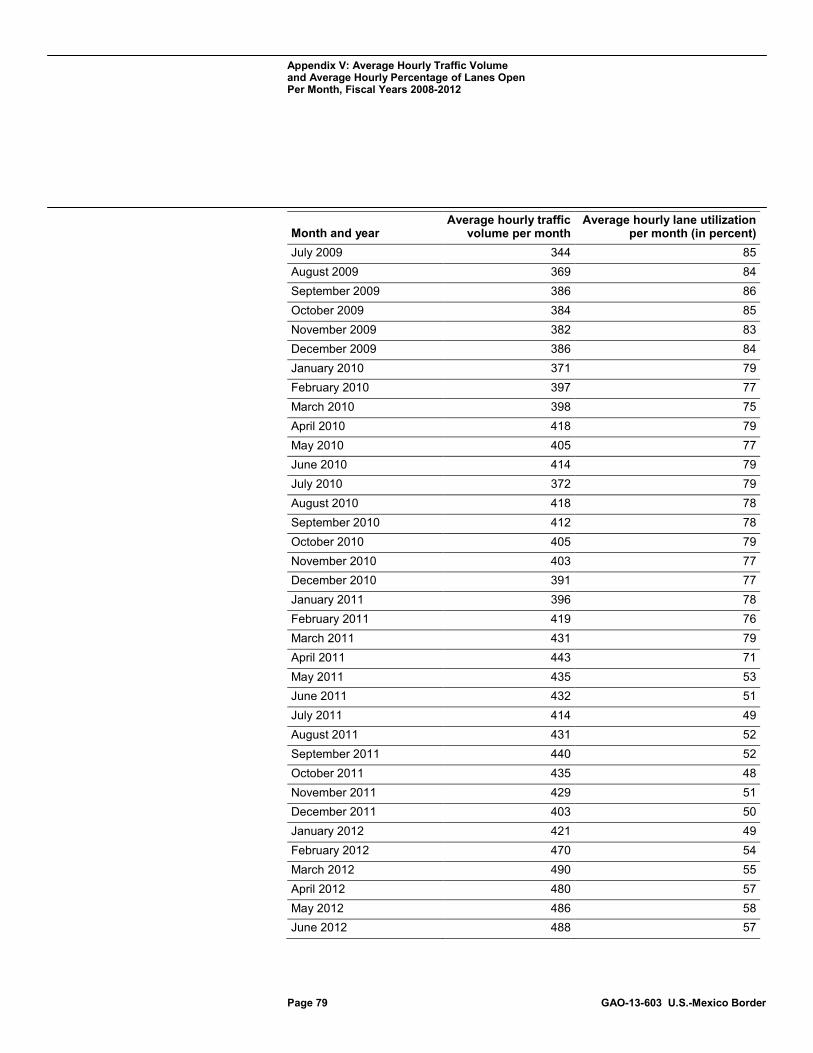
Appendix V: Average Hourly Traffic Volume and Average Hourly Percentage of Lanes Open Per Month, Fiscal Years 2008-2012
Page 79 GAO-13-603 U.S.-Mexico Border
Month and year Average hourly traffic
volume per month Average hourly lane utilization
per month (in percent) July 2009 344 85 August 2009 369 84 September 2009 386 86 October 2009 384 85 November 2009 382 83 December 2009 386 84 January 2010 371 79 February 2010 397 77 March 2010 398 75 April 2010 418 79 May 2010 405 77 June 2010 414 79 July 2010 372 79 August 2010 418 78 September 2010 412 78 October 2010 405 79 November 2010 403 77 December 2010 391 77 January 2011 396 78 February 2011 419 76 March 2011 431 79 April 2011 443 71 May 2011 435 53 June 2011 432 51 July 2011 414 49 August 2011 431 52 September 2011 440 52 October 2011 435 48 November 2011 429 51 December 2011 403 50 January 2012 421 49 February 2012 470 54 March 2012 490 55 April 2012 480 57 May 2012 486 58 June 2012 488 57
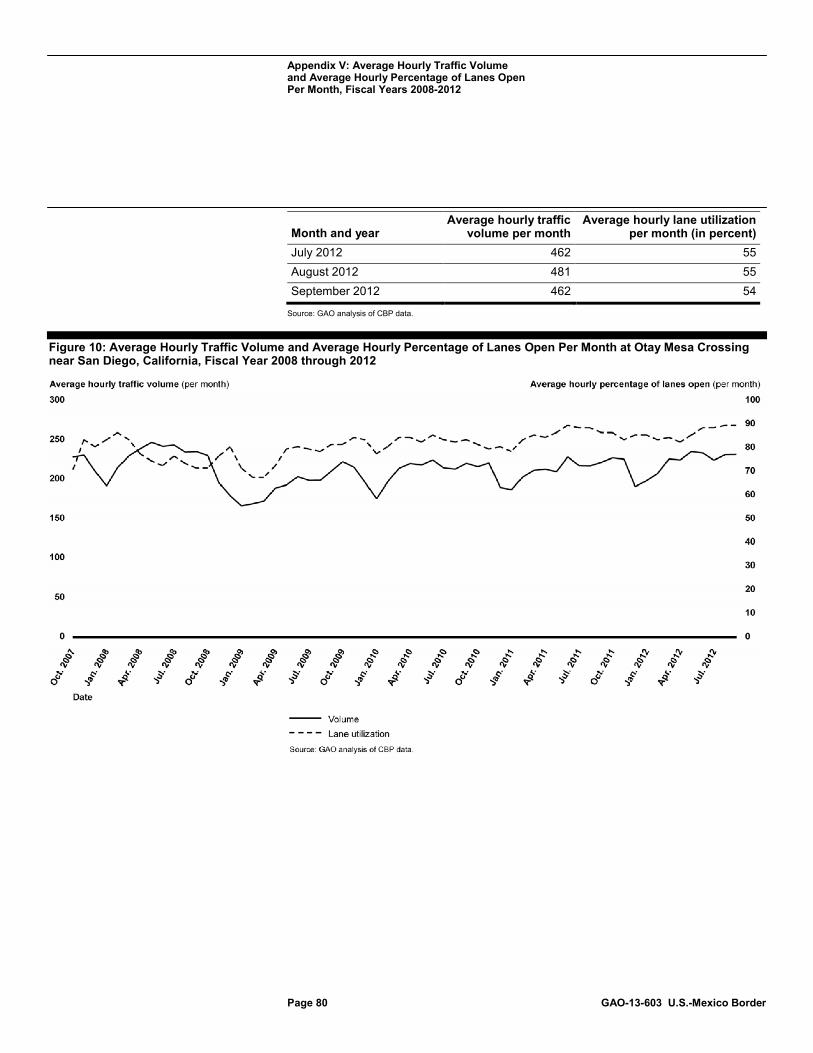
Appendix V: Average Hourly Traffic Volume and Average Hourly Percentage of Lanes Open Per Month, Fiscal Years 2008-2012
Page 80 GAO-13-603 U.S.-Mexico Border
Month and year Average hourly traffic
volume per month Average hourly lane utilization
per month (in percent) July 2012 462 55 August 2012 481 55 September 2012 462 54
Source: GAO analysis of CBP data.
Figure 10: Average Hourly Traffic Volume and Average Hourly Percentage of Lanes Open Per Month at Otay Mesa Crossing near San Diego, California, Fiscal Year 2008 through 2012
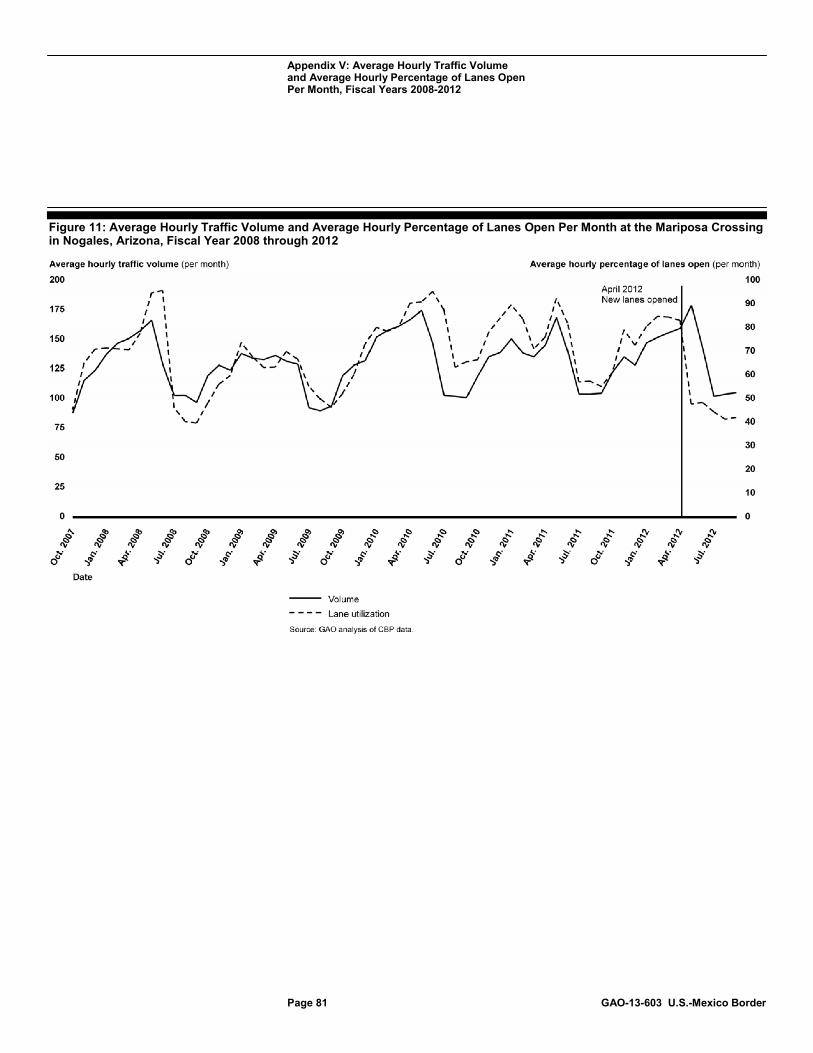
Appendix V: Average Hourly Traffic Volume and Average Hourly Percentage of Lanes Open Per Month, Fiscal Years 2008-2012
Page 81 GAO-13-603 U.S.-Mexico Border
Figure 11: Average Hourly Traffic Volume and Average Hourly Percentage of Lanes Open Per Month at the Mariposa Crossing in Nogales, Arizona, Fiscal Year 2008 through 2012
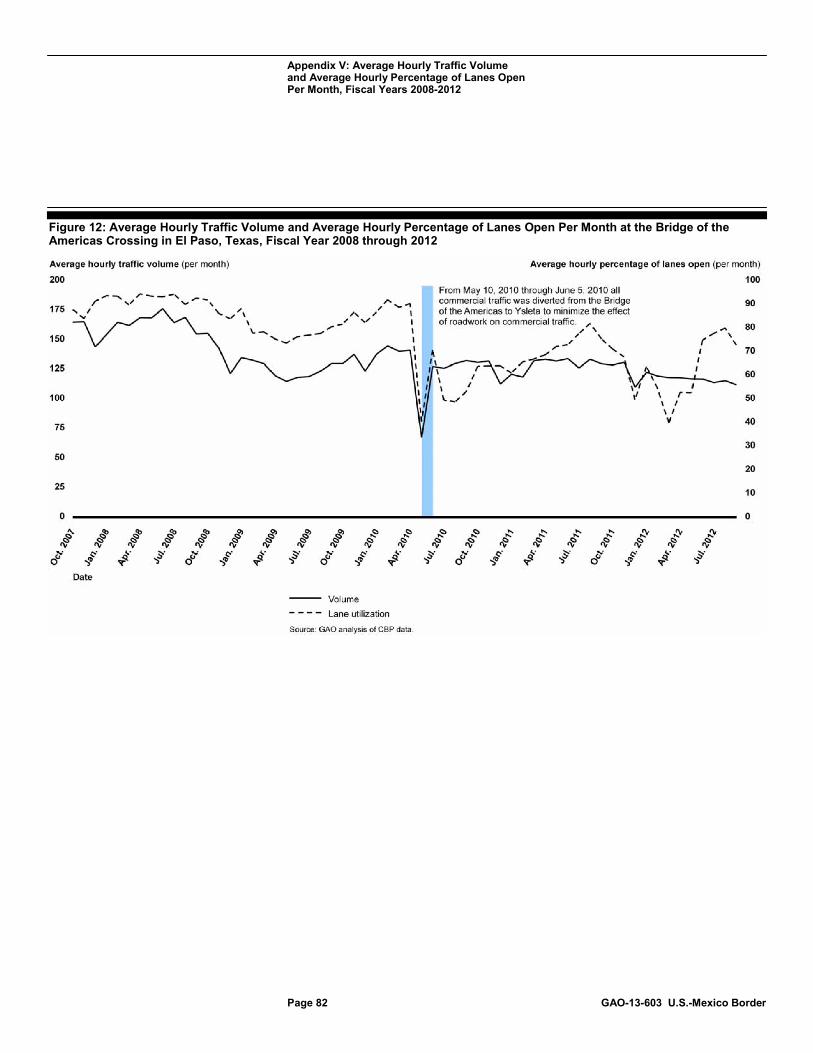
Appendix V: Average Hourly Traffic Volume and Average Hourly Percentage of Lanes Open Per Month, Fiscal Years 2008-2012
Page 82 GAO-13-603 U.S.-Mexico Border
Figure 12: Average Hourly Traffic Volume and Average Hourly Percentage of Lanes Open Per Month at the Bridge of the Americas Crossing in El Paso, Texas, Fiscal Year 2008 through 2012
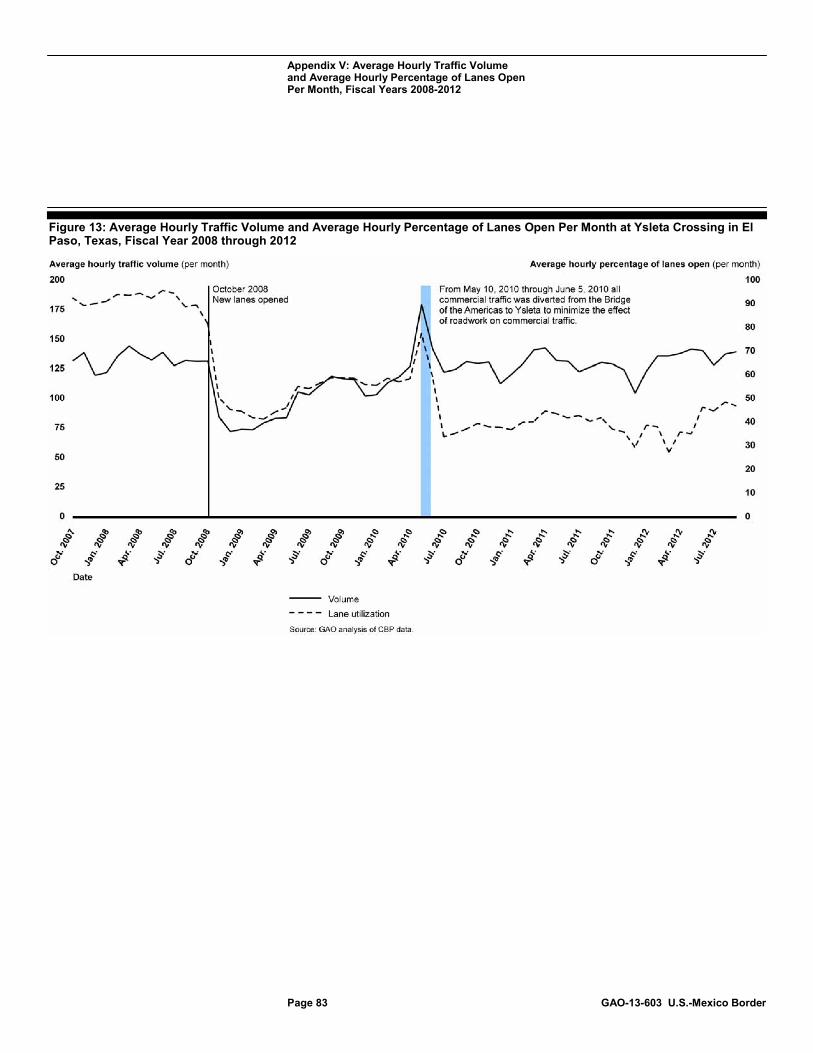
Appendix V: Average Hourly Traffic Volume and Average Hourly Percentage of Lanes Open Per Month, Fiscal Years 2008-2012
Page 83 GAO-13-603 U.S.-Mexico Border
Figure 13: Average Hourly Traffic Volume and Average Hourly Percentage of Lanes Open Per Month at Ysleta Crossing in El Paso, Texas, Fiscal Year 2008 through 2012
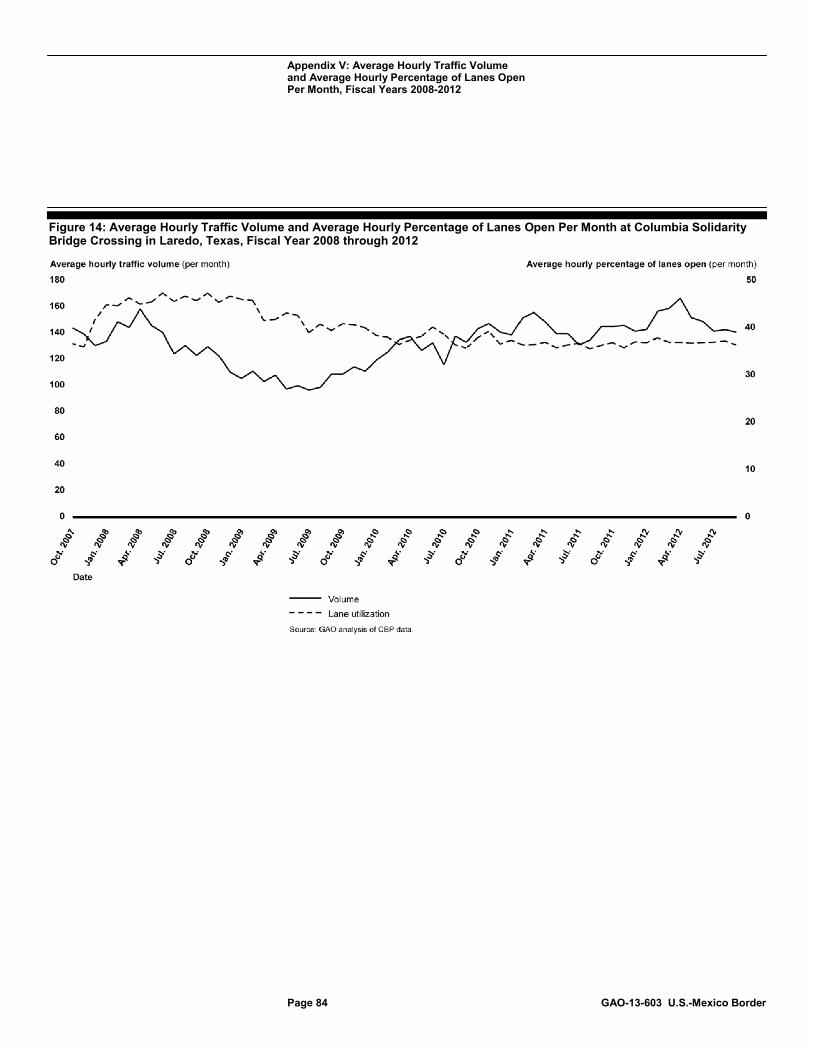
Appendix V: Average Hourly Traffic Volume and Average Hourly Percentage of Lanes Open Per Month, Fiscal Years 2008-2012
Page 84 GAO-13-603 U.S.-Mexico Border
Figure 14: Average Hourly Traffic Volume and Average Hourly Percentage of Lanes Open Per Month at Columbia Solidarity Bridge Crossing in Laredo, Texas, Fiscal Year 2008 through 2012
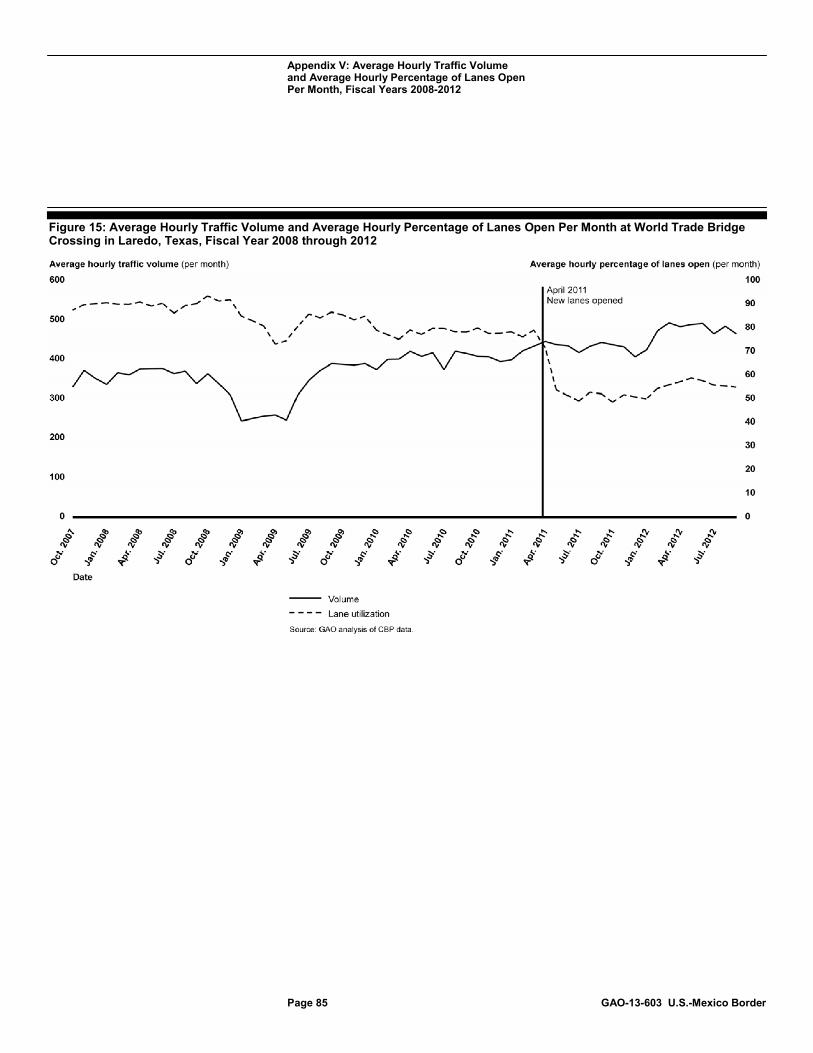
Appendix V: Average Hourly Traffic Volume and Average Hourly Percentage of Lanes Open Per Month, Fiscal Years 2008-2012
Page 85 GAO-13-603 U.S.-Mexico Border
Figure 15: Average Hourly Traffic Volume and Average Hourly Percentage of Lanes Open Per Month at World Trade Bridge Crossing in Laredo, Texas, Fiscal Year 2008 through 2012
Appendix VI: Performance Measures for U.S. Customs and Border Protection Activities, Fiscal Year 2013
Page 86 GAO-13-603 U.S.-Mexico Border
Table 15 lists the 28 performance measures DHS and CBP are using in fiscal year 2013 to assess and report on CBP progress toward the agency’s security and trade facilitation goals. These CBP-focused performance measures include the following:
• Nine measures selected by DHS as Government Performance and Results Act (GPRA) measures.1 (These are also called strategic measures within the department.) These measures are aligned with the goals and objectives in DHS’s Quadrennial Homeland Security Review Report and publicly reported to communicate achievement of these strategic goals and objectives.2
• Fifteen management measures that are not reported publicly but rather inform internal CBP decisions on program priorities and resource allocation, and to monitor progress and performance. CBP officials report, for example, that these measures are used in crafting the department’s budget justification.
• Four CBP Office of Field Operations (OFO) operational measures that capture former GPRA measures that OFO uses internally to evaluate senior officials’ performance, for example.3
1In fiscal year 2013, DHS has designated 84 GPRA performance measures—9 of which focus on CBP efforts. 2The agency’s security and trade facilitation goals are articulated in DHS’s February 2010 Quadrennial Homeland Security Review Report, which outlined a strategic framework for homeland security. See DHS, Quadrennial Homeland Security Review Report: A Strategic Framework for a Secure Homeland (Washington, D.C.: February 2010). 3According to CBP officials, OFO is the only office within CBP that maintains such operational measures.
Appendix VI: Performance Measures for U.S. Customs and Border Protection Activities, Fiscal Year 2013
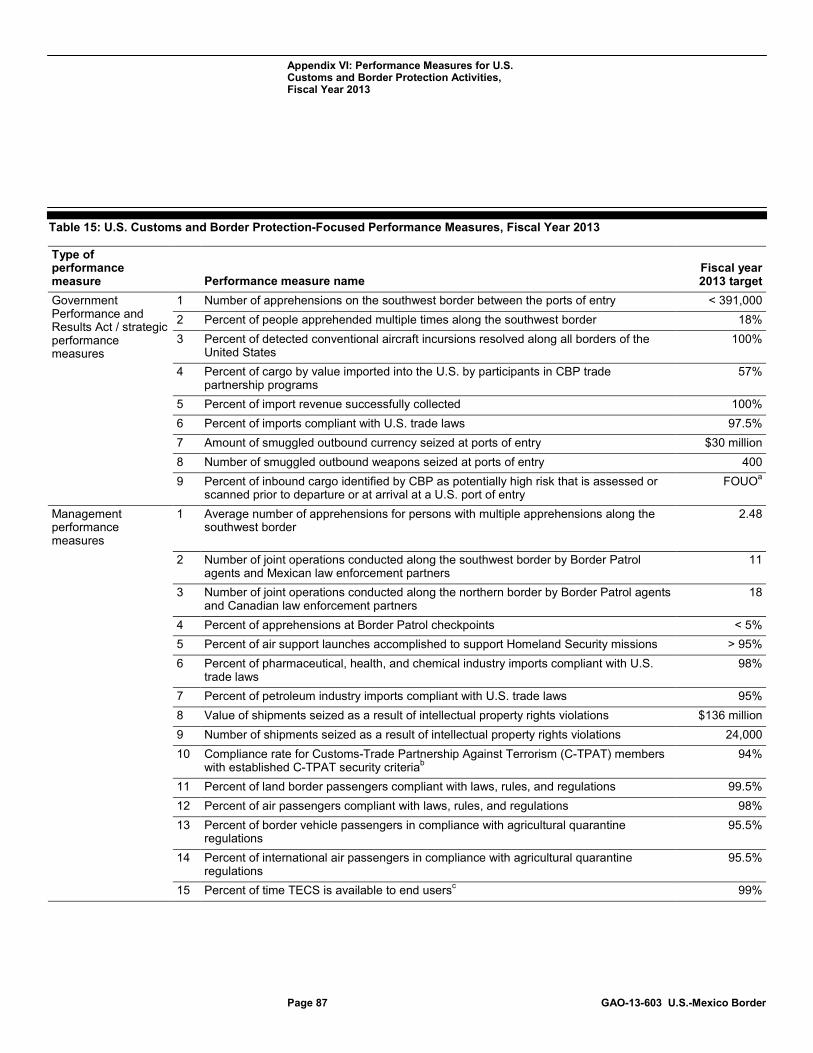
Appendix VI: Performance Measures for U.S. Customs and Border Protection Activities, Fiscal Year 2013
Page 87 GAO-13-603 U.S.-Mexico Border
Table 15: U.S. Customs and Border Protection-Focused Performance Measures, Fiscal Year 2013
Type of performance measure Performance measure name
Fiscal year 2013 target
Government Performance and Results Act / strategic performance measures
1 Number of apprehensions on the southwest border between the ports of entry < 391,000 2 Percent of people apprehended multiple times along the southwest border 18% 3 Percent of detected conventional aircraft incursions resolved along all borders of the
United States 100%
4 Percent of cargo by value imported into the U.S. by participants in CBP trade partnership programs
57%
5 Percent of import revenue successfully collected 100% 6 Percent of imports compliant with U.S. trade laws 97.5% 7 Amount of smuggled outbound currency seized at ports of entry $30 million 8 Number of smuggled outbound weapons seized at ports of entry 400 9 Percent of inbound cargo identified by CBP as potentially high risk that is assessed or
scanned prior to departure or at arrival at a U.S. port of entry FOUOa
Management performance measures
1 Average number of apprehensions for persons with multiple apprehensions along the southwest border
2.48
2 Number of joint operations conducted along the southwest border by Border Patrol agents and Mexican law enforcement partners
11
3 Number of joint operations conducted along the northern border by Border Patrol agents and Canadian law enforcement partners
18
4 Percent of apprehensions at Border Patrol checkpoints < 5% 5 Percent of air support launches accomplished to support Homeland Security missions > 95% 6 Percent of pharmaceutical, health, and chemical industry imports compliant with U.S.
trade laws 98%
7 Percent of petroleum industry imports compliant with U.S. trade laws 95% 8 Value of shipments seized as a result of intellectual property rights violations $136 million 9 Number of shipments seized as a result of intellectual property rights violations 24,000 10 Compliance rate for Customs-Trade Partnership Against Terrorism (C-TPAT) members
with established C-TPAT security criteriab 94%
11 Percent of land border passengers compliant with laws, rules, and regulations 99.5% 12 Percent of air passengers compliant with laws, rules, and regulations 98% 13 Percent of border vehicle passengers in compliance with agricultural quarantine
regulations 95.5%
14 Percent of international air passengers in compliance with agricultural quarantine regulations
95.5%
15 Percent of time TECS is available to end usersc 99%
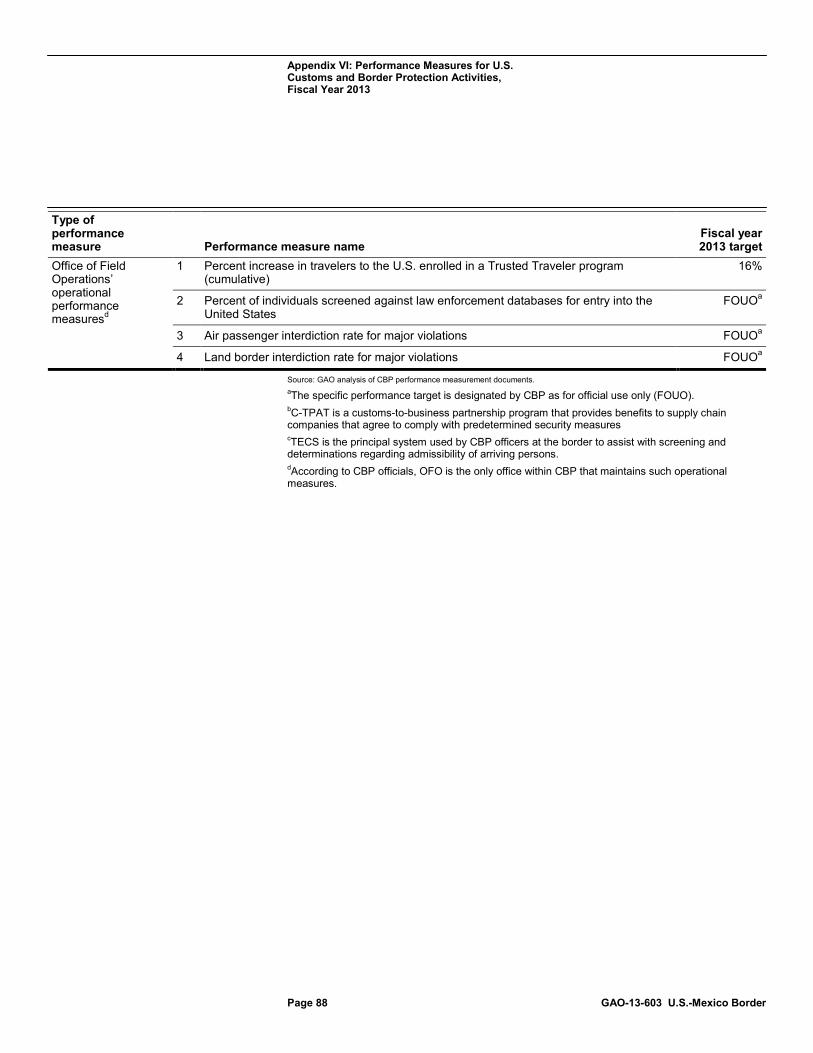
Appendix VI: Performance Measures for U.S. Customs and Border Protection Activities, Fiscal Year 2013
Page 88 GAO-13-603 U.S.-Mexico Border
Type of performance measure Performance measure name
Fiscal year 2013 target
Office of Field Operations’ operational performance measuresd
1 Percent increase in travelers to the U.S. enrolled in a Trusted Traveler program (cumulative)
16%
2 Percent of individuals screened against law enforcement databases for entry into the United States
FOUOa
3 Air passenger interdiction rate for major violations FOUOa
4 Land border interdiction rate for major violations FOUOa
Source: GAO analysis of CBP performance measurement documents. aThe specific performance target is designated by CBP as for official use only (FOUO). bC-TPAT is a customs-to-business partnership program that provides benefits to supply chain companies that agree to comply with predetermined security measures cTECS is the principal system used by CBP officers at the border to assist with screening and determinations regarding admissibility of arriving persons. dAccording to CBP officials, OFO is the only office within CBP that maintains such operational measures.
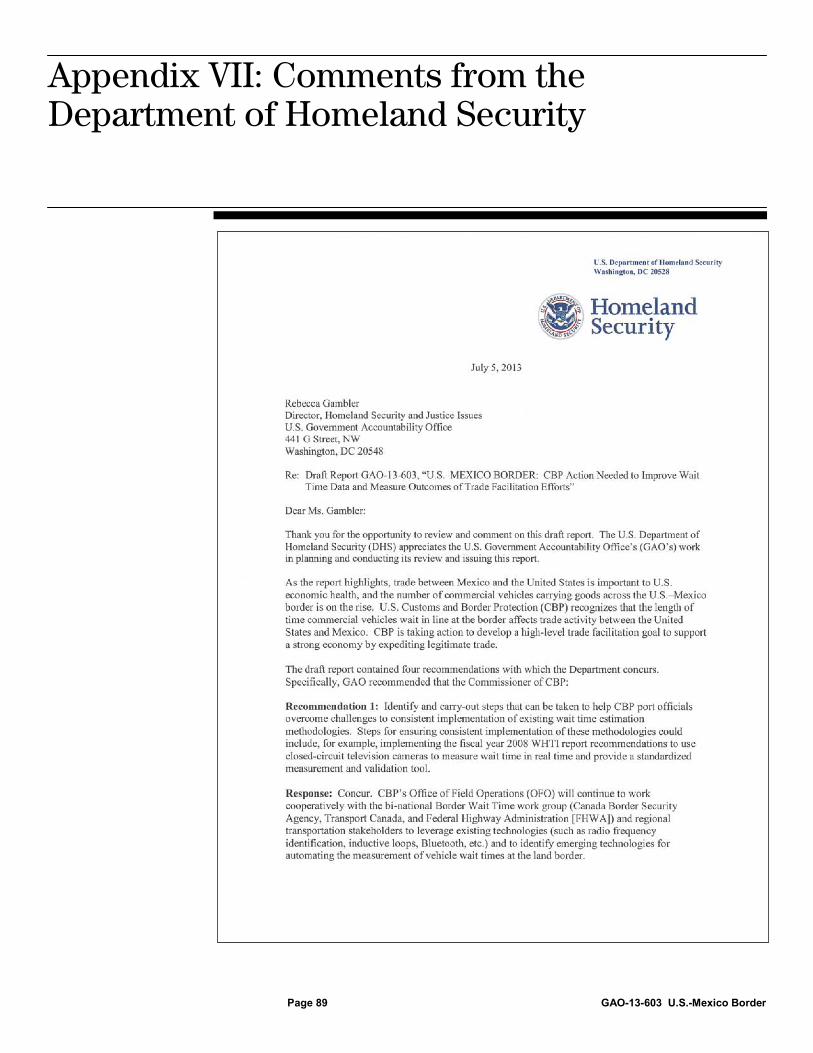
Appendix VII: Comments from the Department of Homeland Security
Page 89 GAO-13-603 U.S.-Mexico Border
Appendix VII: Comments from the Department of Homeland Security
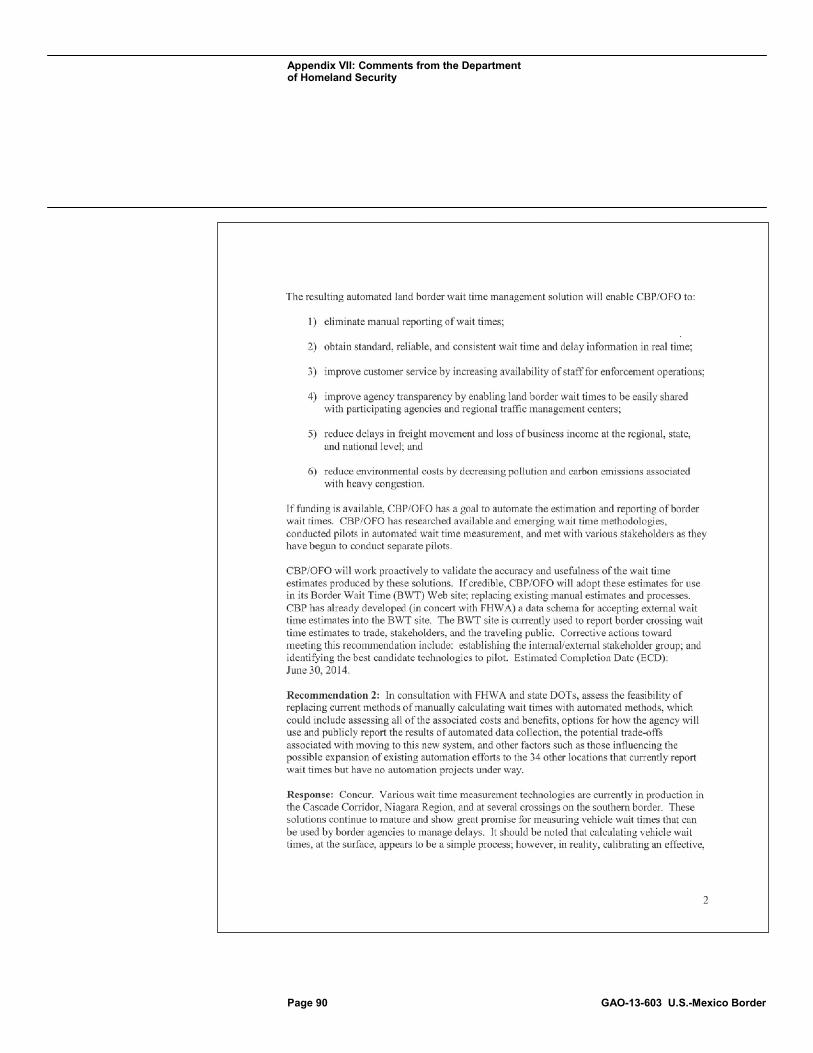
Appendix VII: Comments from the Department of Homeland Security
Page 90 GAO-13-603 U.S.-Mexico Border
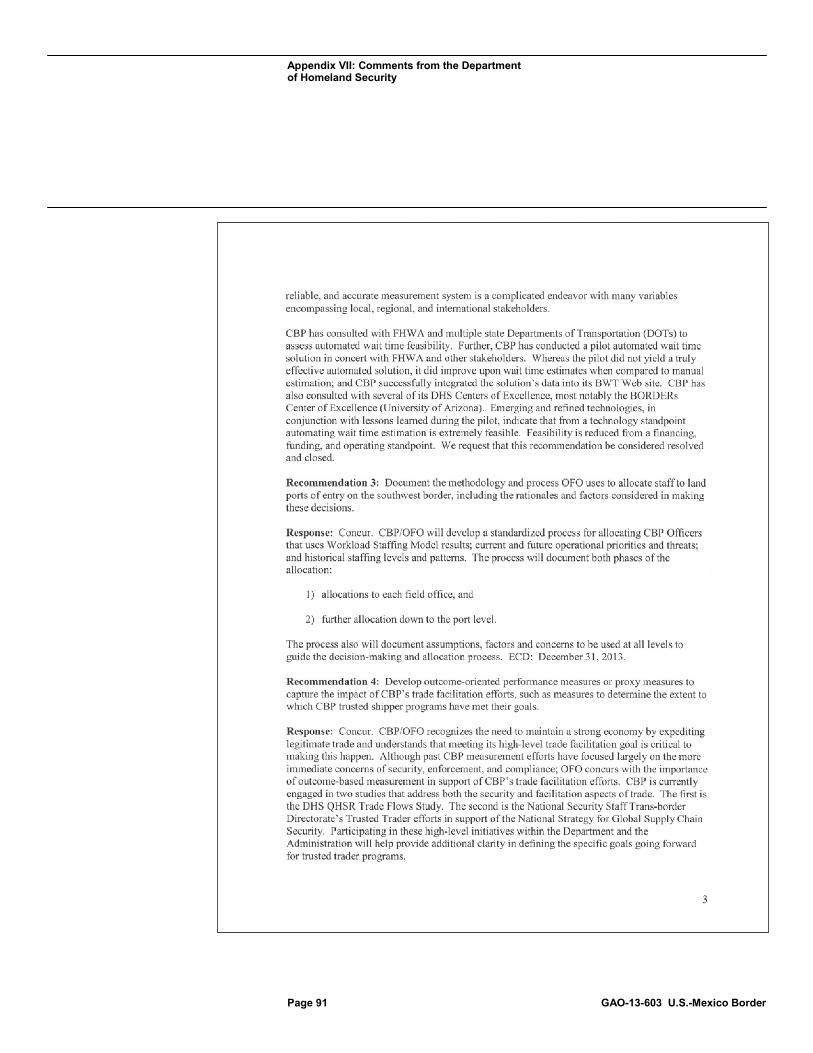
Appendix VII: Comments from the Department of Homeland Security
Page 91 GAO-13-603 U.S.-Mexico Border
Appendix VII: Comments from the Department of Homeland Security
Page 92 GAO-13-603 U.S.-Mexico Border
Appendix VIII: GAO Contact and Staff Acknowledgments
Page 93 GAO-13-603 U.S.-Mexico Border
Rebecca Gambler, (202) 512-8777 or [email protected]
In addition to the contact named above, Lacinda Ayers, Assistant Director; Claudia Becker; Sarah Kaczmarek; and Michael Lenington made key contributions to this report. Also contributing to this report were Pedro Almoguera, Frances Cook, Juan Gobel, Eric Hauswirth, Phil Herr, Stan Kostyla, Jessica Orr, Minette Richardson, and Loren Yager.
Appendix VIII: GAO Contact and Staff Acknowledgments
GAO Contact
Staff Acknowledgments
(441094)
The Government Accountability Office, the audit, evaluation, and investigative arm of Congress, exists to support Congress in meeting its constitutional responsibilities and to help improve the performance and accountability of the federal government for the American people. GAO examines the use of public funds; evaluates federal programs and policies; and provides analyses, recommendations, and other assistance to help Congress make informed oversight, policy, and funding decisions. GAO’s commitment to good government is reflected in its core values of accountability, integrity, and reliability.
The fastest and easiest way to obtain copies of GAO documents at no cost is through GAO’s website (http://www.gao.gov). Each weekday afternoon, GAO posts on its website newly released reports, testimony, and correspondence. To have GAO e-mail you a list of newly posted products, go to http://www.gao.gov and select “E-mail Updates.”
The price of each GAO publication reflects GAO’s actual cost of production and distribution and depends on the number of pages in the publication and whether the publication is printed in color or black and white. Pricing and ordering information is posted on GAO’s website, http://www.gao.gov/ordering.htm.
Place orders by calling (202) 512-6000, toll free (866) 801-7077, or TDD (202) 512-2537.
Orders may be paid for using American Express, Discover Card, MasterCard, Visa, check, or money order. Call for additional information.
Connect with GAO on Facebook, Flickr, Twitter, and YouTube. Subscribe to our RSS Feeds or E-mail Updates. Listen to our Podcasts. Visit GAO on the web at www.gao.gov.
Contact:
Website: http://www.gao.gov/fraudnet/fraudnet.htm E-mail: [email protected] Automated answering system: (800) 424-5454 or (202) 512-7470
Katherine Siggerud, Managing Director, [email protected], (202) 512-4400, U.S. Government Accountability Office, 441 G Street NW, Room 7125, Washington, DC 20548
Chuck Young, Managing Director, [email protected], (202) 512-4800 U.S. Government Accountability Office, 441 G Street NW, Room 7149 Washington, DC 20548
GAO’s Mission
Obtaining Copies of GAO Reports and Testimony
Order by Phone
Connect with GAO
To Report Fraud, Waste, and Abuse in Federal Programs
Congressional Relations
Public Affairs
Please Print on Recycled Paper.