g protein-coupled receptor kinase 2...
TRANSCRIPT

G PROTEIN-COUPLED RECEPTOR KINASE 2 (GRK2) PLAYS A RELEVANT ROLE
IN INSULIN RESISTANCE AND OBESITY
Lucia Garcia-Guerra 1, 2
, Iria Nieto-Vazquez1, 2
, Rocio Vila-Bedmar1, 2
, María Jurado-Pueyo3,
Guillermo Zalba4, Javier Díez
4, Cristina Murga
3, *, Sonia Fernández-Veledo
1,2, *, Federico
Mayor Jr. 3
and Margarita Lorenzo1,2,+
.
1Department of Biochemistry and Molecular Biology II, Faculty of Pharmacy, Complutense
University; 28040 Madrid (Spain); 2CIBER de Diabetes y Enfermedades Metabólicas
(CIBERDEM), 3Departamento de Biología Molecular and Centro de Biología Molecular Severo
Ochoa (CSIC-UAM) and Instituto de Investigación Sanitaria Princesa, 28049 Madrid (Spain), 4Division of Cardiovascular Sciences, Center for Applied Medical Research, University of
Navarra, 31008 Pamplona, Spain.
L. G-G. and I. N-V. contributed equally to this work
Corresponding authors.
Cristina Murga
Sonia Fernández-Veledo
Additional information for this article can be found in an online appendix at
http://diabetes.diabetesjournals.org
Submitted 4 June 2010 and accepted 3 July 2010.
This is an uncopyedited electronic version of an article accepted for publication in Diabetes. The American Diabetes Association, publisher of Diabetes, is not responsible for any errors or omissions in this version of the manuscript or any version derived from it by third parties. The definitive publisher-authenticated
version will be available in a future issue of Diabetes in print and online at http://diabetes.diabetesjournals.org.
Diabetes Publish Ahead of Print, published online July 13, 2010
Copyright American Diabetes Association, Inc., 2010
Control of insulin resistance and obesity by GRK2
Objective - Insulin resistance is associated with the pathogenesis of metabolic disorders as type-
2-diabetes and obesity. Given the emerging role of signal transduction in these syndromes, we
set out to explore the possible role that G protein-coupled receptor kinase 2 (GRK2), first
identified as a G protein-coupled receptor regulator, could have as a modulator of insulin
responses.
Research Design and Methods - We analyzed the influence of GRK2 levels in insulin signaling
in myoblasts and adipocytes with experimentally increased or silenced levels of GRK2, and in
GRK2 hemizygous animals expressing 50% lower levels of this kinase in three different models
of insulin resistance: TNFα infusion, aging and high fat diet (HFD). Glucose transport, whole
body glucose and insulin tolerance, the activation status of insulin pathway components, and the
circulating levels of important mediators were measured. The development of obesity and
adipocyte size with age and HFD was analyzed.
Results - Altering GRK2 levels markedly modifies insulin-mediated signaling in cultured
adipocytes and myocytes. GRK2 levels are increased by approximately 2-fold in muscle and
adipose tissue in the animal models tested, and in lymphocytes from metabolic syndrome
patients. In contrast, hemizygous GRK2 mice show enhanced insulin sensitivity and do not
develop insulin resistance by TNFα, aging or HFD. Furthermore, reduced GRK2 levels induce a
lean phenotype and decrease age-related adiposity.
Conclusions - Overall, our data identify GRK2 as an important negative regulator of insulin
effects, key to the etiopathogenesis of insulin resistance and obesity, what uncovers this protein
as a potential therapeutic target in the treatment of these disorders.
nsulin resistance, a diminished ability of
cells to respond to the action of insulin, is
a key feature associated with the
pathogenesis of metabolic disorders such as
type-2-diabetes and obesity (1). Alterations in
any of the key components of the insulin
signaling cascade, including negative
regulators, have been proposed to contribute
to insulin resistance (1;2). However, the
origin and precise mechanism(s) mediating
insulin resistance in physiopathological
conditions are not fully understood (3).
Both aging and obesity are associated with
increased risk of developing type-2-diabetes
and cardiovascular disease. An increase in
pro-inflammatory and a decrease in anti-
inflammatory factors is found in the obese
state and may influence glucose homeostasis
and insulin sensitivity (4;5). Peripheral tissues
exposed to these pro-inflammatory cytokines
develop an insulin-resistant state (6). In fact,
obesity is now being considered a chronic
state of low-intensity inflammation. In this
regard, the cytokine Tumor Necrosis Factor
(TNF)α is highly expressed in adipose tissue
of obese animals and humans, and obese mice
lacking either TNFα or its receptors show
protection against developing insulin
resistance. The molecular mechanisms
underlying TNFα-mediated insulin resistance
have been studied in models of murine and
human myocytes and adipocytes and in vivo
(7-11).
Insulin suppresses hepatic glucose production
through translocation of glucose transporter
(GLUT)4 to the cell surface (12;13). Insulin-
induced GLUT4 translocation requires at least
two signals, one mediated through
I

Control of insulin resistance and obesity by GRK2
phosphatidylinositol 3-kinase (PI3K) and
another via Gαq/11 (14) in 3T3L1 adipocytes.
The activated Insulin Receptor (IR) can
phosphorylate the G protein subunit Gαq/11,
leading to activation of cdc42 and PI3K, what
triggers glucose transport stimulation (14-16).
Signaling of receptors via G proteins is
regulated by G protein-coupled receptor
kinases (GRKs), a family of seven
serine/threonine protein kinases that
specifically recognize and phosphorylate
agonist-activated G protein-coupled receptors
(GPCRs). This recruits arrestin proteins that
uncouple receptors from G proteins and
promote internalization. The ubiquitous
GRK2 isoform has been reported to regulate
other pathways independently of its GPCR
phosphorylation ability (17;18). GRK2 can
act as an inhibitor of insulin-mediated glucose
transport stimulation in 3T3L1 adipocytes by
interacting with Gαq/11 function
independently of its kinase activity (19).
GRK2 also inhibits basal and insulin-
stimulated glycogen synthesis in mouse liver
FL83B cells (20). In this context, we have
investigated whether GRK2 may play a
relevant physiological role in the modulation
of insulin responses in vivo. GRK2 expression
is increased in key tissues in different
experimental models of insulin resistance and
a 50% down-regulation of GRK2 levels in
hemizygous GRK2+/-
mice is sufficient to
protect against TNFα, aging or high fat diet
(HFD)-induced alterations in glucose
homeostasis and insulin signaling, strongly
arguing for a key role for GRK2 in the
modulation of insulin sensitivity in
physiological and pathological conditions.
RESEARCH DESIGN AND METHODS
Cell Culture and Transfections. The human
liposarcoma cell line LiSa-2 (21) was used as
a cellular model of visceral human adipocytes
and was maintained in DMEM supplemented
with 10% fetal serum and antibiotics, at 37°C
and 5% CO2. To induce insulin resistance
human adipocytes were cultured for 21 days
in serum-free DMEM/F12 (1:1) as previously
described (22). Peripheral blood mononuclear
cells (PBMCs), were isolated from blood
samples with Lymphoprep (≥99% were
lymphocytes and monocytes) as previously
described (23). The studies involving samples
from patients were carried out in accordance
with the Helsinki Declaration, and the
protocol was approved by the Ethical
Committee of the University Clinic of
Navarra (see Supplemental Information in the
online appendix available at
http://diabetes.diabetesjournals.org).
Mouse C2C12 myocytes (American Type
Culture Collection) and immortalized murine
white adipocytes were maintained in DMEM
supplemented with 10% fetal serum and
antibiotics, at 37°C and 5% CO2. Cells were
transiently transfected according to the
LipofectAMINETM
protocol (Invitrogen,
Paisley, UK), with 4µg of pcDNA3-GRK2-
neo, pcDNA3-GRK2-K220R-hygro or ad-
shGRK2-RNAi, to generate cell lines with
increased or decreased GRK2 expression,
respectively or with empty vector (pcDNA3-
hygro) as a control.
Metabolic Assays. Glucose tolerance Test
(GTT) and Insulin Tolerance Test (ITT) were
performed as we previously described (24).
Glucose concentration (mg/dL) was
determined in tail blood samples using an
automatic analyzer (Accucheck from Roche).
Other measurements were performed from
blood collected from the tail and centrifuged
at 2,500g for 15 min to obtain the serum.
Insulin and leptin concentrations were
assayed using a sensitive ELISA-kit (Linco
Research, St. Louis, MO). Triglycerides (TG)
released were assayed by an enzymatic
method using Free Glycerol Determination kit
(Sigma-Aldrich, St. Louis, MO).
Glucose Uptake Assay. Cells were
stimulated for 30 min with insulin, and
glucose uptake was measured during the last
10 min of culture by incorporation of 2-

Control of insulin resistance and obesity by GRK2
deoxy-D[1-3H]-glucose as previously
described (22;24). Individual values were
expressed as pmol of glucose per 10 min per
mg of protein, and results were expressed as
percentage of stimulation over basal
(control=100).
In vivo signaling assay. Male mice (12-14
week-old) were subjected to anaesthesia
(intraperitoneal injection of 60 mg/kg
ketamine per 5 mg/kg xylazine), and 25 mg
epididymal adipose tissue was removed from
each mouse. Insulin (1 IU/kg body weight)
was then injected via the cava vein and a
similar amount of epididymal adipose tissue
was removed, after 1, 3 and 7 min, Tissue
samples were immediately frozen in liquid
nitrogen and stored at -80°C. Epididymal
adipose tissues were homogenized with a
Polytron homogenizer in lysis buffer and
centrifuged at 100,000g for 15 min. The
supernatants were collected, assayed for
protein concentration, and stored at -80°C
until used.
Other Methods were performed as specified
in Supplemental Information.
RESULTS
Insulin signaling is regulated by GRK2
levels in adipocytes and myocytes. To study
the modulation of insulin signaling by GRK2
in relevant insulin-targeted cell types, we used
murine white adipocytic and myocytic cell
lines expressing enhanced or decreased GRK2
protein levels, or over-expressing a
catalytically inactive mutant of GRK2 (Fig.
1A). The increase in glucose uptake elicited
by insulin in both cell types was blocked in
the presence of enhanced GRK2 levels,
whereas GRK2 knockdown led to a slightly
higher response (Fig. 1B). Following acute
insulin challenge, IRS1 tyrosine
phosphorylation and AKT activation were
impaired upon GRK2 or GRK2-K220R
overexpression both in adipocytes and in
myoblasts (Fig. 1C and 1D), while reduced
levels of GRK2 promoted the opposite effect.
Basal IRS1 protein levels were higher in cells
with silenced GRK2, and decreased in cells
with elevated GRK2, suggesting a functional
relationship between GRK2 and IRS1 (Fig.
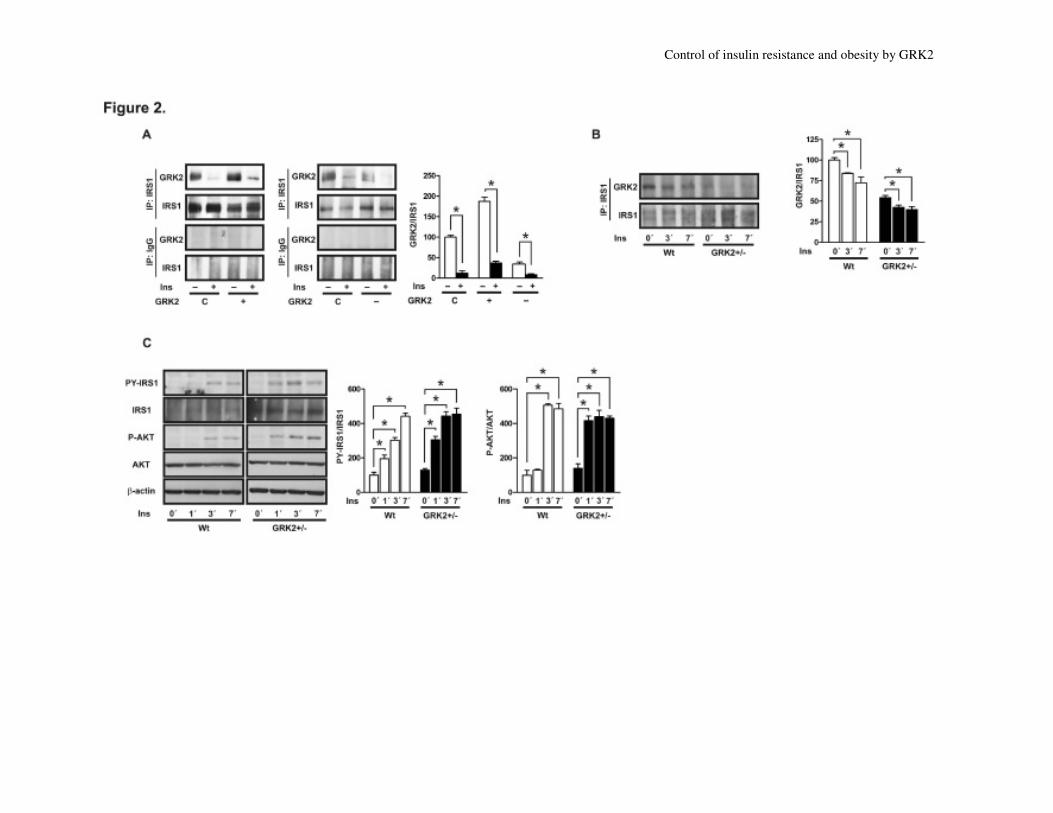
1C and 1D). Co-immunoprecipitation
experiments in adipocytes showed that both
endogenous GRK2 and IRS1 proteins form a
complex under basal conditions that is
completely disrupted after 10 minutes of
insulin treatment (Fig. 2A). GRK2 over-
expression enhances the amount of IRS1
associated to the kinase by approximately
87% and prevents the complete disruption of
the complex by insulin. In contrast, GRK2
downregulation decreases its basal association
with IRS1 and facilitates a complete
disruption of this complex by insulin.
Interestingly, a similar picture emerges when
investigating such parameters in adipose
tissue from wild-type (Wt) or GRK2
hemizygous mice, expressing some 50% of
GRK2 protein (25;26). The amount of basal
IRS1/GRK2 complexes also depends on
GRK2 levels in vivo and insulin infusion
disrupts such complexes (Fig. 2B). Also, a
faster kinetics in insulin-mediated IRS1 and
AKT phosphorylation (Fig. 2C) is observed in
GRK2+/-
mice.
Overall, our data indicate that GRK2 levels
regulate insulin signaling in skeletal muscle
and adipose tissue both in cultured cells and
in vivo, most probably by mechanisms
independent of kinase activity and involving
the formation of dynamic GRK2/IRS1
complexes.
GRK2 protein expression is enhanced
under insulin-resistant conditions. If GRK2
is to play a role in the modulation of insulin
sensitivity in vivo, the expression of this
kinase should be altered in conditions
characterized by insulin resistance. Obesity-
associated metabolic disorders such as type-2-
diabetes and insulin resistance can be induced
by TNFα infusion, aging or HFD (1).
Therefore, we compared GRK2 expression in
epididymal white adipose tissue (eWAT),

Control of insulin resistance and obesity by GRK2
liver and skeletal muscle obtained from 3 and
9-month-old mice, and from mice fed on a
HFD, or treated with TNFα using only male
mice (Fig. 3A and Suppl. Table 1). GRK2
expression levels were enhanced in adipose
tissue (from 1.3 to 1.9-fold) and muscle (1.4
to 1.7-fold) in every experimental condition
studied, and changes in liver expression were
observed upon HFD treatment. GRK2
expression was also enhanced by more than 2-
fold in eWAT tissue of the ob/ob model of
obese mice (Fig. 3B), and by 2.5-fold in
human adipocytes forced to develop an
insulin-resistant state upon a chronic
challenge with insulin (Fig. 3C). Finally,
since lymphocyte GRK2 levels have been
reported to mirror changes in the kinase
expression in other organs under several
physiopathological circumstances (27), we
analyzed the levels of GRK2 in peripheral
blood mononuclear cells obtained from
patients with diverse degrees of insulin
resistance (Suppl. Table 2). In these cells
GRK2 levels were higher in insulin resistant
patients compared to control individuals (Fig.
3D). Although preliminary, our results
indicate that GRK2 levels are altered in
murine experimental models and in human
samples under insulin resistant conditions,
suggesting that this kinase might mediate the
ability to induce insulin resistance of different
neurohumoral factors that are altered in these
situations (28;29).
GRK2+/-
mice do not develop TNFαααα-induced insulin resistance. To test the hypothesis that
such moderate changes in GRK2 expression levels
may indeed alter insulin signaling in vivo, we
studied whole-body insulin action and glucose
homeostasis in age-matched wild-type (Wt) and
GRK2+/-
male mice. These haploinsufficient mice
constitute a good model to recapitulate differences
in GRK2 expression in the same range to those
observed in pathological conditions, and also to
evaluate the potential of therapeutic strategies
aimed at decreasing GRK2 functionality in vivo.
Whereas GRK2 knock-out mice die in utero with
a marked cardiac hypoplasia (30), and the cardiac
phenotype of GRK2+/-
mice has been well
characterized (31;32), insulin signaling has not
been investigated so far in these animals.
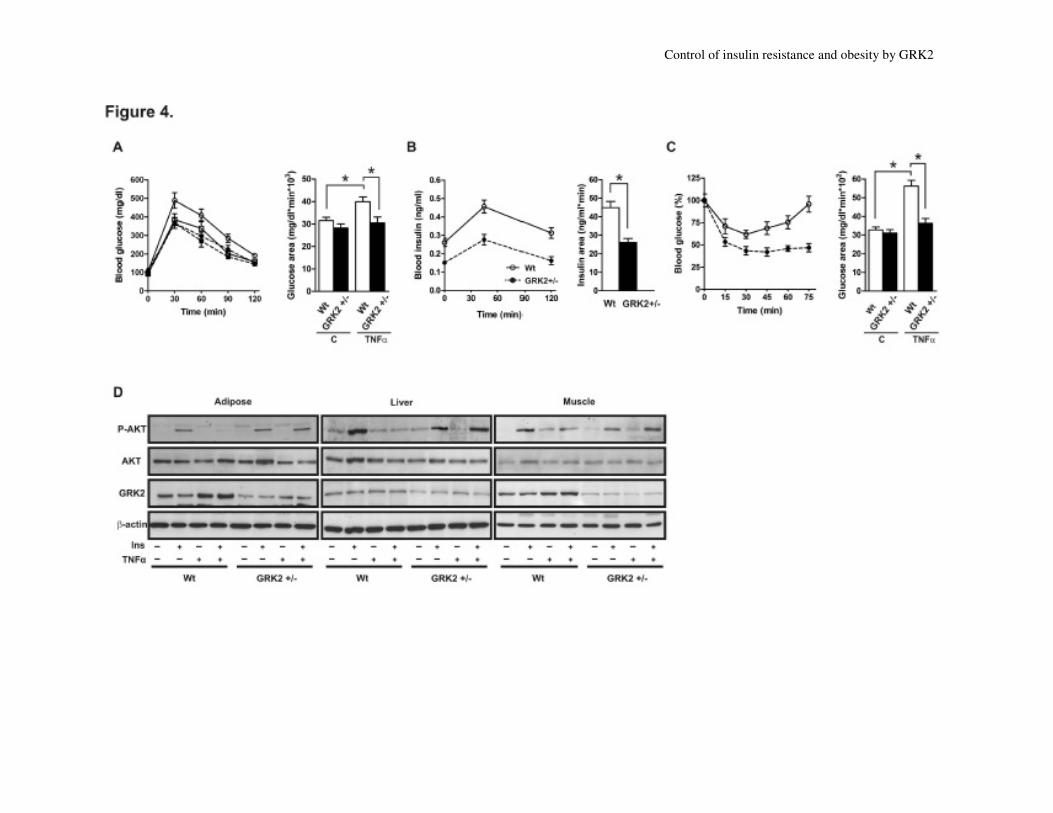
Since TNFα infusion induces insulin
resistance in murine models in vivo (24;33),
we examined insulin sensitivity by GTTs and
ITTs in Wt and GRK2+/-
3-month-old male
mice after a 48h treatment with TNFα (Fig.
4A and 4C). In Wt, but not in GRK2+/-
mice,
TNFα produced a significant 29% increase in
fasting blood glucose levels (Table 1).
Moreover, the additional pronounced
hyperglycemic effect of TNFα after glucose
injection observed in Wt mice was attenuated
in GRK2+/-
mice (Fig. 4A). The improved
glucose tolerance observed was not due to an
increase in circulating insulin because
GRK2+/-
mice had lower circulating insulin
levels than Wt mice in both the fasted state
(Table 1) and during the GTT (Fig. 4B).
These results suggest that the more efficient
glucose clearance observed in GRK2+/-
mice
is caused by enhanced peripheral insulin
sensitivity. In line with this notion, the
hypoglycemic effect of insulin injection was
impaired upon TNFα treatment in Wt animals
but not in GRK2+/-
mice (Fig. 4C).
Wt mice treated with TNFα showed a
complete impairment in insulin-induced AKT
phosphorylation in skeletal muscle, adipose
tissue and liver (Fig. 4D and Suppl. Fig. S2
and Suppl. Table 1), that was not detected in
GRK2+/-
mice. Interestingly, TNFα
substantially increased GRK2 protein content
in eWAT and muscle of Wt mice (by 82%
and 42% respectively, Fig. 4D and Suppl. Fig.
S2 and Suppl. Table 1), whereas the amount
of GRK2 remained unaltered (in liver and
muscle) or below basal Wt levels (adipose)
upon TNFα treatment in GRK2+/-
mice (Fig.
4D, Suppl. Fig S2 and Suppl. Table 1).
Altogether, these results suggest that GRK2 is
a negative modulator of insulin sensitivity and
that lower GRK2 levels protect against the
systemic insulin resistance induced by TNFα.
GRK2 downregulation prevents the
development of aging-associated insulin
resistance. In the model of aging-associated
Control of insulin resistance and obesity by GRK2
insulin resistance, GRK2 downregulation
caused no differences in the GTTs or ITTs of
young (3-month-old) male mice (Fig. 5A-C),
while in adult 9-month-old GRK2+/-
male
mice glucose tolerance was improved
compared to Wt (Fig. 5D). A similar tendency
had already been observed at 5 months of age
in GRK2+/-
mice (Suppl. Fig. S1). Aging also
induced a 57% increase in fasting glucose
concentration in Wt mice, limited to 29% in
GRK2+/-
mice (Table 1). Circulating levels of
insulin were higher in 9-month-old Wt than in
GRK2+/-
mice in response to an identical
glucose load (Fig. 5E). Consistently, GRK2+/-
mice exhibited an enhanced decline in blood
glucose levels upon administration of insulin
(Fig. 5F), and lower fasting serum insulin
levels (Table 1). Altogether these results
suggest increased whole-body insulin
sensitivity in GRK2+/-
mice, in agreement
with the values obtained for the HOMA index
(Table 1).
Insulin-stimulated AKT phosphorylation was
markedly impaired with age in eWAT, liver
and muscle in Wt mice, while GRK2+/-
animals maintained a robust activation of this
pathway (Fig. 5G and Suppl. Fig. S2 and
Suppl. Table 1). Interestingly, in adult
animals, GRK2 protein expression was
enhanced by 33% and 68% in eWAT and
muscle, respectively, compared to young mice
(Figs 3A, 5G and Suppl. Fig. S2 and Suppl.
Table 1), whilst GRK2 levels in adult
GRK2+/-
mice were below the expression
detected at 3 months of age in Wt animals in
all tissues examined (Fig. 5G and Suppl. Fig.
S2 and Suppl. Table 1). Overall, these data
suggest there is a threshold above which the
enhanced GRK2 expression observed with
age markedly affects insulin sensitivity in
vivo.
GRK2+/-
mice display protection against
high fat diet-induced insulin resistance and
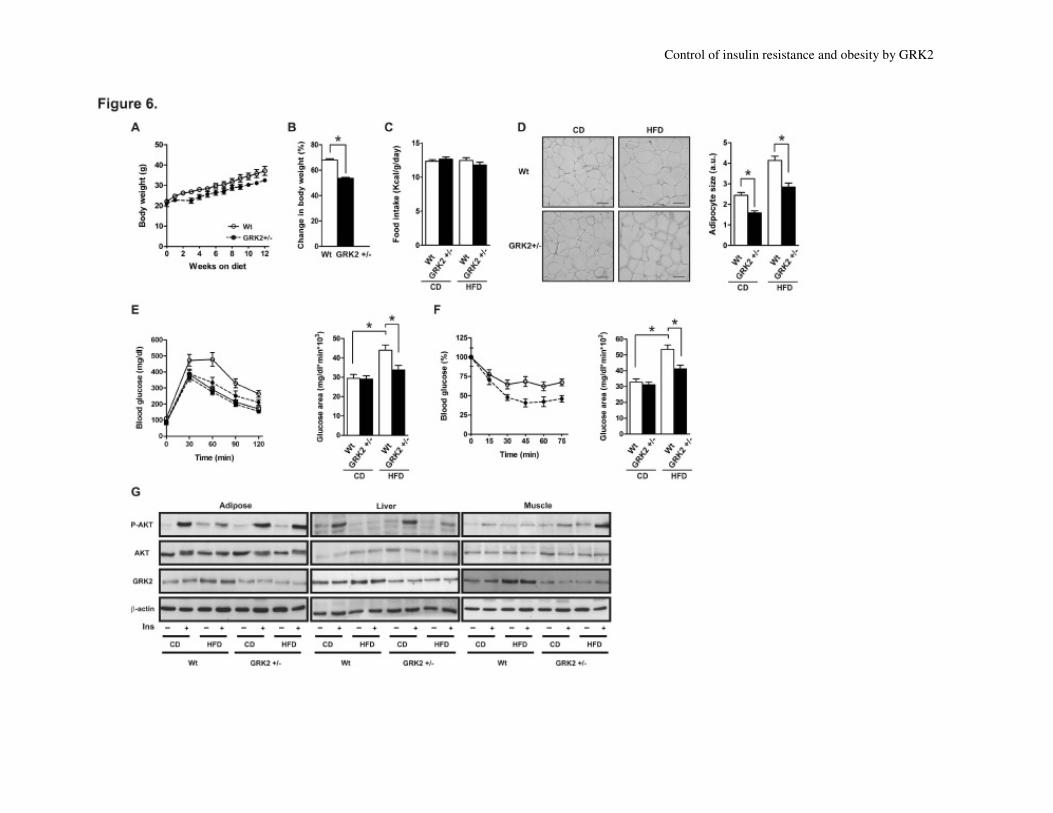
obesity. After a HFD regime for 12 weeks,
Wt mice gained significantly more weight
than GRK2+/-
mice (Fig. 6A). The overall
increase in body weight was of 67% in Wt
and only 53% in GRK2+/-
mice (Fig. 6B),
without changes in food intake (Fig. 6C).
Consistently, even when adipocyte diameter
was increased in both groups, adiposity in
GRK2 hemizygous mice did not go beyond a
certain threshold that was exceeded only in
WT mice, with the size of HFD-fed GRK2+/-
epididymal adipocytes being 45% inferior
than that of Wt mice (Fig. 6D).
GTT analysis indicated a clear deterioration
in glucose metabolism in Wt but not in HFD-
fed GRK2+/-
mice. In the HFD-fed state,
GRK2+/-
mice did not develop glucose
intolerance (Fig. 6E), since we detect no
statistically significant changes in glucose
area between chow diet (CD)-fed and HFD-
fed GRK2+/-
mice, which showed lower blood
glucose levels (Table 1) and an enhanced
reduction in blood glucose induced by insulin
(Fig. 6F). HFD caused a marked increase in
circulating levels of glucose, insulin and TG
after 12 weeks of feeding (Table 1) in Wt
mice whereas these changes were much more
modest in GRK2+/-
animals. These parameters
were not altered with CD in either type of
animals (data not shown). In sum, HFD
promoted a marked insulin resistance state in
Wt mice, in accordance with the observed
increase in HOMA values (Table 1), whereas
insulin sensitivity was preserved in GRK2+/-
mice.
Insulin-induced AKT phosphorylation was
dramatically decreased in adipose tissue, liver
and muscle of Wt but not HFD-fed GRK2+/-
mice (Fig. 6G and Suppl. Fig. S2 and Suppl.
Table 1). On the other hand, in agreement
with data in Fig. 3A, GRK2 protein levels
were significantly increased in eWAT (84%),
liver (26%) and muscle (63%) of Wt but not
GRK2+/-
mice fed on a HFD (Fig. 6G and
Suppl. Fig. S2 and Suppl. Table 1). These
results indicate that even in different cellular
settings, whenever glucose intolerance
develops, GRK2+/-
mice always maintain the
levels of GRK2 protein below those detected

Control of insulin resistance and obesity by GRK2
in Wt and thus below a given threshold that
helps to prevent the development of insulin
insensitivity
GRK2+/-
mice exhibit reduced adiposity . In
addition to the data shown in Fig. 6A-C, a
detailed weekly analysis of the weight of Wt
and GRK2+/-
animals from weaning to 15
months of age (Fig. 7A) revealed less weight
gain for both male and female GRK2+/-
mice
(Fig. 7B), without differences in daily food
intake (Fig. 7C). Body weight differences
were detected as early as at 5 months of age
(Fig. 7A), and at 9 months of age, when some
Wt mice are visibly obese (Fig. 7D), the
average body weight gain was 65% and 56%
in male and female Wt mice, respectively, but
only 56% and 43% in GRK2+/-
mice (Fig.
7B). Body fat distribution was studied by
Magnetic Nuclear Resonance Imaging
(MNRI) (Fig. 7E), showing that 9-month-old
GRK2+/-
mice had 33% less overall fat and
smaller fat depots than age-matched Wt
littermates (Fig. 7F). Epididymal fat mass was
reduced by 30% in GRK2+/-
compared to Wt
mice at 9 months of age (Fig. 7G), and
GRK2+/-
mice exhibited reduced adipocytic
size in epididymal (3-fold), retroperitoneal
(4.6-fold) and inguinal (3-fold) fat (Fig. 7H).
Interestingly, a decrease in circulating leptin
levels was also detected in GRK2+/-
animals at
9 months of age (Table 1). These results
indicate that downregulation of GRK2 is
sufficient to induce a lean phenotype, what
uncovers a previously unidentified role for
GRK2 in the regulation of adiposity.
DISCUSSION
In this report we uncover GRK2 as a key
modulator of insulin sensitivity in vivo. In
cultured adipocytes and myoblasts, increased
GRK2 or GRK2-K220R levels inhibit insulin-
stimulated glucose uptake and signaling in a
kinase-activity independent manner, by
mechanisms involving the formation of
dynamic GRK2/IRS1 complexes. GRK2
expression is enhanced by approximately 2-
fold in insulin-resistant human adipocytes, in
blood mononuclear cells from insulin-
resistant patients and in adipose and muscle
tissues in either TNFα, aging or HFD-induced
insulin resistance models. Importantly,
GRK2+/-
mice maintain glucose tolerance and
insulin signaling in the major insulin-
responsive tissues under such experimental
conditions, suggesting that enhanced GRK2
expression above a certain threshold markedly
impairs insulin sensitivity in vivo. Finally, we
find that GRK2 levels also regulate adiposity
during aging. Since GRK2 haploinsuficient
animals show a phenotype quite similar to
mice deficient in other well established
negative regulators of insulin signaling such
as PTP1B (24;33;34), GRK2 can be regarded
as a bona fide novel physiological regulator of
insulin action and leanness.
Previous reports have indicated that GRK2
could act as an inhibitor of insulin action in
cellular models. Binding of GRK2 to Gαq/11
impairs insulin-stimulated glucose uptake in
3T3L1 pre-adipocytes (19), and enhanced
GRK2 levels favour insulin resistance
induced by endothelin-1 in 3T3L1 cells (29)
or by chronic β-adrenergic receptor
stimulation in HEK-293 cells (28). GPCR
agonists promote GRK2 interaction with Gαq
and also with IRS1, resulting in decreased
insulin-stimulated glucose transport, IRS-
serine phosphorylation and IRS1 degradation
(29). Our data in cultured cells as well as in
adipose tissue in vivo show that IRS1 levels
as well as the amount of basal GRK2-IRS1
complexes depend on GRK2 expression and
that insulin stimulation rapidly disrupts basal
IRS1/GRK2 complexes, what is hampered in
the presence of elevated levels of GRK2.
Overall, these data suggest that altered GRK2
levels could lead to modulation of insulin
signals through GRK2-Gαq/11 binding,
GRK2-IRS1 association, and altered
endothelin-1 or β-adrenergic-mediated
transmodulation of the insulin pathway. The
precise contribution of such mechanisms in

Control of insulin resistance and obesity by GRK2
different physiological conditions remains to
be investigated.
Interestingly, β-arrestin2, another member of
the GPCR signal transduction pathway,
positively regulates insulin sensitivity by
serving as a scaffold of AKT and Src to the
IR (35). β-arrestin2 levels are downregulated
in liver and muscle in animal models and
patients with insulin resistance. Therefore,
simultaneous up-regulation of GRK2 and
down-regulation of β-arrestin2 in insulin-
resistant conditions could lead to major
alterations in the insulin signaling pathways
and in GPCR-IR cross-talk. It is worth noting
that elevated levels of insulin and IGF-1 have
been shown to exert differential effects on
GRK2 and β-arrestin2 expression (36;37).
Enhanced GRK2 levels could alter the
proposed novel IR-arrestin signaling pathway
by re-directing arrestin to other interactors,
such as GPCR or, given the reported direct
interactions of the kinase with AKT or Src, by
inhibiting the formation of the
arrestin/AKT/Src complexes.
GRK2 is degraded by the proteasome
pathway by associating with the Mdm2 E3-
ubiquitin ligase, and activation of the
PI3K/AKT pathway by IGF-1 blocks Mdm2-
mediated GRK2 degradation, leading to
enhanced GRK2 levels (38). Consistently,
chronic insulin has been recently shown to
increase GRK2 levels in HEK-293 and liver
FL83B cells (20;28) what is in agreement
with the upregulation of GRK2 we observe
after insulin treatment in human adipocytic
cells. Thus, it is tempting to suggest that the
hyperinsulinemia associated to aging, HFD-
or TNFα-induced insulin resistant conditions,
and clinically to obesity and type-2-diabetes,
would trigger the observed up-regulation of
GRK2 in such conditions. Consistent with our
findings, enhanced GRK2 expression has
been reported in tissues from obese Zucker
rats, a model of insulin resistance and
hyperinsulinemia (39).
An altered cytokine expression pattern typical
of insulin-resistant states could also contribute
to enhance GRK2 expression levels. TNFα or
IL-6 increase the expression of other negative
modulators of the insulin signalling cascade
like PTP1B (24;40), and we find that TNFα
also enhances GRK2 protein content in
adipose tissue and muscle of Wt mice in the
presence of mild hyperinsulinemia. As in
GRK2+/-
mice, PTP1B-deficient animals also
exhibit protection against insulin resistance
induced by TNFα (24), or IL-6 (40). Pro-
inflammatory mediators can modulate
endogenous GRK2 expression in a cell-type
specific fashion (41), and an increase in
GRK2 protein is found upon chronic IL-1β
treatment (26;42). Interestingly, GRK2
appears to have a relevant role in the
aetiology and/or in the development of
several inflammatory diseases such as
multiple sclerosis, and autoimmune arthritis
(43). A role for GRK2 in states of insulin
resistance associated to inflammatory diseases
deserves further investigation.
The fact that the 50% down-regulation of
GRK2 levels is sufficient per se to protect
against TNFα, aging or HFD-induced
alterations in glucose homeostasis and insulin
signaling strongly supports that this kinase is
a key modulator of insulin sensitivity in vivo
and suggests new therapeutic strategies
against type-2-diabetes and obesity. In fact, in
animal models of type-2-diabetes, GRK2
inhibition through systemic delivery of small
peptides derived from its catalytic domain
results in improved glucose homeostasis
(28;44). It remains to be established whether
inhibition of catalytic activity,
downregulation of protein expression or
targeted disruption of the specific interaction
of GRK2 with insulin signaling pathway
components are the more appropriate
strategies for specifically improving insulin
sensitivity.
The GRK2+/-
mice constitute a good model
that recapitulates a sustained systemic
Control of insulin resistance and obesity by GRK2
inhibition of kinase functionality. We report
here that GRK2 levels are important
modulators of age- and diet-induced
adiposity. GRK2+/-
mice gained less weight,
showed diminished adipocyte size with a
HFD, and adult hemizygous animals
displayed reduced adiposity and lower
circulating levels of insulin and leptin. Aging
is associated with fat mass accretion and with
decreased peripheral insulin sensitivity in
humans and rodents (45), and impaired
insulin actions in adipose tissue could
represent a key step leading to the overall
insulin resistance characteristic of adult
and/or obese animals (46). Adipocyte-
conditioned medium impairs insulin signaling
in muscle cells (22) and hepatocytes (47), and
mice that exhibit reduced adiposity typically
display improved glucose tolerance and
increased insulin sensitivity (46). Therefore, it
is possible that part of the insulin
hypersensitivity detected in GRK2+/-
mice and
the protection afforded to the development of
insulin resistant conditions in these animals
could be related to the observed changes in
adiposity. Future experiments involving
tissue-specific downregulation will provide
new insight into the understanding of the role
of GRK2 in obesity and insulin resistance.
Author contributions: L.G-G & R. V-V.,
researched data, contributed to discussion;
I.N-V., wrote manuscript, researched data,
contributed to discussion; M.J-P., researched
data; G.Z. & J.D., collected samples,
reviewed/edited manuscript. C.M., F.M. Jr.,
M.L. & S. F-V., contributed to discussion,
wrote/edited manuscript.
ACKNOWLEDGMENTS
This work is dedicated to the memory of Prof.
Margarita Lorenzo, who passed away April 7,
2010, at the age of 51.
This work was supported by Grants
BFU2008-04043 (to M.L), SAF2008-0552 (to
F.M) and SAF2007-62553 (to G.Z.) from
Ministerio de Ciencia e Innovación, Spain, S-
SAL-0159-2006 from Comunidad de Madrid,
Spain (to M.L. and F.M), Fundación Ramón
Areces (to F.M), the European Union
(InGenious HyperCare, grant LSHM-CT-
2006-037093 (to J.D., through the agreement
between the Foundation for Applied Medical
Research (FIMA) and “UTE project CIMA”),
The Cardiovascular Network (RECAVA,
RD06-0014/0037 and 0014/008 to F.M and
J.D., respectively), CIBER de Diabetes y
Enfermedades Metabólicas Asociadas, and
PS09/01208 (to C.M.) from Ministerio
Sanidad y Consumo-Instituto Carlos III,
Spain. We also acknowledge the support of
COST Action BM0602 from the European
Commission (to M.L.). The authors thank to
Dr. Oscar Beloqui from the University Clinic
of Navarra, for recollection of clinical data of
studied patients.
REFERENCES
1. Biddinger SB, Kahn CR. From mice to men. insights into the insulin resistance syndromes.
Annu Rev Physiol 2006;68:123-158
2. White MF. Insulin signaling in health and disease. Science 2003;302:1710-1711
3. Hoehn KL, Hohnen-Behrens C, Cederberg A, Wu LE, Turner N, Yuasa T, Ebina Y, James
DE. IRS1-independent defects define major nodes of insulin resistance. Cell Metab
2008;7:421-433
4. Trayhurn P, Wood IS. Signalling role of adipose tissue: adipokines and inflammation in
obesity. Biochem Soc Trans 2005;33:1078-1081
5. Waki H, Tontonoz P. Endocrine functions of adipose tissue. Annu Rev Pathol 2007;2:31-
56

Control of insulin resistance and obesity by GRK2
6. de Luca C, Olefsky JM. Inflammation and insulin resistance. FEBS Lett 2008;582:97-105
7. Hernandez R, Teruel T, de Alvaro C, Lorenzo M. Rosiglitazone ameliorates insulin
resistance in brown adipocytes of Wistar rats by impairing TNF-alpha induction of p38 and
p42/p44 mitogen-activated protein kinases. Diabetologia 2004; 47:1615-1624
8. Fernandez-Veledo S, Nieto-Vazquez I, Vila-Bedmar R, Garcia-Guerra L, Alonso-
Chamorro M, Lorenzo M. Molecular mechanisms involved in obesity-associated insulin
resistance: therapeutical approach. Arch Physiol Biochem 2009;115:227-239
9. de Alvaro C, Teruel T, Hernandez R, Lorenzo M. Tumor necrosis factor alpha produces
insulin resistance in skeletal muscle by activation of inhibitor kappaB kinase in a p38
MAPK-dependent manner. J Biol Chem 2004;279:17070-17078
10. Nieto-Vazquez I, Fernandez-Veledo S, Kramer DK, Vila-Bedmar R, Garcia-Guerra L,
Lorenzo M. Insulin resistance associated to obesity: the link TNF-alpha. Arch Physiol
Biochem 2008;114:183-194
11. Fernandez-Veledo S, Vila-Bedmar R, Nieto-Vazquez I, Lorenzo M. c-Jun N-terminal
kinase 1/2 activation by tumor necrosis factor-alpha induces insulin resistance in human
visceral but not subcutaneous adipocytes: reversal by liver X receptor agonists. J Clin
Endocrinol Metab 2009;94:3583-3593
12. Huang S, Czech MP. The GLUT4 glucose transporter. Cell Metab 2007;5:237-252
13. Zaid H, Antonescu CN, Randhawa VK, Klip A. Insulin action on glucose transporters
through molecular switches, tracks and tethers. Biochem J 2008;413:201-215
14. Kanzaki M, Watson RT, Artemyev NO, Pessin JE. The trimeric GTP-binding protein
(G(q)/G(11)) alpha subunit is required for insulin-stimulated GLUT4 translocation in
3T3L1 adipocytes. J Biol Chem 2000;275:7167-7175
15. Imamura T, Vollenweider P, Egawa K, Clodi M, Ishibashi K, Nakashima N, Ugi S, Adams
JW, Brown JH, Olefsky JM. G alpha-q/11 protein plays a key role in insulin-induced
glucose transport in 3T3-L1 adipocytes. Mol Cell Biol 1999;19:6765-6774
16. Usui I, Imamura T, Huang J, Satoh H, Olefsky JM. Cdc42 is a Rho GTPase family member
that can mediate insulin signaling to glucose transport in 3T3-L1 adipocytes. J Biol Chem
2003;278:13765-13774
17. Jurado-Pueyo M, Campos PM, Mayor F, Murga C. GRK2-dependent desensitization
downstream of G proteins. J Recept Signal Transduct Res 2008;28:59-70
18. Ribas C, Penela P, Murga C, Salcedo A, Garcia-Hoz C, Jurado-Pueyo M, Aymerich I,
Mayor F, Jr.. The G protein-coupled receptor kinase (GRK) interactome: role of GRKs in
GPCR regulation and signaling. Biochim Biophys Acta 2007;1768:913-922
19. Usui I, Imamura T, Satoh H, Huang J, Babendure JL, Hupfeld CJ, Olefsky JM. GRK2 is an
endogenous protein inhibitor of the insulin signaling pathway for glucose transport
stimulation. EMBO J 2004;23:2821-2829
20. Shahid G, Hussain T. GRK2 negatively regulates glycogen synthesis in mouse liver FL83B
cells. J Biol Chem 2007;282:20612-20620
21. Wabitsch M, Bruderlein S, Melzner I, Braun M, Mechtersheimer G, Moller P. LiSa-2, a
novel human liposarcoma cell line with a high capacity for terminal adipose differentiation.
Int J Cancer 2000;88:889-894
22. Fernandez-Veledo S, Nieto-Vazquez I, de Castro J, Ramos MP, Bruderlein S, Moller P,
Lorenzo M. Hyperinsulinemia induces insulin resistance on glucose and lipid metabolism
in a human adipocytic cell line: paracrine interaction with myocytes. J Clin Endocrinol
Metab 2008;93:2866-2876

Control of insulin resistance and obesity by GRK2
23. Fortuno A, Olivan S, Beloqui O, San JG, Moreno MU, Diez J, Zalba G. Association of
increased phagocytic NADPH oxidase-dependent superoxide production with diminished
nitric oxide generation in essential hypertension. J Hypertens 2004;22:2169-2175
24. Nieto-Vazquez I, Fernandez-Veledo S, de Alvaro C, Rondinone CM, Valverde AM,
Lorenzo M. Protein-Tyrosine Phosphatase 1B-Deficient Myocytes Show Increased Insulin
Sensitivity and Protection Against Tumor Necrosis Factor-{alpha}-Induced Insulin
Resistance. Diabetes 2007;56:404-413
25. Jimenez-Sainz MC, Murga C, Kavelaars A, Jurado-Pueyo M, Krakstad BF, Heijnen CJ,
Mayor F, Jr., Aragay AM. G protein-coupled receptor kinase 2 negatively regulates
chemokine signaling at a level downstream from G protein subunits. Mol Biol Cell
2006;17:25-31
26. Kleibeuker W, Jurado-Pueyo M, Murga C, Eijkelkamp N, Mayor F, Jr., Heijnen CJ,
Kavelaars A. Physiological changes in GRK2 regulate CCL2-induced signaling to ERK1/2
and Akt but not to MEK1/2 and calcium. J Neurochem 2008; 104:979-992
27. Iaccarino G, Barbato E, Cipolletta E, de Amicis V, Margulies KB, Leosco D, Trimarco B,
Koch WJ. Elevated myocardial and lymphocyte GRK2 expression and activity in human
heart failure. Eur Heart J 2005;26:1752-1758
28. Cipolletta E, Campanile A, Santulli G, Sanzari E, Leosco D, Campiglia P, Trimarco B,
Iaccarino G. The G protein coupled receptor kinase 2 plays an essential role in beta-
adrenergic receptor-induced insulin resistance. Cardiovasc Res 2009
29. Usui I, Imamura T, Babendure JL, Satoh H, Lu JC, Hupfeld CJ, Olefsky JM. G protein-
coupled receptor kinase 2 mediates endothelin-1-induced insulin resistance via the
inhibition of both Galphaq/11 and insulin receptor substrate-1 pathways in 3T3-L1
adipocytes. Mol Endocrinol 2005;19:2760-2768
30. Jaber M, Koch WJ, Rockman H, Smith B, Bond RA, Sulik KK, Ross J, Jr., Lefkowitz RJ,
Caron MG, Giros B. Essential role of beta-adrenergic receptor kinase 1 in cardiac
development and function. Proc Natl Acad Sci U S A 1996; 93:12974-12979
31. Penela P, Murga C, Ribas C, Tutor AS, Peregrin S, Mayor F, Jr.. Mechanisms of regulation
of G protein-coupled receptor kinases (GRKs) and cardiovascular disease. Cardiovasc Res
2006;69:46-56
32. Dorn GW. GRK mythology: G-protein receptor kinases in cardiovascular disease. J Mol
Med 2009;87:455-463
33. Elchebly M, Payette P, Michaliszyn E, Cromlish W, Collins S, Loy AL, Normandin D,
Cheng A, Himms-Hagen J, Chan CC, Ramachandran C, Gresser MJ, Tremblay ML,
Kennedy BP. Increased insulin sensitivity and obesity resistance in mice lacking the protein
tyrosine phosphatase-1B gene. Science 1999; 283:1544-1548
34. Klaman LD, Boss O, Peroni OD, Kim JK, Martino JL, Zabolotny JM, Moghal N, Lubkin
M, Kim YB, Sharpe AH, Stricker-Krongrad A, Shulman GI, Neel BG, Kahn BB. Increased
energy expenditure, decreased adiposity, and tissue-specific insulin sensitivity in protein-
tyrosine phosphatase 1B-deficient mice. Mol Cell Biol 2000;20:5479-5489
35. Luan B, Zhao J, Wu H, Duan B, Shu G, Wang X, Li D, Jia W, Kang J, Pei G. Deficiency of
a beta-arrestin-2 signal complex contributes to insulin resistance. Nature 2009;457:1146-
1149
36. Dalle S, Imamura T, Rose DW, Worrall DS, Ugi S, Hupfeld CJ, Olefsky JM. Insulin
induces heterologous desensitization of G-protein-coupled receptor and insulin-like growth
factor I signaling by downregulating beta-arrestin-1. Mol Cell Biol 2002;22:6272-6285

Control of insulin resistance and obesity by GRK2
37. Hupfeld CJ, Dalle S, Olefsky JM. Beta -Arrestin 1 down-regulation after insulin treatment
is associated with supersensitization of beta 2 adrenergic receptor Galpha s signaling in
3T3-L1 adipocytes. Proc Natl Acad Sci U S A 2003;100:161-166
38. Salcedo A, Mayor F, Jr., Penela P. Mdm2 is involved in the ubiquitination and degradation
of G-protein-coupled receptor kinase 2. EMBO J 2006;25:4752-4762
39. Trivedi M, Lokhandwala MF. Rosiglitazone restores renal D1A receptor-Gs protein
coupling by reducing receptor hyperphosphorylation in obese rats. Am J Physiol Renal
Physiol 2005;289:F298-F304
40. Nieto-Vazquez I, Fernandez-Veledo S, de Alvaro C, Lorenzo M. Dual role of interleukin-6
in regulating insulin sensitivity in murine skeletal muscle. Diabetes 2008; 57:3211-3221
41. Ramos-Ruiz R, Penela P, Penn RB, Mayor F, Jr.. Analysis of the human G protein-coupled
receptor kinase 2 (GRK2) gene promoter: regulation by signal transduction systems in
aortic smooth muscle cells. Circulation 2000;101:2083-2089
42. Mak JC, Hisada T, Salmon M, Barnes PJ, Chung KF. Glucocorticoids reverse IL-1beta-
induced impairment of beta-adrenoceptor-mediated relaxation and up-regulation of G-
protein-coupled receptor kinases. Br J Pharmacol 2002;135:987-996
43. Vroon A, Heijnen CJ, Kavelaars A. GRKs and arrestins: regulators of migration and
inflammation. J Leukoc Biol 2006;80:1214-1221
44. Anis Y, Leshem O, Reuveni H, Wexler I, Ben SR, Yahalom B, Laster M, Raz I, Ben SS,
Shafrir E, Ziv E. Antidiabetic effect of novel modulating peptides of G-protein-coupled
kinase in experimental models of diabetes. Diabetologia 2004;47:1232-1244
45. Escriva F, Gavete ML, Fermin Y, Perez C, Gallardo N, Alvarez C, Andres A, Ros M,
Carrascosa JM. Effect of age and moderate food restriction on insulin sensitivity in Wistar
rats. role of adiposity. J Endocrinol 2007;194:131-141
46. Sabio G, Das M, Mora A, Zhang Z, Jun JY, Ko HJ, Barrett T, Kim JK, Davis RJ. A stress
signaling pathway in adipose tissue regulates hepatic insulin resistance. Science
2008;322:1539-1543
47. Wang Z, Lv J, Zhang R, Zhu Y, Zhu D, Sun Y, Zhu J, Han X. Co-culture with fat cells
induces cellular insulin resistance in primary hepatocytes. Biochem Biophys Res Commun
2006;345:976-983

Control of insulin resistance and obesity by GRK2
Table 1. Metabolic parameters of Wt and GRK2+/-
male mice.
Serum from Wt and GRK2+/-
3 and 9-month-old male mice, fed on a HFD for 12 weeks or adult male mice treated with TNFα as in
Fig. 4 was collected, and the indicated metabolic parameters were measured as detailed in Methods. The HOMA index was calculated
as the product of the fasting plasma insulin level (mU/mL) and the fasting plasma glucose level (mmol/L), divided by 22.5. Values are
expressed as the mean±SEM of measurements obtained for 8-18 animals for each group. Differences between Wt vs GRK2+/-
mice are
expressed by *, and differences between 3-month-old mice vs 9-month-old mice, fed a HFD or treated with TNFα are expressed by §.
*, § p<0.05.
3 months 9 months HFD TNFα
Parameter
Wt GRK2+/- Wt GRK2+/- Wt GRK2+/- Wt GRK2+/-
Blood glucose (mg/dl)
Fed 155,4 ± 5,9 152 ± 6,3 170,2 ± 6,7 § 152,7 ± 6,4 * 184,4 ± 9,7 § 168 ± 5,7 *§ 148 ± 6,5 135 ± 7,1
Fasted 81,6 ± 3,6 81,6 ± 2,6 128,3 ± 6,0 § 105,6 ± 8,3 *§ 110 ± 3,7 § 89,6 ± 4,0 *§ 105,8±6,2 § 83 ± 2,3 *
Serum Insulin (ng/ml)
Fed 0,65 ± 0,08 0,49 ± 0,09 0,98 ± 0,05 § 0,60 ± 0,02 * 2,50 ± 0,30 § 1,03 ± 0,01 *§ - -
Fasted 0,13 ± 0,02 0,13 ± 0,01 0,61 ± 0,05 § 0,44 ± 0,04 *§ 0,54 ± 0,02 § 0,16 ± 0,01 *§ 0,26 ± 0,02 § 0,15 ± 0,02 *
Triglycerides (µg/µl)
Fed 0,046 ± 0,002 0,054 ± 0,001* 0,038 ± 0,005 § 0,047 ± 0,006 § 0,140 ± 0,020 § 0,064 ± 0,001 *§ - -
Fasted 0,018 ± 0,002 0,011 ± 0,001* 0,035 ± 0,001 § 0,033 ± 0,002 § 0,060 ± 0,002 § 0,045 ± 0,007 *§ - -
Leptin(ng/ml)
Fed 6,7 ± 1,5 6,6 ± 1,3 8,4 ± 1,7 6,1 ± 1,7 14 ± 3,6 § 13,1 ± 3,0 § - -
HOMA 0,63 ± 0,07 0,62 ± 0,08 5,02 ± 0,63 § 2,53 ± 0,16 *§ 3,52 ± 0,42 § 0,85 ± 0,07 * 1,63 ± 0,09 § 0,74 ± 0,06 *
* Wt vs GRK2+/-; P<0.05
§ 3 months vs 9 months, HFD, TNFαααα; P<0.05

Control of insulin resistance and obesity by GRK2
FIGURE LEGENDS
Fig. 1. Modulation on insulin sensitivity by GRK2
Immortalized murine white adipocytes and C2C12 myocytes were transiently transfected with
empty vector (control, C), pcDNA3-GRK2-neo (+), the catalytically inactive pcDNA3-GRK2-
K220R (K) or shGRK2-RNAi (-), to upregulate or knock-down GRK2 expression, respectively.
(A) Lysates were analyzed by Western-blot with the corresponding antibodies against GRK2 and
β-actin. For examples of full-length blots see Suppl. Fig. S3. (B) Adipocytes and myocytes were
cultured for 24h in serum-free and low glucose medium and stimulated in absence or presence of
10 nM insulin (Ins) for 30 min. Glucose uptake was measured during the last 10 min by
incorporation of 2-deoxy-glucose into the cells. Results were expressed as percentage of
stimulation over basal of control cells (adipocytes: 5.3±0.3 pmol glucose/mg protein/10 min;
myocytes: 45.8±3.2 pmol glucose/mg protein/10 min) and are means ± SEM of 5 independent
experiments. (C) Adipocytic and (D) myocytic cell lines were serum-starved overnight and then
incubated in absence or presence of 10 nM insulin for 10 min. Lysates were analyzed by
Western-blot with the corresponding antibodies against total and/or phosphorylated forms of
IRS1(Tyr 608), AKT(Ser473), ERK1/2(Thr202/Tyr204), GRK2 and β-actin. Representative
immunoblots of 4-6 independent experiments and densitometric analysis are shown in A, C and
D. *, p < 0.01. For examples of full-length blots see Suppl. Fig. S3. Data in A, C and D were
normalized with the indicated controls and results are expressed as % over basal (control cells
transfected with empty vector).
Fig. 2. Modulation of insulin signalling by GRK2 levels involves the formation of dynamic
GRK2/IRS1 complexes.
Immortalized murine white adipocytes were transiently transfected with empty vector (control,
C), pcDNA3-GRK2-neo (+), or shGRK2-RNAi (-), to upregulate or knock-down GRK2
expression, respectively. (A) Adipocytic cell lines were serum-starved overnight and then
incubated in absence or presence of 10 nM insulin for 10 min. Total protein from adipocytic cells
(1mg) was immunoprecipitated with the anti-IRS1 or anti-IgG antibodies, and the resulting
immune complexes analyzed by Western-blot with the corresponding antibodies against GRK2
and IRS1. (B) Samples of eWAT were obtained at the indicated times from Wt and GRK2+/-
adult male mice undergoing Ins infusion (1 IU/kg body weight) as detailed in Methods. Lysates
were immunoprecipitated with an anti-IRS1 antibody, and the resulting immune complexes
analyzed by Western-blot with the corresponding antibodies against GRK2 and IRS1. (C) The
same lysates were analyzed by Western-blot with the corresponding antibodies against total
and/or phosphorylated forms of IRS1(Tyr 608), AKT(Ser473) and β-actin. Representative
immunoblots of 4-6 independent experiments and densitometric analysis are shown. Data were
normalized with the indicated controls, and results obtained in non-stimulated control cells (A)
or Wt animals (B, C) taken as 100%. *, p < 0.01.
Fig. 3. GRK2 protein expression is enhanced under insulin resistance conditions
(A) eWAT, liver and muscle from 3 or 9-month-old male mice, fed on a HFD for 12 weeks or
treated with TNFα (0.1 µg/kg body weight) for 48h; (B) eWAT from wild-type (Wt) and ob/ob
mice; (C) insulin sensitive and insulin resistant human adipocytes, and (D) PBMCs collected
from blood samples of insulin-sensitive individuals and insulin-resistant patients (see Suppl.
Table 2) were lysed and subjected to immunoblot analysis with antibodies against GRK2 and β-
actin as a loading control. Data in A, B and C are mean±SEM of 4 independent experiments.

Control of insulin resistance and obesity by GRK2
Data in A were normalized with the indicated control and results expressed as % over basal (3
month-Wt mice). Results in D represent the mean±SEM of 10 controls and 25 metabolic
syndrome patients. Representative blots are shown. * p < 0.01.
Fig. 4. GRK2+/-
mice do not develop TNFα-induced insulin resistance
Wt (white symbols, solid lines) and GRK2+/-
(black symbols, dotted lines) adult male mice were
treated with TNFα (0.1 µg/kg body weight, circles) or vehicle (100 µl PBS plus 0.1% BSA,
squares) for 48 h. (A) GTTs were performed on animals that had been fasted for 24h and were
given an injection of glucose (2 g/kg body weight). (B) Circulating insulin levels during the
GTTs. (C) ITTs were performed on fed male mice that had received insulin (0.8 IU/kg body
weight). Glucose concentration was determined in blood samples obtained from the tail vein.
Results are means±SEM of 8 animals for each group. Histograms on the right show the
incremental area under the curve. *, p < 0.01. (D) Wild-type (Wt) and GRK2+/-
male mice were
treated or not with insulin (1 IU/kg body weight) for 15 min. and eWAT, liver and muscle were
removed. Lysates were subjected to Western-blot with the indicated antibodies against total and
phosphorylated AKT(Ser473), GRK2 and β-actin. Representative immunoblots out of 4
independent experiments are shown. See Suppl. Fig. S2 and Suppl. Table 1 for detailed
quantification of these data. For examples of full-length blots see Suppl. Fig. S4.
Fig. 5. GRK2 downregulation prevents the development of aging-associated insulin
resistance.
(A) GTTs were performed on Wt (white circles, solid lines) and GRK2+/-
(black circles, dotted
lines) 3-month-old male mice as in Fig. 4A. (B) Circulating insulin levels during the GTTs. (C)
ITTs were performed on Wt (white circles) and GRK2+/-
(black circles) 3-month-old male mice
as in Fig. 4C. (D, E, F) GTTs and ITTs were performed as in previous panels in Wt (white
circles) and GRK2+/-
(black circles) 9-month-old male mice. *, p < 0.01. (G) Lysates from Wild-
type (Wt) and GRK2+/-
3 and 9-month-old male mice treated or not with insulin, were processed
as in Fig. 4D. Representative immunoblots out of 4 independent experiments are shown. See
Suppl. Fig. S2 and Suppl. Table 1 for detailed quantification of these data.
Fig. 6. GRK2+/-
mice display protection against diet-induced obesity. Wt (white symbols, solid lines) and GRK2
+/- (black symbols, dotted lines) male mice were fed a
CD or HFD for 12 weeks. (A) Body weight evolution and (A) Body weight evolution and (B)
percentage of change in body weight during the 12 weeks of treatment. (C) Daily food intake on
CD or HFD. (D) Paraffin-embedded sections of epididymal fat pads from Wt and GRK2+/-
male
mice fed on CD or HFD stained with haematoxylin and eosin (Magnification 10x; scale bar
50µm for all pictures). Relative adipocyte size was calculated as detailed in Methods. Data are
mean±SEM of 10-20 animals per group. (E) GTTs (circles, HFD; squares, CD) and (F) ITTs
were performed as in Fig. 4A and 4C, respectively. *, p < 0.01. (G) Lysates from Wt and
GRK2+/-
male mice fed CD or HFD for 12 weeks treated or not with insulin were processed as in
Fig. 4D. Representative immunoblots out of 4 independent experiments are shown. See Suppl.
Fig. S2 and Suppl. Table 1 for detailed quantification of these data.
Fig. 7. GRK2+/-
mice exhibit reduced adiposity.
(A) Body weight evolution in male or female Wt (white circles, solid lines) and GRK2+/-
(black
circles, dotted lines) mice between 2 and 15 months of age. (B) Percentage of change in body
Control of insulin resistance and obesity by GRK2
weight during 13 months. (C) Daily food intake in 3 and 9-month-old male Wt and GRK2+/-
mice. (D) Representative photograph showing 9-month-old Wt or GRK2+/-
male mice (E)
Adiposity in 9 month-old male mice measured by MNRI; white represents areas with more than
50% fat. (F) Quantification of several MNRI measurements. Results were expressed as
proportion between fat volumes vs total mouse volume (fat vol/total vol). (G) eWAT weight in 3
and 9-month-old male Wt and GRK2+/-
mice. (H) Paraffin-embedded sections of WAT:
retroperitoneal (Ret), epididymal (Epi) and inguinal (Ing) fat pads from 9-month-old male Wt
and GRK2+/-
mice stained with haematoxylin and eosin. (Magnification 10x; scale bar 50µm for
all pictures). Relative adipocyte size was calculated as in Fig. 6D. Data are mean ± SEM of 5-30
animals per group. *, p < 0.01.

Control of insulin resistance and obesity by GRK2
Control of insulin resistance and obesity by GRK2

Control of insulin resistance and obesity by GRK2
Control of insulin resistance and obesity by GRK2

Control of insulin resistance and obesity by GRK2
Control of insulin resistance and obesity by GRK2

Control of insulin resistance and obesity by GRK2