fy14 results presentation
DESCRIPTION
Suzlon Energy Limited FY14 Results Presentation 30th May 2014TRANSCRIPT
www.suzlon.com
Senvion offshore wind farm in Thornton Bank, Belgium
Suzlon Energy LimitedFY14 Results Presentation30th May 2014
1
www.suzlon.com
Disclaimer
This presentation and the accompanying slides (the “Presentation”), which have been prepared by Suzlon Energy Limited (the “Company”), have been prepared solely for information purposes and do not constitute any offer, recommendation or invitation to purchase or subscribe for any securities, and shall not form the basis or be relied on in connection with any contract or binding commitment whatsoever. No offering of securities of the Company will be made except by means of a statutory offering document containing detailed information about the Company.
This Presentation has been prepared by the Company based on information and data which the Company considers reliable, but the Company makes no representation or warranty, express or implied, whatsoever, and no reliance shall be placed on, the truth, accuracy, completeness, fairness and reasonableness of the contents of this Presentation. This Presentation may not be all inclusive and may not contain all of the information that you may consider material. Any liability in respect of the contents of, or any omission from, this Presentation is expressly excluded.
Certain matters discussed in this Presentation may contain statements regarding the Company’s market opportunity and business prospects that are individually and collectively forward-looking statements. Such forward-looking statements are not guarantees of future performance and are subject to known and unknown risks, uncertainties and assumptions that are difficult to predict. These risks and uncertainties include, but are not limited to, the performance of the Indian economy and of the economies of various international markets, the performance of the wind power industry in India and world-wide, competition, the company’s ability to successfully implement its strategy, the Company’s future levels of growth and expansion, technological implementation, changes and advancements, changes in revenue, income or cash flows, the Company’s market preferences and its exposure to market risks, as well as other risks. The Company’s actual results, levels of activity, performance or achievements could differ materially and adversely from results expressed in or implied by this Presentation. The Company assumes no obligation to update any forward-looking information contained in this Presentation. Any forward-looking statements and projections made by third parties included in this Presentation are not adopted by the Company and the Company is not responsible for such third party statements and projections.
No offering of the Company’s securities will be registered under the U.S. Securities Act of 1933, as amended (the “Securities Act”). Accordingly, unless an exemption from registration under the Securities Act is available, the Company’s securities may not be offered, sold, resold, delivered or distributed, directly or indirectly, into the United States or to, or for the account or benefit of, any U.S. Person (as defined in regulation S under the Securities Act).
The distribution of this document in certain jurisdictions may be restricted by law and persons into whose possession this presentation comes should inform themselves about and observe any such restrictions.
2
www.suzlon.com3
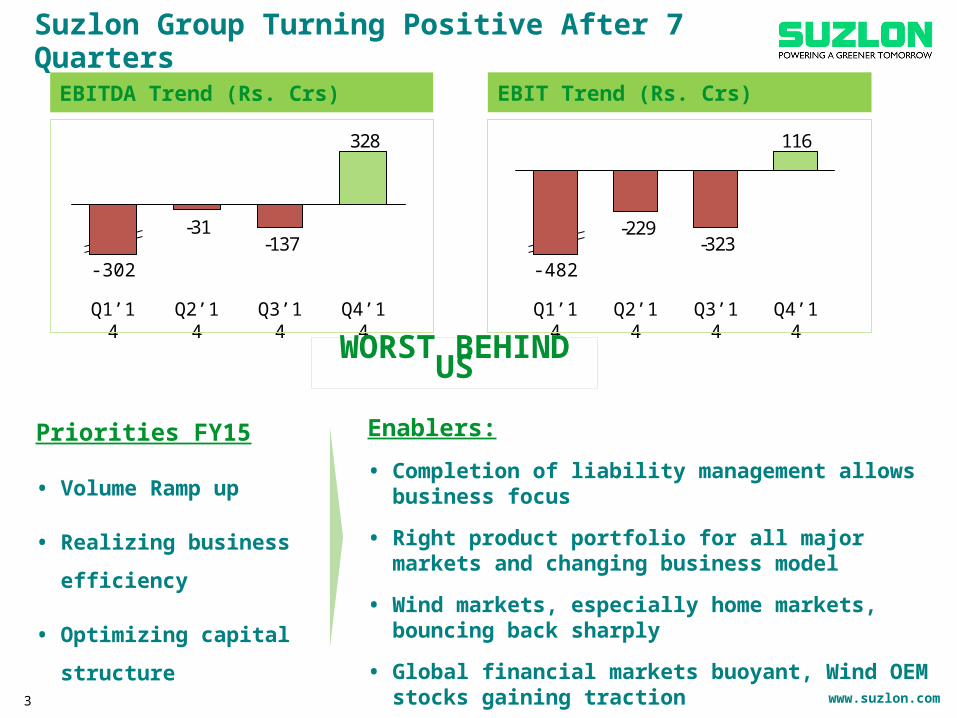
-137-31
328
Q1’14 Q3’14Q2’14
-302
Q4’14
116
-323-229
Q4’14Q3’14Q2’14Q1’14
-482
EBITDA Trend (Rs. Crs) EBIT Trend (Rs. Crs)
WORST BEHIND US
Priorities FY15
• Volume Ramp up
• Realizing business efficiency
• Optimizing capital structure
Enablers:
• Completion of liability management allows business focus
• Right product portfolio for all major markets and changing business model
• Wind markets, especially home markets, bouncing back sharply
• Global financial markets buoyant, Wind OEM stocks gaining traction
Suzlon Group Turning Positive After 7 Quarters
www.suzlon.com
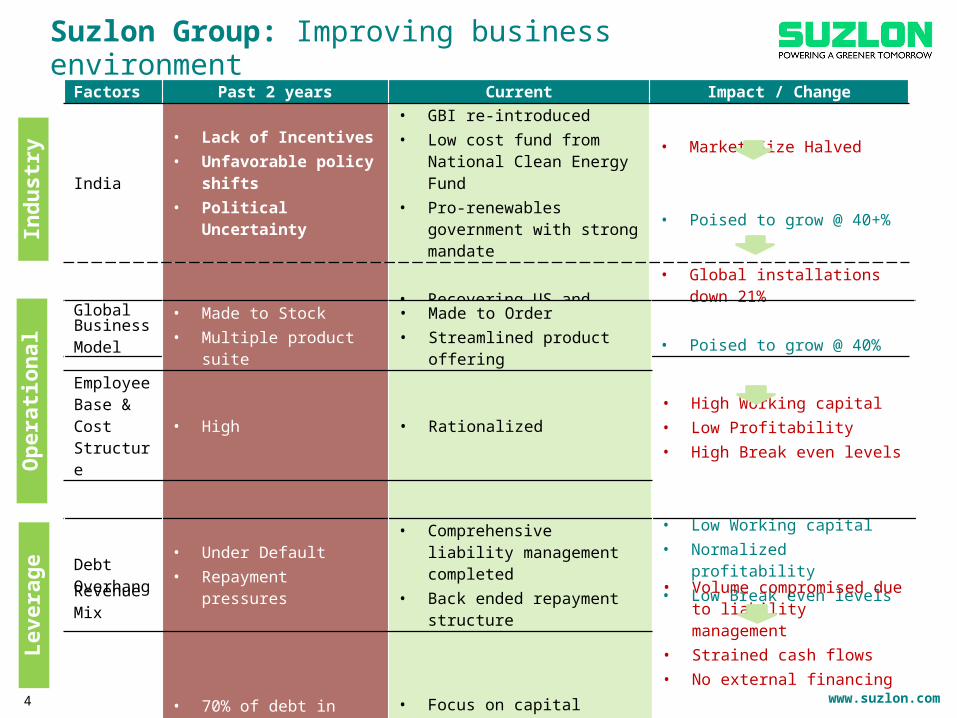
Suzlon Group: Improving business environment
4
Factors Past 2 years Current Impact / Change
India• Lack of Incentives• Unfavorable policy shifts• Political Uncertainty
• GBI re-introduced• Low cost fund from National
Clean Energy Fund• Pro-renewables government
with strong mandate
• Market Size Halved
• Poised to grow @ 40+%
Global • Global Slowdown • Recovering US and Europe economies
• Global installations down 21%
• Poised to grow @ 40%
Business Model
• Made to Stock• Multiple product suite
• Made to Order• Streamlined product offering
• High Working capital • Low Profitability• High Break even levels
• Low Working capital• Normalized profitability• Low Break even levels
Employee Base & Cost Structure
• High • Rationalized
Revenue Mix
• Less profitable legacy orders
• Long pending orders for old products and LDs for delays
• Legacy orders executed in full• Profitable current orders
Debt Overhang
• Under Default• Repayment pressures
• Comprehensive liability management completed
• Back ended repayment structure • Volume compromised due to liability management
• Strained cash flows• No external financing
• Complete volume focus• Improved liquidity• Capital rebalancing opportunity
Capital Structure
• 70% of debt in India, contributing less than 15% of revenue (FY14)
• Focus on capital rebalancing• Low cost FX funds to pay down
high cost domestic debt
Indu
stry
Leve
rage
Ope
ratio
nal
www.suzlon.com
Key highlights - FY14
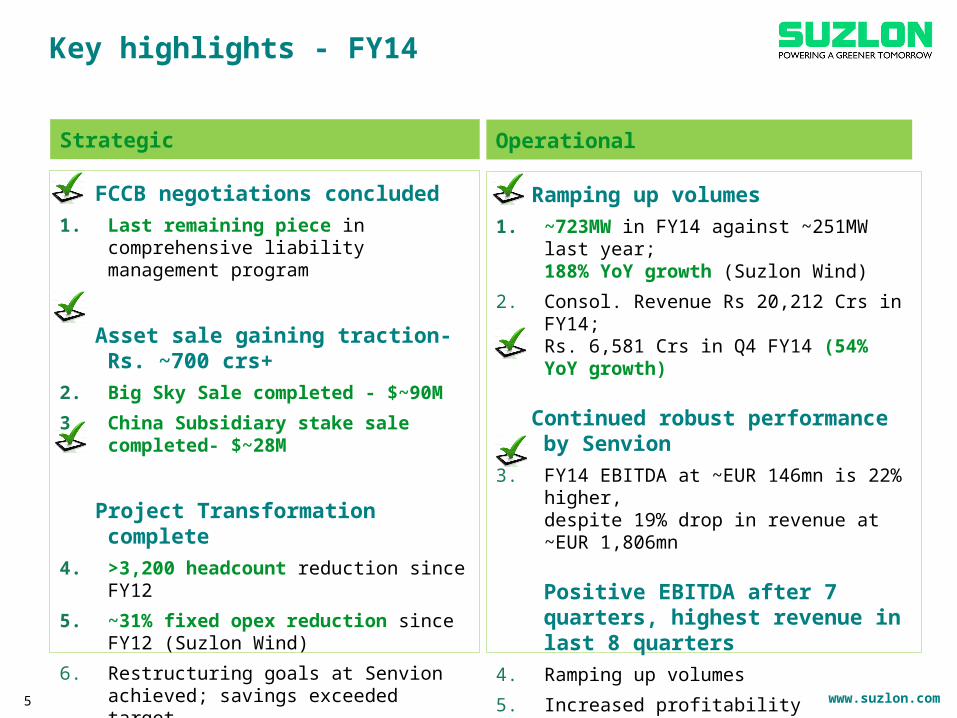
Strategic
FCCB negotiations concluded1. Last remaining piece in comprehensive liability
management program
Asset sale gaining traction- Rs. ~700 crs+2. Big Sky Sale completed - $~90M
3. China Subsidiary stake sale completed- $~28M
Project Transformation complete4. >3,200 headcount reduction since FY12
5. ~31% fixed opex reduction since FY12 (Suzlon Wind)
6. Restructuring goals at Senvion achieved; savings exceeded target
7. Working capital rationalized to ~3.6%
Operational
Ramping up volumes1. ~723MW in FY14 against ~251MW last year;
188% YoY growth (Suzlon Wind)
2. Consol. Revenue Rs 20,212 Crs in FY14; Rs. 6,581 Crs in Q4 FY14 (54% YoY growth)
Continued robust performance by Senvion3. FY14 EBITDA at ~EUR 146mn is 22% higher,
despite 19% drop in revenue at ~EUR 1,806mn
Positive EBITDA after 7 quarters, highest revenue in last 8 quarters
4. Ramping up volumes
5. Increased profitability
6. Favorable geographic and product mix
7. Cost efficiencies from group wide restructuring efforts
5
www.suzlon.com6
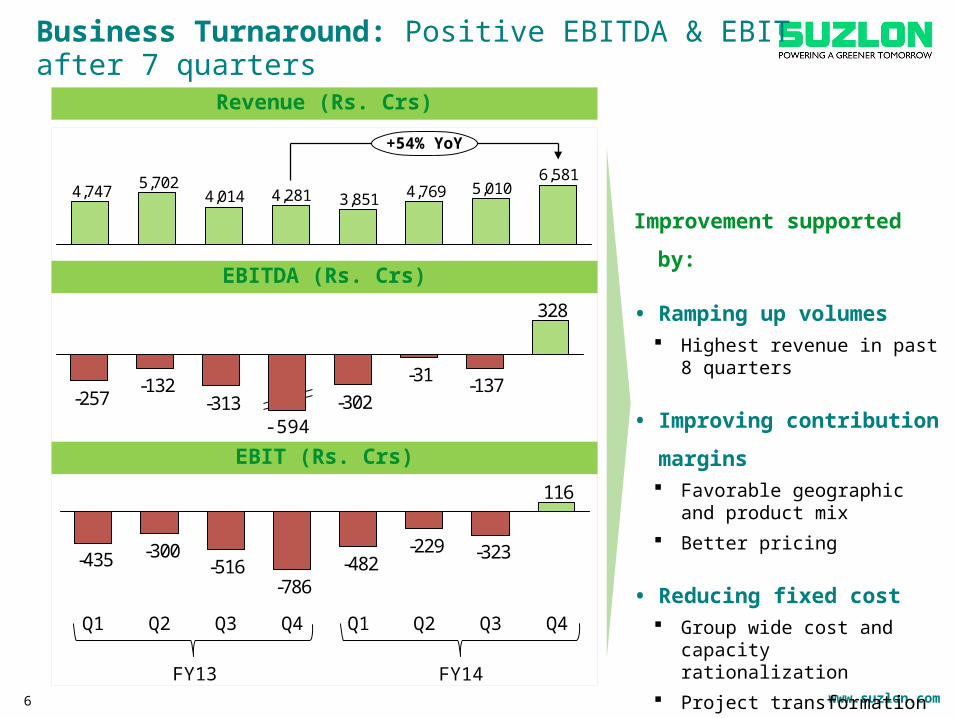
Business Turnaround: Positive EBITDA & EBIT after 7 quarters
Improvement supported by:
• Ramping up volumes Highest revenue in past 8 quarters
• Improving contribution margins Favorable geographic and product
mix Better pricing
• Reducing fixed cost Group wide cost and capacity
rationalization Project transformation
Revenue (Rs. Crs)
6,5815,0104,7693,8514,2814,014
5,7024,747
+54% YoY
EBITDA (Rs. Crs)328
-137-31-302-313
-132-257
-594
116
-323-229-482
-786-516
-300-435
Q3 Q4Q2Q1Q4Q3Q2Q1
EBIT (Rs. Crs)
FY13 FY14
www.suzlon.com
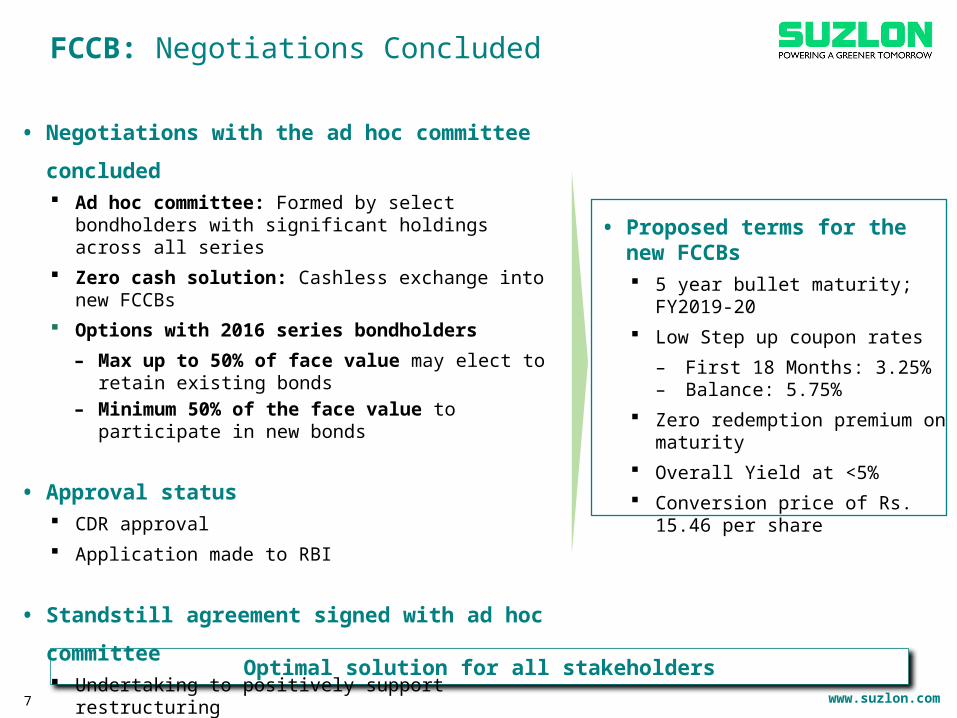
FCCB: Negotiations Concluded
• Proposed terms for the new FCCBs 5 year bullet maturity; FY2019-20 Low Step up coupon rates
– First 18 Months: 3.25% – Balance: 5.75%
Zero redemption premium on maturity
Overall Yield at <5% Conversion price of Rs. 15.46 per
share
Optimal solution for all stakeholders7
• Negotiations with the ad hoc committee concluded Ad hoc committee: Formed by select bondholders with
significant holdings across all series Zero cash solution: Cashless exchange into new FCCBs Options with 2016 series bondholders
– Max up to 50% of face value may elect to retain existing bonds
– Minimum 50% of the face value to participate in new bonds
• Approval status CDR approval Application made to RBI
• Standstill agreement signed with ad hoc committee Undertaking to positively support restructuring Desists from taking any action deterring implementation Valid till 15th Aug’14: Sufficient time to implement the proposal
www.suzlon.com8
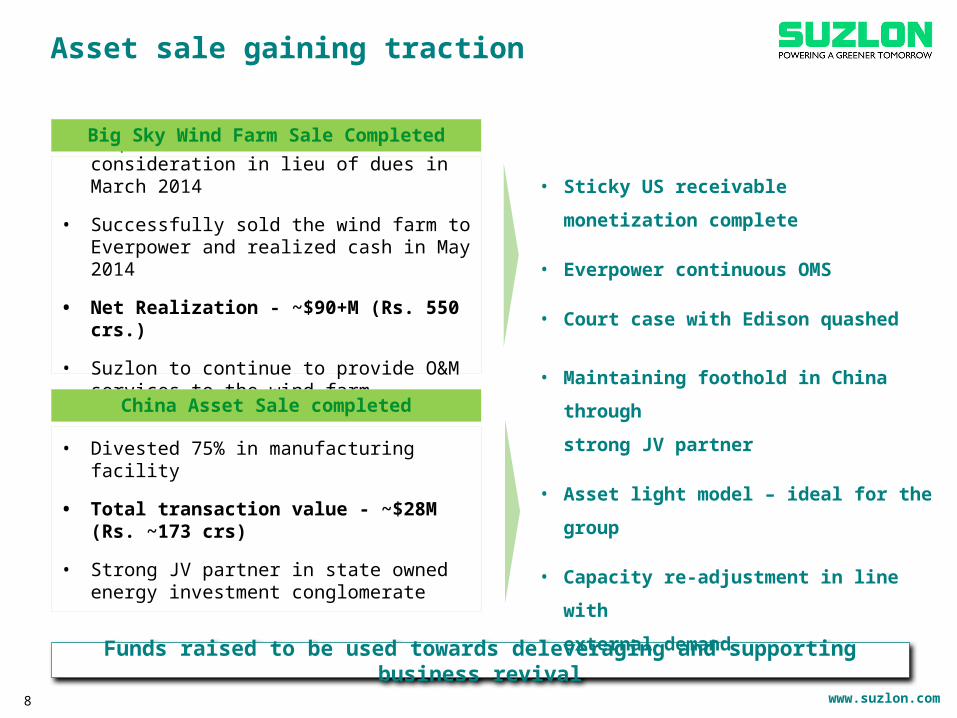
Asset sale gaining traction
Funds raised to be used towards deleveraging and supporting business revival
• Acquired wind farm for token consideration in lieu of dues in March 2014
• Successfully sold the wind farm to Everpower and realized cash in May 2014
• Net Realization - ~$90+M (Rs. 550 crs.)
• Suzlon to continue to provide O&M services to the wind farm
Big Sky Wind Farm Sale Completed
• Divested 75% in manufacturing facility
• Total transaction value - ~$28M (Rs. ~173 crs)
• Strong JV partner in state owned energy investment conglomerate
China Asset Sale completed
• Sticky US receivable monetization complete
• Everpower continuous OMS
• Court case with Edison quashed
• Maintaining foothold in China through
strong JV partner
• Asset light model – ideal for the group
• Capacity re-adjustment in line with
external demand
www.suzlon.com
Suzlon windfarm at Arataci, Brazil
9
Group Business Performance
www.suzlon.com
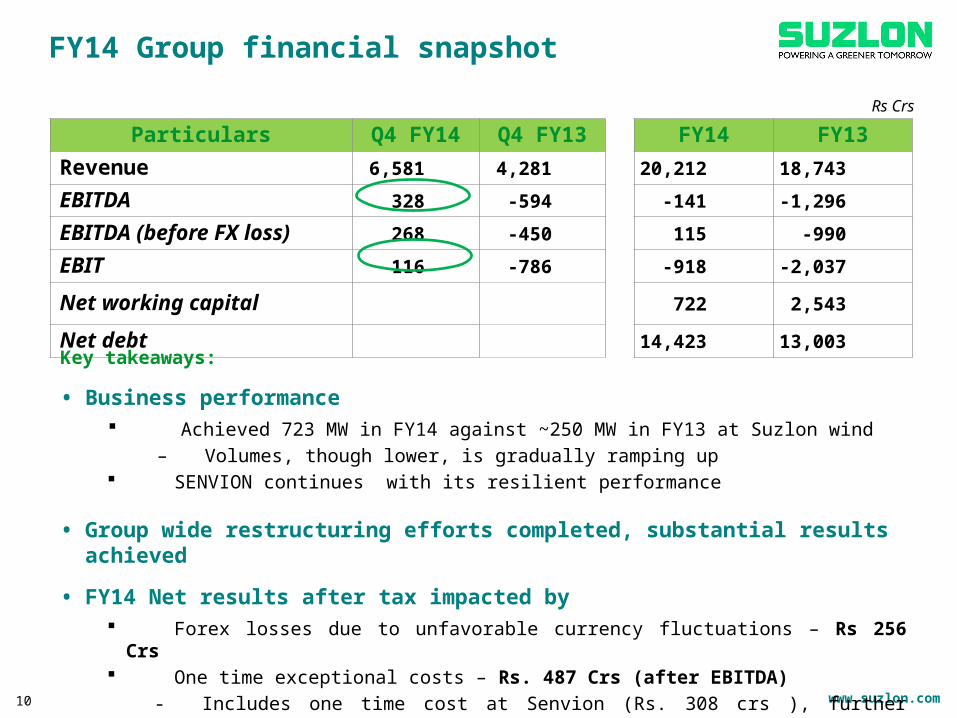
FY14 Group financial snapshot
Particulars Q4 FY14 Q4 FY13 FY14 FY13Revenue 6,581 4,281 20,212 18,743EBITDA 328 -594 -141 -1,296EBITDA (before FX loss) 268 -450 115 -990EBIT 116 -786 -918 -2,037Net working capital 722 2,543
Net debt 14,423 13,003
Rs Crs
Key takeaways:
• Business performance Achieved 723 MW in FY14 against ~250 MW in FY13 at Suzlon wind
– Volumes, though lower, is gradually ramping up SENVION continues with its resilient performance
• Group wide restructuring efforts completed, substantial results achieved
• FY14 Net results after tax impacted by Forex losses due to unfavorable currency fluctuations – Rs 256 Crs One time exceptional costs – Rs. 487 Crs (after EBITDA)
- Includes one time cost at Senvion (Rs. 308 crs ), further impairment of US receivables (Rs. 217 crs) and profit on stake sale of China subsidiary (Rs.
38 crs)10
www.suzlon.com
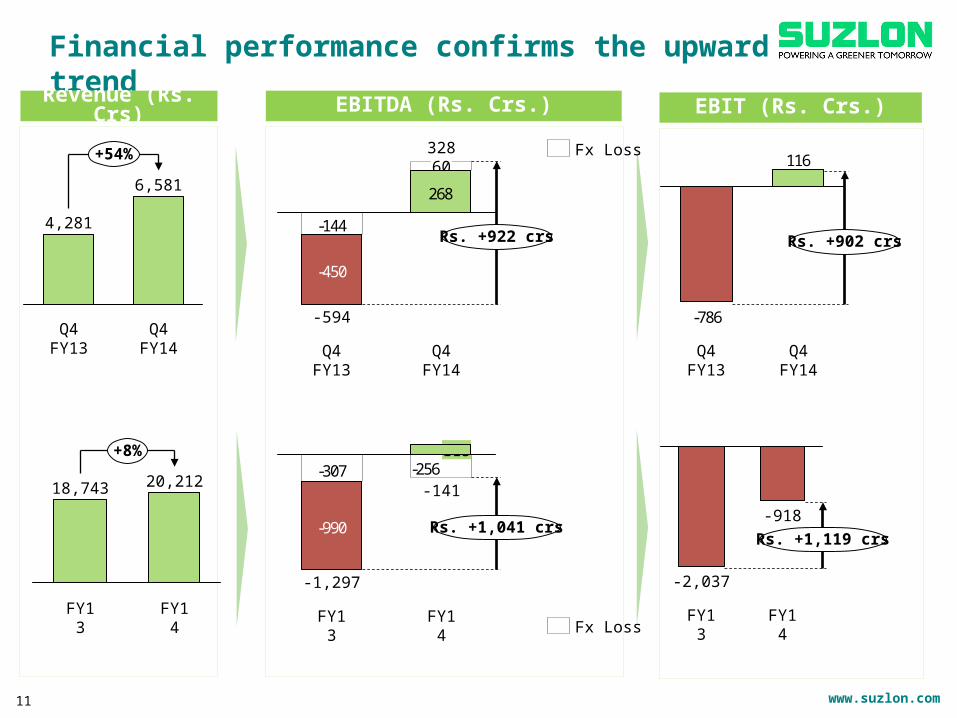
Financial performance confirms the upward trend
11
+54%
Q4 FY14
6,581
Q4 FY13
4,281 -144
268
-450
328
Q4 FY14
60
Q4 FY13
-594
Rs. +922 crs
116
-786
Rs. +902 crs
Q4 FY14Q4 FY13
+8%
FY14
20,212
FY13
18,743-256-307
-990
-141
FY14
115
FY13
-1,297
Rs. +1,041 crs-918
Rs. +1,119 crs
FY14FY13
-2,037
Revenue (Rs. Crs) EBITDA (Rs. Crs.) EBIT (Rs. Crs.)
Fx Loss
Fx Loss
www.suzlon.com
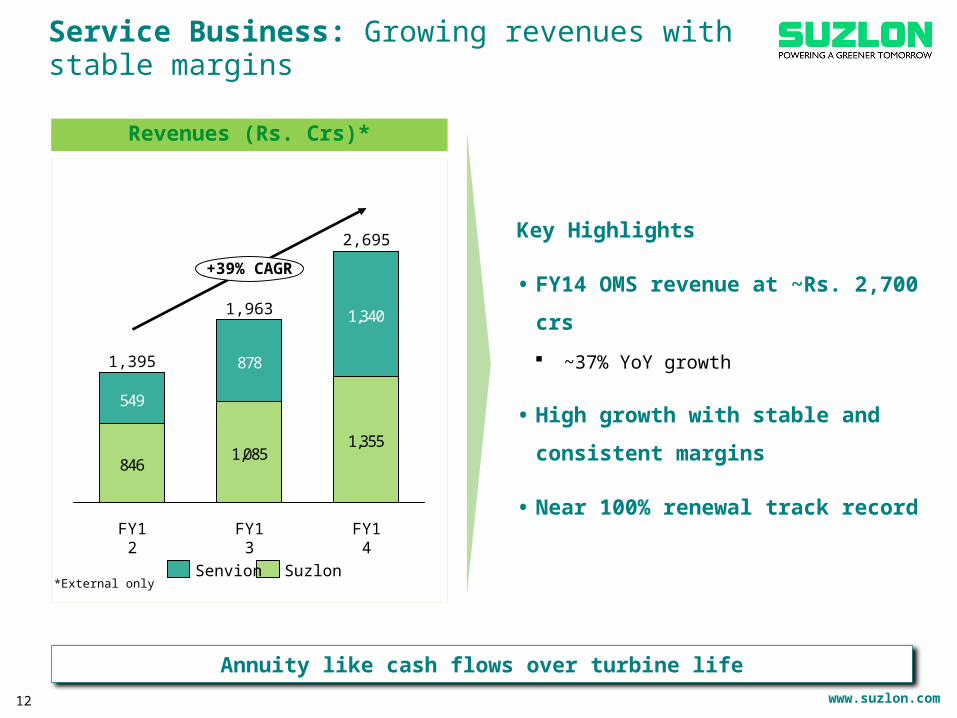
Service Business: Growing revenues with stable margins
Key Highlights
• FY14 OMS revenue at ~Rs. 2,700 crs
~37% YoY growth
• High growth with stable and consistent
margins
• Near 100% renewal track record
12
Revenues (Rs. Crs)*
Annuity like cash flows over turbine life
*External only
8461,085
1,355
549
878
1,340
FY14
2,695
+39% CAGR
FY13
1,963
FY12
1,395
SuzlonSenvion
www.suzlon.com13
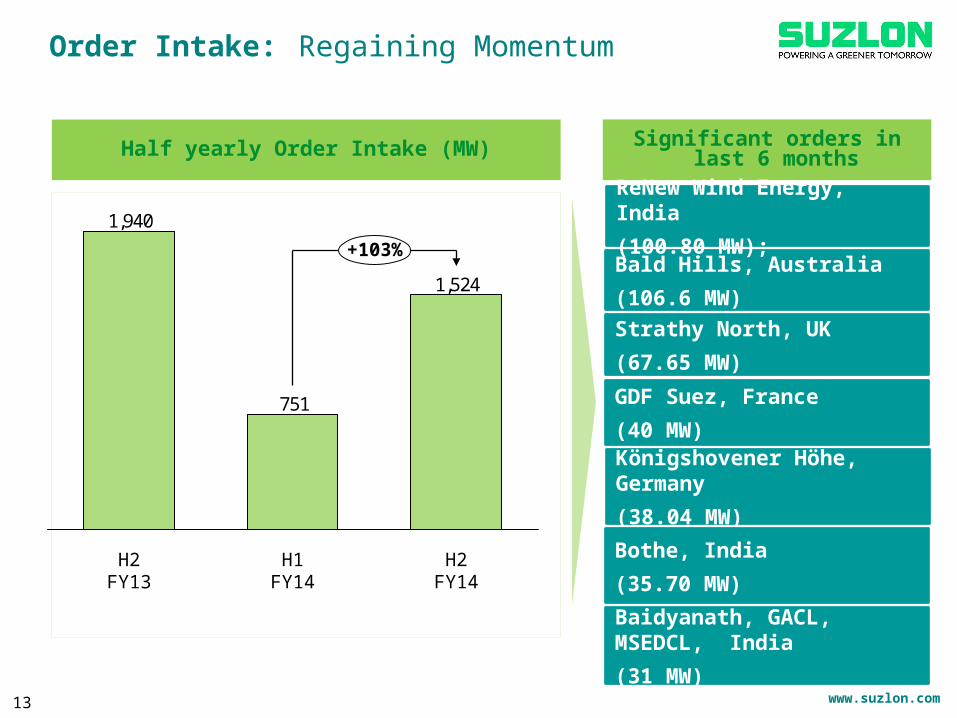
Half yearly Order Intake (MW)
Order Intake: Regaining Momentum
Significant orders in last 6 months
GDF Suez, France
(40 MW)
Bald Hills, Australia
(106.6 MW)
Baidyanath, GACL, MSEDCL, India
(31 MW)
1,524
751
1,940
H2 FY14H1 FY14H2 FY13
+103%
Strathy North, UK
(67.65 MW)
Königshovener Höhe, Germany
(38.04 MW)
Bothe, India
(35.70 MW)
ReNew Wind Energy, India
(100.80 MW);
www.suzlon.com
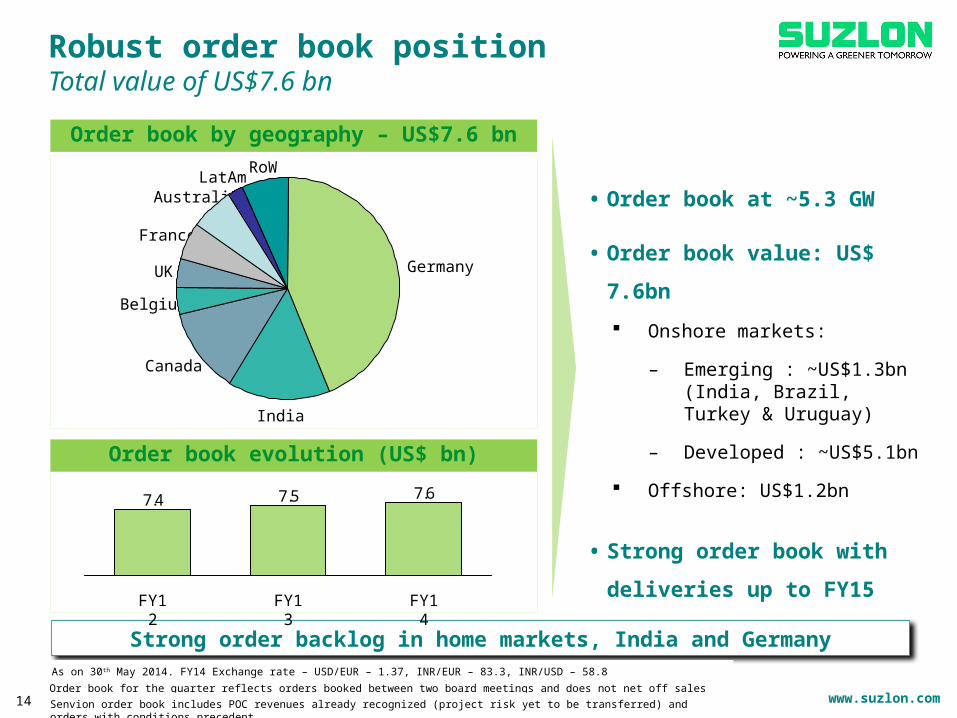
• Order book at ~5.3 GW
• Order book value: US$ 7.6bn
Onshore markets:
– Emerging : ~US$1.3bn (India, Brazil, Turkey & Uruguay)
– Developed : ~US$5.1bn
Offshore: US$1.2bn
• Strong order book with deliveries
up to FY15
Robust order book positionTotal value of US$7.6 bn
Order book by geography – US$7.6 bn
Order book evolution (US$ bn)
Strong order backlog in home markets, India and Germany
France5%
UK 4%
Belgium 4%
Canada12%
India
15%
Germany44%
RoW
7%LatAm
2%Australia6%
7.67.57.4
FY14FY13FY12
Order book for the quarter reflects orders booked between two board meetings and does not net off sales of the next quarter14 Senvion order book includes POC revenues already recognized (project risk yet to be transferred) and orders with conditions precedent
As on 30th May 2014. FY14 Exchange rate – USD/EUR – 1.37, INR/EUR – 83.3, INR/USD – 58.8
www.suzlon.com
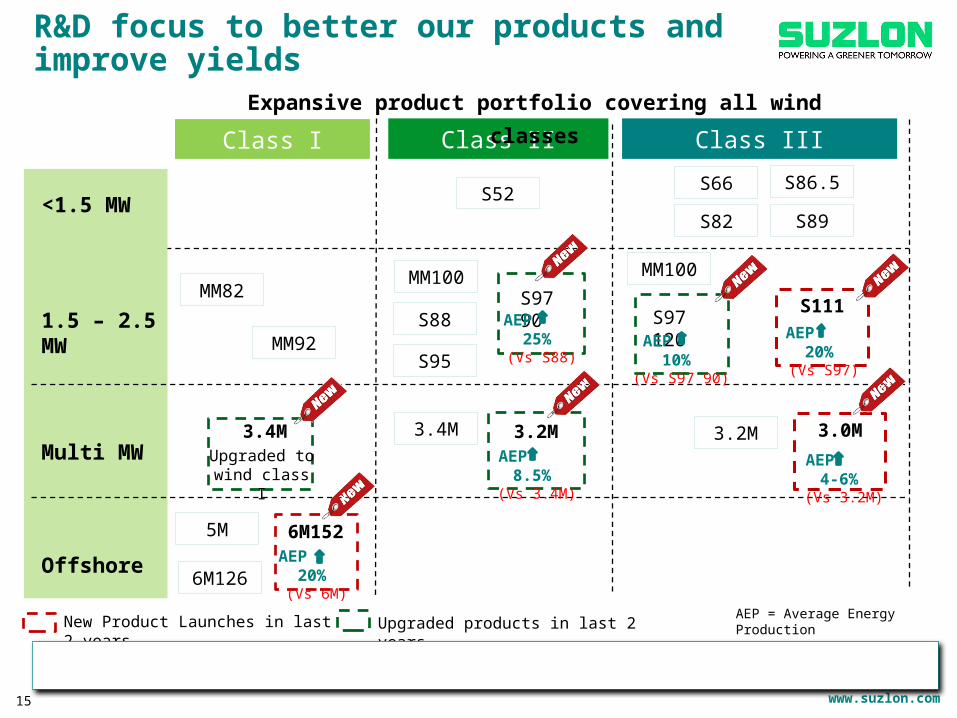
Class I Class II Class III
R&D focus to better our products and improve yields
<1.5 MW
1.5 – 2.5 MW
Multi MW
Offshore
S52
5M
6M126
S82
S86.5S66
S88
S95
MM82
MM92
MM100
S111
3.0M3.2M3.4M
S97 90
3.4M
MM100
3.2M
New Product Launches in last 2 years Upgraded products in last 2 years
S89
6M152
AEP 20% (Vs S97)
AEP 25% (Vs S88)
AEP 4-6% (Vs 3.2M)
AEP 8.5% (Vs 3.4M)
Upgraded to wind class I
AEP 20% (Vs 6M)
Warranty provisions consistently below 2%
AEP = Average Energy Production
Expansive product portfolio covering all wind classes
15
S97 120AEP 10%
(Vs S97 90)
www.suzlon.com
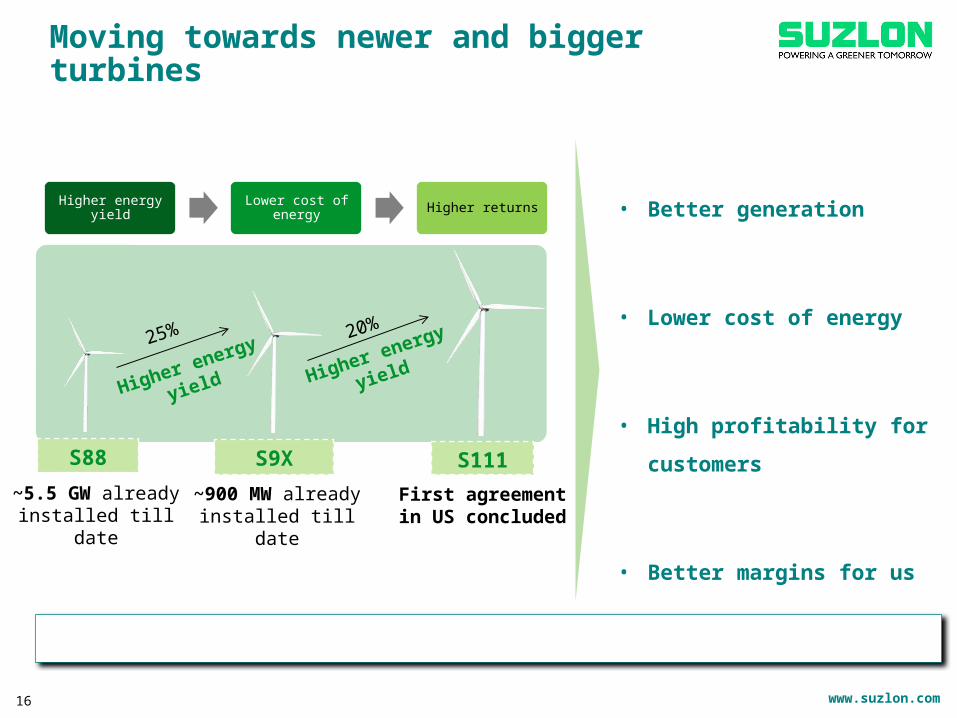
Moving towards newer and bigger turbines
16
25%
Higher energy yield20%
Higher energy yield
Higher energy yield Lower cost of energy Higher returns
S88 S111S9X
• Better generation
• Lower cost of energy
• High profitability for customers
• Better margins for us
First agreement in US concluded
~900 MW already installed till date
S111 best suited for low wind sites in India and US markets
~5.5 GW already installed till date
www.suzlon.com
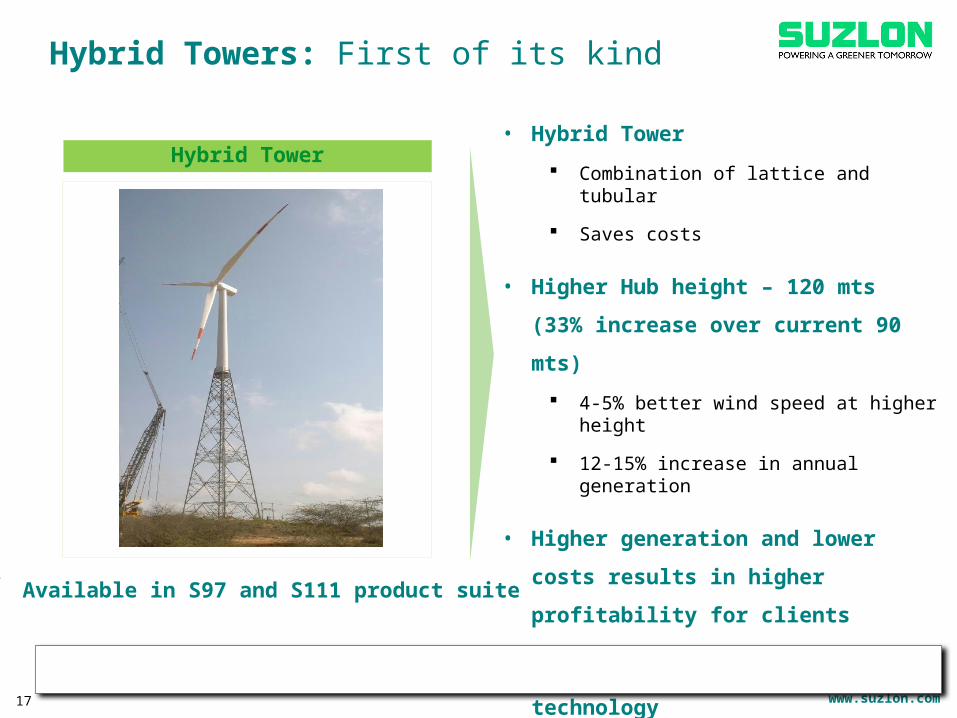
Hybrid Towers: First of its kind
17
• Hybrid Tower
Combination of lattice and tubular
Saves costs
• Higher Hub height – 120 mts (33% increase
over current 90 mts)
4-5% better wind speed at higher height
12-15% increase in annual generation
• Higher generation and lower costs results in
higher profitability for clients
• 3-4 years head start in this technology
Pre-commissioning done in May 2014
First order with new tower variant booked for 100MW
Game changer for low wind sites across the globe
Hybrid Tower
Available in S97 and S111 product suite
www.suzlon.com
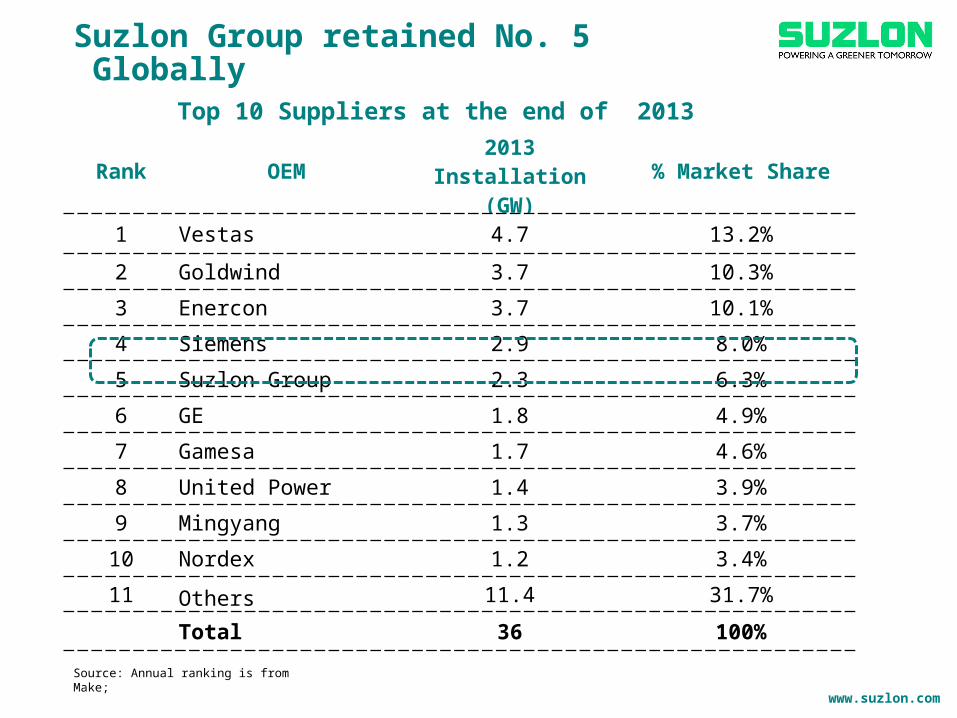
Rank OEM 2013 Installation (GW) % Market Share
1 Vestas 4.7 13.2%
2 Goldwind 3.7 10.3%
3 Enercon 3.7 10.1%
4 Siemens 2.9 8.0%
5 Suzlon Group 2.3 6.3%
6 GE 1.8 4.9%
7 Gamesa 1.7 4.6%
8 United Power 1.4 3.9%
9 Mingyang 1.3 3.7%
10 Nordex 1.2 3.4%
11 Others 11.4 31.7%
Total 36 100%
Suzlon Group retained No. 5 Globally
Top 10 Suppliers at the end of 2013
`
Source: Annual ranking is from Make;
www.suzlon.com19
Senvion: Stellar Performance
Clauen Onshore Wind Farm, Germany
www.suzlon.com
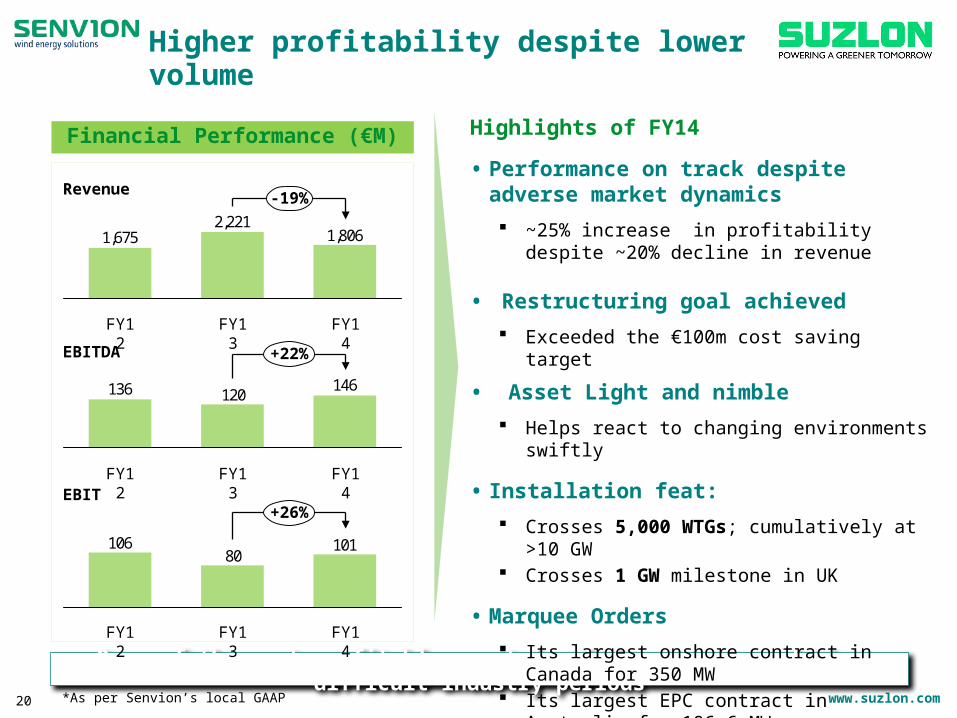
Higher profitability despite lower volume
Financial Performance (€M)
One of the most profitable asset in wind space, even during difficult industry periods20
1,8062,221
1,675
-19%
FY14FY12 FY13
146120136
+22%
FY13 FY14FY12
10180
106
+26%
FY13FY12 FY14
6.3% 3.6% 5.6%
8.1% 5.4% 8.1%
Highlights of FY14
• Performance on track despite adverse market dynamics ~25% increase in profitability despite ~20% decline in
revenue
• Restructuring goal achieved Exceeded the €100m cost saving target
• Asset Light and nimble Helps react to changing environments swiftly
• Installation feat: Crosses 5,000 WTGs; cumulatively at >10 GW Crosses 1 GW milestone in UK
• Marquee Orders Its largest onshore contract in Canada for 350 MW Its largest EPC contract in Australia for 106.6 MW
Revenue
EBITDA
EBIT
*As per Senvion’s local GAAP
www.suzlon.com
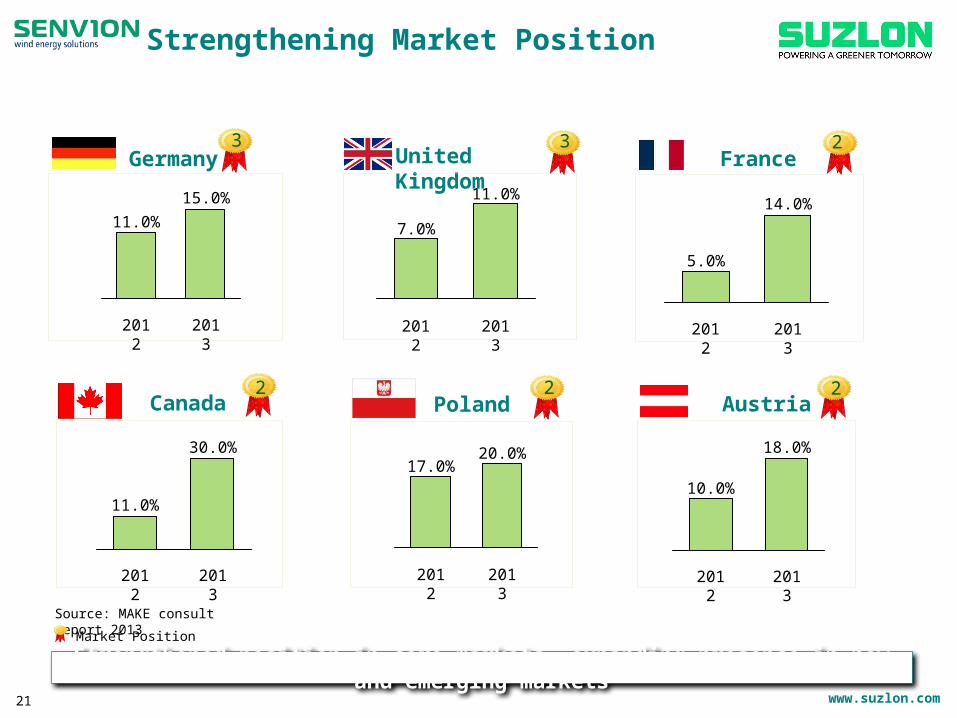
Strengthening Market Position
Source: MAKE consult report 2013
21
2013
30.0%
2012
11.0%
2013
15.0%
2012
11.0%
2013
11.0%
2012
7.0%
2013
14.0%
2012
5.0%
2013
20.0%
2012
17.0%
2013
18.0%
2012
10.0%
Canada
Germany United Kingdom
Poland
France
Austria
Strengthened position in core markets, expanding presence in new and emerging markets
3
2
3
2 2
2
Market Position
www.suzlon.com22
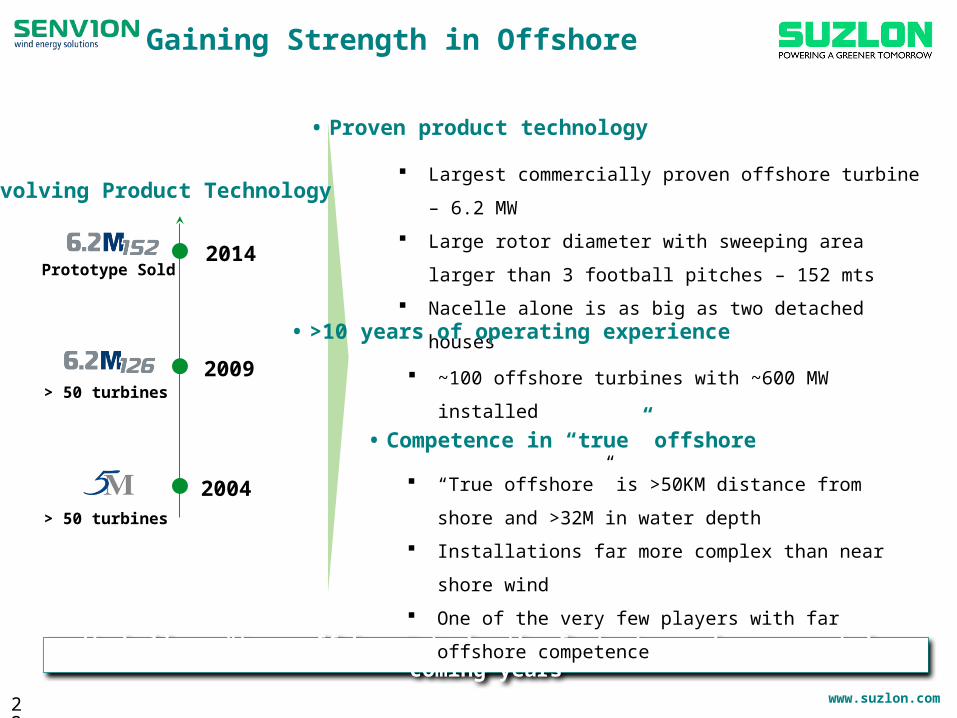
We believe “true offshore” to be the fastest growing segment in coming years
> 50 turbines
> 50 turbines
Prototype Sold
2004
2009
2014
Largest commercially proven offshore turbine – 6.2 MW
Large rotor diameter with sweeping area larger than 3 football
pitches – 152 mts
Nacelle alone is as big as two detached houses
• >10 years of operating experience
Evolving Product Technology
~100 offshore turbines with ~600 MW installed
“True offshore” is >50KM distance from shore and >32M in
water depth
Installations far more complex than near shore wind
One of the very few players with far offshore competence
• Competence in “true” offshore
• Proven product technology
Gaining Strength in Offshore
www.suzlon.com
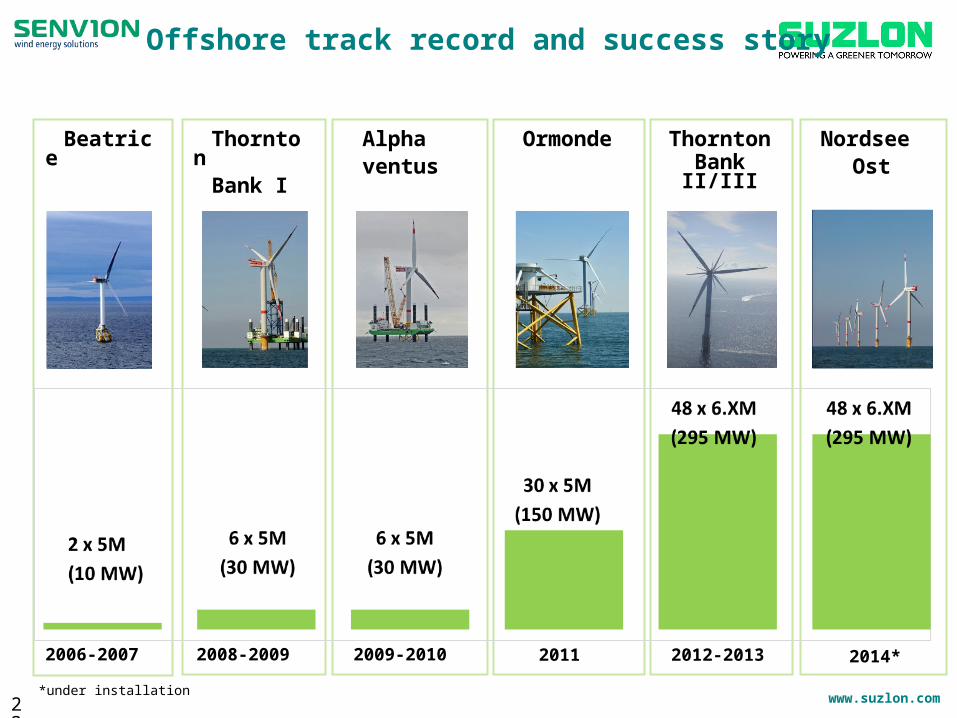
Beatrice
2006-2007
ThorntonBank I
2008-2009
Alphaventus
2009-2010
Ormonde
2011
Nordsee Ost
2014*
ThorntonBank II/III
2012-2013
*under installation23
Offshore track record and success story
www.suzlon.com
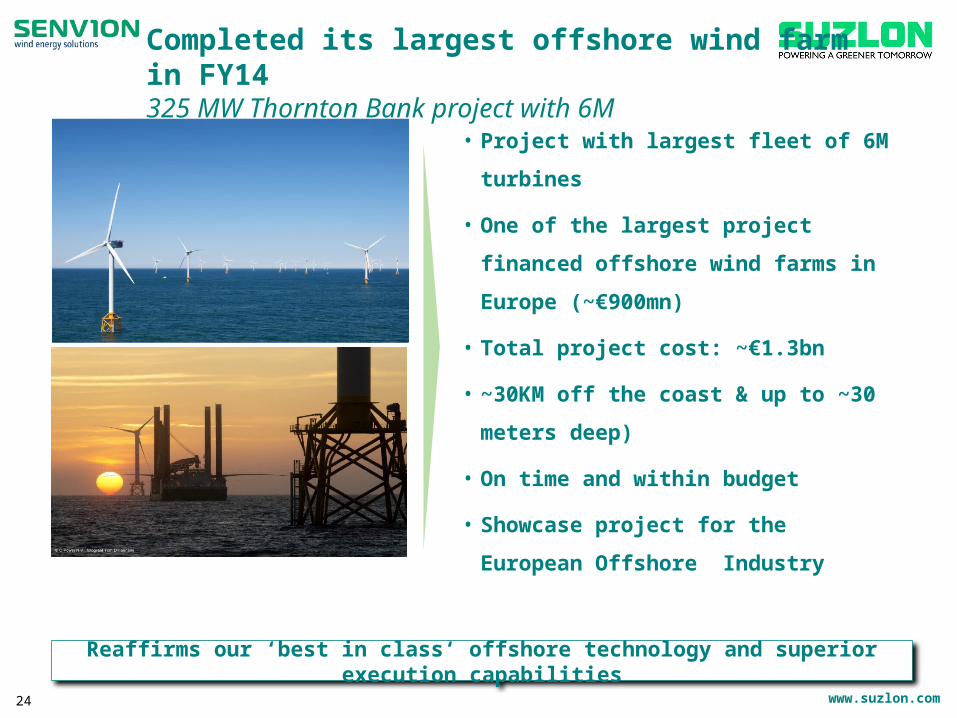
• Project with largest fleet of 6M turbines
• One of the largest project financed offshore
wind farms in Europe (~€900mn)
• Total project cost: ~€1.3bn
• ~30KM off the coast & up to ~30 meters deep)
• On time and within budget
• Showcase project for the European Offshore
Industry
Reaffirms our ‘best in class‘ offshore technology and superior execution capabilities
24
Completed its largest offshore wind farm in FY14325 MW Thornton Bank project with 6M
www.suzlon.com
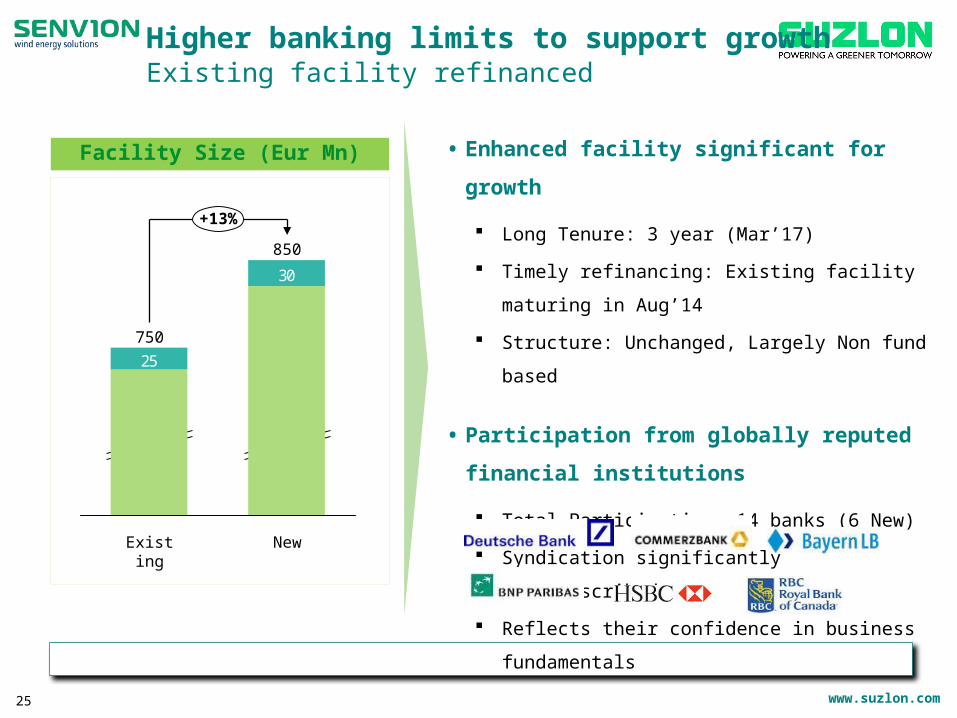
Enhanced facility to enable targeted growth for next 3 years
25
25
30
New
750
820
Existing
850
725
+13%
• Enhanced facility significant for growth
Long Tenure: 3 year (Mar’17)
Timely refinancing: Existing facility maturing in Aug’14
Structure: Unchanged, Largely Non fund based
• Participation from globally reputed financial
institutions
Total Participation: 14 banks (6 New)
Syndication significantly oversubscribed
Reflects their confidence in business fundamentals
Facility Size (Eur Mn)
Higher banking limits to support growthExisting facility refinanced
www.suzlon.com
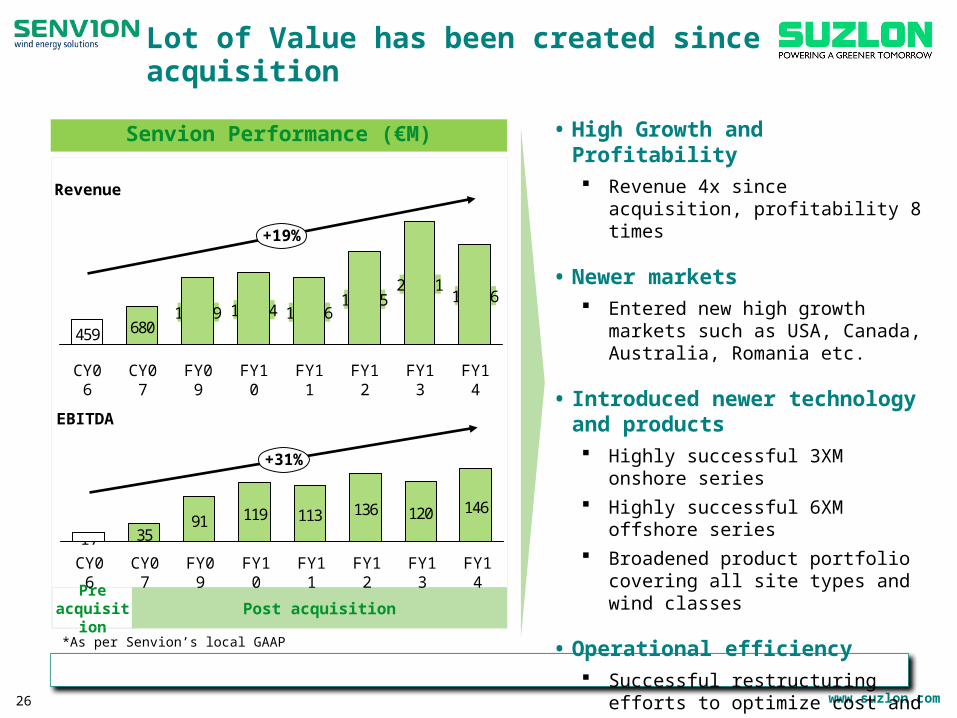
From regional to global player26
Pre acquisition Post acquisition
• High Growth and Profitability Revenue 4x since acquisition, profitability
8 times
• Newer markets Entered new high growth markets such as
USA, Canada, Australia, Romania etc.
• Introduced newer technology and products Highly successful 3XM onshore series Highly successful 6XM offshore series Broadened product portfolio covering all
site types and wind classes
• Operational efficiency Successful restructuring efforts to optimize
cost and manpower Rationalized working capital requirements
680459
+19%
FY14
2,2211,806
FY13FY12
1,3041,2091,675
FY11CY06 CY07 FY10FY09
1,216
91 119 113 136 12035
146
CY0617
FY13 FY14
+31%
FY12FY09CY07 FY11FY10
Senvion Performance (€M)
Revenue
EBITDA
*As per Senvion’s local GAAP
Lot of Value has been created since acquisition
www.suzlon.com27
Suzlon wind farm in Rajasthan, India
Comprehensive Liability Management Update
www.suzlon.com
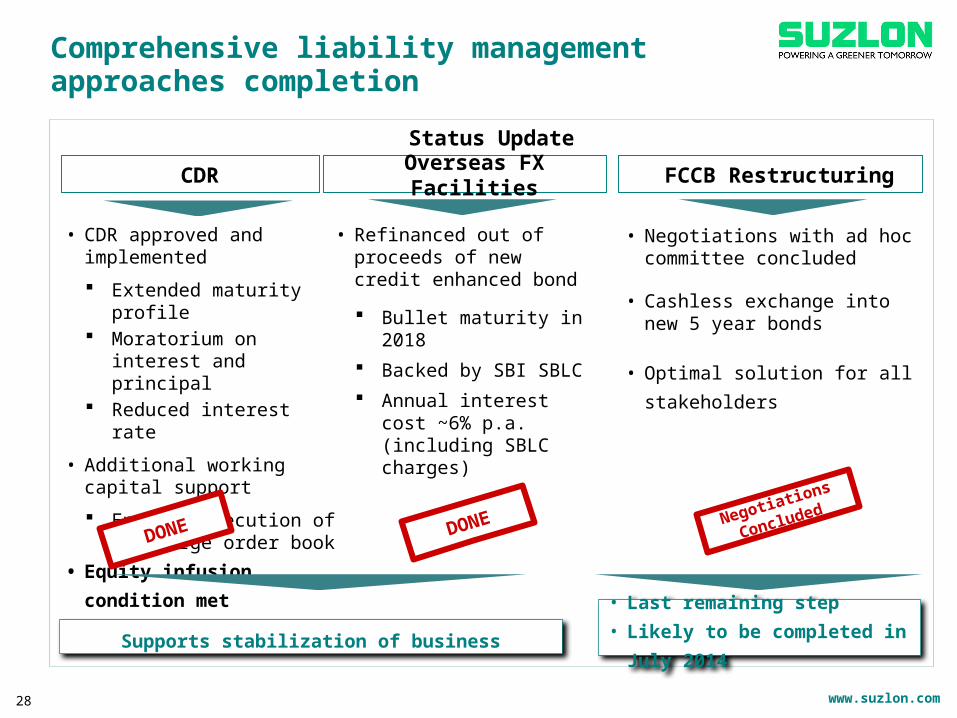
Status Update
FCCB RestructuringCDR Overseas FX Facilities
• CDR approved and implemented
Extended maturity profile Moratorium on interest and
principal Reduced interest rate
• Additional working capital support
Enables execution of our large order book
• Equity infusion condition met
• Negotiations with ad hoc committee concluded
• Cashless exchange into new 5 year bonds
• Optimal solution for all stakeholders
• Refinanced out of proceeds of new credit enhanced bond
Bullet maturity in 2018 Backed by SBI SBLC Annual interest cost ~6%
p.a. (including SBLC charges)
Comprehensive liability management approaches completion
Supports stabilization of business
Negotiations
Concluded
• Last remaining step• Likely to be completed in July 2014
DONEDONE
28
www.suzlon.com
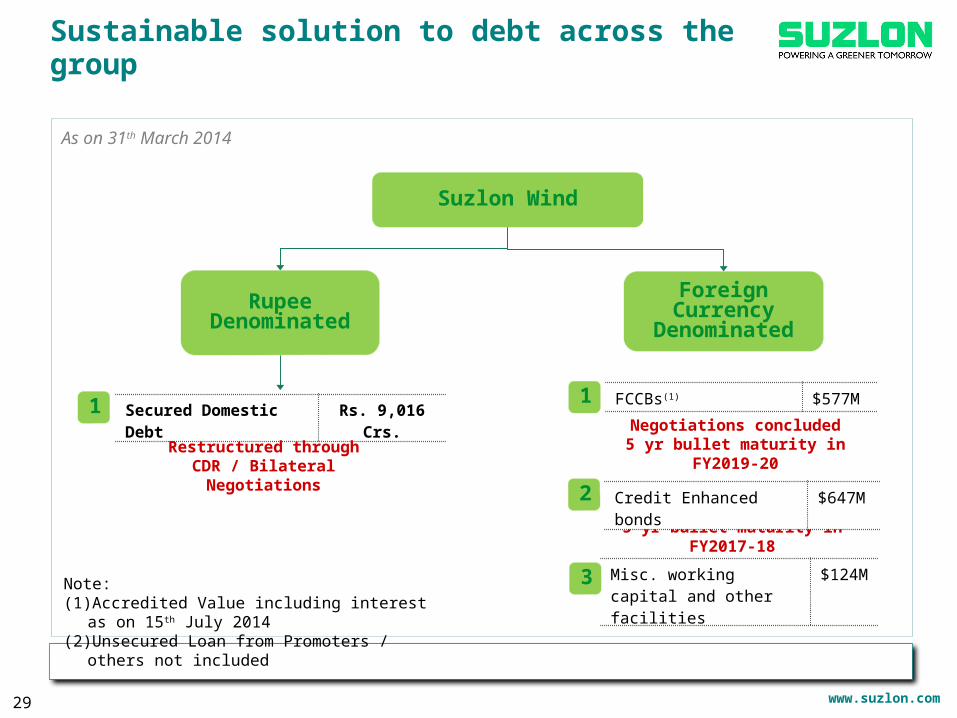
Secured Domestic Debt Rs. 9,016 Crs.
Sustainable solution to debt across the group
Foreign Currency Denominated
Suzlon Wind
Rupee Denominated
Liability comprehensively addressed, FCCB last remaining step
Note: (1) Accredited Value including interest as on 15th July 2014(2) Unsecured Loan from Promoters / others not included
FCCBs(1) $577M
Restructured through CDR / Bilateral Negotiations
Negotiations concluded5 yr bullet maturity in FY2019-20
1
2
1
As on 31th March 2014
5 yr bullet maturity in FY2017-18
Credit Enhanced bonds $647M
Misc. working capital and other facilities
$124M
29
3
www.suzlon.com30
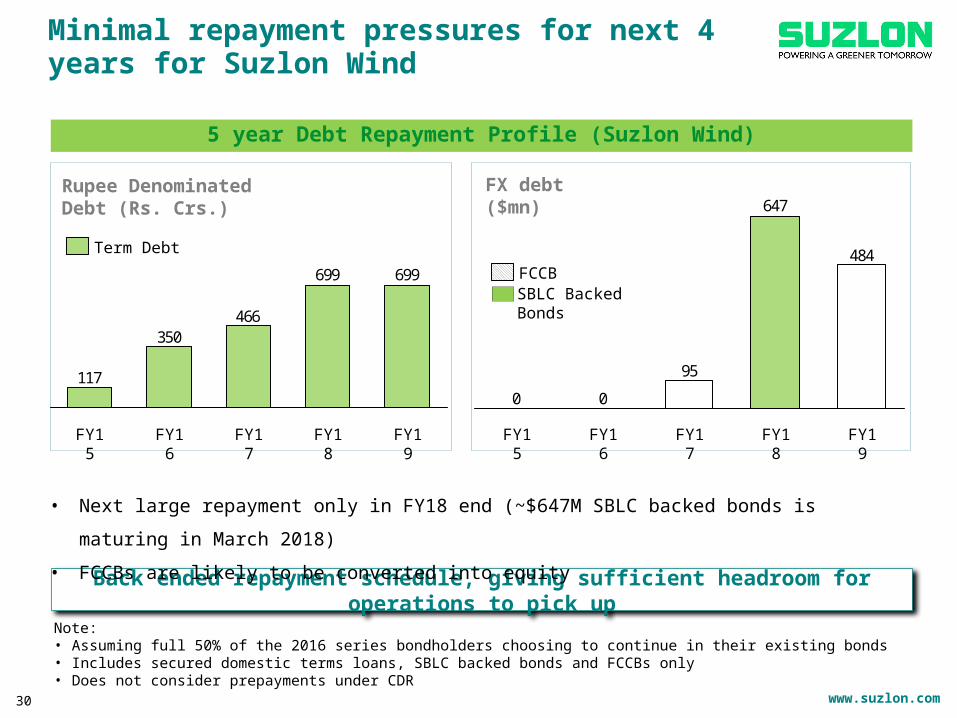
Minimal repayment pressures for next 4 years for Suzlon Wind
Back ended repayment schedule, giving sufficient headroom for operations to pick up
• Next large repayment only in FY18 end (~$647M SBLC backed bonds is maturing in March 2018)
• FCCBs are likely to be converted into equity
Note:• Assuming full 50% of the 2016 series bondholders choosing to continue in their existing bonds• Includes secured domestic terms loans, SBLC backed bonds and FCCBs only• Does not consider prepayments under CDR
5 year Debt Repayment Profile (Suzlon Wind)
Rupee Denominated Debt (Rs. Crs.)
699699
466350
117
FY19FY18FY17FY16FY15
484
647
95
00
FY19FY18FY17FY16FY15
FX debt($mn)
FCCB
Term Debt
SBLC Backed Bonds
www.suzlon.com
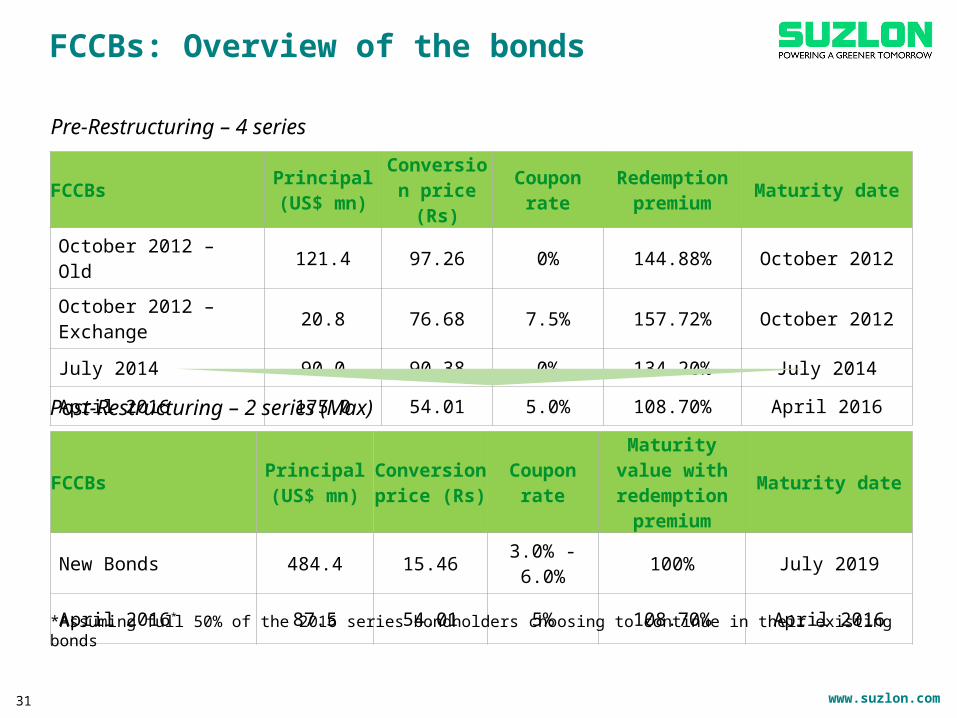
FCCBs: Overview of the bonds
31
FCCBs Principal(US$ mn)
Conversion price (Rs) Coupon rate Redemption
premium Maturity date
October 2012 – Old 121.4 97.26 0% 144.88% October 2012
October 2012 – Exchange 20.8 76.68 7.5% 157.72% October 2012
July 2014 90.0 90.38 0% 134.20% July 2014
April 2016 175.0 54.01 5.0% 108.70% April 2016
FCCBs Principal(US$ mn)
Conversion price (Rs) Coupon rate
Maturity value with redemption
premiumMaturity date
New Bonds 484.4 15.46 3.0% - 6.0% 100% July 2019
April 2016* 87.5 54.01 5% 108.70% April 2016
Pre-Restructuring – 4 series
Post-Restructuring – 2 series (Max)
*Assuming full 50% of the 2016 series bondholders choosing to continue in their existing bonds
www.suzlon.com
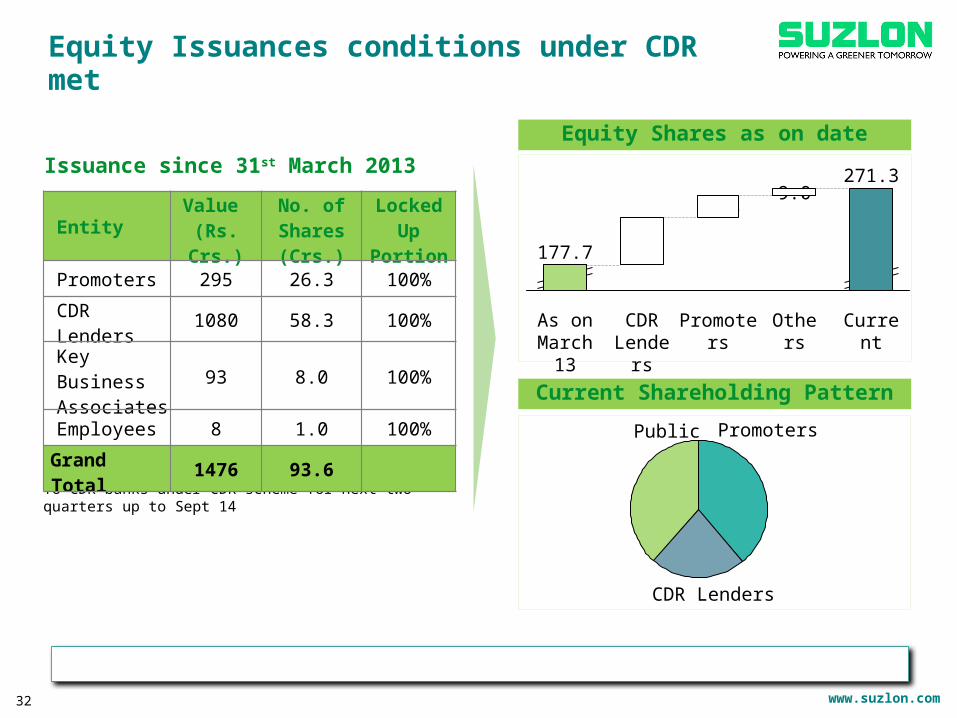
Equity Issuances conditions under CDR met
32
Current
271.3
Others
9.0
Promoters
26.3
CDR Lenders
58.3
As on March 13
177.7
Public
39%
Promoters
CDR Lenders
22%
39%
Equity Shares as on date
Further equity issuances under CDR :To CDR banks under CDR scheme for next two quarters up to Sept 14
Equity related condition of CDR fully complied
Entity Value (Rs. Crs.)
No. of Shares (Crs.)
Locked Up Portion
Promoters 295 26.3 100%
CDR Lenders 1080 58.3 100%
Key Business Associates 93 8.0 100%
Employees 8 1.0 100%
Grand Total 1476 93.6
Current Shareholding Pattern
Issuance since 31st March 2013
www.suzlon.com33
Suzlon wind farm in Aracati, Brazil
Industry Outlook Improving
www.suzlon.com
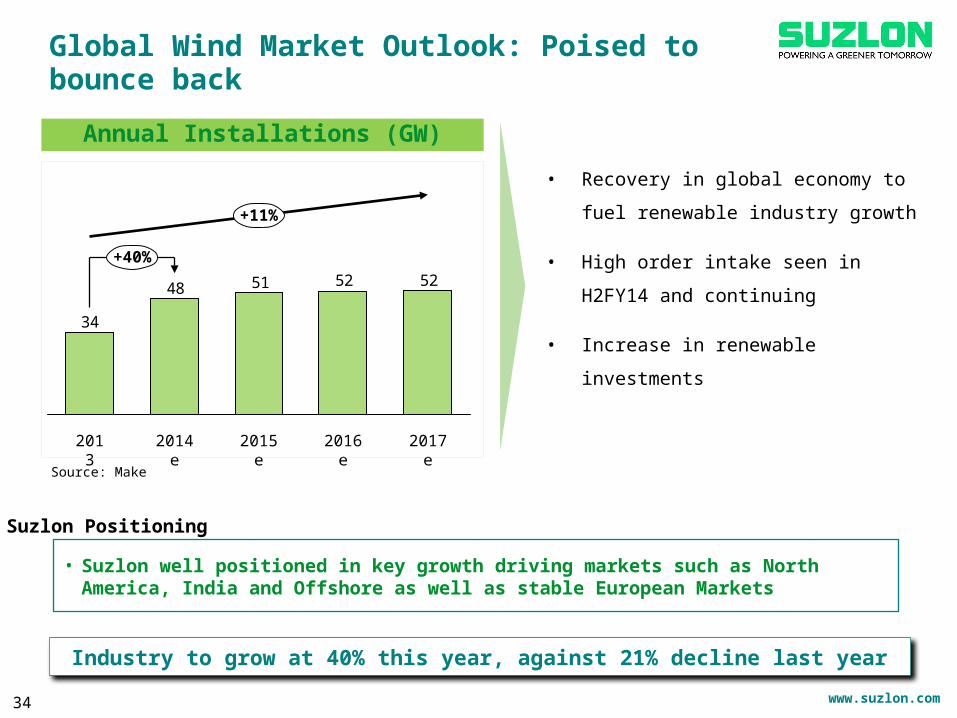
Global Wind Market Outlook: Poised to bounce back
52525148
34
2017e
+11%
2016e
+40%
2015e2014e2013
• Recovery in global economy to fuel
renewable industry growth
• High order intake seen in H2FY14 and
continuing
• Increase in renewable investments
Source: Make
Annual Installations (GW)
Industry to grow at 40% this year, against 21% decline last year
34
• Suzlon well positioned in key growth driving markets such as North America, India and Offshore as well as stable European Markets
Suzlon Positioning
www.suzlon.com
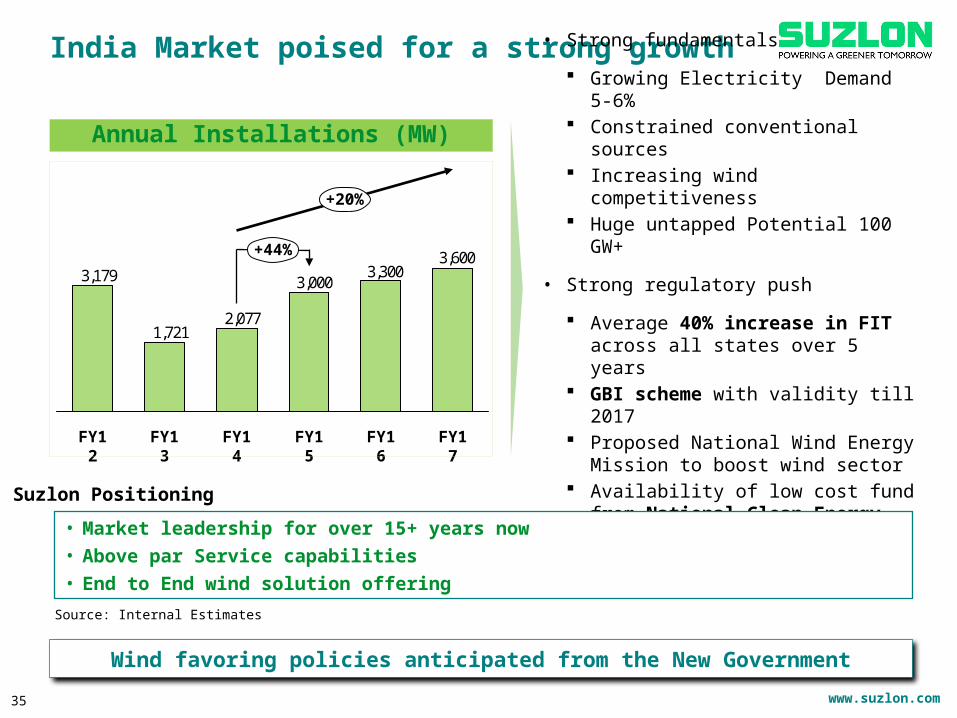
India Market poised for a strong growth
3,6003,300
3,000
2,0771,721
3,179+44%
+20%
FY16FY15FY14FY13FY12 FY17
35
Annual Installations (MW)• Strong fundamentals
Growing Electricity Demand 5-6% Constrained conventional sources Increasing wind competitiveness Huge untapped Potential 100 GW+
• Strong regulatory push
Average 40% increase in FIT across all states over 5 years
GBI scheme with validity till 2017 Proposed National Wind Energy Mission to
boost wind sector Availability of low cost fund from National
Clean Energy Fund through IREDA
Wind favoring policies anticipated from the New Government
Source: Internal Estimates
• Market leadership for over 15+ years now• Above par Service capabilities• End to End wind solution offering
Suzlon Positioning
www.suzlon.com
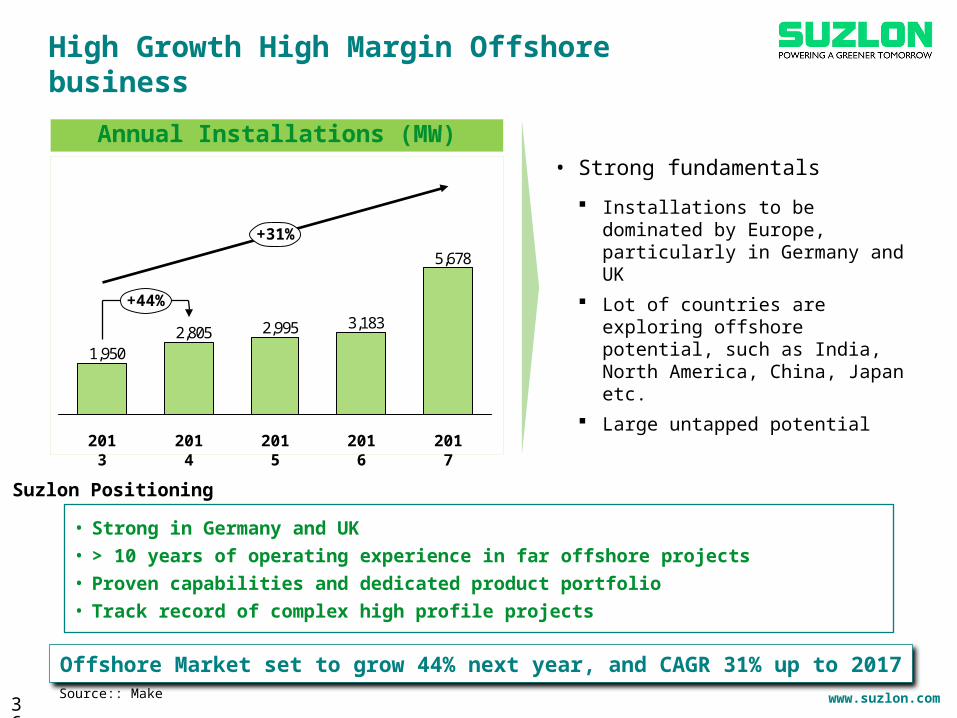
High Growth High Margin Offshore business
36Source:: Make
5,678
3,1832,9952,8051,950
2016201520142013 2017
+31%
+44%
Annual Installations (MW)
• Strong fundamentals
Installations to be dominated by Europe, particularly in Germany and UK
Lot of countries are exploring offshore potential, such as India, North America, China, Japan etc.
Large untapped potential
Offshore Market set to grow 44% next year, and CAGR 31% up to 2017
• Strong in Germany and UK• > 10 years of operating experience in far offshore projects• Proven capabilities and dedicated product portfolio• Track record of complex high profile projects
Suzlon Positioning
www.suzlon.com
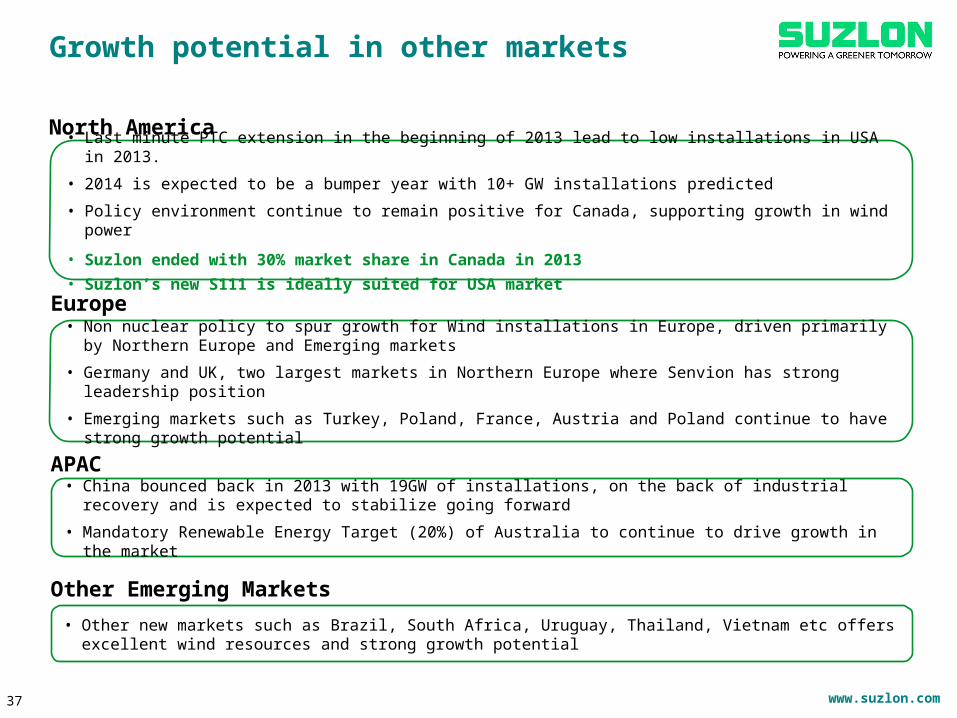
Growth potential in other markets
37
• Non nuclear policy to spur growth for Wind installations in Europe, driven primarily by Northern Europe and Emerging markets
• Germany and UK, two largest markets in Northern Europe where Senvion has strong leadership position
• Emerging markets such as Turkey, Poland, France, Austria and Poland continue to have strong growth potential
• Last minute PTC extension in the beginning of 2013 lead to low installations in USA in 2013.
• 2014 is expected to be a bumper year with 10+ GW installations predicted
• Policy environment continue to remain positive for Canada, supporting growth in wind power
• Suzlon ended with 30% market share in Canada in 2013• Suzlon’s new S111 is ideally suited for USA market
North America
Europe
• China bounced back in 2013 with 19GW of installations, on the back of industrial recovery and is expected to stabilize going forward
• Mandatory Renewable Energy Target (20%) of Australia to continue to drive growth in the market
APAC
• Other new markets such as Brazil, South Africa, Uruguay, Thailand, Vietnam etc offers excellent wind resources and strong growth potential
Other Emerging Markets
www.suzlon.com38
Suzlon Manufacturing unit in Dhule, India
Key Priorities for FY15
www.suzlon.com
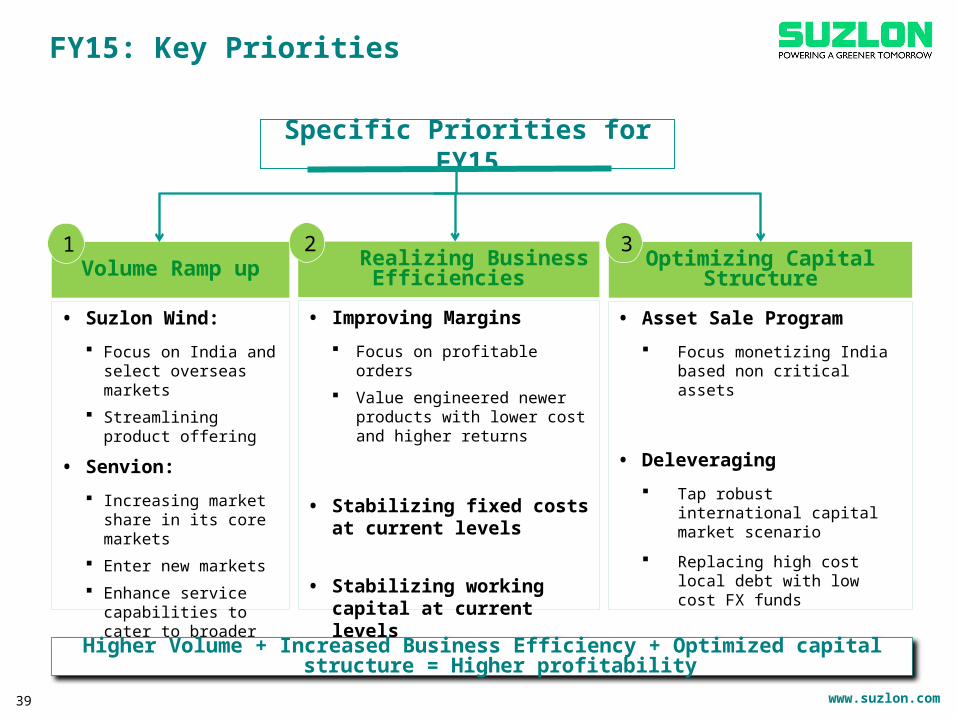
FY15: Key Priorities
39
• Suzlon Wind:
Focus on India and select overseas markets
Streamlining product offering
• Senvion:
Increasing market share in its core markets
Enter new markets
Enhance service capabilities to cater to broader market
Volume Ramp up
Specific Priorities for FY15
Optimizing Capital Structure
• Asset Sale Program
Focus monetizing India based non critical assets
• Deleveraging
Tap robust international capital market scenario
Replacing high cost local debt with low cost FX funds
1
• Improving Margins
Focus on profitable orders
Value engineered newer products with lower cost and higher returns
• Stabilizing fixed costs at current levels
• Stabilizing working capital at current levels
Realizing Business Efficiencies2 3
Higher Volume + Increased Business Efficiency + Optimized capital structure = Higher profitability
www.suzlon.com
Detailed Financials – FY14
40
Manufacturing unit in Daman, India
www.suzlon.com
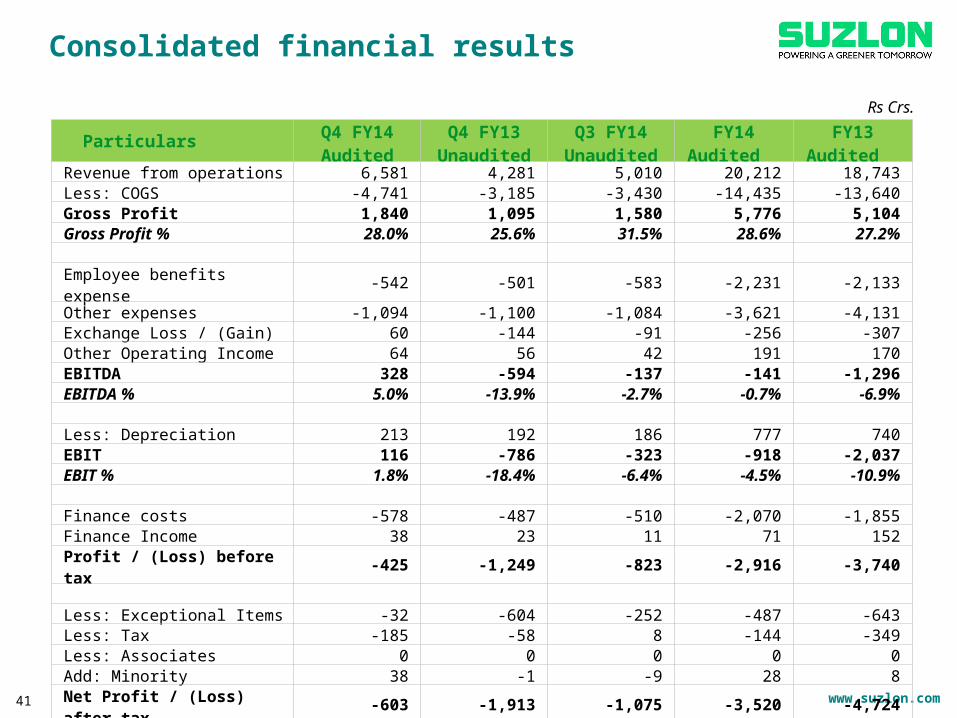
Consolidated financial results
Rs Crs.
Particulars Q4 FY14Audited
Q4 FY13Unaudited
Q3 FY14Unaudited
FY14 Audited
FY13 Audited
Revenue from operations 6,581 4,281 5,010 20,212 18,743Less: COGS -4,741 -3,185 -3,430 -14,435 -13,640Gross Profit 1,840 1,095 1,580 5,776 5,104Gross Profit % 28.0% 25.6% 31.5% 28.6% 27.2% Employee benefits expense -542 -501 -583 -2,231 -2,133Other expenses -1,094 -1,100 -1,084 -3,621 -4,131Exchange Loss / (Gain) 60 -144 -91 -256 -307Other Operating Income 64 56 42 191 170EBITDA 328 -594 -137 -141 -1,296EBITDA % 5.0% -13.9% -2.7% -0.7% -6.9% Less: Depreciation 213 192 186 777 740EBIT 116 -786 -323 -918 -2,037EBIT % 1.8% -18.4% -6.4% -4.5% -10.9% Finance costs -578 -487 -510 -2,070 -1,855Finance Income 38 23 11 71 152Profit / (Loss) before tax -425 -1,249 -823 -2,916 -3,740 Less: Exceptional Items -32 -604 -252 -487 -643Less: Tax -185 -58 8 -144 -349Less: Associates 0 0 0 0 0Add: Minority 38 -1 -9 28 8Net Profit / (Loss) after tax -603 -1,913 -1,075 -3,520 -4,724
41
www.suzlon.com
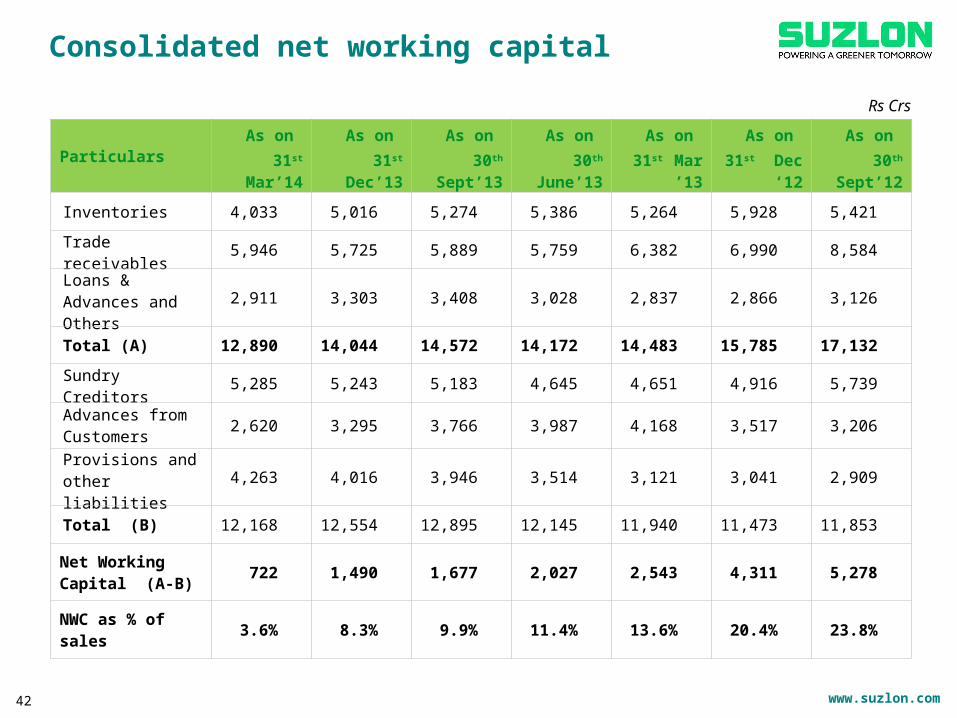
Particulars As on 31st Mar’14
As on 31st Dec’13
As on 30th Sept’13
As on 30th June’13
As on 31st Mar ’13
As on 31st Dec ‘12
As on 30th Sept’12
Inventories 4,033 5,016 5,274 5,386 5,264 5,928 5,421
Trade receivables 5,946 5,725 5,889 5,759 6,382 6,990 8,584
Loans & Advances and Others 2,911 3,303 3,408 3,028 2,837 2,866 3,126
Total (A) 12,890 14,044 14,572 14,172 14,483 15,785 17,132
Sundry Creditors 5,285 5,243 5,183 4,645 4,651 4,916 5,739
Advances from Customers 2,620 3,295 3,766 3,987 4,168 3,517 3,206
Provisions and other liabilities 4,263 4,016 3,946 3,514 3,121 3,041 2,909
Total (B) 12,168 12,554 12,895 12,145 11,940 11,473 11,853
Net Working Capital (A-B) 722 1,490 1,677 2,027 2,543 4,311 5,278
NWC as % of sales 3.6% 8.3% 9.9% 11.4% 13.6% 20.4% 23.8%
Consolidated net working capital
Rs Crs
42
www.suzlon.com
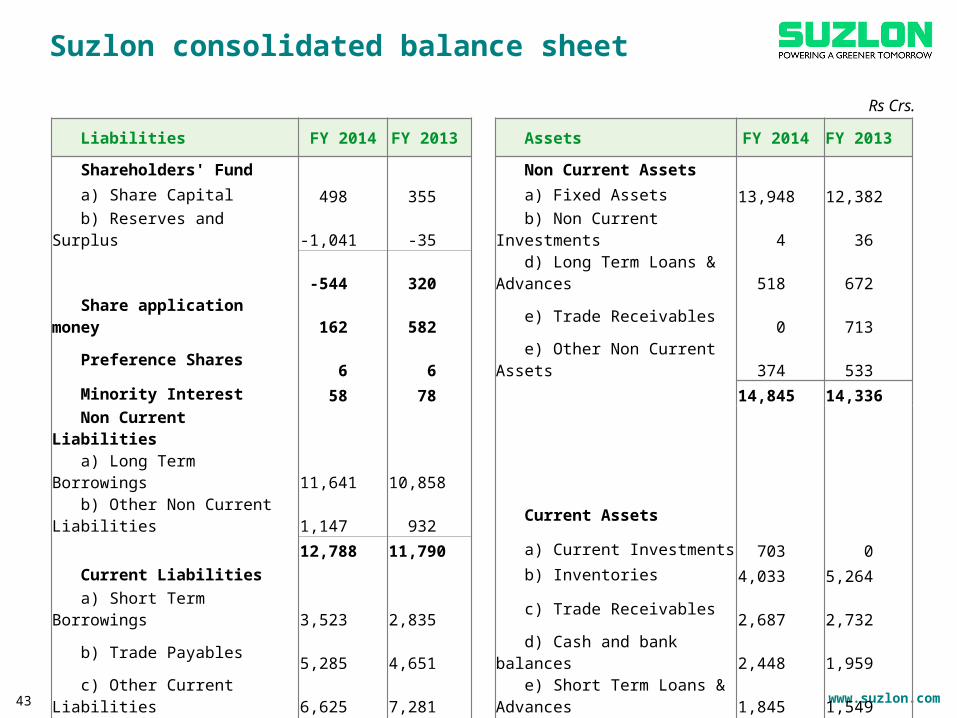
Suzlon consolidated balance sheet
Rs Crs.
43
Liabilities FY 2014 FY 2013
Assets FY 2014 FY 2013
Shareholders' Fund Non Current Assets
a) Share Capital 498 355 a) Fixed Assets 13,948 12,382 b) Reserves and Surplus -1,041 -35 b) Non Current Investments 4 36 -544 320 d) Long Term Loans & Advances 518 672 Share application money 162 582 e) Trade Receivables 0 713 Preference Shares 6 6 e) Other Non Current Assets 374 533 Minority Interest 58 78 14,845 14,336 Non Current Liabilities
a) Long Term Borrowings 11,641 10,858 b) Other Non Current Liabilities 1,147 932 Current Assets 12,788 11,790 a) Current Investments 703 0 Current Liabilities b) Inventories 4,033 5,264 a) Short Term Borrowings 3,523 2,835 c) Trade Receivables 2,687 2,732 b) Trade Payables 5,285 4,651 d) Cash and bank balances 2,448 1,959 c) Other Current Liabilities 6,625 7,281 e) Short Term Loans & Advances 1,845 1,549 d) Due to customers 211 200 f) Due from customers 3,259 2,936 e) Short Term Provisions 2,201 1,473 g) Other Current Assets 496 439 17,844 16,440 15,470 14,880
Total equity and liabilities 30,315 29,216 Total Assets 30,315 29,216
www.suzlon.com
Suzlon wind farm in Texas, USA
44
Thank You