future scenarios in agriculture
DESCRIPTION
Future scenarios in agriculture. Nick Vink Institute for Futures Research Department of Agricultural Economics University of Stellenbosch [email protected]. Outline. Foresight Project Report BFAP Outlook Supply considerations Demand considerations Africa. - PowerPoint PPT PresentationTRANSCRIPT
Future scenarios in agricultureNick Vink
Institute for Futures ResearchDepartment of Agricultural Economics
University of [email protected]
Outline
1. Foresight Project Report2. BFAP Outlook3. Supply considerations4. Demand considerations5. Africa
1. The Foresight Project
Foresight. The Future of Food and Farming (2011). Final Project Report. The Government Office for Science, London
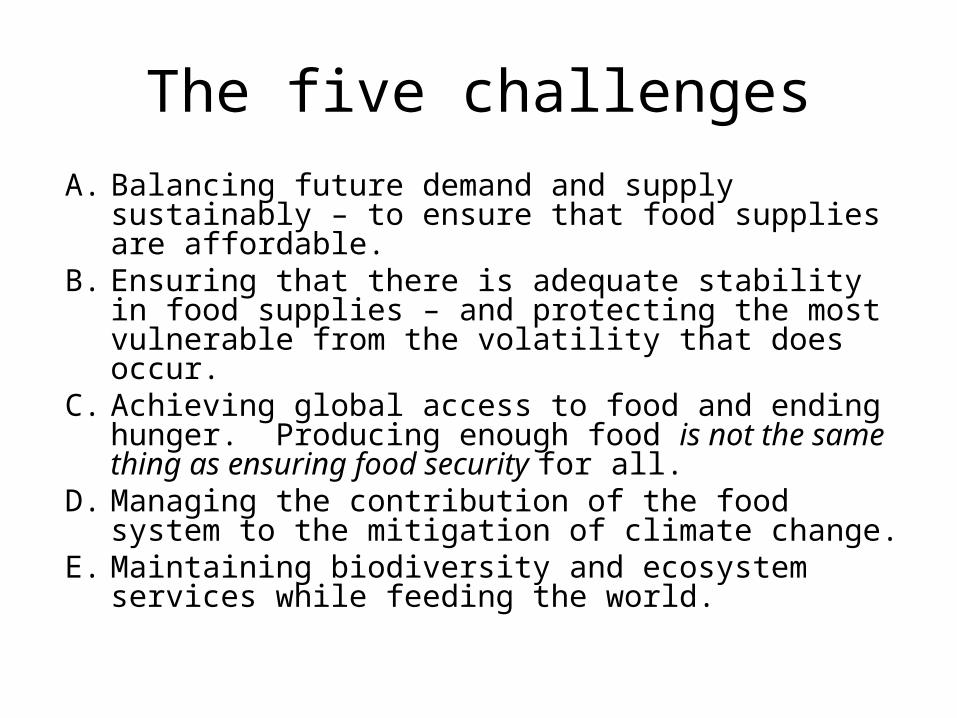
The five challengesA. Balancing future demand and supply sustainably – to
ensure that food supplies are affordable.B. Ensuring that there is adequate stability in food
supplies – and protecting the most vulnerable from the volatility that does occur.
C. Achieving global access to food and ending hunger. Producing enough food is not the same thing as ensuring food security for all.
D. Managing the contribution of the food system to the mitigation of climate change.
E. Maintaining biodiversity and ecosystem services while feeding the world.
Six drivers of change: Population increase
• To 8bn by 2030 and >9bn by 2050• Most in poorer countries: Africa’s population will
double to two billion by 2050 • Factors affecting population size include
GDP growthEducational attainmentAccess to contraceptionGender equalityThe extent of female educationUrbanisation
Six drivers of change: per capita demand for food
• Some food items (such as grain-fed meat) require more resources to produce than others
• Meat: increases in per capita consumption from 32 kg today to 52 kg by the middle of the century: implications for land, water and other inputs
• Fish: demand is expected to increase substantially, and mostly met by aquaculture: consequences for the management of aquatic habitats and the supply of feed
Six drivers of change: governance of the food system
• The globalisation of markets• The emergence and continued growth of
new food superpowers: Brazil, China and India
• The trend for consolidation in transnational companies in agribusiness, and food retail
Six drivers of change: governance of the food system
• Production subsidies, trade restrictions and other market interventions of the rich countries
• The extent to which governments act collectively to face challenges in shared resources, trade and volatility in agricultural markets.
• The control of increasing areas of land for food production such as in Africa
Six drivers of change: climate change
• The backdrop is rising temperatures and changing patterns of precipitation
• These will affect crop growth and livestock performance and the functioning of ecosystem services
• Extreme weather events will increase price volatility
• Policies for climate change mitigation will also impact on the food system
Six drivers of change: competition for key resources
• Land for food production: Additional land is available for food production, but in practice land will come under pressure for other uses
• Land will be lost to erosion, urbanisation, recreation, desertification, salination and sea level rise
• Global energy demand: Double to 2050, and the food system is vulnerable to higher energy costs
• Global water demand: Agriculture currently consumes 70% of ‘blue water’ withdrawals, and demand could double by 2050.
Six drivers of change: food ethics
• A major influence on politicians and policy makers and on patterns of consumption
• Examples include The acceptability of modern technology (GM)Production methods such as organic and related
management systemsThe value placed on animal welfareThe relative importance of environmental
sustainability and biodiversity protectionIssues of equity and fair trade
12
BFAP Baseline
• World market: OECD-FAO Aglink Cosimo model and the FAPRI US and World Agricultural Outlook
• Macroeconomic assumptions• South African supply and demand• Cooperation with industries• Farm level analyses• Building scenarios around the assumptions
13
Assumptions
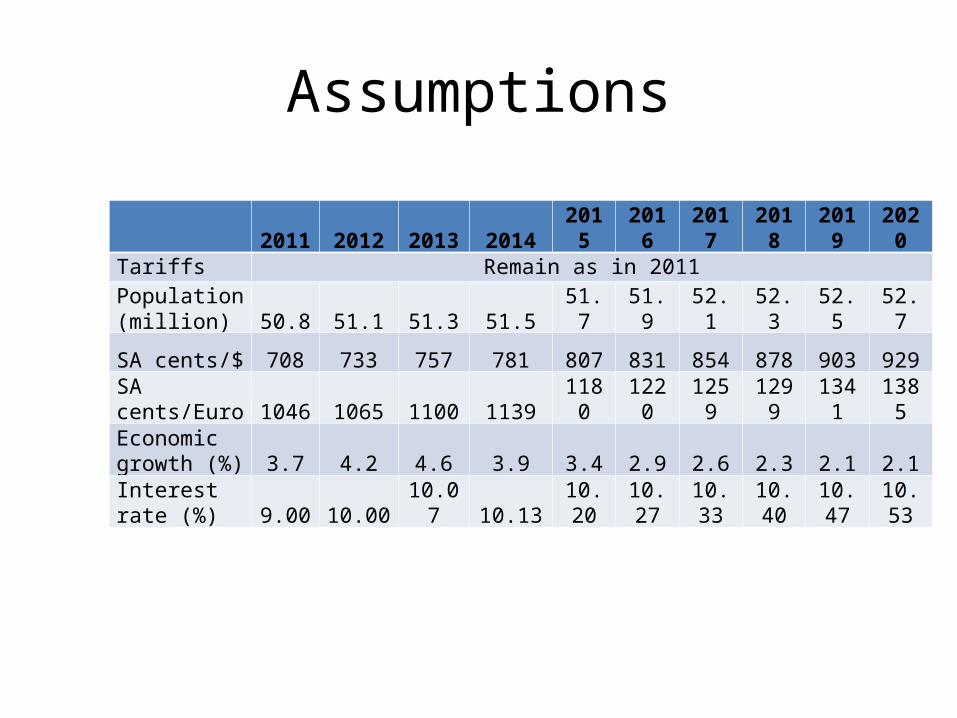
2011 2012 2013 2014 2015 2016 2017 2018 2019 2020Tariffs Remain as in 2011Population (million) 50.8 51.1 51.3 51.5 51.7 51.9 52.1 52.3 52.5 52.7
SA cents/$ 708 733 757 781 807 831 854 878 903 929
SA cents/Euro 1046 1065 1100 1139 1180 1220 1259 1299 1341 1385Economic growth (%) 3.7 4.2 4.6 3.9 3.4 2.9 2.6 2.3 2.1 2.1Interest rate (%) 9.00 10.00 10.07 10.13 10.20 10.27 10.33 10.40 10.47 10.53
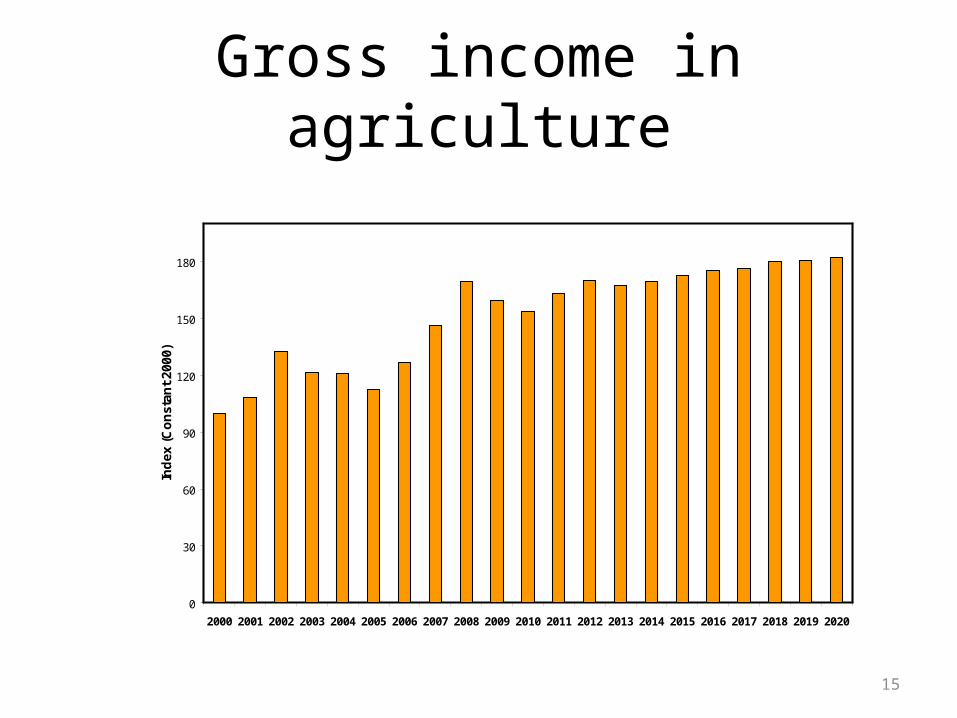
Gross income in agriculture
0
30
60
90
120
150
180
2000 2001 2002 2003 2004 2005 2006 2007 2008 2009 2010 2011 2012 2013 2014 2015 2016 2017 2018 2019 2020
Ind
ex (
Co
nst
ant
2000
)
15
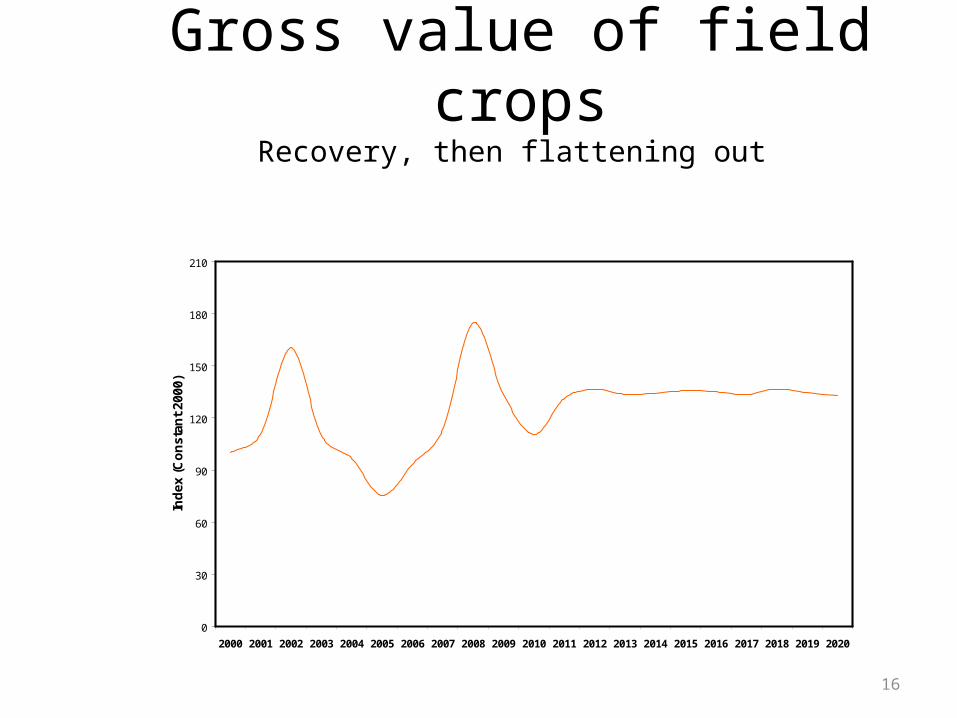
Gross value of field cropsRecovery, then flattening out
0
30
60
90
120
150
180
210
2000 2001 2002 2003 2004 2005 2006 2007 2008 2009 2010 2011 2012 2013 2014 2015 2016 2017 2018 2019 2020
Ind
ex (
Co
nst
ant
2000
)
16
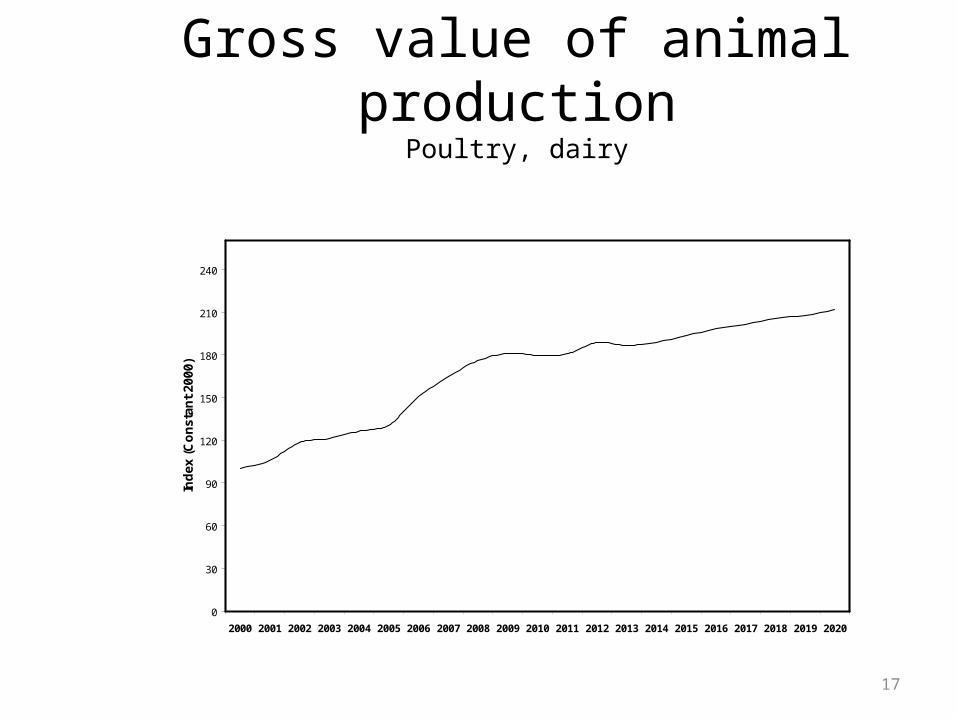
Gross value of animal productionPoultry, dairy
0
30
60
90
120
150
180
210
240
2000 2001 2002 2003 2004 2005 2006 2007 2008 2009 2010 2011 2012 2013 2014 2015 2016 2017 2018 2019 2020
Ind
ex
(Co
ns
tan
t 20
00)
17
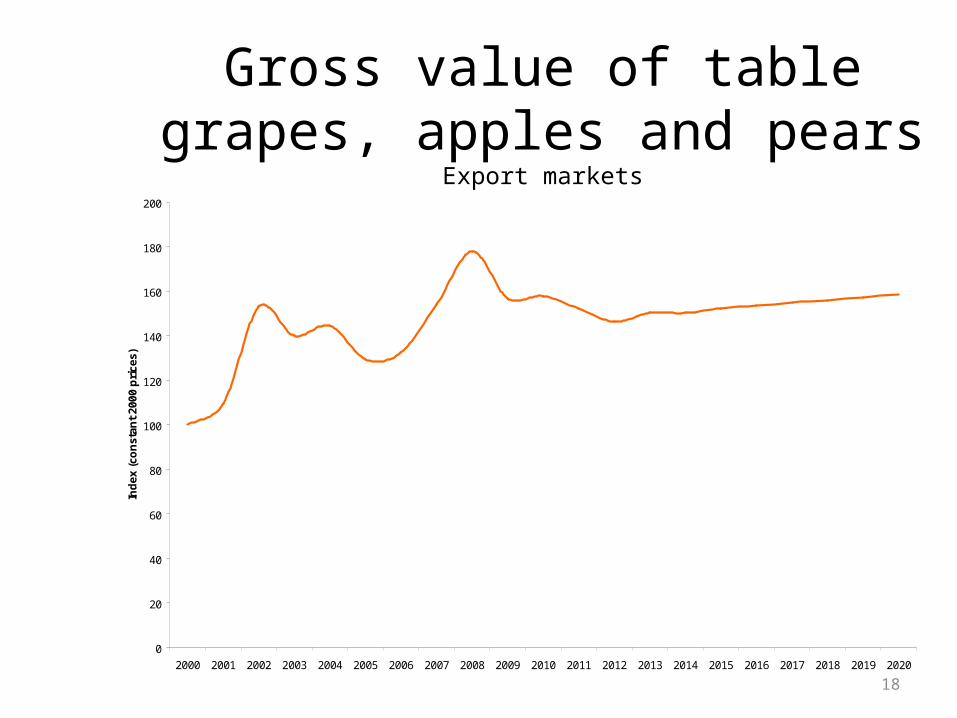
Gross value of table grapes, apples and pears
Export markets
0
20
40
60
80
100
120
140
160
180
200
2000 2001 2002 2003 2004 2005 2006 2007 2008 2009 2010 2011 2012 2013 2014 2015 2016 2017 2018 2019 2020
Ind
ex (
con
stan
t 20
00 p
rice
s)
18
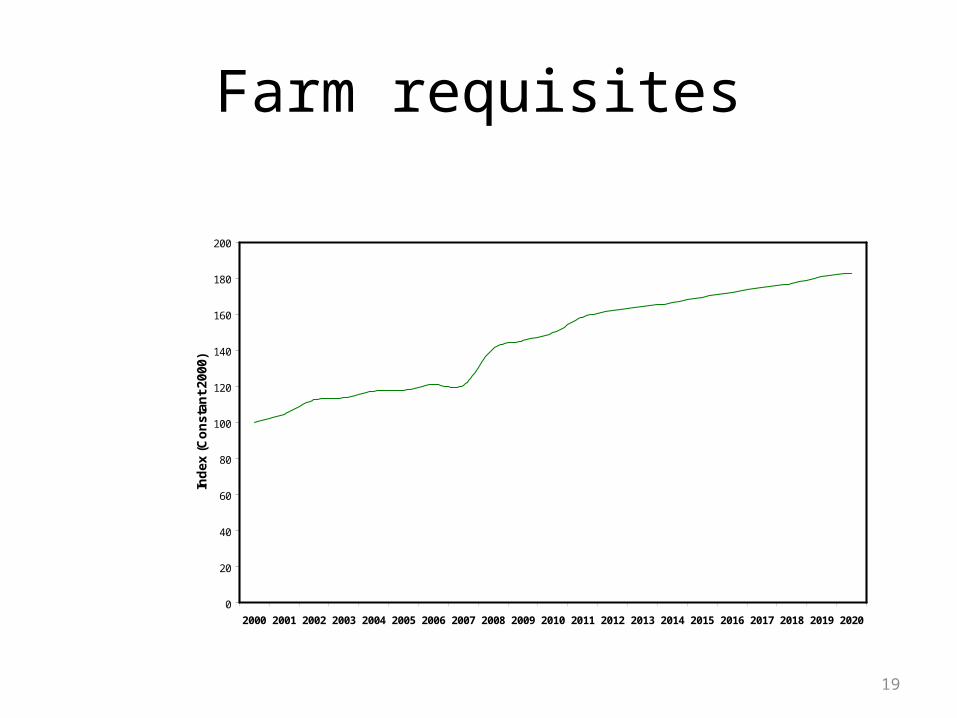
Farm requisites
0
20
40
60
80
100
120
140
160
180
200
2000 2001 2002 2003 2004 2005 2006 2007 2008 2009 2010 2011 2012 2013 2014 2015 2016 2017 2018 2019 2020
Ind
ex (
Co
nst
ant
2000
)
19
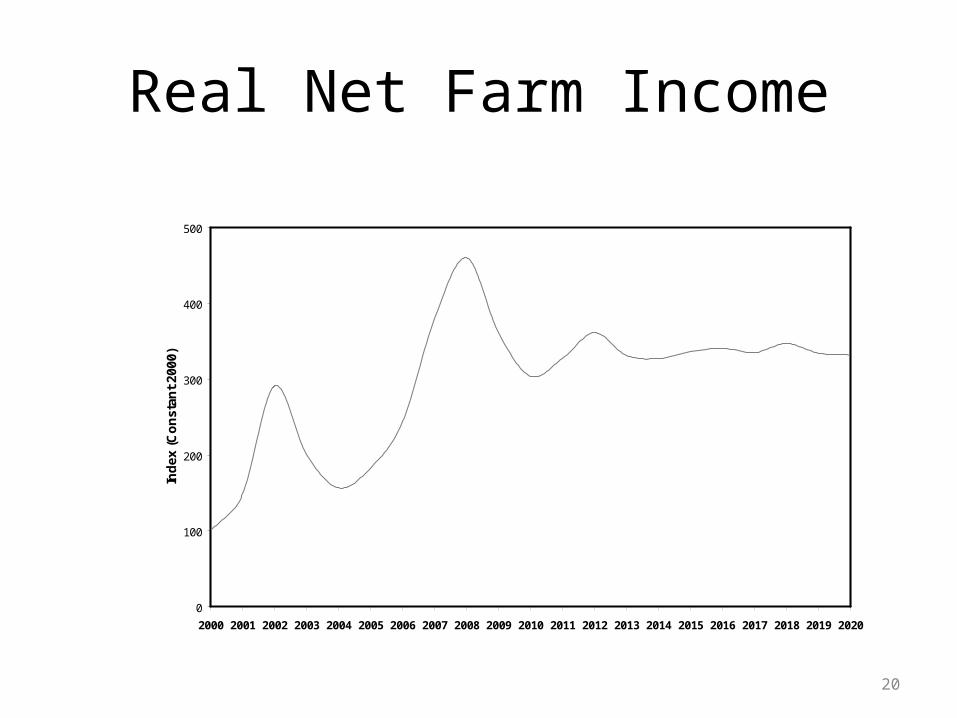
Real Net Farm Income
0
100
200
300
400
500
2000 2001 2002 2003 2004 2005 2006 2007 2008 2009 2010 2011 2012 2013 2014 2015 2016 2017 2018 2019 2020
Ind
ex (
Co
nst
ant
2000
)
20
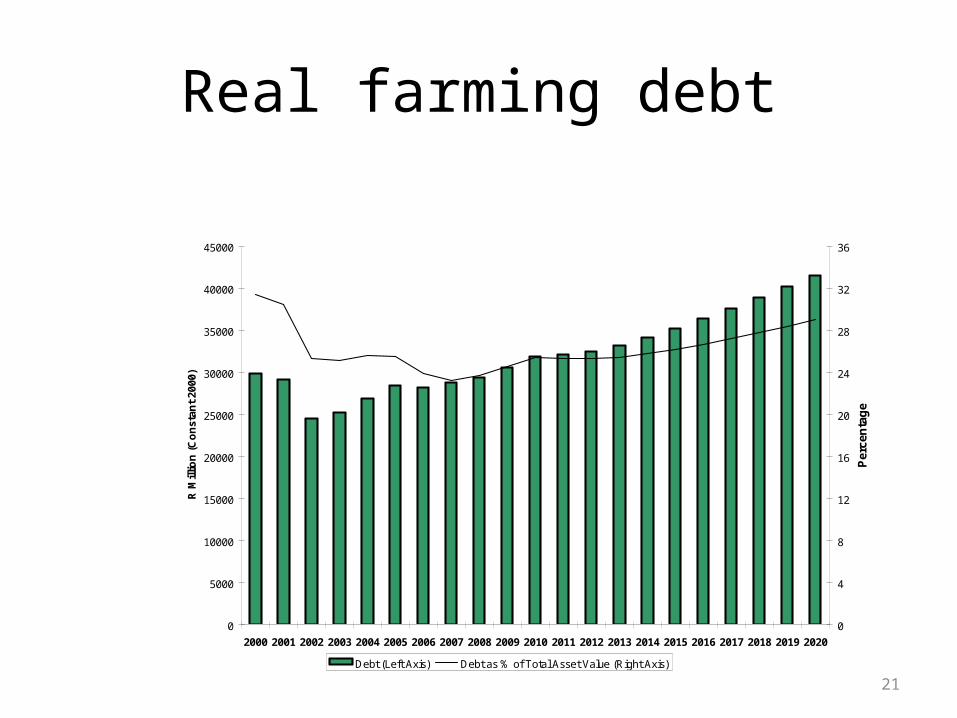
Real farming debt
0
5000
10000
15000
20000
25000
30000
35000
40000
45000
2000 2001 2002 2003 2004 2005 2006 2007 2008 2009 2010 2011 2012 2013 2014 2015 2016 2017 2018 2019 2020
R M
illio
n (
Co
nst
ant
2000
)
0
4
8
12
16
20
24
28
32
36
Per
cen
tag
e
Debt (Left Axis) Debt as % of Total Asset Value (Right Axis)
21
Most important trends• Historically high levels of yields for maize (>4.5 t/ha)
and wheat• Shift out of (white) maize and towards soybeans and
sunflower• Area planted to oilseeds will reach 1.2m ha in 2020,
compared to 2.2m ha for maize• Rise and rise in consumption of poultry meat: 2.2m
ton/year in 2020, compared to beef (<1m ton)• SA remains a net importer of all meat• Growth in dairy to 2.6m ton in 2020: cheese fastest
growing
22
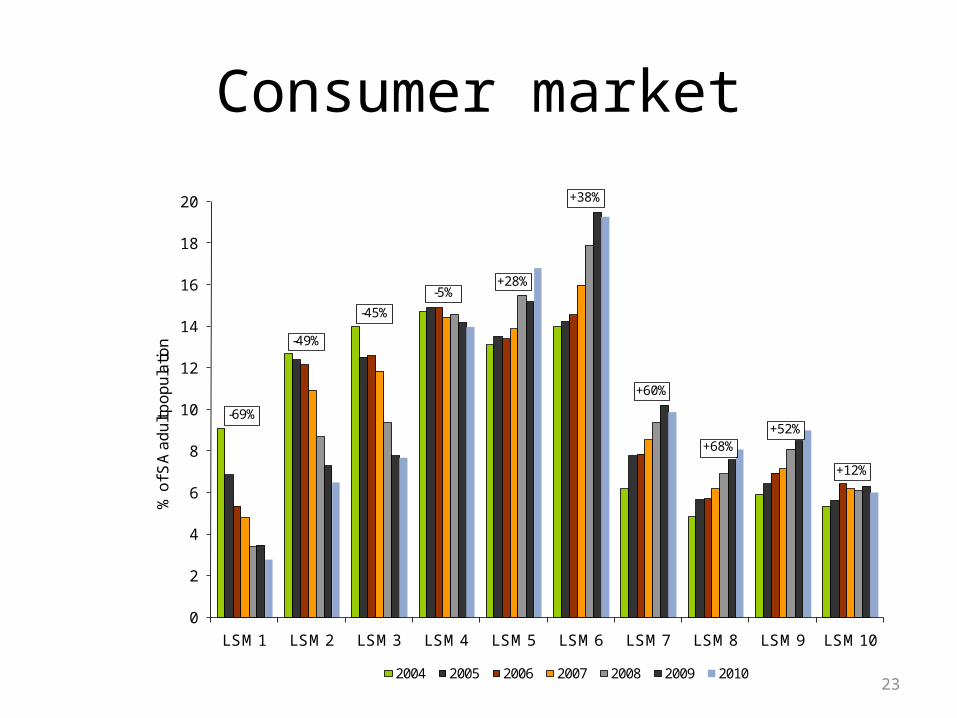
Consumer market
0
2
4
6
8
10
12
14
16
18
20
LSM 1 LSM 2 LSM 3 LSM 4 LSM 5 LSM 6 LSM 7 LSM 8 LSM 9 LSM 10
% o
f SA
ad
ult
po
pu
latio
n
2004 2005 2006 2007 2008 2009 2010
-69%
+28%-5%
-45%
-49%
+38%
+60%
+68%+52%
+12%
23
3. Supply considerations
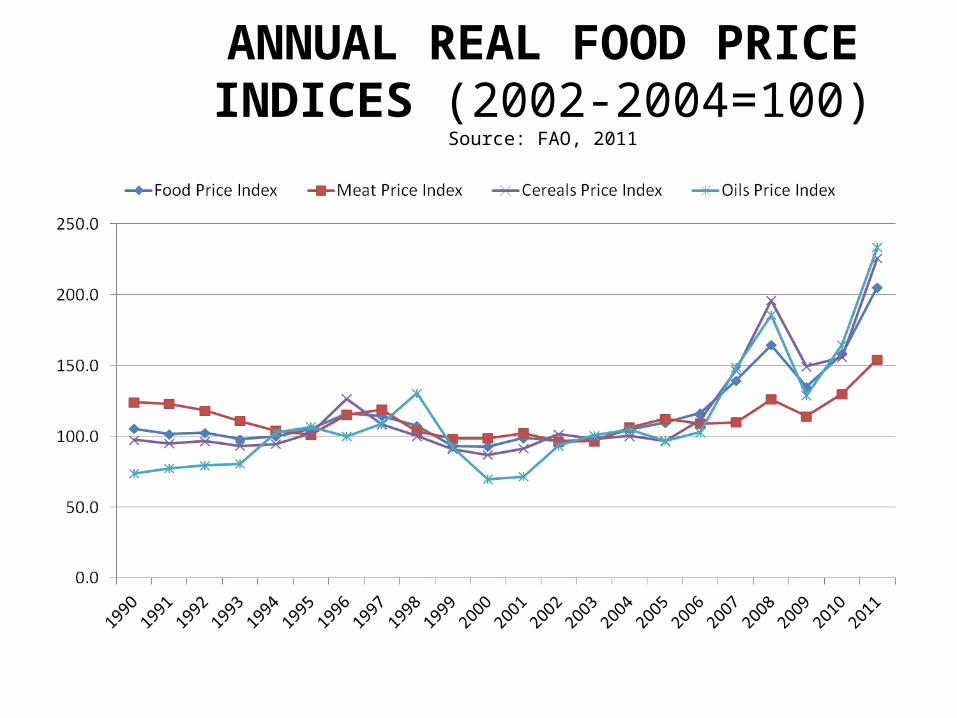
ANNUAL REAL FOOD PRICE INDICES (2002-2004=100)
Source: FAO, 2011
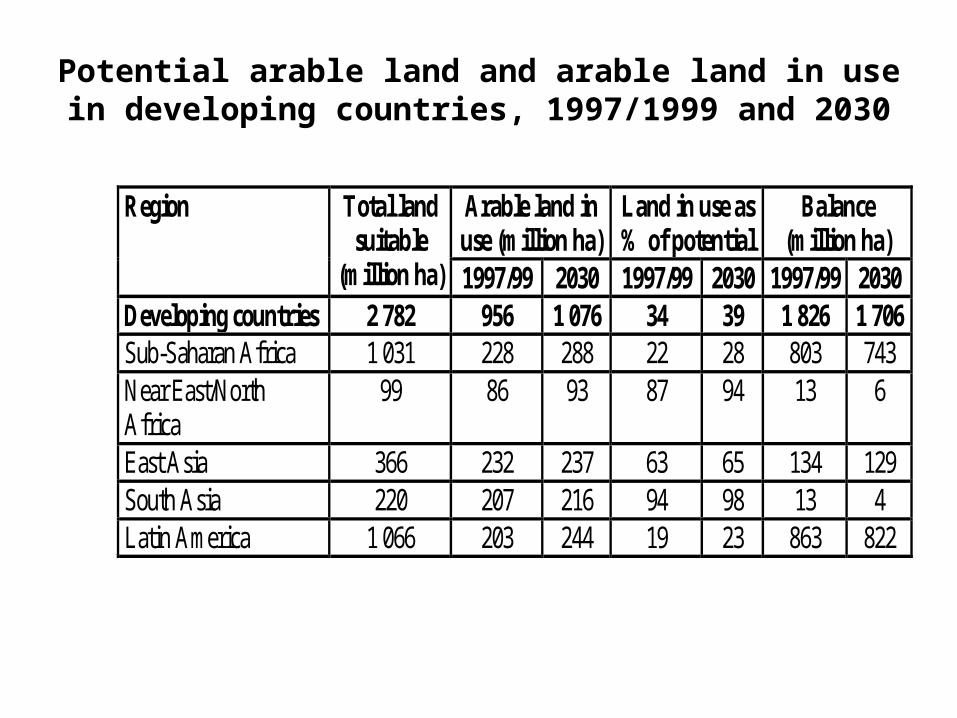
Potential arable land and arable land in use in developing countries, 1997/1999 and 2030
Region Total land suitable
(million ha)
Arable land in use (million ha)
Land in use as % of potential
Balance (million ha)
1997/99 2030 1997/99 2030 1997/99 2030 Developing countries 2 782 956 1 076 34 39 1 826 1 706 Sub-Saharan Africa 1 031 228 288 22 28 803 743 Near East/North Africa
99 86 93 87 94 13 6
East Asia 366 232 237 63 65 134 129 South Asia 220 207 216 94 98 13 4 Latin America 1 066 203 244 19 23 863 822
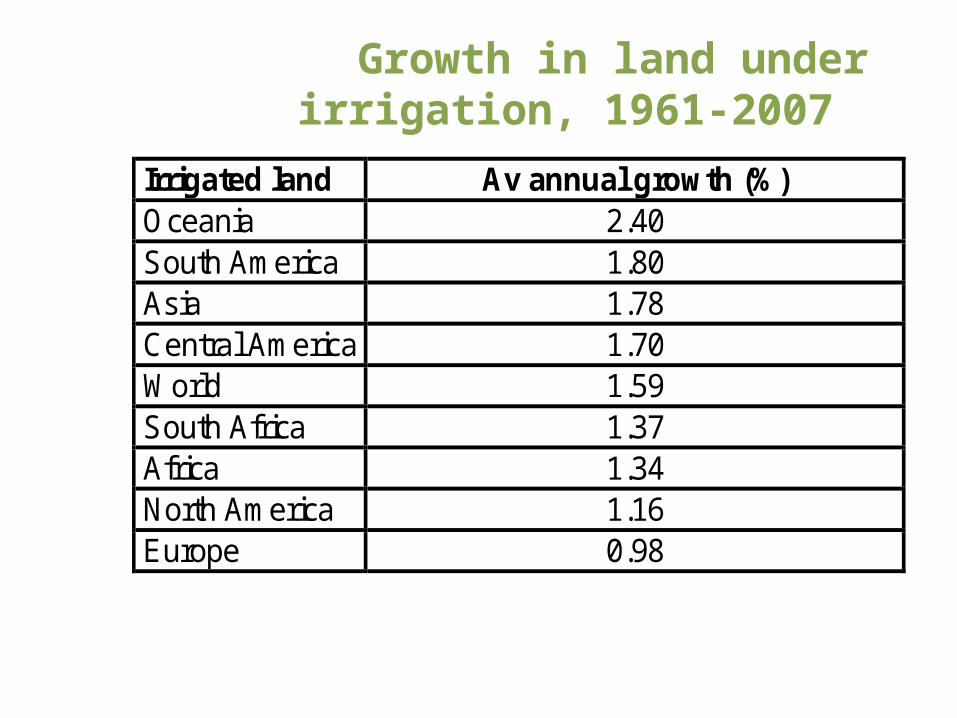
Growth in land under irrigation, 1961-2007
Irrigated land Av annual growth (%) Oceania 2.40 South America 1.80 Asia 1.78 Central America 1.70 World 1.59 South Africa 1.37 Africa 1.34 North America 1.16 Europe 0.98
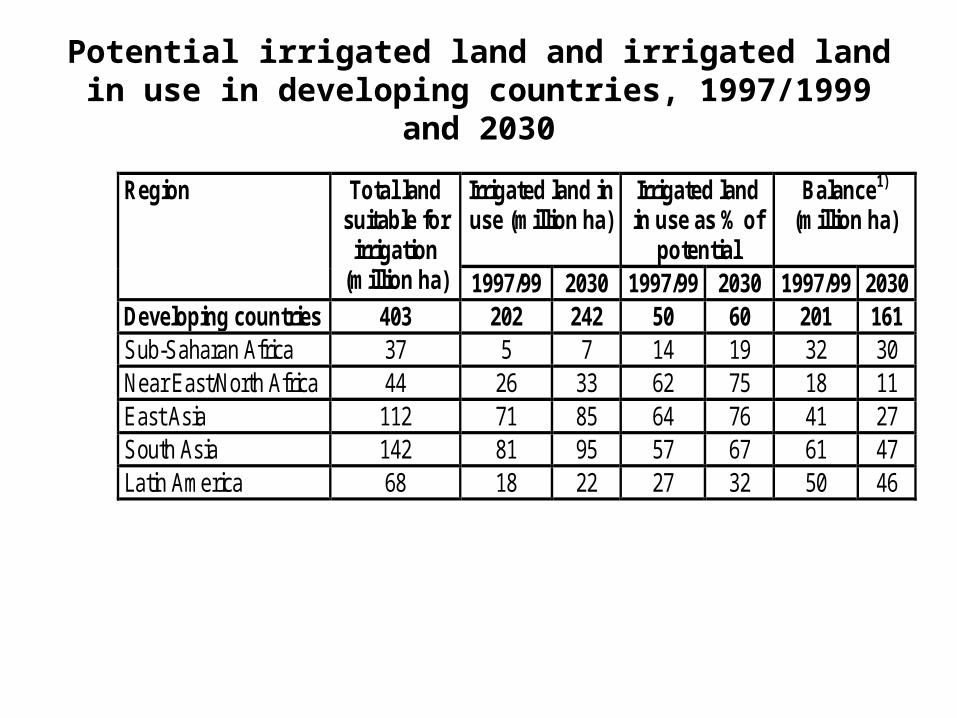
Potential irrigated land and irrigated land in use in developing countries, 1997/1999 and 2030
Region Total land suitable for irrigation
(million ha)
Irrigated land in use (million ha)
Irrigated land in use as % of
potential
Balance1) (million ha)
1997/99 2030 1997/99 2030 1997/99 2030 Developing countries 403 202 242 50 60 201 161 Sub-Saharan Africa 37 5 7 14 19 32 30 Near East/North Africa 44 26 33 62 75 18 11 East Asia 112 71 85 64 76 41 27 South Asia 142 81 95 57 67 61 47 Latin America 68 18 22 27 32 50 46
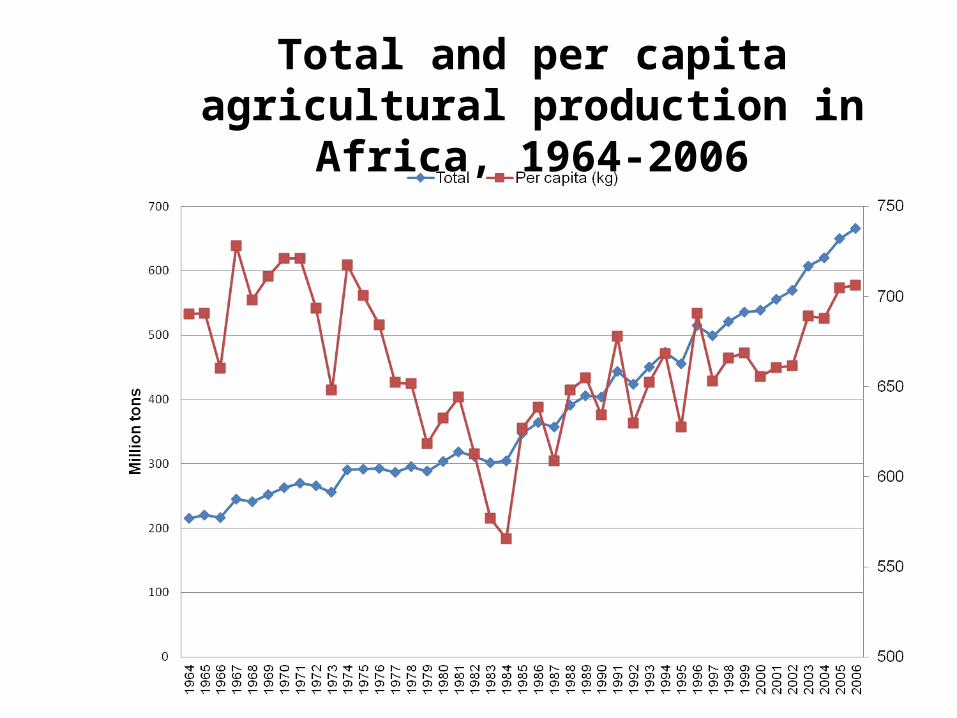
Total and per capita agricultural production in Africa, 1964-2006
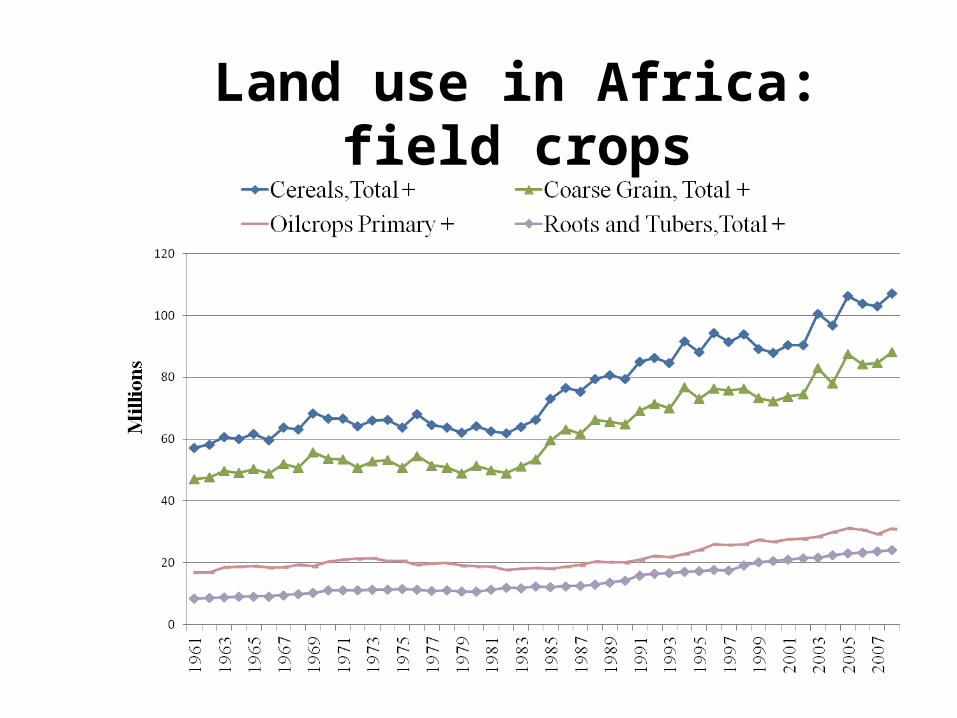
Land use in Africa: field crops
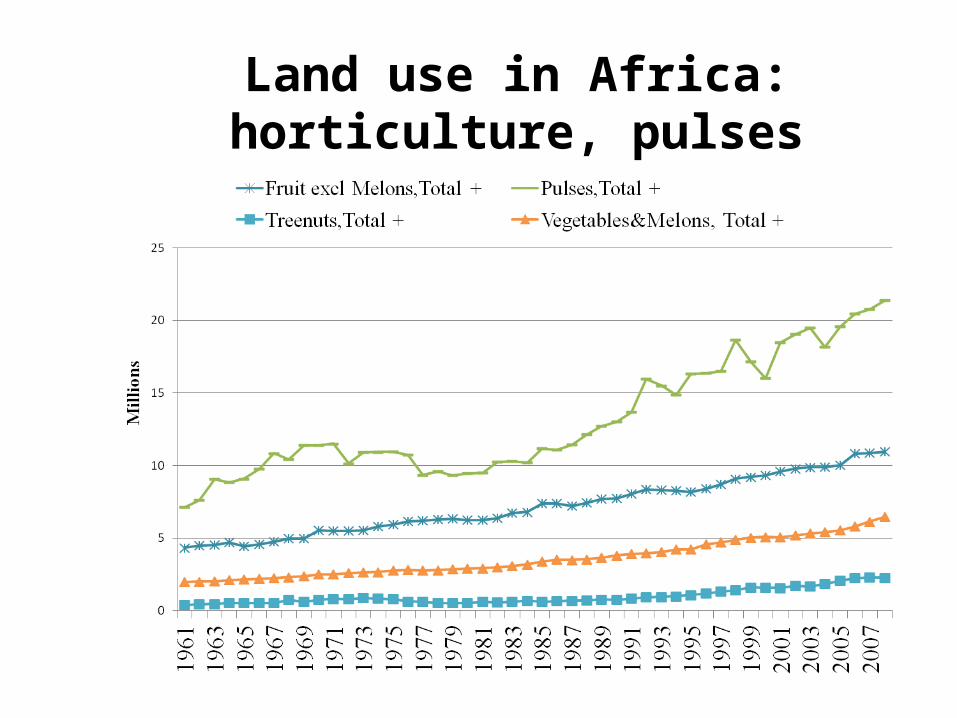
Land use in Africa: horticulture, pulses
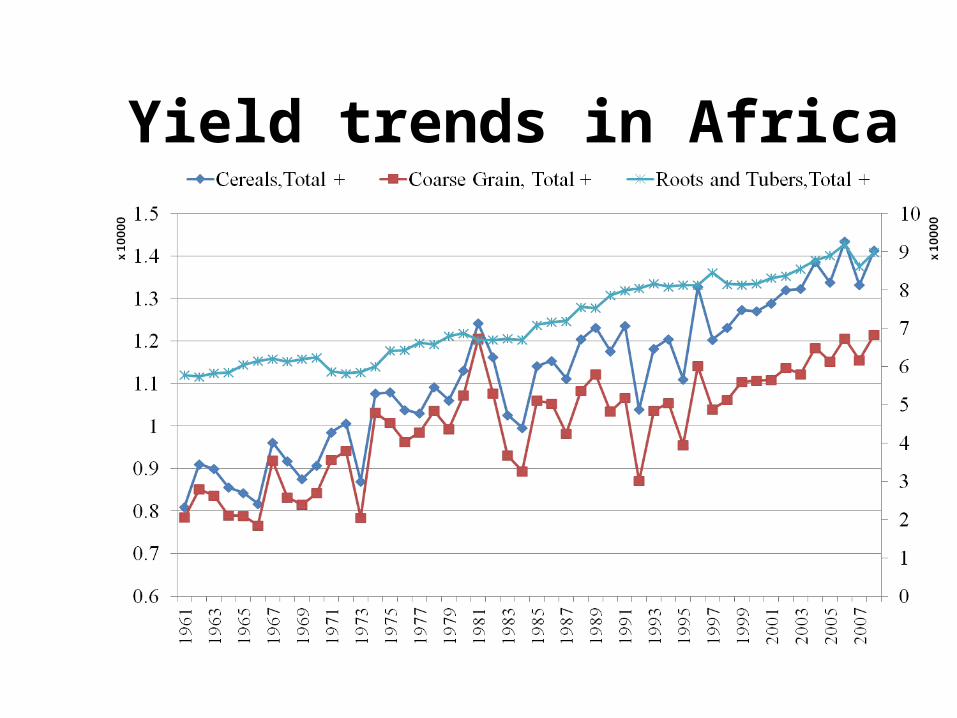
Yield trends in Africa
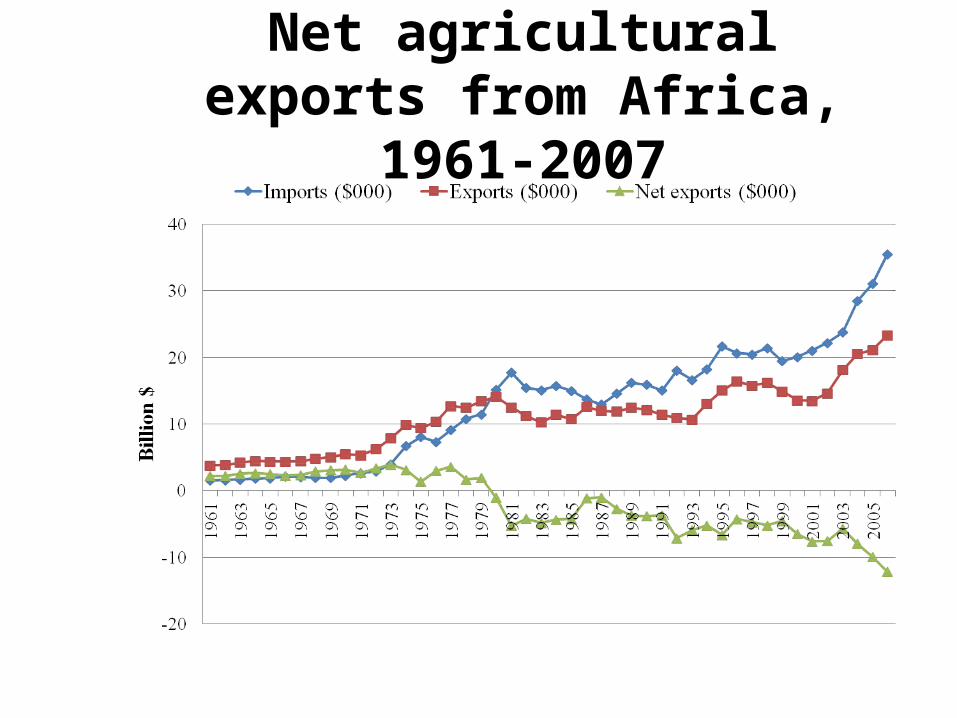
Net agricultural exports from Africa, 1961-2007
4. Demand considerations
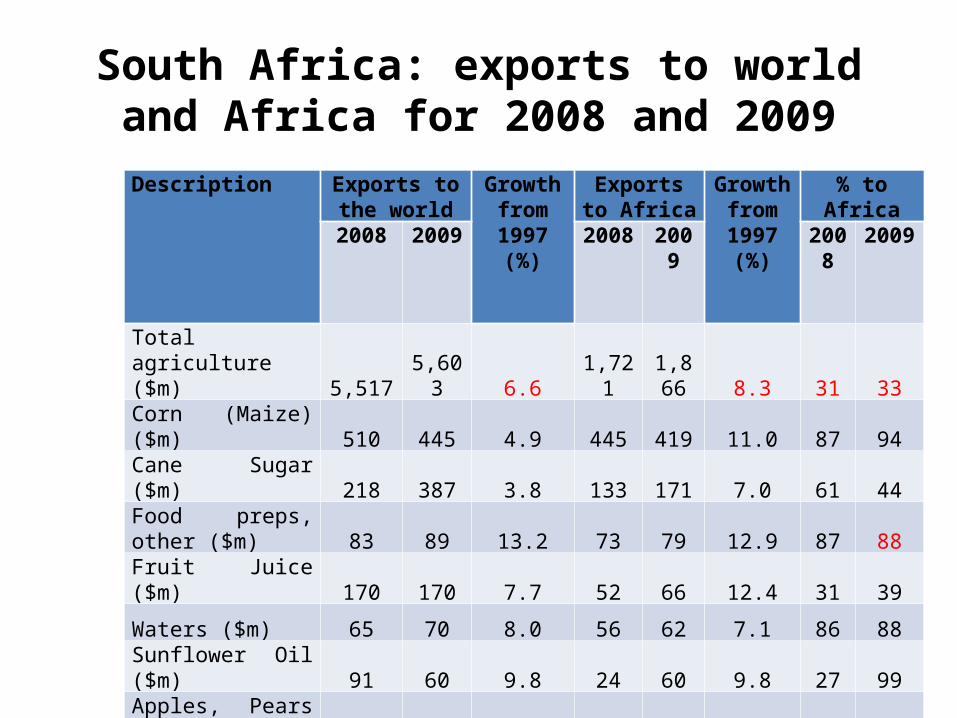
South Africa: exports to world and Africa for 2008 and 2009
Description Exports to the world
Growth from
1997 (%)
Exports to Africa
Growth from 1997 (%)
% to Africa2008 2009 2008 2009 200
82009
Total agriculture ($m) 5,517 5,603 6.6 1,721
1,866 8.3 31 33
Corn (Maize) ($m) 510 445 4.9 445 419 11.0 87 94Cane Sugar ($m) 218 387 3.8 133 171 7.0 61 44Food preps, other ($m) 83 89 13.2 73 79 12.9 87 88Fruit Juice ($m) 170 170 7.7 52 66 12.4 31 39Waters ($m) 65 70 8.0 56 62 7.1 86 88Sunflower Oil ($m) 91 60 9.8 24 60 9.8 27 99Apples, Pears ($m) 367 365 6.8 59 56 10.3 16 15Cereal Meal etc ($m) 52 52 10.2 51 51 10.2 98 99Wine ($m) 754 727 12.0 54 49 9.2 7 7
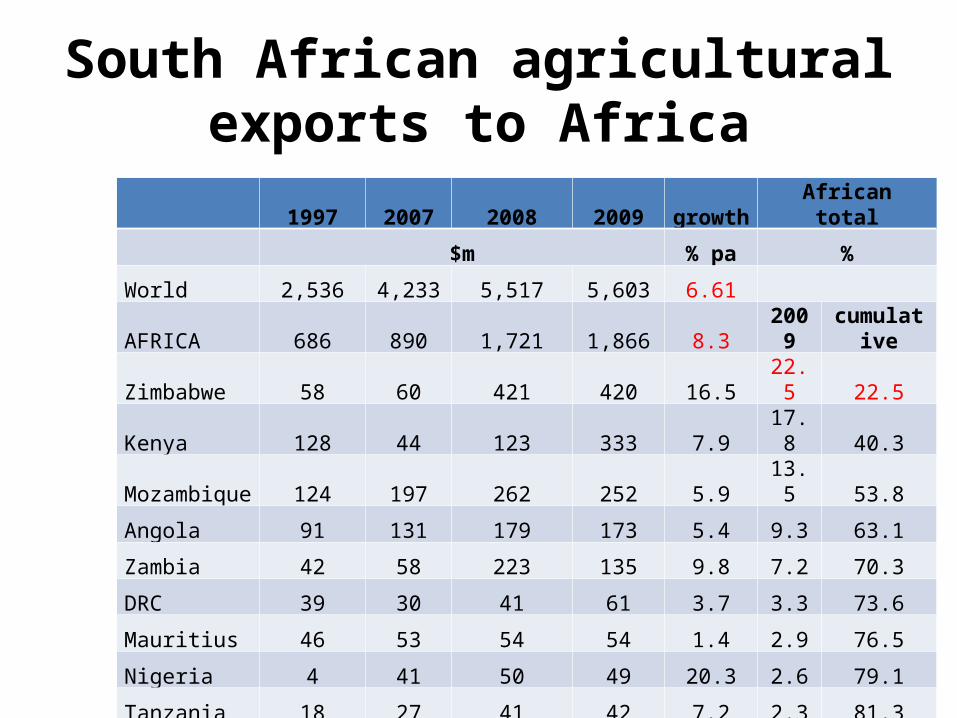
South African agricultural exports to Africa
1997 2007 2008 2009 growth African total
$m % pa %
World 2,536 4,233 5,517 5,603 6.61
AFRICA 686 890 1,721 1,866 8.3 2009 cumulative
Zimbabwe 58 60 421 420 16.5 22.5 22.5
Kenya 128 44 123 333 7.9 17.8 40.3
Mozambique 124 197 262 252 5.9 13.5 53.8
Angola 91 131 179 173 5.4 9.3 63.1
Zambia 42 58 223 135 9.8 7.2 70.3
DRC 39 30 41 61 3.7 3.3 73.6
Mauritius 46 53 54 54 1.4 2.9 76.5
Nigeria 4 41 50 49 20.3 2.6 79.1
Tanzania 18 27 41 42 7.2 2.3 81.3
Malawi 32 23 34 41 2.0 2.2 83.5
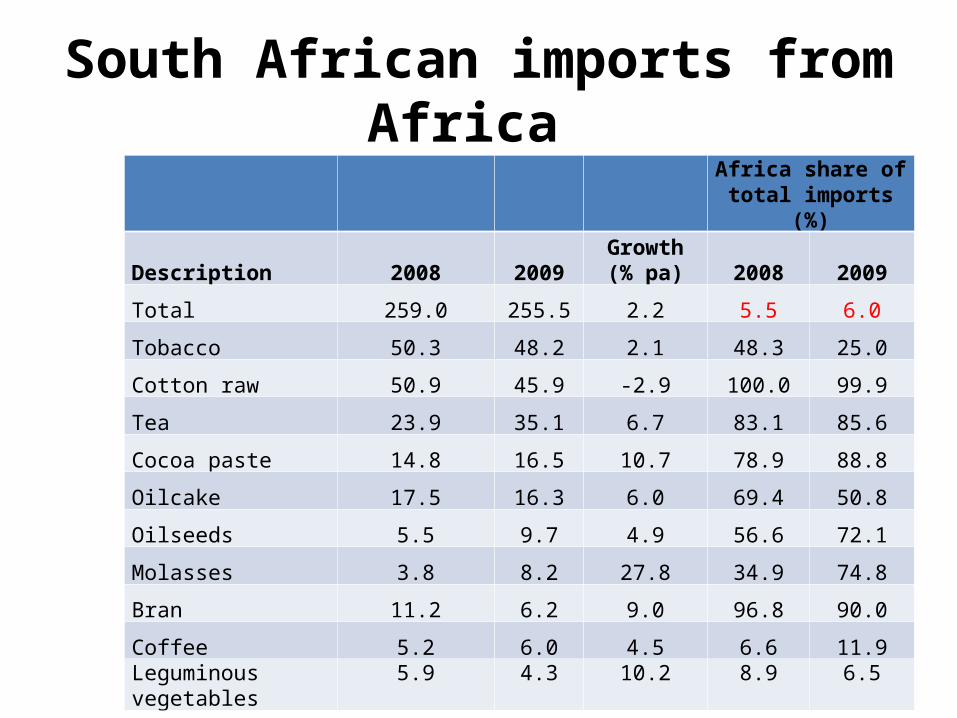
South African imports from Africa Africa share of total
imports (%)
Description 2008 2009Growth (%
pa) 2008 2009
Total 259.0 255.5 2.2 5.5 6.0
Tobacco 50.3 48.2 2.1 48.3 25.0
Cotton raw 50.9 45.9 -2.9 100.0 99.9
Tea 23.9 35.1 6.7 83.1 85.6
Cocoa paste 14.8 16.5 10.7 78.9 88.8
Oilcake 17.5 16.3 6.0 69.4 50.8
Oilseeds 5.5 9.7 4.9 56.6 72.1
Molasses 3.8 8.2 27.8 34.9 74.8
Bran 11.2 6.2 9.0 96.8 90.0
Coffee 5.2 6.0 4.5 6.6 11.9Leguminous vegetables
5.9 4.3 10.2 8.9 6.5
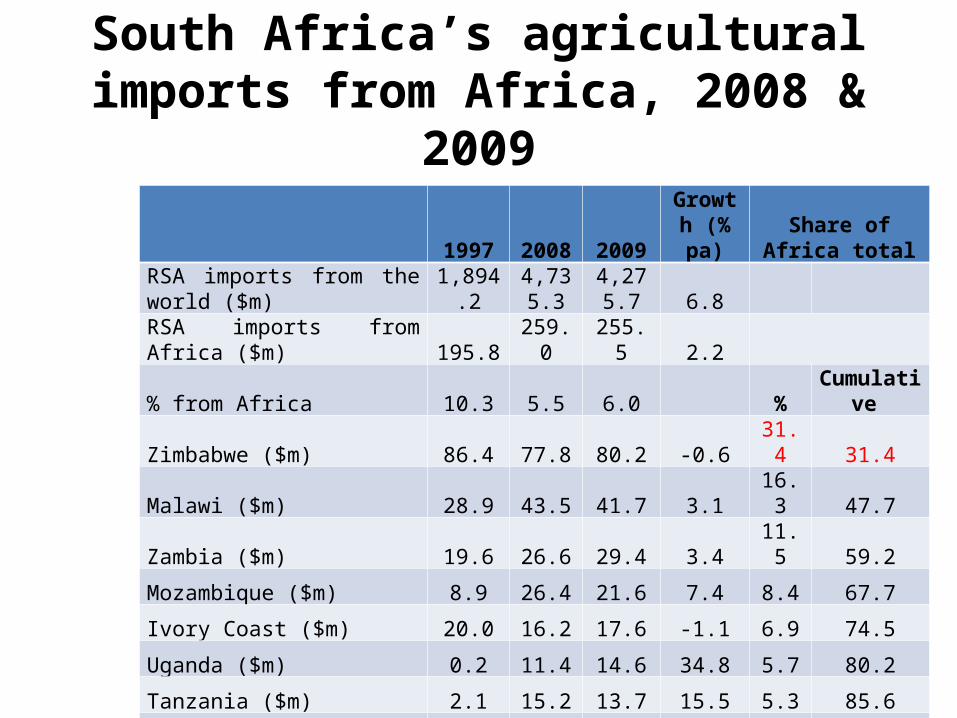
South Africa’s agricultural imports from Africa, 2008 & 2009
1997 2008 2009Growth (% pa)
Share of Africa total
RSA imports from the world ($m) 1,894.2
4,735.3
4,275.7 6.8
RSA imports from Africa ($m) 195.8 259.0 255.5 2.2
% from Africa 10.3 5.5 6.0 %Cumulativ
e
Zimbabwe ($m) 86.4 77.8 80.2 -0.6 31.4 31.4
Malawi ($m) 28.9 43.5 41.7 3.1 16.3 47.7
Zambia ($m) 19.6 26.6 29.4 3.4 11.5 59.2
Mozambique ($m) 8.9 26.4 21.6 7.4 8.4 67.7
Ivory Coast ($m) 20.0 16.2 17.6 -1.1 6.9 74.5
Uganda ($m) 0.2 11.4 14.6 34.8 5.7 80.2
Tanzania ($m) 2.1 15.2 13.7 15.5 5.3 85.6
Kenya ($m) 7.0 7.1 6.5 -0.6 2.6 88.1
Ethiopia ($m) 0.3 4.7 4.4 21.5 1.7 91.8
Wine exports to Africa
• Total wine exports have declined the past 3 years
• Packaged exports declined most• SA is therefore exporting more bulk wine
(little value added)• BUT the market for packaged wine in Africa is
growing fast
39
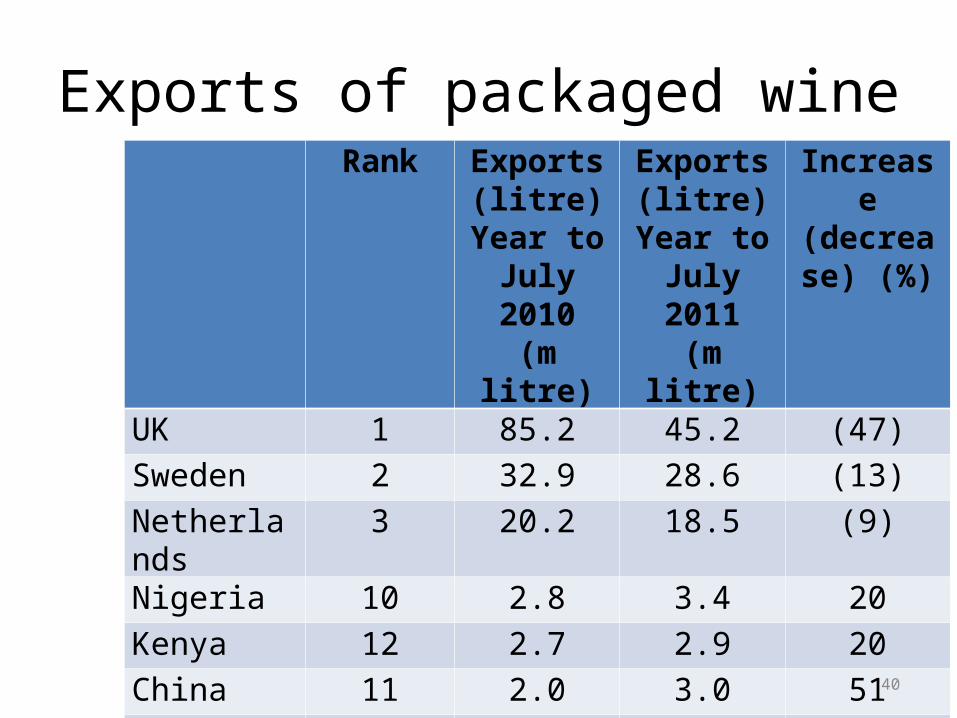
Exports of packaged wineRank Exports
(litre)Year to
July 2010(m litre)
Exports (litre)
Year to July 2011(m litre)
Increase (decrease)
(%)
UK 1 85.2 45.2 (47)
Sweden 2 32.9 28.6 (13)
Netherlands 3 20.2 18.5 (9)
Nigeria 10 2.8 3.4 20
Kenya 12 2.7 2.9 20
China 11 2.0 3.0 51
All Asia 8.4 8.4 0
All Africa 12.1 13.4 1140