future scenarios for china’s carbon emissions · sussex energy group spru - science and...
TRANSCRIPT
Sussex Energy GroupSPRU - Science and Technology Policy Research
Future Scenarios forChina’s Carbon Emissions
Jim Watson and Tao Wang
Kennedy School of Government, Harvard University, 7th July 2008
Sussex Energy GroupSPRU - Science and Technology Policy Research
1 Energy and emissions trends in China2 Who owns China’s emissions?3 Future emissions scenarios
• Explaining our approach• Application to China (so far …)
4 Conclusions
Overview
Sussex Energy GroupSPRU - Science and Technology Policy Research
Global trends and developing countries
According to the IEA World Energy Outlook 2007:
• World primary energy demand will grow 55% between 2005 and 2030: From 11.4 billion toe to 17.7 billion toe
• 74% of this increase will be due to growth in developing countries; 45% from China and India
• The developing country share of global energy demand will increase from 41% in 2005 to 47% in 2015, and over 50% in 2030
• China and India account for 45% of world coal demand. These countries will account for over 80% of the increase in coal demand to 2030
Sussex Energy GroupSPRU - Science and Technology Policy Research
0
500
1000
1500
2000
1980 1983 1986 1989 1992 1995 1998 2001 2004
m to
nnes
of c
oal e
quiv
alen
t
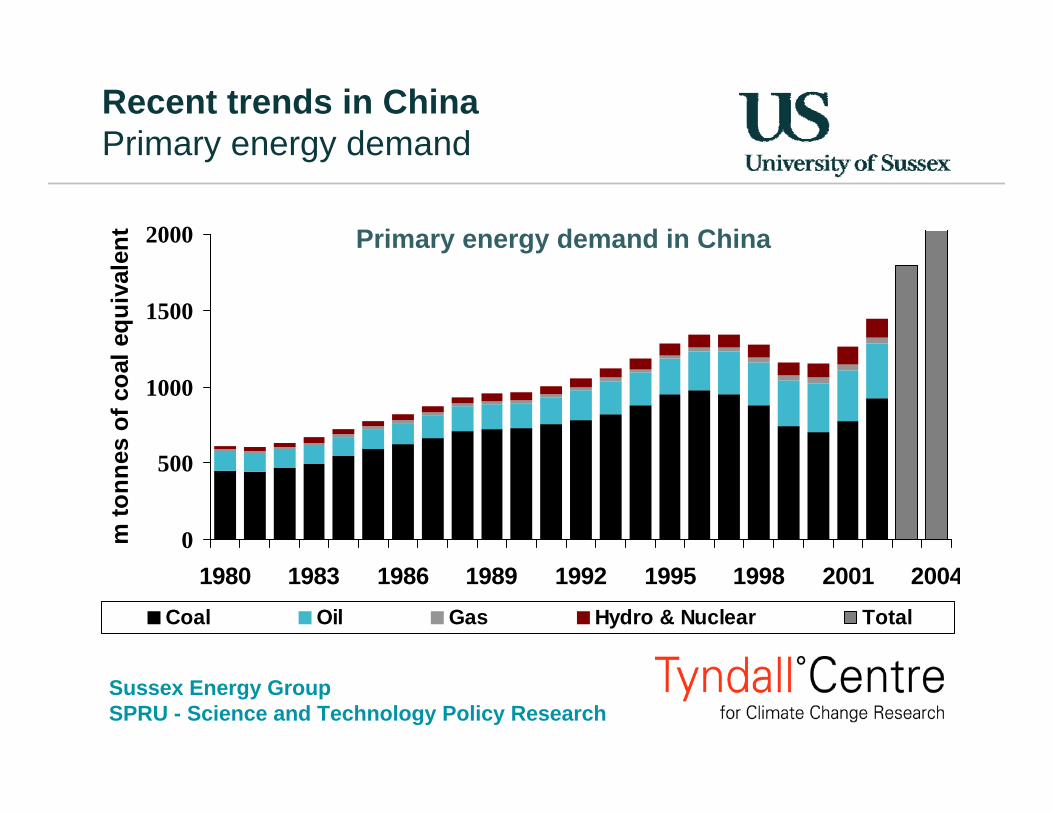
Coal Oil Gas Hydro & Nuclear Total
Recent trends in ChinaPrimary energy demand
Primary energy demand in China
Sussex Energy GroupSPRU - Science and Technology Policy Research
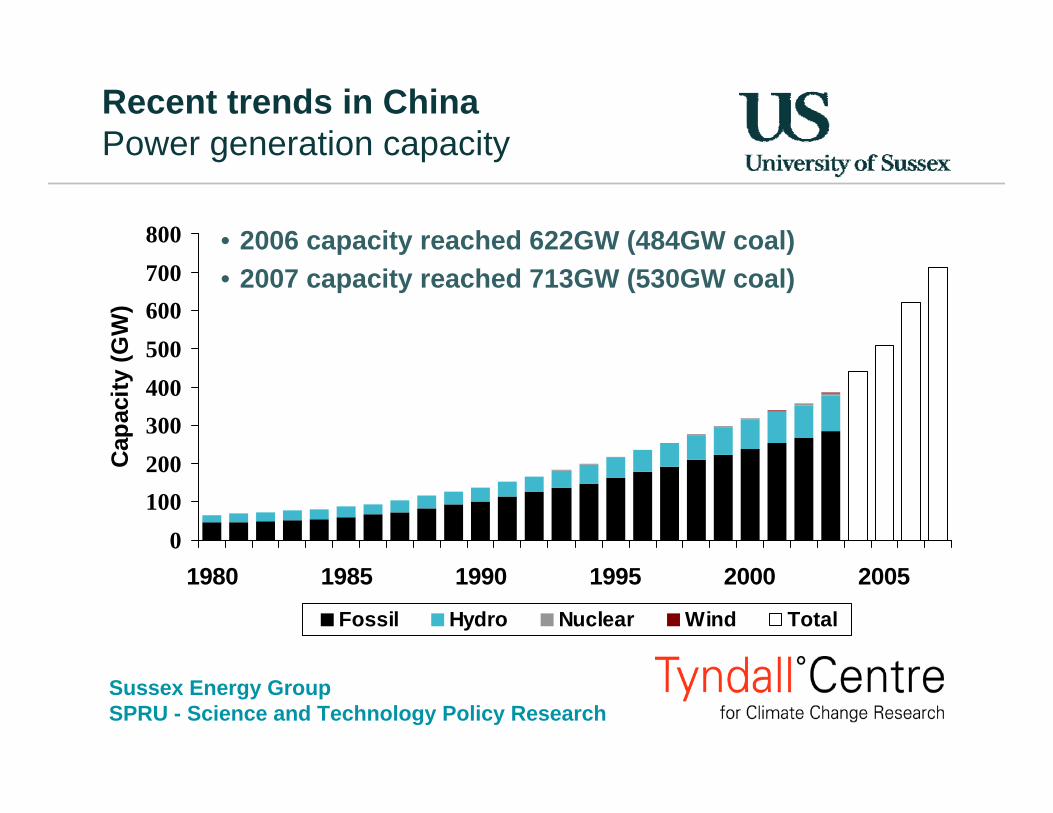
0100200300400500600700800
1980 1985 1990 1995 2000 2005
Cap
acity
(GW
)
Fossil Hydro Nuclear Wind Total
Recent trends in China Power generation capacity
• 2006 capacity reached 622GW (484GW coal)• 2007 capacity reached 713GW (530GW coal)
Sussex Energy GroupSPRU - Science and Technology Policy Research
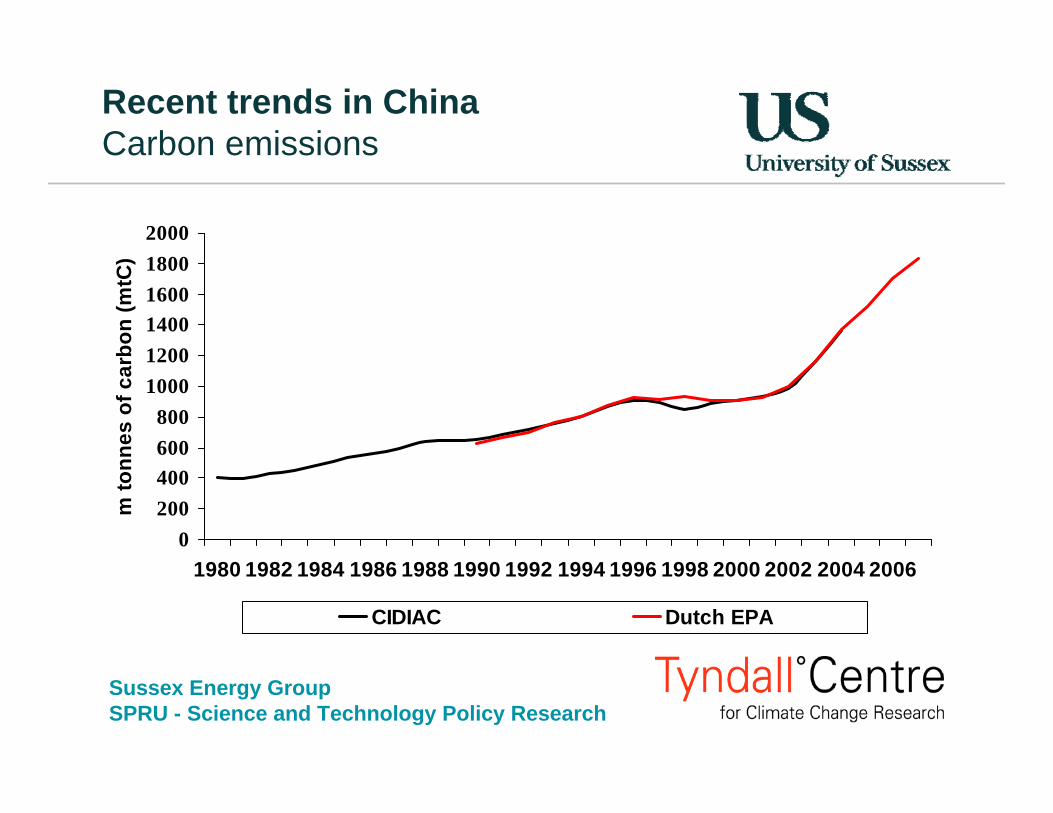
0200400600800
100012001400160018002000
1980 1982 1984 1986 1988 1990 1992 1994 1996 1998 2000 2002 2004 2006
m to
nnes
of c
arbo
n (m
tC)
CIDIAC Dutch EPA
Recent trends in China Carbon emissions
Sussex Energy GroupSPRU - Science and Technology Policy Research
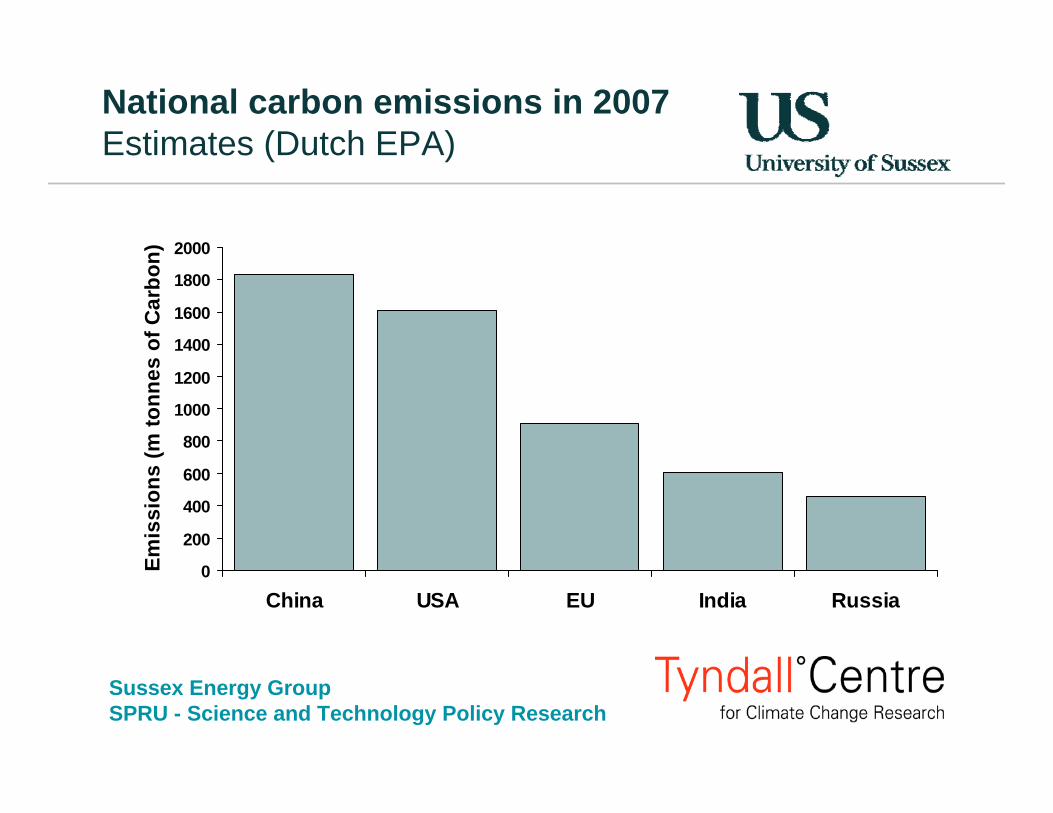
National carbon emissions in 2007Estimates (Dutch EPA)
0
200
400
600
800
1000
1200
1400
1600
1800
2000
China USA EU India Russia
Emis
sion
s (m
tonn
es o
f Car
bon)
Sussex Energy GroupSPRU - Science and Technology Policy Research
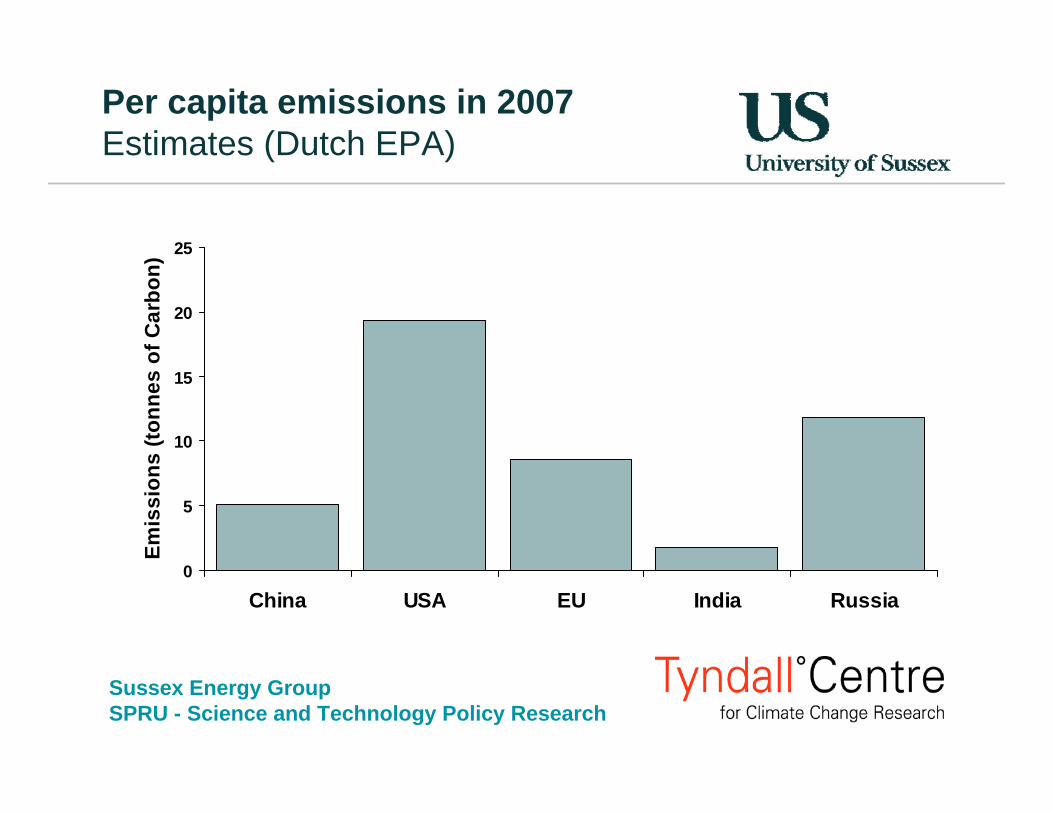
Per capita emissions in 2007Estimates (Dutch EPA)
0
5
10
15
20
25
China USA EU India Russia
Emis
sion
s (to
nnes
of C
arbo
n)
Sussex Energy GroupSPRU - Science and Technology Policy Research
China also faces serious climate change impacts
• Chinese studies project a range of impacts, e.g.– Decreases in agricultural yields and increased costs of food
production– Decreased run-off of rain water in northern China; increased run-
off in Southern China. Adds to water imbalance that is already causing problems
– Expected increases in storms; vulnerability of prosperous coastal zones (e.g. Shanghai) to small sea level rises
• As a result, climate change taken increasingly seriously at national level – focus is reducing energy intensity
• Government has a climate change co-ordinating group and has produced a climate change strategy
Sussex Energy GroupSPRU - Science and Technology Policy Research
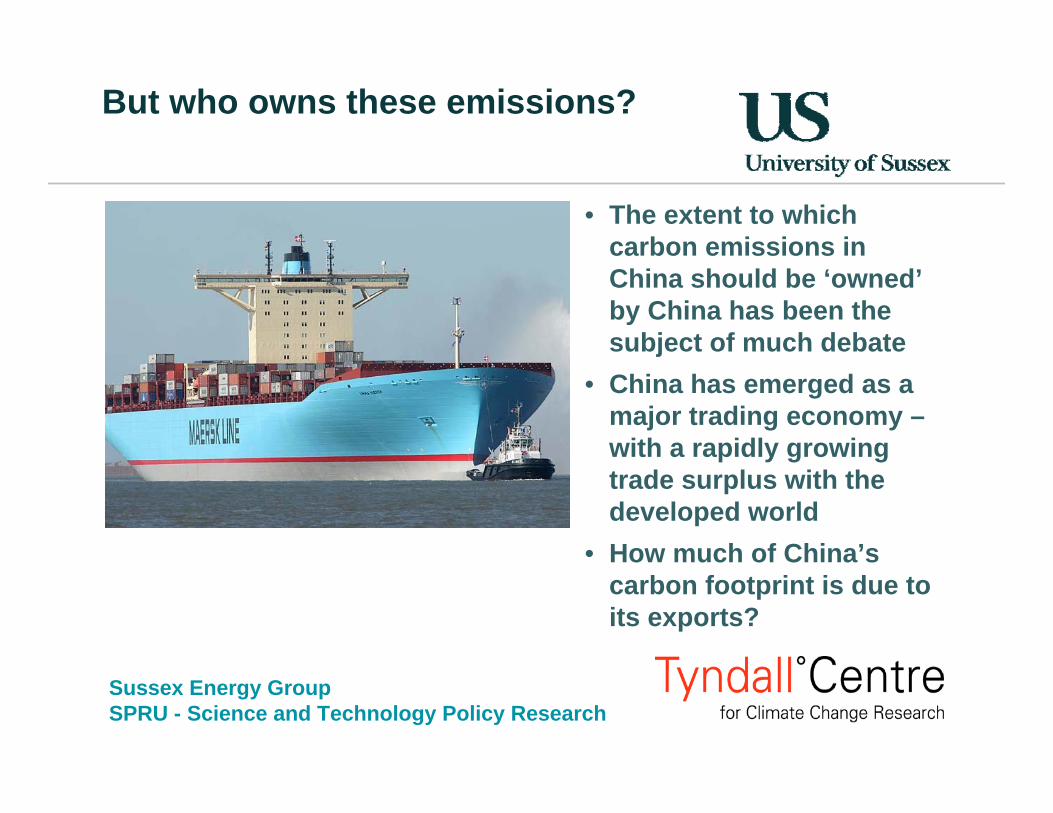
• The extent to which carbon emissions in China should be ‘owned’by China has been the subject of much debate
• China has emerged as a major trading economy –with a rapidly growing trade surplus with the developed world
• How much of China’s carbon footprint is due to its exports?
But who owns these emissions?
Sussex Energy GroupSPRU - Science and Technology Policy Research
• Headline results:– Emissions from exports in 2004 :1490 million tonnes of CO2
– Emissions avoided due to imports: 381 million tonnes of CO2
– Combining these, 23% of China’s emissions due to net exports
• One reason is large (& growing) trade surplus: tripled between 2004 and 2005 to $102bn, rose again to $177 bn in 2006, and over $250bn in 2007
• Another reason is relatively high carbon intensity of Chinese economy. In 2000, the US produced 0.5 kg CO2 per dollar of economic activity whereas China produced 2.76kg per dollar
• This result challenges production-based emissions targets, and suggests that consumption-based targets could be better
Who owns China’s emissions?
Sussex Energy GroupSPRU - Science and Technology Policy Research
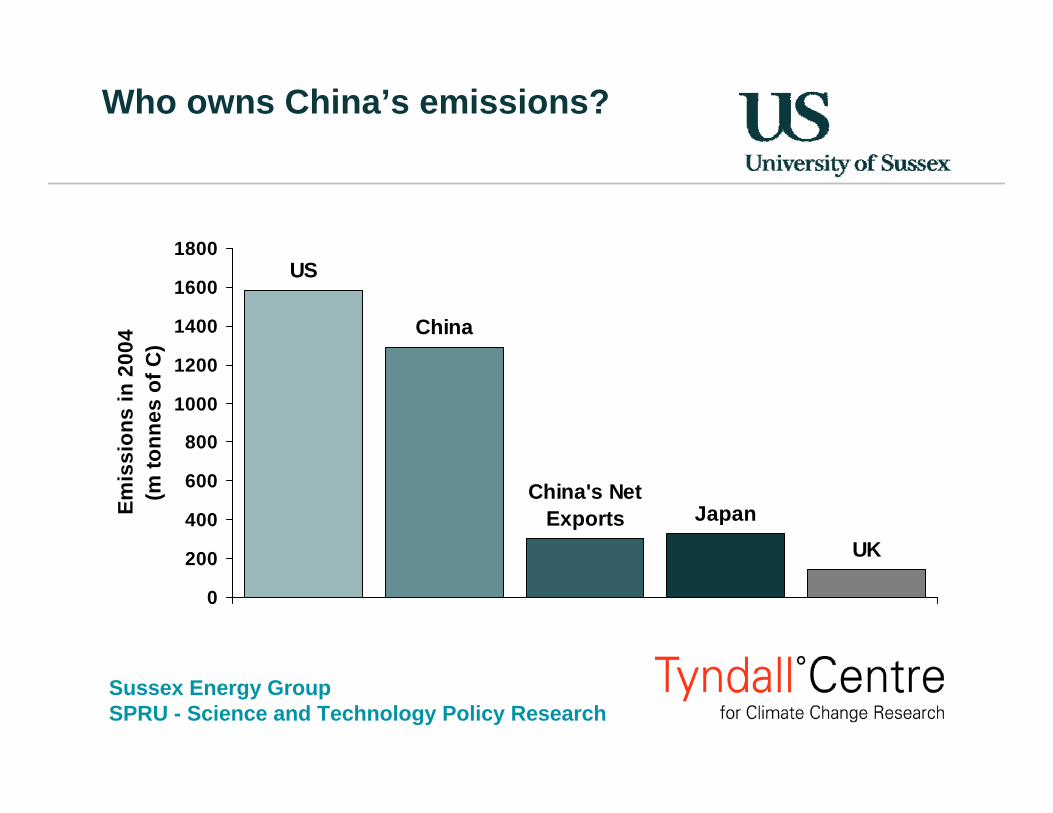
Who owns China’s emissions?
US
China
China's Net Exports Japan
UK
0
200
400
600
800
1000
1200
1400
1600
1800
Emis
sion
s in
200
4(m
tonn
es o
f C)
Sussex Energy GroupSPRU - Science and Technology Policy Research
Analysing future emissionsA carbon budget approach
• The main aim of our Tyndall Centre project is to develop a set of scenarios to explore future carbon emissions in China – and analyse implications
• There are a number of scenario options – e.g. exploratory or more goal-driven
• We are using a cumulative emissions method so scenarios meet a specific target; used previously by Tyndall for the UK
• Tyndall’s scenario tool enables us to quantify possible trends in different Chinese sectors (e.g. transport & households)
• Collaborating with organisations in the UK & China, including workshops in Beijing and London to discuss key features
Sussex Energy GroupSPRU - Science and Technology Policy Research
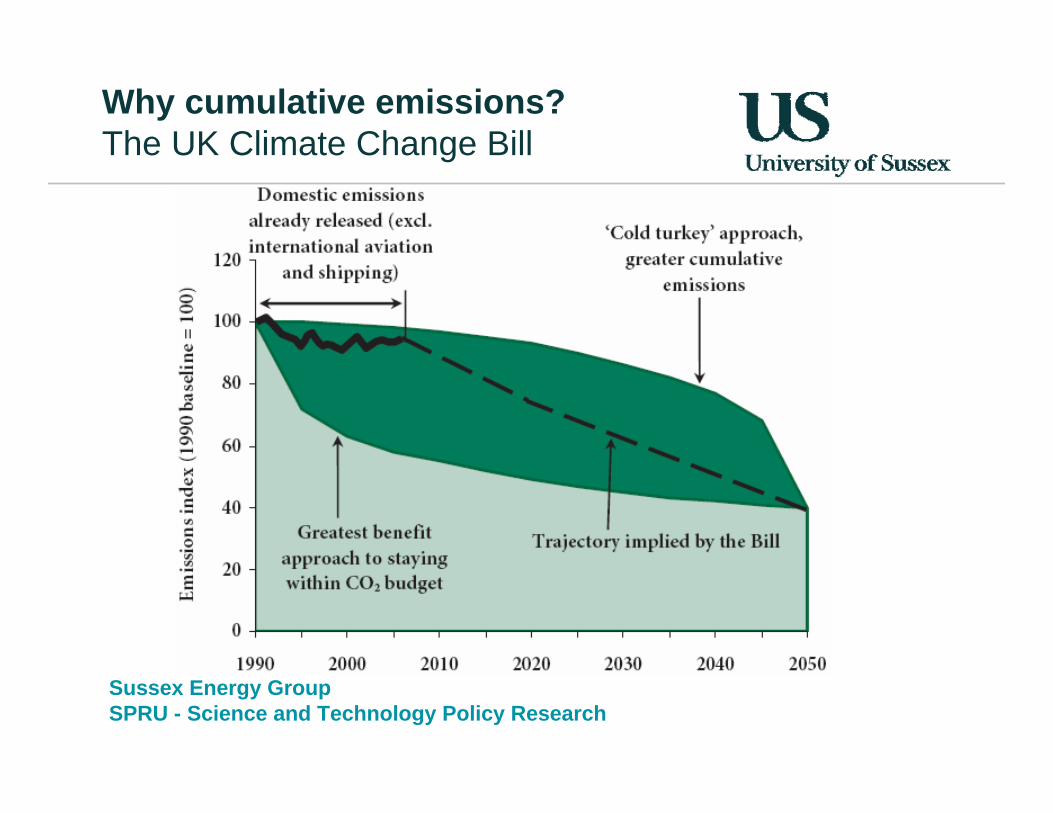
Why cumulative emissions?The UK Climate Change Bill
Sussex Energy GroupSPRU - Science and Technology Policy Research
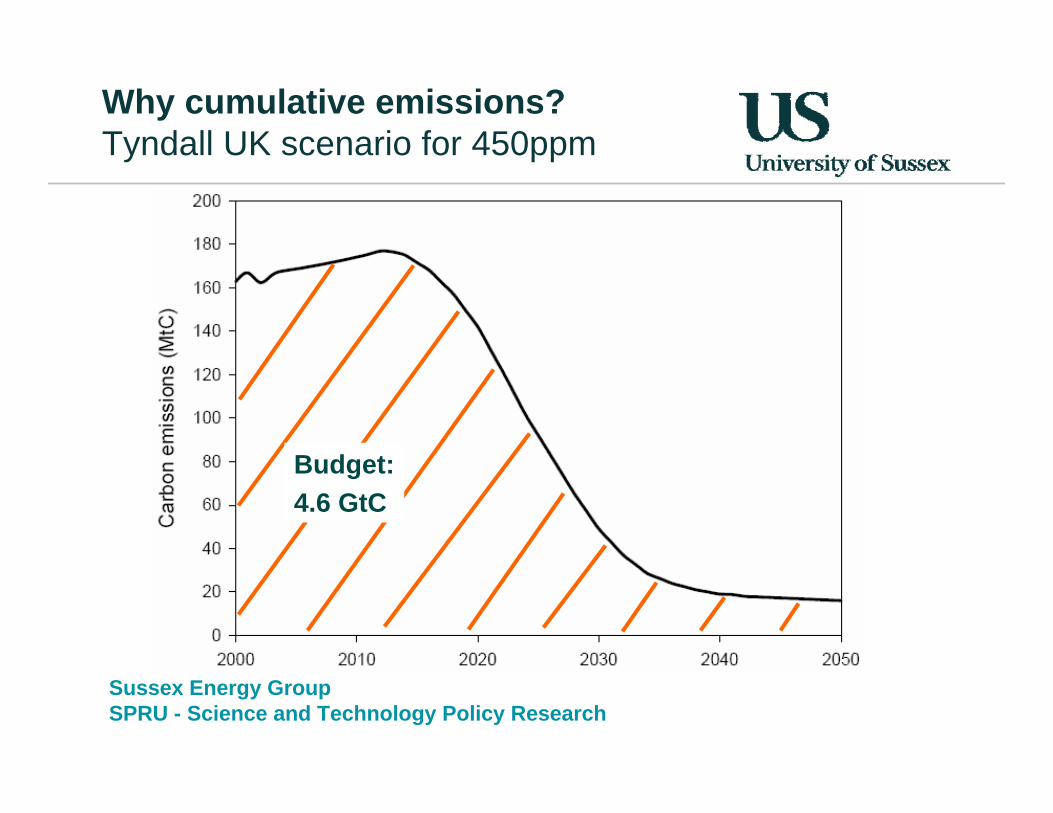
Why cumulative emissions?Tyndall UK scenario for 450ppm
Budget:4.6 GtC
Sussex Energy GroupSPRU - Science and Technology Policy Research
Analysing future emissionsA carbon budget approach
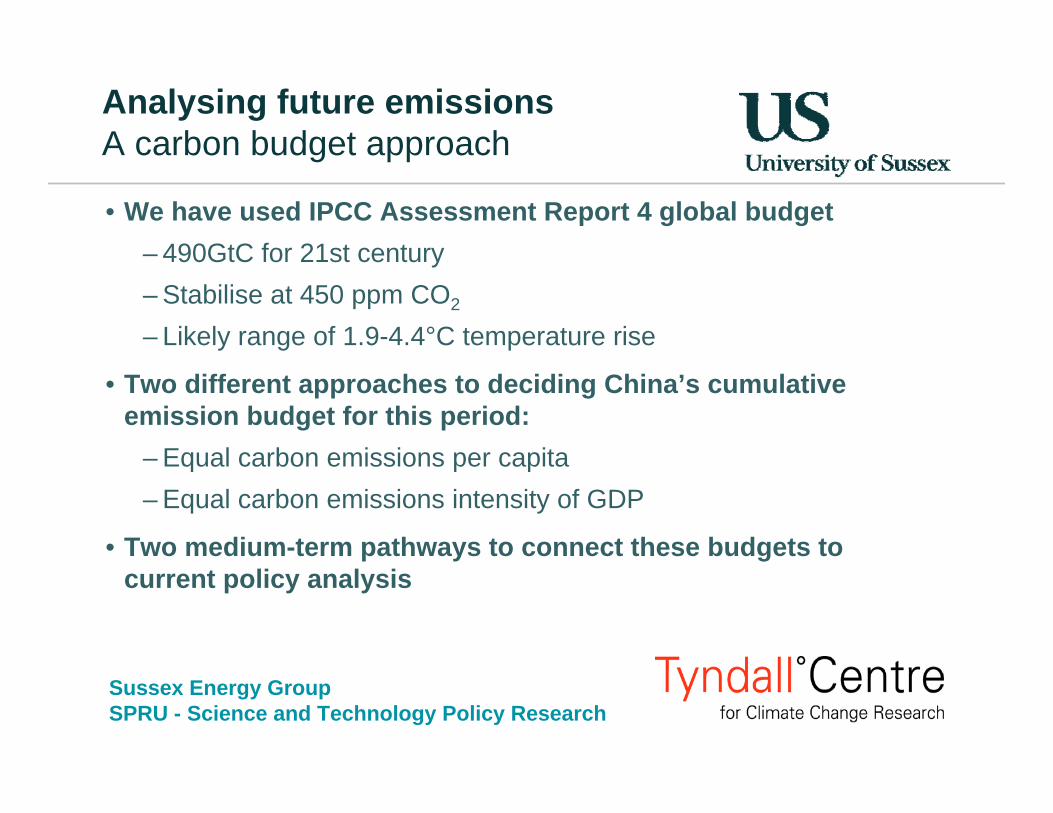
• We have used IPCC Assessment Report 4 global budget– 490GtC for 21st century– Stabilise at 450 ppm CO2
– Likely range of 1.9-4.4°C temperature rise
• Two different approaches to deciding China’s cumulative emission budget for this period:
– Equal carbon emissions per capita– Equal carbon emissions intensity of GDP
• Two medium-term pathways to connect these budgets to current policy analysis
Sussex Energy GroupSPRU - Science and Technology Policy Research
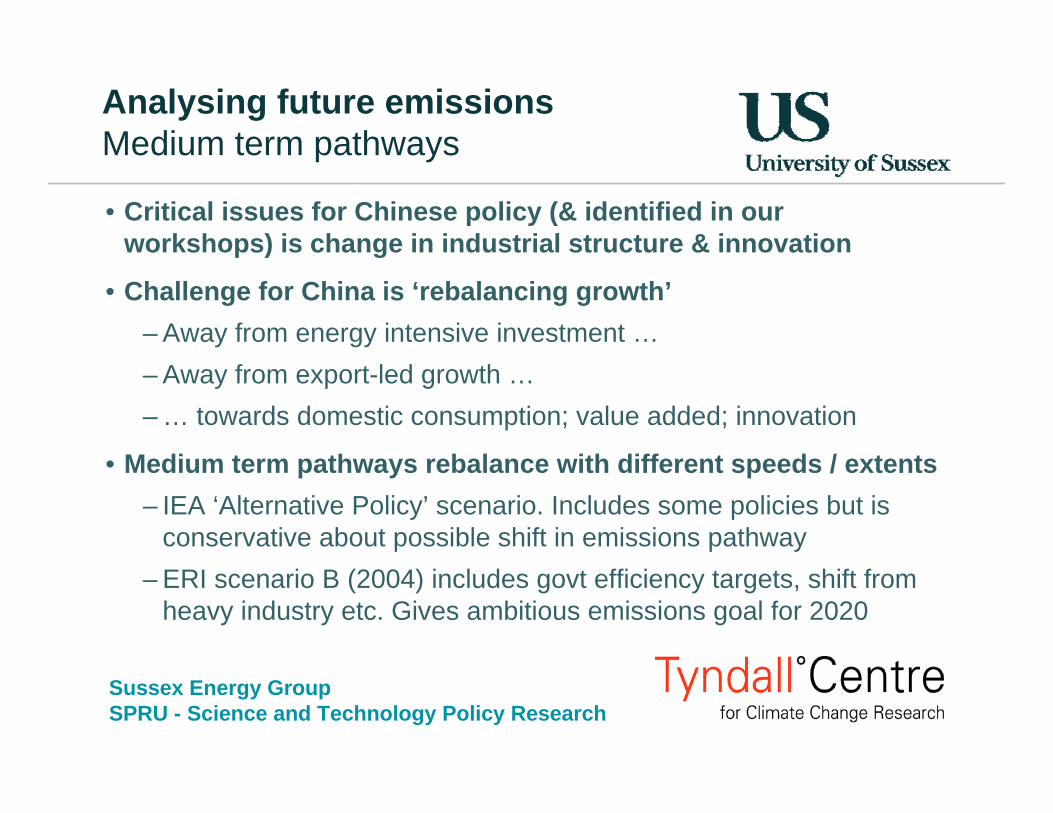
Analysing future emissionsMedium term pathways
• Critical issues for Chinese policy (& identified in our workshops) is change in industrial structure & innovation
• Challenge for China is ‘rebalancing growth’– Away from energy intensive investment …– Away from export-led growth …– … towards domestic consumption; value added; innovation
• Medium term pathways rebalance with different speeds / extents– IEA ‘Alternative Policy’ scenario. Includes some policies but is
conservative about possible shift in emissions pathway– ERI scenario B (2004) includes govt efficiency targets, shift from
heavy industry etc. Gives ambitious emissions goal for 2020
Sussex Energy GroupSPRU - Science and Technology Policy Research
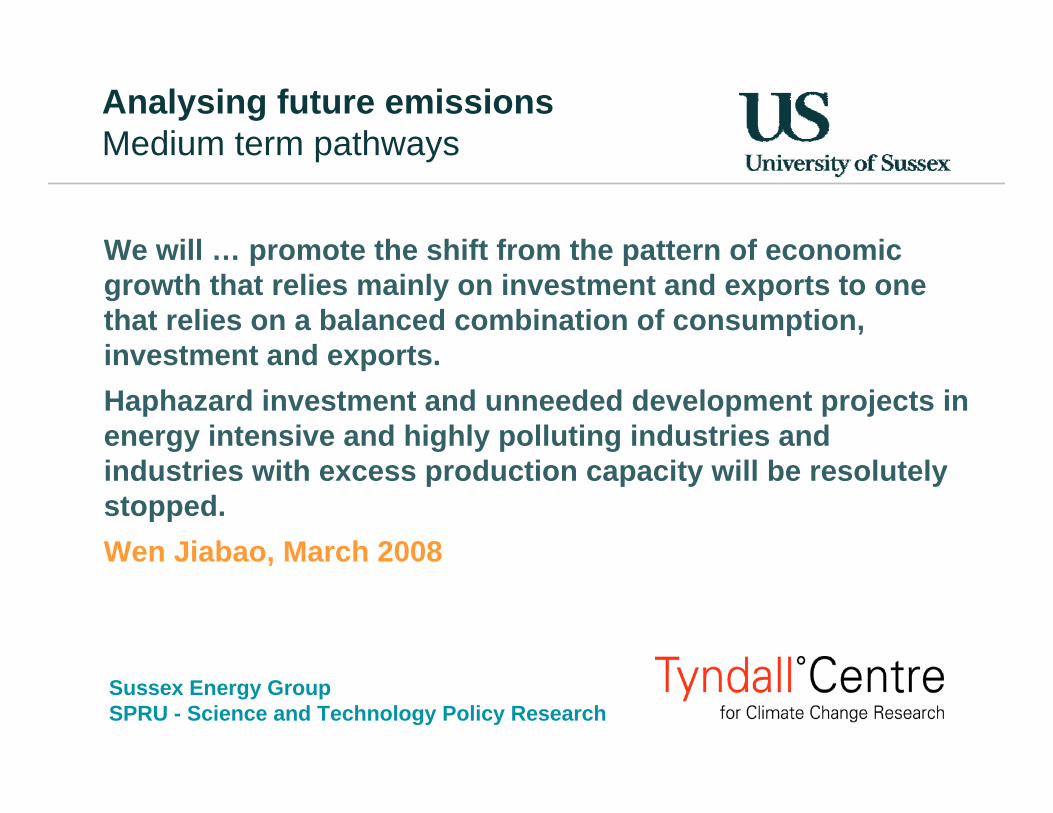
Analysing future emissionsMedium term pathways
We will … promote the shift from the pattern of economic growth that relies mainly on investment and exports to one that relies on a balanced combination of consumption, investment and exports.Haphazard investment and unneeded development projects in energy intensive and highly polluting industries and industries with excess production capacity will be resolutely stopped.Wen Jiabao, March 2008
Sussex Energy GroupSPRU - Science and Technology Policy Research
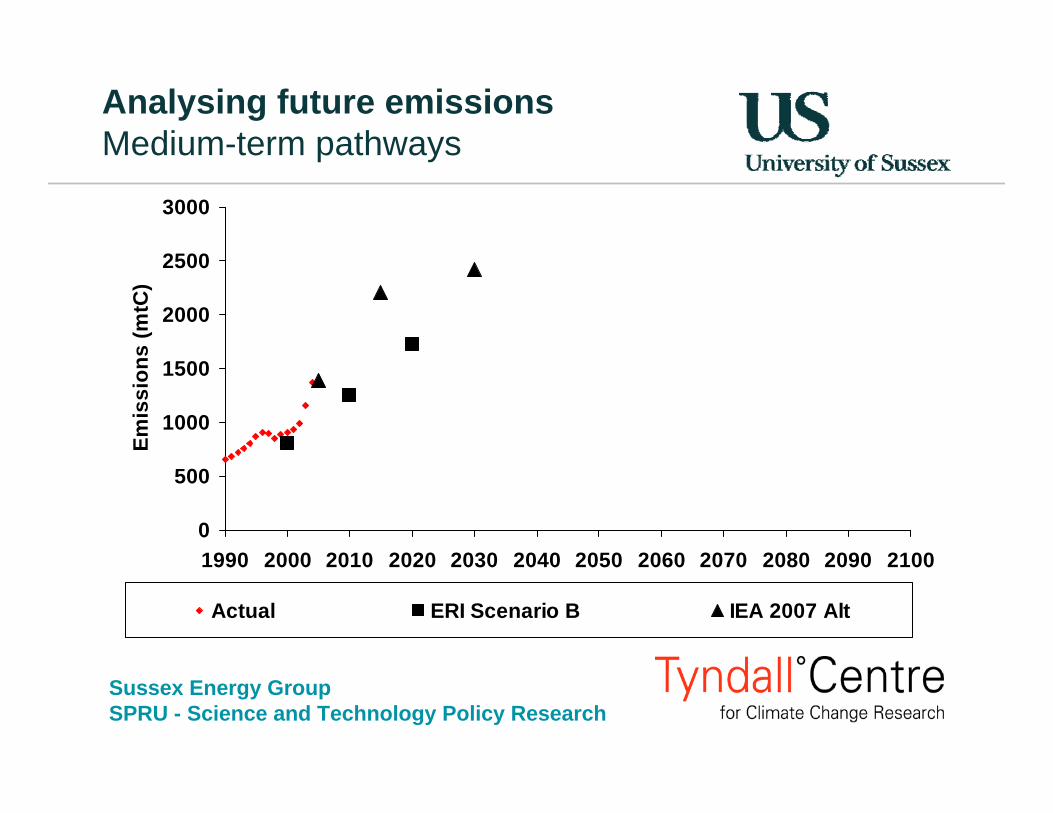
Analysing future emissionsMedium-term pathways
0
500
1000
1500
2000
2500
3000
1990 2000 2010 2020 2030 2040 2050 2060 2070 2080 2090 2100
Emis
sion
s (m
tC)
Actual ERI Scenario B IEA 2007 Alt
Sussex Energy GroupSPRU - Science and Technology Policy Research
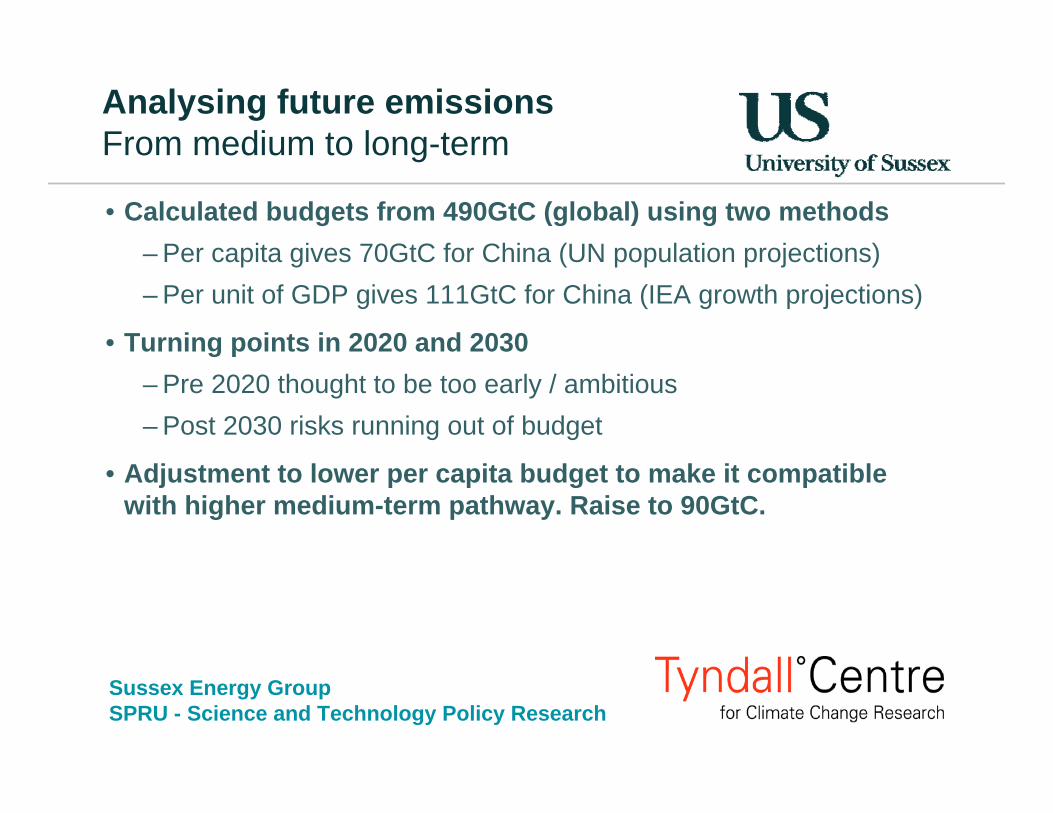
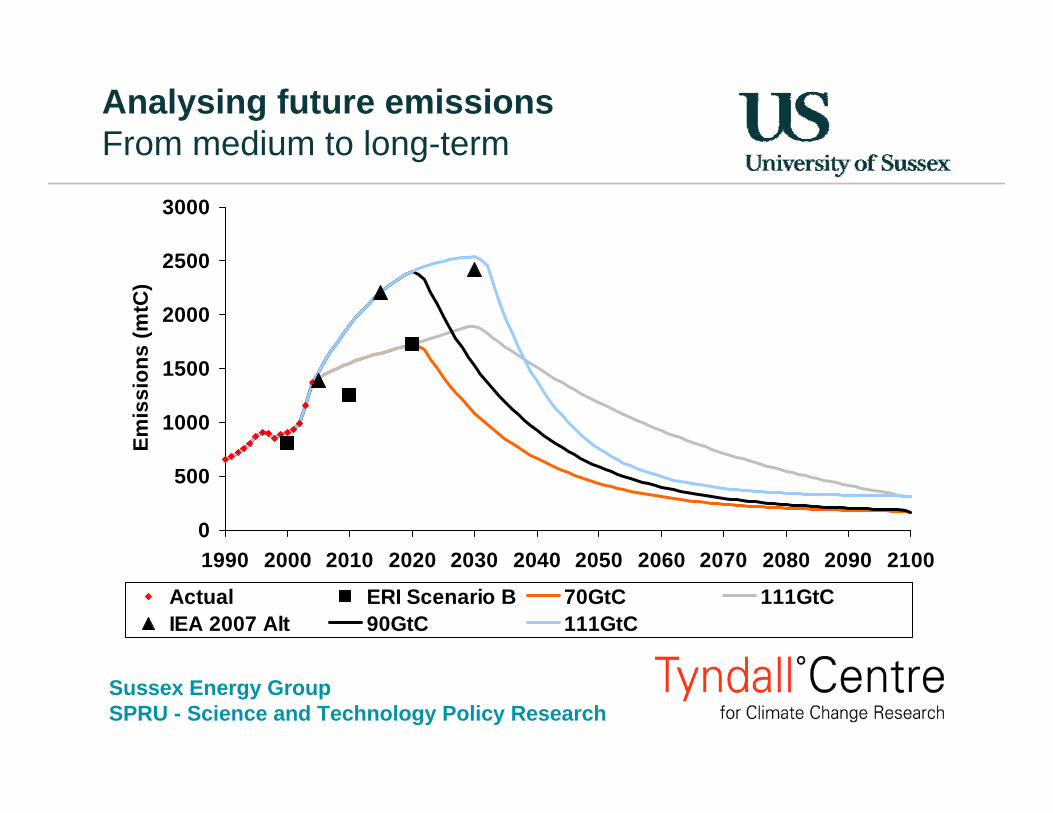
Analysing future emissionsFrom medium to long-term
• Calculated budgets from 490GtC (global) using two methods– Per capita gives 70GtC for China (UN population projections)– Per unit of GDP gives 111GtC for China (IEA growth projections)
• Turning points in 2020 and 2030– Pre 2020 thought to be too early / ambitious– Post 2030 risks running out of budget
• Adjustment to lower per capita budget to make it compatible with higher medium-term pathway. Raise to 90GtC.
Sussex Energy GroupSPRU - Science and Technology Policy Research
Analysing future emissionsFrom medium to long-term
0
500
1000
1500
2000
2500
3000
1990 2000 2010 2020 2030 2040 2050 2060 2070 2080 2090 2100
Emis
sion
s (m
tC)
Actual ERI Scenario B 70GtC 111GtCIEA 2007 Alt 90GtC 111GtC
Sussex Energy GroupSPRU - Science and Technology Policy Research
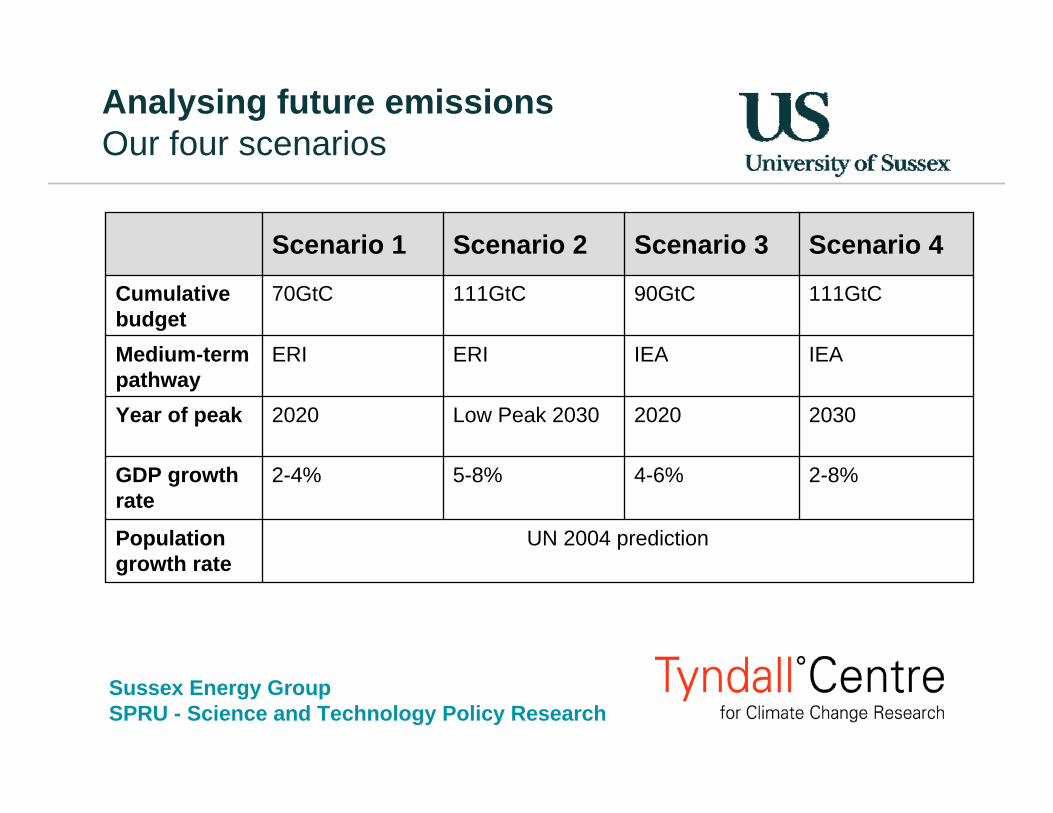
Analysing future emissionsOur four scenarios
UN 2004 predictionPopulation growth rate
2-8%4-6%5-8%2-4%GDP growth rate
20302020Low Peak 20302020Year of peak
IEAIEAERIERIMedium-term pathway
111GtC90GtC111GtC70GtCCumulative budget
Scenario 4Scenario 3Scenario 2Scenario 1
Sussex Energy GroupSPRU - Science and Technology Policy Research
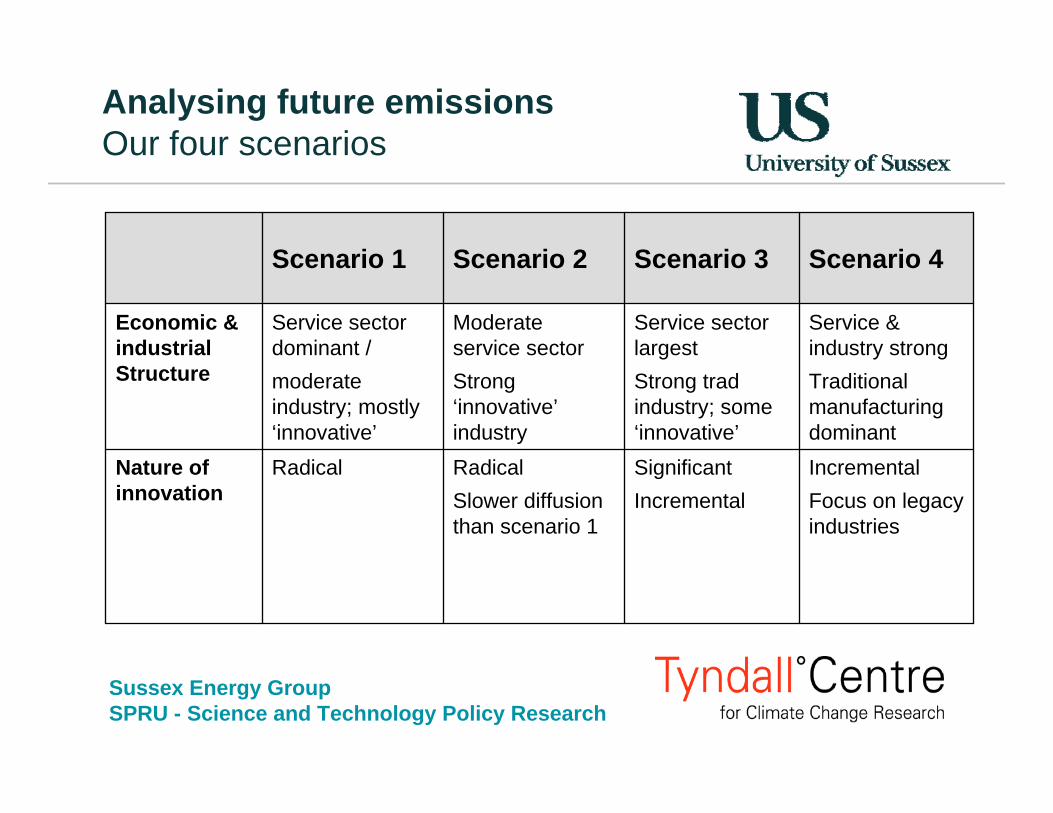
Analysing future emissionsOur four scenarios
IncrementalFocus on legacy industries
Significant Incremental
RadicalSlower diffusion than scenario 1
RadicalNature of innovation
Service & industry strongTraditional manufacturing dominant
Service sector largestStrong trad industry; some ‘innovative’
Moderate service sector Strong ‘innovative’industry
Service sector dominant / moderate industry; mostly ‘innovative’
Economic & industrial Structure
Scenario 4Scenario 3Scenario 2Scenario 1
Sussex Energy GroupSPRU - Science and Technology Policy Research
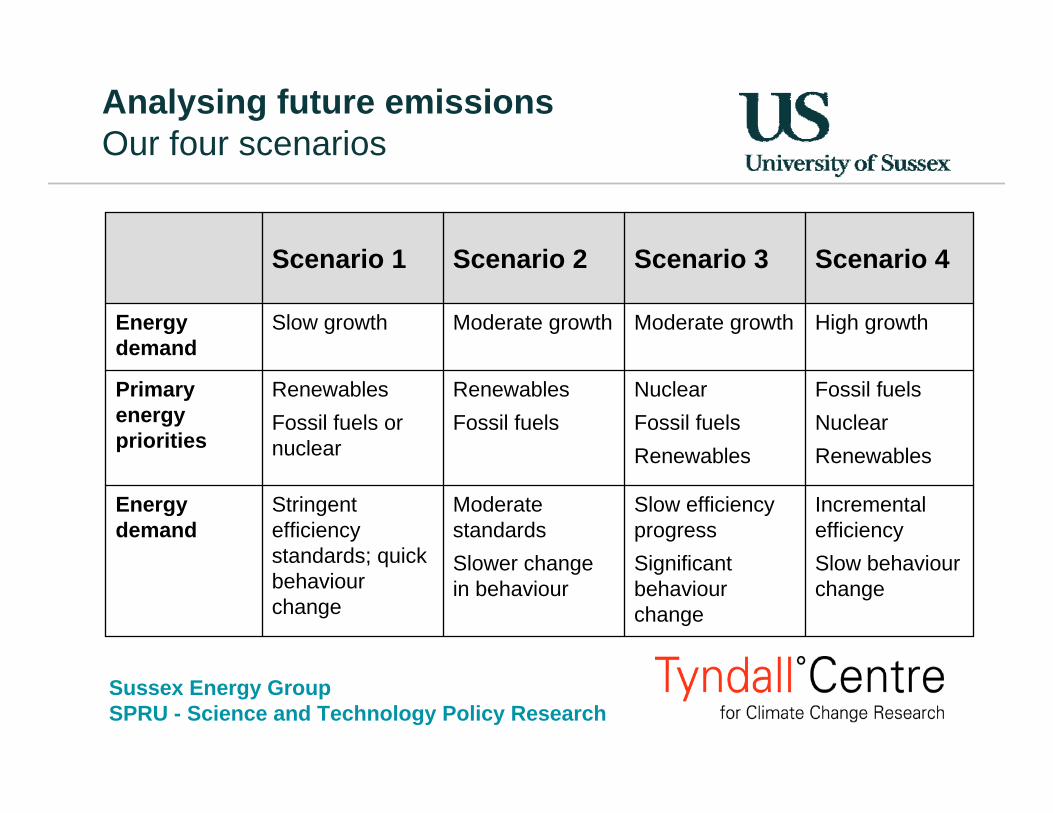
Analysing future emissionsOur four scenarios
Incremental efficiencySlow behaviour change
Slow efficiency progressSignificant behaviour change
Moderate standardsSlower change in behaviour
Stringent efficiency standards; quick behaviour change
Energy demand
Fossil fuels Nuclear Renewables
NuclearFossil fuels Renewables
Renewables Fossil fuels
RenewablesFossil fuels or nuclear
Primary energy priorities
High growthModerate growthModerate growthSlow growthEnergy demand
Scenario 4Scenario 3Scenario 2Scenario 1
Sussex Energy GroupSPRU - Science and Technology Policy Research
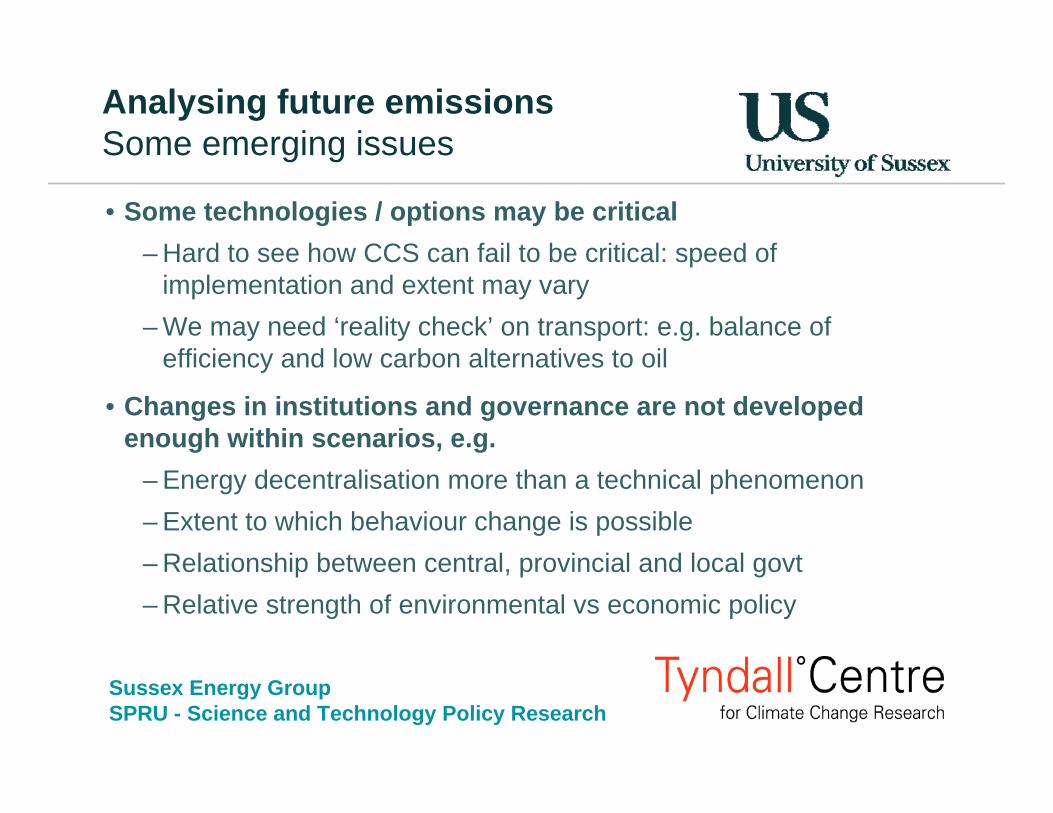
• Some technologies / options may be critical– Hard to see how CCS can fail to be critical: speed of
implementation and extent may vary– We may need ‘reality check’ on transport: e.g. balance of
efficiency and low carbon alternatives to oil
• Changes in institutions and governance are not developed enough within scenarios, e.g.
– Energy decentralisation more than a technical phenomenon– Extent to which behaviour change is possible– Relationship between central, provincial and local govt– Relative strength of environmental vs economic policy
Analysing future emissionsSome emerging issues
Sussex Energy GroupSPRU - Science and Technology Policy Research
• Draft working paper summarises scenarios so far: comments are welcome
• Iterative process with spreadsheet tool so changes in emissions in different sectors fit within overall carbon budget
• Identify critical areas for early action that are common across most scenarios
• Develop policy implications: for China and for international community (especially UK)
• Launch of final results in early 2009
Next steps
Sussex Energy GroupSPRU - Science and Technology Policy Research
Thanks
http://www.sussex.ac.uk/sussexenergygroup