future funding outlook for councils
DESCRIPTION
A report published by the Local Government Association on the future of financing local government. This is an interim update of our 2014 analysis. It sets out the financial challenge faced by councils that the government needs to consider when making decisions in the July Budget and the autumn Spending Review.TRANSCRIPT

1 Future funding outlook for councils 2019/20
Future funding outlook for councils 2019/20
Interim 2015 update
June 2015
www.local.gov.uk

3 Future funding outlook for councils 2019/20
Executive summary 4
Introduction 6
The path of council spending 8
The path of council funding 10
Mapping funding against expenditure 13
Contents
4 Future funding outlook for councils 2019/20
The purpose of this paper is to set out the impact in the local government sector in England of future funding cuts and unavoidable growth pressures on the resources it will have available for services between now and the end of this decade.
Councils are continuing to balance their budgets and fulfil their statutory obligations as well as delivering a range of services to promote growth and community cohesion. Each year they close the funding gap in the face of funding cuts and expenditure pressures.
This is an interim update of our 2014 analysis. It sets out the financial challenge faced by councils that the government needs to consider when making decisions in the July Budget and the autumn Spending Review. This analysis will be updated and finalised following the Spending Review announcements.
Based on applying the projections for departmental spending implied by the March 2015 edition of the OBR’s economic and fiscal outlook1, the funding gap will grow to £10.3 billion by 2018/19, before an increase in funding in 2019/20 reduces the gap to £9.5 billion.
1 http://budgetresponsibility.org.uk/economic-fiscal-outlook-march-2015/
To maintain the same level of service councils provided in 2014/15, a funding gap of £6 billion opens up by 2016/17 alone.
The current Government has not yet made its intentions for departmental spending clear which means that the assumptions of the OBR are subject to change too. For example, based on the same trajectory of cuts that was experienced during the previous Parliament, the funding gap for councils would grow to £10.8 billion by 2019/20.
Assuming authorities can continue making efficiencies at between 1 per cent and 2 per cent per year, the model predicts an increase in expenditure in cash terms of 1.6 per cent per year to maintain the existing level of service.
With social care and waste spending absorbing a rising proportion of the resources available to councils, funding for other council services drops by 35 per cent in cash terms by the end of the decade, from £26.6 billion in 2010/11 to £17.2 billion in 2019/20. To put this in context, this £9.3 billion drop is greater than the £7.7 billion total expenditure (in 2014/15) on central services, ‘other’ services and capital financing combined. The challenge cannot be solved by back-office efficiencies alone.
Executive summary

5 Future funding outlook for councils 2019/20
The Better Care Fund does not fully fund the adult social care funding gap for the period.
Authorities will have different strategies in relation to the use of reserves, but using up reserves more quickly increases risks to services and does not reduce the gap to be closed. Under our assumptions, authorities use £3.0 billion of their reserves in the five years to 2019/20.
A sustainable future for local services in the face of funding cuts and spending pressures is dependent upon changes in the way we think about funding local services, and how we manage the system. The Local Government Association will set out the ways in which the system can be changed to make local services sustainable in its forthcoming publication ‘A shared commitment’.
As stated above, this is an interim update of our 2014 analysis. Should the in year cuts of 3 per cent that HM Treasury is reportedly asking departments to make affect the local government baseline in either 2015/16 or 2016/17, this would add about £600 million to the funding gap in that year and the total gap in 2019/20 would rise to £10.1 billion. We will be in a better position to understand this and the overall trajectory of public spending following the Budget on 8 July and the autumn Spending Review, after which we will produce a final document.
6 Future funding outlook for councils 2019/20
Introduction
Each year since 2012 the LGA published reports on its future funding model for councils. The aim of these papers has always been to present a credible analysis of the challenges facing local councils over the course of the decade. They highlighted the large and growing funding gap for English local government caused by spending pressures and funding reductions.
This current fourth iteration of the model is a further refinement on previous modelling and again shows a growing funding gap, although with each year that passes local government continues to close the gap and deliver a balanced budget as per its legal duty to do so.
The Government is set to make significant public spending decisions in the July Budget and the autumn Spending Review. Due to the resulting uncertainty, the interim update assumes that reductions will be in line with the public spending forecasts of the independent Office of Budget Responsibility, contained within the March 2015 edition of the Economic and Fiscal Outlook report.
The use of OBR projections means that, for the first time, our headline funding gap will not continue to grow ad infinitum, but from 2019/20 will slowly start to close.
Our analysis is built from:
• projections of total annual net revenue spending in ten principal service blocks within council budgets over the period to 2019/20
• projections of council tax, business rates, grant and other income streams over the period to 2019/20.
We have projected likely expenditure pressures in all service areas, while recognising that councils are actively taking steps to mitigate cost pressures by reforming the way they deliver services. LGA research suggests that this has been achieved to date partly through innovative methods of service delivery, but partly by a reduction in the level of services councils can offer2.
Expenditure is split into ten service blocks as follows (in approximate order of size):
• social care
• education (excluding schools funding via the Dedicated Schools Grant)
• environment including waste
• highways, roads and transport
• housing (not including housing revenue account (HRA) or housing benefit)
• public health3
• culture, recreation and sport
• planning and development
• regulatory
• other services.
2 Under Pressure, LGA 20143 Public health expenditure starts in 2013/14 although this
is assumed to be funded in full by ringfenced Public Health Grant.

7 Future funding outlook for councils 2019/20
Since 2012, the future funding outlook modelling has interpreted the impact of funding cuts on local authority budgets. The model now contains four years of outturn expenditure data, one year of budgeted expenditure data, and five years of LGA projections. This report separates expenditure into two distinct periods – what has happened to date, and what might happen in the remaining years.
Grant figures in six of the 10 years covered by the model are from published data and only the last four are derived from our projections.
We have modelled all future sources of council funding to the end of this decade. We have used councils’ estimates of their local rates collection in the first two years of the rates retention system, and projected forward from this data. We see that as a whole, England is performing slightly better under rates retention than the ‘baseline’ funding level, and as we would expect, there are disparities in the impact of rates retention on individual authorities.
There are inevitably areas that cannot be predicted by the model; in particular the additional pressures created by welfare reform, by local government pension revaluations, and the unknown costs to upper-tier authorities of implementing the proposals in the Care Act.
There is also the introduction of the single state pension in 2016, which will increase employers’ national insurance contributions for councils with no compensating new burdens payment. Different local areas will have their own local pressures and priorities, such as policies on the introduction of the Living Wage for council staff. Because the impacts of these high-risk areas are inherently uncertain, and very dependent on local circumstances, they have been excluded from the model.
We believe this model presents the most comprehensive picture available of the likely path of funding cuts and spending pressures across the sector.
8 Future funding outlook for councils 2019/20
The path of council spending
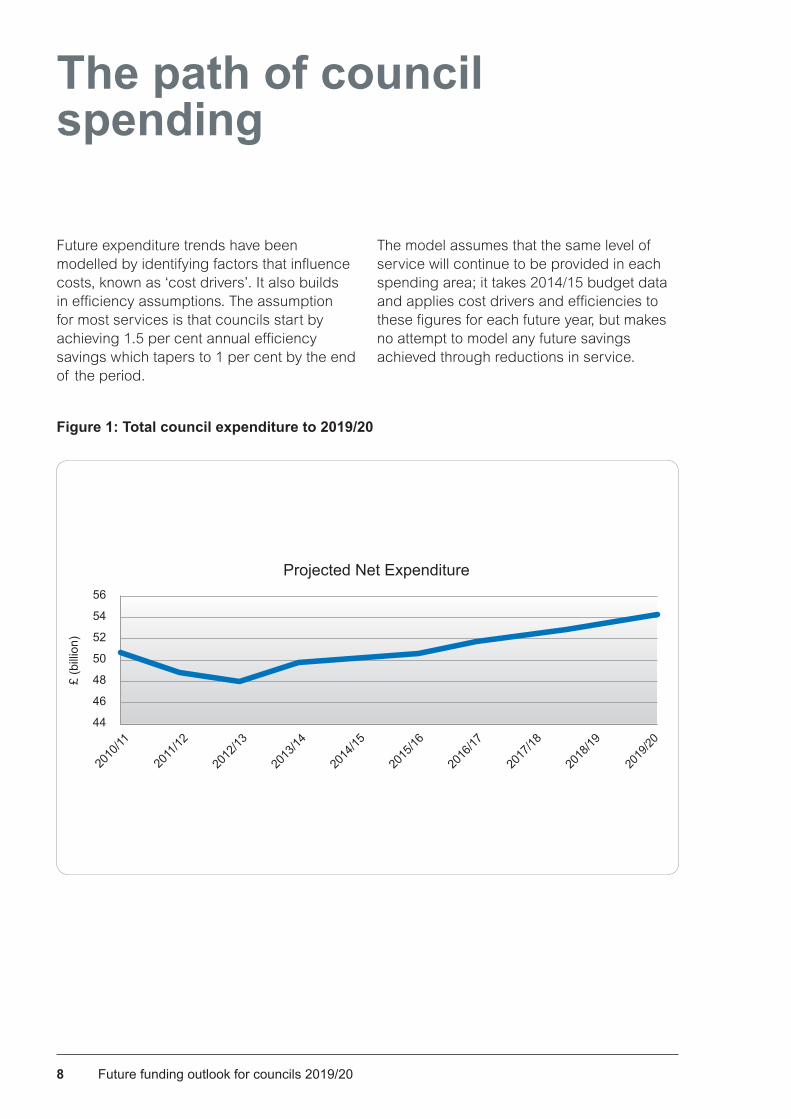
Future expenditure trends have been modelled by identifying factors that influence costs, known as ‘cost drivers’. It also builds in efficiency assumptions. The assumption for most services is that councils start by achieving 1.5 per cent annual efficiency savings which tapers to 1 per cent by the end of the period.
The model assumes that the same level of service will continue to be provided in each spending area; it takes 2014/15 budget data and applies cost drivers and efficiencies to these figures for each future year, but makes no attempt to model any future savings achieved through reductions in service.
56
54
52
50
48
46
44
£ (b
illio
n)
2013
/14
2014
/15
2015
/16
2016
/17
2017
/18
2018
/19
2019
/20
2010
/11
2011
/12
2012
/13
Projected Net Expenditure
Figure 1: Total council expenditure to 2019/20

9 Future funding outlook for councils 2019/20
The projected path of future expenditure is shown in figure 1. This shows that, at current service levels, total expenditure will rise from £50.3 billion in 2014/15 to £54.3 billion in 2019/20, the annual rate of increase stabilising at 1.6 per cent per annum in cash terms by 2019/20.
We have again modelled no real increase in local government salaries, although this becomes a less and less realistic assumption: councils will find it harder to fill vacancies by offering wage rates lower than those in private sector employers for similar jobs. In order to attract staff councils might be forced to re-grade posts upwards, putting further pressure on expenditure.
We can see the effect that different assumptions have on the overall level of expenditure in Figure 2. If we assumed no increase in fees and charges for example this would increase expenditure in 2019/20 by £0.6 billion.
Assuming no efficiency savings would increase expenditure by £3.9 billion. Altogether, assumptions on sales, fees and charges and efficiencies have reduced overall forecast expenditure in 2019/20 by £4.5 billion, or 9 per cent. This makes it clear that the scenario shown in the model is not an overly pessimistic one, and any variance that emerges as a result of ‘real world’ factors is likely to widen the gap rather than help close it.
Figure 2: Total council service expenditure 2010/11 to 2019/20 with different assumptions about efficiencies, fees and charges
2013
/14
2014
/15
2015
/16
2016
/17
2017
/18
2018
/19
2019
/20
2010
/11
2011
/12
2012
/13
70
65
60
55
50
45
40
Central assumptions
No increases in fees and charges
No efficiencies
No efficiencies or fees and charge increases

10 Future funding outlook for councils 2019/20
The path of council funding
Core funding was reduced by 40 per cent over the course of the previous Parliament, and further reductions are anticipated over the course of the current Parliament.
Our model projects the likely path of all council funding, based on a number of assumptions:
Council tax: We have used actual council tax rates until 2015/16. Average increases have been below 1 per cent for each of the last four years but have risen each year. We have assumed that councils will increase their council tax by 1.0 per cent in 2016/17 and 2017/18, and 1.5 per cent for each of the following two years. It is not clear whether the one per cent freeze grant will continue. We have assumed a modest growth in the tax base.
Business Rates: We have used councils’ individual estimates of their retained business rates in 2015/16. We have assumed future business rates will grow by retail price index (RPI) plus a local area growth estimate.
Grant funding: The position to 2015/16 is based on final grant allocations. From 2016/17 we have applied a change in Local Government Departmental Expenditure Limit based on the March 2015 analysis of the Office of Budget Responsibility. This equates to reductions from 2016/17 to 2018/19 of 12.1 per cent, 11.6 per cent and 4.7 per cent respectively, and an increase of 7.1 per cent in 2019/20.
Better Care Fund: Shared funding with the NHS for Adult Social Care is assumed to fund social care spending by £615 million each year from 2015/16. This is based on an analysis of locally agreed 2015/16 Better Care Fund plans.
Public health: We have used public health funding allocations for 2013/14, 2014/15 and 2015/16, and for subsequent years have assumed that the overall level of funding rises to cover costs. This funding is ring-fenced and thus its impact on the overall funding gap is neutral. We have used the half-year Public Health 0-5 allocations for 2015/16, and doubled these allocations for 2016/17, the first full year in which councils have this responsibility. For subsequent years we have again assumed this service is cost-neutral.
Investment income: We assume that yield will rise with inflation. Most analysts predict that interest rates will increase but the effect of this on councils’ finances is immaterial.
Transfers to and from reserves: The model assumes that each authority will draw up to 5 per cent of its total reserves each year to plug any funding gap, with the reserve level never going below 5 per cent of total annual expenditure. If the funding level in an authority is above projected expenditure then all surplus will be added to reserves for that year. In practice individual authorities will have different strategies based on local analysis of risk and their local financial strategy.
11 Future funding outlook for councils 2019/20
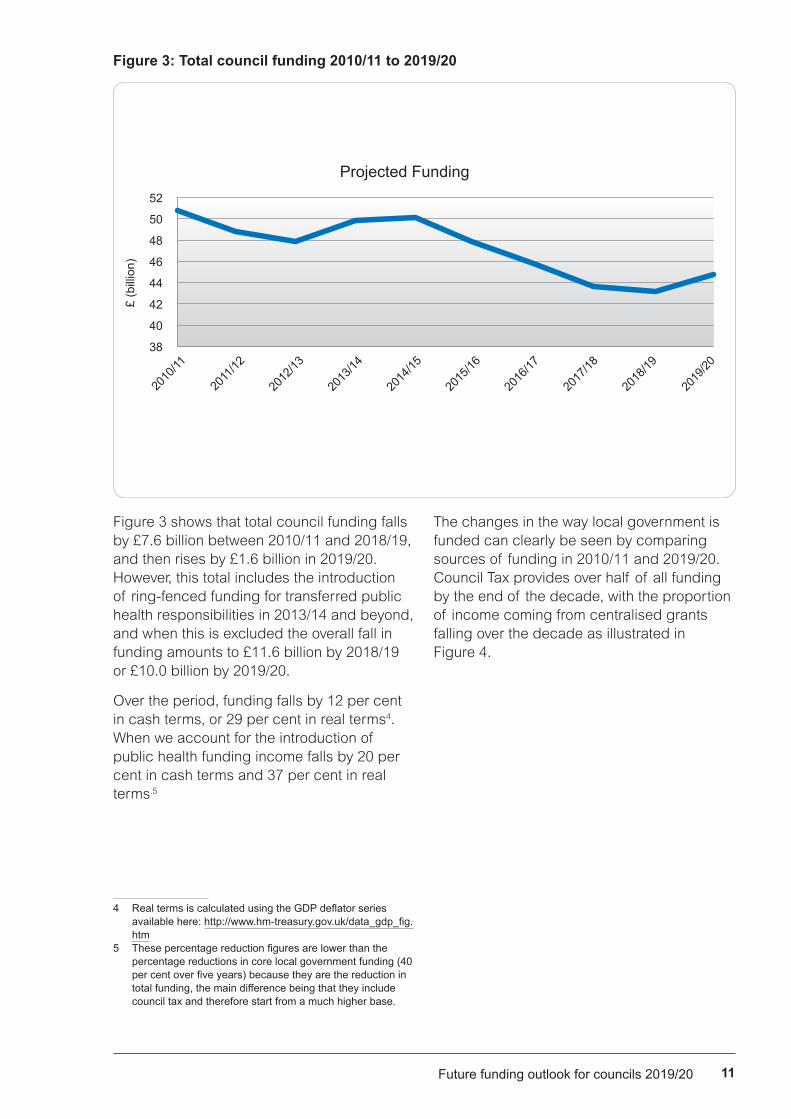
Figure 3 shows that total council funding falls by £7.6 billion between 2010/11 and 2018/19, and then rises by £1.6 billion in 2019/20. However, this total includes the introduction of ring-fenced funding for transferred public health responsibilities in 2013/14 and beyond, and when this is excluded the overall fall in funding amounts to £11.6 billion by 2018/19 or £10.0 billion by 2019/20.
Over the period, funding falls by 12 per cent in cash terms, or 29 per cent in real terms4. When we account for the introduction of public health funding income falls by 20 per cent in cash terms and 37 per cent in real terms.5
4 RealtermsiscalculatedusingtheGDPdeflatorseriesavailable here: http://www.hm-treasury.gov.uk/data_gdp_fig.htm
5 Thesepercentagereductionfiguresarelowerthanthepercentage reductions in core local government funding (40 percentoverfiveyears)becausetheyarethereductionintotal funding, the main difference being that they include council tax and therefore start from a much higher base.
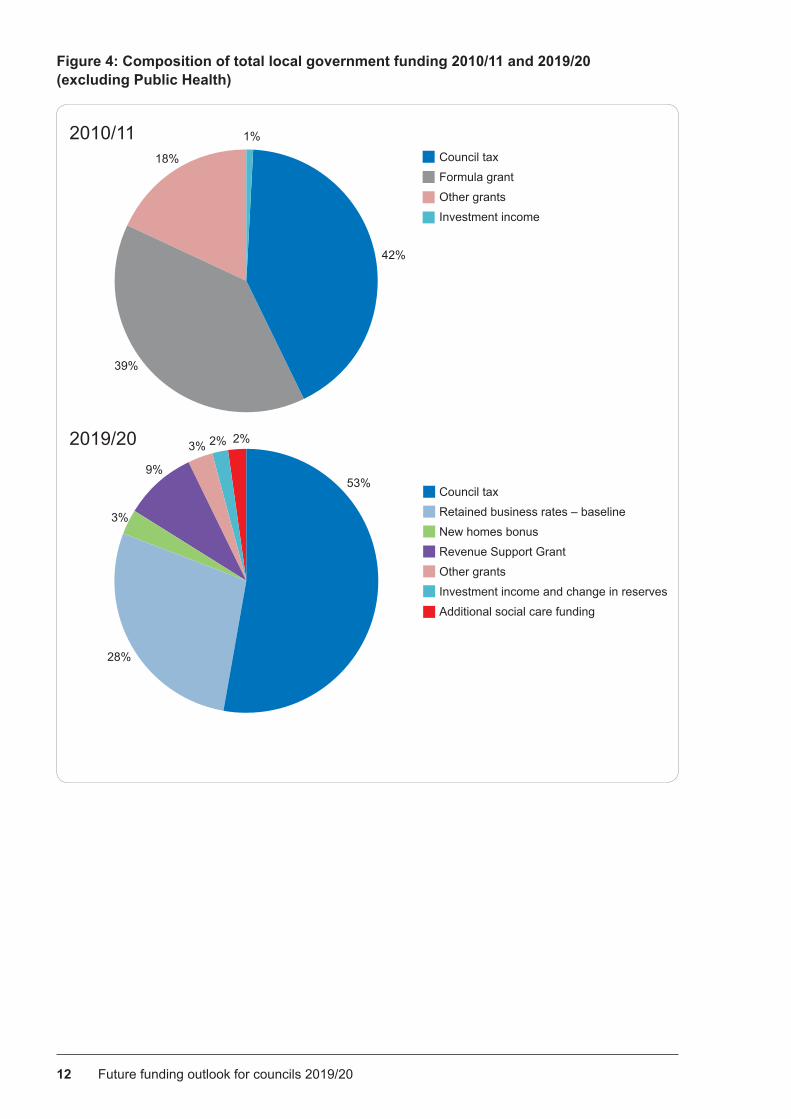
The changes in the way local government is funded can clearly be seen by comparing sources of funding in 2010/11 and 2019/20. Council Tax provides over half of all funding by the end of the decade, with the proportion of income coming from centralised grants falling over the decade as illustrated in Figure 4.
Figure 3: Total council funding 2010/11 to 2019/20
52
50
48
46
44
42
40
38
£ (b
illio
n)
2013
/14
2014
/15
2015
/16
2016
/17
2017
/18
2018
/19
2019
/20
2010
/11
2011
/12
2012
/13
Projected Funding
12 Future funding outlook for councils 2019/20
Figure 4: Composition of total local government funding 2010/11 and 2019/20 (excluding Public Health)
2010/11
2019/20
18%
39%
42%
1%
53%
Council tax
Formula grant
Other grants
Investment income
Council tax
Retained business rates – baseline
New homes bonus
Revenue Support Grant
Other grants
Investment income and change in reserves
Additional social care funding
28%
3%
9%
3% 2% 2%
13 Future funding outlook for councils 2019/20
In practice authorities have already closed the gap for 2015/16 in order to comply with their duty to set balanced budgets, and they have done this either through cuts, further efficiencies or use of reserves.
Once full data sets are available it will be possible to say more about how they have done this, but our research indicates that in many authorities the well of efficiencies is starting to run dry, with savings starting to come from service reductions.
Many authorities already have in place savings plans to close their budget gap still further in 2016/17 and beyond, but our research shows that 2015/16 is the year in which service reductions will start to account for a higher proportion of savings than efficiencies.
The model provides an opportunity to test councils’ ability to deliver their statutory obligations within the available resource envelope.
Mapping funding against expenditure
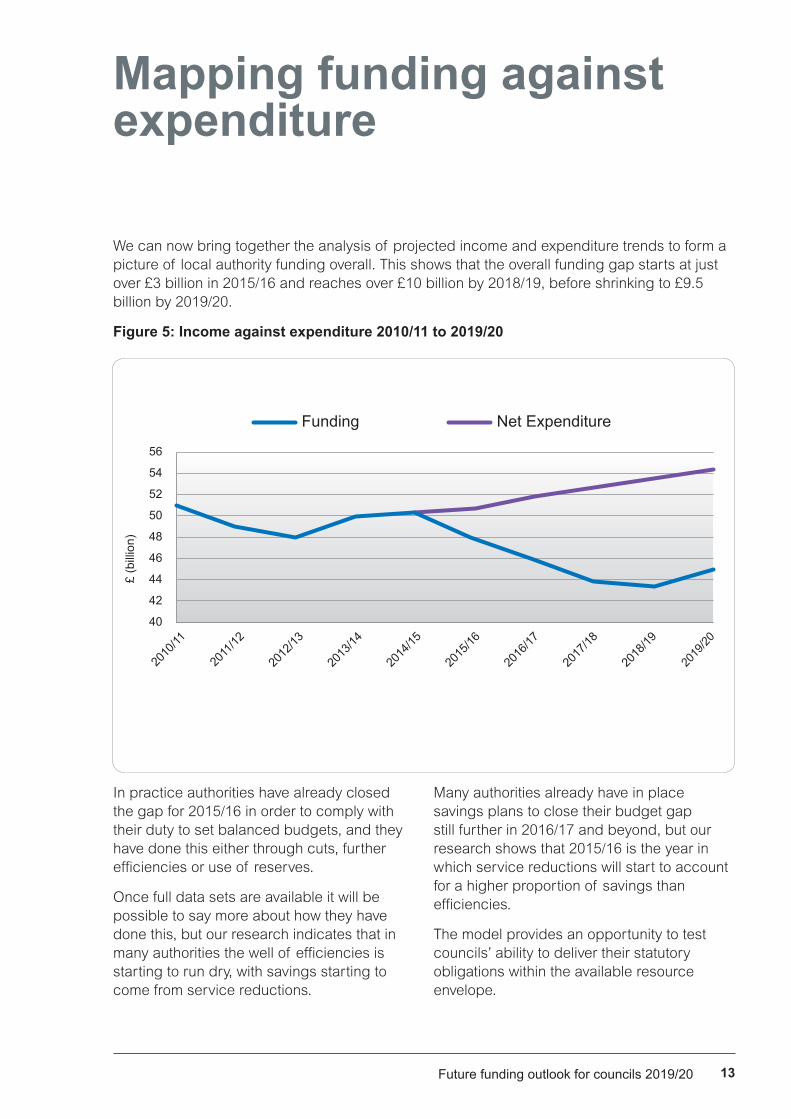
We can now bring together the analysis of projected income and expenditure trends to form a picture of local authority funding overall. This shows that the overall funding gap starts at just over £3 billion in 2015/16 and reaches over £10 billion by 2018/19, before shrinking to £9.5 billion by 2019/20.
Figure 5: Income against expenditure 2010/11 to 2019/20
56
54
52
50
48
46
44
42
40
£ (b
illio
n)
2013
/14
2014
/15
2015
/16
2016
/17
2017
/18
2018
/19
2019
/20
2010
/11
2011
/12
2012
/13
Funding Net Expenditure
14 Future funding outlook for councils 2019/20
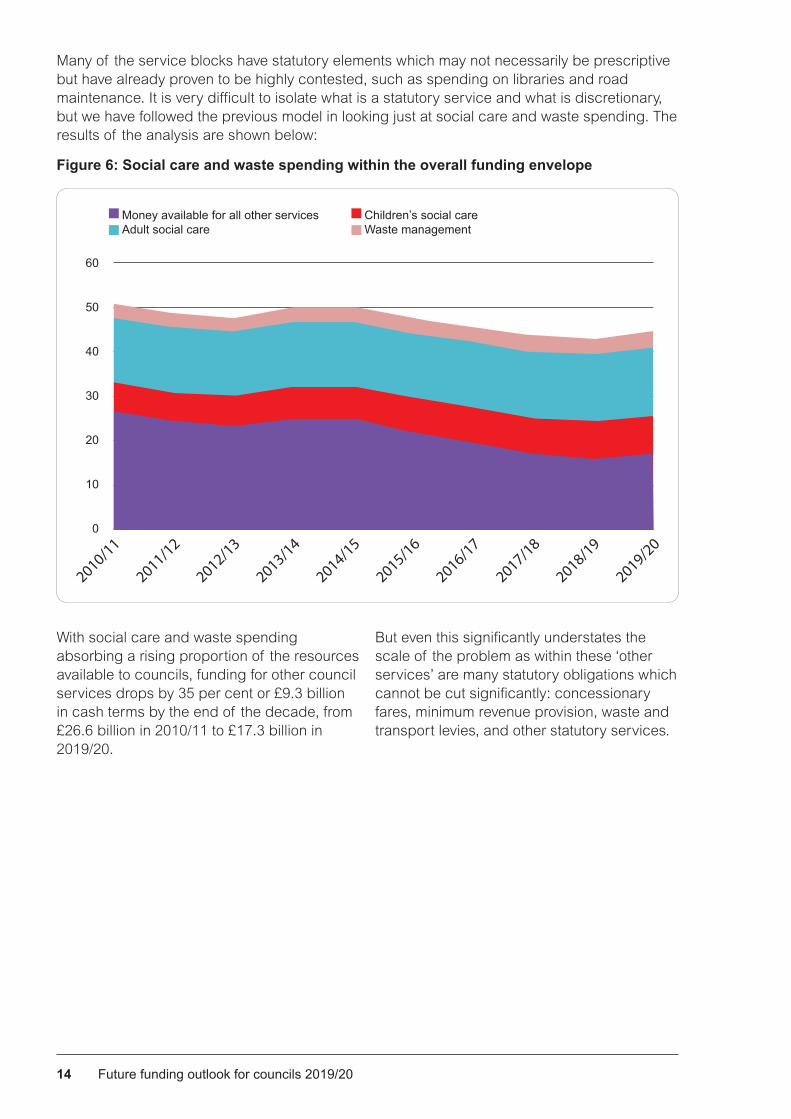
Many of the service blocks have statutory elements which may not necessarily be prescriptive but have already proven to be highly contested, such as spending on libraries and road maintenance. It is very difficult to isolate what is a statutory service and what is discretionary, but we have followed the previous model in looking just at social care and waste spending. The results of the analysis are shown below:
Figure 6: Social care and waste spending within the overall funding envelope
60
40
20
0
50
30
10
2010/11
2011/12
2013/14
2014/15
2012/13
2015/16
2016/17
2017/18
2018/19
2019/20
Money available for all other servicesAdult social care
Children’s social careWaste management
With social care and waste spending absorbing a rising proportion of the resources available to councils, funding for other council services drops by 35 per cent or £9.3 billion in cash terms by the end of the decade, from £26.6 billion in 2010/11 to £17.3 billion in 2019/20.
But even this significantly understates the scale of the problem as within these ‘other services’ are many statutory obligations which cannot be cut significantly: concessionary fares, minimum revenue provision, waste and transport levies, and other statutory services.

Local Government Association Local Government House Smith Square London SW1P 3HZ
Telephone 020 7664 3000 Fax 020 7664 3030 Email [email protected] www.local.gov.uk
For a copy in Braille, larger print or audio, please contact us on 020 7664 3000. We consider requests on an individual basis. L15-260
© Local Government Association, July 2015
For more information please contact:
Bevis Ingram Senior Adviser – Local Government Finance
Local Government Association Local Government House Smith Square London SW1P 3HZ
[email protected] 020 7664 3258