future food production and consumption in california … planning future food production and...
TRANSCRIPT
Topic: Planning Future Food Production and Consumption in California under Alternative Scenarios
Future Food Production and Consumption in California Under Alternative Scenarios
By Henrich Brunke, Richard Howitt and Daniel Sumner1 University of California Agricultural Issues Center
April 2004
This report considers food production and consumption patterns in California in recent years and the likely pattern of California food production and consumption in year 2030. It also considers in less detail recent production and use of nonfood agricultural products. The purpose of this analysis is to help the California Department of Water Resources respond to legislative requirements concerning information used in considerations about future supply and demand for irrigation water in California.
Introduction
This report was prepared for the California Department of Water Resources (DWR) in its response to California legislation AB2587. A key phrase in the law is that “neither the state nor the nation should be allowed to become dependent upon a net import of foreign food.” In particular, DWR is urged to consider scenarios under which agricultural production in California is sufficient to assure that California is a net food exporter and that the net shipments out of state are enough to cover its traditional share of “table food” use in the United States plus “growth in export markets.”
The law is specified in terms of aggregate food production, consumption and trade on a net basis. The focus on feeding the population in California and “table food” for the United States excludes several of the most important agricultural commodities in California. In particular, cotton and ornamental crops are not food items, but both are important in production value. Cotton ranks second in export value, and ornamental horticulture crops, as a group, generate about $3 billion in farm production value in California. Furthermore, the analysis and projections to consider “net import of foreign food” exclude such livestock feed crops as hay, feed grains and oilseeds.
The main focus of the legislation was on concerns for water available for food production in California relative to food use in California. Consistent with this emphasis, nonfood crops are not included in our full analysis of production and use currently or in 2030. However, we do examine the position of California with regard to ornamental horticulture, cotton, live animals and animal feeds. We note that California uses far more animal feed and more cotton (in the form of clothing and textiles) than it produces, but it is a net shipper of ornamental horticulture, mainly to other states.
The reference to food consumption, production and trade requires a common unit to aggregate the individual food commodities. (It is useless to attempt to create food balances for hundreds of individual commodities. Even if this were feasible, the questions we are addressing and AB 2587 relate to California food as a whole and not to specific products.) Given the nature of food production in California, the only
1 Brunke is a postgraduate researcher at the University of California Agricultural Issues Center; Howitt is a professor in the Department of Agricultural and Resource
Economics at the University of California, Davis; and Sumner is the Frank H. Buck, Jr., Professor in the Department of Agricultural and Resource Economics at the
University of California, Davis, and Director of the University of California Agricultural Issues Center.
CA Water Plan Update 2013 Vol. 4 Reference Page 1
Topic: Planning Future Food Production and Consumption in California under Alternative Scenarios
reasonable unit for aggregation is the value of each commodity. Aggregation in value terms reflects the relative weights of these commodities from the viewpoint of buyers. It makes no sense to simply add tons of apples and tons of oranges or tons of rice and tons of Cabernet Sauvignon. In some very poor countries, analysis of food supply and demand is done in terms of staple-grain equivalents, where basic foods are converted to equivalents of tons of rice of wheat. Such an approach may be useful, for example, in North Korea, but makes no sense in California, where dairy, beef and horticultural crops dominate food production. We therefore use estimates of the farm value production, consumption, and trade of food products to calculate the net trade position of California.
Measured by aggregate value, California is a net food shipper to the rest of the United States and the rest of the world. Besides shipments out of state, there are substantial gross shipments of food and other agricultural products into California. California food shipments from the rest of the United States and from international sources are large and vital to the health and welfare of Californians. Furthermore, imports of such nonfood agricultural commodities as live animals, livestock feed, and crop seed are also crucial to the productivity of California food industries. The net export trade balance must not obscure the importance of trade flows in both directions.
This analysis does not consider the nutritional details of available food. We aggregate across food products using values rather than a single nutritional unit such as calories or vitamins. A far more extensive analysis would be needed to consider the trade position of California for each major nutrient component.
Furthermore, we only consider net shipments of food into and out of California. Most food consumed in the state, including grain products, meat, tropical fruits, and “off-season” produce is produced elsewhere, and most of the crop production in California, although not the dairy production, is shipped out of the state. We follow the specific language of AB 2587 in examining net trade flows.
Turning to the supply side, we do not attempt to decompose expected crop yield growth due to aggregate technological improvement adopted in California into specific technological changes. It is very difficult to forecast the rate at which new technologies will be adopted and essentially impossible to project the path of applicable research itself. Such crop yield improvements have occurred steadily for decades, but we have not attempted to project which innovations will be adopted over the next three decades.
We do not explicitly consider irrigation water supply or demand. As specified below, we do consider a reduction of overall cropland with a shift to urbanization. This implies a shift of the irrigation water now associated with that cropland. Our analysis does not explicitly model changes in the current irrigation water situation. For example, we do not estimate the state of snow packs or reservoir levels. Nor do we explicitly consider the position of ground water availability into the future. Our analysis implicitly holds irrigation water use per unit of cropland constant. We incorporate explicit growth in output per unit of land. This implies growth in output per unit of irrigation water, but we do not include any further reduction in irrigation water use per unit of land. There have been declines in water use per acre in California for many crops, but we, conservatively, do not project those to continue.
CA Water Plan Update 2013 Vol. 4 Reference Page 2
Topic: Planning Future Food Production and Consumption in California under Alternative Scenarios
Section 1. Interpretations and Analysis of Current Data
We first calculated the current position of California food consumption, production, net shipments to the rest of the United States, and net shipments to export markets. Table 1 shows approximate values for five food categories and for the sum of those commodities. The food categories include approximations for most of U.S. food and beverage production and consumption. We exclude some processed product trade and some minor food items. We also do not include fish consumption.
Base Data and Methods
The first step was to determine a base period for California production. The California production data used was reported in the 2002 CDFA Resource Directory, which lists California production data for 2001 that is taken from data produced by the National Agricultural Statistics Service (NASS) of USDA. In 2001, California vegetable production was valued at $6.1 billion, and California fruit and tree-nut production was valued at $7.0 billion, for a combined value of $13.1 billion. The next category “Food Grains” is comprised of rice and wheat. The 2001 value for wheat was $112 million. The 2001 production value of $138 million reported for rice in the 2002 CDFA Resource Directory was inconsistent with other reports, so we used the $203 million value of production figure reported directly by the California office of the National Agricultural Statistical Service (CASS). Combining the rice and wheat values yielded a $315 million value of production for food grains. The value of production of milk and cream was $4.63 billion in 2001. Remaining livestock (primarily beef) and poultry (including eggs) totaled $2.72 billion in 2001. Other food products, including oilseeds, sugar and sweeteners, and spices totaled $103 million in 2001. Thus, the total value of California food production in 2001 was $20.5 billion at farm gate value.
Next, we turned to consumption for 2001. We obtained the total U.S. consumption for the five categories by adding the value of U.S. imports of goods for each category to the value of U.S. production of goods for each category and then subtracting the value of exports of the goods from each category.
Data for the value of U.S. production was obtained from the NASS. For example, U.S. food grain (wheat and rice) production value totaled $6.37 billion in 2001 ($5.44 billion for wheat and $925 million for rice). Trade data for the United States is based on the Foreign Agricultural Service’s FATUS database. According to these data, the United States exported $4.02 billion worth of food grains ($3.33 billion for wheat, unmilled and $692 million for rice, paddy) in 2001. At the same time, the United States imported $450 million worth of food grains ($169 million for rice and $281 million for wheat). The production values here are at the farm gate. The trade data are at port and, therefore, includes some post-farm value added. The estimate of post-farm gate value added varies widely across products (Bervejillo and Sumner). Unfortunately, there are no estimates available of farm value of imports or exports.
Applying the formula for consumption (production + imports – exports), we obtained a $2.8 billion total for U.S. consumption of food grains in 2001. Using similar procedures, U.S. consumption for fruit, tree nuts and vegetables was $29.4 billion in 2001. Milk and cream consumption in the United States was $25.5 billion, livestock and poultry consumption totaled $72 billion, and other food product consumption was $10.2 billion. Total U.S. consumption of food commodities was approximately $140 billion in 2001.
Because California data was unavailable, California consumption was derived from U.S. consumption data using the approximate California share (12 percent) of the national population. At the level of
CA Water Plan Update 2013 Vol. 4 Reference Page 3
Topic: Planning Future Food Production and Consumption in California under Alternative Scenarios
precision available for other parameters and estimates, this approximation is appropriate. We assumed that consumption patterns in California were similar to those in the rest of the United States. California population in 2000 totaled about 34 million, and the U.S. population was about 282 million. Applying 12 percent to total U.S. consumption of the individual commodity groupings yielded a California consumption figure of $3.5 billion for fruits, tree nuts and vegetables, $338 million for food grains, $3.1 billion for milk and cream (dairy) products, $8.6 billion for livestock and poultry, and $1.2 billion for other food products. Total California consumption of food commodities totaled $16.8 billion in 2001.
The USDA Economic research service (Lin et al.,) provide detailed analysis of how per capita consumption of food differs across the United States by region, ethnicity and other demographic factors. In addition, we could have made adjustments for the slightly higher average personal income in California and for differences in relative prices. We found in our preliminary analysis that none of these adjustments was large for food aggregates and some were offsetting, so we expect the consumption figures that we calculated are close to the true, but unavailable, figures. Notice that all these calculations are done on a farm value basis or port value for imports and exports and do not include the value of the farm-to-retail markup. For the livestock data, we have taken into account that meat animals are often exchanged in farm-to-farm transactions before the final sale to food processors.
Next, we looked at California trade. Export data was obtained from the AIC database on California’s agricultural exports. Given the base data on exports we used export values that included some value that was added after the product left the farm. Rice exports in 2001, for example, totaled $166.4 million, and California wheat exports were valued at $3.9 million. Thus, the total for the food grain category was $170.3 million. Export figures were also obtained for the other food categories in the study. Note that California does not export food commodities included in the category “other food products.” Vegetable oils, peanuts, sugar and sweeteners, and spices are mainly produced in other parts of the United States or not produced in the United States at all.
There is no database for imports by state in the United States, but data are available for the nation as a whole (see above). To get a reasonable approximation of California imports of food commodities, we again applied the 12 percent population share. Taking the example of food grains, we estimated that the California value of such imports for 2001 was $54 million (12 percent of $450 million in U.S. food grain imports). We derived California import values for the other food commodity categories in the same manner.
Base Position of California Food Production, Consumption of Trade in 2001
From the production and consumption values for food commodities in California, we can derive the net position of California agriculture. Subtracting California consumption from California production yields the value of California production available for consumption in the rest of the United States or for international export. These data are reported in Table 1. As expected, California was a net exporter of fruit, tree nuts and vegetables ($9.6 billion), a net importer of food grains ($25 million), a net exporter of dairy products ($1.6 billion) and a net importer of livestock and poultry ($6.3 billion) and other food products ($1.1 billion). For food commodity production, California was a net exporter by $3.6 billion in 2001.
Now consider the net trade position of California food commodities with the rest of the world. California was a net exporter of $2.5 billion in fruit, tree nuts and vegetables to the rest of the world in 2001.
CA Water Plan Update 2013 Vol. 4 Reference Page 4
Topic: Planning Future Food Production and Consumption in California under Alternative Scenarios
California food grains and the dairy industries also had net foreign trade surpluses in 2001. California, however, is a net importer of livestock and poultry and other food products.
After obtaining California’s net position regarding the production and trade of food commodities, we were able to derive the net trade position of California with the rest of the United States by subtracting California net trade with the rest of the world from California’s net production (production minus consumption). The results are in the last row of Table 1. The second to last row in Table 1 shows U.S. consumption minus California consumption.
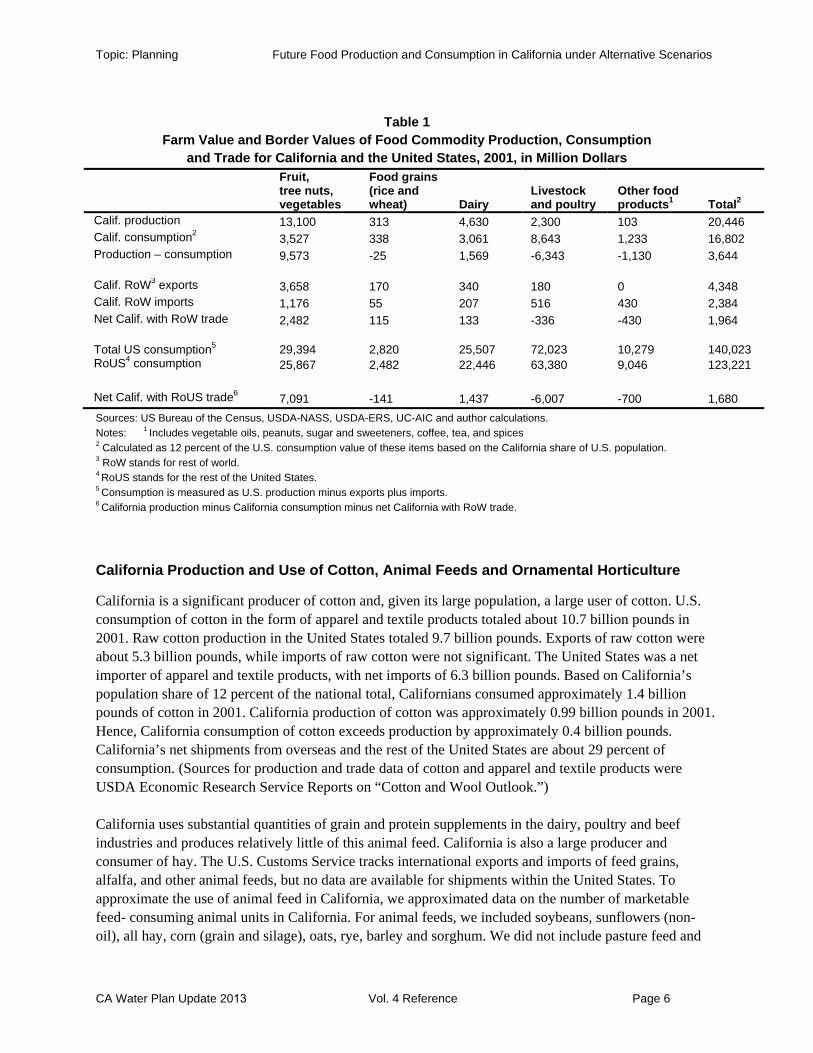
The first three rows of Table 1 show the production, consumption and net surplus position of California for each of the food categories. Row one shows the value of California production of each food category And a total production value of just over $20 billion. This is a probably a small overstatement of California’s food production value because it includes the value of hides and skins and wool. As noted above, California consumption values are approximated by assuming that California consumes 12 percent of the national total disappearance of each category (based on California’s share of national population).
The international export position of California agriculture is shown in the rows 4–6 of table 1. Most food exports are in the fruit, tree nuts and vegetables category, and because of the large export surplus in this category, California is a net exporter of food value.
To consider the position of California relative to the food consumption of the rest of the United States outside California and to the United States as a whole, we estimated the farm value of U.S. food consumption and the farm value of U.S. food consumption outside California (RoUS). Total farm value of U.S. food consumption at is about $140 billion, with about 12 percent ($16.8 billion) of that in California. California production of food accounts for about 14.6 percent of total U.S. food consumption ($20.5 billion California production/$140 billion U.S. consumption) and about 14.4 percent of U.S. food production ($20.5 billion California production/$142.5 billion U.S. production). On a net basis, California production could cover California consumption plus another 2.6 percent of food consumption in other states.
California exports valued at the port equal about 21 percent of food production valued at the farm. The AIC estimate is that California exports average about 18 percent of the production by quantity for 50 main export commodities (Bervejillo and Sumner 2003). Thus, their estimate is that on average port value is about 16.7 percent higher than farm value for the main California export products. We estimate that international imports are about 14 percent of food consumption in California.
Also note the 14.6 percent share of California production in U.S. food consumption at farm (or import) value is higher than California’s share of U.S. agricultural production overall because California produces relatively little feed crop value, no tobacco, and a small share of energy crops (mainly corn for ethanol). California is a net exporter of food to the rest of the world on a net basis.
CA Water Plan Update 2013 Vol. 4 Reference Page 5
Topic: Planning Future Food Production and Consumption in California under Alternative Scenarios
Table 1 Farm Value and Border Values of Food Commodity Production, Consumption
and Trade for California and the United States, 2001, in Million Dollars Fruit, tree nuts, vegetables
Food grains (rice and wheat) Dairy
Livestock and poultry
Other food products1 Total2
Calif. production 13,100 313 4,630 2,300 103 20,446Calif. consumption2 3,527 338 3,061 8,643 1,233 16,802Production – consumption 9,573 -25 1,569 -6,343 -1,130 3,644
Calif. RoW3 exports 3,658 170 340 180 0 4,348Calif. RoW imports 1,176 55 207 516 430 2,384Net Calif. with RoW trade 2,482 115 133 -336 -430 1,964
Total US consumption5 29,394 2,820 25,507 72,023 10,279 140,023RoUS4 consumption 25,867 2,482 22,446 63,380 9,046 123,221
Net Calif. with RoUS trade6 7,091 -141 1,437 -6,007 -700 1,680Sources: US Bureau of the Census, USDA-NASS, USDA-ERS, UC-AIC and author calculations. Notes: 1 Includes vegetable oils, peanuts, sugar and sweeteners, coffee, tea, and spices 2 Calculated as 12 percent of the U.S. consumption value of these items based on the California share of U.S. population. 3 RoW stands for rest of world. 4 RoUS stands for the rest of the United States. 5 Consumption is measured as U.S. production minus exports plus imports. 6 California production minus California consumption minus net California with RoW trade.
California Production and Use of Cotton, Animal Feeds and Ornamental Horticulture
California is a significant producer of cotton and, given its large population, a large user of cotton. U.S. consumption of cotton in the form of apparel and textile products totaled about 10.7 billion pounds in 2001. Raw cotton production in the United States totaled 9.7 billion pounds. Exports of raw cotton were about 5.3 billion pounds, while imports of raw cotton were not significant. The United States was a net importer of apparel and textile products, with net imports of 6.3 billion pounds. Based on California’s population share of 12 percent of the national total, Californians consumed approximately 1.4 billion pounds of cotton in 2001. California production of cotton was approximately 0.99 billion pounds in 2001. Hence, California consumption of cotton exceeds production by approximately 0.4 billion pounds. California’s net shipments from overseas and the rest of the United States are about 29 percent of consumption. (Sources for production and trade data of cotton and apparel and textile products were USDA Economic Research Service Reports on “Cotton and Wool Outlook.”)
California uses substantial quantities of grain and protein supplements in the dairy, poultry and beef industries and produces relatively little of this animal feed. California is also a large producer and consumer of hay. The U.S. Customs Service tracks international exports and imports of feed grains, alfalfa, and other animal feeds, but no data are available for shipments within the United States. To approximate the use of animal feed in California, we approximated data on the number of marketable feed- consuming animal units in California. For animal feeds, we included soybeans, sunflowers (non-oil), all hay, corn (grain and silage), oats, rye, barley and sorghum. We did not include pasture feed and
CA Water Plan Update 2013 Vol. 4 Reference Page 6
Topic: Planning Future Food Production and Consumption in California under Alternative Scenarios
attempted to exclude livestock fed on pasture. We included dairy and beef cattle, swine, poultry, sheep and horses. (We omitted beef bulls, beef cows and calves, and some sheep, which are primarily pasture based). Of the livestock we included, California feeds approximately 5.1 percent of the national herd. In dollar terms, the value of California feed production is approximately $1.1 billion. The value of U.S. feed production is approximately $46 billion. Taking into account U.S. international trade of animal feeds, the use of feed in the United States is about $35 billion. California uses about $1.8 billion worth of animal feed ($35 billion times 5.1 percent). Hence, California produces about 61 percent by value of its use of animal feeds and imports about 39 percent ($700 million), of its total animal feed from the rest of the United States and overseas. The share of 61 percent may be a slight overestimate because the value of U.S. feed trade used here already includes the value of California exports. However, there is no source of the value of exports at the farm gate.
(The sources for the data on California animal feeds are the CDFA 2002 Resource Directory, which provided 2001 data on the number of animals on California farms. The animal unit conversion factors are generally accepted and were obtained from USDA. The value of production for California and U.S. feed commodities was obtained from NASS/CASS. For U.S. trade, we used the United States International Trade Commission database, which uses export and import data as compiled by the U.S. Customs Service.)
In 2001, U.S. consumption of ornamental horticulture products was about $8.5 billion, and California consumption was approximately $1.1 billion based on its population share of approximately 12 percent. The value of production of ornamental horticulture in California was approximately $3 billion. Exports to the rest of the world were only $40 million, which leaves California as a net shipper of ornamental horticulture to the rest of the United States of about $1.9 billion. (Value of production for California nursery/flower crops was derived from the CDFA 2002 Resource Directory. Production value data for the United States came from NASS reports on nursery crops and ornamental horticulture.)
Section 2. Projections to 2030
Projections for consumption were used to calculate the production such that California produces food sufficient for continued net export to the rest of the United States and foreign destinations (as discussed in AB 2587). These are discussed and followed by production projections.
Consumption Projections
Total food consumption in developed countries rises mainly with population growth. In the United States, the amount of consumer food value that is added off the farm has risen rapidly with income growth. Farm value of food consumption has also risen with income, but more slowly. Changes in the age and ethnic distribution of the population and changes in relative prices affect consumption patterns for specific food products. These are much less important for aggregate foods or large categories.
U.S. population is projected to grow by 24 percent, from 282 million to 351 million people, from 2000 to 2030 (U.S. Census Bureau). California population is projected to grow by 52 percent, from 34 million to 52 million people, during the same period (California Department of Finance). We use these figures as applicable to 2001 to 2030 and thus slightly overestimate demand growth relative to these sources. Real per capita personal income is expected to grow slowly over this period, and California will become more Hispanic and more Asian.
CA Water Plan Update 2013 Vol. 4 Reference Page 7
Topic: Planning Future Food Production and Consumption in California under Alternative Scenarios
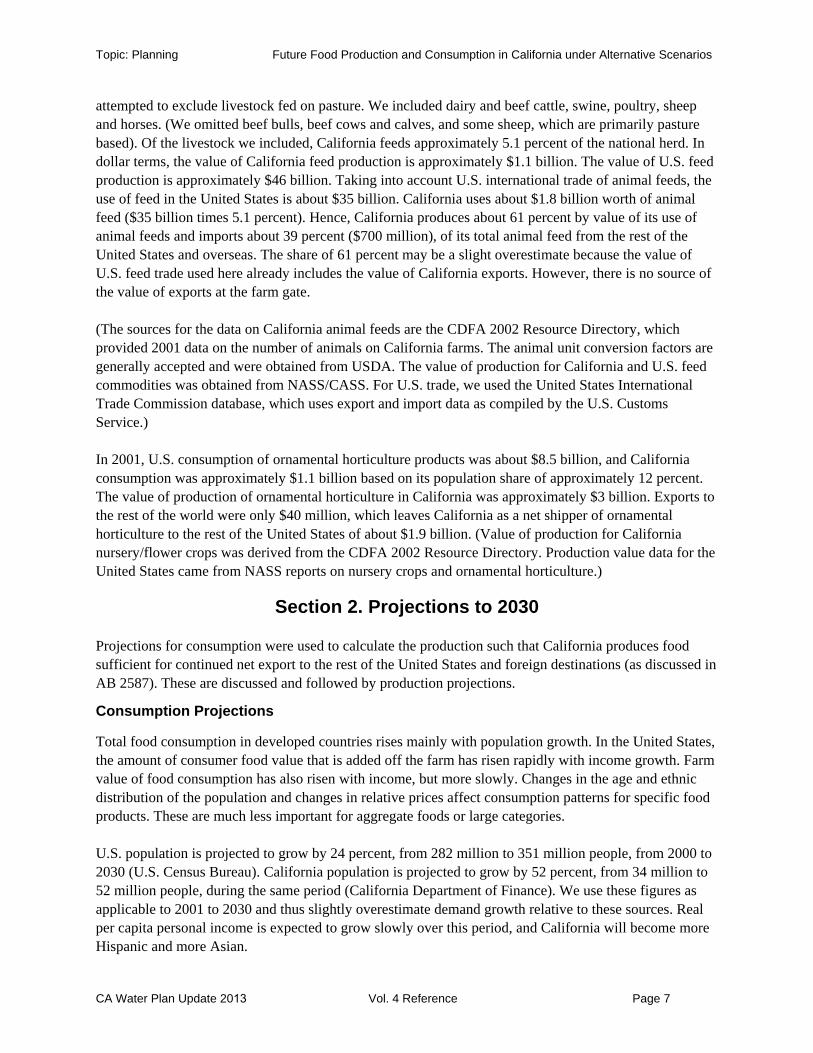
Recent research from the USDA Economic Research Service projects per capita consumption to grow by about 10 percent for fruits, nuts and vegetables, grow by about 2 percent for grains, fall slightly for dairy, fall by about 3 percent for meats, and remain constant for the other category (Lin et al., 2003). The USDA study looked at consumption patterns for the year 2020. We extrapolated their projections to 2030.
Overall per capita food consumption rises about two percentage points over 30 years. The figures apply to California and to the United States as a whole. Combining population growth with per capita growth, we get the projections shown in Table 2 for overall food consumption and by category.
The percentage projections in table 2 are multiplied by the 2001 consumption numbers in table 1 to project consumption value for California agriculture in 2030. We compare these projections to projections of production to establish projection of net shipments out of California.
Table 2 Change in Food Consumption, 2001 to 2030
California United States ---Percentage growth--
Fruit, nuts and vegetables 62 34 Food grains 54 26 Dairy 51 23Meats 49 21Other 52 24Total 54 26
Projecting California Agricultural Production to 2030
Food production changes in California will derive primarily from the following six sources. Relative prices of food and the relative price across commodities affect all of these adjustments and are affected by them.
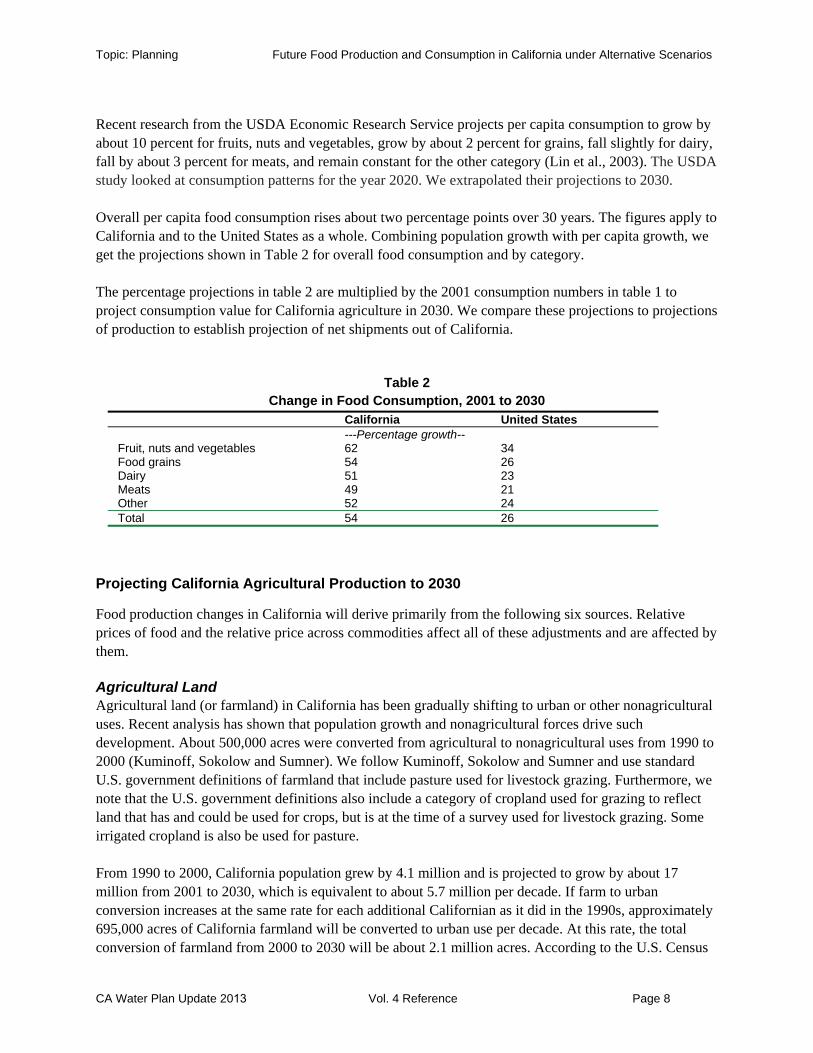
Agricultural Land Agricultural land (or farmland) in California has been gradually shifting to urban or other nonagricultural uses. Recent analysis has shown that population growth and nonagricultural forces drive such development. About 500,000 acres were converted from agricultural to nonagricultural uses from 1990 to 2000 (Kuminoff, Sokolow and Sumner). We follow Kuminoff, Sokolow and Sumner and use standard U.S. government definitions of farmland that include pasture used for livestock grazing. Furthermore, we note that the U.S. government definitions also include a category of cropland used for grazing to reflect land that has and could be used for crops, but is at the time of a survey used for livestock grazing. Some irrigated cropland is also be used for pasture.
From 1990 to 2000, California population grew by 4.1 million and is projected to grow by about 17 million from 2001 to 2030, which is equivalent to about 5.7 million per decade. If farm to urban conversion increases at the same rate for each additional Californian as it did in the 1990s, approximately 695,000 acres of California farmland will be converted to urban use per decade. At this rate, the total conversion of farmland from 2000 to 2030 will be about 2.1 million acres. According to the U.S. Census
CA Water Plan Update 2013 Vol. 4 Reference Page 8
Topic: Planning Future Food Production and Consumption in California under Alternative Scenarios
of Agriculture, between 1992 and 1997, the most recent data available, approximately 1.3 million acres were shifted out of farming and ranching in California, but about 0.8 million acres of cropland and 1.1 million acres of irrigated land were added.
If current patterns continue, the land converted will be a combination of irrigated cropland, nonirrigated cropland and pasture. Irrigated farmland acreage (irrigated cropland and irrigated pasture) in California in 2001 was about 9 million acres or approximately 31 percent of privately owned agricultural land in California. If irrigated cropland were shifted to nonfarm uses at the same rate as all cropland, then, under this scenario, approximately 690,000 acres of irrigated cropland in California would shift to nonfarm uses during the 30-year period. As in the past, the expanded use of multi-cropping of irrigated cropland is expected to offset some of the loss in irrigated acres. From 1994 to 2000, the increase in multi-cropping acreage almost offset the decrease in irrigated cropland acreage (Hawkins 2003). Even if only 50 percent of the loss in irrigated acreage is offset by multi-cropping, the net effect of the combination of shifting acreage and multiple use of cropland is a net loss of 345,000 acres from irrigated cropland use over the next 30 years.
Overall, we project that a maximum of 10 percent of California farmland, including both cropland and grazing land will be shifted out of agriculture by 2030.
Labor Changes in farm labor availability depend on policy, demographic, economic growth outside of agriculture, and trends in Mexico. Labor use also depends on technical changes that increase productivity of labor. Such factors as immigration policy, education of farmers and farm workers, and the standard of living in Mexico also affect the cost and productivity of human capital on farms. Long-term trends suggest higher costs of hired farm labor, but higher productivity of all human capital in farming. We expect current trends to continue and that labor availability will not, limit production of California agriculture, though real labor costs will rise.
Regulations Environmental, labor and other business regulations have continued to become more stringent over time. We expect this trend to continue. Regulations have affected land use in agriculture and productivity growth. In that sense, they are incorporated in the resource use and yield growth estimates. Government agricultural policy also affects farm production by affecting the relative income from alternative crops through subsidy. Most California commodities receive little subsidy or protection. Feed grains, wheat, rice, cotton, sugar and dairy are major exceptions. Producer support estimates (PSEs) as a share of production value for important California commodities show that certain commodities receive substantial support, while others receive close to nothing. Estimates by Sumner and Brunke (2003) show that the average PSE is approximately 11 percent across all California commodities. Producer support has recently been very high for rice at over 70 percent and sugar beets at over 65 percent. Cotton and wheat PSEs are also far above the average. Dairy, the state’s most important agricultural sector in terms of market value, has a PSE of more than 30 percent. Fruits and nuts, vegetables and melons, and flower and nursery products have PSEs in the low single-digit range. Current trends are for the production effects of subsidies to decline over time and for trade protection from imports to be reduced. Continuation of these trends would be required for the United States itself to comply with U.S. proposals in international trade negotiations. With reduced production enhancing incentives of farm subsidies, land will shift from rice, sugar beets, wheat, feed grains and cotton to less subsidized crops. The result will be more food value
CA Water Plan Update 2013 Vol. 4 Reference Page 9
Topic: Planning Future Food Production and Consumption in California under Alternative Scenarios
produced in California. The trend for dairy is mixed because relaxation of the dairy subsidy will shift U.S. dairy production toward California, and with trade agreements, the world prices for dairy products will rise. We expect little change in California dairy production if subsidies are relaxed. Changes in farm subsidy may also facilitate acreage shifts.
Acreage Shifts Across Crops Acreage shifts across crops in California have accounted for substantial gains in the value of food production. For example, barley acreage has declined over the past 30 years and cotton acreage has declined over the past 20 years (after an increase in the 1970s). Acres of grapes, almonds and other horticultural crops have increased. Significant potential remains for continued acreage shifts. We would expect these shifts to continue, as demand growth and California’s comparative advantage will continue to favor expansion of fruits, nuts and vegetables over the next 30 years. The total acreage of vegetables, fruit and nuts in California was about 3.9 million acres in 2002. Acreage for cotton, alfalfa and irrigated pasture was about 2.8 million acres in 2002. As the demand for California vegetables, fruit and tree nuts grows, cotton, alfalfa and irrigated pasture acreage in the state is likely to shift toward these crops. Furthermore, California has 20 million acres of non-irrigated pastureland and non-irrigated cropland and 6.9 million acres of pastureland in the Central Valley (Kuminoff, Sokolow and Sumner, 2001). As relative prices and policy adjustments continue to favor the shift of resources, there will be a gradual increase in the value of food production in California. A 10 percent increase in the value of food production from acreage shifts is a conservative estimate.
Climate Change and Environmental Resources Yield growth per acre of land has been a key factor in expanding California agricultural production. Consider first projected effects of climate change over the next three decades. The best estimates available for California crops indicate that climate change over the next three decades will increase yields by an average of 15 percent for major California crops (Adams, Wu and Houston, 2003). Additional references on climate change can be found in Mendelsohn, Nordhaus and Shaw, Adams et al. and Segerson and Dixon.
The average we use is smaller than the increases in yields expected as a consequence of climate change for such important California food commodities as grapes, tomatoes and almonds. Wine grape yields, for example, are expected to increase due to projected climate change by 34 percent by 2030. The projected yield increase due to climate change is 40 percent for almonds. (Appendix C provides more information on the projected effects of climate change on crop yields per acre for food crops in California.) Other resource changes are air quality and soil quality. Despite some crop and location specific adjustments, we see no trends that suggest major reductions in productivity from changes in these resources. We do not discuss water availability here in this context.
Crop Yields and Technical Change Growth in the quantity of food crop production per acre of land will continue to be an important driving force in increasing the value of California food crop production over the next three decades, as it has been in previous decades.
We base our analysis of crop yields on historical yield growth data from 1960–2002. Using these data, we created a yield index for each of 30 California food crops. We then aggregated these indices into an overall California crop yield index using the value share over the period 1997–2001. Using these data, we
CA Water Plan Update 2013 Vol. 4 Reference Page 10
Topic: Planning Future Food Production and Consumption in California under Alternative Scenarios
calculated that the mean percentage rate of growth in the aggregate food-crop yield index over the period 1960–2002 was 1.42 percent per year. This number simply says that over a 42-year period of year-to-year yield changes, the simple average of percentage changes was 1.42 percent per year.
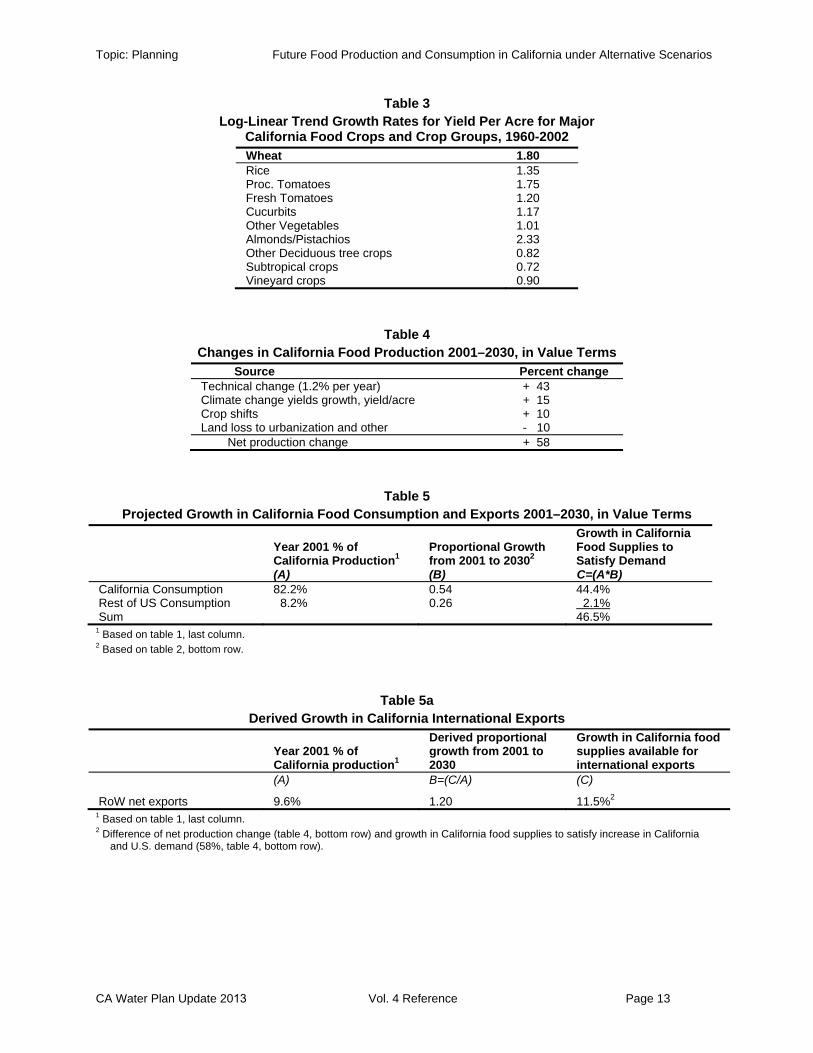
Alternatively, we examined several trend lines fit to the aggregate food-crop yield index and to yield indices for individual crops. The log-linear trend line for the aggregate food-crop yield index has a slope coefficient of 1.11 percent. Table 3 lists the log-linear trends for individual commodities or commodity groups for 1960–2002, which differ considerably across crops. These log-linear trends are also measures of percentage changes over the period.
In table 3, vineyard crops are the most important commodity group in the overall index. The relatively low yield growth can be explained by trends in the industry to lower producing, higher quality varieties and to technologies that limit yield while improving quality. The growth rate for vineyards, therefore, does not seem to represent slow technical improvement.
In our projections to 2030, we used an average yield growth for California food crops of 1.20 percent per year, which we think is conservative. Compounded over 30 years, the total growth rate is 43 percent. Such growth relies on technological advances and the application of such advances in California. It also relies on managerial improvement and innovation on the part of growers. One part of this equation that raises concern is the potential for a failure to invest in agricultural science in California. However, given the long time lags from scientific innovation to productivity growth, we are confident in our conservative productivity growth estimate being met or exceeded.
Table 4 summarizes the base production projections
The growth in California food consumption and shipments to the rest of the United States can now be projected using the base data in table 1 and the consumption and production projections to 2030. Appendix B contains a sensitivity analysis of certain parameters used here.
Table 5 uses the data and projections from tables 1, 2 and 4 to compare food production and consumption for the year 2030. As in previous tables, we aggregate across individual food products using value terms. Column A in table 5 presents the “use” of 2001 California production of food commodities. California food consumption equaled 82.2 percent of California food production in 2001. Shipments to the rest of the United States accounted for 8.2 percent of California production. Net exports to international markets equaled 9.6 percent of 2001 California production (Table 5a). These three shares are obtained from the production and consumption figures presented in table 1. Column B in table 5 contains the proportional change in consumption due to demand growth following population increase. The figures for California consumption and consumption in the rest of the United States are obtained from table 2. Column C of table 5 shows that California food production must grow by 46.5 percent from 2001 to 2030 (44.4 percent for California and 2.1 percent for the rest of the United States) in order to hold both the ratio of California food consumption to California food production and the ratio of rest-of-the-U.S. food consumption to California food production constant at the 2001 values.
However, the total projected growth in California food production value by 2030 equals 58 percent (table 4). The difference between this growth in production and the growth in demand in California and the rest of the United States is 11.5 percent, which is the share in the growth of California food production that
CA Water Plan Update 2013 Vol. 4 Reference Page 11
Topic: Planning Future Food Production and Consumption in California under Alternative Scenarios
will be available for international exports in 2030. This implies that international exports by the year 2030 will grow by 20 percent compared to 2001 (11.5 percent divided by 9.6 percent, table 5a). A further underlying assumption in this analysis is that market forces are allowed to operate in both input and output markets for California agriculture. In particular, if market prices for farm output fall faster than costs fall in real terms, given productivity growth in California, land prices may decline, but land will remain in production. We do not expect significant amounts of land suited for food crops in California to be removed from production over the next 30 years except that portion that is converted to urban uses. Appendix B looks at these findings in more detail and provides estimates for alternative growth rates in production.
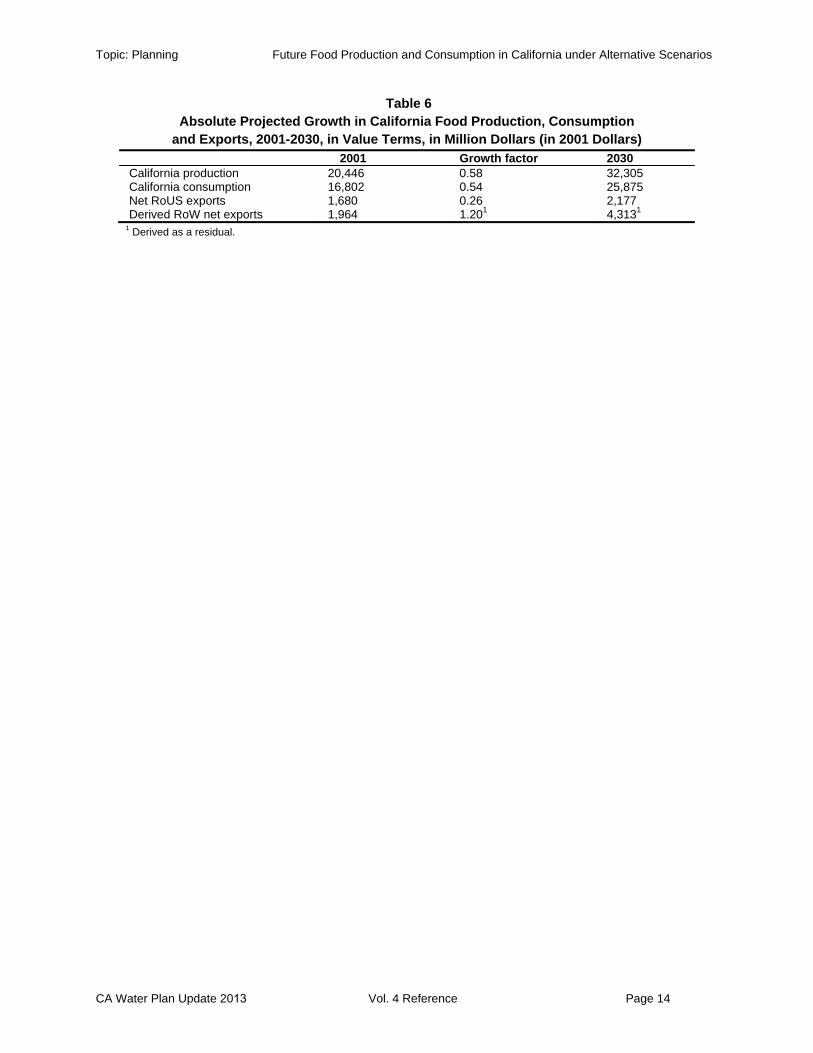
Table 6 summarizes the projected growth in inflation adjusted value terms and shows the production and distribution of California food in 2030 compared to 2001.
Conclusions
Tables 4 to 6 summarize the projections and net effects of several changes in California food supply and demand over the next 30 years. The projections shown here rely on some tentative data and assumptions and may change as more data and fuller analysis become available. However, it is unlikely that the dominant driving forces for both production and consumption discussed above will change significantly. As a result, the major findings shown in tables 4 to 6 are unlikely to change substantially. The main conclusion that can be drawn from tables 4 to 6 is that California agriculture will continue to produce substantial quantities of food crops. Furthermore, crop shifts and the productivity growth of California agriculture suggest that the value of California food production will more than keep up with rising population and income growth in California and the rest of the United States. A 10 percent net loss of farmland and irrigation water resources will be more than offset by shifts toward crops with high value per acre, growth in production per acre due to technological improvement, and yield growth attributable to climate change. These productivity growth factors will likely enable California agricultural production to expand such that the inflation-adjusted farm gate value of net food exports to the rest of the world will expand, not contract.
CA Water Plan Update 2013 Vol. 4 Reference Page 12
Topic: Planning Future Food Production and Consumption in California under Alternative Scenarios
Table 3 Log-Linear Trend Growth Rates for Yield Per Acre for Major
California Food Crops and Crop Groups, 1960-2002 Wheat 1.80Rice 1.35Proc. Tomatoes 1.75 Fresh Tomatoes 1.20 Cucurbits 1.17Other Vegetables 1.01 Almonds/Pistachios 2.33Other Deciduous tree crops 0.82 Subtropical crops 0.72 Vineyard crops 0.90
Table 4 Changes in California Food Production 2001–2030, in Value Terms
Source Percent change Technical change (1.2% per year) + 43 Climate change yields growth, yield/acre + 15 Crop shifts + 10 Land loss to urbanization and other - 10
Net production change + 58
Table 5 Projected Growth in California Food Consumption and Exports 2001–2030, in Value Terms
Year 2001 % of California Production1
Proportional Growth from 2001 to 20302
Growth in California Food Supplies to Satisfy Demand
(A) (B) C=(A*B)California Consumption 82.2% 0.54 44.4%Rest of US Consumption 8.2% 0.26 2.1% Sum 46.5%
1 Based on table 1, last column. 2 Based on table 2, bottom row.
Table 5a Derived Growth in California International Exports
Year 2001 % of California production1
Derived proportional growth from 2001 to 2030
Growth in California food supplies available for international exports
(A) B=(C/A) (C)
RoW net exports 9.6% 1.20 11.5%2
1 Based on table 1, last column. 2 Difference of net production change (table 4, bottom row) and growth in California food supplies to satisfy increase in California
and U.S. demand (58%, table 4, bottom row).
CA Water Plan Update 2013 Vol. 4 Reference Page 13
Topic: Planning Future Food Production and Consumption in California under Alternative Scenarios
Table 6 Absolute Projected Growth in California Food Production, Consumption
and Exports, 2001-2030, in Value Terms, in Million Dollars (in 2001 Dollars) 2001 Growth factor 2030
California production 20,446 0.58 32,305 California consumption 16,802 0.54 25,875Net RoUS exports 1,680 0.26 2,177 Derived RoW net exports 1,964 1.201 4,3131
1 Derived as a residual.
CA Water Plan Update 2013 Vol. 4 Reference Page 14
Topic: Planning Future Food Production and Consumption in California under Alternative Scenarios
References
Adams, Richard M. Junjie Wu, Laurie L. Houston. “The Effects of Climate Change on Yields and Water Use of Major California Crops.” Working Paper, Prepared for the Electric Power Research Institute and the California Energy Commission. Oregon State University, 2003
Adams, Richard M., Bruce A. McCarl, Kathleen Segerson, Cynthia Rosenzweig, Kelly J. Bryant, Bruce L. Dixon, Richard Conner, Robert E. Evenson and Dennis Ojima. “Economic Effects of Climate Change on U.S. Agriculture” in Mendelson, Richard and James Neumann, Eds. The Impact of Climate Change on the United States Economy. Cambridge University Press, 1999
Bervejillo, José E. and Daniel A. Sumner. “California’s International Agricultural Exports in 2001.” Agricultural Issues Center, Issues Brief, No 19, January 2003. Available at: http://aic.ucdavis.edu/pub/briefs/brief19.pdf
California Department of Finance. “Population Projections 1990-2040.” Available at: www.dof.ca.gov/html/demograp/projca.pdf
California Department of Food and Agriculture. “2002 Resource Directory.” Available at: www.cdfa.ca.gov/card/card_new02.htm
California Department of Water Resources: “Various Water Plan Updates (Bulletin 160 from 1974-1998)”
Hawkins, Tom. California Department of Water Resources. Personal Communication, Sep. 2003.
Kuminoff, Nicolai V., Alvin D. Sokolow and Daniel A. Sumner. “Farmland Conversion: Perceptions and Realities.” Agricultural Issues Center, Issues Brief, No 16, May 2001. Available at: http://aic.ucdavis.edu/pub/briefs/brief16.pdf
Mendelsohn, Robert, William Nordhaus and Daigee Shaw. “The Impact of Climate Variation on U.S. Agriculture.” In Mendelson, Richard and James Neumann, Eds. The Impact of Climate Change on the United States Economy. Cambridge University Press, 1999
Lin, Biing-Hwan, Jayachandran N. Variyam, Jane Allshouse, and John Cromartie. “Food and Agricultural Commodity Consumption in the United States: Looking Ahead to 2020.” Food and Rural Economics Division, Economic Research Service, U.S. Department of Agriculture, Agricultural Economic Report No. 820, Feb 2003. Available at:www.ers.usda.gov/publications/aer820/
Segerson, Kathleen and Bruce L. Dixon. “Climate Change and Agriculture: The Role of Farmer Adaptation” in Mendelson, Richard and James Neumann, Eds. The Impact of Climate Change on the United States Economy. Cambridge University Press, 1999
CA Water Plan Update 2013 Vol. 4 Reference Page 15
Topic: Planning Future Food Production and Consumption in California under Alternative Scenarios
State of California, Legislative Counsel. “Official California Legislative Information.” Available at: www.leginfo.ca.gov/pub/01-02/bill/asm/ab_2551-2600/ab_2587_bill_20020917_chaptered.pdf
Sumner, Daniel A. and Henrich Brunke. “Commodity Policy and California Agriculture.” Dec. 2003. Forthcoming in California Agriculture: Issues and Challenges. Jerome B. Siebert. University of California, Giannini Foundation.
United States Department of Agriculture. Economic Research Service. “Agricultural Outlook Statistical Indicators.” Various Issues. Available at: www.ers.usda.gov/publications/Agoutlook/AOTables/
United States Department of Agriculture. Economic Research Service. “Cotton and Wool Outlook.” Various Issues. Available at: www.ers.usda.gov/publications/so/view.asp?f=field/cws-bb/
United States Department of Agriculture. National Agricultural Statistical Service. “Reports by Commodity, Various Issues.” Available at: www.usda.gov/nass/pubs/estindx.htm
United States Department of Agriculture. Foreign Agricultural Service. “Foreign Agricultural Trade of the United States (FATUS) Database.” Available at: www.fas.usda.gov/ustrade/USTExFatus.asp?QI=
United States Department of Commerce. U.S. Census Bureau. “National Populations Projections.” Available at: www.census.gov/population/www/projections/natsumT3.html
United States Department of Commerce. Bureau of Economic Analysis. “National Economic Accounts.” Available at: www.bea.doc.gov/bea/dn/home/gdp.htm
United States International Trade Commission. “USITC International Tariff and Trade Dataweb.” Available at: http://dataweb.usitc.gov/scripts/user_set.asp
CA Water Plan Update 2013 Vol. 4 Reference Page 16
Topic: Planning Future Food Production and Consumption in California under Alternative Scenarios
Appendix A. Value Per Unit of Irrigation Water
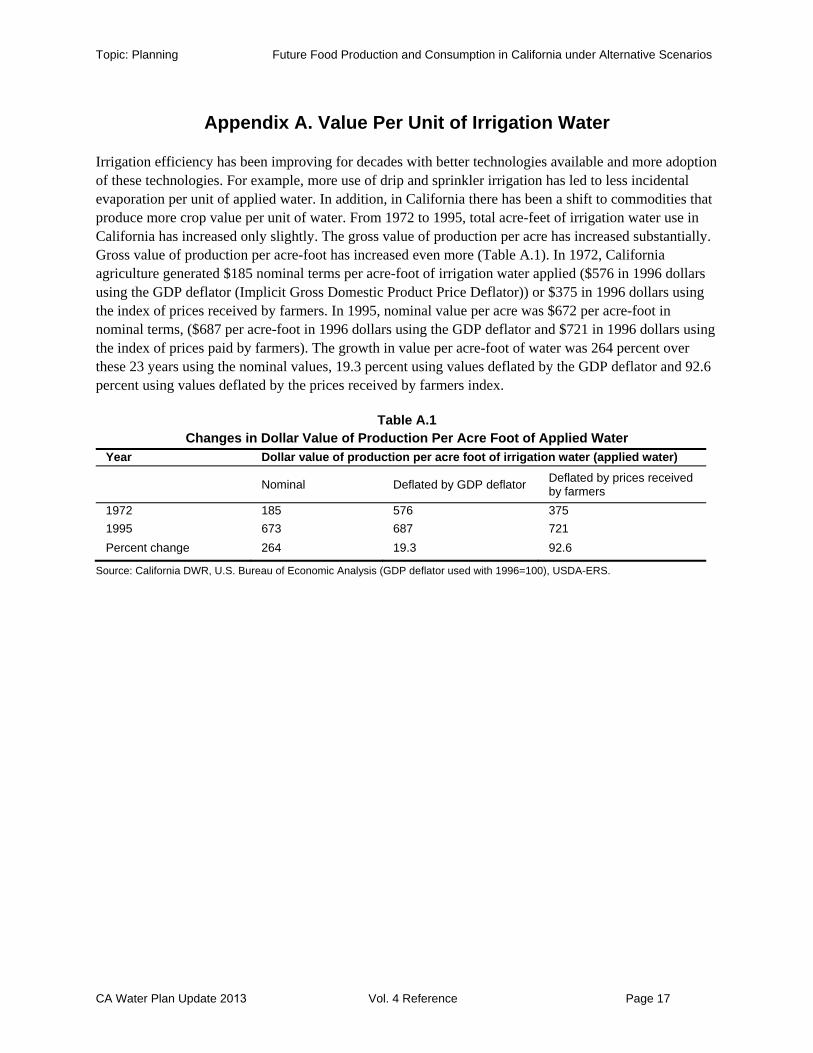
Irrigation efficiency has been improving for decades with better technologies available and more adoption of these technologies. For example, more use of drip and sprinkler irrigation has led to less incidental evaporation per unit of applied water. In addition, in California there has been a shift to commodities that produce more crop value per unit of water. From 1972 to 1995, total acre-feet of irrigation water use in California has increased only slightly. The gross value of production per acre has increased substantially. Gross value of production per acre-foot has increased even more (Table A.1). In 1972, California agriculture generated $185 nominal terms per acre-foot of irrigation water applied ($576 in 1996 dollars using the GDP deflator (Implicit Gross Domestic Product Price Deflator)) or $375 in 1996 dollars using the index of prices received by farmers. In 1995, nominal value per acre was $672 per acre-foot in nominal terms, ($687 per acre-foot in 1996 dollars using the GDP deflator and $721 in 1996 dollars using the index of prices paid by farmers). The growth in value per acre-foot of water was 264 percent over these 23 years using the nominal values, 19.3 percent using values deflated by the GDP deflator and 92.6 percent using values deflated by the prices received by farmers index.
Table A.1 Changes in Dollar Value of Production Per Acre Foot of Applied Water
Year Dollar value of production per acre foot of irrigation water (applied water)
Nominal Deflated by GDP deflator Deflated by prices receivedby farmers
1972 185 576 3751995 673 687 721Percent change 264 19.3 92.6
Source: California DWR, U.S. Bureau of Economic Analysis (GDP deflator used with 1996=100), USDA-ERS.
CA Water Plan Update 2013 Vol. 4 Reference Page 17
Topic: Planning Future Food Production and Consumption in California under Alternative Scenarios
Appendix B. Sensitivity Analysis
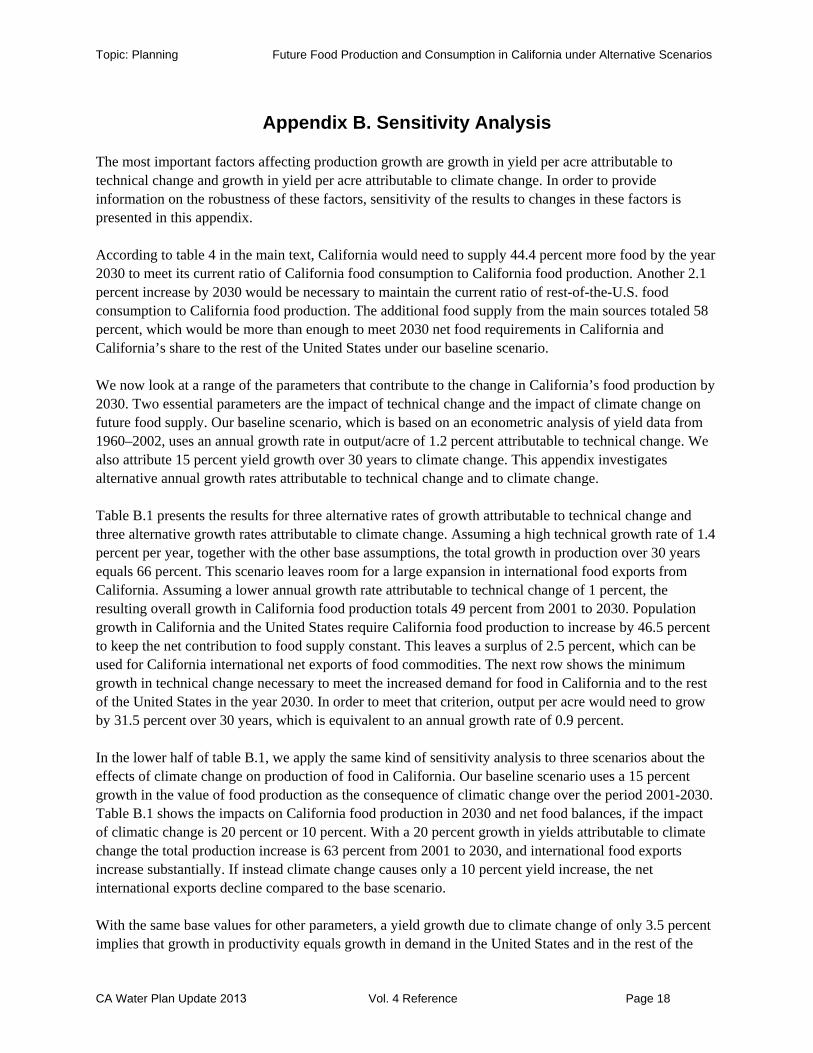
The most important factors affecting production growth are growth in yield per acre attributable to technical change and growth in yield per acre attributable to climate change. In order to provide information on the robustness of these factors, sensitivity of the results to changes in these factors is presented in this appendix.
According to table 4 in the main text, California would need to supply 44.4 percent more food by the year 2030 to meet its current ratio of California food consumption to California food production. Another 2.1 percent increase by 2030 would be necessary to maintain the current ratio of rest-of-the-U.S. food consumption to California food production. The additional food supply from the main sources totaled 58 percent, which would be more than enough to meet 2030 net food requirements in California and California’s share to the rest of the United States under our baseline scenario.
We now look at a range of the parameters that contribute to the change in California’s food production by 2030. Two essential parameters are the impact of technical change and the impact of climate change on future food supply. Our baseline scenario, which is based on an econometric analysis of yield data from 1960–2002, uses an annual growth rate in output/acre of 1.2 percent attributable to technical change. We also attribute 15 percent yield growth over 30 years to climate change. This appendix investigates alternative annual growth rates attributable to technical change and to climate change.
Table B.1 presents the results for three alternative rates of growth attributable to technical change and three alternative growth rates attributable to climate change. Assuming a high technical growth rate of 1.4 percent per year, together with the other base assumptions, the total growth in production over 30 years equals 66 percent. This scenario leaves room for a large expansion in international food exports from California. Assuming a lower annual growth rate attributable to technical change of 1 percent, the resulting overall growth in California food production totals 49 percent from 2001 to 2030. Population growth in California and the United States require California food production to increase by 46.5 percent to keep the net contribution to food supply constant. This leaves a surplus of 2.5 percent, which can be used for California international net exports of food commodities. The next row shows the minimum growth in technical change necessary to meet the increased demand for food in California and to the rest of the United States in the year 2030. In order to meet that criterion, output per acre would need to grow by 31.5 percent over 30 years, which is equivalent to an annual growth rate of 0.9 percent.
In the lower half of table B.1, we apply the same kind of sensitivity analysis to three scenarios about the effects of climate change on production of food in California. Our baseline scenario uses a 15 percent growth in the value of food production as the consequence of climatic change over the period 2001-2030. Table B.1 shows the impacts on California food production in 2030 and net food balances, if the impact of climatic change is 20 percent or 10 percent. With a 20 percent growth in yields attributable to climate change the total production increase is 63 percent from 2001 to 2030, and international food exports increase substantially. If instead climate change causes only a 10 percent yield increase, the net international exports decline compared to the base scenario.
With the same base values for other parameters, a yield growth due to climate change of only 3.5 percent implies that growth in productivity equals growth in demand in the United States and in the rest of the
CA Water Plan Update 2013 Vol. 4 Reference Page 18
Topic: Planning Future Food Production and Consumption in California under Alternative Scenarios
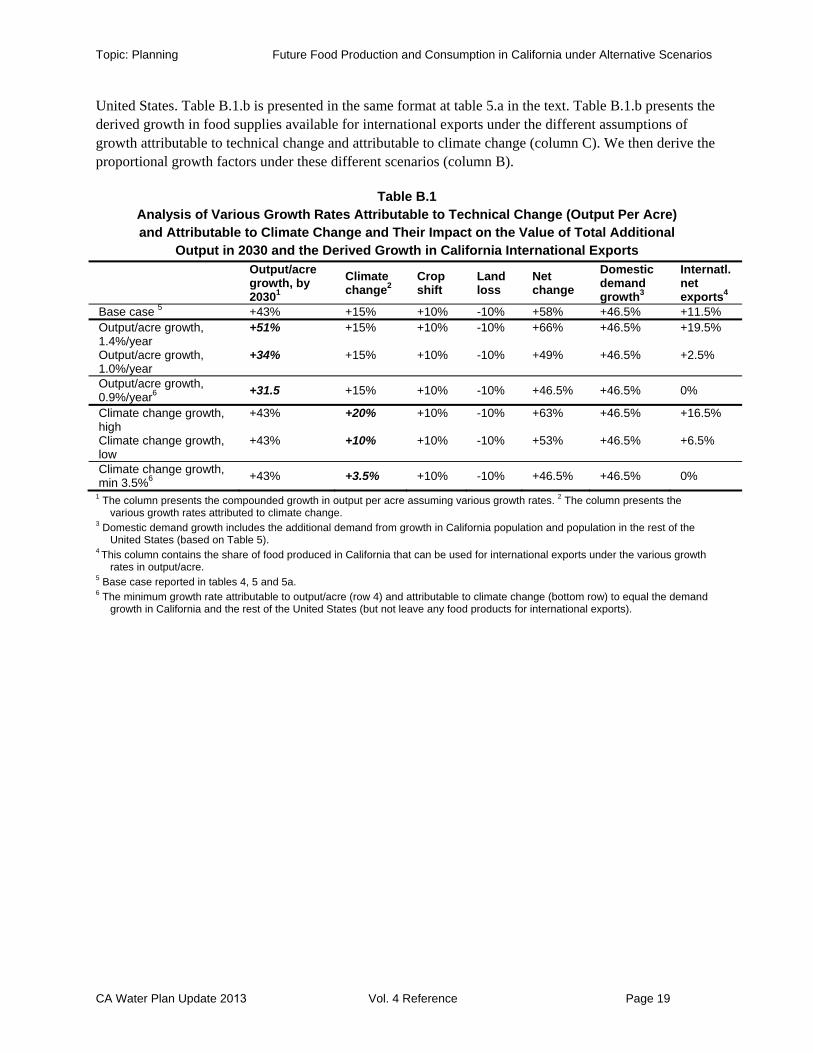
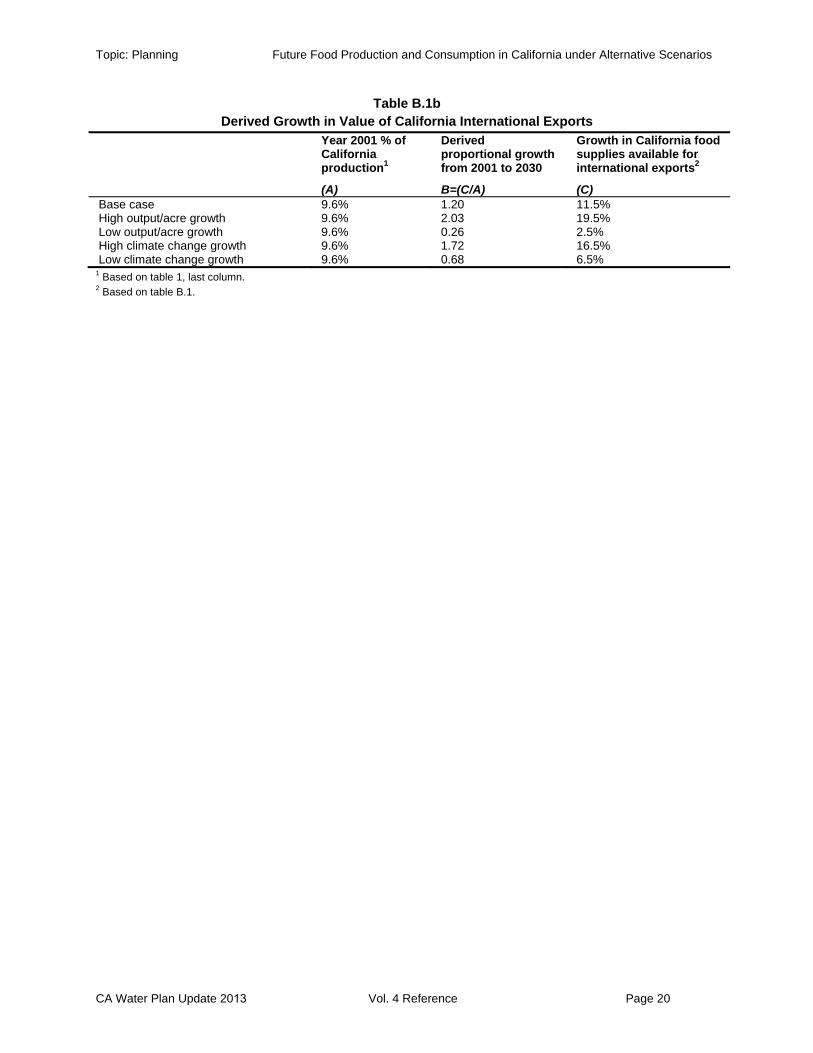
United States. Table B.1.b is presented in the same format at table 5.a in the text. Table B.1.b presents the derived growth in food supplies available for international exports under the different assumptions of growth attributable to technical change and attributable to climate change (column C). We then derive the proportional growth factors under these different scenarios (column B).
Table B.1 Analysis of Various Growth Rates Attributable to Technical Change (Output Per Acre) and Attributable to Climate Change and Their Impact on the Value of Total Additional
Output in 2030 and the Derived Growth in California International Exports Output/acre growth, by 20301
Climate change2
Crop shift
Land loss
Net change
Domestic demand growth3
Internatl. net exports4
Base case 5 +43% +15% +10% -10% +58% +46.5% +11.5%Output/acre growth, 1.4%/year
+51% +15% +10% -10% +66% +46.5% +19.5%
Output/acre growth, 1.0%/year
+34% +15% +10% -10% +49% +46.5% +2.5%
Output/acre growth, 0.9%/year6 +31.5 +15% +10% -10% +46.5% +46.5% 0%
Climate change growth, high
+43% +20% +10% -10% +63% +46.5% +16.5%
Climate change growth, low
+43% +10% +10% -10% +53% +46.5% +6.5%
Climate change growth, min 3.5%6 +43% +3.5% +10% -10% +46.5% +46.5% 0%
1 The column presents the compounded growth in output per acre assuming various growth rates. 2 The column presents the various growth rates attributed to climate change.
3 Domestic demand growth includes the additional demand from growth in California population and population in the rest of the United States (based on Table 5).
4 This column contains the share of food produced in California that can be used for international exports under the various growth rates in output/acre.
5 Base case reported in tables 4, 5 and 5a. 6 The minimum growth rate attributable to output/acre (row 4) and attributable to climate change (bottom row) to equal the demand
growth in California and the rest of the United States (but not leave any food products for international exports).
CA Water Plan Update 2013 Vol. 4 Reference Page 19
Topic: Planning Future Food Production and Consumption in California under Alternative Scenarios
Table B.1b Derived Growth in Value of California International Exports
Year 2001 % of California production1
Derived proportional growth from 2001 to 2030
Growth in California food supplies available for international exports2
(A) B=(C/A) (C)Base case 9.6% 1.20 11.5% High output/acre growth 9.6% 2.03 19.5% Low output/acre growth 9.6% 0.26 2.5% High climate change growth 9.6% 1.72 16.5% Low climate change growth 9.6% 0.68 6.5%
1 Based on table 1, last column. 2 Based on table B.1.
CA Water Plan Update 2013 Vol. 4 Reference Page 20
Topic: Planning Future Food Production and Consumption in California under Alternative Scenarios
Appendix C. Climate Change
Adams, Wu and Houston (2003) provide estimates on projected yield growth as a consequence of global climate change in a study prepared for the Electric Power Research Institute and the California Energy Commission. One step in their research was to develop crop yield response functions that estimate the effects of changes in temperature and precipitation on yields of major crops in California. They then apply these to climate change scenarios. The resulting yield estimates are presented for a range of climatic change scenarios and include assumptions concerning the effects of changes in CO2 levels on crop yields. The information obtained for the three time periods modeled in the study are presented in tables C.1 through C.4 for the four production regions identified in the study:
Sacramento and the Delta regions, including Butte, Colusa, Contra Costa, Glenn, Sacramento, San Joaquin, Solano, Sutter, Tehema, Yolo and Yuba counties
San Joaquin and Desert Regions, including Fresno, Imperial, Kern, Kings, Madera, Merced, Riverside, Stanislaus and Tulare counties
North East and Mountain Regions: Calaveras, El Dorado, Lassen, Mariposa, Modoc, Nevada, Placer, Shasta, Siskiyou and Tuolumne counties.
Coast Regions, including Lake, Los Angeles, Monterey, Napa, Orange, San Benito, San Diego, San Luis Obispo, Santa Barbara and Sonoma counties
These estimates provide the basis for our projections of the impacts of climate change on yields by 2030.
CA Water Plan Update 2013 Vol. 4 Reference Page 21
Topic: Planning Future Food Production and Consumption in California under Alternative Scenarios
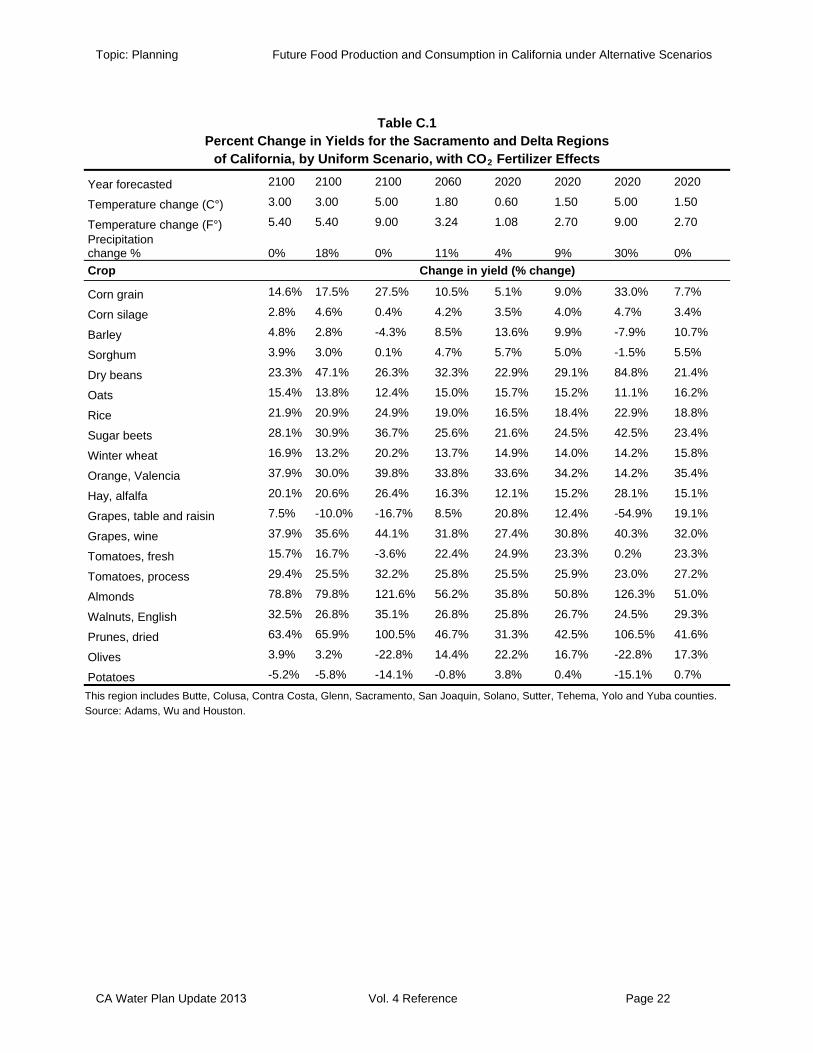
Table C.1 Percent Change in Yields for the Sacramento and Delta Regions
of California, by Uniform Scenario, with CO2 Fertilizer Effects
Year forecasted 2100 2100 2100 2060 2020 2020 2020 2020
Temperature change (C°) 3.00 3.00 5.00 1.80 0.60 1.50 5.00 1.50
Temperature change (F°) 5.40 5.40 9.00 3.24 1.08 2.70 9.00 2.70 Precipitation change % 0% 18% 0% 11% 4% 9% 30% 0% Crop Change in yield (% change)
Corn grain 14.6% 17.5% 27.5% 10.5% 5.1% 9.0% 33.0% 7.7%
Corn silage 2.8% 4.6% 0.4% 4.2% 3.5% 4.0% 4.7% 3.4%
Barley 4.8% 2.8% -4.3% 8.5% 13.6% 9.9% -7.9% 10.7%
Sorghum 3.9% 3.0% 0.1% 4.7% 5.7% 5.0% -1.5% 5.5%
Dry beans 23.3% 47.1% 26.3% 32.3% 22.9% 29.1% 84.8% 21.4%
Oats 15.4% 13.8% 12.4% 15.0% 15.7% 15.2% 11.1% 16.2%
Rice 21.9% 20.9% 24.9% 19.0% 16.5% 18.4% 22.9% 18.8%
Sugar beets 28.1% 30.9% 36.7% 25.6% 21.6% 24.5% 42.5% 23.4%
Winter wheat 16.9% 13.2% 20.2% 13.7% 14.9% 14.0% 14.2% 15.8%
Orange, Valencia 37.9% 30.0% 39.8% 33.8% 33.6% 34.2% 14.2% 35.4%
Hay, alfalfa 20.1% 20.6% 26.4% 16.3% 12.1% 15.2% 28.1% 15.1%
Grapes, table and raisin 7.5% -10.0% -16.7% 8.5% 20.8% 12.4% -54.9% 19.1%
Grapes, wine 37.9% 35.6% 44.1% 31.8% 27.4% 30.8% 40.3% 32.0%
Tomatoes, fresh 15.7% 16.7% -3.6% 22.4% 24.9% 23.3% 0.2% 23.3%
Tomatoes, process 29.4% 25.5% 32.2% 25.8% 25.5% 25.9% 23.0% 27.2%
Almonds 78.8% 79.8% 121.6% 56.2% 35.8% 50.8% 126.3% 51.0%
Walnuts, English 32.5% 26.8% 35.1% 26.8% 25.8% 26.7% 24.5% 29.3%
Prunes, dried 63.4% 65.9% 100.5% 46.7% 31.3% 42.5% 106.5% 41.6%
Olives 3.9% 3.2% -22.8% 14.4% 22.2% 16.7% -22.8% 17.3%
Potatoes -5.2% -5.8% -14.1% -0.8% 3.8% 0.4% -15.1% 0.7%
This region includes Butte, Colusa, Contra Costa, Glenn, Sacramento, San Joaquin, Solano, Sutter, Tehema, Yolo and Yuba counties. Source: Adams, Wu and Houston.
CA Water Plan Update 2013 Vol. 4 Reference Page 22
Topic: Planning Future Food Production and Consumption in California under Alternative Scenarios
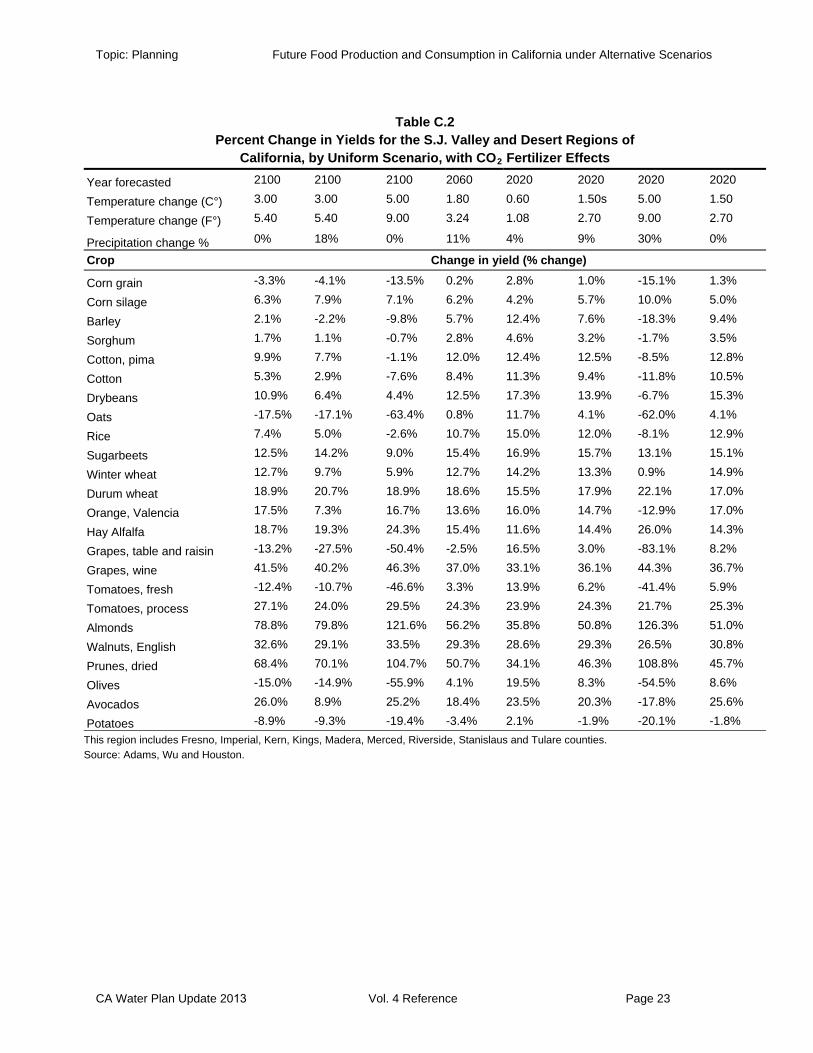
Table C.2 Percent Change in Yields for the S.J. Valley and Desert Regions of
California, by Uniform Scenario, with CO2 Fertilizer Effects
Year forecasted 2100 2100 2100 2060 2020 2020 2020 2020
Temperature change (C°) 3.00 3.00 5.00 1.80 0.60 1.50s 5.00 1.50
Temperature change (F°) 5.40 5.40 9.00 3.24 1.08 2.70 9.00 2.70
Precipitation change % 0% 18% 0% 11% 4% 9% 30% 0%
Crop Change in yield (% change)
Corn grain -3.3% -4.1% -13.5% 0.2% 2.8% 1.0% -15.1% 1.3%
Corn silage 6.3% 7.9% 7.1% 6.2% 4.2% 5.7% 10.0% 5.0%
Barley 2.1% -2.2% -9.8% 5.7% 12.4% 7.6% -18.3% 9.4%
Sorghum 1.7% 1.1% -0.7% 2.8% 4.6% 3.2% -1.7% 3.5%
Cotton, pima 9.9% 7.7% -1.1% 12.0% 12.4% 12.5% -8.5% 12.8%
Cotton 5.3% 2.9% -7.6% 8.4% 11.3% 9.4% -11.8% 10.5%
Drybeans 10.9% 6.4% 4.4% 12.5% 17.3% 13.9% -6.7% 15.3%
Oats -17.5% -17.1% -63.4% 0.8% 11.7% 4.1% -62.0% 4.1%
Rice 7.4% 5.0% -2.6% 10.7% 15.0% 12.0% -8.1% 12.9%
Sugarbeets 12.5% 14.2% 9.0% 15.4% 16.9% 15.7% 13.1% 15.1%
Winter wheat 12.7% 9.7% 5.9% 12.7% 14.2% 13.3% 0.9% 14.9%
Durum wheat 18.9% 20.7% 18.9% 18.6% 15.5% 17.9% 22.1% 17.0%
Orange, Valencia 17.5% 7.3% 16.7% 13.6% 16.0% 14.7% -12.9% 17.0%
Hay Alfalfa 18.7% 19.3% 24.3% 15.4% 11.6% 14.4% 26.0% 14.3%
Grapes, table and raisin -13.2% -27.5% -50.4% -2.5% 16.5% 3.0% -83.1% 8.2%
Grapes, wine 41.5% 40.2% 46.3% 37.0% 33.1% 36.1% 44.3% 36.7%
Tomatoes, fresh -12.4% -10.7% -46.6% 3.3% 13.9% 6.2% -41.4% 5.9%
Tomatoes, process 27.1% 24.0% 29.5% 24.3% 23.9% 24.3% 21.7% 25.3%
Almonds 78.8% 79.8% 121.6% 56.2% 35.8% 50.8% 126.3% 51.0%
Walnuts, English 32.6% 29.1% 33.5% 29.3% 28.6% 29.3% 26.5% 30.8%
Prunes, dried 68.4% 70.1% 104.7% 50.7% 34.1% 46.3% 108.8% 45.7%
Olives -15.0% -14.9% -55.9% 4.1% 19.5% 8.3% -54.5% 8.6%
Avocados 26.0% 8.9% 25.2% 18.4% 23.5% 20.3% -17.8% 25.6%
Potatoes -8.9% -9.3% -19.4% -3.4% 2.1% -1.9% -20.1% -1.8% This region includes Fresno, Imperial, Kern, Kings, Madera, Merced, Riverside, Stanislaus and Tulare counties. Source: Adams, Wu and Houston.
CA Water Plan Update 2013 Vol. 4 Reference Page 23
Topic: Planning Future Food Production and Consumption in California under Alternative Scenarios
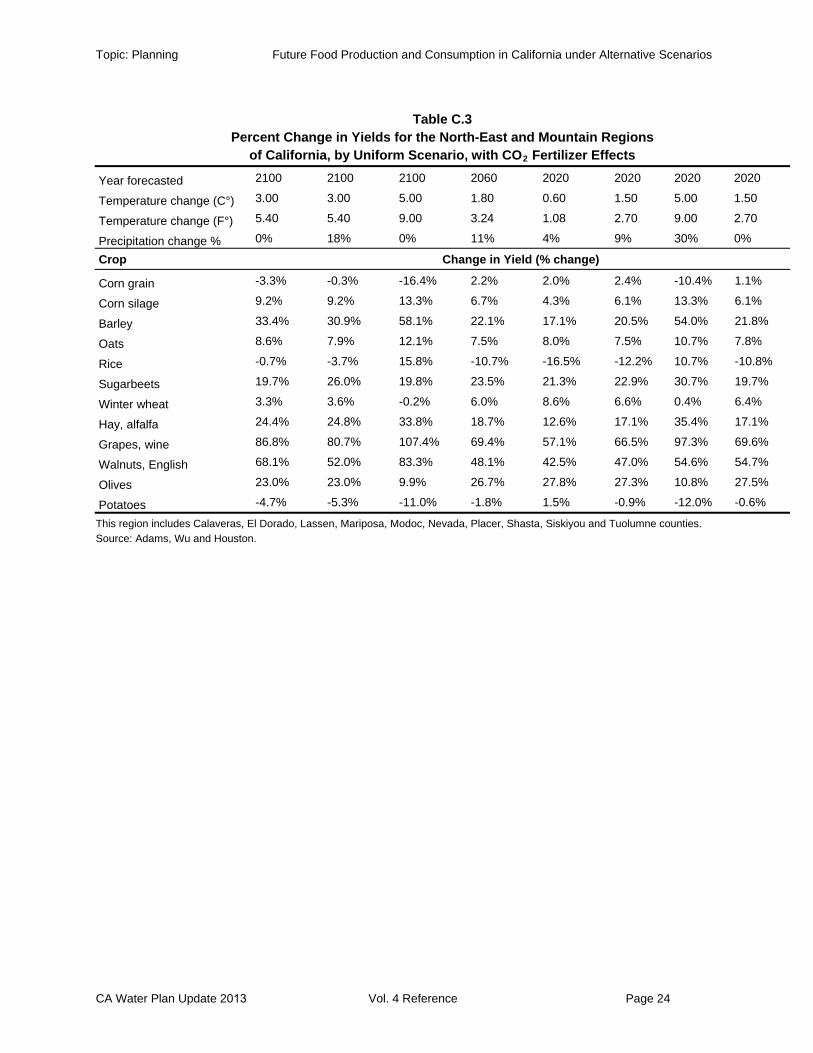
Table C.3 Percent Change in Yields for the North-East and Mountain Regions
of California, by Uniform Scenario, with CO2 Fertilizer Effects
Year forecasted 2100 2100 2100 2060 2020 2020 2020 2020
Temperature change (C°) 3.00 3.00 5.00 1.80 0.60 1.50 5.00 1.50
Temperature change (F°) 5.40 5.40 9.00 3.24 1.08 2.70 9.00 2.70
Precipitation change % 0% 18% 0% 11% 4% 9% 30% 0%
Crop Change in Yield (% change)
Corn grain -3.3% -0.3% -16.4% 2.2% 2.0% 2.4% -10.4% 1.1%
Corn silage 9.2% 9.2% 13.3% 6.7% 4.3% 6.1% 13.3% 6.1%
Barley 33.4% 30.9% 58.1% 22.1% 17.1% 20.5% 54.0% 21.8%
Oats 8.6% 7.9% 12.1% 7.5% 8.0% 7.5% 10.7% 7.8%
Rice -0.7% -3.7% 15.8% -10.7% -16.5% -12.2% 10.7% -10.8%
Sugarbeets 19.7% 26.0% 19.8% 23.5% 21.3% 22.9% 30.7% 19.7%
Winter wheat 3.3% 3.6% -0.2% 6.0% 8.6% 6.6% 0.4% 6.4%
Hay, alfalfa 24.4% 24.8% 33.8% 18.7% 12.6% 17.1% 35.4% 17.1%
Grapes, wine 86.8% 80.7% 107.4% 69.4% 57.1% 66.5% 97.3% 69.6%
Walnuts, English 68.1% 52.0% 83.3% 48.1% 42.5% 47.0% 54.6% 54.7%
Olives 23.0% 23.0% 9.9% 26.7% 27.8% 27.3% 10.8% 27.5%
Potatoes -4.7% -5.3% -11.0% -1.8% 1.5% -0.9% -12.0% -0.6%
This region includes Calaveras, El Dorado, Lassen, Mariposa, Modoc, Nevada, Placer, Shasta, Siskiyou and Tuolumne counties. Source: Adams, Wu and Houston.
CA Water Plan Update 2013 Vol. 4 Reference Page 24
Topic: Planning Future Food Production and Consumption in California under Alternative Scenarios
CA Water Plan Update 2013 Vol. 4 Reference Page 25
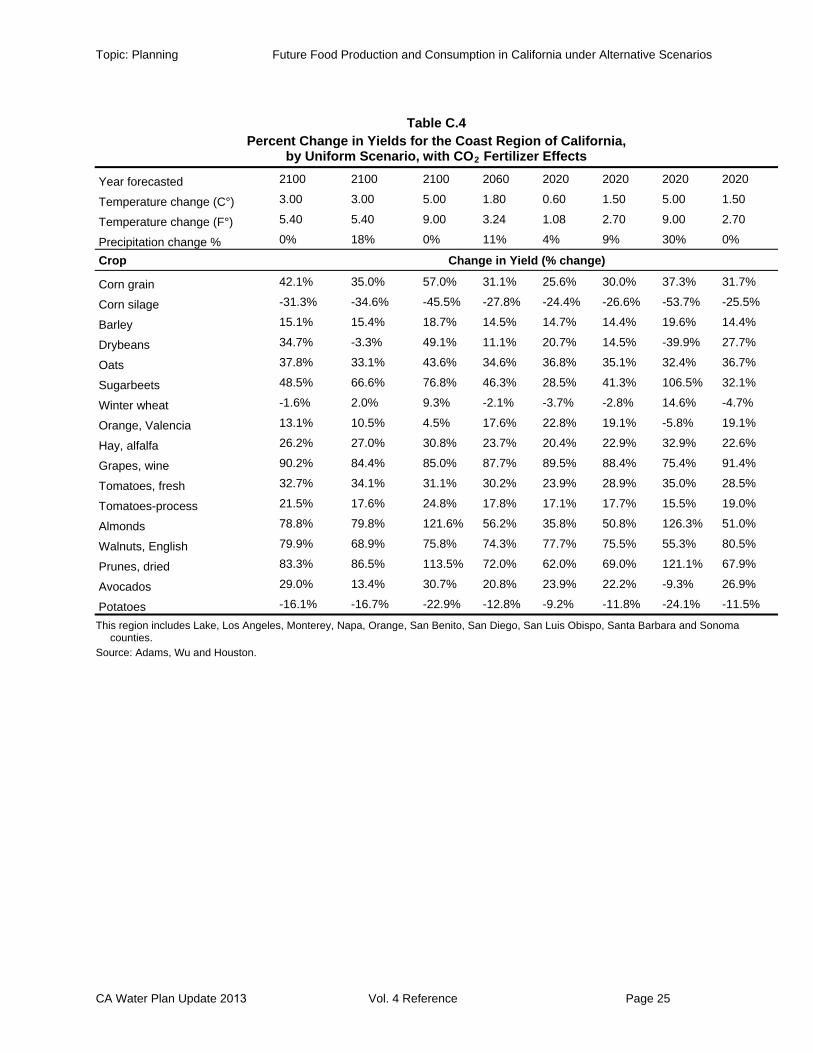
Table C.4 Percent Change in Yields for the Coast Region of California,
by Uniform Scenario, with CO2 Fertilizer Effects
Year forecasted 2100 2100 2100 2060 2020 2020 2020 2020
Temperature change (C°) 3.00 3.00 5.00 1.80 0.60 1.50 5.00 1.50
Temperature change (F°) 5.40 5.40 9.00 3.24 1.08 2.70 9.00 2.70
Precipitation change % 0% 18% 0% 11% 4% 9% 30% 0%
Crop Change in Yield (% change)
Corn grain 42.1% 35.0% 57.0% 31.1% 25.6% 30.0% 37.3% 31.7%
Corn silage -31.3% -34.6% -45.5% -27.8% -24.4% -26.6% -53.7% -25.5%
Barley 15.1% 15.4% 18.7% 14.5% 14.7% 14.4% 19.6% 14.4%
Drybeans 34.7% -3.3% 49.1% 11.1% 20.7% 14.5% -39.9% 27.7%
Oats 37.8% 33.1% 43.6% 34.6% 36.8% 35.1% 32.4% 36.7%
Sugarbeets 48.5% 66.6% 76.8% 46.3% 28.5% 41.3% 106.5% 32.1%
Winter wheat -1.6% 2.0% 9.3% -2.1% -3.7% -2.8% 14.6% -4.7%
Orange, Valencia 13.1% 10.5% 4.5% 17.6% 22.8% 19.1% -5.8% 19.1%
Hay, alfalfa 26.2% 27.0% 30.8% 23.7% 20.4% 22.9% 32.9% 22.6%
Grapes, wine 90.2% 84.4% 85.0% 87.7% 89.5% 88.4% 75.4% 91.4%
Tomatoes, fresh 32.7% 34.1% 31.1% 30.2% 23.9% 28.9% 35.0% 28.5%
Tomatoes-process 21.5% 17.6% 24.8% 17.8% 17.1% 17.7% 15.5% 19.0%
Almonds 78.8% 79.8% 121.6% 56.2% 35.8% 50.8% 126.3% 51.0%
Walnuts, English 79.9% 68.9% 75.8% 74.3% 77.7% 75.5% 55.3% 80.5%
Prunes, dried 83.3% 86.5% 113.5% 72.0% 62.0% 69.0% 121.1% 67.9%
Avocados 29.0% 13.4% 30.7% 20.8% 23.9% 22.2% -9.3% 26.9%
Potatoes -16.1% -16.7% -22.9% -12.8% -9.2% -11.8% -24.1% -11.5%
This region includes Lake, Los Angeles, Monterey, Napa, Orange, San Benito, San Diego, San Luis Obispo, Santa Barbara and Sonoma counties.
Source: Adams, Wu and Houston.