fundamentals of irrigation and on-farm water management: volume 1 || plant: a machinery of water...
TRANSCRIPT

Chapter 5
Plant: A Machinery of Water Absorption
Among the living organisms, only the green plants are able to build up organic food
from the relatively raw materials of the inorganic world. Plants are not limited
by size because of their indeterminate growth and architectural design. This gives
plants the ability to colonize and exploit new areas for resources. Growing condi-
tions and management decisions at any stage of crop plant can have a significant
bearing on the ultimate performance of the crop. In modeling water and nutrient
uptake and in quantifying the effect of fertilizer and/or irrigation on growth and
yield, root information is needed because root is the organ of the plant which takes
up necessary nutrient and water for the plant.
Water is a reactant in many chemical reactions in the plant. Water movement
from cell to cell in plants occurs along gradients of “water potential”. Water-related
data of plants in different environments facilitate understanding about how plants
“adjust or adapt” in order to maintain an appropriate water status that is necessary
for survival and growth. The overall ability of a plant to survive in a drought
condition depends on many morphological, physiological, and phenological char-
acteristics. A sound understanding of plant growth and development, morpho-
physiological structure, and plant–water relations is essential for efficient and
economic crop management.
5.1 General Overview and Types of Plant
5.1.1 General Overview
Plants have an architectural design. In other words, the plant body is constructed
like a building – modular. It is built of a limited number of units, each of which is
relatively independent of the others and that are united into a single structure. Thus,
just like a building is made of rooms, the leaves, stems, and roots of a plant are
analogous to rooms in the building. Each room is somewhat independent, yet they
all function together to make an integrated whole. You can seal off a room in a
M.H. Ali, Fundamentals of Irrigation and On-farm Water Management: Volume 1,DOI 10.1007/978-1-4419-6335-2_5, # Springer ScienceþBusiness Media, LLC 2010
219

building, or remove a leaf or fruit, with little harm to the overall integrity of the
structure. This is critical for plants to be able to add or remove parts (leaves, stems,
flowers, fruits) as necessary. Plants are not limited by size because of their indeter-
minate growth and architectural design. This gives plants the ability to colonize and
exploit new areas for resources.
Among the living organisms, only the green plants are able to build up organic
food from the relatively raw materials of the inorganic world. (Certain bacteria,
e.g., nitrifying and sulfur bacteria, are also able to build up organic materials. They
obtain their energy by oxidizing ammonia and hydrogen sulfide and obtain carbon
from the carbon dioxide of the air without the agency of sunlight. The organic
substances produced are relatively negligible in amount.) The plant in its botanical
sense includes every being which has vegetative-life, from the loftiest tree which
adorns our landscapes to the humblest moss which grows on its stem, to the mould
or fungus which attacks out provisions, or the green scum that floats on our ponds.
Information on crop characteristics is required to determine plant’s available
soil-water. Crop rooting pattern, the depth of rooting, density of roots with depth,
and crop susceptibility to water stress are important crop characteristics.
5.1.2 Types of Plants
Plants can be classified in various ways. Several classes of plants are presented here.
In a broad sense, plants may be classified into monocarpic and caulocarpic.
Monocarpic: These type of plants die after one flowering-season. These includeannuals, which flower in the same year in which they are raised from seed; and
biennials, which only flower in the year following that in which they are sown.
Examples are rice, wheat, banana, etc.
Caulocarpic: If, after flowering, the whole or part of the plant lives and producesfresh flowers in another season. These include herbaceous perennials, in which the
greater part of the plant dies after flowering, leaving only a small perennial portion
called the stock or caudex, close to or within the earth; undershrubs, suffruticose, or
suffrutiscent plants, in which the flowering branches, forming a considerable
portion of the plant, die down after flowering but leave a more or less prominent
and woody base; shrubs (frutescent or fruticose plants), in which the perennial
woody part forms the greater part of the plant, but branches near the base, and does
not much exceed a man’s height; and trees (arboreus or arborescent plants) when
the height is greater and forms a woody trunk, scarcely branching from the base.
5.1.2.1 Terrestrial and Aquatic Plants
Based on the growing environment (soil or water), plants may be terrestrial
and aquatic. Plants are usually terrestrial, that is growing on earth, or aquatic,i.e., growing in water; but sometimes they may be found attached by their roots to
other plants, in which case they are epiphytes when simply growing upon other
220 5 Plant: A Machinery of Water Absorption

plants without penetrating into their tissue, parasites when their roots penetrate intoand derive more or less nutrient from the plant to which they are attached.
5.1.2.2 C3 and C4 Plants
Based on the photosynthetic pathway, plants may be C4 and C3 types. The term C-4
refers to certain plants (such as sugarcane, that evolve in semi-arid tropical or sub-
tropical areas) which have a special added metabolic pathway. Some of the
intermediate compounds in this pathway are four-carbon acids, hence the term
“C-4”. These plants use some of their light energy to drive this extra path, but
overall energy efficiency in air and bright sunlight is higher than other plants. The
C-4 plants avoid a wasteful process called photorespiration that occurs in other
plants at high light intensities. The C4 pathway of photosynthesis is essentially a
pumping mechanism that moves CO2 from the mesophyll cells and cause high CO2
concentrations in the biochemically active vascular-bundle sheath cells.
Atmospheric CO2 concentrations are strongly inhibitive to CO2 uptake in C3
plants where CO2 is fixed directly by RuBP carboxylase. For a given rate of
transpiration, photosynthesis is greater in C4 than in C3 plants.
5.1.2.3 CAM Plants
The crassulacean-acid metabolism (CAM) has evolved in some desert succulents
and cacti. CAM plants open their stomata primarily at night when they assimilate
carbon dioxide into oxaloacetate. Daily water use is minimized but their growth is
very slow.
5.2 Development of Plants
5.2.1 Growth Stages of Field Crops
There is a wise saying, “You can not manage what you do not observe and
measure.” A sound understanding of plant growth and development is an essential
element of efficient and economic crop management systems. Growing conditions
and management decisions at any stage can have a significant bearing on the
ultimate performance of the crop. The impact of frost, heat, drought, diseases,
insects, and weeds can be more accurately predicted with a clear picture of the relation-
ships between growth stage and plant response to stress. The optimum timing (and
need) of fertilizer, irrigation, herbicide, insecticide, and fungicide applications are
also best determined by crop growth stage rather than calendar date. Also, crop
monitoring to determine the timing of the occurrences of such yield-reducing
factors as lodging, water-logging, and frost will, in combination with other severity,
determine their effect on grain yield.
5.2 Development of Plants 221

A number of staging systems have been evolved for describing the development
of cereals. The ten major growth stages that the cereal plant progresses through
during its life cycle are all familiar to us: (1) Germination, (2) Seedling, (3)
Tillering, (4) Stem elongation or Jointing, (5) Booting, (6) Heading, (7) Flowering
or Anthesis, (8) Milk, (9) Dough, (10) Ripening.
5.2.1.1 Numerical Measures of Growth and Development
Several systems have been developed to provide numerical designations for growth
and developmental stages. Among these, the Feekes, Zadoks, and Haun scales are
used the most frequently.
5.2.1.2 Feekes Scale
The Feekes scale was originally designed for wheat by Feekes (1941), and then
illustrated and amended by Large (1954) (Table 5.1, Fig. 5.1). It recognizes 11
Table 5.1 Growth stages and corresponding Feekes scale (after Large 1954; with permission
from Wiley-Blackwell)
Growth stage Feekes scale Crop growth description
Tillering 1 One shoot (number of leaves can be added)
2 Beginning of tillering
3 Tillers formed, leaves often twisted spirally. In some
varieties of winter wheats, plants may be “creeping” or
prostrate
4 Beginning of the erection of the pseudo-stem, leaf sheaths
beginning to lengthen
5 Pseudo-stem (formed by sheaths of leaves) strongly erected
Stem elongation 6 First node of stem visible at base of shoot
7 Second node of stem formed, next-to-last leaf just visible
8 Last leaf visible, but still rolled up, ear beginning to swell
9 Ligule of last leaf just visible
10 Sheath of last leaf completely grown out, ear swollen but not
yet visible
Heading 10.1 First ears just visible (awns just showing in barley, ear
escaping through split of sheath in wheat or oats)
10.2 Quarter of heading process completed
10.3 Half of heading process completed
10.4 Three-quarters of heading process completed
10.5 All ears out of sheath
Flowering (wheat) 10.5.1 Beginning of flowering (wheat)
10.5.2 Flowering complete to top of ear
10.5.3 Flowering over at base of ear
10.5.4 Flowering over, kernel watery ripe
Ripening 11.1 Milky ripe
11.2 Mealy ripe, contents of kernel soft but dry
11.3 Kernel hard (difficult to divide by thumb-nail)
11.4 Ripe for cutting. Straw dead
222 5 Plant: A Machinery of Water Absorption

major growth stages starting with seedling emergence and ending with grain
ripening. The Feekes scale is frequently used to identify optimum stages for
chemical treatments, such as fungicide applications, that focus on the plant devel-
opment period from the start of stem elongation (Feekes stage 6) to the completion
of flowering (Feekes stage 10.53). According to Large (1954), cereals develop as
per Feekes growth stages (Table 5.1).
5.2.1.3 Zadoks Scale
The Zadoks decimal code (Z) is used internationally to describe growth stages of
cereals. The Zadoks scale (Zadoks et al. 1974) covers all stages from seed to
seed, using a two-digit, computer compatible, easy-to-memorize, numerical code
(Table 5.2). It uses code based on ten major stages that can be subdivided, making it
particularly suited for computerization.
The Zadoks’s system applies to any small grain cereals (e.g., wheat, barley, rye,
oats, and rice) and its stages are easy to identify in the field. It is more detailed than
other systems and allows for precise staging. The first digit of this two-digit code
(shown in Table 5.2) refers to the principal stage of development beginning with
germination (stage 0) and ending with kernel ripening (stage 9). Use of the second
digit between 0 and 9 subdivides each principal growth stage. A second digit value
of 5 usually indicates the midpoint of the principal stage. For example, a 75 refers to
medium milk stage of kernel development. In seedling growth, principal growth
Stage 1one
shoot
Stage 2tilleringbeqins
Stage 3tillers
formed
Stage 4leaf
sheathslenqthen
Stage 5leaf
sheathsstronglyerected
Stage 6first
node ofstem
visible
Stage 7secondnodevisible
Stage 8last leaf
justvisible
Stage 9ligule oflast leaf
justvisible
Stage 10in “boot”
Stem Extension
Tillering
Growth Stagesin Cereals
Heading Ripening
Stage10.1
Stage 10.5flowering(wheat)
Stage 11
Fig. 5.1 Illustration of growth stages in cereal by Feekes scale (after Large 1954; with permission
from Wiley-Blackwell)
5.2 Development of Plants 223

stage 1, the second digit refers to the number of emerged leaves. To be counted, a
leaf must be at least 50 percent emerged. A 13, for example, indicates that three
leaves are at least 50 percent emerged on the main shoot. Tiller leaves are not
counted.
Table 5.2 Description of the growth stages of the Zadoks decimal code for cereals (with
consideration of wheat) (after Zadoks et al. 1974; with permission from Wiley-Blackwell)
Code Stage Code Stage
Germination Booting00 Dry seed 40 –
01 Water uptake (imbibition) started 41 Flag leaf sheath extending
03 Imbibition complete 45 Boot just swollen
05 Radicle emerged from seed 47 Flag leaf sheath opening
07 Coleoptile emerged from seed 49 First awans visible
09 Leaf just at coleoptile tip HeadingSeedling development 50 First spikelet of head visible
10 First leaf emerged 53 ¼ of head emerged
11 First leaf unfolded 55 ½ of head emerged
12 2 leaves unfolded 57 ¾ of head emerged
13 3 leaves unfolded 59 Emergence of head complete
14 4 leaves unfolded Flowering/Anthesis15 5 leaves unfolded 60 Beginning of flowering
16 6 leaves unfolded 65 Flowering half complete
17 7 leaves unfolded 69 Flowering complete
18 8 leaves unfolded Milk19 9 or more leaves unfolded 70 –
Tillering 71 Kernel watery
20 Main shoot only 73 Early milk
21 Main shoot and 1 tiller 75 Medium milk
22 Main shoot and 2 tillers 77 Late milk
23 Main shoot and 3 tillers Dough24 Main shoot and 4 tillers 80 –
25 Main shoot and 5 tillers 83 Early dough
26 Main shoot and 6 tillers 85 Soft dough
27 Main shoot and 7 tillers 87 Hard dough
28 Main shoot and 8 tillers Ripening29 Main shoot and 9 or more tillers 90 –
Stem elongation or jointing 91 Kernel hard (difficult to separate by fingernail)
30 Pseudo stem erection 92 Kernel hard
31 1st node detectable 93 Kernel loosening in daytime
32 2nd node detectable 94 Overripe, straw dead, and collapsing
33 3rd node detectable 95 Seed dormant
34 4th node detectable 96 50% of viable seed germinates
35 5th node detectable 97 Seed not dormant
36 6th node detectable 98 Secondary dormancy
37 Flag leaf just visible 99 Secondary dormancy lost
39 Flag leaf ligule/collar just visible
224 5 Plant: A Machinery of Water Absorption

5.2.1.4 Haun Scale
The Haun scale growth stages are based on rate of development of the main shoot
(Haun 1973). In the early stages, the description of each new leaf is related to the
previous leaf that was produced. For example, a seedling with one fully extended
leaf and a second leaf that is half as long as the fully extended leaf is at Haun stage
1.5. Similarly, a plant with five fully extended leaves on the main shoot and an
emerging sixth main shoot leaf that is 30% as long as the fifth leaf is at Haun stage
5.3. The booting stage numerical designation starts at one more than the number of
leaves produced by the main shoot, i.e., the flag leaf number plus one. This can
cause confusion because the flag number is not a constant for all cultivars. For this
reason, the Haun scale has been used mainly to describe the growth stages before
the booting stage. Haun scale values from the booting to ripening stages are
dependent on the number of leaves produced on the main stem.
5.2.1.5 Comparison Among Feekes, Zadoks, and Haun Scales
The scales differ in their scaling pattern and magnitude of the code. The differences
among the Feekes, Zadoks, and Haun scale are illustrated in Table 5.3 with a
sample crop, wheat.
5.2.2 Growth and Development of Cereals: Example withWheat Plant
5.2.2.1 Growth Stages of Wheat
An understanding of crop growth and development is essential to achieve optimum
productivity of the crop. The growth cycle of wheat has mainly the following
divisions: germination, seedling establishment and leaf production, tillering and
head differentiation, stem and head growth, head emergence and flowering, and
grain filling and maturity. Bhuiya and Kamal (1991) identified 12 growth stages
under six growth phases of different winter wheat cultivars in a sub-humid sub-
tropic environment, having variations in duration in different varieties. The phases
were germination and emergence (0–8 days), tillering (8–43 days), stem elongation
(33–65 days), heading (55–75 days), flowering (61–81 days), and grain formation
and ripening (65–115 days). The growth stages were emergence (0–8 days),
seedling (9–18 days), crown root (17–29 days), tillering (22–43 days), jointing
(33–51 days), shooting (42–59 days), booting (51–65 days), heading (56–75 days),
flowering (61–81 days), milk (65–88 days), dough (79–98 days), and ripening
(92–115 days).
5.2 Development of Plants 225

Table 5.3 Comparative illustrations of wheat growth stages for Haun, Feekes, and Zadoks scales
Haun scale Feekes scale Zadoks scale General description
0.0 Germination00 Dry seed
01 Water uptake (imbibition) started
03 Imbibition complete
05 Radicle emerged from seed
07 Coleoptile emerged from seed
09 Leaf just at coleoptile tip
Seedling development10 First leaf emerged
1.þ 1 11 First leaf unfolded
1.þ 12 2 leaves unfolded
2.þ 13 3 leaves unfolded
3.þ 14 4 leaves unfolded
4.þ 15 5 leaves unfolded
5.þ 16 6 leaves unfolded
6.þ 17 7 leaves unfolded
7.þ 18 8 leaves unfolded
8.þ 19 9 or more leaves unfolded
Tillering20 Main shoot only
2 21 Main shoot and 1 tiller
22 Main shoot and 2 tillers
23 Main shoot and 3 tillers
24 Main shoot and 4 tillers
25 Main shoot and 5 tillers
26 Main shoot and 6 tillers
27 Main shoot and 7 tillers
28 Main shoot and 8 tillers
29 Main shoot and 9 or more tillers
Stem elongation or jointing4–5 30 Pseudo stem erection
6 31 1st node detectable
7 32 2nd node detectable
33 3rd node detectable
34 4th node detectable
35 5th node detectable
36 6th node detectable
8 37 Flag leaf just visible
9 39 Flag leaf ligule/collar just visible
Booting40 –
8–9 41 Flag leaf sheath extending
9.2 45 Boot just swollen
47 Flag leaf sheath opening
10.1 49 First awans visible
Heading10.2 10.1 50 First spikelet of head visible
10.2 53 ¼ of head emerged
10.5 10.3 55 ½ of head emerged
10.7 10.4 57 ¾ of head emerged
11.0 10.5 59 Emergence of head complete
(continued)
226 5 Plant: A Machinery of Water Absorption

Some Relevant Terminologies
Before going through details about different growth stages and plant parts, it is
useful to define some relevant terminologies used frequently.
Adventitious roots: Roots produced by crown nodes on the main shoot and tillers.
Crown: Several nodes whose internodes do not elongate.
Sheath: The tubular portion of a grass leaf that encloses the stem.
Spikelet: Subdivision of the head.
Radicle: The first root to emerge from the seed.
Seminal roots: The roots originating from the seed.
Photosynthate: The products of photosynthesis.Coleoptile: The leaf sheath which surrounds and protects the embryonic plant as
it emerges from the seed.
Leaf axil: The junction of the leaf with the main stem.
Internode: The region between two successive nodes.
Table 5.3 (continued)
Haun scale Feekes scale Zadoks scale General description
Flowering/Anthesis11.4 10.51 60 Beginning of flowering
11.5 65 Flowering half complete
11.6 69 Flowering complete
Milk70 –
12.1 10.54 71 Kernel watery
13.0 73 Early milk
11.1 75 Medium milk
77 Late milk
Dough80 –
83 Early dough
85 Soft dough
87 Hard dough
Ripening90 –
11.3 91 Kernel hard (difficult to separate
by fingernail)
16.0 11.4 92 Kernel hard
93 Kernel loosening in daytime
94 Overripe, straw dead, and collapsing
95 Seed dormant
96 50% of viable seed germinates
97 Seed not dormant
98 Secondary dormancy
99 Secondary dormancy lost
5.2 Development of Plants 227

Description of Growth Stages
Germination
When a seed is sown, the germination process begins. The radicle and seminal roots
first extend, followed by the coleoptile (Fig. 5.2a). Roots can be initiated from several
positions on the seedling, both at the level of the seed and at the crown (Fig. 5.2b, c).
The crown is usually separated from the seed by a sub-crown internode. The length of
this internode is greater as the depth of planting increases. As the coleoptile emerges
from the soil, its growth stops and the first true leaf pushes through the tip.
Fig. 5.2 (a) Schematic
of wheat germination.
(b) Sketch of wheat
emergence. (c) Sketch of
wheat plant with well
developed crown
228 5 Plant: A Machinery of Water Absorption

Seedling Stage
The seedling stage begins with the appearance of the first leaf and ends with the
emergence of the first tiller. Up to six seminal roots and three leaves support the
plant at this stage. The crown of the plant usually becomes noticeably distinct after
the third leaf has emerged.
After seedling emergence, leaves are produced at a rate of about one every 4–5
days. A total of eight or nine leaves are usually produced: later maturing varieties
have the larger number. Emergence of the last leaf (termed the flag leaf) is an
important stage for timing the application of certain plant growth regulators.
Tillering and Head Differentiation
Tillering is an important development stage that allows plants to compensate for
low plant populations or take advantage of good growing conditions. Tiller appear-
ance is closely coordinated with the appearance of leaves on the main shoot. The
number of tillers formed depends on the variety and growing conditions. Under
usual field conditions, a plant may produce a total of three tillers in addition to the
main shoot, although not all will necessarily produce grain. The capability also
exists to produce tillers from tillers (termed secondary tillers) if the plant is not
crowded or is heavily fertilized. Tillers that appear at the time that the fourth, fifth,
and sixth leaves emerge on the main shoot are most likely to complete development
and form grain. Tillers formed later are likely to abort without producing grain.
Tillers that produce more than three leaves and initiate their own root system are
most likely to survive. The proportion of initiated tillers that abort differs with the
variety and can increase if the crop encounters stress conditions.
During the time that tillering occurs, another less obvious but extremely impor-
tant event occurs: the initiation of heads on the main shoot and tillers. Although the
head at this time is microscopic, the parts that will become the floral structures and
kernels are already being formed. When head formation is complete, the stem
begins elongating. This corresponds to the “jointing” stage. A plant usually has
about five leaves at this time.
Stem and Head Growth
Lower stem internodes on the plant remain short throughout development. The
fourth internode is usually the first to elongate in a plant with nine total leaves. This
is followed in sequence by the internodes above it. Each stem internode up the plant
becomes progressively longer, and the last stem segment to elongate, the peduncle,
accounts for a considerable proportion of the total stem length. Growth regulators
that are designed to shorten plant stature and increase resistance to lodging are
timed to influence stem elongation. Some regulators act as growth retardants and
reduce elongation of the last two or three stem internodes, resulting in a shorter,
stiffer stemmed plant that lodges less readily.
5.2 Development of Plants 229

Stem elongation coincides with the period of rapid head growth in which the
individual florets become prepared to pollinate and be fertilized. Throughout the
pre-heading period, differences in the duration of the various developmental phases
among shoots on the same plant help synchronize development. This means a
difference of several weeks between emergence of the main shoot and a tiller is
reduced to a difference of only a few days by the time the heads emerge from the
flag leaf sheaths. The “boot” stage is just prior to head emergence, when the flag
leaf sheath encloses the growing head.
Head Emergence and Flowering
As the stem continues to elongate, the head is pushed out of the flag leaf sheath, a
stage referred to as “heading.” Within a few days after heading, flowering (pollina-
tion) begins in the head, starting first with the florets in the central spikelets. Within
the next few days flowering progresses both up and down the spike.
Flowering is usually noted by extrusion of the anthers from each floret, although
this can change depending on the variety and weather conditions. If the anthers
within a floret are yellow or gray rather than green, it is reasonably certain that
pollination of the floret has occurred. The period of pollination within a single head
is about 4 days. The young kernels within a head vary considerably in size at
pollination and maintain this size variation throughout grain filling to maturity. The
flowering or anthesis stage lasts from the beginning to the end of the flowering
period. Pollination and fertilization occur during this period. All heads of a properly
synchronized wheat plant flower within a few days, and the embryo and endosperm
begin to form immediately after fertilization.
Milk Stage
Early kernel formation occurs during the milk stage. The developing endosperm
starts as a milky fluid whose solid content increases as the milk stage progresses.
Kernel size increases rapidly during this stage.
Dough Development Stage
Kernel formation is completed during the dough development stage. The kernel
accumulates most of its dry weight during dough development. The transport of
nutrients from the leaves, stems, and spike to the developing seed is completed
by the end of the hard dough stage. The developing kernel is physiologically
mature at the hard dough stage even though it still contains approximately 30%
water.
230 5 Plant: A Machinery of Water Absorption

Ripening Stage
The seed loses moisture, and any dormancy it may have had, during the ripening
stage.
Adverse environmental conditions during any of the growth periods of a kernel
can reduce the rate of dry matter accumulation and decrease yield. As a rule, the
longer the adverse condition lasts, and the earlier it occurs during grain filling, the
greater its effect on yield. Throughout grain filling the kernel moisture percentage
declines, finally reaching a level between 30 and 40% at the time of maximum grain
weight (physiological maturity). However, kernel moisture does not always deter-
mine when physiological maturity occurs. A better indicator of maturity is when the
head and the peduncle lose their green color. The green color is lost from the flag
leaf blade when the kernel has attained about 95% of its final dry weight. Once the
crop is at physiological maturity, no more kernel dry weight will accumulate and it
can be harvested without reducing yield. After physiological maturity, moisture in
the kernels declines rapidly.
5.2.2.2 Critical Growth Stages of Wheat
An understanding of how plants respond to environmental stresses at different
growth stages can assist in the assessment of crop condition and production
potential throughout the growing season. Winter wheat plants must survive against
many stresses of winter. Roots and leaves that develop in the fall are often killed off
during the very cold period. However, as long as the crown remains alive, new roots
and leaves can be regenerated. Therefore, plants that enter the winter with well-
developed crowns have the best chance of winter survival.
The number of viable seeds planted and the number of tillers produced per plant
sets the upper limit on the number of heads that can be produced by a wheat crop.
Crown root initiation stage plays a significant role in plant vigor and tiller initiation.
Tiller production is favored by moist, warm weather and good soil fertility,
especially nitrogen fertility, prior to the stem elongation stage.
Tillers produced during the tillering stage must survive to maturity to contribute
to grain yield. The developing head and elongating stem start making large
demands on the plants’ resources once stem elongation starts and younger, poorly
developed tillers that are unable to compete are quickly lost. Drought and heat
stress during the stem elongation and booting stages increase the rate of tiller
mortality by placing added restrictions on resource availability. If a drought is
broken or a late application of nitrogen fertilizer suddenly becomes available during
this period, the developmental synchrony of the plant may be disrupted producing a
flush of later maturing heads.
Environmental stress prior to flag leaf appearance can result in a loss of spikelets
on the developing head. As many as 12 florets per spikelet can be initiated under
favorable conditions for development. However, later forming florets abort, and
normally only two to four florets actually set seed in each spikelet. Floret initiation
5.2 Development of Plants 231
starts in the lower central region and progresses toward the base and tip of the head.
Under extreme environmental stress, all of the florets in the spikelets at the top and
bottom of the head may abort prior to flowering.
5.2.2.3 Grain Yield Production
Sources of Photosynthates for Grain Yield
Approximately 70–90% of the final grain yield is derived from photosynthates
(products of photosynthesis) produced by the plant during grain filling (the remain-
ing from pre-stored carbohydrates in vegetative parts). The flag leaf and head
usually contribute most, but certainly not all, of the photosynthate to the grain.
Photosynthates produced by the flag leaf may contribute up to 50% of the grain
yield, depending on seasonal conditions, but the head, penultimate leaf, and other
leaves can also contribute significant quantities. Maintaining green and functional
upper leaf blades, sheaths, and heads during grain filling is important for high yields.
Cool temperature with sunny days favor wheat growth and yield, as cool
temperature requires less respirational energy loss and bright sunshine increase
photosynthesis (more energy gain).
Expression of Wheat Yield
Grain yield of wheat can be expressed as the product of yield components as (Ali
et al. 2007):
Grain yield=m2 ¼ ðnumber of effective tiller or panicle=m2Þ� ðseed=panicleÞ � ðaverage unit seed weightÞ (5.1)
The impact of each yield component on final grain yield is determined at
different stages during the growing period.
5.2.3 Thermal Time Requirement of Crop
Crop growth and development is often described in terms of days from sowing, e.g.,
50-day wheat, frost-free days, heading date, etc. However, a consideration of
temperature is also important because temperature determines the rate of growth
and development. The time–temperature unit that governs plant growth and devel-
opment is known as thermal time and it is measured in heat units or growing-degree
days. Heat unit is often used to avoid confusion between growing-degree days and
calendar days.
The thermal time required for crop production is determined by adding the
daily heat units together for the period between planting and harvest. Details
232 5 Plant: A Machinery of Water Absorption

about the importance of heat unit and calculation procedure of different heat units
have been described in Chap. 2 (Climate). The thermal time provides an explana-
tion for differences in crop maturity when observations from different years are
compared.
5.3 Structure of Plant
5.3.1 General Structural Overview
A crop plant has two main organ systems: (1) the shoot system and (2) the root
system. The shoot system is above ground and includes the organs such as leaves,
buds, stems, flowers (if the plant has any), and fruits (if the plant has any). The root
system includes parts of the plant below ground, such as the roots, tubers, and
rhizomes.
Functions of Shoot System
l Elevates the plant above the soill Many other functions including the following:
– Photosynthesis
– Reproduction and dispersal
– Food and water conduction
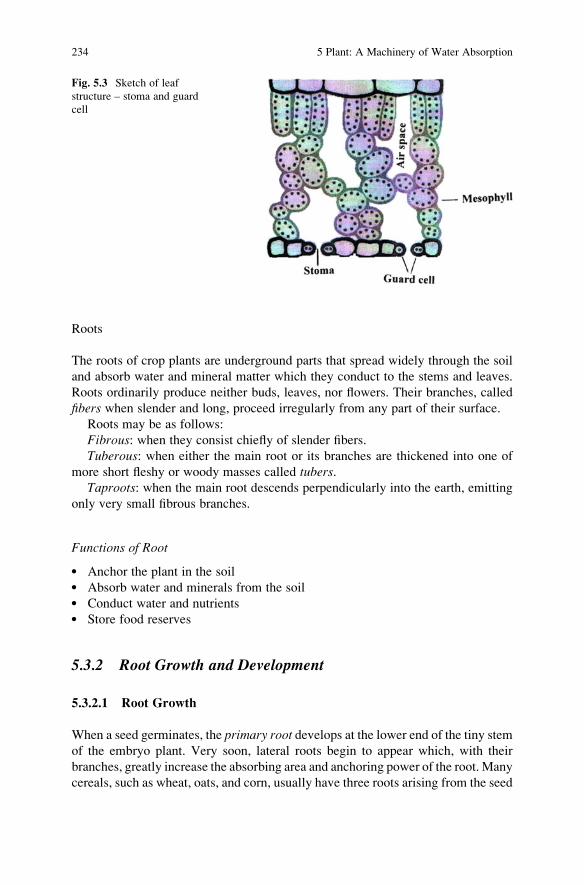
Functions of Leaf
l Trap light energy for photosynthesisl Produce sugar by photosynthesisl Exchange of gases – oxygen and carbon dioxide
Leaves are designed to allow carbon dioxide to get to the main chlorophyll layer
at the top of the leaf. They have small holes called stomata on the under surface.
Each hole is open and closed by two guard cells (Fig. 5.3).
Stomata open and close at different times of the day. When it is light, the plant
needs CO2 for photosynthesis so the stoma open; and at night (darkness) they
close. The closure of stomata is also influenced by water content of the guard
cells. As the turgor pressure of the guard cells increase, the cells swell outward and
open the stomatal pore. On the contrary, when the turgor pressure of the cells
decrease, the cells shrinks inward and then the stomatal pore closed. High tempera-
ture may also close stomatal closure. This may probably results from enhanced
respiration and increased levels of CO2 in the stomatal cavities. Stomatal behaviour
may be different in different plant species, leaf position on the plant, stage of
growth, and environmental conditions.
5.3 Structure of Plant 233
Roots
The roots of crop plants are underground parts that spread widely through the soil
and absorb water and mineral matter which they conduct to the stems and leaves.
Roots ordinarily produce neither buds, leaves, nor flowers. Their branches, called
fibers when slender and long, proceed irregularly from any part of their surface.
Roots may be as follows:
Fibrous: when they consist chiefly of slender fibers.
Tuberous: when either the main root or its branches are thickened into one of
more short fleshy or woody masses called tubers.Taproots: when the main root descends perpendicularly into the earth, emitting
only very small fibrous branches.
Functions of Root
l Anchor the plant in the soill Absorb water and minerals from the soill Conduct water and nutrientsl Store food reserves
5.3.2 Root Growth and Development
5.3.2.1 Root Growth
When a seed germinates, the primary root develops at the lower end of the tiny stemof the embryo plant. Very soon, lateral roots begin to appear which, with their
branches, greatly increase the absorbing area and anchoring power of the root. Many
cereals, such as wheat, oats, and corn, usually have three roots arising from the seed
Fig. 5.3 Sketch of leaf
structure – stoma and guard
cell
234 5 Plant: A Machinery of Water Absorption

(seminal roots), i.e. the primary root and two almost equally large laterals. These
with their branches (sometimes supplemented by other primary roots) constitute the
primary root system. In the case of the cereals and other grasses which have strong,
threadlike or fibrous roots the larger part of the root system is composed of the
adventitious roots which collectively make up the secondary root system.Plant roots are responsible for nutrient and water uptake and provide physical
support to the plant. Most of the root system is made of lateral roots that originate
postembryonically. Lateral root development is controlled by different factors
including nutrient concentration in the plant and the soil. This plasticity allows
adaptation of the root system to the soil, a very heterogeneous and changing
environment, and is consequently very important for the survival of the plant.
5.3.2.2 Structure of Root
Internally, the roots of all cultivated plants are built on the same general plan and
differ from one another only in detail. Although the growing root ends are usually
only about a millimeter in diameter, they show a wonderful differentiation and are
remarkably adapted to perform their several functions (Fig. 5.4).
The amount of water and air in the soil has a marked effect upon the develop-
ment of root hairs. The roots of cultivated crops usually produce few root hairs
in wet soil. In moderately moist soil corn roots are almost woolly with root hairs,
but there are fewer in wet soil, and usually none in water. The same general rela-
tion’s hold for most cultivated plants, although there are some exceptions. Wet soils
contain less air than dry ones and a good oxygen supply seems necessary to promote
Root cap
Root hair
Fig. 5.4 Schematic view of
root structure (showing root
cap, root hairs)
5.3 Structure of Plant 235

abundant development of root hairs, at least in many species. Most cultivated plants
require a well-aerated soil. Indeed, one of the chief advantages of stirring the soil is
to admit air to the roots. In cultivated plants, so long as they do not wilt, it has been
observed that the most abundant production of root hairs takes place at a water
content somewhat less than that which will afford the highest yield. Of course, if
soils become very dry, both root hairs and young rootlets die. Root-hair develop-
ment may also be retarded by a very concentrated soil solution such as that occurs in
alkali soils. Extremes of temperature are also inimical to their growth. They
develop in the light and dark about equally well, provided there is ample moisture.
The great importance of roots hairs may be realized when it is found that absorption
is practically limited to the root-hair zone.
5.3.2.3 Relation of Roots to Soil Moisture
Crops respond to differences in water content and aeration, both in amount and
direction of growth. By varying these factors by the application of more or less
water, not only the root system but also the aboveground plant parts and yields may
be varied, since a close correlation exists between the growth of roots and tops. The
necessary water can be applied more effectively if a knowledge of the extent and
position of the root system as modified by the chemical and physical nature of the
soil is known.
If the subsoil is water-logged and thus unaerated, deeper roots will not develop
or, if already grown, will soon die as the water table rises. In either case, there is a
marked tendency toward the production of an abundance of roots so superficially
placed that cultivation results in more or less serious root pruning. Moreover, under
such conditions, plants are more sensitive to drought, temperature changes, etc.
They require heavier irrigation and greater amounts of fertilizers than those more
deeply rooted.
5.3.2.4 Factors Affecting Root Development and Adaptation
Some crops are better adapted to semiarid regions than others. The reason may
sometimes be explained, at least in part, by a study of the root habit. Root distribu-
tion and development is greatly modified by various cultural practices. For exam-
ple, loosening the soil by plowing results in increased storage of water and better
aeration. This not only makes conditions more favorable for seed germination but
affords better conditions for the growth of roots and for soil organisms such as
nitrate bacteria. The latter produce greater amounts of nitrates which, in turn, affect
root growth. Fertilizing the surface layers of soil, especially with nitrates, and thus
stimulating surface root production in regions where these layers have very little or
no available water during periods of drought appears to be distinctly detrimental to
normal crop production. The effect of phosphates in promoting root growth in
length and number of branches has long been recognized in agricultural practice.
236 5 Plant: A Machinery of Water Absorption
Layers of compact soil often play an important part in shaping the root system.
Depth of water table also influences the length of root. Depth of plowing, listing, or
sub-soiling and the preparation of the seed bed, as well as the time, depth, and
manner of subsequent cultivation influence the rooting system. Moreover, the
loosened soil makes root penetration easier. Roots tend to develop a shorter and
more compact structure in dense than in loose soils. Subsoiling carries the air still
deeper and at the same time raises more minerals to the surface soil layers. It
modifies in many ways the physical, chemical, and biological factors of the soil. All
these changes are ultimately reflected in root habit.
5.3.2.5 Transport of Assimilates
It has been mentioned that a system of vascular bundles runs through all higher
plants. It evolved as a response to the increase in the size of plants, which caused a
progressing separation of roots and leaves in space. Thus, plants developed systems
for long distance transport – i.e., translocation. The system consists of xylem and
phloem. The xylem is the tissue that translocates water and minerals. Transport
occurs acripetally, i.e., in the direction of the shoot’s tip. The phloem is the tissue
that translocates assimilates from mature leaves to growing or storage organs and
roots. It serves, too, to redistribute water and various other substances. It may run
either basipetally, i.e., in the direction of the root or bi-directionally (both acripe-
tally and basipetally).
Xylem Transport
The xylem of a living plant is an interconnected, water-containing apoplastic
system of communicating tubes in which the water holds together by cohesion
forces. The xylem transports water and dissolved ions. The main portion of the
water is taken up by young roots. Absorption occurs directly by the rhizodermis,
and the area that takes up water and ions is enlarged by the formation of root hairs.
From there flows the water through the cortex that may be developed as an
exodermis, through the endodermis, the innermost layer of cortical cells and into
the cells of the stele’s vascular bundles. It is then transported through the roots to
the shoot and finally into the leaves where it is given off by transpiration.
5.4 Crop Growth Factors
Plant growth and development is dependent on abiotic (physical) and biotic (bio-
logical) factors. Abiotic factors include the physical environmental conditions and
biotic factors include animals, insects, and diseases.
5.4 Crop Growth Factors 237

Among abiotic factors, crop growth is influenced by the following:
l Climatic factorl Waterl Nutrient
Crop growth is also influenced by growth hormone, if it is artificially applied. In
addition, cultural practices that enhance the development of healthy, vigorous root
systems result in efficient uptake and use of available nutrients. This category includes
managing and maintaining crop residue, composting, liming to maintaining soil pH,
reduced tillage, manuring, establishing diverse crop rotations, growing crop covers, etc.
5.4.1 Climatic Factors
Each crop has certain environmental requirements. To attain the highest yield
(potential yield), a crop must be grown in an environment that meets these require-
ments. The main climatic elements determinant to crop growth and yield include
temperature, solar radiation, and CO2 concentration.
5.4.1.1 Temperature
Each crop grows and develops well at a favorable range of air temperature. This
range is termed as optimum air temperature range. The temperature determines the
speed of respiration and the dark reaction. A high temperature combined with a low
intensity of sunlight means a high loss by respiration. A low temperature combined
with a high intensity of sunlight means high net assimilation.
5.4.1.2 Solar Radiation
Solar radiation (also called photosynthetic active radiation (PAR)) is the energy
source for green plant growth. The PAR powers the light reaction, which converts
carbon dioxide and water into glucose and molecular oxygen. When temperature,
moisture, carbon dioxide and nutrient levels are optimal, light intensity determines
maximum production level. The potential drymatter production for a specific
location under the prevailing light or solar radiation can be determined from the
mathematical formula, as described in Chap. 3 (Weather).
5.4.1.3 Carbon dioxide Levels
Atmospheric carbon dioxide is the sole carbon source for plants. About half of
all proteins in green leaves have the sole purpose of capturing carbon dioxide.
Although CO2 levels are constant under natural circumstances, CO2 fertilization is
238 5 Plant: A Machinery of Water Absorption

common in greenhouses and is known to increase yields by an average 24%. The C4
plants like maize and sorghum can achieve a higher yield at high solar radiation
intensities, because they prevent the leaking of captured carbon dioxide due to the
spatial separation of carbon dioxide capture and carbon dioxide use in the dark
reaction. This means that their photorespiration is almost zero. This advantage is
often offset by a higher maintenance respiration level.
5.4.2 Water and Nutrient Supply
5.4.2.1 Water Supply
Optimum soil-water supply (i.e., good irrigation practices) are critical to maintain a
good crop growth and facilitating effective uptake of nutrients. As the plants use
passive transport to transfer water and nutrients from their roots to the leaves, water
supply is essential to growth.
5.4.2.2 Nutrient Supply
For optimum growth and high-quality harvested products, supply of adequate plant
nutrients is essential. Nutrient supply has a twofold effect on plant growth. A
limitation in nutrient supply will limit biomass production. In some crops, several
nutrients influence the distribution of plant products in the plants. A nitrogen gift is
known to stimulate leaf growth and therefore can work adversely on the yield of
crops which are accumulating photosynthesis products in storage organs, such as
ripening cereals or fruit-bearing fruit trees.
5.5 Crop Growth Parameters
5.5.1 Leaf Area Index
Leaf area index (LAI) is defined as the ratio of leaf area to land area under the leaf, i.e.,
LAI ¼ leaf area
land area under the leaf
LAI is a function of growth stage (or time of the life cycle) and type of the crop.
It is also influenced by the available heat energy and management factors. For field
crops, the LAI reaches its maximum value at the end of vegetative stage (or about
50% of its life span). The general trend is mostly like the graph given below
(Fig. 5.5):
5.5 Crop Growth Parameters 239

Green leaf area is the effective leaf area which contributes in photosynthesis
process through interception of solar radiation. For the same type of crop, the LAI
may vary depending on the varietal (i.e. genetical) difference.
The more the LAI, the more the carbohydrate assimilation.
5.5.1.1 Determination of LAI
Leaf area index is determined from the destructive plant samples. Leaves are
separated from the stems and the leaves are weighed. Samples of the leaves are
run through a leaf area machine (e.g., Portable Area Meter, Model L1-3000) to
determine the area of leaves. Then, leaf area index is computed using the above
formula.
Instead of determining the leaf area of the whole sample, sub-samples of the
leaves can be used. In such case, the sub-sample is weighed and the sub-sample is
run through a leaf area machine to determine the area of leaves. The leaf area of the
whole sample is determined based on the leaf area per unit fresh weight of the sub-
sample and the leaf biomass per unit sample area. That is,
Leaf area of the whole sample ¼ ðleaf area of the sub-sample=
fresh weight of the sub-sample� fresh weight of whole sample
Then, leaf area index is computed.
0
1
2
3
4
0 10 20 30 40 50 60 70 80 90 100
Leaf
are
a in
dex
% growing season
LAI
Fig. 5.5 Leaf area index (LAI) as a function of percent growth period
240 5 Plant: A Machinery of Water Absorption

It is not wise to take the dry (oven-dry, at about 70–80�C) weight of leaf sub-sample to determine the leaf area of the whole sample because the dry weight of the
leaf is very low, and there are possibilities of making errors while taking the dry
weight and maintaining uniformity of dryness.
Specific leaf area (SLA)
It is the leaf area per unit of dry mass. That is,
SLA ¼ A=M
Where
A ¼ area of leaf
M ¼ mass of the leaf
5.5.2 Growth Rate and Relative Growth Rate
Growth is the process by which a plant increases in the number and size of
leaves and stems. It can be said as an irreversible change in the size of a cell,
organ, or whole organism. The Growth rate (GR) refers to development per unit
time, i.e.,
GR ¼ L
Tðm per secondÞ:
Under given normal conditions, different plants show different rate of growth.
This is due to their genetic potentialities. Growth rate also varies with factors in the
environment.
Relative Growth Rate
Relative growth rate (RGR) is computed from two sampling event as follows:
RGR ¼ ðlogeW2 � logeW1Þ=ðt2 � t1Þ; (5.2)
where
W2 is thefresh weight of plant sample of particular (or unit) area at time t2,W1 is the fresh weight of plant sample of the same area at time t1, and t2 – t1 is the
time interval in days between those harvests.
The RGR represents that growth obtained relative to the amount of tissue at
present, expressed as a daily average. This is a reflection of growth potential under
the conditions imposed. The RGR may also be expressed as a dry-weight basis.
5.5 Crop Growth Parameters 241

In that case, the harvested plants are to be dried at 70�C until constant weight is
achieved.
5.5.3 Root Study
Shoot and root development are closely linked and coordinated as growth proceeds.
If the environment is constant, a logarithmically linear relationship usually exists
between the weight of shoots and roots during vegetative growth. Modeling of
water and nutrient uptake during crop growth requires quantitative information on
root development. Besides, to quantify the effect of fertilizer and/or irrigation on
growth and yield, root information is needed because; root is the organ of the plant
which takes up necessary nutrient and water for the plant.
5.5.3.1 Root Length Density
Root length density (RLD) is defined as the root length per unit soil volume, i.e., the
ratio of total root length under a certain volume of soil to the volume of soil under
consideration:
RLD ¼ total root length
total volume of soil(5.3)
RLD is generally expressed in cm/cm3 of soil.
5.5.3.2 Method of Root Sampling
Various methods are available for root sampling and measurement. Root sampling
methods include auger hole method, pit sampling method, etc.
Auger Hole Method
The auger hole method is simple compared to other methods to determine root
distribution and root density. Auger size may range from 5 to 10 cm (inner
diameter). But sampling with 10 cm provides a good estimate for shallow-rooted
crop like wheat (Kumar et al. 1993). The position of sampling should be between on
the row and midway between rows. A large number of samples are required to
obtain a reasonable accurate estimate of average root density.
Root sampling is carried out at different time of growth period (e.g., 45, 60, and
85 days after sowing (DAS)).
242 5 Plant: A Machinery of Water Absorption

Pit Sampling/Soil Monolith Sampling
Pits are dug covering row and half-way between rows in both sides of a row (as
shown in Fig. 5.6). Pits can be dug easily with small shabowls and locally available
tools. An ideal pit size depends on the plant type and the depth of sampling depends
on plant type and period of growing season. For wheat, with 20 cm line spacing,
an ideal size of pit may be at 30 cm � 20 cm � 15 cm, where 30 cm is along row,
20 cm is normal to row, and 15 cm deep. Separate sample for each 15-cm incremental
depth may be collected to observe the distribution pattern as and when necessary
(depending on the development stage of the crop).
Processing of the Sample and Preparing the Roots for Measurement
The soil from each core or pit section may be cleaned by placing on a 32-mesh
screen and washing in a water channel providing gentle pulse by wrist action. The
roots can also be cleaned by first diluting the soil sample (containing root) in a large
bucket and then passing the solution through a mesh (or any other locally available
fine net or net-like cloth bag). The main problem of washing roots through sieves is
that the fine root segments are lost through the sieve. The most appropriate sieve
size depends on the plant species and soil texture. Ideally, the size should be such
that it allows the soil particles to pass through easily and retain the roots, or there
should be some compromise within the permissible limit. Kumar et al. (1993)
reported that washing wheat roots in cloth bags yielded significantly more roots
than washing in sieves of 16 or 32 meshes. After passing through mesh or net, the
roots are separated from the underground step, stones, grass roots, and rhizome
parts. The living roots are kept frozen till their lengths are measured.
Root samplingarea 30 cm
20 cm
20 cm
Plant row
Fig. 5.6 Schematic view of
the root sampling area
5.5 Crop Growth Parameters 243
5.5.3.3 Measurement of Roots
Length Measurement
Lengths of root can be measured following different techniques given below:
By millimeter paper: In this method, the washed roots are positioned in series in
a millimeter paper in which the scales are written from zero point. The lengths are
summed to obtain the total length.
Line intercept technique: The length of the roots can also be measured by the
line-intercept technique of Newman (1966).
Taking Weight of Roots
To express the root density in weight basis, the roots are dried in an oven at 70�C for
48 h and weighed. It is expressed as gm/cm3 (gm root per cubic centimeter of soil).
Root to Shoot Weight Ratio
Ratio of root to shoot dry weight is computed as the ratio of root weight to the total
weight of leaves and stems. The ratio can be determined on fresh weight basis or dry
weight basis, as required.
5.5.3.4 Increasing Available Water Supply for Plant Root
Crop drymatter yield increases approximately linearly with total evapotranspiration
and nutrient availability. This suggests that increasing the quantity of water avail-
able for transpiration will increase yield if water supply is limiting yield. Increasing
the abstracting area by expansion of root will also increase opportunity to take up
nutrients.
One method of increasing the supply of available water is through increasing the
total soil volume occupied by the plant’s root. This can be achieved by either a
greater lateral spread or a greater rooting depth. Optimum tillage and deep tillage
can facilitate for such type of expansion. The second method for increasing avail-
able water supply is through increasing root length density in soil zone from where
water is lost by evaporation or deep percolation. Root length density may increase
as a result of increased initiation of secondary roots and increased elongation rate of
secondary roots. Third method for increasing total available water is through
increasing the root water uptake rate in soil zone where water is lost rapidly. Soil
management techniques that increase soil water content (such as addition of organic
matter, mulching) may increase water uptake. The Fourth method for increasing
total available water is through reducing axial resistance to water flow in the root
xylem. This reduction in resistance permits more water to flow for photosynthesis.
244 5 Plant: A Machinery of Water Absorption

5.6 Dry-Matter Production in Plant and Its Partitioning
Usually only a fraction of the total plant biomass consists of useful products, e.g., the
seeds in pulses and cereals, the tubers in potato and cassava, the leaves in sisal and
spinach, etc. The yield of usable plant portions will increase when the plant allocates
more assimilates to these parts. For example, the high-yielding varieties of wheat
and rice allocate about 40–50% of their biomass into wheat and rice grains, while the
traditional varieties achieve only 20–30%, thus doubling the effective yield.
De Wit (1958) originally pointed out that drymatter accumulation of a plant is
related to transpiration. This was the basis of simple and relatively complex models of
drymatter production by crops and pastures in water-limiting condition. Portioning of
drymatter into different parts of the plant (shoot, root, fruit or grain) depends on the
percentage growing period, limitations of other essential resources (water or nutrient),
and any other adverse condition or stress (e.g., salinity stress, heat, or cold stress).
5.6.1 Determination of Total Biomass or Drymatter
Total above-ground drymatter can be determined by harvesting the stover at the
ground surface and taking fresh weight. By drying 1 kg sample (of each category or
treatment) at 85�C for constant weight (�48 h), the total fresh weight can be
converted to dry weight.
For total biomass, root weight should also be included.
5.6.2 Indices of Drymatter Partitioning
5.6.2.1 Root–Shoot ratio
It is the ratio of root weight to the weight of total above-ground matter or shoot.
That is,
Root� Shoot ratio ¼ wt: of root=wt: of shoot
¼ grain yield=total aboveground biomass
The weight can be of fresh weight or dry weight. The ratio indicates the percent
distribution of total biomass into root and shoot.
5.6.2.2 Harvest Index
Harvest index (HI) is defined as the ratio of grain or seed yield to the sum of grain
and straw yield, i.e.,
5.6 Dry-Matter Production in Plant and Its Partitioning 245

HI ¼ grain yield= grain yieldþ straw yieldð Þ:
Harvest index indicates the proportion of grain yield to total aboveground
drymatter. That is, it actually indicates the percentage of aboveground drymatter
accumulated to grain. Its value for field crops normally ranges between 0.25 and
0.36, depending upon the crop and species.
5.6.2.3 Harvest Ratio
The harvest ratio (HR) is defined as the ratio of grain or seed yield to the straw
yield, i.e.,
HR ¼ grain yield
straw yield:
Harvest ratio indicates the proportion of grain weight to straw weight. Usually,
its value ranges from 0.45 to 0.55 for the high-yielding modern crop varieties. The
higher value of HR indicates the higher proportional accumulation of assimilates to
grain, which indirectly indicates higher efficiency for resource utilization. Although
harvest index and harvest ratio represent similar meaning, but the harvest ratio
gives a clear picture of assimilate partitioning. Harvest ratio can be used as an
indicator for selecting cultivar in breeding program as well as in resource-limiting
condition. Cultivars having higher HR accompanied by higher or comparable yield,
may be selected for commercial production. In determining HI and HR, the grain
and straw yield must be adjusted to a certain (fixed) percentage of moisture content
(normally at 12% moisture for cereals). It can be done using the following equation
(Ali 2008):
Yadj ¼ Yi � ð100þMtÞð100þMiÞ (5.4)
where Mi is the initial moisture content, Yi is the initial yield (at Mi moisture
content), Mt is the targeted moisture content (say, 12%), and Yadj is the adjusted
yield (at Mt% moisture content).
5.6.3 Assimilate Partitioning/Remobilizationof Prestored Carbon
Grain filling is the final stage of growth in cereals where fertilized ovaries develop
into caryopses. At this stage, about 40–50% of total biomass is deposited into the
grains. Delayed whole plant senescence, leading to poorly filled grains and unused
carbohydrate in straws, is a new problem increasingly recognized in rice and wheat
246 5 Plant: A Machinery of Water Absorption

production (Zhang et al. 1998). Slow grain filling may often be associated with
delayed whole plant senescence. Monocarpic plants such as rice and wheat need the
initiation of whole plant senescence so that stored carbohydrates in stems and leaf
sheaths can be remobilized and transferred to developing grains (Zhang and Yang
2004). Normally when these crops are grown in high-input system, pre-stored
carbohydrates contributes one-fourth to one-third to the final weight of grain.
5.6.4 Improving Assimilate Partitioning to Grain
In most crops (especially in cereals), we are interested to produce higher grain
yield, but not the straw yield. Harvest index has been shown as a variable factor in
crop production, especially in cases where whole plant senescence of cereals (e.g.,
rice and wheat) is unfavorably delayed. Such delayed senescence can delay the
remobilization of pre-stored carbon reserves in the straw and results in lower
harvest index. Controlled soil drying can enhance whole plant senescence and,
therefore, improves the remobilization of pre-stored carbon reserve. Gains from the
improved harvest index may outweigh any possible biomass loss due to shortened
photosynthetic period in grain filling. Yang et al. (2001) noted that the early
senescence induced by water deficit does not necessarily reduce grain yield even
when plants are grown under normal nitrogen conditions. Zhang et al. (1998) found
with field-grown wheat that a soil drying during the grain-filling period enhance
early senescence. They found that while the grain filling was shortened by 10 days
(from 41 to 31 days) in unwatered (during this period) plots, a faster rate of grain
filling and enhanced mobilization of stored carbohydrate minimized the effect
on yield. Zhang and Yang (2004) showed that water productivity (WP) may be
enhanced through an improved harvest index (HI). Ali (2008) found highest harvest
index, harvest ratio and irrigation water productivity with drying at grain filling
stage.
5.7 Plant Water Relations
5.7.1 Theoretical Perspectives
Water is considered by most plant biologists and forest scientists to be the single
most important environmental factor influencing plant growth and distribution.
Water plays an important role in plants. It maintains the turgor pressure in the
cells, and it cools the leaves as it evaporates. Water is the largest component of
plants. Actively growing tissue (leaves, root tips) can be 80–90% water. Woody
parts of trees are a much lower percent of water ranging between 45 and 60% water
by weight. Water serves as the solvent which transports minerals and dissolved
5.7 Plant Water Relations 247

carbohydrates throughout the plant. Because of its unique chemical properties,
water is an excellent overall solvent and is therefore able to dissolve many chemical
substances. Water is also a reactant in many chemical reactions in the plant.
Probably the most significant of these is photosynthesis, where water serves as
the source of electrons. The oxygen we breathe every day is a result of this reaction
in photosynthesis. Another important function of water is that it maintains turgidity
(or pressure) in plant tissue. This “turgor pressure” is necessary for cell enlarge-
ment, growth and even maintenance of form in some plants. One of the first visible
signs of a lack of water is wilted (or “deflated”) leaves.
Water movement from cell to cell in plants occurs along gradients of water
potential. Water potential is actually a measure of the “free energy” of water. Water
moves from regions of high to low free energy or from regions of high to low
water potential. For the sake of convenience, plant biologists have defined pure
water as having a water potential of zero.
Water relations data of plants in different environments facilitates understanding
about how plants “adjust or adapt” in order to maintain an appropriate water status
that is necessary for survival and growth. Physiological interpretation of water
relations data provides insight about the mechanistic processes that allow plants to
maintain appropriate water status. Specifically, water and osmotic potentials, tur-
gor, relative water content, and transpiration of plants without or under varying
water stress conditions are to be determined and interpreted.
Studies on diurnal and seasonal plant–water relations in crop provide an under-
standing of the response of the crop and adaptation to moisture stress by regulating
water vapor loss and internal water status. Relationships between the indices of
plant–water relation may vary with the following:
l Speciesl Stage of developmentl Time of the dayl Evaporative demandl Plant-water history
5.7.2 Indices of Plant–Water Relations
The commonly used indices for plant-water status are:
l Water content or water retention capacityl Relative water contentl Relative saturation deficitl Leaf water potentiall Osmotic potential
Typically, water potential is expressed in units of pressure, with the most
common units being bars or mega-pascals (MPa). One mega-pascals is equal to
10 bars.
248 5 Plant: A Machinery of Water Absorption

5.7.3 Water Potential in Plant
5.7.3.1 Components of Water Potential
The potential value can be positive or negative. Water potential in plant cells has
several components. The most important are osmotic potential and turgor (pressure)
potential. These two potentials sum up and together equal total water potential, i.e.,
Total water potential of a plant : ct ¼ cos þ cp; (5.5)
where ct is the total water potential,cos is the osmotic potential, and cp is the turgor
or pressure potential.
5.7.3.2 Osmotic Potential
Osmotic potential is due to the presence of dissolved solutes (e.g., sugars, salts) in
the water. When a solute is dissolved in water it lowers the osmotic potential. Since
pure water (nothing dissolved in it) has a water potential of zero, adding salt or
some other solute will result in a negative water potential. An osmometer demon-
strates this principle very well.
5.7.3.3 Turgor Potential
Turgor (or pressure) potential results when pressure is applied to the water. For
example, if a tank of water is pressurized, its water potential can be raised above
zero. Living plant cells typically have positive turgor potential, and osmotic and
turgor potential often work to balance each other. When you see wilted leaves they
have zero turgor potential. In the dead xylem of trees, water often has a negative
turgor pressure and we say it is “under tension”.
Water potential varied diurnally, with minimum values around noon, and
increasing in the late afternoon and evening to maximum values before dawn.
5.7.3.4 Factors Affecting Plant Water Potential
Factors that determine plant water potential are:
1. Amount of solutes: Increasing concentrations will lower the free energy (water
potential); termed osmotic potential (cs).
2. Turgor pressure (cp) in plant cell: Positive pressure inside plant cell increases
free energy.
5.7 Plant Water Relations 249

5.7.3.5 Adjustment of Plant–Water Relations Components
To maintain water uptake from the soil, plants must maintain a lower water
potential, but minimize water loss. Plant water potential can be altered by the
following:
1) Osmotic adjustment – increasing osmotic potential as soils dry
2) Changes in cell wall elasticity – determines how much turgor pressure will
change as cell water content changes.
Different techniques are used to determine plant–water relations parameters
that are indicative of plant water status. Plant–water relation parameters vary sub-
stantially during the day and because of water stress (drought, dehydration,
osmotic, etc.).
5.7.4 Leaf Water Potential
5.7.4.1 Total Leaf Water Potential
Similar to water potential of other plant cells, leaf water potential (c) is
commonly resolved into two components, the mean pressure potential or turgor
(cp) and the mean solute potential or osmotic potential of the vacuolar con-
tents (cos):
c ¼ cp þ cos
c may be measured by a wide range of methods. Psychrometric techniques permit
non-destructive measurement of c, by contrast both cos and cp have usually been
measured destructively.
Osmotic pressure (or osmotic potential) is a measure of the attraction of solutes
for water. It is defined as the hydrostatic pressure that must be applied to a solution
to prevent water flowing into it when it is separated from pure water by a membrane
that allows the passage of water. It is a colligated property, that is, its value depends
simply on the number of solute molecules present.
Accurate measurements of leaf water potential (c) in the field are essential for
studying crop responses to water stress. Water is normally under tension (negative
pressure) in the stems of trees and to get water out great pressure needs to be
applied. A tool called a “pressure chamber” or “pressure bomb” is often used by
plant scientist to measure this tension. The Scholander pressure chamber (also
referred to as Plant Water Console) (Fig. 5.7) is the most widely used apparatus
for c measurement, although thermocouple psychrometers are generally accepted
as the standard.
250 5 Plant: A Machinery of Water Absorption

Procedure for Estimation of Total Leaf Water Potential
Themeasurement of water potential of leaf xylem ismade between 11:30 and 14:00 h.
Single leaflets’ are enclosed in a plastic bag immediately prior to detachment
from the plant in order to minimize subsequent evaporative losses. A single leaf
(leafy shoot or needle fascicle) is sealed in the pressure chamber with the cut
surface protruding through a rubber stopper visible to the experimenter. Pressure
is applied to the shoot from a tank of compressed air (or nitrogen) until xylem sap
just appears at the cut ends of the xylem elements. At that instant, the hydrostatic
pressure inside the xylem elements is exactly balanced by the applied external
pressure, and the chamber pressure is recorded. The amount of pressure that must
be applied to force water out of the leaf cells into the xylem is regarded as equal
(and opposite) to the tension originally existing in the xylem at the time the leaf
was separated from the plant. This value is an estimate of the water potential,
expressed in negative (�) units by convention.
The leaf-water potential of water-stressed plant may develop as high as �25
bars. Some stress corresponding to leaf-water potential of �5 bars in wheat crop is
not detrimental for yield.
5.7.4.2 Leaf Osmotic Potential
Leaf osmotic potential can be measured on expressed sap by freezing point depres-
sion osmometry using osmometer or dew point hygrometer. Leaflets are detached
and rapidly frozen with liquid nitrogen. About 24 h later, the samples are thawed at
room temperature for half an hour before the samples are crushed to provide several
millimeters of sap. The sap is placed in osmometer with a plastic syringe and the
reading is taken.
Fig. 5.7 View of a plant
water console (Courtesy:Soilmoisture Co.)
5.7 Plant Water Relations 251

5.7.4.3 Turgor Pressure
Turgor pressure (cp) is obtained as the difference between leaf water potential (cL)
and leaf osmotic potential (cs) determined with separate leaflets from the same leaf.
5.7.5 Water Content/Water Retention
The water content/retention of a leaf (WC),
WC %ð Þ ¼ 100� fresh wt:� dry wt:
fresh wt:: (5.6)
The drought resistant cultivars showed greater water retaining ability than the
drought susceptible cultivars.
The measurement of water retention is simple and rapid, as it requires only
weighing each leaf sample twice. If one is dealing with lines that vary considerably
in their water retention ability (under a specific soil water or drought condition), no
special care is required to control the drying condition if all the samples are allowed
to dry on the same bench or setting condition.
5.7.6 Relative Water Content/Relative Turgidity
Water content of a plant part is defined as the amount of water contained per unit of
dry weight of that part.
Relative water content (RWC) is defined as:
RWC ¼ Fresh wt:� dry wt:
Turgid fresh wt:� dry wt:(5.7)
The value is often expressed in percentage form.
There is evidence that, for some physiological processes, relative water content
may be a more relevant measure of stress than c, though the later may be measured
more easily.
5.7.6.1 Procedure for the Measurement of Relative Water Content
(a) Measure the fresh weight and record it. The leaves are weighed immediately
after collection (in a digital balance, preferably having 3–4 digit after decimal
point) to obtain fresh weight. For accuracy, measurement in the field is pre-
ferred. If the facility is not available, insert the leaf in the polythene packet just
after detaching from the plant, and put in a closed box (such as in an ice box)
and carry to the lab for measurement.
252 5 Plant: A Machinery of Water Absorption

(b) Float the leaf sample on water in a petri-dish overnight, or put the cutting edge
of the leaf on water in a cylinder, close the cylinder to eliminate evaporation
and place it in dark place for about 6–10 h.
(c) Then remove the leaf from the water, sweep the water from the leaf with dry
tissue paper gently (do not damage the leaf), and quickly measure its weight
on a balance. Next, place the leaf in a labeled paper bag and set it on the tray.
(d) To obtain the dry weight, place the samples (with leaf ID) in a 70�C oven to
completely dry (for about 24–48 h).
(e) Take weight of the samples immediately after taking out of the oven (if it is
delayed to take weight, the leaves can absorb water from the surrounding
moist air).
(f) Calculate the RWC using the formula given above.
5.7.7 Relative Saturation Deficit
Relative saturation deficit (RSD):
RSD ¼ 100� ðsaturated wt:� fresh wt:Þ=saturated wt: (5.8)
5.7.7.1 Determination of RSD
The youngest, fully expanded leaf is collected. The fresh and saturated weight
of the leaf can be obtained following the procedure as of Relative Water Content.Then the RSD is calculated from the above formula.
The RSD increases with a corresponding decrease in water content.
5.7.8 Relation Between Leaf Water Potential and RelativeWater Content
Relation between leaf water potential and relative water content can be determined
using following procedure. After the saturation weight of the leaf is obtained, the
leaf is allowed to dry under ambient conditions in the laboratory. At periodic
intervals (1/2–1 h interval for about 12 h), leaf water potential is measured soon
after determining fresh weight. After the end of measurements, the leaf is dried at
80�C and weighed. The relationship can be expressed in two ways:
(a) Leaf water potential vs. relative water content, also termed as pressure–volume
curve
(b) Reciprocal of leaf water potential (LWP) vs. relative water content (RWC)
5.7 Plant Water Relations 253

5.7.8.1 Leaf Water Potential vs. Relative Water Content
The curve showing the relationship between the water potential of an organism, in
general the leaf, and its relative water content, is termed as the pressure–volume
curve. The graphical analysis of the curve yields several water parameters.
The pressure volume curve typically has two parts. In the first part, turgor (ct)
and osmotic potential (co) are combined (Fig. 5.8). As the turgor potential falls to
zero with decreased leaf water potential, the relationship becomes linear and
represents only the osmotic potential at that relative water content. Extrapolation
yields an estimate of the osmotic potential for maximum relative water content.
From the extrapolated values of the osmotic and the observed values of the leaf
water potential (cl), the turgor potential (ct) can be calculated as follows:
ct ¼ cl � co
5.8 Plant Biochemical and Physiological Aspects
5.8.1 Plant Biochemical Aspects
5.8.1.1 Photosynthesis
Photosynthesis is a complicated biochemical process. Plants use light as their
energy source. The general equation for photosynthesis is:
CO2 þ H2Oþ light ! ðCH2OÞn þ O2 (5.9)
0
0.5
1
1.5
2
2.5
1 0.98 0.96 0.75 0.65 0.55
Leaf
wat
er p
oten
tial,
-MP
a
Relative water content
ψt
ψ0
ψl
Fig. 5.8 Pressure volume curve
254 5 Plant: A Machinery of Water Absorption

Leaves are perfect solar collectors. These organs are broad and flat to allow for
efficient light harvest. The leaves are broad to maximize surface area for light
harvest and they are thin since light cannot penetrate too deeply into the leaf (the
amount of light decreases exponentially with distance). Within the thin leaf, most
chloroplasts are found in the upper layer of cells, the palisade layer, which is the
tissue layer just beneath the upper epidermis.
Photosynthesis requires the following:
– Efficient light harvesting
– An apparatus for gas exchange
– A water supply
– Thin leaves, required for light absorption and gas exchange, need support
– A mechanism to transport end products throughout the plant
5.8.1.2 Leaf Chlorophyll and Sugar Content
Chlorophyll content can be determined from the leaf samples following the method
of Arnon (1975) and Coombs et al. (1985). Reducing sugar can be determined
following Somogyi–Nelsen method (Nelsen 1944; Somogyi 1952).
5.8.2 Physiological Aspects
5.8.2.1 Transpiration Rate
Transpiration can be defined as the loss of water from plants in the form of vapor.
A plant of vigorous growth transpires heavily. The velocity of solute transport
increases and falls with the rate of transpiration. Transpiration causes evaporative
cooling of the leaf.
Control of Transpiration
The opening and closing of stomata is the principal factor controlling transpiration
rate. The closure of stomata is influenced by light intensity, temperature, and
atmospheric CO2 concentration. Stomata closure is also influenced by tissue hydra-
tion, and more specifically, by the turgidity of the paired guard cells. Increasing
turgidity causes these cells to bulge outwards, while low turgidity causes them to
collapse against each other, thus shutting off the diffusive outlet for the water vapor.
The turgidity of the cell is governed by the availability of water to plant, which in
turn governed by the soil-water availability or soil-water content. In essence, the
transpiration rate is controlled by the following:
l Light intensityl Temperature
5.8 Plant Biochemical and Physiological Aspects 255

l Atmospheric vapor pressure deficit (at plant canopy level)l Atmospheric CO2 concentrationl Soil water availability (under saline condition) or soil water content (under
drought condition)
Measurement of Transpiration Rate
Transpiration is commonly measured by (a) gravimetric methods, (b) measuring
humidity increase in a plastic cuvette that completely encloses the leaf or stem, or
(c) estimating the velocity of sap flow.
Transpiration Estimates by Gravimetric Method
Transpiration estimates by a gravimetric approach involves measuring plant weight
at several intervals of time and then estimating the mass of water loss per unit leaf
area per unit time. Transpiration rates is to be recorded at 15-min intervals through-
out the day (completion of last period).
Procedure:
1. Take a waterproof container of plant. Carefully wrap the container in a plastic
bag and secure with a rubber band so the measurement does not reflect any water
loss from the soil surface, i.e., prevent evaporation. Care should be taken so that
no injury occurs in the stem during the process, and note that plants will require a
period to “adapt” to the wrapping procedure.
2. Place the container in open place.
3. Take weight of the container after several hours interval.
4. Obtain a water loss rate for each plant (g H2O min�1) from the difference in
weight.
5. Measure the total leaf surface area for each plant separately using a Leaf Area
Meter.
6. Compute a transpiration rate (mmol H2O m�2 s�1) by dividing the weight loss to
the total leaf area.
Necessary conversion factors:
1g H2O ¼ 55:55 mmol; 1 m2 ¼ 10;000 cm2; 1 h ¼ 3;600 s
Data sheet for determination of transpiration rate by the gravimetric method for
each plant of each treatment
Treatment/
plant
Water loss
rate (g min�1)
Water loss rate
(mmol H2O s�1)
Leaf area
(m2)
Transpiration rate
(mmol H2O m�2 s�1)
Plant 1
256 5 Plant: A Machinery of Water Absorption

5.8.2.2 Respiration
Respiration in plants is essential to provide metabolic energy and carbon skeletons
for growth and development, and an essential component of a plant’s carbon
budget. It consumes about 25–30% of all the carbohydrates produced in photosyn-
thesis. Recent study showed that photo-respiration enables the plant to take inor-
ganic nitrogen in the form of nitrate and convert it into a form that is useful for plant
growth (David 2010).
5.9 Water and Nutrient Uptake
5.9.1 Water Uptake Theory
The issue of water flow through the root zone of field crops represents a complex
problem requiring knowledge of a large spectrum of phenomena from various
disciplines. Within the state of the art, two theories of water absorption are
available:
l Active absorptionl Passive absorption
5.9.1.1 Active Absorption
Active absorption is operating in slowly transpiring plant. Under favorable condi-
tions, root systems function as osmometers. According to this theory, accumulation
of salt in the root xylem sap lowers the water potential below that in the soil. The
resulting inward diffusion of water produces the “root pressure,” which transmitted
to the evaporating surface of the leaf.
5.9.1.2 Passive Absorption
Passive absorption is operating when transpiration is rapid. According to this
theory, roots operate simply as passive absorbing surface. Evaporation of water
from the leaf cells (transpiration) lowers the cell water potential and causes
movement of water into them from the xylem, thus reducing the pressure in the
xylem sap. The reduction in pressure of the xylem sap is transmitted to the roots,
reducing the water potential and causing mass inflow of water from the soil, unless
of course the soil is at a more negative water potential. The resulting tension or
suction induces upward mass flow from roots to leaves through the tube like
capillary vessels of the xylem. These capillary vessels can maintain the cohesive
5.9 Water and Nutrient Uptake 257

continuity of liquid water columns even under a tension of many bars, as needed to
draw water from relatively dry soils and transport it to the top of the tree.
The roots therefore merely acts as passive absorbing surfaces through which
water is pulled by a gradient of water potential generated in the transpiring shoots.
This theory is also termed as “cohesion-tension theory.” As one water molecule
evaporates from the leaf, another is pulled in and so on down the stem. The drier the
soil, the more tension is required to pull water in from the soil. When the soil
is moist (water potential close to zero), water flows easily into the root and up
the stem.
5.9.2 Nutrient Uptake
The key-role of fertilizers and their judicious use in crop husbandry is well
understood, when one is familiar with the general facts about plant nutrition. It is
now known that at least 16 plant-food elements are necessary for the growth of
green plants. These plant-nutrients are called essential elements. In the absence of
any one of these essential elements, a plant fails to complete its life cycle, though
the disorder caused can, however, be corrected by the addition of that element.
These 16 elements are: Carbon (C), hydrogen (H), oxygen (O), nitrogen (N),
phosphorous (P), sulphur (S), potassium (K), calcium (Ca), magnesium (Mg),
iron (Fe), manganese (Mn), zinc (Zn), copper (Cu), molybdenum (Mb), boron
(B), and chlorine (Cl). Green plants obtain carbon from carbon-di-oxide from the
air; oxygen and hydrogen from water, whereas the remaining elements are taken
from the soil. Based on their relative amounts, normally found in plants, the plant
nutrients are termed as macronutrients, if large amounts are involved, and micro-
nutrients, if only traces are involved. The micronutrients essential for plant growth
are iron, manganese, copper, zinc, boron, molybdenum, and chlorine. All other
essential elements listed above are macronutrients.
As mentioned above, most of the plant nutrients, besides carbon, hydrogen, and
oxygen, originate from the soil. In the soil system, the nutrients are viewed by the
soil scientists as a triple-phased system of solid, liquid, and a gaseous phase. These
phases are physically separable. The plant nutrients are based in the solid phase and
their usual pathway to the plant system is through the surrounding liquid phase, the
soil solution and then to the plant root and plant cells. This pathway may be written
in the form of an equation as follows:
MðSolidÞ ! MðSolutionÞ ! MðPlant rootÞ ! MðPlant topÞ
where “M” is the plant nutrient element in continual movement through the soil-
plant system.
The operation of the above system is dependent on the solar energy through
photosynthesis and metabolic activities. This is however, an oversimplified state-
ment for gaining a physical concept of the natural phenomenon, but one should bear
258 5 Plant: A Machinery of Water Absorption

in mind that there are many physical and physico-chemical processes influencing
the reactions in the pathway. The actual transfer in nature takes place through the
charged ions, the usual form in which plant-food elements occur in solutions (liquid
phase of the system). Plant roots take up plant-food elements from the soil in these
ionic forms. The positively charged ions are called “cations” which include potas-
sium (Kþ), Calcium (Caþþ), magnesium (Mgþþ), iron (Feþþþ), zinc (Znþþ), andso on. The negatively charged ions are called anions and the important plant
nutrients taken in this form include nitrogen (NO�3), phosphorous (H2PO
�4),
sulphur (SO�4), Chlorine (Cl), etc.
The process of nutrient uptake by plants refers to the transfer of the nutrient ions
across the soil root interfaces into the plant cell. The energy for the process is
provided by the metabolic activity of the plant and in its absence no absorption of
nutrients take place. Nutrient absorption involves the phenomenon of ion exchange.
The root surface, like soil, carries a negative charge, and exhibits cation-exchange
property. The most efficient absorption of the plant nutrients takes place on the
younger tissues of the roots, capable of growth and elongation.
In this respect, root-systems are known to vary from crop to crop. Hence their
feeding power differs. The extent and the spread of the effective root-system
determine the soil volume trapped in the feeding-zone of the crop plant. This is
indeed an important information in a given soil–plant system which helps us to
choose fertilizers and fertilizer-use practices. The nutrient absorption mechanisms
of the crop plants are fairly known now. There are three mechanisms in operation in
the soil–water–plant systems. They are as follows:
1. The contact exchange and root interception
2. The mass flow or convection
3. Diffusion
5.9.2.1 The Contact Exchange and Root Interception
In the case of contact exchange and root interception, the exchangeable nutrients
ions from the clay-humus colloids migrates directly to the root surface through
contact exchange when plant roots come into contact with the soil solids. Nutrient
absorption through this mechanism is, however, insignificant as most of the plant
nutrients occur in the soil solutions. Plant roots actually grow to come into contact
with about only 3% of the soil volume exploited by the root mass, and the nutrient
uptake through root interception is even still less.
5.9.2.2 Mass Flow or Convection
The second mechanism is mass flow or convection, which is considered to be the
important mode of nutrient uptake. This mechanism relates to nutrient mobility
with the movement of soil water toward the root surface where absorption through
5.9 Water and Nutrient Uptake 259

the roots takes place along with water. Some are called mobile nutrients. Others
which move only a few millimeters are called immobile nutrients. Nutrient ions
such as nitrate, chloride, and sulfate are not absorbed by the soil colloids and are
mainly in solution. Such nutrient ions are absorbed by the roots along with soil
water. The nutrient uptake through this mechanism is directly related to the amount
of water used by the plants (transpiration).
It may, however, be mentioned that the exchangeable nutrient cations and anions
other than nitrate, chloride, and sulfate, which are absorbed on soil colloids are in
equilibrium with the soil solution do not move freely with water when it is absorbed
by the plant roots. These considerations, therefore, bring out that there are large
differences in the transport and root absorption of various ion through the mecha-
nism of mass flow. Mass flow is, however, responsible for supplying the root with
much of the plant needs for nitrogen, calcium, and magnesium, when present in
high concentrations in the soil solution, but does not do so in the case of phospho-
rous or potassium. The nutrient uptake through mass flow is largely dependent on
the moisture status of the soil and is highly influenced by the soil physical properties
controlling the movement of soil water.
5.9.2.3 Diffusion
The third mechanism is diffusion. It is an important phenomenon by which ions in
the soil medium move from a point of higher concentration to a point of lower
concentration. In other words, the mechanism enables the movement of the nutri-
ents ion without the movement of water. The amount of nutrient-ion movement in
this case is dependent on the ion-concentration gradient and transport pathways
which, in turn, are highly influenced by the content of soil water. This mechanism is
predominant in supplying most of the phosphorous and potassium to plant roots. It
is important to note that the rhizosphere volume of soil in the immediate neighbor-
hood of the effective plant root receives plant nutrients continuously to be delivered
to the roots by diffusion. However, when the nutrient concentration builds up far
excess of the plant in the reverse direction. These are some of the choice of
fertilizers and fertilizer practices for practicing scientific agriculture.
5.10 Critical Growth Stages of Plant and Water Demand
for Whole Growth Period
5.10.1 Critical Growth Stages
All the growth stages of plants are not similar in their response to water deficit.
Critical stages are the growth stages when the plants are most sensitive to water
deficit or stress.
260 5 Plant: A Machinery of Water Absorption
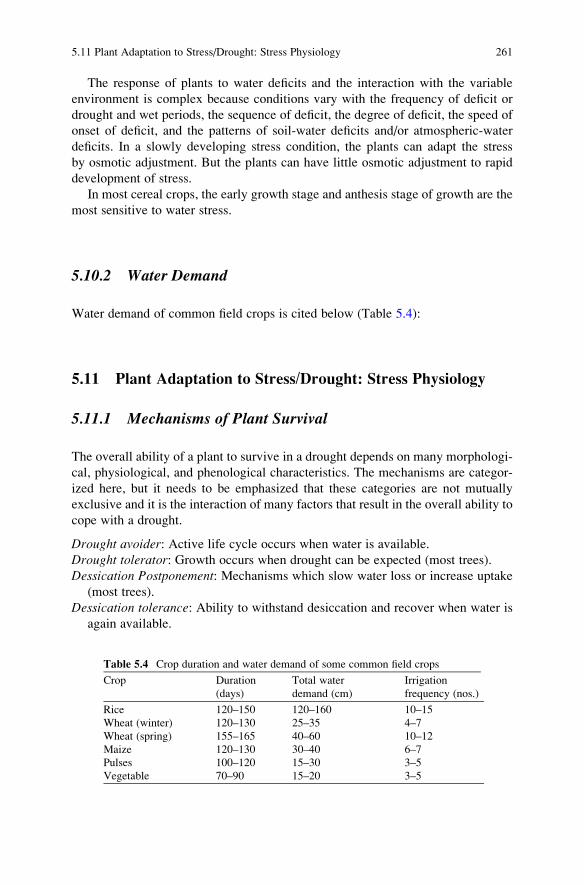
The response of plants to water deficits and the interaction with the variable
environment is complex because conditions vary with the frequency of deficit or
drought and wet periods, the sequence of deficit, the degree of deficit, the speed of
onset of deficit, and the patterns of soil-water deficits and/or atmospheric-water
deficits. In a slowly developing stress condition, the plants can adapt the stress
by osmotic adjustment. But the plants can have little osmotic adjustment to rapid
development of stress.
In most cereal crops, the early growth stage and anthesis stage of growth are the
most sensitive to water stress.
5.10.2 Water Demand
Water demand of common field crops is cited below (Table 5.4):
5.11 Plant Adaptation to Stress/Drought: Stress Physiology
5.11.1 Mechanisms of Plant Survival
The overall ability of a plant to survive in a drought depends on many morphologi-
cal, physiological, and phenological characteristics. The mechanisms are categor-
ized here, but it needs to be emphasized that these categories are not mutually
exclusive and it is the interaction of many factors that result in the overall ability to
cope with a drought.
Drought avoider: Active life cycle occurs when water is available.
Drought tolerator: Growth occurs when drought can be expected (most trees).
Dessication Postponement: Mechanisms which slow water loss or increase uptake
(most trees).
Dessication tolerance: Ability to withstand desiccation and recover when water is
again available.
Table 5.4 Crop duration and water demand of some common field crops
Crop Duration
(days)
Total water
demand (cm)
Irrigation
frequency (nos.)
Rice 120–150 120–160 10–15
Wheat (winter) 120–130 25–35 4–7
Wheat (spring) 155–165 40–60 10–12
Maize 120–130 30–40 6–7
Pulses 100–120 15–30 3–5
Vegetable 70–90 15–20 3–5
5.11 Plant Adaptation to Stress/Drought: Stress Physiology 261

5.11.1.1 Drought Avoider
Some plants can be classified as drought avoiders. These are plants that complete
their entire active life cycle during a period where drought does not occur. Typi-
cally these are plants that grow in dessert regions with well-defined rainy seasons.
During the rainy season the seeds sprout, the plant matures, flowers, and develops
new seed before the next often prolonged dry season. Increased stomatal resistance,
direct absorption of water by hairy leaves and leaf rolling also contribute to drought
avoidance. Drought semi-deciduous species avoid excessive water loss with a
reduction of their transpiring surface through partial fall of leaves during the dry
period.
5.11.1.2 Drought Tolerator
Most tree species fall into the category of drought tolerators. These are plants
which have portions of their active life cycles during periods when drought can
be expected. Drought tolerance can be broken down into two subcategories –
desiccation postponement and desiccation tolerance. Desiccation postponement
mechanisms prevent the loss of water out of the plant or increase the rate of water
uptake into the plant, in this way they postpone desiccation during a drought.
Many tree species utilize avoidance mechanisms. These mechanisms might
involve:
1. Deep, wide spreading root systems.
2. Rapid stomatal closure during the onset of drought.
3. Smaller leaf size.
4. Metabolic adaptations to avoid water loss.
5. Water storage in pant organs (e.g., trunk) and in extreme cases.
6. Leaf abscission to prevent further water loss. All of these mechanisms can occur
as adaptations and many acclimations.
5.11.1.3 Desiccation Tolerance
Desiccation tolerance is the ability of plants to desiccate but still survive. Most tree
species do not do this well. If leaves and other living tissues actually desiccate, they
typically become damaged or even killed. However, some plants such as grasses
and mosses can become severely desiccated and upon rehydration resume growth.
Tree species, however, will often osmotically adjust in response to a drought.
Osmotic adjustment is an acclimation where the plant lowers its osmotic potential
in response to a drought and in this way maintain turgor despite a lower water
potential. In a way the plant is desiccating as indicated by the lower water potential
but at the same time it maintains its turgor.
262 5 Plant: A Machinery of Water Absorption

5.11.1.4 Dehydration Tolerance
The improved dehydration tolerance of the summer leaves are attributed to posses-
sion of physiological and/or biophysical adaptations to water stress, which are
reflected in lower osmotic potential at full turgor and osmotic potential at turgor
loss point.
5.11.2 Drought Tolerance Mechanism
Drought is a meteorological event which can be defined as a period without rainfall
of sufficient duration that plant growth is impacted negatively. Most plants, and
particularly tree species since they are so long-lived, are exposed to drought during
their lifetime. In order to minimize the impact, and during severe drought, survive,
plants must have mechanisms in place to cope with the drought.
At this point we should differentiate between the terms adaptation and acclima-tion. Some plants are better adapted to cope with a drought. Others aren’t very
drought hardy but they can be acclimated to perform better. Adaptations are
characteristics which are heritable or passed on from generation to generation.
They are genetically based and the parent will pass on the adaptation to their
offspring. An example of this could be the potential of a particular species or
genotype to produce a deep and wide-spreading root system. Regardless of where
the tree is planted it will produce a deep and wide-spreading root system.
An acclimation on the other hand is a modification of a characteristic in response
to the environment. An example of this is the ability of a species to change the
morphology of its root system in response to the environment. The root system is
deep and wide spreading when the tree is planted on a dry site, but shallow when
planted on a wet site.
5.11.2.1 Adaptive Response
There are many different ways of adaptation to drought. These are concerned with
long-term changes in morphology and allocation to root, and short-term changes in
physiological characteristics of leaves. Common adaptive responses of herbaceous
annuals to water stress include the following:
l Increasing osmotic potential of leaves/osmotic adjustmentl Increases in root densityl Deeper rootl Rapid development to escape droughtl Temporal leaf falll Thinner leaves (and their density and specific leaf mass are higher)
5.11 Plant Adaptation to Stress/Drought: Stress Physiology 263

5.11.2.2 Osmotic Adjustment
The term “osmotic adjustment” originated in the salinity literature to describe
a change in the osmotic pressure of leaves in parallel with that of the soil. An
increase in the osmotic pressure of leaves or roots, due mainly to salts, is
considered an “adjustment” to the increase in the salt concentration in the soil.
Osmotic adjustment is usually defined as an increase in osmotic pressure of cell
sap resulting from more solute molecules per cell rather than from a lower
cell volume. Osmotic adjustment has emerged as a unified concept in stress
hydrology. Many plants undergo osmotic adjustment (erroneously called “osmo-
regulation”) by accumulating ions and organic solutes when exposed to drought
or salt stress.
Osmotic adjustment plays a role in maintenance of a leaf water status favorable
for some growth in water-stressed leaves. Osmotic adjustment through active
accumulation of solutes as well as an increase of solute concentration through
reduced cell volume (elastic adjustment) can result in turgor maintenance. Due to
osmotic adjustment, the plants are able to maintain turgor potential at a similar level
for lower values of leaf water potential. Mild water stress (approximately soil water
potential of �5 bars) at critical growth stages of cereals, the plants could maintain
positive turgor almost at the level of plants suffering no soil water stress, through
osmotic adjustment.
Two types of osmotic adjustment may occur:
1. The first corresponds with the phenological development of the plant (agro-
nomic aspects).
2. The second is achieved by physiological adaptation to drought or salinity
(physiological aspects).
Physiological adjustments enable the plant in a saline or drought environment to
maintain the turgor potential at a similar level as under non-saline or non-drought
conditions. The agronomic consequences are that plants show a slight decrease in
evapotranspiration and yield due to salinity or water stress, which may be caused by
the decrease in leaf area and the maintenance of gaseous exchange under saline
conditions.
The degree of osmotic adjustment varies with:
l Cultivarl Age of the tissuel Rate and pattern of the development of stress
Greater osmotic adjustment is observed with slow, compared with more rapid
rates of stress development. Exposure to two periods of drought increases the
magnitude of the osmotic adjustment compared with that after one period of
drought. Field-grown crops show increased osmotic adjustment compared with
pot-grown seedlings.
264 5 Plant: A Machinery of Water Absorption

Chemicals in Osmotic Potential
Of the various solutes present in cell sap of mesophytes, potassium is a major
components of the osmotic potential and play an important role in osmotic regula-
tion of elongating cells, as well as specialized functions such as stomatal guard cells
and motor cells. Organic solutes such as sugars and amino acids are also major
components, with the relative contribution depending on cultural conditions. In
expanded leaves of wheat that ware subjected to water stress, changes in potassium,
sugar and amino acids (including proline) accounted for 90–100% of the changes in
the osmotic potential.
Determination of Osmotic Adjustment
Osmotic adjustment can be determined by the difference in osmotic potential at full
turgor between stress and non-stress plants, after re-hydrating the stress plants for
6 h in the light.
5.11.2.3 Other Reason/Mechanism for Plant Adaptation
Stress Preconditioning
The leaf water potential (cl) vs. relative water content (RWC) relationship is altered
as a result of stress preconditioning. Under water stressed situation, at a given cl,
stress preconditioned plants maintain a higher tissue water content than that of an
unconditioned plants. Furthermore, the capacity to maintain a relatively high water
content at a given cl value increases with the severity of stress preconditioning.
Transpiration in pre-stressed plants shows less sensitivity to the alteration of cl than
in the non-stressed plants.
5.11.3 Yield Estimation Under Drought Condition
Yield under drought (Yd) can be estimated as (adapted from Hiler and Clark 1971):
Yd ¼ Ypð1� SDÞ; (5.10)
where Yd is the yield under drought, Yp is the potential yield, and SD is the drought
sensitivity or drought susceptibility of the crop.
5.11 Plant Adaptation to Stress/Drought: Stress Physiology 265

Drought susceptibility should be determined experimentally as follows:
SDi ¼ Y � YiY
Where, Y is the yield from plots without any moisture stress, Yi is the yield with
moisture stress in stage i, SDi is drought sensitivity caused by stress during the
growing stage i.The model mostly used is the one proposed by Stewart and Hagan (1973):
Y ¼ Ym � Ym � Ky � ETD=ETm; (5.11)
In which Y is the crop yield; Ym is the maximum crop yield under the same con-
dition of soil texture, fertility, etc.; Ky is the crop coefficient; ETD is the cumulative
evapotranspiration deficit during the growth period, calculated as follows: ETD ¼ETm – ETa, in which ETmis the maximum evapotranspiration and ETa is the actual
evapotranspiration.
Stewart et al. (1977) proposed a model that takes into account the effect of
moisture stress during successive phenological stages. They used a different coeffi-
cient for each stage, according to the following equation:
Y
Ym¼
Ym
n¼1
1� kyn 1� ET
ETm
� �
n
� �(5.12)
where n is generic growth stage, and m is the number of growth stage considered,
and ky is the crop or yield response factor. The formula is based on the theory that,
considering all other factors of production at their optimum level, it is the water
scarcity factor (estimated as the ratio of actual to maximum evapotranspiration,
ET/ETm) that limit the final yield.
5.12 Plant Production Models
Various plant production models exist with varying levels of utility (cell, physiologi-
cal, individual plant, crop, geographical region, global) and of generality. A model
can be crop-specific or be more generally applicable. The United States Department
of Agriculture has sponsored a number of applicable crop growth models for various
major US crops, such as cotton, soybean, wheat and rice. Other widely-used models
are APSIM, Cropsyst, CERES, PLANTGRO, ORYZA2000, SUCROS (SWATR),
SUBSTOR, the FAO-sponsored CROPWAT, AGWATER, and the erosion-specific
model EPIC.
266 5 Plant: A Machinery of Water Absorption

5.12.1 APSIM
APSIM stands for “Agricultural Production Systems sIMulator.” The APSIM is a
modeling framework that provides capabilities to simulate cropping systems over
variable time periods using available meteorological data (Keating et al. 2003). The
framework provides a “plug-in-pull-out” facility allowing users to select modules
for modeling crop and their environments under a range of constraint conditions.
APSIM allow the coupling of models from separate research efforts. APSIM allows
the simulation of diverse crops and cropping systems targeting issues such as
nitrogen management, climate variability, land degradation, crop rotations, and
management alternatives.
5.12.2 CropSyst
CropSyst is a multi-year multi-crop daily time step simulation model (Stockle and
Nelson 1994). The model has been developed to serve as an analytical tool to study
the effect of cropping systems management on productivity and the environment.
The model simulates the soil-water budget, soil-plant nitrogen budget, crop canopy
and root growth, dry-matter production, yield, residue production and decomposition,
and erosion. Management options include cultivar selection, crop rotation (includ-
ing fallow year), irrigation, nitrogen fertilization, tillage operations, and residue
management.
5.12.3 Oryza2000
The ORYZA2000 rice growth model has been developed at the IRRI in cooperation
with Wageningen Agricultural University. This model, too, is programmed in
FORTRAN. The scope of this model is limited to rice, which is the main food
crop for Asia.
5.12.4 SUCROS
SUCROS is programmed in the Fortran computer programming language. The
model can and has been applied to a variety of weather regimes and crops. Because
the source code of Sucros is open source, the model is open to modifications of
users with FORTRAN programming experience. The official maintained version of
SUCROS comes into two flavors: SUCROS I, which has non-inhibited unlimited
5.12 Plant Production Models 267

crop growth (which means that only solar radiation and temperature determine
growth) and SUCROS II, in which crop growth is limited only by water shortage.
Relevant Journals
– Plant Physiology (Springer)
– Australian Journal of Plant Physiology
– Annual Revew of Plant Physiology
– Australian Journal of Biological Science
– New Phytology
– Journal of Experimental Botany
– Crop Science
– Field Crop Research
– American Journal of Botany
– Botanical Review
– Plant and Soil
– Physiology of Plant
– Botanical Gazette
– Faraday Society Discussion
– Planta
– Arid Zone Research
– Journal of Applied Ecology
– Science
– Indian Journal of Plant Physiology (now, Plant Physiology)
– Annals of Plant Physiology
– Advances in Plant Physiology
– Agronomy Journal
– Advances in Agronomy
Questions
1. Classify plants considering various aspects.
2. What are the most common growth stages of cereal crops?
3. Describe different numerical scales for growth stages of field crops.
4. Briefly discuss the growth and development of wheat plant.
5. Describe the equation expressing cereal yield as the product of yield compo-
nents.
6. What do you mean by critical growth of crop? Name the critical growth stages
of wheat plant.
7. What is thermal time for crop growth?
268 5 Plant: A Machinery of Water Absorption

8. What are the functions of root? Describe the growth and development of crop
root.
9. Briefly narrate the factors affecting root development and adaptation to stress
condition.
10. Discuss the norms and procedures of drymatter partitioning in plants.
11. What are the indicators of drymatter partitioning? Write the equation for
adjusting crop grain moisture to a particular level.
12. How the assimilate partitioning to grain can be improved?
13. Write short note on: LAI, SLA, RGR, RLD, growth rate.
14. Explain different methods of root sampling and rootmeasurement.
15. How the available water for plants can be increased?
16. Briefly discuss the different plant–water relation indicators.
17. What are the components of plant water potential? What are the factors
affecting plant water potential?
18. What is pressure–volume curve? Draw a sketch of pressure–volume curve.
19. What are the factors limiting transpiration in plant?
20. Briefly explain the available theories of plant water uptake.
21. What are the mechanisms of plant survival under stress condition?
22. How the yield is decreased under stress conditon?
23. Name some crop growth and yield model, and explain their utility in brief.
References
Ali MH (2008) Deficit irrigation for wheat cultivation under limited water supply condition.
Dissertation.com, Boca Raton, p 181
Ali MH, Hoque MR, Hassan AA, Khair MA (2007) Effects of deficit irrigation on wheat yield,
water productivity and economic return. Agric Water Manage 92:151–161
Arnon I (1975) Physiological principles of dry-land crop production. In. Gupta US (ed) Physio-
logical aspects of dry-land farming. Oxford & IBH, New Delhi, pp 3–145
Bhuiya MSU, Kamal AMA (1991) A study of growth phases and stages in Bangladesh. Bangladesh
J Crop Sci 2(1):55–63
Coombs J, Hall DO, Long SP, Scurlok JMO (1985) Techniques in bio-productivity and photosyn-
thesis, 2nd edn. Paragamon Int., Oxford, pp 223–234
David UC (2010) Plant respiration not just an evolutionary leftover. http://www.sacedaily.com/
news/life-04zzr.html Accessed 08 Jan 2010
de Wit CT (1958) Transpiration and crop yields. Agric. Res. Rep. 64.6, Pudoc, Wegeningen, p 88
Feekes W (1941) De Tarwe en haar milieu Vers (Wheat and its Environments). XVII Tech. Tarwe
Comm. Groningen, 560–561
Haun JR (1973) Visual quantification of wheat development. Agron J 65:116–119
Hiler EA, and Clark RN (1971) Stress day index to characterize effects of water stress on crop
yields. Trans ASAE 14:757–761
Keating BA, Carberry PS, Hammer GL, Probert ME, Robertson MJ, et al. (2003) An overview of
APSIM, a model designed for farming systems simulation. Europ J Agron 18:267–288
Kumar K, Prihar SS, Gari PR (1993) Augar sampling procedure to determine distribution of wheat
roots. Ind J Agril Sci 63(3):141–146
Large EC (1954) Growth stages in cereals- Illustration of the Feekes scale. Plant Pathol 3:128–129
References 269

Newman EI (1966) A method of estimating the total length of root in a sample. J Appl Ecol 3:
139–145
Nelson N (1944) A photometric adaptation of the Somogyi method for determination of lucose.
J Biol Chem 153:375–380
Somogyi H (1952) Notes on sugar determination. J Biol Chem 195:19–23
Stewart JI, Hagan EM (1973) Functions to predict effects of crop after deficit. J Irrig Drain Div,
ASCE, 99(IR4):429–439
Stewart JI, Hagen RM, Pruitt WO, Hanks RJ, Denilson RE, Franklin WT, Jackson EB (1977)
Optimizing crop production through control of water, salinity levels. Utah Water Research Lab
PRWG 151, Logan, Utah, 191 pp
Stockle CO, Nelson RL (1994) Cropsyt user’s manual (version 1.0). Biological Systems Engi-
neering, Dept., Washington State University, Pullman
Yang J, Zhang J, Wang Z, Zhu Q, Wang W (2001) Remobilization of carbon reserves in response
to water deficit during grain filling of rice. Field Crop Res 71:47–55
Zadoks JC, Chang TT, Konzak CF (1974) A decimal code for the growth stages of cereals. Weed
Res 14:415–421
Zhang J, Yang J (2004) Improving harvest index is an effective way to increase crop water use
efficiency. In: Proceedings of the 4th international crop science congress, on crop science for
diversified planet, Brisbane, September 2004
Zhang J, Sui X, Li B, Su B, Li J, Zhou D (1998) An improved water use efficiency for winter wheat
grown under reduced irrigation. Field Crop Res 59:91–98
270 5 Plant: A Machinery of Water Absorption