functionalised dextran nanoparticles for drug delivery to ... · functionalised dextran...
TRANSCRIPT
i
Functionalised dextran nanoparticles
for drug delivery to the brain
IBEGBU, Madu Daniel
March, 2015
A thesis submitted in partial fulfilment of the requirements for the award of the degree of
Doctor of Philosophy of the University of Portsmouth.
Biomaterials and Drug Delivery Research Group
School of Pharmacy and Biomedical Sciences
University of Portsmouth

Abstract
ii
Abstract
Towards the development of drug carriers that are capable of crossing the Blood Brain
Barrier, the techniques of emulsion polymerisation and nanoprecipitation have been
utilised to produce nanoparticulate carriers from a systematic series of alkylglyceryl
dextrans (of two different average molecular weights, 6 kDa and 100 kDa) that had been
functionalised with ethyl and butyl cyanoacrylates. Also, zero length grafting of polylactic
acid to butyl, octyl and hexadecylglyceryl dextrans has allowed the preparation of
polylactic acid-functionalised nanoparticles. All materials and derived nanoparticles have
been characterised by a combination of spectroscopic and analytical techniques. The
average size of nanoparticles has been found to be in the range 100-500 nm. Tagging or
loading of the nanoparticles with fluorophores or model drugs allowed the preliminary
investigation of their capability to act as controlled-release devices. The effects of an
esterase on the degradation of one such nanoparticulate carrier have been studied.
Testing against bend3 cells revealed that all materials display dose-dependent
cytotoxicity profiles, and allowed the selection of nanocarriers that may be potentially
useful for further testing as therapeutic delivery vehicles for conditions of the brain.

Dedication
iii
Dedication
To God Almighty

Acknowledgements
iv
Acknowledgements
I would like to express my appreciations to my supervisors Dr Eugen Barbu and Dr John
Tsibouklis for their support and kind assistance through the period of my PhD.
I would like to acknowledge Dr Asme Boussahel for her assistance with cell work, I also
acknowledge Mrs Christine Hughes for SEM work, Val Ferrigan for logistical support; and
to my colleagues Ashleigh, Temmy and Fauzi for their friendly company.
I would like also to acknowledge TETFUND-Nigeria through University of Nigeria for
providing the financial support.

Declaration
v
Declaration
Whilst registered as a candidate for the degree of Doctor of Philosophy, I have not been
registered for any other award. This work was sponsored by the Tertiary Education Trust
Fund (TETFUND) Nigeria, through University of Nigeria, Nsukka. The material contained
within this thesis is all my own work and has not been submitted for any other academic
award.
Ibegbu, Madu Daniel

Contents
vi
Contents
Contents
Abstract ............................................................................................................................................... ii
Dedication .......................................................................................................................................... iii
Acknowledgements ............................................................................................................................ iv
Declaration .......................................................................................................................................... v
Contents ............................................................................................................................................. vi
Abbreviation list .................................................................................................................................. x
Lists of Tables .................................................................................................................................... xii
Lists of Figures .................................................................................................................................. xiv
1. Introduction and aims ..................................................................................................................... 1
1.1 Drug delivery to the brain ......................................................................................................... 1
1.1.1 The blood-brain barrier ...................................................................................................... 2
1.1.2 Strategies for delivering drugs to the brain ........................................................................ 9
1.1.2.1 Invasive approaches ........................................................................................................ 9
1.1.2.2 Use of penetration enhancers .......................................................................................... 9
1.1.2.3 Prodrugs ........................................................................................................................ 10
1.1.2.4 Modifications of influx transporters.............................................................................. 10
1.1.2.5 Passive drug targeting ................................................................................................... 11
1.1.2.6 Active drug targeting .................................................................................................... 11
1.1.2.7 Carrier-mediated delivery (Colloidal drug delivery systems) ....................................... 11
1.1.3 Nanoformulated drugs currently in clinical trials ............................................................ 17
1.2 Polymeric drug delivery systems ............................................................................................ 18
1.2.1 Poly(alkyl cyanoacrylate)s ............................................................................................... 20
1.2.2. Poly lactic acid (PLA) ..................................................................................................... 22
1.2.3. Polysaccharides ............................................................................................................... 22
1.2.4. Polycyanoacrylates.......................................................................................................... 25
1.3. Methods for the preparation of nanocarriers ....................................................................... 26
1.4. Characterisation techniques .................................................................................................. 26
1.4.1. Elemental analysis........................................................................................................... 27
1.4.2. MALDI-TOF MS ............................................................................................................ 28
1.4.3. Nanoparticle Tracking Analysis (NTA) .......................................................................... 31
1.4.4. Zeta potential determination ........................................................................................... 32
1.4.5 TGA ................................................................................................................................. 32
1.4.6 SEM ................................................................................................................................. 33

Contents
vii
1.5. Aim of the study ..................................................................................................................... 35
2. Chemical modifications of dextran ............................................................................................... 36
2.1 Dextran .................................................................................................................................... 36
2.1.1 Chemical structure of oxiranes for synthesis of alkyl-glyceryl dextrans ......................... 38
2.2 Materials and instrumentation ............................................................................................... 38
2.3 Methods .................................................................................................................................. 39
2.4 Results and Discussion ............................................................................................................ 40
2.4.1 Synthesis of alkylglyceryl dextrans ................................................................................. 40
2.4.2 Characterisation of the alkylglyceryl dextrans ................................................................. 42
2.4.2.1 NMR and FTIR ............................................................................................................. 42
2.4.2 GPC .................................................................................................................................. 46
2.4.6 Discussion on synthesis and characterisation techniques ................................................ 56
2.5 Conclusions ............................................................................................................................. 57
3. Preparation and characterisation of nanoparticles ...................................................................... 58
3.1 Mechanism of ACA polymerisation ......................................................................................... 58
3.2 Materials and instrumentation ............................................................................................... 60
3.3 Methods .................................................................................................................................. 62
3.3.1 Attempted NP formulation with ethyl 2-cyano-3-ethoxyacrylate .................................... 62
3.3.1.1 Preparation of PECA-Dex100 nanoparticles ................................................................ 62
3.3.2 Preparation of poly (ethyl 2-cyanoacrylate)–alkylglyceryl-dextran NPs ......................... 63
3.3.3 Preparation of PLA15-Dex100G8-PECA ........................................................................ 64
3.3.4 Effect of filtration on size of PECA-Dex100G8 NPs ...................................................... 64
3.3.5 Preparation of PECA-Dex6G16 nanoparticles by nanoprecipitation ............................... 65
3.3.6 Preparation of PLA-derived nanoparticles by zero length crosslinking .......................... 65
3.3.7 Preparation of PBCA-Dex100G4 nanoparticles .............................................................. 66
3.3.8 Degradation study ............................................................................................................ 66
3.4 Results and discussion ............................................................................................................ 68
3.4.1 Preparation of nanoparticles of ethyl 2-cyanoacrylate ..................................................... 68
3.4.1.1 Preparation of PECA-Dex100 ....................................................................................... 68
3.4.1.2 Preparation of poly (ethyl 2-cyanoacrylate)–alkylglyceryl-dextran NPs ...................... 68
3.4.1.2.1 Preparation of PECA-Dex6G16 NPs by nanoprecipitation ....................................... 68
3.4.1.2.2 Effect of filtration on size of PECA-Dex100G8 NPs ................................................ 69
3.4.2 Elemental analysis results ................................................................................................ 72
3.4.3 MALDI-TOF-MS of PECA-alkylglyceryl dextran NPs .................................................. 74
3.4.4 Autotitration of PECA-alkylglyceryl dextran nanoparticles ........................................... 76
3.4.5 Preparation of PBCA-Dex100G4 nanoparticles .............................................................. 80
3.4.7 TGA and DSC thermograms of PLA-Dex100G8-PECA ................................................ 82

Contents
viii
3.4.8 Preparation of PLA-derived nanoparticles by zero length crosslinking .......................... 84
3.5 Enzymatic degradation of PECA-alkylglyceryl dextran nanoparticles ..................................... 86
3.6. Conclusions ............................................................................................................................ 90
4. Loading of nanoparticles with drugs, peptides and fluorophores ................................................ 92
4.1. Actives and fluorophores ....................................................................................................... 92
4.2 Methods and instrumentation ................................................................................................ 95
4.2.1. Loading of PECA-Dex, PECA-Dex100G4 and PECA-Dex100G8 NPs with Rhodamine
B ................................................................................................................................................ 95
4.2.2 PECA-Dex100G4 and PLA-Dex100G8PECA Nanoparticle-loading with Curcumin: the
EtOH/H2O (1:1) method ........................................................................................................... 96
4.2.2.3 Loading and release of Doxorubicin hydrochloride from PECA-Dex6G4 NPs and
PECA-Dex6G8 NPs by nanoprecipitation-solvent evaporation ............................................... 97
4.2.4 The preparation of PECA-Dex100G4-Dox ...................................................................... 98
4.2.5 Loading of Doxorubicin hydrochloride to PECA-Dex6G16 ........................................... 98
4.2.6 Determination of EGFP enhanced green fluorescence protein (EGFP) ........................... 98
4.2.7 Tagging of PECA-Dex100G8 with MIA ......................................................................... 98
4.2.8 Tagging of MIA to PECA-Dex16 and loading of Curcumin ......................................... 100
4.2.9 Tagging of Tetramethyl Rhodamine-5-carbonyl azide (TMRCA) to PECA-Dex6G12
nanoparticles ........................................................................................................................... 100
4.2.10 Evaluation of Evans blue retentive capacity ................................................................ 100
4.3 Results and discussion .......................................................................................................... 102
4.3.1 Rhodamine ..................................................................................................................... 102
4.3.2 Curcumin ........................................................................................................................ 103
4.3.3. Doxorubicin .................................................................................................................. 103
4.3.3.2 PECA-Dex6G16-Doxorubicin (PECA-Dex6G16-Dox) nanoparticles ....................... 104
4.3.3.3 Loading and release of Doxorubicin hydrochloride from PECA-Dex6G4 NPs and
PECA-Dex6G8 NPs by nanoprecipitation-solvent evaporation ............................................. 104
4.3.3.4 Loading of both Doxorubicin and Curcumin into PECA-Dex100G12nanoparticles: 106
4.3.3.5 PECA-Dex100G12-Dox TGA and DSC results ......................................................... 107
4.3.4 Other fluorescent markers and model drugs .................................................................. 108
4.3.4.1 Enhanced green fluorescence protein (EGFP) determination in NPs ......................... 108
4.3.4.2 N-methyl-isatoic anhydride (MIA) ............................................................................. 109
4.3.4.3 Tetramethyl Rhodamine-5-carbonylazide ................................................................... 110
4.4 Conclusions ........................................................................................................................... 112
5. In vitro studies - Cytotoxicity ...................................................................................................... 113
5.1 Methods and instrumentation .............................................................................................. 113
5.2 Results and Discussion .......................................................................................................... 114
5.3. Conclusions .......................................................................................................................... 119

Contents
ix
6. General Conclusions and suggestions for further work .............................................................. 120
7. References .................................................................................................................................. 122
8. Appendices .................................................................................................................................. 133
Abbreviations
x
Abbreviation list
ACA= Alkyl cyanoacrylates
AFM= Atomic force microscopy
BBB= Blood-brain barrier
BCA= n-butyl cyanoacrylate
CNS= Central nervous system
DCM= Dichloromethane
Dex= Dextran
Dex6= Dextran 6 kDa
Dex100= Dextran 100 kDa
Dex6G4 = Dextran 6 kDa modified with butyl glycidyl ether
Dex6G8 = Dextran 6 kDa modified with octyl glycidyl ether
Dex6G12= Dextran 6 kDa modified with glycidyl lauryl ether
Dex6G14= Dextran 6 kDa modified with dodecyl /tetradecyl glycidyl ether
Dex6G16= Dextran 6 kDa modified with hexadecyl glycidyl ether
Dex100G4 = Dextran 100k Da modified with butyl glycidyl ether
Dex100G8 = Dextran 100 kDa modified with octyl glycidyl ether
Dex100G12 = Dextran 100 kDa modified with glycidyl lauryl ether
Dex100G14 = Dextran 100kDa modified with dodecyl /tetradecyl glycidyl ether
Dex100G16 = Dextran 100kDa modified with hexadecyl glycidyl ether
DLS= Dynamic light scattering
DMEM= Dulbecco's Modified Eagle Medium
DMSO= Dimethyl sulfoxide
DS= Degree of substitution
DSC=Differential scanning calorimetry
ECA= ethyl 2-cyanoacrylate
GPC= Gel permeation chromatography.
ICS= Cerebrospinal fluid
ISF= Interstitial fluid
M/Z= mass-to-charge ratio
MALDI/TOF MS = Matrix assisted laser desorption/ionisation time of flight mass
spectroscopy

Abbreviations
xi
MIA= N-Methylisatoic anhydride
MRP=Multi Drug resistance protein
MTT= 3-(4,5-Dimethylthiazol-2-yl)-2,5-diphenyl tetrazolium bromide
NPs= Nanoparticles
NTA= Nanoparticle Tracking Analysis
OGE=Octyl glycidyl ether
PACA= Poly (alkyl cyanoacrylates)
PECA-Dex100G4(1:1)= prepared with equal ratio of ECA monomer to modified dextran
PECA-Dex100G16(1:6) =prepared with 6:1 ratio of ECA monomer to modified dextran
PBCA= Poly (butyl cyanoacrylate)
PDI= Polydispersity index
PECA= Poly (ethyl 2-cyanoacrylate)
PES=Polyethersulphone
PLGA= Poly(lactic-co-glycolic acid)
PLA= Poly (lactic acid)
SEM= Scanning electron microscope
t-BuOK= Potassium tert-Butoxide
TEM= Transmission electron microscope
TGA=Thermal gravimetric analysis
ZP= Zeta potential

Lists of tables
xii
Lists of Tables
Table 1.1: Representative examples of nanoformulations water insoluble drugs that are approved for clinical use or under clinical trial
Table 1.2: Classification of biodegradable polymers
Table2.1: The degree of substitution of the glyceryl dextrans
Table 2.2: Pullulan standard calibration data
Table 2.3: Equation calculated for GPC calibration curve
Table2.4: Mn, Mw and PDI of the dextrans and alkylglyceryl dextrans
Table 2.5: m/z fragment mass loss of the modified dextrans
Table 2.6: TGA results of first and second mass loss, and temperature of modified and unmodified dextrans
Table 3.1: Protocol for the degradation study of PECA-Dex100G4
Table 3.2: DLS Characterisation PECA-Dex6G16 nanoparticles
Table 3.3: Effect of filtration of NPs on size, PDI and zeta potential (±SD; n=3)
Table 3.4: Percentage elemental composition of PECA-alkylglyceryl dextran NPs (experimentally found and calculated)
Table 3.5: m/z fragment mass loss of PECA-alkylglyceryl dextran NPs
Table 3.6 Comparison of effects of pH on the size and zeta potential of titrated nanoparticles
Table 3.7: Size, PDI and zeta potential of PBCA-Dex100G4 nanoparticles
Table 3.8: Size and PDI of PLA15-Dex100G8-PECA NPs (±SD, n=3)
Table 4.1: Size, PDI and zeta potential of Rhodamine B-loaded, Polysorbate 80-coated PECA-Dex100 NPs
Table 4.2: The absorbance and concentration of Curcumin in the supernatant ( EtOH:H2O), (1:1) from the loading of NPs.
Table 4.3: Concentration of Curcumin content of dissolved Curcumin loaded NPs
Table 4.4: Size, PDI and zeta potential of PECA-Dex100G4-Dox nanoparticles
Table 4.5: Size, zeta potential and PDI characterisation of Doxorubicin-PECA-Dex16 (Dox-PD16) nanoparticles (DLS)
Table 4.6 percentage Doxorubicin loading to the nanoparticles(loading effeciency)
Table 4.7: Size, PDI and zeta potential of PECA-Dex6G12 nanoparticles loaded with Doxorubicin-Curcumin.

Lists of tables
xiii
Table 4.8: Determination of concentrations of EGFP in PECA-Dex100G8-EGFP NPs
Table 4.9: The effect of different liquid media on the size distribution of NPs of PECA-Dex100G8 that had been tagged with MIA (DLS)
Table 4.10: Fluorescence intensity of MIA-Curcumin nanoparticles
Table 4.11: DLS analysis of MIA-Curcumin NPs
Table 4.12: The size and PDI of PECA-Dex6G12-TMRCA nanoparticles
Table 5.1: cytotoxicity dose response of alkyl cyanoacrylate-alkylglyceryl dextran NPs against bEND3 cells

Lists of figures
xiv
Lists of Figures
Figure 1.1: The structure of the brain
Figure 1.2: Cellular interplay at the neurovascular unit (capillary level)
Figure 1.3: Tight junction
Figure 1.4: A simplified atlas of the BBB
Figure 1.5: Structures of heroin and morphine
Figure 1.6: Types of drug delivery systems
Figure 1.7: Schematic representation of liposomes and micelles
Figure 1.8: The structure of dendrimer
Figure 1.9: Schematic representation of the structure of nanosphere and nanocapsule for drug delivery
Figure 1.10: The structures of alkyl cyanoacrylate (R= methyl, ethyl, butyl, isobutyl, isohexyl, octyl etc.) (A) and poly(lactic acid) (B).
Figure 1.11: The chemical structure of dextran.
Figure 1.12: Schematic representation of an elemental analyser
Figure 1.13: Schematic representation of the MALDI instrument
Figure 1.14: Non-destructive vaporisation and ionisation of biomolecules by MALDI TOF
Figure 1.15: Schematic representation of the Nanoparticle Tracking Analysis (NTA)
Figure 1.16: Schematic representation of particles and surround charges
Figure 1.17: Representative TGA curve
Figure 1.18: The scanning electron microscope
Figure 2.1: The chemical structure of dextran
Figure 2.2: Chemical structure of alkyl glycidyl ether where: n=1, butyl; n=4,octyl; n=8, lauryl; n=12, hexadecyl.
Figure 2.3: Scheme for the synthesis of alkylglyceryl dextrans
Figure2.4: 1H-NMR spectrum of alkyl glyceryl dextran (Dex100G16)
Figure2.5: 1H-NMR spectrum of butyl alkyl glyceryl dextran (Dex100G4)
Figure2.6: 1H-NMR of native dextran
Figure2.7: FTIR of butyl glyceryl dextran (Dex100G4)
Figure2.8: FTIR of octyl glyceryl dextran (Dex100G8)

Lists of figures
xv
Figure 2.9: Pullulan standard calibration curve
Figure 2.10: GPC chromatogram of native dextran (Dex6)
Figure2.11: GPC chromatogram of native dextran (Dex100)
Figure2.12: GPC chromatogram of Dex6G4
Figure 2.13: GPC chromatogram of Dex100G16
Figure 2.14: MALDI TOF spectrum of Dex6G4
Figure 2.15 MALDI TOF spectrum of Dex100G4
Figure 2.16: TGA results for Dex6
Figure 2.17: TGA results of Dex6G4
Figure 2.18: First mass loss plot of percentage mass loss the chain length (Dex100 and derivatives)
Figure 2.19: First mass loss plot of percentage mass loss against the chain length (Dex6 and derivatives)
Figure 3.1: Mechanism for the anionic emulsion polymerisation of ACA, as initiated by
mild nucleophiles
Figure3.2: Structure of ethyl 2-cyano-3-ethoxyacrylate
Figure 3.3: Schematic representation of the protocol for the synthesis and characterisation of PACA-alkylglyceryl dextran.
Figure 3.4: Scheme for the synthesis of PLA-alkylglyceryl dextran nanoparticles
Figure 3.5: 1H NMR spectrum of PECADex100G8 nanoparticles
Figure3.6: 1H-NMR spectrum of pure PECA
Figure3.7: 13C-NMR spectrum of pure PECA
Figure 3.8 MALDI TOF spectrum of PECADex6G4
Figure 3.9: MALDI TOF spectrum of PECA-Dex6G12
Figure 3.10: Effect of pH on PECA-nanoparticles (0.25mg/mL) MPT-2 Titration-[0.005M/0.5 M HCl] (n=2, ±SD)
Figure 3.11: Effect of pH on PECA-Dex6G4 (1:1) nanoparticles (0.25 mg/mL); MPT-2 Titration (0.005/0.5 M HCl; n=3 ±SD)
Figure 3.12: Effect of pH on the characteristics of PECA-Dex6G4 (1:6) nanoparticles (0.25mg/mL); MPT-2 Titration (0.005/0.5 M HCl; n=3 ±SD).
Figure 3.13: Effect of pH on PECA-Dex6G16 (1:1) nanoparticles (0.25 mg/mL); MPT-2 titration (0.005/0.5 M HCl; n=3 ±SD).

Lists of figures
xvi
Figure3.14: Effect of pH on PECA-Dex6G16 (1:6) nanoparticles (0.25 mg/mL); MPT-2 Titration (0.005/0.5 M HCl; n=3 ±SD).
Figure 3.15: Size concentration intensity distribution of PBCA-dex100G4 NPs
Figure3.16 FTIR spectrum of PBCA-Dex100G4 NPs
Figure3.17: 1H-NMR spectrum of PLA15-Dex100G8-PECA (400 MHz).
Figure 3.18: TGA plots of PLA-Dex100G8-PECA NPs
Figure 3.19: DSC of PLA-Dex100G8-PECA NPs
Figure 3.20: 1H NMR spectrum of PLA15-Dex100G8 nanoparticles.
Figure 3.21: 13CNMR NMR of PLA15-Dex100G8 nanoparticles
Figure 3.22: 13CNMR NMR of PLA15-Dex100G8 nanoparticles
Figure 3.23: Effect of time on size and PDI of PECA-Dex100G4 NPs (n=3, ±SD) (Control, without enzyme)
Figure 3.24: Effect of constant enzyme concentration on size and PDI of PECA-Dex100G4 nanoparticles as a function of enzyme (n=3±SD).
Figure 3.25: Effect of enzyme concentrations on size and PDI of PECA-Dex100G4 nanoparticles as a function of enzyme (n=3 ±SD).
Figure3.26: Enzyme-mediated degradation of PECA-NPs during the first 4h of the extended study.
Figure 3.27: Enzyme degradation of PECA-Dex100G4
Figure 4.1: Chemical structure of Rhodamine B
Figure4.2: Chemical structure of Curcumin
Figure4.3: Chemical structure of Doxorubicin hydrochloride
Figure4.4: MIA reaction with PECA-Dex100G8
Figure 4.5: Covalent linkage of Tetramethyl Rhodamine to PECA-Dex6G12 nanoparticles
Figure 4.6: Size distribution of PECA-Dex, PECA-Dex100G4 and PECA-Dex100G8 loaded with Rhodamine B (n=3)
Figure 4.7: Cumulative release profile of Doxorubicin from Doxorubicin HCl, PECA-Dex6G4 and PECA-Dex6G8 (n=3, ±SD).
Figure 4.8 TGA plots from PECA-Dex100G12-Dox nanoparticles.
Figure 4.9: DSC of PECA-Dex100G12–Doxorubicin nanoparticles.
Figure 4.10: Chemical structure of Evans blue
Figure 5.1: Relative toxicity of PECA and PECA-alkylglyceryl dextran nanoparticles (1 mg/mL)

Lists of figures
xvii
Figure 5.2: Relative cytotoxicity of alkylglyceryl dextran (1 mg/mL) (p<0.05)
Figure 5.3: Relative viability as a function of dose response of alkyl cyanoacrylate NPs against bEnd3 cells, each incubated at specified concentrations (10 μg/mL, 25 μg/mL 50 μg/mL 100 μg/mL) for 24 h; MTT assay; Triton –X100 and media blank (n =3, ±SD; Triton-X100 positive control).

Introduction and aims
1
1
1. Introduction and aims
1.1 Drug delivery to the brain
In 2010 it was estimated that 38% of the European population suffered from a brain
disorder as compared with 27% in 2005 (1). These disorders include the
neurodegenerative diseases (dementia, epilepsy, multiple sclerosis) and mental disorders
(depression, schizophrenia, panic disorder, drug dependence and insomnia).
Epidemiological studies have shown that about one third of the world population may
suffer from some mental disorder at some stage in their lives (2). Schizophrenia,
depression, epilepsy, dementia, alcohol dependence and other mental, neurological and
substance-use (MNS) disorders constitute 13% of the global burden of disease, surpassing
both cardiovascular disease and cancer (3). A recent review has identified several CNS
(central nervous system) diseases that may be treatable with biological actives if
appropriate therapeutic delivery systems were to be developed (4).
Figure 1.1: The structure of the brain (5)
The human brain (Figure 1.1) is irrigated by capillaries the total length of which is
estimated at ca. 644 km; corresponding to surface area available for transport of about
20 m2 (6), and a thickness of the cerebral endothelial membrane of the order of 0.2-0.3
µm.

Introduction and aims
2
One of the major inhibiting factors to the efficient treatment of brain disorders is the lack
of universally applicable methods for transporting therapeutic agents across the blood-
brain barrier (BBB), which has evolved to separate circulating blood from the brain
extracellular fluid (BECF) in the central nervous system (CNS) such as to prevent potential
neurotoxins from reaching the brain (7).
The BBB, which is formed by capillary endothelial cells (ECs) that are connected by tight
junctions with an extremely high electrical resistivity (> 0.1 Ω m), allows the passive
diffusion of some gases and that of water and of some lipid soluble molecules, and also
the selective transport of certain molecules (glucose, amino acids) that are crucial to
neural function. Consequently, therapeutic approaches to circumvent the BBB without
altering its integrity are an area of intense activity in drug research and development.
1.1.1 The blood-brain barrier
The acknowledgement of the existence of the BBB is consequent to the work of Ehrlich,
Lewandowsky and Goldmann, in the late 1800s and early 1900s, who reported the
absence of bile acids, ferrocyanide or trypan blue in the brain and spinal cord following
intravenous administration of each of these agents (8-11). The BBB is a highly specialised
brain endothelial structure of the fully differentiated neurovascular system (8). It is
formed from brain capillary endothelial cells (12) and localized at the level of tight
junctions (TJ) between adjacent cells. It has been described as a multicellular vascular
structure that isolates the CNS from systemic blood circulation (13), inhibiting the
transport into the brain of plasma components, red blood cells and leukocytes. Thus the
BBB is crucial for preservation and regulation of the neural microenvironment; the
specialised TJs have been described as the core structures responsible for these functions.
The endothelial cells of the BBB are characterised by extremely low numbers of
transcytotic vesicles and by a restrictive paracellular diffusion barrier (13, 14). The barrier
functions by utilising carrier-mediated transport systems to exert a tight control over the
movement of nutrient molecules, ions, and oxygen, and to protect the brain from toxins
and pathogens (13). The barrier restricts the free flow of hydrophilic compounds, small
proteins and charged molecules but relatively small lipophilic molecules (<600 Da) that
can form fewer than nine H-bonds are normally capable of permeating the BBB (15, 16). It
has been argued that some therapeutic agents may reach the brain if they are capable of

Introduction and aims
3
becoming associated with specific transporters and/or receptors at the luminal side of
endothelial cells (9).
The main anatomical structure of the BBB (Figure 1.2) is the cerebral blood vessel formed
by the ECs, which is characterised by low concentrations of leukocyte-adhesion molecules
and consequently is responsible for the limited immune surveillance inherent to the CNS
(17). There is a body of experimental evidence which suggests that attempts to
compromise the integrity of the BBB for the purpose of delivering therapeutic agents to
the CNS may distort the balance of transport of molecules between the brain and the
blood, which in turn may lead to aberrant angiogenesis, vessel regression, brain
hypoperfusion, intracerebral haemorrhage, trauma, neurodegenerative processes,
inflammatory responses, or vascular disorder; these responses are capable of generating
toxic metabolites that could affect synaptic and/or neuronal functions (8, 18, 19, 20).
Figure 1.2: Cellular interplay at the neurovascular unit (capillary level) (13)
The BBB consists of a body of cell types that include pericytes, astrocytes, endothelial
cells and microglial cells (21). Brain capillary endothelial cells are characterised by narrow
tight junction, by low pinocytic activities and by high metabolic activity. They allow little
paracellular and no transcellular transport of high-molecular-weight molecules (22).

Introduction and aims
4
Pericytes are important in supporting BBB development since they influence the
differentiation and maturation of associated endothelial cells. Their interaction with
endothelial cells induces the formation of tight junctions. In addition, they serve as
partial foundation for the basement membrane. Also, pericytes play a significant role in
cytokines production and in antigens presentation, affect end-foot processes, and
support proper neuronal functions (13).
Astrocytes account for about 90% of the overall brain mass, they are involved in
regulation of brain homeostasis through K+ buffering, in the regulation of
neurotransmitter and growth-factor release, and in the regulation of brain immune
responses. Astrocytes produce Apolipoprotein E (ApoE), a molecule that has been shown
to be beneficial to brain homeostasis (23) and may be important in drug transport
through receptor mediated endocytosis (24).
The BBB is part of the Neurovascular Unit NVU, which presents as an elaborate
interplay of central and peripheral cells (13). It creates the extracellular fluid
compartment, the content of which is different to that of somatic extracellular fluid since
it accommodates both Cerebrospinal (CSF) and Interstitial (ISF) fluids. Also, the BBB acts
as neuroprotector in that potentially damaging xenobiotics and metabolites are
prevented entry or are removed from the organ through the action of specialised
transporters (25).
Tight junctions
TJs are located in the apical part of the paracellular space and contain transmembrane
proteins (occludin, claudins, and junctional adhesion molecule-1) and cytoplasmic
proteins (zonula occludens [ZO]-1, -2, -3 and cingulin) that are bound to the actin
cytoskeleton (10).

Introduction and aims
5
Figure 1.3: Tight junction(26)
TJs are domains of occluded intercellular clefts that are shaped either in grooves (E-face)
or in ridges (P-face) (Figure 1.3). The latter face exhibits higher electrical resistance and
lower permeability than the former. Particles that associate with tight junctions are found
in both faces (14). TJs serve a key function in the regulation of paracellular permeability
and in maintaining cell polarity (27). Intermingled with tight junctions are usually found
Adherens junctions. The paracellular route of drug delivery occurs via the intercellular
space and is mediated by alterations of the tight junction barrier of epithelial cells.
A number of signal pathways have been associated with tight junction regulation, which
involves but is not limited to G-proteins, serine, threonine and tyrosine-kinases, extra-
and intra-cellular calcium levels, cAMP levels, proteases and cytokines (14).

Introduction and aims
6
Bidirectional transport between brain and systemic circulation
The transcellular bidirectional transport across the BBB has been categorized into carrier-
mediated transport, ion transport, active efflux transport, receptor-mediated transport,
and caveolae-mediated transport of interstitial fluid to blood (28). The influx transporters
(mostly involved in nutrients import) and the efflux transporters (involved in removal of
metabolites and neurotoxic compounds from brain) both prevent the entry of xenobiotics
to the brain (29). An example is P-glycoprotein (P-gp; a 170 kDa protein member of the
ATP-binding cassette transporters), which is located at the luminal membrane of
endothelial cells. P-glycoprotein has been suggested to serve as an efflux transporter that
functions as a clearance system for metabolites and neurotoxic compounds produced in
the brain (28). It has been shown that P-gp is distributed throughout both the luminal and
abluminal membranes of the endothelium, and in astrocytes and pericytes, suggesting
that the pump may be involved in regulating drug transport processes over the entire CNS
and at both the cellular and subcellular levels (30).
The movement of nutrients to the brain (e.g. hexoses, amino acids and monocarboxylic
acids, nucleosides, amines and vitamins), which is facilitated by specialised carrier-
mediated transporters, is characterised by a concentration gradient of each nutrient as it
moves from blood to brain (Figure 1.4). The inflow of nutrients is regulated by the
metabolic needs of the brain, but is also affected by the availability of nutrients.
Since the brain depends mainly on glucose for its energy needs, Glucose transporter 1
(GLUT1) is crucial to brain function. The concentration of GLUT1 is higher at the abluminal
membrane as compared with that of the luminal membrane (29). Consistent with the
need for demand-regulated influx of glucose into the organ, the distribution of the same
transporter in the brain is asymmetric. Facilitative amino acid transport systems at the
BBB (e.g. L1, y+) provide the brain with all the essential amino acids, while sodium-
dependent amino acid transport systems (e.g. A, ASC) allow the movement of non-
essential amino acids. Sodium-dependent excitatory amino acid transporters are
responsible for the removal from the brain of potentially toxic acidic amino acids. Biotin,
pantothenic acid and lipoic acid are transported to the brain by means of sodium-
dependent transporter, while others vitamins (B1, B3, B5, and E) are transported by
specialised carriers.

Introduction and aims
7
Localised at the abluminal side of the brain, the sodium pump serves the sodium-
potassium (Na+-K+, ATPase; Figure 1.4) exchange in the brain. Also, the Na+-K+-2Cl- co-
transporter, which resides predominantly at the luminal side of the brain, facilitates the
control of sodium, potassium and chloride ions at the brain endothelium. The intracellular
pH of the endothelium is regulated by the co-operative actions of the sodium-hydrogen
exchanger and the chloride-bicarbonate exchanger, while calcium efflux is mediated by
the sodium-calcium exchanger (8, 31).
Monocarboxylate1 (MCT1) is involved in the regulated transport of ketone molecules to
the brain, which serve as energy sources, as do hexoses (8). The efflux of anionic
compounds is mediated by multi drug resistance-associated proteins (MRP) transporters,
which are known to be involved in the organ-specific efflux of molecules (e.g. breast-
cancer-resistance protein, BCRP) and family members of the organic anion transporting
polypeptide (OATP) and the organic anion transporter (OAT). These transporters have the
capability to work co-operatively to inhibit penetration of many drugs into the brain and
to increase their efflux from the brain.

Introduction and aims
8
Figure 1.4: A simplified atlas of the BBB (8)

Introduction and aims
9
1.1.2 Strategies for delivering drugs to the brain
Several strategies have been proposed towards overcoming the BBB-imposed limitations
to the delivery of some drugs and other actives to the brain. These strategies may be
categorised into invasive and non-invasive; the former requires specialised expertise,
which impacts on costs, while the latter may be readily accessible to patients.
1.1.2.1 Invasive approaches
Due to the limited access of drugs to the brain via the BBB, invasive procedures represent
the current method of choice for brain-specific therapeutic delivery. Most of these
methods are characterised by intraventricular drug infusion or by disruption of the BBB;
procedures that are both time-consuming and highly specialised (32, 33). Implantation of
a catheter into the ventricular system for the delivery of drugs directly to brain then
bypassing the BBB has been described as the most common invasive procedure for drug
delivery to CNS (34).
1.1.2.2 Use of penetration enhancers
Several penetration-enhancing approaches have been adopted towards increased
paracellular transport in brain capillaries. These include the administration of osmotic
solutions, the use of vasoactive substances, the utilisation of alkylglycerols (35) and the
application of physical stimuli (9) to induce an enhancement of drug transport across the
BBB (36).
Chemical stimuli and tight-junction modulations have been used for opening the BBB to
deliver anti-tumour agents to the brain. Although not without side effects, Mannitol has
been claimed to be preferable to Polysorbate 80 and to Bradykinin for this purpose (10).
The physical opening of TJs by means of electromagnetic radiation has been documented
(37); electromagnetic pulses have also been claimed to affect key TJ-related proteins,
including ZO-1, occludin, and claudin-5 (38). In attempts to open TJs, sodium caprate has
been utilised as have Claudin modulator (39) and junction Zonula Occludens toxin, Zot
(40).
However, disturbance of the BBB as a means for the delivery of therapeutic molecules to
the CNS is inhibited by the technological complexity of the approach, by risks of tumour
dissemination, neurotoxicity and by inadequate selectivity (10).

Introduction and aims
10
1.1.2.3 Prodrugs
The use of prodrugs represents another means of circumventing the BBB in the delivery
of actives to the brain (37, 38). This approach involves the chemical transformation of an
administered drug to generate an active precursor molecule that is capable of traversing
the target biological membrane, as is exemplified by the relationship between heroin and
morphine (Figure 1.5):heroin (a diacetyl ester congener of morphine) is capable of
penetrating the BBB and subsequently becoming metabolised to produce morphine,
which is a molecule that is not capable of penetrating the BBB (41).
Heroin Morphine
Figure 1.5: Structures of heroin and morphine
Amongst other strategies, the co-administration of drugs with P-gp modulators, the
utilisation of drug-loaded biopolymers, the use of drug-transporting peptides and the
structural modification of drugs have all been examined as means of overcoming the BBB
(33), as has nasal drug delivery (a route that is not impeded by the BBB).
1.1.2.4 Modifications of influx transporters
The formulation of drugs such that they exhibit structural resemblance to a substrate of
influx transporters to the brain has been proposed as a strategy towards increased
availability of a drug to the brain (28). However, an attempted use of a formulation of a D-
glucose-chlorambucil derivative failed to transport this active to the brain consequent to
the associated inhibition of the GLUT1 influx pump (42).

Introduction and aims
11
1.1.2.5 Passive drug targeting
Passive targeting occurs due to extravasation of the nanoparticles at the diseased site
where the microvasculature is often described as leaky (43).The molecular design of
nanoparticulate therapeutic vehicles is primarily determined by the need to overcome
the natural defence mechanisms mononuclear phagocyte system (MPS) that work
towards their elimination from circulation (43). Selective accumulation of nanocarriers
and drug then occurs by the enhanced permeability and retention (EPR) effect, The EPR
effect will be optimal if nanocarriers can evade immune surveillance and circulate for a
long period (44).
1.1.2.6 Active drug targeting
It has been suggested that epitopes or receptors that are overexpressed in certain
diseased states may be exploited in active drug targeting: if ligands are attached at the
surface of the nanocarrier for binding to specified receptors expressed at the target site,
targeted receptors may be expressed homogeneously on all targeted cells. Targeting
ligands are either monoclonal antibodies (mAbs) and antibody fragments or nonantibody
ligands. The binding affinity of the ligands influences the tumour penetration because of
the binding-site barrier. The ligand is selected to bind to a receptor that is overexpressed
by tumour cells or by tumour vasculature and not expressed by normal cells. The active
targeting is particularly attractive for the intracellular delivery of macromolecular drugs,
such as DNA, siRNA and proteins (44).
1.1.2.7 Carrier-mediated delivery (Colloidal drug delivery systems)
Commonly used nanocarriers for preclinical and clinical drug delivery studies include
liposomes (e.g. lipodox), dendrimers (Figure 1.6) and solid-lipid nanoparticles, since these
often combine effective drug delivery with high drug loading capacity (44).

Introduction and aims
12
Figure 1.6: Types of drug delivery systems (45)
Liposomes and micelles
Although the subject of considerable research efforts, liposome-mediated drug delivery is
often limited by: the inherent instability of liposomal dispersions, drug leakage, low
activity due to no specific tumour targeting, nonspecific clearance by the mononuclear
phagocytic system (MPS) and complications associated with the available large-scale
production methods (46). Nonetheless, liposome-loaded Doxorubicin (lipodox) has been
shown to be significantly more effective on resistant cell line than free Doxorubicin. Co-
administration of Doxorubicin and P-gp inhibitor indicated the capability of the liposomal
formulation to inhibit the efflux pump P-gp (47-49). Benefits to drug-delivery applications
have been shown by micellar formulations, as is exemplified by the capability of micelles
poly caprolactone-b-poly ethylene oxide (PCL-b-PEO) of Doxorubicin to shift the
accumulation of this active from the cytoplasm to the nucleus, thereby enhancing
efficacy.
Introduction and aims
13
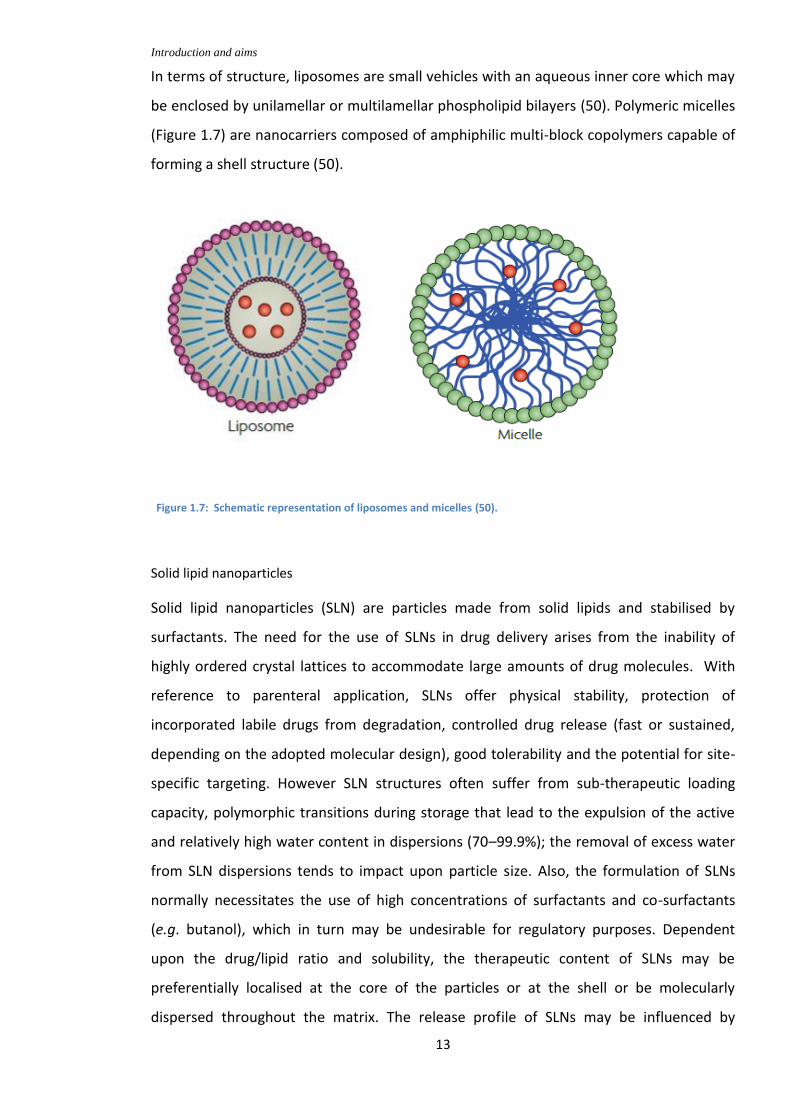
In terms of structure, liposomes are small vehicles with an aqueous inner core which may
be enclosed by unilamellar or multilamellar phospholipid bilayers (50). Polymeric micelles
(Figure 1.7) are nanocarriers composed of amphiphilic multi-block copolymers capable of
forming a shell structure (50).
Figure 1.7: Schematic representation of liposomes and micelles (50).
Solid lipid nanoparticles
Solid lipid nanoparticles (SLN) are particles made from solid lipids and stabilised by
surfactants. The need for the use of SLNs in drug delivery arises from the inability of
highly ordered crystal lattices to accommodate large amounts of drug molecules. With
reference to parenteral application, SLNs offer physical stability, protection of
incorporated labile drugs from degradation, controlled drug release (fast or sustained,
depending on the adopted molecular design), good tolerability and the potential for site-
specific targeting. However SLN structures often suffer from sub-therapeutic loading
capacity, polymorphic transitions during storage that lead to the expulsion of the active
and relatively high water content in dispersions (70–99.9%); the removal of excess water
from SLN dispersions tends to impact upon particle size. Also, the formulation of SLNs
normally necessitates the use of high concentrations of surfactants and co-surfactants
(e.g. butanol), which in turn may be undesirable for regulatory purposes. Dependent
upon the drug/lipid ratio and solubility, the therapeutic content of SLNs may be
preferentially localised at the core of the particles or at the shell or be molecularly
dispersed throughout the matrix. The release profile of SLNs may be influenced by

Introduction and aims
14
chemical modifications at the lipid matrix, by the concentration of co-formulated
surfactant and by the physical parameters adopted during formulation. For therapeutic
applications, SLNs are normally injected (intravenously, intramuscularly, subcutaneously
or directly to the target organ). SLN formulations are suitable for therapeutic uses
requiring systemic body distribution since their small size minimises the risk of embolism
by blood clotting or particle aggregation. If administered subcutaneously or designed to
accumulate in the MPS, SLNs offer the opportunity to act as a sustained release depot of
the drug which allows the incorporated drug to be released over extended time scales
either by the erosion of the SLN matrix (e.g. by means of enzymic degradation) or by
diffusion from the particles (46).
Dendrimers
Dendrimer (Figure 1.8) nanocomposites are symmetric hyper-branched, star-shaped
structures that are designed such as to produce monodispersed formulations (51). The
repetitious nature of chain and branching afford a series of radially concentric layers with
increasing crowding, as is exemplified by poly(amidoamine)-based structures. The
classification of dendrimers according to generation reflects the exponential increase in
the number of branches in each layer: dendrimer growth is typically ca. 1 nm per
generation. Since dendrimers are typically symmetric around the core, their extended
forms in aqueous media are of spheroidal morphology. The loosely packed core and
tightly packed periphery of dendrimers often affords good drug loading capacity (52, 53)
but this is counterbalanced by little control over the release mechanism of loaded drugs.
Also, because of their branched nature, dendrimers are often amenable to conjugation
with pharmaceutically active moieties through functional groups. Notably, studies in
cultured cells (colon carcinoma) have shown that Dox-dendrimers are less toxic than free
Dox (54).
As compared with linear polymers, dendritic structures have “dendritic voids” that give
these molecules important and useful features. Dendrimers with a high surface charge
density due to ionisable groups are amenable to non-stoichiometric association with
therapeutic molecules through electrostatic interactions. Such dendrimer-drug

Introduction and aims
15
interactions may afford to actives enhanced solubility, increased stability and efficient
transport through biological membranes (55).
Figure 1.8: The structure of dendrimer(55)
Nanoparticulates
Since colloidal carriers, particularly biodegradable polymeric nanoparticles, are often
amenable to structural modifications that may bestow to them the capability to be
transportable through the BBB, many researchers regard these structures as promising
vehicles for the delivery of drugs to the brain. Many colloid-forming biopolymers (e.g.
dextran, PACA, PLA) have been considered for the purpose. The properties of
nanoparticles utilised for the in vivo transport and enhanced pharmacokinetic profile of
therapeutic compounds originate from their nano-scale size which furnishes them with
colloidal stability and allows them to penetrate tissues easily through capillaries and
epithelial linings. Amenability to functionalisation, both at the surface and at the core of
nanoparticles, has provided opportunities for applications in drug delivery and in
molecular imaging (56). The performance of drug-loaded nanocarriers for targeting
organs or tissues may be fine-tuned by adjusting the balance between particle size, size
distribution, surface charge, surface modification and hydrophobicity (57).

Introduction and aims
16
Nanoparticulate drug carriers are nanoscaled solid colloidal structures (nanospheres or
nanocapsules) that may be prepared from natural or from synthetic polymers (58-60).
Research efforts in nanoparticle-mediated drug delivery have been rationalised in terms
of their potential to effect: (i) long blood circulation time that is coupled with a capability
to enter the smallest capillaries; (ii) resistance to rapid phagocytic clearance; (iii)
capability to reach the target organ by penetrating cells and tissues; (iv) capacity to
exhibit controlled release properties that are inherent to the rate of biodegradability or
occur in response to a stimulus or a combination of stimuli (pH, temperature, ion
sensibility); and, (v) improved target-organ specificity (61).
For potential use in drug delivery nanoparticles must possess properties of
biocompatibility and biodegradability to non-toxic and non-immunogenic products (62).
Nanoparticles are differentiated from larger size congeners by their active surface area
which in turn impacts upon aspects of chemical and biological reactivity (63) through
effects at the solid–liquid interface and those at the contact zone with biological
substrates (64). Chemical composition, surface function, geometry, porosity, surface
crystallinity, size range, heterogeneity, roughness, and degree of hydrophilicity are all
considered important in determining the scope and extent of the interactions of
nanoparticles with biological systems (65). Of importance are the characteristics of the
surface layer (zeta charge, aggregation potential, dispersion state, stability, extent of
hydration) as influenced by the characteristics of the surrounding medium (ionic strength,
pH, temperature, and presence of organic molecules or surfactants) (66). The surface
chemistry of nanoparticles that are amenable to functionalisation offers the possibility to
optimise the behaviour of nanoparticles in biological environments (64). It has been
suggested that to be usefully applied in drug delivery to the brain (67), nanoparticles
must have the following characteristics: diameter around 100 nm, physical stability in
blood (no aggregation), non-susceptibility to the mononuclear phagocytic system (MPS),
prolonged blood residence time, capacity for BBB-targeted brain delivery (receptor-
mediated transcytosis across brain capillary endothelial cells), amenability to a scalable
and cost-effective manufacturing process, capacity to accommodate therapeutic agents
(small molecules, peptides, proteins, nucleic acids), chemical inertness (chemical
degradation/alteration, protein denaturation), and possible modulation of the drug

Introduction and aims
17
release profiles. There is experimental evidence to suggest that the size of NP for
effective brain drug delivery must be in the range 100-300 nm (68).
Dependent upon their method of formulation and constituent materials, nanoparticles
formulations may be divided into two broad types, namely: nanospheres and
nanocapsules. The method of choice for the formulation of nanoparticles of either type is
interfacial polymerisation (the mixing of an organic phase with an aqueous phase).
Differences in the two types of nanoparticle are manifested by their morphology and
architecture and also by the patterns characterising the drug distribution profile and the
rate of drug release. Drug molecules are localised at the central core of nanocapsules
whereas in nanospheres they are dispersed evenly throughout the matrix (Figure 1.9).
Nanocapsules offer the possibility for zero order release while nanospheres normally
exhibit first order release kinetics (69).
Figure 1.9: Schematic representation of the structure of nanospheres and nanocapsules for drug delivery (50).
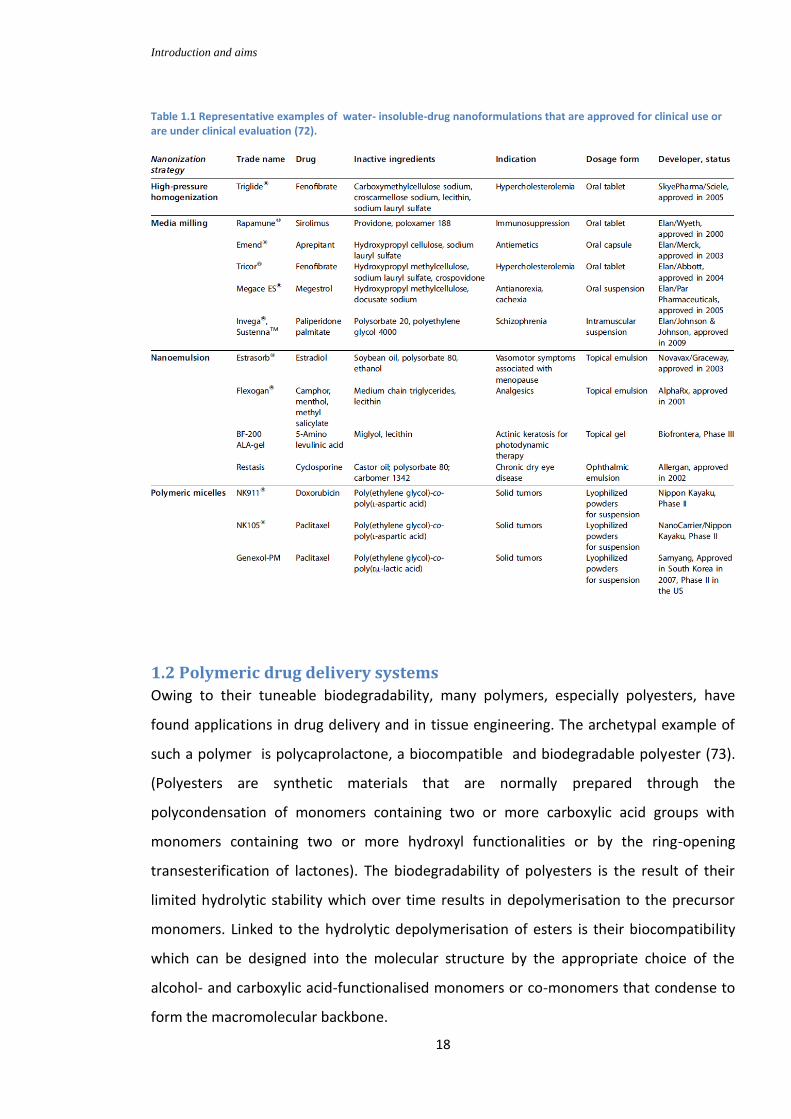
1.1.3 Nanoformulated drugs currently in clinical trials
Amongst the first nanoformulated (Table 1.1) drugs to be employed in CNS-targeted
clinical trials were glutathione-decorated liposomes, drug-protein conjugates (e.g.
ANG1005) and polyglutamate paclitaxel (70). The initial promise of these formulations has
stimulated considerable research activities in the use of nanoparticles as drug carriers,
with polyester-based structures finding particular favour amongst researchers because of
their molecular-design-determined biocompatibility and tuneable degradation properties
(71).
Introduction and aims
18
Table 1.1 Representative examples of water- insoluble-drug nanoformulations that are approved for clinical use or are under clinical evaluation (72).
1.2 Polymeric drug delivery systems
Owing to their tuneable biodegradability, many polymers, especially polyesters, have
found applications in drug delivery and in tissue engineering. The archetypal example of
such a polymer is polycaprolactone, a biocompatible and biodegradable polyester (73).
(Polyesters are synthetic materials that are normally prepared through the
polycondensation of monomers containing two or more carboxylic acid groups with
monomers containing two or more hydroxyl functionalities or by the ring-opening
transesterification of lactones). The biodegradability of polyesters is the result of their
limited hydrolytic stability which over time results in depolymerisation to the precursor
monomers. Linked to the hydrolytic depolymerisation of esters is their biocompatibility
which can be designed into the molecular structure by the appropriate choice of the
alcohol- and carboxylic acid-functionalised monomers or co-monomers that condense to
form the macromolecular backbone.

Introduction and aims
19
The polymeric carriers used in drug delivery systems may be categorised into natural and
synthetic. The latter materials may be subdivided into biopersistent and biodegradable
(Table 1.2) polymers. The former comprise stable materials that maintain their
physicochemical features in the physiological environment; they are eliminated from the
body without undergoing metabolism (51) and their therapeutic payloads are released by
diffusion through the polymeric matrix. By contrast, biodegradable polymers undergo
metabolic transformation at the physiological environment, which renders the kinetics for
their release highly sensitive to their biodegradation pathway. As long as biodegradable
materials are not amenable to biodegradation into cytotoxic products, the use of such
polymers is considered preferable to that of biopersistent molecules, in that
biodegradable polymeric materials allow for the complete release of the active (51).
The use of biodegradable polymers in drug delivery avoids issues relating to the fate of
the body of the depleted drug delivery device. Polymeric nanoparticles are most often
prepared by poly(D,L-lactide-co-glycolide), polylactic acid, polycaprolactone, poly-alkyl-
cyanoacrylates, chitosan and gelatin (57). The loading of drugs to nanoparticles may
reduce the side effects inherent in most therapeutic agents (e.g. Doxorubicin-loaded
nanoparticles have been shown to be less toxic than the free drug), and may afford
control over the release and biodistribution of the active, increase specificity, prolong
bioactivity and inhibit opsonisation or rapid elimination from circulation. It has been
claimed that nanoparticles have the capacity to protect anticancer drugs from
biotransformation and to delay clearance from the host (74). The thermodynamic stability
of nanoparticles renders them preferable drug-host structures to liposomes, both in
terms of stability during storage and in biological fluids where they offer in vivo
protection from proteases (75). Neha et al. (76) have outlined the following potentially
useful characteristics of polymeric nanoparticles to applications in drug delivery:
- in terms of efficiency and effectiveness, they offer a significant improvement over
traditional oral and intravenous methods of administration;
- they deliver a high concentration of pharmaceutical agent to the desired location;
- Tuneable drug-release profiles render polymeric nanoparticles ideal candidate
vehicles for cancer therapy and for the delivery of vaccines, contraceptives and
targeted antibiotics;

Introduction and aims
20
- Polymeric nanoparticles can be easily incorporated into other technologies
related to drug delivery, such as tissue engineering;
- Readily accessible nanoparticle formulations are often capable of affording
increased stability to volatile pharmaceutical agents.
Table 1.2 Classification of biodegradable polymers(73)
1.2.1 Poly(alkyl cyanoacrylate)s
Alkyl cyanoacrylates (ACA) are low viscosity compounds that are formed by the
condensation reaction of alkyl cyanoacetates and formaldehyde. The first report of a
cyanoacrylate dates back to 1949, but the importance of this class of molecules as
adhesives was not realised until 1959 (77). The physicochemical properties of
cyanoacrylates are determined by the length of their alkyl side chains. Considering their
proven biocompatibility following extensive use as medical adhesives, alkyl
cyanoacrylates have been investigated for their ability to form nanoparticulate vehicles
for biomedical applications; especially for the delivery of cancer drugs (78) and for the
Introduction and aims
21
transport of therapeutic agents across the BBB (79). Poly(alkyl cyanoacrylate)s are
colourless brittle materials that are susceptible to environmental degradation unless
stabilised by acidic stabilizers (80). The ease of degradation is inversely proportional to
the length of the alkyl chain (81, 82). Methyl cyanoacrylate, ethyl 2-cyanoacrylate, n-butyl
2-cyanoacrylate, isobutyl cyanoacrylate, isohexyl cyanoacrylate and octyl cyanoacrylate,
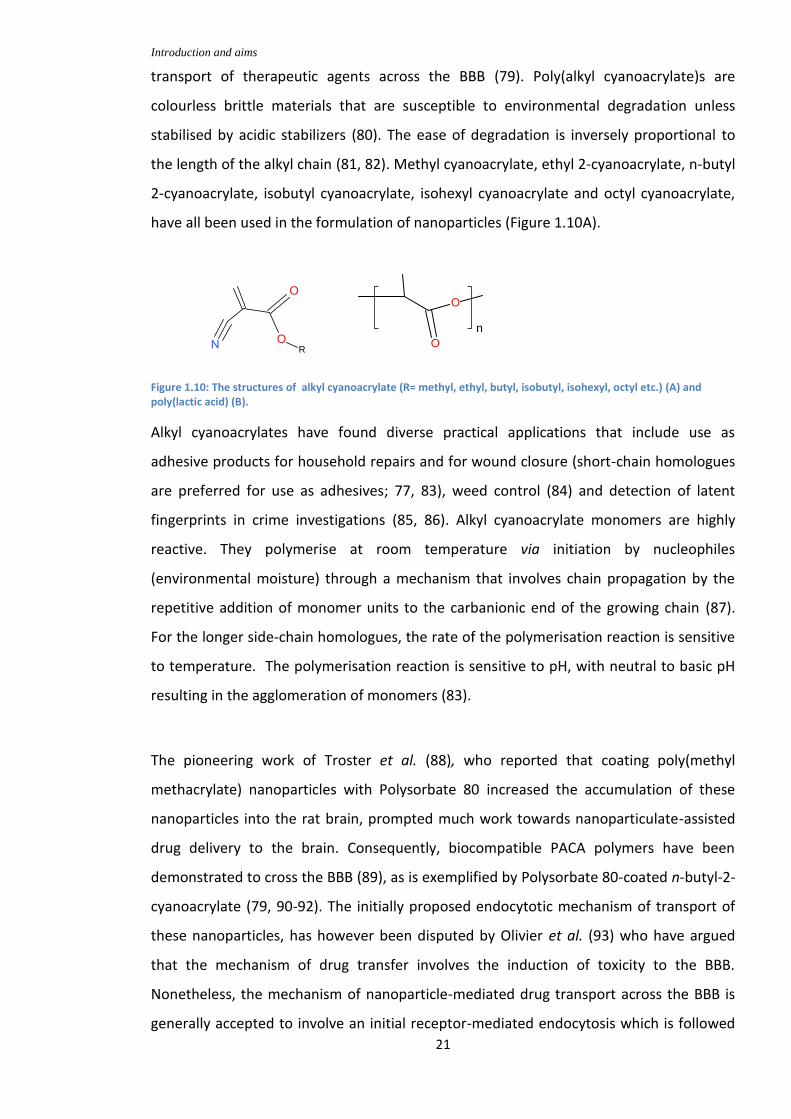
have all been used in the formulation of nanoparticles (Figure 1.10A).
Figure 1.10: The structures of alkyl cyanoacrylate (R= methyl, ethyl, butyl, isobutyl, isohexyl, octyl etc.) (A) and poly(lactic acid) (B).
Alkyl cyanoacrylates have found diverse practical applications that include use as
adhesive products for household repairs and for wound closure (short-chain homologues
are preferred for use as adhesives; 77, 83), weed control (84) and detection of latent
fingerprints in crime investigations (85, 86). Alkyl cyanoacrylate monomers are highly
reactive. They polymerise at room temperature via initiation by nucleophiles
(environmental moisture) through a mechanism that involves chain propagation by the
repetitive addition of monomer units to the carbanionic end of the growing chain (87).
For the longer side-chain homologues, the rate of the polymerisation reaction is sensitive
to temperature. The polymerisation reaction is sensitive to pH, with neutral to basic pH
resulting in the agglomeration of monomers (83).
The pioneering work of Troster et al. (88), who reported that coating poly(methyl
methacrylate) nanoparticles with Polysorbate 80 increased the accumulation of these
nanoparticles into the rat brain, prompted much work towards nanoparticulate-assisted
drug delivery to the brain. Consequently, biocompatible PACA polymers have been
demonstrated to cross the BBB (89), as is exemplified by Polysorbate 80-coated n-butyl-2-
cyanoacrylate (79, 90-92). The initially proposed endocytotic mechanism of transport of
these nanoparticles, has however been disputed by Olivier et al. (93) who have argued
that the mechanism of drug transfer involves the induction of toxicity to the BBB.
Nonetheless, the mechanism of nanoparticle-mediated drug transport across the BBB is
generally accepted to involve an initial receptor-mediated endocytosis which is followed
R
n

Introduction and aims
22
by transcytosis into the brain or by drug release within the endothelial cells (94). The use
of PBCA nanoparticles that are coated with Polysorbate 80 has received considerable
attention in drug delivery across the BBB (41). Significantly, PBCA nanoparticles that had
been loaded with Doxorubicin and overlaid with the non-ionic surfactant Polysorbate 80
are reported to be capable of reaching to the brain intact and of releasing their
Doxorubicin content following endocytotic uptake by brain blood endothelial cells (91).
The use of Polysorbate 80 coatings has been rationalised in terms of earlier work by
Kreuter et al.(92), who, on the basis of electron microscopy and fluorescent studies, had
suggested that drug-loaded nanoparticles coated with Polysorbate-80 undergo
phagocytic uptake by brain blood vessel endothelial cells. However, the matter is still
subject to considerable debate since other findings suggest that the uptake of PBCA
nanoparticles by the brain is consequent to interaction with the LDL-receptor by
mimicking the LDL-protein following association with Apolipoprotein E from blood plasma
(95).
1.2.2. Poly lactic acid (PLA)
Poly (lactic acid) (Figure 1.10B), PLA, is amongst the most commonly used biodegradable
polymers in therapeutic delivery, especially that of vaccines. The main criticism this
polymer has received relates to the generation of acidic micro environments during
degradation. PLAs are linear aliphatic thermoplastic polyesters (96) that are commonly
synthesised from the condensation of α-hydroxy acids. The basic building block for PLA is
lactic acid. PLA is susceptible to degradation by simple aqueous hydrolysis and undergoes
thermal degradation above 200°C. The respective glass transition and melt temperatures
of the material are at 55°C and 175°C (97). Owing to its excellent biocompatibility and
biodegradability (98), PLA has found uses in drug delivery. PLA has been utilised widely as
a structural polymer or co-polymer in the preparation of nanoparticles. Its combination
with glycolic acid to form poly (lactic-co-glycolic acid) (PLGA) is well documented, as is its
zero-length grafting attachment to modified dextran and also its combination with poly Ԑ-
caprolactone.
1.2.3. Polysaccharides
Dextran, a hygroscopic polysaccharide, is an odourless and tasteless white amorphous
powder which is insoluble in ethanol and diethyl ether but gradually soluble in water. The
constitutional repeat unit of dextran is glucose, which forms linear bonds of α-1,6

Introduction and aims
23
glycosidic linkages with few branches at the α-1,2, α-1,3 and α-1,4 positions (99, 100).
Apart from its common use in density centrifugation (to remove vasculature of a given
homogenate) (70, 101); dextran is a useful matrix material for drug delivery applications
since it exhibits properties of biocompatibility, degradability and non-immunogenicity
(102). The same material is often employed as surfactant or as copolymer in
nanoparticles fabrication, especially those of ACA-based structures (103), where it
imparts increased hydrophilicity by means of the considerable –OH functionalisation of
the pyranose ring. Notably, the α-1,6 polyglucose linkages of dextran are not susceptible
to cleavage by most endogenous cellular glycosidases (104). It is a polysaccharide that is
present in certain microorganisms, especially bacteria. Dextran, which is primarily utilised
by microorganisms as a structural support material and as an energy store, is also integral
to the immune-response mechanisms.
m
O
OH
OH
OH
O
O
OH
O
OH
O
n
Figure 1.11: The chemical structure of dextran.
Dextran has been used for several decades as a plasma volume expander. This highly
water soluble substance can be readily attached to drugs either directly or through
linkers. Studies have shown that both the distribution and the elimination of dextran are
influenced by the combined effects of molecular weight and surface charge of the
polymer. The degree of water solubility of dextran decreases with increased branching, as
has been exemplified by the controllable degrees of hydrophobicity that have been
obtained through modifications with alkyl glycerols of systematically varied chain lengths
(105). An in vitro study involving modified dextran has shown that chemically modified
dextran exhibits reduced rates of dextranase-induced depolymerisation as compared with
the unmodified material (105).

Introduction and aims
24
The use of dextran in such applications has been extended to nanoparticulate
formulations that could involve co-formulation with alkyl cyanoacrylates. Native dextran
has been used extensively as a surfactant in the formulation of poly(alkyl cyanoacrylate)s-
containing molecular structures (90, 93, 103, 106). The combined use of these materials
has been rationalised in terms of the capability of dextran to impart to alkyl
cyanoacrylates flexural strength and an increased capacity to accommodate a therapeutic
load for drug delivery applications. However, the observation that PECA-Dex structures
are susceptible to aggregation and to becoming brittle over time has stimulated further
research activities towards the development of alternative materials with improved long-
term stability.
Polymeric nanoparticles prepared from alkyl cyanoacrylates and dextran have shown
promise as carrier vehicles for drug delivery to the brain, as is exemplified by the
observed delivery of drugs and peptides across the BBB by means of Polysorbate 80-
coated formulations of PACA and dextran. The capability of the biodegradable PACA
macromolecules to act as carriers for drugs and fluorophores alike has been integral to
their utilisation in drug delivery (107). It is common practice to incorporate covalently
bonded fluorophore end groups into the polymer structure by initiating the
polymerisation reaction by means of nucleophilic fluorophores (108). Alternatively, the
fluorescent labelling may be achieved by nanoprecipitation of the preformed polymer
(109).
Derived from chitin, chitosan is regarded as a nontoxic, biocompatible and biodegradable
cationic polysaccharide. Chitosan is comprised of β(1,4)-linked 2-acetamido-2-deoxy-β-D-
glucan and 2-amino-2-deoxy-β-D-glucan. The commercial preparation of chitosan is
through alkaline deacetylation of chitin. Chitosan nanoparticles are prepared mainly by
the ionic gelation of chitosan through the tripolyphosphate anions method (110, 111).
Chitosan has been utilised widely in the development of controlled-release drug delivery
systems (51,112). Interestingly, chitosan nanoparticles have been described as an
efficient vehicle for the delivery of insulin through the nasal mucosa (113).

Introduction and aims
25
1.2.4. Polycyanoacrylates
The chemical stability of PACA has been shown to be sensitive to the nature of the
initiator and the method employed for the polymerisation, and also by the length of alkyl
side chains. PACAs are susceptible to biodegradation both at the backbone C―C bond
(due to the presence of the strongly electron withdrawing cyanate group) and at the ester
linkage (by hydrolysis). The ease of hydrolytic degradation to the alkyl alcohol and to
poly(alkyl cyanoacrylic acid) has been observed to decrease with increasing length of the
side chain. Backbone (C―C) degradation occurs by the unzipping of the polymer chains in
a depolymerisation process that produces the precursor monomer (108).
The ease with which ACA monomers undergo polymerisation reactions to form PACA,
coupled with the biocompatibility of PACA and its biodegradability to innocuous products,
render this polymer a suitable structural material for the fabrication of drug carrier
structures (58). Conventionally ACA is polymerised in acidified water using a two phase
polymerisation process that affords control over particle size has been argued however
that this slow process and yields a particle size distribution that is broader than that
which can be obtained with ethanol/water systems (114). The easy accessibility and ready
availability of ECA renders this monomer the cyanoacrylate of choice for nanoparticle
formulation for anionic emulsion polymerisation reaction via initiation by the hydroxyl
group of water or the nucleophilic centre of other initiator molecules such as amines
(114). The amino group of proteins, has been utilised as an initiating moiety in the
polymerisation of ECA as exemplified by the reaction with Bovine serum albumin (BSA),
where the protein molecules are also claimed to serve as stabilizer surfactants (114).
Adjustment of the pH affords control over the size distribution of PACA nanoparticles
(115) whereas the hydrophobicity of the same nanoparticles may be tuned by adjusting
the length of the side chain such that control may be exerted over the capacity of
nanoparticles to swell in biological fluids (116). Transmission electron microscopy (TEM)
has shown that PECA nanoparticles are structured as a highly porous but dense polymeric
matrix with high surface area that facilitates the entrapment of wide range of drug
molecules (117). Clinical trials of formulations of PACA for drug delivery applications have
not unmasked any metabolites-related toxic effects of notable significance (118).
M

Introduction and aims
26
1.3. Methods for the preparation of nanocarriers
The variants of the two main methods of choice for the preparation of nanoparticles,
dispersion of preformed polymer and polymerisation of monomers, have been reviewed
by Rao and Geckeler (119). Nanoparticles formation by the dispersion of preformed
polymers may involve solvent evaporation, nanoprecipitation, salting out, dialysis, rapid
expansion of supercritical solution (RESS) and rapid expansion of supercritical solution
into liquid solvent (RESOLV). The formation of nanoparticles by the polymerisation of
monomers may utilise the techniques of micro-emulsion, mini-emulsion, surfactant-free
emulsion or interfacial polymerisation. The method of nanoparticle preparation is
determined by the chemical structure of the adopted matrix, which in turn is selected
according to the requirements of size and of the proposed use (120).
Other methods that have been utilised for the preparation of nanoparticles for drug
delivery include: (i) freezing-induced phase separation (121); (ii) emulsion solvent
evaporation (122); (iii) single emulsion–solvent evaporation technique, which has been
claimed to be the best general method of encapsulating hydrophobic molecules into
nanoparticles; and, (iv) miniemulsion, which has been utilised for the co-formulation of
paclitaxel and PBCA (123).
Bertholon et al. (124) in their studies of redox and anionic emulsion polymerisation of
nanoparticulate PACA have shown that low (highly acidic) pH leads to the formation of
higher molecular weight and higher average particle size than corresponding
nanoparticles prepared at higher pH. The same group of workers speculated that the
higher molecular weight polymers formed as a result of the highly acidic pH making fewer
OH groups available for the initiation of polymerisation.
1.4. Characterisation techniques
Integral to the characterisation of nanoparticles is the determination of size,
polydispersity index (PDI), zeta potential, texture morphology and thermal stability.
Particle size and its distribution influence such key properties as stability in suspension,
viscosity, surface area, and parking density. For biomedical applications, size also impacts
on the capability of therapeutic agents-loaded nanoparticles to penetrate deeply into
tissues through the narrow capillary route and further to penetrate cells; amongst other

Introduction and aims
27
techniques, the sizes of nanoparticles may be determined by DLS, TEM, NTA, SEM, and
AFM.
Zeta potential provides a measure of the stability of nanoparticles in a given medium.
Zeta potential values above 30 mV (-ve or +ve) are normally considered indicative of good
colloidal stability as it indicates that the electrostatic repulsion between neighbouring
nanoparticles is greater than the antagonistic van der Waals forces of attraction,
preventing aggregation or precipitation (125); zeta potential may be determined by
dynamic electrophoretic mobility. The preparation of nanoparticles of narrow size
distribution, as measured by the PDI, is prerequisite to the reproducible behaviour of
vehicles intended for systemic use.
1.4.1. Elemental analysis
The technique used for the determination of elemental C, H, and N and S is based on the
quantitative “dynamic flash combustion” method (Figure 1.12). The samples are held in a
tin capsule, placed inside the autosampler drum where they are purged by a continuous
flow of helium and dropped at pre-set intervals into a vertical quartz tube maintained at
900°C. When the samples are placed inside the furnace, the helium stream is temporarily
enriched with pure oxygen, the sample melts and the tin promotes a violent reaction
(flash combustion); under these conditions even thermally resistant substances are
oxidised fully. Quantitative combustion is then achieved by passing the mixture of gases
over a catalyst layer. The mixture of combustion gases is then passed over copper to
remove the excess oxygen and to reduce the nitrogen oxides to elemental nitrogen. The
resulting mixture is then directed to the chromatographic column where the individual
components are separated and eluted with the help of a thermal conductivity detector
(TCD) whose signal feeds the automatic EAGER300™ workstation as nitrogen, carbon
dioxide, sulphur dioxide and water. The instrument is calibrated with the analysis of
standard compounds using the K factors calculation or linear regression method
incorporated in the EAGER300™ software.
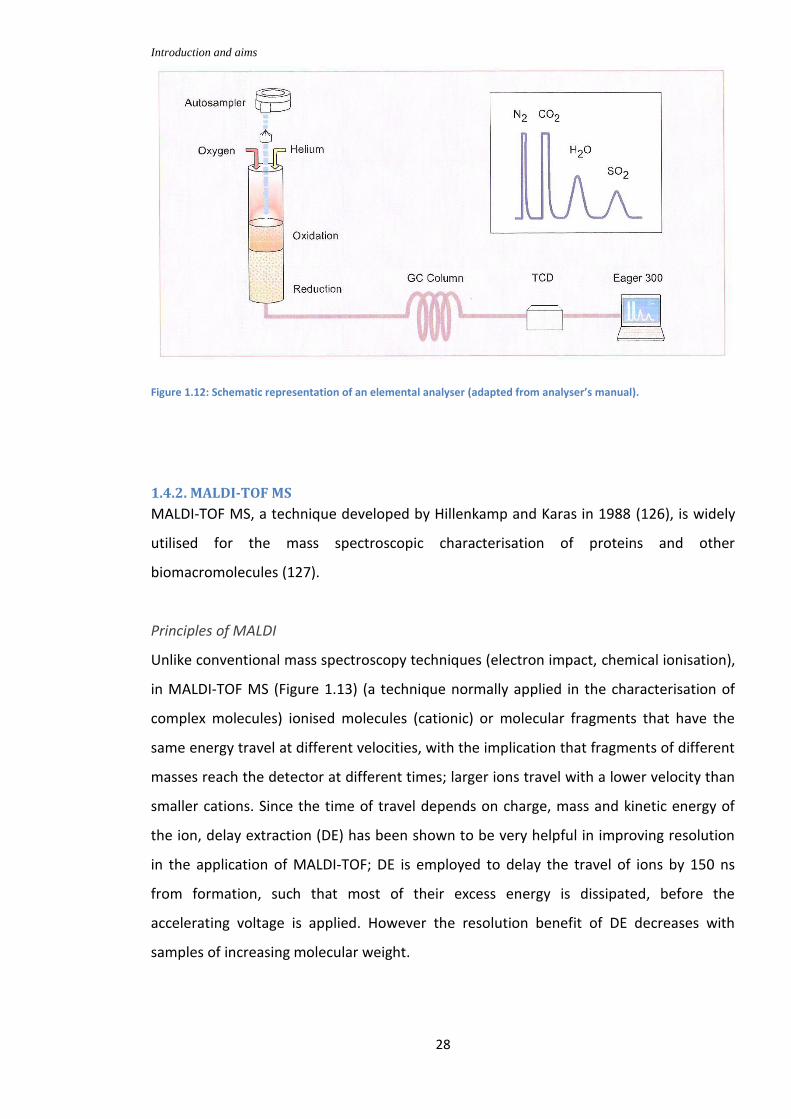
Introduction and aims
28
Figure 1.12: Schematic representation of an elemental analyser (adapted from analyser’s manual).
1.4.2. MALDI-TOF MS
MALDI-TOF MS, a technique developed by Hillenkamp and Karas in 1988 (126), is widely
utilised for the mass spectroscopic characterisation of proteins and other
biomacromolecules (127).
Principles of MALDI
Unlike conventional mass spectroscopy techniques (electron impact, chemical ionisation),
in MALDI-TOF MS (Figure 1.13) (a technique normally applied in the characterisation of
complex molecules) ionised molecules (cationic) or molecular fragments that have the
same energy travel at different velocities, with the implication that fragments of different
masses reach the detector at different times; larger ions travel with a lower velocity than
smaller cations. Since the time of travel depends on charge, mass and kinetic energy of
the ion, delay extraction (DE) has been shown to be very helpful in improving resolution
in the application of MALDI-TOF; DE is employed to delay the travel of ions by 150 ns
from formation, such that most of their excess energy is dissipated, before the
accelerating voltage is applied. However the resolution benefit of DE decreases with
samples of increasing molecular weight.

Introduction and aims
29
Sample preparation
The sample preparation stage is critical in the quality of the spectrum produced in MALDI-
TOF spectrometry. Amongst the methods of sample preparation, the dried-droplet
method has become the most widely utilised: a saturated matrix solution is mixed with
the analyte at the ratio of 5000:1, and an aliquot of about 0.5 µl is placed on the sample
receptor where is dried under vacuum before ionisation. Other approaches to sample
preparation include: thin and thick layer (127), fast-vaporisation, electrospray, matrix-
precoated layer, particle-doped (two phase liquid) and chemical-liquid (128) methods.
Figure 1.13: Schematic representation of the MALDI instrument (128).
The advent of MALDI has offered many advantages in the analysis of macromolecules as
compared with conventional chromatographic techniques. These include the capability to
determine absolute molecular weight irrespective of macromolecular structure, the ease
of use (the technique imposes few demands in terms of instrument- and sample-
preparation procedures), and the capability to characterise molecules of <20 kDa (128,
129). However, the technique is regarded as complementary to chromatographic
methods since it is not suitable for the study of macromolecules with PDI >1.6 or for the
analysis of complex mixtures of surfactants. Most importantly, MALDI is of little
usefulness in the analysis of macromolecules that do not possess chemical functionalities
that are capable of stabilising the prerequisite cationic structure at the gaseous phase
(128).

Introduction and aims
30
The vaporisation and ionisation technique is widely used in the characterisation of
biomolecules by MALDI-TOF. This is a non-destructive technique that vaporises and
ionises large and small biomolecules without promoting fragmentation (Figure 1.14 ). To
this end, the sample to be analysed is incoporated first into a matrix (e.g. 2,5
dihydroxybenzoic acid (130, 131), which is in excess of the analyte and functions by
absorbing strongly the energy of a laser source thereby facilitating for vaporisation of the
analyte. In doing this, it also serves as proton donor for the analyte thereby facilitating
ionisation and subsequent analysis by the detector (linear time-of-flight (TOF) analyzer,
TOF reflectron or fourier transformed mass analyzer).
Figure 1.14: Non-destructive vaporisation and ionisation of biomolecules by MALDI TOF (126)
The usefulness of mass spectrometry methods in the identification and characterisation
of unknown compounds is twofold, in that it allows the:
a. Determination of the molecular mass of the compound under study; mild direct
ionisation techniques allow the detection of the highest m/z ratio ion which often
corresponds to an isotopic form of the intact, ionised molecule, while chemical
ionisation techniques (e.g. ESI, MALDI) typically identify the protonated or
deprotonated form of the molecule.
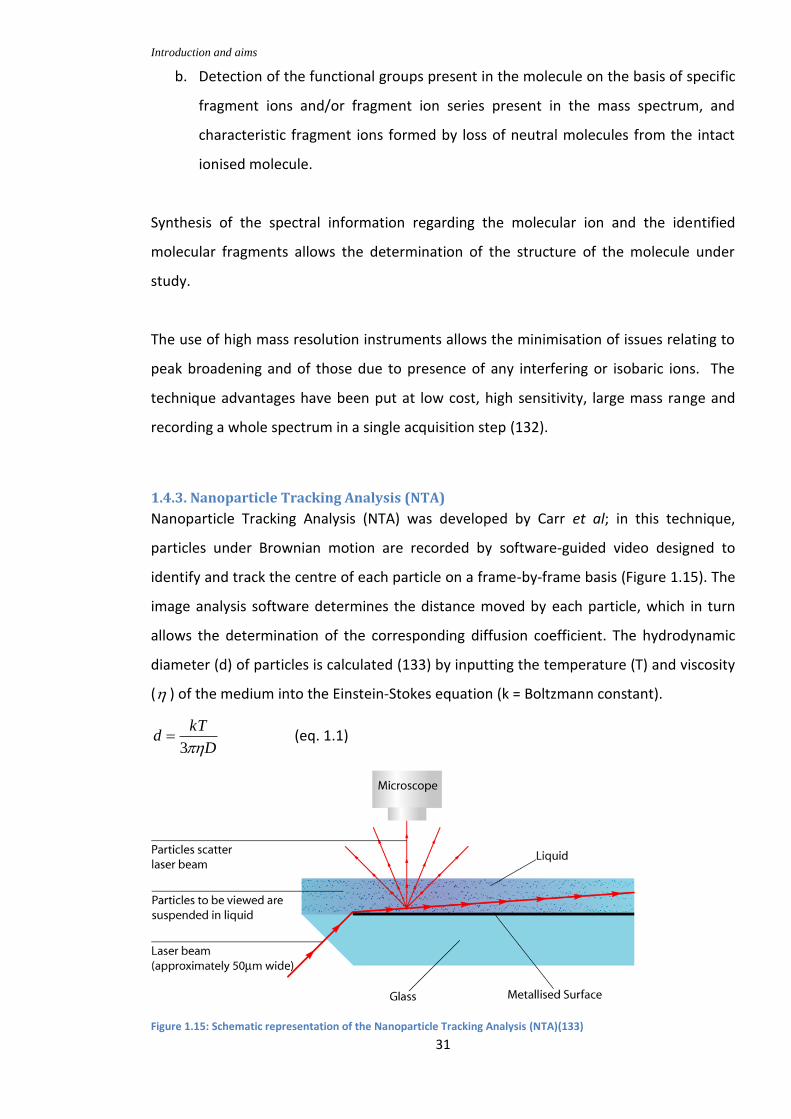
Introduction and aims
31
b. Detection of the functional groups present in the molecule on the basis of specific
fragment ions and/or fragment ion series present in the mass spectrum, and
characteristic fragment ions formed by loss of neutral molecules from the intact
ionised molecule.
Synthesis of the spectral information regarding the molecular ion and the identified
molecular fragments allows the determination of the structure of the molecule under
study.
The use of high mass resolution instruments allows the minimisation of issues relating to
peak broadening and of those due to presence of any interfering or isobaric ions. The
technique advantages have been put at low cost, high sensitivity, large mass range and
recording a whole spectrum in a single acquisition step (132).
1.4.3. Nanoparticle Tracking Analysis (NTA)
Nanoparticle Tracking Analysis (NTA) was developed by Carr et al; in this technique,
particles under Brownian motion are recorded by software-guided video designed to
identify and track the centre of each particle on a frame-by-frame basis (Figure 1.15). The
image analysis software determines the distance moved by each particle, which in turn
allows the determination of the corresponding diffusion coefficient. The hydrodynamic
diameter (d) of particles is calculated (133) by inputting the temperature (T) and viscosity
( ) of the medium into the Einstein-Stokes equation (k = Boltzmann constant).
D
kTd
3 (eq. 1.1)
Figure 1.15: Schematic representation of the Nanoparticle Tracking Analysis (NTA)(133)

Introduction and aims
32
1.4.4. Zeta potential determination
There exist two layers around a particle that is suspended in an electrolytic solution,
namely: the Stern layer and inner region, where the ions are bound strongly; and the
outer, diffuse region, where the ions are bound less strongly (Figure 1.16). The net
surface charge of particles determines the distribution of ions surrounding it, effecting
the formation of an electrical double layer around each particle. Zeta potential is used to
determine the magnitude of the interaction between charges in a system, and provides a
measure of surface charge. Thus, zeta potential is the energy difference that exists at this
boundary. Colloidal systems with a zeta potential between +30 and -30 are normally
considered stable (134).
Figure 1.16: Schematic representation of particles and surround charges (134)
1.4.5 TGA
Thermogravimetric analysis TGA (135) is a method of thermal analysis in which changes in
the physical and chemical properties of materials are monitored either as a function of
increasing temperature (at constant heating rate), or as a function of time (at constant
temperature and/or constant mass loss). TGA is used to study the decomposition and
thermal stability of materials under specified conditions and to examine the kinetics of
the physicochemical processes occurring within a sample. The technique is commonly
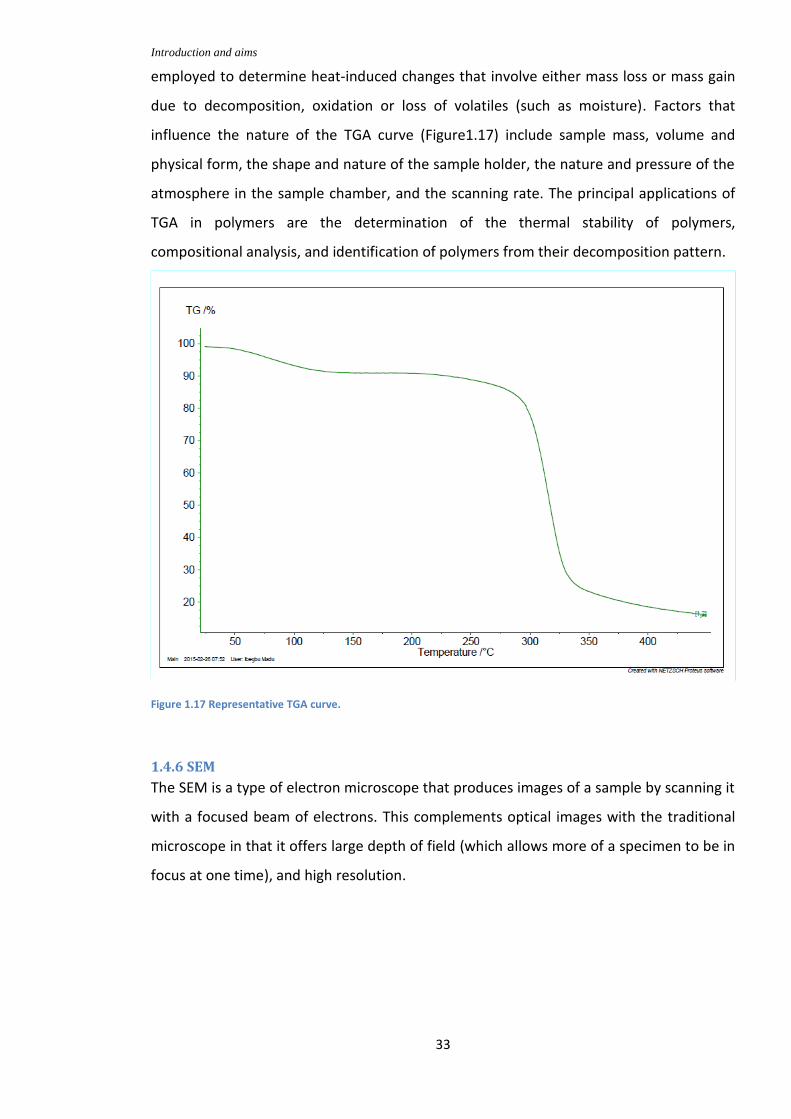
Introduction and aims
33
employed to determine heat-induced changes that involve either mass loss or mass gain
due to decomposition, oxidation or loss of volatiles (such as moisture). Factors that
influence the nature of the TGA curve (Figure1.17) include sample mass, volume and
physical form, the shape and nature of the sample holder, the nature and pressure of the
atmosphere in the sample chamber, and the scanning rate. The principal applications of
TGA in polymers are the determination of the thermal stability of polymers,
compositional analysis, and identification of polymers from their decomposition pattern.
Figure 1.17 Representative TGA curve.
1.4.6 SEM
The SEM is a type of electron microscope that produces images of a sample by scanning it
with a focused beam of electrons. This complements optical images with the traditional
microscope in that it offers large depth of field (which allows more of a specimen to be in
focus at one time), and high resolution.

Introduction and aims
34
Figure 1.18 Scanning electron microscope (136)
The electron beam scans the surface line by line to produce the image (Figure 1.18); since
metals are conductive, their samples do not require pre-imaging treatment but non-
metals need treatment that renders them conductive; this may involve coating with gold,
graphite or other electrically conducting materials in a sputter coater. The sample to be
coated is fixed on a stub and placed under vacuum. The interaction of electron with the
sample produces many signals which include secondary electrons (SE), back-scattered
electrons (BSE), characteristic X-rays, light (cathodoluminescence) (CL), specimen current
and transmitted electrons. The signals result from interactions of the electron beam with
atoms at or near the surface of the sample. Secondary electrons and backscattered
electrons are commonly used for imaging samples.

Introduction and aims
35
1.5. Aim of the study
Amongst the approaches towards the delivery of therapeutic agents to the brain without
compromising the integrity of the BBB, the utilisation of polymeric nanoparticulate drug-
carrier vehicles – the focus of this work – has gained considerable following amongst
researchers. The objectives of this study are to:
i) synthesise amphiphilic dextran derivatives through functionalisation with alkyl glycidyl
ethers;
ii) use these modified dextrans in combination with alkyl cyanoacrylates (ACA) for the
preparation of well-defined nanoparticles;
iii) study the capability of these nanoparticles to act as carriers for fluorescent-marker
molecules and for small molecule drugs; and,
iv) investigate the biodegradability and the potential toxicity of these nanoparticles, and
assess any associated interactions for the purpose of evaluating promise in therapeutic
applications.

Chemical modification of dextrans
36
2
2. Chemical modifications of dextran
The chemical modification of dextrans has been rationalised in terms of the capability of
dextran to impart to alkyl cyanoacrylates flexibility and an increased capacity to
accommodate a therapeutic load for drug delivery applications. However, the observation
that PECA-Dex structures are susceptible to aggregation and to becoming brittle over
time has stimulated further research activities towards the development of alternative
materials with improved long-term stability. The functionalisation of dextrans with alkyl
glyceryl moieties represents one of the approaches towards that goal.
2.1 Dextran
Dextran is an odourless and tasteless hygroscopic white powder that is insoluble in
ethanol or diethyl ether but dissolves gradually in water. It is a polysaccharide that is
present in certain microorganisms, especially bacteria. Dextran, which is primarily utilised
by microorganisms as a structural support material and as an energy store, is also integral
to the immune-response mechanisms.
The chemical structure of dextran (Figure 2.1) is that of a neutral polysaccharide that has
glucose as its sole constitutional repeat unit. The glucose moieties form linear bonds at
the α-1, 6 glycosidic linkages (more than 95% of the chain) with few branches at the α-
1,2, α-1,3 and α-1,4 linkages (99, 100). Owing to its glucose-based structure, dextran is
characterised by biocompatibility, degradability and non-immunogenic properties which
render it a useful structural material for biomedical applications (102). The use of dextran
in such applications has been extended to nanoparticulate formulations that often involve
co-formulation with alkyl cyanoacrylates (24, 93, 137).

Chemical modification of dextrans
37
Figure 2.1: The chemical structure of dextran
The –OH functionalities render dextran a molecule that is readily amenable to structural
modification (138). Consequently, a number of modified dextrans have been prepared in
which aromatic rings or aliphatic chains are attached to the molecular structure (139-
144). For example, dextran that had been modified by esterification with benzoic acid and
valeric acid has been used in protein partitioning (145). In other examples, Rouzes et al.
(98) utilised hydrophobically modified dextran as a surfactant for the preparation of
nanoparticles with well-defined surface properties, while Sadtler et al. (146) reported its
use in the stabilisation of oil-in-water emulsions. Dextran derivatives with good chemical
stability at extreme pH environments have been achieved through functionalisation with
1,2-epoxydodecane (144). The chemical modifications of dextran have been extended to
attempts to obtain amphiphilic polymers which are capable of forming micellar structures
that can associate with organic solutes at the hydrophobic domain. Rotureau et al. (141)
have shown that lipophilic modification of dextran through linkage with aromatic or
aliphatic hydrocarbons results in macromolecular structures of controlled amphiphilicity.
The amphiphilic nature of modified dextrans renders these materials suitable
components for the fabrication of nano-sized structures of well-defined size, as is
exemplified by the work of Rouzes et al. (147) who utilised such materials in combination
with PLA to produce nanomaterials in the 150-200 nm range, and that of others who
utilised amphiphilic dextrans as surface-modification components of both nano- and
micro-sized drug delivery systems (147, 148). Native dextran has been used extensively as
α-1,6
α-1,3
...........
α-1,6
...........

Chemical modification of dextrans
38
a surfactant in the preparation of poly(alkyl cyanoacrylate)s-based structures (24, 90, 93,
103). The combined use of these materials has been rationalised in terms of the capability
of dextran to impart to alkyl cyanoacrylates flexibility and an increased capacity to
accommodate a therapeutic load for drug delivery applications. However, the observation
that PECA-Dex structures are susceptible to aggregation and to becoming brittle over
time has stimulated further research activities towards the development of alternative
materials with improved long-term stability. The functionalisation of dextrans with alkyl
glyceryl moieties represents one of the approaches towards that goal.
2.1.1 Chemical structure of oxiranes for synthesis of alkyl-glyceryl dextrans
Various chain lengths of oxiranes were used in the modification of dextran, these includes
butyl glycidyl ether, octyl glycidyl ether, glycidyl lauryl ether, tetradecyl glycidyl ether, and
hexadecyl glycidyl ether (Figure 2.2)
O On
Figure 2.2 Chemical structure of alkyl glycidyl ether where n=1, butyl; n=5,octyl; n=9, lauryl; n=11,tetradecyl; n=13 hexadecyl.
2.2 Materials and instrumentation
Dextrans from Leuconostoc spp. (MW 6 kDa and 100 kDa), dimethyl sulfoxide (DMSO,
anhydrous, ≥ 99.9)%), potassium tert-butoxide (t-BuOK; reagent grade > 97 %), butyl
glycidyl ether, octyl/decyl glycidyl ethers, glycidyl lauryl ether, tetradecyl glycidyl ethers
and hexadecyl glycidyl ether were all obtained from Sigma-Aldrich UK.
TGA analysis was carried out with TG 209 F1 Libra (TGA from Netzsch Instruments), with
temperature ranged from 25 to 500°C, heating at 10K/min. under Nitrogen atmosphere.
A Büchi Rotovapor (R-200) powered with a Sogevac Saskia PIZ 100 vacuum pump
equipped with a liquid nitrogen trap was used to remove solvents under reduced
pressure during the process of modified dextrans purification, Dialysis was performed
using Visking membrane tubing (Medicell International Ltd, UK) with cut-off either 12-14
kDa or 3.5 kDa in a discontinuous system (10.0 L deionised water (15.0 mΩ); exchanged 3
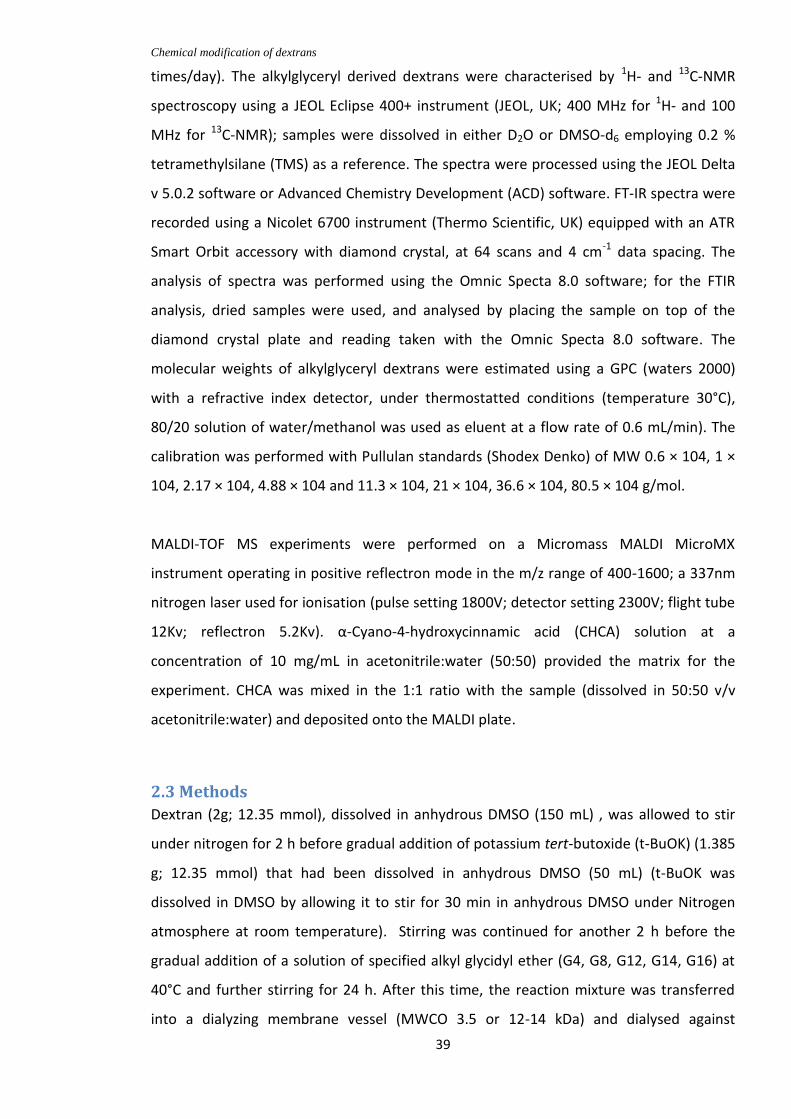
Chemical modification of dextrans
39
times/day). The alkylglyceryl derived dextrans were characterised by 1H- and 13C-NMR
spectroscopy using a JEOL Eclipse 400+ instrument (JEOL, UK; 400 MHz for 1H- and 100
MHz for 13C-NMR); samples were dissolved in either D2O or DMSO-d6 employing 0.2 %
tetramethylsilane (TMS) as a reference. The spectra were processed using the JEOL Delta
v 5.0.2 software or Advanced Chemistry Development (ACD) software. FT-IR spectra were
recorded using a Nicolet 6700 instrument (Thermo Scientific, UK) equipped with an ATR
Smart Orbit accessory with diamond crystal, at 64 scans and 4 cm-1 data spacing. The
analysis of spectra was performed using the Omnic Specta 8.0 software; for the FTIR
analysis, dried samples were used, and analysed by placing the sample on top of the
diamond crystal plate and reading taken with the Omnic Specta 8.0 software. The
molecular weights of alkylglyceryl dextrans were estimated using a GPC (waters 2000)
with a refractive index detector, under thermostatted conditions (temperature 30°C),
80/20 solution of water/methanol was used as eluent at a flow rate of 0.6 mL/min). The
calibration was performed with Pullulan standards (Shodex Denko) of MW 0.6 × 10⁴, 1 ×
104, 2.17 × 10⁴, 4.88 × 10⁴ and 11.3 × 10⁴, 21 × 104, 36.6 × 10⁴, 80.5 × 10⁴ g/mol.
MALDI-TOF MS experiments were performed on a Micromass MALDI MicroMX
instrument operating in positive reflectron mode in the m/z range of 400-1600; a 337nm
nitrogen laser used for ionisation (pulse setting 1800V; detector setting 2300V; flight tube
12Kv; reflectron 5.2Kv). α-Cyano-4-hydroxycinnamic acid (CHCA) solution at a
concentration of 10 mg/mL in acetonitrile:water (50:50) provided the matrix for the
experiment. CHCA was mixed in the 1:1 ratio with the sample (dissolved in 50:50 v/v
acetonitrile:water) and deposited onto the MALDI plate.
2.3 Methods
Dextran (2g; 12.35 mmol), dissolved in anhydrous DMSO (150 mL) , was allowed to stir
under nitrogen for 2 h before gradual addition of potassium tert-butoxide (t-BuOK) (1.385
g; 12.35 mmol) that had been dissolved in anhydrous DMSO (50 mL) (t-BuOK was
dissolved in DMSO by allowing it to stir for 30 min in anhydrous DMSO under Nitrogen
atmosphere at room temperature). Stirring was continued for another 2 h before the
gradual addition of a solution of specified alkyl glycidyl ether (G4, G8, G12, G14, G16) at
40°C and further stirring for 24 h. After this time, the reaction mixture was transferred
into a dialyzing membrane vessel (MWCO 3.5 or 12-14 kDa) and dialysed against

Chemical modification of dextrans
40
deionised water (10.0 L; exchanged 3x per day) over five days. The content of the dialysis
vessel (ca. 400 mL) was washed with diethyl ether or with DCM (3× 150 mL) to remove
impurities and any unreacted ether. Traces of volatile solvents were removed using the
rotary evaporator (reduced pressure, 50°C) and the sample was again subjected to the
dialysis procedure (48 h) before lyophilisation with a Virtis freeze dryer (<-85°C, for 48h)
to yield the corresponding alkylglyceryl dextrans, which were characterised using FTIR,
1H- and 13C-NMR spectroscopy, GPC, MALDI-TOF MS, SEM and TGA. Yields were in the
range 40-60%.
2.4 Results and Discussion
2.4.1 Synthesis of alkylglyceryl dextrans
The modification of dextrans with alkyl glycidyl ethers (Figure 2.3) was carried out by
attaching alkylglyceryl side chains to the hydroxyl groups through two-step reactions
which involved the conversion of the hydroxyl groups of the pyranose rings of dextran
into the more reactive alcoholates and subsequent reaction with specified alkyl glycidyl
ethers (149). The synthesis was carried out, at 40°C, in anhydrous DMSO and under a
nitrogen atmosphere for 24 h; similar modification of dextran are well documented in the
literature (139, 141, 144, 150). The reactivity of the –OH pyranose ring of the glucose unit
is in the order 2>4>3.

Chemical modification of dextrans
41
Figure 2.3: Scheme for the synthesis of alkylglyceryl dextrans
Native dextrans with a molecular weight of either 6 kDa or 100 kDa were modified by
covalent attachment of alkylglyceryl pendent chains to their hydroxyl groups. This was
carried out by means of a series of commercially available alkyl glycidyl ethers of different
chain lengths: butyl glycidyl ether (G4; 1H NMR, 13C-NMR; Appendix 1), octyl glycidyl ether
(G8), glycidyl lauryl ether (G12), tetradecyl glycidyl ether (G14; 1H-NMR, 13C-NMR;
Appendix 2), and hexadecyl glycidyl ether (G16; 1H-NMR, 13C-NMR; Appendix 3). The
reactions produced a range of alkylglyceryl dextrans: butylglyceryl dextrans (Dex100G4 or
Dex6G4), octylglyceryl dextrans (Dex100G8 or Dex6G8), laurylglyceryl dextrans
(Dex100G12 or Dex6G12), tetradecylglyceryl dextrans (Dex6G14 or Dex100G14) and
hexadecylglyceryl dextrans (Dex100G16 or Dex6G16); the numbers 6 and 100 represent
the molecular weight of the dextrans while 4, 8, 12, 14, 16 represent the chain lengths of
alkyl glycidyl ethers used for the modification of dextrans.
Hexadecyl glyceryl dextran was prepared in two-step reactions which involved conversion
of OH group to more reactive alcoholate with t-BuOK and subsequent reaction with the
specified glycidyl ether; other dextran derivatives were synthesised through the same
procedure.
t-BuOKN2 atm. 24 h.
m=3; G4m=7; G8m=11; G12m=13; G14m=15; G16
m=3; DexG4m=7; DexG8m=11; DexG12m=13; DexG14m=15; DexG16
m
R = H or m

Chemical modification of dextrans
42
2.4.2 Characterisation of the alkylglyceryl dextrans
2.4.2.1 NMR and FTIR
The modified dextran structures were confirmed by FTIR and NMR spectroscopy. The
modification of the dextran was assessed by comparing the 1H-NMR spectrum of the
modified dextrans (examples in Figures 2.4 and 2.5) with that of the native material
(Figure 2.6): the presence of resonances at 0.87 ppm, 1.3 ppm and 1.4 ppm confirmed the
successful functionalisation of dextran. Similar results were obtained for butyl, octyl,
lauryl and tetradecyl dextrans. Table 2.1 summarises the DS% of the modified dextrans.
The successful synthesis of alkylglyceryl dextran was consistent with FTIR spectroscopy
data: the grafting of alkyl glyceryl chains resulted in the formation of a new secondary
alcohol. The band at 1012 cm−1 is assigned to the vibrational mode of C –O. In crystalline
dextran, two absorption peaks at 851 and at 914 cm−1 were observed, respectively
assigned to (C–C) and (C–H) bending modes. It has been proposed that the absorption
bands in the spectral range between 1200 and 1500 cm−1 are mainly due to CH
deformation vibrations and (COH) bending vibrations (151). The bands at 2921 cm-1 and
at 3215 cm-1 are respectively consistent with (C–H) and (O–H) stretching vibrations
(Figure 2.7 and Figure 2.8).
SEM images of native dextran and of Dex100G4 visualised the morphology of these
materials (Appendix 13).
The enumeration of the degree of substitution (Table 2.1), as expressed by the
percentage of substituted saccharide units carrying an alkylglycerol group, was achieved
by 1H-NMR through the comparison of the ratio of integral of the intensity of the terminal
methyl group of alkyl glycerol (IA) with that of the anomeric proton of the glucopyranose
ring (IB); (equation 2.1; Table 2.1).

Chemical modification of dextrans
43
P3069JT_PROTON-3.jdf
5.0 4.5 4.0 3.5 3.0 2.5 2.0 1.5 1.0
Chemical Shift (ppm)
0.1
0.2
0.3
0.4
0.5
0.6
0.7
0.8
0.9
1.0
Norm
alized Inte
nsity
Figure 2.4: 1H-NMR spectrum of alkyl glyceryl dextran (Dex100G16)
P4039EB_PROTON-3 EA4.esp
5.0 4.5 4.0 3.5 3.0 2.5 2.0 1.5 1.0
Chemical Shift (ppm)
0
0.05
0.10
0.15
0.20
0.25
0.30
0.35
0.40
0.45
Norm
alized Inte
nsity
Figure 2.5: 1H-NMR spectrum of butyl alkyl glyceryl dextran (Dex100G4)
b
a
a b

Chemical modification of dextrans
44
P3054JT_PROTON-3.esp
5.0 4.5 4.0 3.5 3.0 2.5
Chemical Shift (ppm)
0
0.05
0.10
0.15
0.20
0.25
0.30
Norm
alized Inte
nsity
Figure 2.6: 1H-NMR of native dextran
100*3
%B
A
I
IDS ) (eq. 2.1)
Table 2.1: The degree of substitution of the synthesised glyceryl dextrans.
DexnGm DS (%)
Dex6G4 87.70
Dex100G4 68.49
Dex6G8 114.94
Dex100G8 64.91
Dex6G12 54.35
Dex100G12 67.56
Dex6G16 55.56
Dex100G16 144.92

Chemical modification of dextrans
45
Figure 2.7: FTIR of butyl glyceryl dextran (Dex100G4)
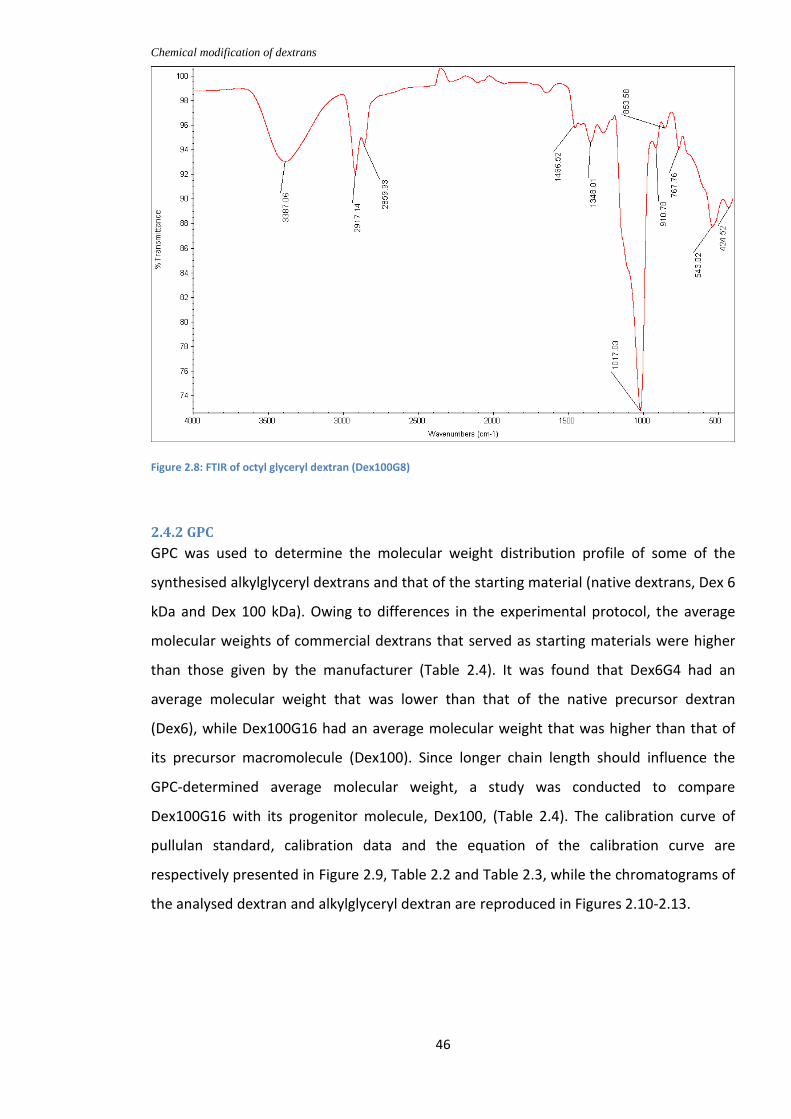
Chemical modification of dextrans
46
Figure 2.8: FTIR of octyl glyceryl dextran (Dex100G8)
2.4.2 GPC
GPC was used to determine the molecular weight distribution profile of some of the
synthesised alkylglyceryl dextrans and that of the starting material (native dextrans, Dex 6
kDa and Dex 100 kDa). Owing to differences in the experimental protocol, the average
molecular weights of commercial dextrans that served as starting materials were higher
than those given by the manufacturer (Table 2.4). It was found that Dex6G4 had an
average molecular weight that was lower than that of the native precursor dextran
(Dex6), while Dex100G16 had an average molecular weight that was higher than that of
its precursor macromolecule (Dex100). Since longer chain length should influence the
GPC-determined average molecular weight, a study was conducted to compare
Dex100G16 with its progenitor molecule, Dex100, (Table 2.4). The calibration curve of
pullulan standard, calibration data and the equation of the calibration curve are
respectively presented in Figure 2.9, Table 2.2 and Table 2.3, while the chromatograms of
the analysed dextran and alkylglyceryl dextran are reproduced in Figures 2.10-2.13.

Chemical modification of dextrans
47
Figure 2.9 GPC calibration curve (Pullulan standards)
Table 2.2: GPC calibration data using Pullulan standards
Retention Time /min
Elution Volume /mL
Mol Wt Log (Mol Wt) Calculated Weight
% Residual
Standard Type
Relative Weight
1 9.549 9.549 805000 5.905796 790018 1.896 Narrow 1.00
2 10.413 10.413 366000 5.563481 383256 -4.502 Narrow 1.00
3 11.281 11.281 210000 5.322219 206578 1.657 Narrow 1.00
4 12.219 12.219 113000 5.053078 109750 2.961 Narrow 1.00
5 13.295 13.295 48800 4.688420 49454 -1.322 Narrow 1.00
6 14.188 14.188 21700 4.336460 21831 -0.602 Narrow 1.00
7 14.865 14.865 10000 4.000000 10136 -1.338 Narrow 1.00
8 15.271 15.271 6000 3.778151 5914 1.459 Narrow 1.00
Table 2.3: Equation calculated for the GPC calibration curve
R R^2 Standard Error Equation
1 0.999902 0.999804 1.407507e-002 Log Mol Wt = 2.24e+001 - 3.87e+000 T^1 + 3.08e-001 T^2 - 8.84e-003 T^3
Log M
ol W
t
3.00
4.00
5.00
6.00
Retention Time
9.00 9.50 10.00 10.50 11.00 11.50 12.00 12.50 13.00 13.50 14.00 14.50 15.00 15.50 16.00 16.50 17.00

Chemical modification of dextrans
48
Figure 2.10 GPC chromatogram of native dextran (Dex6)
Figure 2.11: GPC chromatogram of native dextran (Dex100)
dw
t/d(logM
)
Cum
ula
tive %
0.00
0.20
0.40
0.60
0.80
1.00
0.00
20.00
40.00
60.00
80.00
100.00
Slice Log MW
2.503.003.504.004.505.00
Mn=
4223
Mz=
23547
Mz+
1=
50405
Mw
=9811
MP
=5925
dwt/d(logM)
Cumulative %
dw
t/d(logM
)
Cum
ula
tive %
0.00
0.10
0.20
0.30
0.40
0.50
0.60
0.70
0.00
20.00
40.00
60.00
80.00
100.00
Slice Log MW
3.003.504.004.505.005.506.00
Mn=
24919
Mz=
291485
Mz+
1=
522793
Mw
=109399
MP
=42332
dwt/d(logM)
Cumulative %

Chemical modification of dextrans
49
Figure 2.12: GPC chromatogram of Dex6G4
Figure 2.13: GPC chromatogram of Dex100G16
dw
t/d(logM
)
Cum
ula
tive %
0.00
0.20
0.40
0.60
0.80
1.00
1.20
1.40
0.00
20.00
40.00
60.00
80.00
100.00
Slice Log MW
2.803.003.203.403.603.804.004.204.40
Mn=
3640
Mz=
7756
Mz+
1=
10240
Mw
=5469
MP
=4330
dwt/d(logM)
Cumulative %
dw
t/d(logM
)
Cum
ula
tive %
0.00
0.50
1.00
1.50
2.00
2.50
3.00
3.50
4.00
4.50
5.00
5.50
6.00
6.50
7.00
7.50
8.00
0.00
10.00
20.00
30.00
40.00
50.00
60.00
70.00
80.00
90.00
100.00
Slice Log MW
5.165.185.205.225.245.265.285.305.325.345.365.385.405.42
Mn=
185810
Mz=
190943
Mz+
1=
193698
Mw
=188308
MP
=175450
dwt/d(logM)
Cumulative %

Chemical modification of dextrans
50
Table 2.4: Mn, Mw and PDI of the dextrans and alkylglyceryl dextrans
sample Mn Mw PDI
Native dextran 6 kDa
4223 9811 2.3
Native dextran 100 kDa
24919 109399 4.4
Dex6G4 3640 5469 1.5
Dex100G16 186810 188308 1.0 Where: Mn = number average molecular weight
Mw = weight average molecular weight
PDI = Polydispersity index
2.4.3 MALDI-TOF MS
Figure 2.14: MALDI TOF spectrum of Dex6G4.
Peak-to-peak mass differences of 130.2 and 146.2, observed between the main peaks
that form the spectral pattern, are likely due to fragmentation at the O-C bond level (as
suggested in Figure 2.14, insets); this is indicative of a fragmentation pathway that is
characterised by the loss of C7H14O2 and C7H14O3 (MW 130.18 and 146.18 Da,
respectively), which in turn confirms the successful chemical grafting of native dextran
with butylglyceryl pendent chains; no cross-ring fragments could be identified.
OO
OHOH
OO
O
OH
C7H
11O
6
191.0556 Da
C7H
15O
2
131.1072 Da
146.2
130.2

Chemical modification of dextrans
51
The isotopic ratios (discernible in Figure 2.15) are indicative of primarily singly charged
ions. Since the CHCA matrix used (a strong acid in the gaseous phase) tends to induce
extensive fragmentation (Karas et al. 1995, Harvey 1999;(152, 153), the detection of
molecular ions was not possible. This is consistent with suggestions that 2,5-
dihydroxybenzoic acid (2,5-DHB) is a better matrix for the MALDI-TOF MS study of high
molecular weight polysaccharides (such as dextran) that require a high matrix-to-analyte
ratio to give enhanced signals (153, 154). The mass/charge (m/z) fragment loss and
nature of fragment loss are presented in Table 2.5.
Table 2.5: Identified m/z fragment mass loss in the MALDI-TOF spectra of the modified dextrans.
sample m/z fragment loss
Nature of fragment loss identified
Dex6G4 130.1 C7H14O2
Dex100G4 130.1; 146 C7H14O3
Dex100G8 ~186 C11H22O2
Dex6G12 242.2 C15H30O2
Dex100G12 242.3 C15H30O2
Figure 2.15 MALDI TOF spectrum of Dex100G4
Similar spectra have been obtained for the grafted 100kDa or 6kDa dextran (Appendix 7).
130.2
O
OOH
OH
O
O
O
OH
C7H
11O
6
191.0556 Da
C7H
15O
2
131.1072 Da
Molecular Formula = C14
H26
O8

Chemical modification of dextrans
52
2.4.5 TGA
TGA was carried out to determine the thermal stability of samples; the thermograms of
analysed samples are collated in Appendix 6.
Figure 2.16: TGA results for Dex6
Figure 2.16 is the TGA plot from a sample that had been heated under nitrogen to 500°C.
There are 2 mass loss steps: the first of these corresponds to a mass loss of -8.91% and
exhibits a maximum mass loss rate (peak in DTG curve) at 82.5°C, while the second step
(maximum mass loss rate at 315.0°C) is associated with a -74.25% loss relative to the
original mass.

Chemical modification of dextrans
53
Figure 2.17: TGA results of Dex6G4
Figure 2.17 shows the TGA profile of the sample that was heated under nitrogen
atmosphere to 500°C. The thermogram is again associated with two mass-loss steps, the
first of which corresponds with a mass loss of -9.01% and is characterised by a mass-loss
rate maximum at 66.6°C; the second step (mass loss -86.6%) exhibits its maximum mass
loss rate at 327.1°C.
The thermograms of other samples are presented in Appendix 6: the data of the
thermograms in appendices are summarised in Table 2.6; the tabulated temperature
values were determined from the first derivative (point of inflection) of the corresponding
thermogram.

Chemical modification of dextrans
54
Table 2.6: TGA data of first and second mass loss for modified and unmodified dextrans
First mass loss/temperature, °C
Second mass loss/temperature, °C
Total mass loss %
sample % mass loss Temperature /°C
mass loss Temperature /°C
Dex6 -8.90 82.5 -74.25 315.0 -83.2
Dex6G4 -9.01 66.6 -86.58 327.1 -95.6
Dex6G8 -3.54 69.0 -77.81 388.0 -81.4
Dex6G12 -5.36 59.7 -86.17 319.8 -91.5
Dex6G14 -4.39 61.7 -86.49 305.9 -90.9
Dex6G16 -2.85 58.1 -87.70 252.6 -90.6
Dex100 -9.38 84.2 -70.63 304.6 -80.0
Dex100G4 -9.70 66.0 -76.63 326.5 -86.3
Dex100G8 -6.41 61.6 -77.30 328.8 -83.7
Dex100G12 -4.95 59.1 -90.60 335.6 -95.6
Dex100G14 -4.82 74.4 -86.00 309.2 -90.8
Dex100G16 -3.12 24.3 -90.08 332.6 -93.2
All thermograms exhibit two decomposition stages: the first mass loss, which occurs
below 100°C, is attributed to water loss from the sample while the second mass loss,
which occurs in the temperature range 200-350°C, is due to the degradation of the
alkylglyceryl dextran structure (155, 156).
To determine the trend of water content loss across the range of materials, percentage
mass losses were plotted against chain lengths.

Chemical modification of dextrans
55
Figure 2.18: first-stage mass loss as a function of chain length (Dex100 and derivatives)
Figure 2.19: first-stage mass loss as a function of chain length (Dex6 and derivatives)
In accord with expectation, the first mass loss (loss of water) varies with chain length,
with more hydrophilic samples exhibiting correspondingly higher percentage mass loss
(Figures 2.18 and 2.19): the longer the chain length, the more hydrophobic the sample
and the lower its water content. Accordingly, for samples of Dex100 kDa (Figure 2.18), the
plot reveals the gradual decrease in water content. A similar behaviour was observed for
samples of Dex6kDa (Figure 2.19), with Dex6G8 presenting the only anomaly.
-12
-10
-8
-6
-4
-2
0Dex100 Dex100G4 Dex100G8 Dex100G12 Dex100G14 Dex100G16
%m
ass
loss
chain length
-10
-9
-8
-7
-6
-5
-4
-3
-2
-1
0Dex6 Dex6G4 Dex6G8 Dex6G12 Dex6G14 Dex6G16
%m
ass
loss
chain length

Chemical modification of dextrans
56
2.4.6 Discussion on synthesis and characterisation techniques
Matrix-assisted laser desorption/ionisation mass spectrometry (MALDI MS) has been
developed as a soft ionisation and as a sensitive method that allows the rapid detection
of macromolecules and biopolymers (157). MALDI can generate singly or multiply charged
ions ([M+nH]n+), the prevalence of which depends on the nature of the matrix, the laser
intensity and/or the voltage used. While it is generally accepted that the MS analysis of
polysaccharides is of lower sensitivity than that of peptides and proteins, it has been
shown that MALDI-TOF MS may be usefully applied to the measurement of the molecular
mass of carbohydrates up to 106 Da (158); it has been recently acknowledged however
that this becomes more difficult for higher molecular weights as neutral polysaccharides
show poor ionisation efficiency (154). Figure 2.15 presents a typical MALDI TOF spectrum
of the modified dextran polymers considered in this study. The spectra are characterised
by the lack of a molecular ion and of patterns that are characteristic of natural glycans,
and a series of glycosidic ions. The observed pattern is attributed to the loss of
butylglyceryl chains, which is consistent with the successful chemical modifications of
dextran.
The mechanism for the attachment of alkyl glycerol chains to dextran involves the t-BuOK
-mediated deprotonation of the alcohol moieties of dextran to the strongly nucleophilic
butoxide ion, which in turn attacks the strained glycidyl ether ring (149).
Since the viscosity of the reaction medium, which is influenced by both the length of the
alkyl chains and the concentration of t-BuOK, appeared to impact upon the fate of the
reaction, preliminary experiments were conducted in order to determine optimised
mixing ratios for the reactants. An attempt to reduce the viscosity of the reaction medium
by increasing the amount of solvent (DMSO) by 30% did not produce the desired effect.
By contrast, modulation of the ratio of t-BuOK to alkyl glycidyl ether increased the extent
of the functionalisation. For optimal functionalisation, the ratio 1:3:4 (dextran: t-BuOK:
alkyl glycidyl ether) was used for the shorter chain butyl- and octyl- glycidyl ethers; the
corresponding ratio of 1:2:1 was selected for the modification of dextrans with lauryl
glycidyl ether; the ratio of 1:1:1 was used for the reaction involving the tetradecyl glycidyl
and hexadecyl glycidyl ethers.

Chemical modification of dextrans
57
As expected, GPC experiments showed that the higher the degree of substitution or the
chain length of the sample the higher the corresponding molecular weight. All other 1H-
and 13C-NMR signals were in good agreement with those expected on the basis of
published work (159).
2.5 Conclusions
Alkylglyceryl dextrans have been synthesised by the reaction of commercially available
dextrans and a range of alkyl glycidyl ethers in the presence of a strong base (t-BuOK) in
anhydrous DMSO and under an atmosphere of nitrogen. The crude products were
washed with organic solvent, subjected to dialysis, and freeze-dried to a final yield of 40-
60% before characterisation with NMR and FTIR. NMR spectroscopic investigations
showed that the degree of substitution was in the range 50 - 145%.
Thermograms of the alkylglyceryl dextrans have shown a two-step mass loss profile that
corresponds to the initial loss of water and the higher-temperature thermal
decomposition of the dextran core. TGA measurements revealed that the water content
of each dextran and modified dextrans is influenced by the length of the hydrophobic side
chain.
GPC data showed that butylglyceryl dextran (Dex6G4) has an average molecular weight
that is lower than that of the 6kDa native dextran. By contrast, Dex100G16 exhibits an
average molecular weight that is higher than that of the native dextran (Dex100), which is
attributed to the contribution of the pendent alkylglycerol chain.
Due to extensive fragmentation of the modified dextrans and to the absence from the
spectra of molecular ion peaks, MALDI-TOF MS did not prove suitable for the
determination of the molecular weight of samples.

Preparation and characterisation of nanoparticles
58
3
3. Preparation and characterisation of nanoparticles The preparation of nanoparticles of poly(alkyl cyanoacrylate) was carried out by anion-
propagated emulsion polymerisation and solvent-displacement nanoprecipitation,
whereas the preparation of nanoparticles of PLA-alkylglyceryl dextran was by means of
the dialysis method.
3.1 Mechanism of ACA polymerisation
The method of choice for the chemical synthesis of alkyl cyanoacrylates (ACA) is the
Knoevenagel condensation reaction (73). ACA molecules polymerise readily at room
temperature in the presence of any nucleophile, base or even trace moisture to yield
PACA polymers. In solution, PACA polymers are highly susceptible to rapid degradation
into species of lower molecular weight, which is witnessed as anomalous solution-
viscosity behaviour (160). The low ceiling temperature of PACA has been linked to retro-
Knoevenagel depolymerisation (161).
The polymerisation of ACA has been examined in depth by Ryan and McCann, who have
made the following observations: (i) the ACA monomer and polymer are in rapid, dynamic
equilibrium; (ii) a very high concentration of monomer relative to that of the initiator
favours the production of long chains; (iii) chain-termination occurs by the anionic end-
group becoming protonated by water or other acid functionalities to form a species that
is not capable of carrying the reaction; (iv) the use of base effects a deprotonation of this
dormant chain end, allowing the reactivation of the polymerisation reaction; (v) the
monomer that is present during the equilibrium adds rapidly to any nucleophiles present
to initiate new-chains formation; (vi) since the concentration of the monomer in the new
equilibrium is much lower than that during polymerisation, the new chains that form have
drastically lower molecular weights (implying that longer-chain formation is favoured by
the distortion of the monomer to polymer ratio through the continuous addition of
monomer into the polymerisation vessel); and, (vii) the addition of acid into the reaction
mixture inhibits the deprotonation of the chain ends, preventing the establishment of the
equilibrium (160).

Preparation and characterisation of nanoparticles
59
The most widely used alkyl cyanoacrylate monomer is ethyl cyanoacrylate (ECA). As with
other alkyl cyanoacrylates, anionic species or a Lewis base are both capable of initiating
the rapid polymerisation of this monomer to give a high molecular weight polymer;
amines and phosphines are adequately nucleophilic substances for the purpose. The
degree of substitution in amines affects reactivity, with tertiary amines initiating an
exothermic polymerisation that results in the formation of high molecular weight
polymers; primary and secondary amines give polymers of lower molecular weights (162).
The high reactivity of alkyl cyanoacrylates is consequent to the electron withdrawing
effect of the ester and nitrile functionalisation of the monomer unit. The effective
utilisation of alkyl cyanoacrylates in nanoparticles formulation involves polymerisation,
which requires a nucleophile or base for the reaction initiation; water, amines, alcohols
and phosphines are employed commonly. The combination of the monomer with the
initiating nucleophile results in the formation of a chain-carrying species that is stabilised
by the ester and nitrile moieties, while the associate polarisation of the double bond
activates further nucleophilic attack. Chain propagation occurs by the repetitive addition
of electron deficient monomer to the anionic end of the growing chain and further to the
biomedically useful polymer (Figure 3.1). The hydrogen bonds between ammonium and
cyano groups that become established during the polymerisation of ACA coupled with
van der Waals interactions represent the forces of attraction that are responsible for the
cohesion of PACA nanoparticles that are important in their use as biomedical materials
(163).
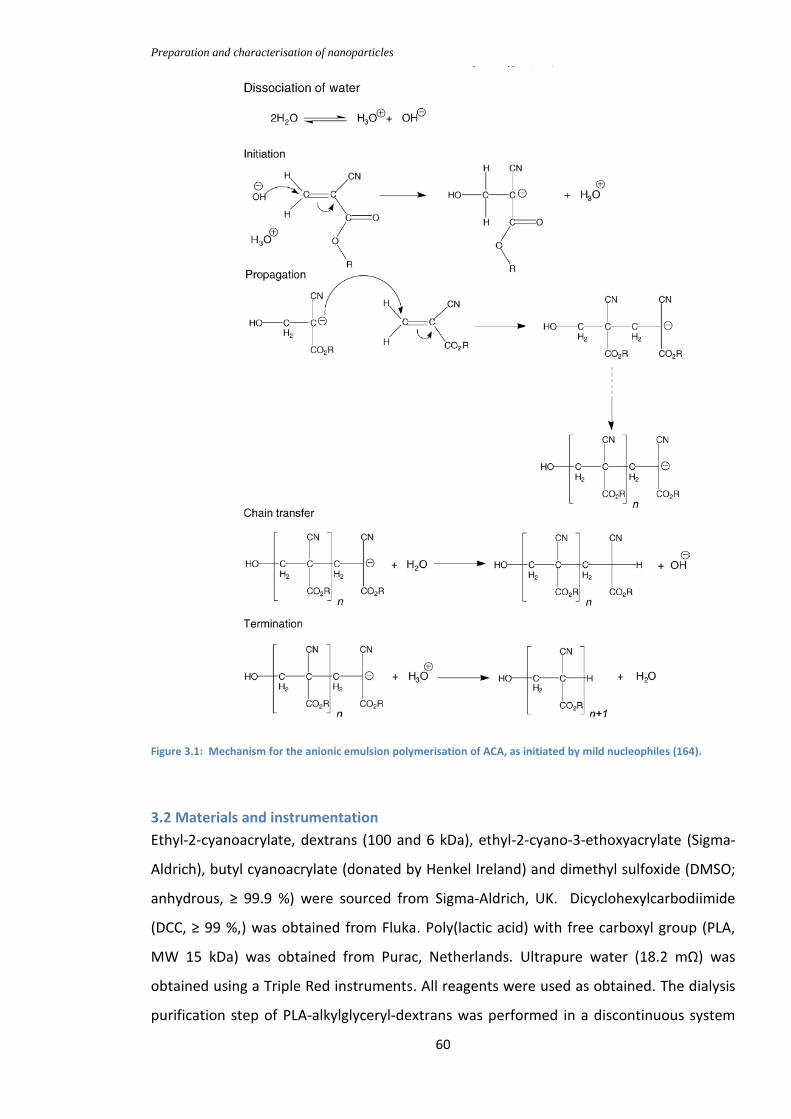
Preparation and characterisation of nanoparticles
60
Figure 3.1: Mechanism for the anionic emulsion polymerisation of ACA, as initiated by mild nucleophiles (164).
3.2 Materials and instrumentation
Ethyl-2-cyanoacrylate, dextrans (100 and 6 kDa), ethyl-2-cyano-3-ethoxyacrylate (Sigma-
Aldrich), butyl cyanoacrylate (donated by Henkel Ireland) and dimethyl sulfoxide (DMSO;
anhydrous, ≥ 99.9 %) were sourced from Sigma-Aldrich, UK. Dicyclohexylcarbodiimide
(DCC, ≥ 99 %,) was obtained from Fluka. Poly(lactic acid) with free carboxyl group (PLA,
MW 15 kDa) was obtained from Purac, Netherlands. Ultrapure water (18.2 mΩ) was
obtained using a Triple Red instruments. All reagents were used as obtained. The dialysis
purification step of PLA-alkylglyceryl-dextrans was performed in a discontinuous system

Preparation and characterisation of nanoparticles
61
(deionised water, 15.0 mΩ, 10.0 L; exchanged 3 times/day) using Visking membrane
tubing (Medicell International Ltd, UK; cut-off either at 12-14 kDa or at 3.5 kDa).
Alkylglyceryl dextran of different chain lengths. Low speed centrifugation was performed
by means of a Rotofix 32A Hettich (Zentrifugen-Germany). Ultracentrifugation
experiments utilised a Beckman Ultracentrifugation XL-90 instrument. The Z-average
diameter (nm), PDI and zeta potential (mV) were determined by Dynamic Light Scattering
experiments (Malvern Zetasizer Nano instrument, Worchester, UK) using Whatman filter
paper of specified pore size for filtration. Freeze drying involved the use of either a Virtis
(Advanced Sentry 2.0 Controller for Virtis® Benchtop(TM) or a 'K' Freeze Dryer (SP
Industries-Warminster, USA) instrument. Sonication was by means of a Grant ultrasonic
bath XB3 (Farnell, UK).
TGA analysis was carried out with TG 209 F1 Libra (TGA from Netzsch Instruments), with
temperature ranged from 25 to 500°C, heating at 10K/min. under Nitrogen atmosphere.
Nanoparticle Tracking Analysis (NTA) was carried out at 25 °C using a Nanosight
instrument that was equipped with a thermostatted LM-14 unit and with a 532 nm
(green) laser. The image capture (length 60 s) was by means of a CCD Marlin camera, data
were analysed using NTA 3.0 software.
The hydrodynamic diameter of the nanoparticles was determined with DLS using a
Malvern Zetasizer Nano instrument, UK, equipped with a 633 nm He-Ne laser (173° back
scattering angle detection; Zetasizer software v.7.01 software). Samples analysis was
done in triplicate (25 °C, 2 min equilibration) using clear polycarbonate disposable
cuvettes. Data are presented as Z averages (Z-av.) and the associated polydispersity index
(PDI).
The autotitrations of colloidal material were performed to simultaneously determine Z-
average diameter (Z-av) in (nm), and ZP (mV) as a function of pH; an MTP-2 (Multi-
Purpose Titrator-2, Malvern, UK) equipped with a solvent degasser was employed. The
sample (10 mL) was titrated automatically against aqueous NaOH solutions (5 mM or 50
mM) and against aqueous HCl solutions (5 mM or 50 mM). Prior to each experiment,
solutions were filtered through 0.2 μm PES filters (Whatman).

Preparation and characterisation of nanoparticles
62
3.3 Methods
3.3.1 Attempted NP formulation with ethyl 2-cyano-3-ethoxyacrylate
Since there are few reports regarding the capability of ethyl 2-cyano-3-ethoxyacrylate
(Figure 3.2) to undergo co-polymerisation to nanoparticulate structures, an attempt was
made to formulate nanoparticles by means of an anionic emulsion polymerisation
protocol (24, 93). To this end, ethyl 2-cyano-3-ethoxyacrylate (1 g) was dispersed in
acetone/water (1:1 v/v; 1 mL) and added dropwise to a solution of dextran (100 kDa; 1%
w/v, 100 mL) in KH2PO4 buffer (pH 2.5). The mixture was allowed to stir overnight (room
temperature), after which time it was neutralized with NaOH solution (1 N), filtered
through 0.8 µm filter paper and centrifuged (90000 g, 1 h).
Figure 3.2: Structure of ethyl 2-cyano-3-ethoxyacrylate
Since no solid product could be isolated, attempts were made to repeat the experiment
at increased pH, in water-free acetone and in the absence of phosphate buffer. All these
attempts failed to produce polymeric structures, suggesting that this molecule is not
amenable to polymerisation under the selected experimental conditions. Hence, ethyl 2-
cyano-3-ethoxyacrylate was excluded as a co-monomer in further nanoparticle-formation
experiments, limiting the choice of cyanoacrylates to the ethyl and butyl homologues.
3.3.1.1 Preparation of PECA-Dex100 nanoparticles
Method: PECA-Dex100 was prepared using a standard literature method (24,93). Ethyl 2-
cyanoacrylate (1 mL) was added dropwise into dextran solution (1% (w/v), 100 mL, pH
2.5; 100 KDa) and the solution was allowed to stir at room temperature overnight. After
this time, the mixture was neutralised with NaOH solution (1 N), centrifuged (Rotofix;
3500 rpm, 20 min), filtered (0.8 µm Whatman filter paper), isolated by
ultracentrifugation (18000 g, 30 min; Beckman ultracentrifuge), rinsed with deionised
water and re-suspended in deionised water (5 mL; sonication in water bath, 10 min). The

Preparation and characterisation of nanoparticles
63
size and zeta potential of the thus suspended nanoparticles was determined using a
Malvern instrument before the water was removed (freeze dryer, 24 h). The synthesis of
PECA repeated in phosphate buffer medium resulted in the formation of NPs that were
characterised by poor yield, low zeta potential and high conductivity.
3.3.2 Preparation of poly (ethyl 2-cyanoacrylate)–alkylglyceryl-dextran NPs
Method 1 (24, 93): Ethyl 2-cyanoacrylate (ECA) (600 µL) was added dropwise to
alkylglyceryl-dextran (DexnGm; 100 mg; n=6 or 100; m=4, 8, 12, 16) dispersed in water
(100mL; pH 2.5, HCl) and stirred at room temperature for 4 h (Figure 3.3). After this time
the solution was neutralised with NaOH solution (1 N), centrifuged for 15 min (3000 rpm;
Rotofix) and further ultra-centrifuged for 30 min at 12,200 rpm (18000 g; Beckman
ultracentrifuge). The isolated sample (pellet) was rinsed, dispersed in water and sonicated
for 10 min before freeze drying to a batch-dependent yield in the range 20-40%.
Figure 3.3: Schematic representation of the protocol for the synthesis and characterisation of PACA-alkylglyceryl dextran.
IR
HCl(aq.) pH 2.5
SEM
MALDI-TOF-MS
TA-DSC
EA
Characterization
4h
Modified-dextran-PACA-NPs
Modified-dextran-PACA-NPs
Modified-dextran-PACA1.1N NaOH
2.Centrifugation
3.Dispersion
Freeze drying
Characterization
DLS
NTA
NMR
AFM
High speed stirringACA
Modified-dextran-PACA-NPs
Modified-dextran
Supernatant
Pellet
Re-dispersion
Characterization
DLS
NTA
Modified-dextran-PACA-NPs
Modified-dextran-PACA-NPs

Preparation and characterisation of nanoparticles
64
Method 2 (69): ECA (600 µL) was dissolved in acetone (100 mL) and gradually added
(room temperature) to a stirring solution of alkylglyceryl dextran (DexnGm; 100 mg) in
water (100 mL); stirring was continued overnight at room temperature to allow the
evaporation of most of the acetone. Following centrifugation at 40000 rpm for 30 min,
the pellet was rinsed, re-suspended in water and subjected to sonication for 10 min
before isolation by freeze drying to a batch-dependent yield in the range 50-70%.
Method 3 (24): ECA (1 mL) was added dropwise to DexnGm (1% w/v; pH 2.5, HCl) and was
allowed to stir for a minimum of 4 h at room temperature, before neutralisation with
NaOH solution (1 N), filtering (P3 glass filter), and isolation by centrifugation (12200 rpm,
30 min). The crude product was rinsed, dispersed in water (10 mL), sonicated (10 min)
and freeze dried to a yield of 30-40%. SEM image of PECA-Dex100G4 is in Appendix 4.
3.3.3 Preparation of PLA15-Dex100G8-PECA
Alkylglyceryl dextran, PLA and ECA were all incorporated into a single multi-block
structure through the simple polymerisation procedure of nanoprecipitation solvent
displacement.
Dex100G8 (0.05 g) was dispersed (by sonication) into an acetone (50 mL) solution of ECA
(0.265 g) and PLA (0.265 g). This mixture was then added dropwise in water (100 mL; 18.2
mΩ) under continuous stirring. After overnight stirring at room temperature, the mixture
was dialysed in a discontinuous manner (10 L container; 3x a day for 2 days), filtered
(Whatman paper, 90 mm; 1 qualitative circle) placed over sintered glass (P3) and the
filtrate was freeze dried before being subjected to characterisation by DLS (Table 3.8),
TGA (Figure 3.18), DSC (Figure 3.19) and 1H-NMR (Figure 3.17).
3.3.4 Effect of filtration on size of PECA-Dex100G8 NPs
ECA (100 mg) in acetone (100 mL) was gradually added to stirring Dex100G8 (100 mg)
that had been dispersed in water (100 mL) and was allowed to stir at room temperature
overnight. After this time, NaOH solution (2 mL, 0.1 N) was added to the resulting mixture
and allowed to stir for a further 30 min before filtration over sintered glass (P3),
centrifugation (40000 rpm, 30 min), rinsed and re-dispersion in water (10 mL).
Following filtration (yield, 15-25%) the isolated product was characterised using DLS
(Table 3.3) and NMR (Figure 3.5).

Preparation and characterisation of nanoparticles
65
3.3.5 Preparation of PECA-Dex6G16 nanoparticles by nanoprecipitation
ECA (600 µL) in acetone (100 mL) was added gradually to stirring Dex6G16 (100 mg) in
water (100 mL; 18.2 mΩ). Stirring was continued overnight (room temperature) after
which time the product was isolated by centrifugation (12200 rpm, 30 min), rinsed with
deionised water, dispersed in water (10 mL) and sonicated (ultrasonic bath).
3.3.6 Preparation of PLA-derived nanoparticles by zero length crosslinking
Three different alkylglyceryl dextrans were employed for the preparation of PLA-
alkylglyceryl dextran derived nanoparticles (Figure 3.4; Scheme 1) by zero length grafting
of PLA to alkylglyceryl dextran with N,N’-dicyclohexylcarbodiimide (DCC) (165, 166) and
DMAP. PLA15 respectively grafted onto Dex100G4, Dex100G8 and Dex6G16 produced
PLA15-Dex100G4, PLA15-Dex100G8 and PLA15-Dex6G16.
The apparatus was dried (vacuum) and flushed with Nitrogen before use. DCC (0.045 g,
0.2 mmol) dissolved in anhydrous DMSO (10 mL) was added with stirring to a solution of
PLA (1.75 g, 0.11 mmol) in anhydrous DMSO (100 mL) contained within a round-bottomed
flask that had been equipped with a Nitrogen inlet tube. After 30 min, the solution was
transferred into a stirring solution (Nitrogen atmosphere) of octylglyceryl-dextran
(Dex100G8, 0.85 g) and 4-(dimethylamino)-pyridine (DMAP; 0.026 g, 0.22 mmol) in
anhydrous DMSO (100 mL) that had been stirred for an hour. The reaction mixture was
allowed to stand at room temperature for 24 h, after which time it was filtered through
Whatman paper over P3 sintered glass (to remove dicyclourea (a byproduct of the
reaction) and dialyzed for 48 h (MWCO 12-14 kDa) against deionised water, before freeze
drying. The dried powder was dispersed in acetone (50 mL), filtered through Whatman
filter paper (to remove unreacted PLA) and the isolated pellet was dried under vacuum at
room temperature. The thus dried pellet was washed with water, dispersed in deionised
water (100 mL) and freeze dried to yield (20-30%) of the product. This was used to purify
PLA15Dex100G8.
Purification (method 2): The preparation of PLA15-Dex100G16 and PLA15Dex100G4
nanoparticles followed the protocol presented in Figure 3.4. The zero-length grafting (165,
166) of PLA to alkylglyceryl dextran was carried out with N,N’-dicyclohexylcarbodiimide
(DCC). After dialysis and freeze drying, the powder was dispersed in acetone (100 mL),

Preparation and characterisation of nanoparticles
66
spun at 22,000 rpm for 30 min (to remove unreacted PLA) and the pellet was dried
overnight under vacuum. The dried pellet was suspended in deionised water (300 mL) and
placed on a shaking platform overnight (room temperature) before freeze drying to yield a
pellet of the material labelled PLA15-Dex100G16. To the supernatant (acetone solution
containing mostly unreacted fraction of PLA) was added water (500 mL) to precipitate any
unreacted PLA, which was removed by filtration. The water-acetone mixture was allowed
to stir gently at room temperature for 48 h (to remove excess acetone), and the solid mass
that formed (yield 50-70%) was labelled PLA15-Dex100G16-acetone fraction.
Figure 3.4 scheme for the synthesis of PLA-alkylglyceryl dextran nanoparticles
3.3.7 Preparation of PBCA-Dex100G4 nanoparticles
BCA (200 mg) was added gradually into a stirred suspension of Dex100G4 (200 mg) in
water (100 mL) and the mixture was allowed to stir for a further 4 h at room temperature.
After this time, the mixture was neutralised with NaOH solution (1 N), filtered through
sintered glass, centrifuged (40000 rpm, 30 min) and the nanoparticles that separated
were rinsed with water, sonicated, dispersed in water (20 mL) and freeze dried to a yield
of 26%. This product was characterised with DLS and NTA.
3.3.8 Degradation study
The esterase-induced study of the degradation of PECA-Dex100G4 was conducted
according to a standard literature method (167, 168): ECA (2.5 g, 2.36 mL) was added
m m
m=3; DexG4
m=7; DexG8
m=15;DexG16
R=H or
25oC
N2.atm. 24h
DMAPDCC
PLA
m=3; PLA-DexG4
m=7; PLA-DexG8
m=15; PLA-DexG16
z
z

Preparation and characterisation of nanoparticles
67
dropwise to water (250 mL; 18.2 mΩ, pH 3) that contained Dex100G4 (250 mg; 0.1%
w/v) and maintained at 25°C (water bath) and stirred for 3 h. After this time, specified
concentrations (1-5 mg/mL) of an esterase solution in phosphate buffer (pH7) were
added to each NPs suspension (3.5 mL) contained in 30 mL of Ringer’s solution. The
resulting mixtures were incubated at 37°C under shaking (50 cycles/min). Aliquots were
withdrawn after 0.5 h, 1 h, 2 h, 3 h and 4 h and size and PDI were determined using DLS.
The same procedure was repeated with samples at a constant esterase concentration of 2
mg/mL and also with an esterase-free mixture (which served as control).
The effect of increased enzyme concentration on the degradation pattern of PECA-
Dex100G4
The methods adopted for the formulation of nanoparticles and for the study of their
degradation were identical to those described previously (167, 168); with the only
variations for the latter study being the duration of the experiment, which was prolonged
and the concentration of enzyme that was increased (Table 3.1). A mass of 31 mg of
PECA-Dex100G4 contained in a 3.5 mL volume of each suspended population of
nanoparticles was used as substrate for the degradation study. A stock solution of the
enzyme (180 mg in 15 mL; equivalent to 12 mg/mL) was made and distributed amongst
the samples under test as indicated in Table 3.1. Samples were incubated at 37°C (Grant
OLS 200 orbital/linear shaking water bath) under shaking (50 rpm/min); the extraction of
aliquots at premeditated time points allowed the measurement of size and the
determination of PDI by DLS.

Preparation and characterisation of nanoparticles
68
Table 3.1: protocol for the degradation study of PECA-Dex100G4 NPs
sample A B C D E F
Enzyme (mg) - 7.06 12.94 24.71 36.47 71.75
Units of Enzyme - 120 220 420 620 1220
Enzyme Vol. (mL;
conc. 12mg/mL)
- 0.588 1.078 2.059 3.04 5.98
Ringer’s Solution
(mL)
30 30 30 30 30 30
Nanoparticles
(mL)
3.5 3.5 3.5 3.5 3.5 3.5
3.4 Results and discussion
3.4.1 Preparation of nanoparticles of ethyl 2-cyanoacrylate
3.4.1.1 Preparation of PECA-Dex100 NPs
The yield of PECA-Dex100 NPs (2.41%), was very poor as compared with that reported by
Han et al. (108) who, using a similar method, reported a yield of over 93%. Three batches
of NPs were prepared, all of which produced nanoparticles of reproducible size in the Z-
average diameter range 250-400 nm and PDI of 0.364.
3.4.1.2 Preparation of poly (ethyl 2-cyanoacrylate)–alkylglyceryl-dextran NPs
3.4.1.2.1 Preparation of PECA-Dex6G16 NPs by nanoprecipitation
This method combines the emulsion polymerisation, solvent evaporation and
nanoprecipitation methods into a one-pot synthesis. As the acetone evaporates the
acetone-soluble ECA is allowed to react via an anionic mechanism leading to
instantaneous nanoprecipitation. The presence of acetone appears to play an important
role in regulating the size and size distribution of the formed nanoparticles (Table 3.2),
which is very small (153.3 nm) as compared with that of nanoparticles obtained from
conventional anionic polymerisation.

Preparation and characterisation of nanoparticles
69
Table 3.2: DLS Characterisation PECA-Dex6G16 nanoparticles (n=1)
Parameter value
Zeta Av. diameter 153.3±0.4 nm
PDI 0.132±0.006
Zeta potential -27.6±0.7 mV
3.4.1.2.2 Effect of filtration on size of PECA-Dex100G8 NPs
A study was conducted in an effort to evaluate the effect of filtration on the size, PDI and
zeta potential of the nanoprecipitation-solvent-displacement-method formulated PECA-
Dex100G8; nanoparticles were characterised by DLS (Table 3.3) and NMR (Figure 3.5).
To evaluate the effect of filtration, poly(ethersulfone) (PES) filter membrane (0.45 µm)
was used for the filtering of a portion of the dispersed sample before DLS analysis (Table
3.3) – no significant differences were observed between the filtered and unfiltered
samples.
Table 3.3: Effect of filtration on NPs size, PDI and zeta potential (±SD; n=3)
parameter Un-filtered Filtered
Size (Z-av.d)nm 120.94±30.57 110.77±29.12
PDI 0.22±0.02 0.18±0.00
Zeta (mV) -38.37±1.12 -31.39±0.90

Preparation and characterisation of nanoparticles
70
Figure 3.5: 1H NMR spectrum of PECADex100G8 nanoparticles
NMR spectrum PECA-Dex100G8 (Figure 3.5) shows that at least two of the characteristic
resonances of PECA are well defined, namely those at 1.3 ppm and at 4.2 ppm. The
spectral features of alkylglyceryl dextran are less pronounced (Figure 3.5), as is consistent
with the high ratio of PECA to alkylglyceryl dextran. This confirms data from elemental
analysis determinations, which estimated the ratio of PECA to alkylglyceryl dextran at ca.
90:10. The 1H- and 13C-NMR spectra of pure PECA are respectively presented in Figures
3.6 and 3.7.
f
d
c
fe
R= H or
e c
a

Preparation and characterisation of nanoparticles
71
Figure 3.6: 1H-NMR spectrum of pure PECA
Figure 3.7: 13
C-NMR spectrum of pure PECA
a
bc
d
e
a
bc
d
e
d e
b
a
c
c
b

Preparation and characterisation of nanoparticles
72
3.4.2 Elemental analysis results
The method for the formation of nanoparticles appeared to be of little influence on the
elemental composition and hence to the ratio of PECA to alkylglyceryl dextran in the
nanoparticulate formulation. The nanoparticles evaluated for elemental composition and
ratio of PECA to alkylglyceryl dextran had been formulated by: (i) anionic emulsion
polymerisation (samples 1-8); or (ii) the nanoprecipitation-solvent-diffusion method
(samples 9-10; Table 3.4).
Elemental analysis enabled the determination of the ratio of PECA to alkylglyceryl-dextran
in complex nanoparticles (Table 3.4). The percentage ratio of alkylglyceryl dextran and
PECA of the polymer obtained in the experiment was deduced by considering their
percentage composition of carbon, nitrogen, oxygen, and hydrogen following the
equation presented in Appendix 11. Experimental elemental compositions were in
agreement with theoretically calculated values. Across the range of synthesised
nanoparticles, PECA was the higher percentage constitutional unit (over 90% in some
samples) while alkylglyceryl-dextran accounted for a small percentage (3.9% to 19.62%)
of the structural component of nanoparticles (Table 3.4).
Elemental analysis reported for the respective composition percentage weight per weight
(w/w) of dextran and poly (isobutyl cyanoacrylate), PIBCA, in a polymer obtained from the
emulsion polymerisation of isobutyl cyanoacrylate (IBCA) is 22% and 78% (169), which is
consistent with current findings in that the ratio of dextran to alkyl cyanoacrylate is
consistently low. This observation is in agreement with that from comparative
(alkylglyceryl-dextran to PECA) NMR experiments which were characterised by the low
intensity of signals from alkylglyceryl-dextran moieties as compared with those from alkyl
cyanoacrylate groups (Figure 3.5). Since it has been observed that sequential washing and
centrifugation of nanoparticles from dextran and BCA reduces the PBCA:dextran ratio to
9:1, it may be reasonably assumed that a significant amount of dextran is simply
physisorbed onto the nanoparticles (170).

Preparation and characterisation of nanoparticles
73
Table 3.4: Percentage elemental composition of PECA-alkylglyceryl dextran NPs (experimentally found and calculated)
S/No Material g %DS X %PECA (w) %Dex-G (w)
Found (av%C)
Cal C.% Found (av%H)
Cal. (H%)
Found (av%N)
Cal.(%N) av%O(100-CHN)
1 PECA Dex6G4
4 87.7 26.29 92.25 7.75 55.94 57.22 5.77 5.83 10.33 10.33 27.96
2 PECA Dex100G4
4 68.49 26.66 92.99 7.01 56.07 57.17 5.81 5.79 10.41 10.41 27.71
3 PECA Dex6G8
8 114.94 10.21 80.38 19.62 56.31 58.03 6.34 6.51 8.65 8.65 28.70
4 PECA Dex100G8
8 64.91 46.35 95.92 4.079 56.22 57.51 5.73 5.78 10.67 10.67 27.38
5 PECA Dex6G12
12 54.35 31.04 94.34 5.66 56.31 57.61 5.89 5.88 10.41 10.41 27.39
6 PECA Dex100G12
12 67.56 49.07 96.09 3.91 56.35 57.69 5.82 5.83 10.63 10.63 27.19
7 PECA Dex6G16
16 133.33 19.84 88.09 11.91 56.95 59.36 6.45 6.61 9.13 9.133 27.47
8 PECA Dex100G16
16 144.92 17.32 86.07 13.93 57.22 59.78 6.58 6.80 8.78 8.78 27.42
9 PECA Dex10G4A
4 68.49 36.92 94.84 5.159 56.81 57.29 5.67 5.75 10.62 10.62 26.90
10 PECA Dex100G16A
16 144.92 18.85 87.05 12.95 57.99 59.63 6.35 6.72 8.94 8.94 26.73
g = no of C atoms in the alkyl group present in the pendent chain (in substituted dextran) %DS = the degree of substitution of dextran with pendent chains (as calculated by NMR) X = molar ratio (ECA monomer : dextran glucopyranose units) ECA C6H7NO2 Dex C6H10O5 G C(g+3)H(2g+6)O2 (equations in Appendix 11)

Preparation and characterisation of nanoparticles
74
For the 1H-NMR determination of the percentage degree of substitution (%DS) of
modified dextran used for nanoparticles formulation, the ratio of the intensity of the
resonance integral of the terminal methyl of the alkylglycerol chain (A) was divided by
three-times (corresponding to the ratio of attaching protons) the intensity of the integral
of the signal due to the anomeric proton of the pyranose ring of the glucose unit of
dextran (equation 3.1). As expressed, %DS is defined as the number alkylglycerol chains
attaching per 100 glucose units of dextran (171) normalised with reference to the
maximum theoretical percentage of 300 for the fully –OH substituted pyranose groups
structure.
100*3
%B
ADS (eq. 3.1)
3.4.3 MALDI-TOF-MS of PECA-alkylglyceryl dextran NPs
Figure 3.8 MALDI TOF spectrum of PECADex6G4
PECA-Dex6G4 NPs Peak to peak mass differences between neighbouring peaks was ca.
130 Da, which may be explained in terms of the mass loss corresponding to the PECA
OO
OH
O O
O
O
OHO
O
N
C14
H25
O8
321.1549 Da
C6H
7NO
2
125.0477 Da
114.2
130.1
130.1

Preparation and characterisation of nanoparticles
75
fragment. The spectrum exhibits the characteristic features of carbon-oxygen bond
fragmentation (Figure 3.8).
Figure 3.9: MALDI TOF spectrum of PECA-Dex6G12
PECA-Dex6G12 NPs characteristic peak-to-peak mass differences was ca. 125 Da,
indicating that PECA was eliminated by means of carbon-oxygen bond fragmentation
(figure 3.9). Other spectra were appended in (Appendix 8).
The most characteristic fragment mass loss was that of PECA, which is consistent with the
80-90% proportion of PECA that was calculated from elemental analysis data. This large
percentage of PECA structural units in nanoparticle structures may account for the mass
loss of 125 Da observed for most nanoparticles except those from PECA-Dex100G4 and
PECA-Dex6G4 that had peak differences of 130 Da (Table 3.5) and those from
PECADex6G8 (Table 3.5) which did not have consistent characteristic of 125 Da peak-to-
peak fragment mass difference (172).
OO
OHO O
O
O
OH
O
O N
C24
H47
O8
463.3271 Da
C6H
8NO
2
126.0555 Da
CH2
N
COOEt
Molecular Formula = C6H
7NO
2
Formula Weight = 125.12528
125.1
16.0
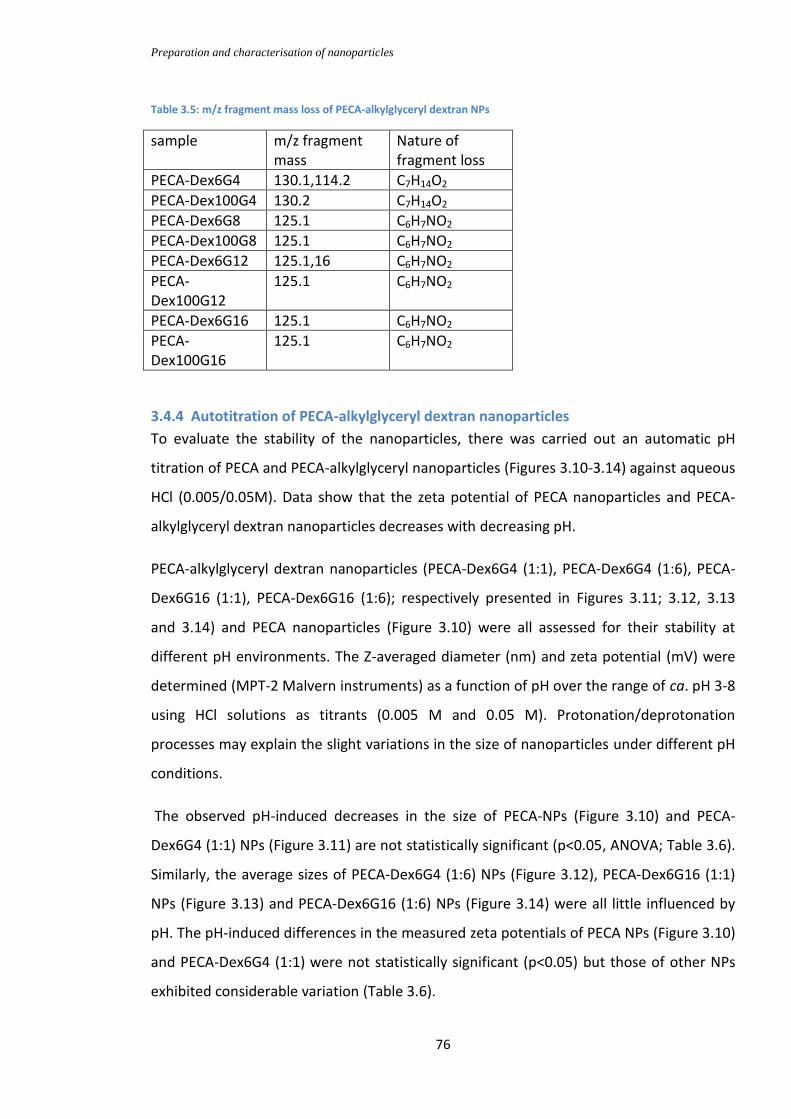
Preparation and characterisation of nanoparticles
76
Table 3.5: m/z fragment mass loss of PECA-alkylglyceryl dextran NPs
sample m/z fragment mass
Nature of fragment loss
PECA-Dex6G4 130.1,114.2 C7H14O2
PECA-Dex100G4 130.2 C7H14O2
PECA-Dex6G8 125.1 C6H7NO2
PECA-Dex100G8 125.1 C6H7NO2
PECA-Dex6G12 125.1,16 C6H7NO2
PECA-Dex100G12
125.1 C6H7NO2
PECA-Dex6G16 125.1 C6H7NO2
PECA-Dex100G16
125.1 C6H7NO2
3.4.4 Autotitration of PECA-alkylglyceryl dextran nanoparticles
To evaluate the stability of the nanoparticles, there was carried out an automatic pH
titration of PECA and PECA-alkylglyceryl nanoparticles (Figures 3.10-3.14) against aqueous
HCl (0.005/0.05M). Data show that the zeta potential of PECA nanoparticles and PECA-
alkylglyceryl dextran nanoparticles decreases with decreasing pH.
PECA-alkylglyceryl dextran nanoparticles (PECA-Dex6G4 (1:1), PECA-Dex6G4 (1:6), PECA-
Dex6G16 (1:1), PECA-Dex6G16 (1:6); respectively presented in Figures 3.11; 3.12, 3.13
and 3.14) and PECA nanoparticles (Figure 3.10) were all assessed for their stability at
different pH environments. The Z-averaged diameter (nm) and zeta potential (mV) were
determined (MPT-2 Malvern instruments) as a function of pH over the range of ca. pH 3-8
using HCl solutions as titrants (0.005 M and 0.05 M). Protonation/deprotonation
processes may explain the slight variations in the size of nanoparticles under different pH
conditions.
The observed pH-induced decreases in the size of PECA-NPs (Figure 3.10) and PECA-
Dex6G4 (1:1) NPs (Figure 3.11) are not statistically significant (p<0.05, ANOVA; Table 3.6).
Similarly, the average sizes of PECA-Dex6G4 (1:6) NPs (Figure 3.12), PECA-Dex6G16 (1:1)
NPs (Figure 3.13) and PECA-Dex6G16 (1:6) NPs (Figure 3.14) were all little influenced by
pH. The pH-induced differences in the measured zeta potentials of PECA NPs (Figure 3.10)
and PECA-Dex6G4 (1:1) were not statistically significant (p<0.05) but those of other NPs
exhibited considerable variation (Table 3.6).

Preparation and characterisation of nanoparticles
77
Figure 3.10: Effect of pH on PECA-nanoparticles (0.25mg/mL) MPT-2 Titration-[0.005M/0.5M HCl] (n=2, ±SD)
Figure 3.11: Effect of pH on PECA-Dex6G4 (1:1) nanoparticles (0.25mg/mL); MPT-2 Titration (0.005/0.5M HCl; n=3 ±SD)
-50
-40
-30
-20
-10
0
10
0
100
200
300
400
500
600
700
800
7.44 6.99 6.65 5.83 5.46 5.09 4.67 4.16 3.71 3.2
Zeta potential (mV) Z.av.diameter (nm)
pH
size zeta
-40
-35
-30
-25
-20
-15
-10
-5
0
0
100
200
300
400
500
600
7.78 7.42 7.02 6.6 6.19 5.5 5.15 4.61
Zeta potential (mV) Z.av.diameter(nm)
pH
size zeta

Preparation and characterisation of nanoparticles
78
Figure 3.12: Effect of pH on the characteristics of PECA-Dex6G4(1:6) nanoparticles (0.25mg/mL); MPT-2 Titration (0.005/0.5M HCl; n=3 ±SD).
Figure 3.13: Effect of pH on PECA-Dex6G16(1:1) nanoparticles (0.25mg/mL); MPT-2 Titration (0.005/0.5M HCl; n=3 ±SD).
-35
-30
-25
-20
-15
-10
-5
0
100
200
300
400
500
600
700
7.47 7.13 6.66 5.88 5.19 4.88 4.61 4.19 3.68 3.21
Zeta potential (mV) Z-av.diameter (nm)
pH
size zeta
-45
-40
-35
-30
-25
-20
-15
-10
-5
0
0
50
100
150
200
250
300
350
400
7.63 7.26 6.71 6.33 5.68 5.39 4.94 4.49 3.97 3.53 3.04
Zeta potential (mV) Z.av.diameter (nm)
pH
size zeta

Preparation and characterisation of nanoparticles
79
Figure3.14: Effect of pH on PECA-Dex6G16 (1:6) nanoparticles (0.25mg/mL); MPT-2 Titration (0.005/0.5M HCl; n=3 ±SD).
Table 3.6: Comparison of effects of pH on the size and zeta potential of titrated nanoparticles
Sample
Size Zeta
potential
ANOVA (p)
1 PECA 0.262 0.193
2. PECA-Dex6G4(1:6) 0.785 0.022
3. PECA-Dex6G4(1:1) 0.056 0.184
4. PECA-
Dex6G16(1:1)
0.685 0.001
5. PECA-
Dex6G16(1:6)
0.158 0.000
(p < 0.05 significant)
-45
-40
-35
-30
-25
-20
-15
-10
-5
0
0
50
100
150
200
250
300
350
400
450
8.1 7.47 7.17 6.73 6.05 5.41 4.91 4.65 4.36 3.86 3.36
Zeta potential (mV) Z.av.diameter(nm)
pH
size zeta

Preparation and characterisation of nanoparticles
80
3.4.5 Preparation of PBCA-Dex100G4 nanoparticles
PBCA-Dex100G4 nanoparticles were characterised for size, PDI and zeta potential with
DLS and NTA (Table 3.7), NTA (Figure 3.15) and further with FTIR (Figure 3.16). The
functional group of interest were noted as: C=O stretch at 1743.88 cm−1; C–O stretches in
the range 1300 - 1000 cm−1; hydrocarbon functionalities CH, CH2 and CH3, respectively at
2954, 1450 and 1374 cm−1; OH absorption at 3500–3200 cm−1 (168); and CN band at 2242
cm−1 (173).
Table 3.7: Size, PDI and zeta potential of PBCA-Dex100G4 NPs (n=1)
DLS NTA
Z-av.diameter(nm) 149.8±1.2 120.3±35.5
PDI 0.394± 0.018
Zeta potential
(mV)
-47.8± 2.0
Figure 3.15: Size concentration intensity distribution of PBCA-dex100G4 NPs

Preparation and characterisation of nanoparticles
81
Figure3.16 FTIR spectrum of PBCA-Dex100G4 NPs
3.4.6 Preparation of PLA15-Dex100G8-PECA
Alkylglyceryl dextran, PLA and ECA were all incorporated into a single multi-block
structure through the simple polymerisation procedure of nanoprecipitation solvent
displacement.
PLA-Dex100G8-PECA was prepared (n=3) in nanoparticulate form with narrow size
distribution (Table 3.8).
Table 3.8: Size and PDI of PLA15-Dex100G8-PECA NPs (±SD, n=3)
The combination of alkylglyceryl dextran, PLA and ECA was used in an attempt to
formulate PLA15-Dex100G8-PECA nanoparticles that are both stable in suspension and
flexible. ECA was employed as the crosslinker that connects covalently the polymer
chains. Since available OH groups in both PLA and alkylglyceryl dextran could serve as the
Parameter Value
Z-av.diameter(nm) 143.13±1.70
PDI 0.19±0.10

Preparation and characterisation of nanoparticles
82
initiating site for the polymerisation of ECA, the covalent bond formed by PECA served as
a link between the alkylglyceryl dextran chain on one side and the PLA on the other.
Other intermolecular forces (H-bond and van der Waals interactions) are however
assumed to be of significance in maintaining the nanoparticulate structure in suspension.
The NMR spectrum of PLA15Dex100G8PECA (Figure 3.17) shows the characteristic methyl
and methylene resonances of PLA at 1.45 ppm and 5.19 ppm, respectively; the 1.2 ppm
signal in the spectrum of PECA is attributed to methyl protons while that at 4.2 ppm is
assigned to the methylene proton of PECA. The anomeric proton of the pyranose ring of
dextran is manifested at 4.67 ppm. Protons corresponding to the alkylglyceryl chain
methyl group are observed at 0.87 ppm.
Figure 3.17: 1H-NMR spectrum of PLA15-Dex100G8-PECA (400 MHz).
3.4.7 TGA and DSC thermograms of PLA-Dex100G8-PECA
Figure 3.18 shows the TGA plots of a sample of PLA-Dex100G8-PECA which had been
heated to 600°C under a nitrogen atmosphere and then subjected to an oxidative
treatment (synthetic air) to 1000 °C.
d
c
a
b
z
fe
R= H or
c d
b e
a
f

Preparation and characterisation of nanoparticles
83
In the temperature range up to 600 °C there are at least three mass loss steps. The major
mass loss (51.4%) occurs at a rate (peak in DTG curve) at 168.6 °C. This step is marked by
a shoulder (at 192.4°C) in the DTG signal, which indicates the complexity of the
mechanism of degradation. The second step is associated with a mass loss of 42.4% and is
characterised by a rate maximum at 333.3 °C. The final (third) step exhibits a mass loss of
5.5 %. Exposure of the sample to synthetic air causes a further mass loss of 1.2%.
Figure 3.18: TGA plots of PLA-Dex100G8-PECA NPs
DSC results for the sample of PLA-Dex100G8-PECA.
In (Figure 3.19) the sample was heated from -100 °C up to 100 °C at a heating rate of 10
K/min. Indicative of a glass transition, the first heating cycle (blue curve) identifies a
thermal event at 54.2 °C (midpoint) which is accompanied by a change in specific heat
capacity of 0.444 J/g*K. The shift in heat capacity is partially overlapped by a relaxation
event that is centred at 60.1 °C. The same plot shows a small endothermic effect, which is
most likely associated with the onset of evaporation or that of oxidative degradation of
some sample components.
The second heating cycle (green curve) confirms the glass transition temperature of the
sample at 49.6 °C, with a change in the specific heat capacity of 0.232 J/(g*K). The

Preparation and characterisation of nanoparticles
84
endothermic relaxation effect observed during the first heating was reproduced during
the second heating run.
Figure 3.19: DSC of PLA-Dex100G8-PECA NPs
3.4.8 Preparation of PLA-derived nanoparticles by zero length crosslinking
P4041EB_PROTON-3 .esp
5.0 4.5 4.0 3.5 3.0 2.5 2.0 1.5 1.0
Chemical Shift (ppm)
0
0.5
1.0
1.5
2.0
2.5
Norm
alized Inte
nsity
Figure 3.20:
1H-NMR spectrum of PLA15-Dex100G8 nanoparticles.

Preparation and characterisation of nanoparticles
85
Figure 3.21: H/H-COSY NMR of PLA15-Dex100G8 nanoparticles.
Figure 3.22:
13C-NMR of PLA15-Dex100G8 nanoparticles
X : p a r t s p e r M i l l i o n : 1 H
5 . 0 4 . 0 3 . 0 2 . 0 1 . 0
Y : p a r t s p e r M i l l i o n : 1 H
5 . 0
4 . 0
3 . 0
2 . 0
1 . 0
( M i l l i o n s )
1 . 0 2 . 0
p r o j e c t X
( M i l l i o n s )
1 . 0
2 . 0
p r o j e c t Y
P4041EB_CARBON-3 e223.esp
170 160 150 140 130 120 110 100 90 80 70 60 50 40 30 20
Chemical Shift (ppm)
0
0.05
0.10
0.15
Norm
alized Inte
nsity

Preparation and characterisation of nanoparticles
86
The grafting of PLA to alkylglyceryl dextran (PLA-Dex100G8) has been successful in that it
yielded nanoparticles that are readily dispersible in water. The nanoparticles were
characterised with NMR spectroscopy, 1H (Figure 3.20), H/H-COSY (Figure 3.21) and 13C-
NMR (Figure 3.22). The mixing of alkylglyceryl dextran and PLA in the 1:2 ratio results in
insufficient crosslinking as witnessed by the significant amounts of unreacted PLA that are
removed during purification. Consequently the mixing of these materials in the 1:1 ratio,
which will result in considerably lower loses of PLA during purification, was suggested for
subsequent reactions.
PLA15-Dex100G16(or4) nanoparticles were synthesised successfully, but their purification
required several steps (166) and was conducted in a way that two fractions of the material
were obtained. While both fractions of nanoparticles exhibited the characteristic 13C- and
1H-NMR resonances of glyceryl-dextran and PLA, it was the 1H NMR spectra of the
acetone fraction that showed PLA and alkylglycerol chain resonances that were of notably
higher intensity than that of dextran, as is desirable. The acetone fraction was associated
with the dominant yield of 50-70%.
The chemical shifts of 13C-NMR and 1H-NMR of dextran were in agreement with published
data (159, 172, 174-177), with characteristic features in their ranges 65 ppm to 99 ppm for
13C NMR, and 3 ppm to 5.2 ppm for 1H NMR. Slight variations in the observed chemical
shifts are attributed to solvent effects (178). The chemical shifts of PLA both in 13C- and
1H-NMR were consistent with the structure of PLA, exhibiting 13C-NMR multiplets at
169.53-169.75 ppm (–CO), 69.23 ppm (–CH), and 17.00 ppm (–CH3), and 1H-NMR
resonances at 5.19 ppm (CH) and 1.46 ppm (CH3); the observed chemical shifts correlate
well with published data (179, 180).
3.5 Enzymatic degradation of PECA-alkylglyceryl dextran nanoparticles
The degradation study of PECA-Dex100G4 nanopaticles, along with that of a control
sample, was conducted at constant enzyme concentration and variable enzyme
concentration. The use of heat to stop the degradation process resulted in the formation
of cloudy solutions, which could not be utilised effectively for further analysis.

Preparation and characterisation of nanoparticles
87
The measurement of size and PDI by DLS did not reveal any statistically significant
differences in the degradation behaviour of control and enzyme-containing PECA-
Dex100G4 nanoparticles (Figure 3.23, 3.24 and 3.25). It is possible that the amount or
activity of the enzyme utilised was not sufficient to bring about the significant
degradation of the nanoparticles within the timescale of the experimental protocol,
especially since the degradation of PECA-Dex100G4 NPs was found to be dependent on
both time and enzyme concentration: the longer the time of the experiment or the higher
the concentration of the enzyme, the faster the degradation. Notably, PECA-nanoparticles
are known to be susceptible to surface degradation (181).
Figure 3.23: Effect of time on size and PDI of PECA-Dex100G4 nanoparticles (n=3, ±SD; control, no enzyme)
0
0.1
0.2
0.3
0.4
0.5
0.6
0.7
0.8
0
50
100
150
200
250
300
350
400
450
500
0.5 1 2 3 4
PDI Z-av.diameter(nm)
Time (h)
SIZE PDI

Preparation and characterisation of nanoparticles
88
Figure 3.24: Effect of constant enzyme concentration on size and PDI of PECA-Dex100G4 nanoparticles (n=3, ±SD).
Figure 3.25: Effect of enzyme concentrations on size and PDI of PECA-Dex100G4 nanoparticles (n=3, ±SD).
0
0.1
0.2
0.3
0.4
0.5
0.6
0.7
0
100
200
300
400
500
600
2 2 2 2 2
PDI Z.av.diameter (nm)
Enzyme conc. mg/mL
SIZE PDI
0
0.1
0.2
0.3
0.4
0.5
0.6
0.7
0
50
100
150
200
250
300
350
400
1 2 3 4 5
PDI Z.av.diameter (nm)
Enzyme conc. mg/mL
size PDI

Preparation and characterisation of nanoparticles
89
The effect of increased enzyme concentration on the degradation pattern of PECA-
Dex100G4 NPs
Figure 3.26: Enzyme-mediated degradation of PECA-Dex100G4 nanoparticles during the first 4h of the extended study (0, 1 and 4 h time points) for different enzymatic activity (A= 0 units; B= 120 Units; C= 220 Units; D= 420 units; E=620 units; F=1220 units).
Consideration of the data for the first 4 h of the 84 h degradation study, for all the sample
sets there was an apparent decrease in size during the first hour of the experiment
(Figure 3.26), and also between aliquots of A, B and C sampled at the first- and fourth-
hour periods; this is in agreement with published data on PBCA nanoparticles (168).
Aliquots of D, E and F sampled at four hours from the onset of the experiment exhibited
increased sizes relative to those sampled at one hour. The increases in the size of D, E,
and F after four hours of incubation with the enzyme were witnessed as initiation of
aggregation. The increase appears to be directly related to enzyme concentration. In
accord with the findings of Muller et al. (181), who reported the NaOH-induced surface
degradation of PECA-nanoparticles, the degradation pattern observed with samples A, B
and C could be consequent to surface degradation whereby PECA becomes depleted over
time; the increase in size observed for D, E and F after the expected initial decrease may
be explained in terms of agglomeration that is consequent to the complete degradation
0
200
400
600
800
1000
1200
A-size B-Size C-size D-size E-size F-size
Z.av.diameter(nm)
0
1
4

Preparation and characterisation of nanoparticles
90
of the nanoparticles (Figure 3.27); considering the high concentration of the enzyme, it is
possible that depleted NPs plays a significant role in this process. The esterase enzyme
degradation study showed that the degradation of nanoparticles is directly proportional
to the amount of enzyme, which is in agreement with published data (182), and that the
higher the enzyme concentration the faster the degradation.
Figure 3.27: Enzyme degradation of PECA-Dex100G4 over time, for different enzymatic activity (A= 0 units; B= 120 Units; C= 220 Units; D= 420 units; E=620 units; F=1220 units).
3.6. Conclusions
In our hands, ethyl 2-cyano-3-ethoxyacrylate on its own could not be formulated into
stable nanoparticles. The synthesis of PECA in phosphate buffer resulted in the formation
of NPs that were characterised by poor yield, low zeta potential and high conductivity.
PBCA-Dex100G4 NPs was prepared at an average size of 149.8 nm and zeta potential of -
47.8 mV. FTIR studies confirmed the presence of the cyanoacrylate group since the
spectra exhibit the characteristic stretching vibrations of C=O (1743.88 cm−1), CN (2242
cm-1) and C-O (1300 - 1000 cm-1).
The dispersion of nanoparticles in water and its subsequent filtration through a PES
membrane showed that the filtering process does not influence the DLS-determined
characteristics of nanoparticles.

Preparation and characterisation of nanoparticles
91
Alkylglyceryl dextran was successfully reacted with PLA through the zero-length grafting
of PLA to alkylglyceryl dextran in the presence of DCC. As determined by 1H NMR, the
degree of grafting of PLA to alkylglyceryl dextran was 163.9%.
An esterase-induced degradation study of samples of PECADex100G4 showed that the
higher the enzyme concentration the faster the degradation, as evidenced by the rate of
the agglomeration process that accompanies nanoparticle depletion.

Loading of nanoparticles with drugs peptide and fluorophores
92
4
4. Loading of nanoparticles with drugs, peptides and fluorophores
The labelling of drug delivery vehicles with fluorescent dyes is rationalised in this work in
terms of the capability to track the progress of the label through the host environment by
means of the many fold array of fluorescence-detection technologies. To facilitate cell
interaction studies, fluorophores, peptides and fluorescence drugs were loaded or tagged
to the synthesised NPs.
4.1. Actives and fluorophores
Rhodamine B (Figure 4.1) is an organic dye that has been used traditionally as a tracer dye
in water to determine the rate and direction of flow. Owing to its highly fluorescent
nature and solubility in water, methanol and ethanol, Rhodamine B has found extensive
use as a tracer molecule in biomedical research.
Figure 4.1: Chemical structure of Rhodamine B
Curcumin, found in rhizomes of curcuma longa or tumeric, is a low molecular weight
diphenol-functionalised bis–α,β-unsaturated β-ketone that exists in equilibrium with its
enol tautomer (183). Curcumin (structure in Figure 4.2) is soluble in both polar and non-
polar organic solvents. Although highly insoluble in water (11 ng/mL), it is soluble in
alkaline or extremely acidic aqueous solvents; the pH-dependent solubility is assumed to
be due to ionisation of the phenolic or enolic groups and/or due to degradation. This is
Cl-

Loading of nanoparticles with drugs peptide and fluorophores
93
witnessed by the solvent-dependent UV-vis absorption profile of Curcumin. Toluene
solutions of the material fluorescence strongly, exhibiting maximum absorption at 418
nm (184). The main degradation products of Curcumin (185) are ferulic acid,
feruloylmethane, vanilline and acetone. Curcumin is known to possess many therapeutic
effects but is rapidly eliminated from systemic circulation (186).
Figure 4.2: Chemical structure of Curcumin
It has been suggested that the low bioavailability of Curcumin limits its capability to reach
target tissues where it can exert its claimed pleiotropic effects. Hence, the covalent
attachment of Curcumin to nanoparticles represents one approach towards overcoming
this limitation.
Because of its low aqueous solubility and its amphiphilic nature, the fluorescence
intensity of Curcumin decreases with increasing water volume and also decreases as the
acidity of its liquid host varies from neutral to extremely acidic or to basic (pH >8.0) (185).
The absorption and fluorescence capacity of Curcumin may be used to both locate and
quantify the molecular distribution in normal and tumour cells (187). The fluorescence of
the molecule allows the visualisation of the distribution of Curcumin while UV absorption
measurements provide a means for the quantification of this molecule within a specified
sample size, rendering the molecule suitable for the assessment of the fate of Curcumin-
loaded nanoparticles for delivery through the BBB. However, the determination of the
fate of Curcumin in living tissues is limited by its amphiphilic nature and susceptibility to
degradation: deprotonation of Curcumin effects spectral changes, both in terms of the
extinction coefficient and in terms of the spectral profile (184) while degradation is
manifested by colour change. Furthermore, the steady-state absorption and

Loading of nanoparticles with drugs peptide and fluorophores
94
fluorescence characteristics of Curcumin are sensitive to the immediate environment due
to keto-enol isomerism. The loading of Curcumin amphiphilic NPs may therefore lead into
structural changes that need to be taken into consideration in attempts to follow the fate
of such nanoparticles. These potential complications are balanced by the capability of
Curcumin-labelled nanoparticles to fluoresce in the blue laser channel, which renders
those nanoparticles amenable to direct visualisation under the optical microscope. Also,
the use of Curcumin fluorophores is complementary with the concomitant use of DAPI
(4’6-diamino-2-phenyl indole) nuclear stain. Although the spectral characteristics of
Curcumin are sensitive to solvent polarity (188), the molecule displays an intense
absorption band in the region 350-480 nm in all media of interest for this work.
Figure 4.3: Chemical structure of Doxorubicin hydrochloride
Doxorubicin (Figure 4.3) has been described as a very potent anti-cancer agent (189, 190)
that has great potential for CNS chemotherapy but lacks the ability to cross the BBB
because it is a substrate for the ATP-dependent efflux pump P-glycoprotein (P-gp) at the
base of the BBB (191, 192). Prerequisite to the transport of Doxorubicin to the brain is the
development of a suitable carrier that can cross or circumvent this barrier (193). Studies
with P-gp suppressors (e.g. Cyclosporine A) have shown that significant amounts of
Doxorubicin may be capable of penetrating the BBB following administration (191, 194).
Also, PACA nanoparticles have been associated with the transport of Doxorubicin to the
brain in significant amounts (91, 195). In another example, co-administration of
Doxorubicin and Curcumin that had been loaded into PACA/chitosan nanoparticles has
been suggested to increase the penetration of Doxorubicin across the BBB (196). An
additional benefit associated with the use of nanopolymeric PACA carriers is the claimed
lowering of the cardiotoxicity of Doxorubicin, which is a known side effect that limits its
.HCl
2
Loading of nanoparticles with drugs peptide and fluorophores
95
use for therapeutic purposes (193, 197, 198). The change in the biodistribution profile of
Doxorubicin NPs may be responsible for the relatively low cardiotoxicity of this agent.
The ratio of copolymer to PECA in Doxorubicin nanoparticles is reported to influence the
initial burst release of the drug from the nanoparticulate matrix, as is exemplified by the
observation that a structure of PECA-PLGA in the 1:1 ratio exhibits reduced losses during
the initial burst release of Doxorubicin (199). The burst release behaviour seen in this
study may be due to the adopted ratio (1:6) of alkylglyceryl dextran to PECA. Notably,
emulsifier-free PBCA loaded with Doxorubicin is reported to release its drug content very
slowly, exhibiting a half-life of over 100 h in PBS (200).
4.2 Methods and instrumentation
Dialysis membrane (10000-MWCO) and PBS tablets were sourced from Sigma-Aldrich.
Other equipment used included a: Perkin Elmer UV-Vis spectrophotometer, Grant water
bath, Varian Cary Eclipse Fluorescence spectrophotometer, Falcon tubes (50 mL). The
Perkin Elmer UV-Vis spectrophotometer was zeroed before use, with the wavelength set
between 400-750nm. Samples were measure individually by placing the sample-
containing cuvette against that of the reference sample. A Varian Cary Eclipse
spectrophotometer recorded fluorescence measurements after placing the sample-
containing cuvettes in the pre-zeroed sample reading chamber; the wavelength was set
according to absorbance wavelength of the sample to be measured (excitation-emission)
and data were processed using Cary Eclipse software. Mini-spin Eppendorf centrifuge.
4.2.1. Loading of PECA-Dex, PECA-Dex100G4 and PECA-Dex100G8 NPs with Rhodamine B
Rhodamine B solution (10 µl, 10 µg/µl) was added to a stirred suspension of PECA-Dex,
PECA-Dex100G4 and PECA-Dex100G8 nanoparticles each (1 mL, 20 mg/mL) and stirring
was continued for 3h at room temperature. After this time, the nanoparticles where
separated by centrifugation (18000 g) and re-suspended in deionised water (5 mL)
characterised by DLS (Figure 4.6).
For the preparation of Polysorbate 80-coated nanoparticles, Polysorbate 80 (100 µl, 10%
w/v) was added into the stirred suspension of PECA-Dex100 nanoparticles (tagged with
Rhodamine B) to a final concentration of 1% (w/v) and stirring was continued for a further

Loading of nanoparticles with drugs peptide and fluorophores
96
30min. The particles were separated by centrifugation using the Eppendorf centrifuge
(12200 rpm, 30 min) and re-dispersed following rinsing with deionised water and re-
suspension in deionised water (5mL) under sonication (10 min) and characterised with
DLS (Table 4.1); the NTA fluorescing video record is placed in (Appendix 5).
Monitoring the release of Rhodamine B
PECA-dex, PECA-Dex100G4 and PECA-Dex100G8 nanoparticulate samples (2 mg) that had
been loaded with Rhodamine B were each dispersed in PBS (10 mL, pH 7.4), and
sonicated for 10 min before 1.5 mL of each solution was introduced into an 1.5 mL
Eppendorf tube and incubated in a water bath (Grant thermostat temperature shaker,
thermostatted at 37°C). Samples were removed sequentially at specified time intervals
and centrifuged (12200 rpm, 15 min). To a specified volume of the supernatant (1 mL)
was added to PBS (2 mL) and the absorbance was recorded over the UV range 650 nm to
450 nm using a Elmer Perkin instrument; the variation in the intensity of the absorption
maximum (564.76 nm) was monitored at specified time intervals. Since the release of
Rhodamine B from nanoparticles was found to be very limited, this study was
discontinued.
4.2.2 PECA-Dex100G4 and PLA-Dex100G8PECA Nanoparticle-loading with Curcumin: the
EtOH/H2O (1:1) method
Curcumin (0.1 mg) was loaded onto PECA-Dex100G4 NPs and PLA-Dex100G8PECA NPs
(100 mg) by stirring (overnight, room temperature) nanoparticles in ethanol-water (1:1
v/v). After this time, the samples were spun at 12200 rpm for 15 min using the mini-spin
Eppendorf and the absorbance of the supernatants (1 mL aliquot to which 2 mL of DMSO
had been added) were taken to determine the degree of loading. Concentration was
determined using the equation of the calibration curve of Curcumin (Appendix 12).
4.2.2.1 Determination of Curcumin content of PECA-Dex100G4 NPs and PLA-Dex100G8-
PECA NPs
Freeze-dried nanoparticles (20 mg) of PECA-Dex100G4 and PLA-Dex100G8-PECA that had
been loaded with Curcumin were each dissolved in DMSO (3 mL) and their absorbance
were measured to allow the determination of the concentration of released Curcumin,
which corresponds with that loaded onto the specified weight of nanoparticles. Again,
loading was determined with reference to the standard plot of Curcumin in DMSO.

Loading of nanoparticles with drugs peptide and fluorophores
97
4.2.2.2 Loading of Curcumin into PECA-Dex100G4 nanoparticles: cross linking with acetic
acid and TPP (Tripolyphosphate)
The loading of PECA-Dex100G4 NPs with Curcumin was conducted according to the
method of Rejinold et al. (201) in which acetic acid and Tripolyphosphate (TPP) were
employed to promote entrapment to the nanoparticles. A release study was conducted in
which a portion (0.008 g) of the pellet was dispersed in PBS (10 mL) before being
distributed into 9 Eppendorf tubes that were subsequently incubated at 37oC in a Grant
water bath. Aliquots were withdrawn at specified time periods and each sample was spun
for 5 min at 5000rpm; the method was not suitable because the released Curcumin was
either sticking to the container or washed off during the process of supernatant removal.
4.2.2.3 Loading and release of Doxorubicin hydrochloride from PECA-Dex6G4 NPs and
PECA-Dex6G8 NPs by nanoprecipitation-solvent evaporation.
Doxorubicin was loaded by nanoprecipitation using acetone as the organic solvent for
ECA.
Preparation of the NPs was by the monomer polymerisation method. ECA (150 µl) in
acetone (25 mL) was gradually added to a stirring mixture of Dex6G4 or Dex6G8 (25 mg)
in water (25 mL, 18.2mΩ) followed by Doxorubicin hydrochloride (2 mg) in acetone
(concentration 2 mg/mL). The reaction mixture was allowed to stir overnight (room
temperature) and the colloid that formed was separated by centrifugation at 40000 rpm
for 30min. The amount of unloaded Doxorubicin hydrochloride in the supernatant was
determined fluorimetrically. The pellet was dispersed in deionised water (10 mL) and
after sonication (10 min) an aliquot (5 mL) of each sample was extracted and used for the
release study. To this end, the aliquot (5 mL) of either PECA-Dex6G4-Dox or PECA-
Dex6G8-Dox was placed in a dialysis membrane bag and immersed in 50 mL capacity
falcon tubes containing PBS (20 mL). The calculated amount of the free Doxorubicin
hydrochloride equivalent contained in the nanoparticles was used as control. The samples
were incubated in water bath (37°C) at an oscillating speed of 100 rpm. At specified time
intervals, an aliquot (1 mL) of each sample was withdrawn and replaced with fresh media.
Fluorescence intensity was measured using a Varian Cary Fluorescence
spectrophotometer (Excitation and Emission wavelengths respectively at 480 nm and 590
nm) and the amount of drug released at each time point was quantified by comparison
against the Doxorubicin hydrochloride calibration curve (Appendix 14).

Loading of nanoparticles with drugs peptide and fluorophores
98
4.2.4 The preparation of PECA-Dex100G4-Dox
Method: The preparation of PECA-Dex100G4-Dox was by the anionic emulsion
polymerisation method, which is widely employed for the formulation of cyanoacrylate
monomers into nanoparticles. ECA (100 µl) was gradually added to Dex100G4 (100 mg) in
water (50 mL; 18.2 mΩ, pH 2.5) containing Doxorubicin hydrochloride (1.5 mg) and
allowed to stir at room temperature for 4 h before neutralisation with aqueous NaOH (1
N). The colloid that formed was filltered through P3 sintered glass. An aliquot of specified
volume was taken and subjected to centrifugation (40000 rpm, 30 min). The pellet was
dispersed in water (10 mL, 18 mΩ) and sonicated and thereafter characterised by DLS.
Drug loading was calculated by subtraction following the determination of the drug
content of the supernatant by UV-Vis measurements (400 nm-750 nm; Doxorubicin
exhibits its absorbance maximum at 480nm). The Doxorubicin loading effeciency was
determined to be 68.7%.
4.2.5 Loading of Doxorubicin hydrochloride to PECA-Dex6G16 NPs
The monomer polymerisation method via nanoprecipitation by solvent evaporation was
used. To a flask (stirring) containing Dex6G16 (100 mg) and Doxorubicin (1.4 mg) in
deionised water (100 mL) was added gradually and in sequence a solution of ECA (ethyl 2-
cyanoacrylate; 600 µl) in acetone (100 mL). Stirring was continued overnight (room
temperature), after which time the mixture was spun (40000 rpm, 30 min; XL-90 Beckman
Ultracentrifuge) and the pellet was dispersed in deionised water, sonicated (10 min) and
freeze dried.
4.2.6 Determination of EGFP enhanced green fluorescence protein (EGFP)
PECA-Dex100G8-EGFP NPs were dispersed (1573 µg/mL) in PBS (pH7.4) and diluted to
specified concentrations before the measurement of absorbance at each dilution to
determine the concentration of EGFP through comparison with a BSA calibration curve
(Appendix 15).
4.2.7 Tagging of PECA-Dex100G8 with MIA
The tagging of MIA to NPs was accomplished according to a published procedure (202). To
a dispersion of PECA-Dex100G8 NPs (ca. 20 mg) in ethanolic sodium borate buffer (5 mL)
was added under sonication/vortexing a solution of MIA (20 mg) in ethanol (0.2 mL); a UV
lamp facilitated the detection of MIA (Figure 4.4; the MIA excitation and emission
wavelengths are at 350nm and 445nm respectively).The mixture was dialysed (72 hr) and

Loading of nanoparticles with drugs peptide and fluorophores
99
freeze dried. Nanoparticle size was determined (DLS and Nanosight). MIA attachment to
NPs was assessed further through visualisation by confocal microscopy (Appendix 9).
Figure 4.4: MIA reaction with PECA-Dex100G8
Purification of MIA-tagged nanoparticles with Sephadex
Column chromatography (Sephadex 50 medium) was used in an effort to increase the
purity of MIA-tagged NPs. After packing, the column was washed repeatedly with water
(18.2 mΩ), (the eluent) before the sample was introduced. Fractions were collected in
6mL aliquots. The second and third fractions were identified as those containing the
fluorophore-tagged NPs, with the second fraction containing the highest proportion.
Further fractions (up to nine 6mL aliquots) did not contain any fluorophore, as indicated
with aid of a UV lamp.
3
3
R= H or
EtOH
pH 8.5
Borate buffer

Loading of nanoparticles with drugs peptide and fluorophores
100
4.2.8 Tagging of MIA to PECA-Dex6G16 NPs and loading of Curcumin
Method: PECA-Dex6G16 NPs (200 mg) was dispersed in sodium borate/ethanol (1:1;
40mL) before being added to MIA (100 mg) in ethanol (20 mL). After sonication, the
mixture was shaken in Bio-Rad (2h, room temperature) before purification by dialysis (72
h). To the dialysed product was added Curcumin (1 mg) in acetone (2 mL) and stirring was
continued for 3h (room temperature). After filtering (P3 sintered glass), the
determination of Curcumin and MIA content in MIA-Curcumin-tagged nanoparticles was
carried out by utilising the dual wavelength capability of the fluorimeter (Cary Eclipse,
Varian Fluorescence Spectrophotometer). The excitation-emission wavelength of
Curcumin was set at 420nm-480nm and that of MIA was set at 350nm-445nm.
4.2.9 Tagging of Tetramethyl Rhodamine-5-carbonyl azide (TMRCA) to PECA-Dex6G12
nanoparticles
Method: PECA-Dex6G12 nanoparticles (50 mg) that had been dispersed in anhydrous
toluene (20 mL) and mixed with TMRCA (0.6 mg) were allowed to stir at 80°C for 5h under
an atmosphere of nitrogen (Figure 4.5) (203-205). After this time, the mixture was placed
in a dialysis-membrane vessel (3500MWCO) and first dialysed against DMF (HPLC grade,
Fisher) for 72 h before further dialysis against double-distilled water for 4 days. The
aqueous-medium-derived Tetramethyl Rhodamine-nanoparticles were freeze dried.
4.2.10 Evaluation of Evans blue retentive capacity
To evaluate the retentive capacity of the nanoparticles for the dye, after loading Evans
Blue to PECA-Dex6G4 NPs, the colloidal mixture that formed was centrifuged twice and
after each centrifugation cycle, the absorbance of supernatant was measured. After the
second centrifugation, the degree of loading was evaluated at 0.016% and the
entrapment efficiency at 2.034%. An attempt to load Evans blue into PECA-Dex6G12
nanoparticles yielded similar results; the calibration curve for Evans blue is appended
(Appendix 16).

Loading of nanoparticles with drugs peptide and fluorophores
101
Figure 4.5: Covalent linkage of Tetramethyl Rhodamine to PECA-Dex6G12 nanoparticles
-
+ -
+
(( )3
2 3)2
-
+
(( )3
2 3)2
-
+
()32 3)2
5h
N2.
atm.
(
R= H or

Loading of nanoparticles with drugs peptide and fluorophores
102
4.3 Results and discussion
4.3.1 Rhodamine
4.3.1.1 Rhodamine B loading into nanoparticles
The size distribution of nanoparticles tagged with Rhodamine B coated with Polysorbate
80 was within the range 400-500nm and exhibited low zeta potential (see example for
Rhodamine B-loaded PECA-Dex100 NPs in Table 4.1). The size distribution of NPs tagged
with Rhodamine B alone were within the size range 300 nm to 500 nm (Figure 4.6).
Table 4.1: Size, PDI and zeta potential of Rhodamine B-loaded, Polysorbate 80-coated PECA-Dex100 NPs
parameter value
Size (Z average) /nm 402.9±3.70
PDI 0.35±0.012
Zeta potential /mV -18.0±0.1
Figure 4.6: Size of Rhodamine B-loaded nanoparticles prepared from PECA-Dex, PECA-Dex100G4 and PECA-Dex100G8 (n=3)
0
100
200
300
400
500
600
700
800
PECA-Dex PECA-Dex100G4 PECA-Dex100G8
Size
(n
m)

Loading of nanoparticles with drugs peptide and fluorophores
103
4.3.2 Curcumin
4.3.2.1 PECA-dex100G4 and PLA-dex100G8PECA Nanoparticle-loading with Curcumin: the
EtOH/H2O (1:1) method
In accord with expectation due to the very low solubility of Curcumin in water, Curcumin
loading into nanoparticles was highly efficient (Table 4.2).
Table 4.2: The absorbance and concentration of Curcumin in the supernatant ( EtOH:H2O), (1:1) from the loading of NPs.
Sample Absorbance Concentration (µg/µl)
PLA-Dex100G8-PECA-Curcumin
0.47308 0.00285
PECA-Dex100G4-Curcumin
0.52779 0.00319
4.3.2.2 Determination of Curcumin content of PECA-Dex100G4 Nps and PLA-Dex100G8-
PECA NPs
Freeze-dried nanoparticles of PECA-Dex100G4-Curcumin NPs and PLA-Dex100G8-PECA-
Curcumin were evaluated for their Curcumin content (Table 4.3).
Table 4.3: concentration of Curcumin content of dissolved Curcumin loaded NPs
Sample Absorbance Concentration (µg/µl)
PLA-Dex100G8-PECA Curcumin
0.64525 0.00392
PECA-Dex1004G4 Curcumin
0.45075 0.00271
4.3.3. Doxorubicin
4.3.3.1 The preparation of PECA-Dex100G4-Dox
The preparation of PECA-Dex100G4-Dox by the anionic emulsion polymerisation method
yielded nanoparticles of low PDI and high zeta potential (Table 4.4).
Table 4.4: Size, PDI and zeta potential of PECA-Dex100G4-Dox nanoparticles
sample Size PDI Zeta potential
PECA-
Dex100G4-Dox
281.0±6.7 nm 0.153±0.022 -35.7±2.7 mV

Loading of nanoparticles with drugs peptide and fluorophores
104
4.3.3.2 PECA-Dex6G16-Doxorubicin (PECA-Dex6G16-Dox) nanoparticles
To assess the effects of purity on size, PDI and zeta potential, the characterisation of
PECA-Dex6G16-Dox was carried out by DLS both before (as prepared) and after
centrifugation (by resuspending the pellet and sonicating for 10 min). As compared with
their as-prepared congeners, the purified NPs exhibit smaller size, lower PDI and higher
zeta potential (Table 4.5), all of which highlight the importance of the purification step.
Table 4.5: Size, zeta potential and PDI characterisation of Doxorubicin-PECA-Dex16 (Dox-PD16) nanoparticles (DLS)
Sample Size (nm) PDI Zeta Potential (mV)
Before centrifugation 268.2±2.9 0.540±0.021 -26.2±0.5
Dispersed pellet 254.0±4.6 0.389±0.047 -39.4±3.3
4.3.3.3 Loading and release of Doxorubicin hydrochloride from PECA-Dex6G4 NPs and
PECA-Dex6G8 NPs by nanoprecipitation-solvent evaporation
The chain length of the Dex6G4 or Dex6G8 used as copolymer in the formation of
nanoparticles of PECA-alkylglyceryl dextran that were loaded with Doxorubicin
hydrochloride appears to affect loading capacity. Dex6G4, which has a shorter chain
length as compared with Dex6G8, had a smaller amount of Doxorubicin hydrochloride
loaded to its nanoparticulate formulation (PECA-Dex6G4) than Dex6G8 (PECA-Dex6G8).
The more hydrophobic nature of Dex6G8 could have promoted the adsoption of the
Doxorubicin hydrochloride [Doxorubicin base is hydrophobic whereas its HCl salt is water
soluble (206)]. The drug is assummed to be entrapped into PECA-Dex6G8 NPs in its
hydrophilic Doxorubicin.HCl form, which probably enables efficient diffusion from the
nanosphere matrix. Of the two nanoparticulates investigated, those of PECA-Dex6G8 NPs,
which are associated with the higher loading capacity for Doxorubicin.HCl, were seen to
exhibit the faster rate of release of this active.

Loading of nanoparticles with drugs peptide and fluorophores
105
Figure 4.7: Cumulative release profile of Doxorubicin from Doxorubicin HCl, PECA-Dex6G4 and PECA-Dex6G8 (n=3±SD).
The freeze dried nanoparticles drug content (Table 4.6) was determined by dissolving the
NP-drug in DMSO and the values were determined from the calibration curve (presented
in Appendix 14). Samples of nanoparticles that had been subjected to freeze drying,
contained drastically reduced amounts of entrapped drug relative to those that had not
been subjected to a freeze drying protocol. This was particularly pronounced with PECA-
Dex100G4 NPs. The release of the Doxorubicin content of PECA-Dex6G8 or PECA-Dex6G4
nanoparticles is influenced by polymer-chain hydrophilicity, which in turn is influenced by
the liquid environment and by the amount of loaded drug that is retained in the
nanoparticle matrix. The complex binding and releasing mechanisms are yet to be
deconvoluted (207).
Doxorubicin release from PECA-Dex6G8-Dox nanoparticles was very fast (similar to that of
the free Doxorubicin from the dialysis-membrane bag; Figure 4.7). PECA-Dex6G4-Dox
nanoparticles had about 40% of their drug content released within about 8 h from the
start of the release study, which also saw about 95% of the drug released from PECA-
Dex6G8 nanoparticles within the same timescale (Figure 4.7). The release profile (Figure
4.7) of Doxorubicin from the nanoparticulate matrix, especially that of PECA-Dex6G8-Dox,
-10
10
30
50
70
90
110
130
0 2 4 6 8 10
cumulative drug release
(w/w) %
Time (h)
Free-Dox PD4-Dox PD8-Dox

Loading of nanoparticles with drugs peptide and fluorophores
106
suggested that almost all loaded Doxorubicin had been released within few hours. It is
possible that Doxorubicin release from these nanoparticles may have been better
controlled if structures containing different ratios of the constitutional polymers had
been used, or by the use of Doxorubicin in its free base form. The release profiles
demonstrated that the nanoparticles exhibited limited affinity for the drug at the
temperature and pH of the adopted experimental protocol.
Table 4.6: Percentage Doxorubicin loading to the nanoparticles (loading efficiency)
sample % drug loaded
PECA-Dex100G4 45.8%
PECA-Dex100G8 58.3%
4.3.3.4 Loading of both Doxorubicin and Curcumin into PECA-Dex100G12nanoparticles:
The monomer polymerisation method provided the means for the loading of PECA-
Dex100G12 nanoparticles with equal proportions of Curcumin and Doxorubicin (208).
Since for both molecules OH functionalities may become involved in the initiation of the
polymerisation of ECA, the formulation cannot be regarded as a mere combination of
Doxorubicin and Curcumin but rather as a molecular complex of these actives with the
nanoparticles. Accordingly, release studies involving this nanoparticulate complex have
shown that Doxorubicin is released from the complex at a faster rate than Curcumin. In
the absence of detailed spectroscopic characterisation data the relative contributions of
the binding forces that operate between the individual components of the complex
cannot be deconvoluted. However, the observed release patterns suggest that these
nanoparticles may be amenable to employment for therapeutic purposes; Table 4.7
summarises the DLS characterisation data of Doxorubicin-Curcumin nanoparticles.
Table 4.7: Size, PDI and zeta potential of PECA-Dex6G12 nanoparticles loaded with Doxorubicin-Curcumin.
Size (nm) PDI Zeta potential (mV)
DLS NTA Mode
PECA-
Dex100G12-
Dox-Cur
211.4±0.1 152±66 120 0.249±0.022 -30.40±0.40

Loading of nanoparticles with drugs peptide and fluorophores
107
4.3.3.5 PECA-Dex100G12-Dox TGA and DSC results
TGA performed under an atmosphere of nitrogen indicated that the main degradation
step for PECA-Dex100G12-Dox is characterised by a mass loss of 91.4% (Figure 4.8), with a
maximum rate of mass loss at 192.0 °C. The second step of the same thermogram is
associated with a mass loss of 7.7% and exhibits a peak mass loss rate at 327.5 °C.
Exposed to a synthetic air atmosphere the sample exhibited an additional mass loss of
1.1%.
Figure 4.8: TGA plots from PECA-Dex100G12-Dox nanoparticles.
In (Figure 4.9) the first heating curve (blue curve) of this sample, there is observed a glass
transition at 52.4 °C (midpoint) which is accompanied by a change in specific heat
capacity of 0.059 J/g*K. Immediately after the glass transition, a broad endothermic event
is observed which is assumed to be associated with the onset of evaporation or with the
oxidative degradation of a components of the sample. The second heating curve (green
curve) confirms the glass transition at 52.3 °C and enumerates the change in specific heat
capacity at 0.041 J/g*K. Notably, the endothermic event did not occur during the second
heating cycle, which is indicative of a possible relaxation effect in the polymer structure.

Loading of nanoparticles with drugs peptide and fluorophores
108
Figure 4.9: DSC of PECA-Dex100G12–Doxorubicin nanoparticles.
Since the extraction of Doxorubicin-free base with methanol and triethylamine has been
shown to be an effective means of increasing Doxorubicin entrapment in the PECA-
DexnGm nanoparticles (199), it is likely that the use of Doxorubicin as its hydrochloride
salt would have affected the extent of entrapment to PECA-DexnGm nanoparticles. The
interactions between PACA and Doxorubicin have been indicated to involve the
establishment of hydrogen bonds between the ammonium N-H function and the cyano
group, while the cohesion of PACA nanoparticles have been indicated by the same
technique to be due to the combined effects of electrostatic forces, H-bonds and dipolar
interactions (163).
4.3.4 Other fluorescent markers and model drugs
4.3.4.1 Enhanced green fluorescence protein (EGFP) determination in NPs
Determination of EGFP at various concentrations of PECA-Dex100G8-EGFP NPs
EGFP loading was studied over a range of concentrations of nanoparticles that had been
dispersed in PBS. This was to confirm whether the fluorescence protein has been loaded
unto the nanoparticles. The various concentrations of the NPs-loaded EGFP confirmed the

Loading of nanoparticles with drugs peptide and fluorophores
109
presence of the fluorescence marker in the NPs (Table 4.8). The nanoparticles were
further analysed with SEM. SEM image of PECA-Dex100G8-EGFP loaded nanoparticles is
appended in (Appendix 10)
Table 4.8: Determination of concentrations of EGFP in PECA-Dex100G8-EGFP NPs
Initial Conc. of NPs (µg/mL) Absorbance (nm) Conc. of EGFP
(µg/mL)*
100 0.0558 1.294
200 0.0770 13.760
300 0.1084 32.240
400 0.3335 164.558
500 0.3481 173.240
4.3.4.2 N-methyl-isatoic anhydride (MIA)
Dispersion of freeze dried MIA-NPs in a range of media demonstrated the medium-
influenced variation in the size of nanoparticles (Table 4.9).
Table 4.9: The effect of different liquid media on the size distribution of NPs of PECA-Dex100G8 that had been tagged with MIA (DLS)
Liquid medium Z-av.d (nm) PDI
water 141.4±1.0 0.241±0.006
NaCl (10mmol) 133.2±1.6 0.224±0.009
PBS (7.4) 226.0±5.3 0.467±0.011
PBS (filtered 0.2µm) 134.6±0.4 0.221±0.007
In an experiment designed to establish the optimum method of co-loading MIA and
Curcumin, it was observed that the tagging of MIA before loading the sample with
Curcumin was more efficient than that involving loading with Curcumin before tagging
with MIA (Table 4.10); DLS results of sizes and zeta potentials are presented in (Table
4.11).

Loading of nanoparticles with drugs peptide and fluorophores
110
Table 4.10: Fluorescence intensity of MIA-Curcumin nanoparticles
sample Tagged with MIA before
loading with Curcumin
Loaded with Curcumin
before tagging with MIA
Fluorescence
intensity (Curcumin)
56.9538 20.5744
Fluorescence
intensity(MIA)
507.3941 547.0530
Table 4.11: DLS analysis of MIA-Curcumin NPs
Loaded with Curcumin before tagging with MIA
Tagged with MIA before loading with Curcumin
Z-Av (nm) 634.5±16.1 Z-av (nm) 430.1±8.0
PDI 0.159±0.023 PDI 0.248±0.009
Zeta potential (mV)
-27.6±0.1 Zeta potential (mV)
-23.0±0.5
4.3.4.3 Tetramethyl Rhodamine-5-carbonylazide
The synthesis of Tetramethyl Rhodamine-nanoparticles by covalent bond formation
involved reaction between the hydroxyl group of constituent macromolecules and the
isocyanate group formed from the acyl azide functionality of TMRCA on heating at 80°C.
The conjugation of these molecules was evidenced by NTA, and by the difference
between the fluorescence intensities of the blank and Tetramethyl Rhodamine
nanoparticles dissolved in DMSO as measured with Microplate Reader. Proton NMR
(205) was used to determine the molar ratio of the attached Tetramethyl Rhodamine to
the nanoparticles by comparing the signal intensity or the peak area of its methyl proton
to the anomeric proton of the pyranose ring of the dextran or, the methylene protons (or
methyl protons) of the alkyl glyceryl group attaching to the dextran.
Evidence for the conjugation of Tetramethyl Rhodamine to the nanoparticles was
obtained by considering the difference in fluorescence intensities of nanoparticles with
reference to a blank sample, which had been dissolved in DMSO and measured
(Microplate Reader) at the respective excitation and emission wavelengths of 544 nm and
590 nm; fluorescence intensities obtained were 21902 for Tetramethyl Rhodamine tagged
nanoparticles and 1952 for empty nanoparticles. The linking of Tetramethyl Rhodamine
to the nanoparticles was further evidenced with NTA, in that fluorescing Tetramethyl

Loading of nanoparticles with drugs peptide and fluorophores
111
Rhodamine nanoparticles could be observed when the filter was shut. The sizes of tagged
nanoparticles, as measured by DLS and NTA, are presented in (Table 4.12). Since the size
distribution of nanoparticles was high, as reflected by the associated PDI, the separation
of nanoparticles to narrower size samples was attempted by filtration.
Table 4.12: The size and PDI of PECA-Dex6G12-TMRCA nanoparticles (n=1)
DLS NTA(nm)
Size (nm) PDI Size Mode
NP-TMRCA 879.6±42.8 0.525±0.030 735±264 752
4.3.4.4 Evans Blue
Loading of PECA-Dex100G4 NPs with Evans blue
Evans blue dye (structure in Figure 4.10) was loaded into the nanoparticles by means of
the monomer polymerisation method. The degree of loading and the efficiency of
entrapment were determined by measuring the Evans blue content of the supernatant.
The system exhibited a poor loading efficiency and an associated low degree of loading.
Evans blue is a negatively charged dye; it is possible that the negative zeta potential of
PECA-DexnGm nanoparticles is responsible for the poor affinity of this dye for these
nanoparticles.
Figure 4.10: Chemical structure of Evans blue
-
-
2
2
-
-
4 Na+

Loading of nanoparticles with drugs peptide and fluorophores
112
4.4 Conclusions
Rhodamine B was successfully loaded into the nanoparticles but since the release of
Rhodamine B from nanoparticles was poor this study was discontinued.
To promote the entrapment of Curcumin into nanoparticles, the loading of PECA-
Dex100G4 NPs with Curcumin was carried out in the presence of acetic acid and TPP.
However, inherent to this method was the inefficient study of the release profile.
The study of the release of Doxorubicin hydrochloride indicated that nanoparticles of
PECA-Dex6G4 NPs can sustain the release of Doxorubicin hydrochloride more efficiently
than those formulated from longer chain homologues (e.g. PECA-Dex6G8 NPs).
Towards the optimisation of methods of tagging MIA to nanoparticles, it was observed
that the tagging of MIA prior to loading with Curcumin was preferable to the tagging of
MIA after Curcumin had been loaded to the nanoparticles.
EGFP was successfully loaded into the nanoparticles as confirmed by absorbance
measurements at specified concentrations.
The synthesis of Tetramethyl Rhodamine-containing nanoparticles by covalent bond
formation was achieved through reaction between the hydroxyl group of constituent
macromolecules and the isocyanate group formed from the acyl azide functionality of
TMRCA. The successful tagging of TMRCA to the nanoparticles was indicated by NTA and
by the difference in fluorescence intensities of nanoparticles with reference to those of
the blank as determined using the microplate reader.
Evans blue had very low affinity for the nanoparticles as evidence by the ease with which
the dye washed away from their nanoparticulate hosts.

In vitro studies
113
5
5. In vitro studies - Cytotoxicity
The cytotoxicity of nanoparticulate formulations was assessed by measuring the viability
of mouse brain endothelial cells (bend3) following incubation with selected
nanoformulations.
5.1 Methods and instrumentation
The cytotoxicity evaluation protocol involved the following materials and equipment:
incubator (37°C, 5% CO2), Plate reader PolarStar Optima (BMG Labtech) (570nm
Absorbance filter), 96-well plate (Greiner bio-one) Fisher, inverted microscope,
haemocytometer, pipettes (1 mL, 100 µl, 50 µl, 20 µl), class II safety cabinet, sterile
pipette tips, sterile pipette (10mL, 3mL) disposable, sterile 0.4 µm polyethersulfone (PES)
filter, electric pipette (Fisher), T25 culture flask (Fisher), centrifuge, alkyl cyanoacrylate-
alkylglyceryl dextran NPs, alkylglyceryl dextrans, MTT (3-(4,5-dimethylthiazolyl-2)-2, 5-
diphenyltetrazolium bromide), DMEM (media), trypan blue, Triton-X100, PBS, Tryple
Express, mouse-brain endothelial cells (bend3), DMEM (500 mL), L-Glutamine (5 mL),
Sodium pyruvate (5 mL), 2-mercaptoethanol (0.5 mL), NEAA (5 mL), FBS (50mL),
Pen/Strep (5 mL).
The cytotoxicity study was conducted by means of the MTT (3-(4, 5-dimethylthiazolyl-2)-
2, 5-diphenyltetrazolium bromide) assay (209, 210): MTT metabolism is known to show a
good correlation between cell viability and conversion of MTT tetrazolium salt (yellow) to
MTT formazan (purple) since only metabolic active cells have the capacity to effect the
conversion of this salt to its purple metabolite.
Various alkyl cyanoacrylate-alkylglyceryl dextrans NPs and alkylglyceryl dextrans were
assessed at 1 mg/mL concentration.
To assess the concentrations of nanoparticles that induce cytotoxicity to bend3 cells, a
dose-response study employing a MTT assay were conducted for PECA-Dex100G4 NPs
(1:1), PECA-Dex100G4 NPs (1:6) and PBCA-Dex100G4 NPs samples at four specified
concentrations (10 μg/mL, 25 μg/mL, 50 μg/mL and 100 μg/mL).

In vitro studies
114
MTT (3-(4,5-Dimethylthiazol-2-yl)-2,5-diphenyl tetrazolium bromide) assay protocol
The MTT working solution was prepared by allowing a solution of MTT in DMEM (5
mg/mL; kept in the dark at 2-8°C until needed) to reach 37°C and a steady state
concentration of 5% CO2 before dilution (1:5) with DMEM. Bend3 cells (20,000) were
seeded (in triplicate) into each of a 96 well plate containing 200 µl of normal media
(DMEM containing 10% fetal bovine serum, FBS) and incubated for 24h. After this time, in
each well were added 20 µl of each nanoformulation and of alkylglyceryl dextran
formulations dispersed in PBS at specified concentrations prior to incubation for 24h at
37°C (5% CO2). After this time, to each well was added MTT working solution (50 µl) and
the mixture was incubated for 2h at 37°C (5% CO2). The media was then removed from
each well, replaced with 100 µl of DMSO and this mixture was agitated gently until the
formazan crystals had dissolved. Each plate was inserted into the plate reader and the
absorbance was read at 570 nm. The viability of cells was calculated (Equation 5.1) as
percentage relative to PBS (negative control); Triton-X100 provided the positive control.
100*.
.%..Re
controlA
testAviabilitycelllative (eq. 5.1)
5.2 Results and Discussion
Tested against bend3 cells at a relatively high concentration of 1 mg/mL (MTT assay),
PECA and PECA-alkylglyceryl dextran nanoparticles exhibited significant cytotoxicity
(p<0.05) as compared with the PBS control (Figure 5.1).

In vitro studies
115
Figure 5.1: Relative toxicity of PECA and PECA-alkylglyceryl dextran nanoparticles (1mg/mL; p<0.05, n=3)
Figure 5.2: Relative cytotoxicity of alkylglyceryl dextrans (1mg/mL; p<0.05, n=3)
0
20
40
60
80
100
120
viability against PBS control[%]
0
20
40
60
80
100
120
140
160
PBS Dex100G4 Dex100G16 Dex6G4 Dex6G16
viability against PBS control[%]

In vitro studies
116
To account for these results, alkylglyceryl dextrans were also evaluated using the same
assay, and the results (Figure 5.2) exhibited variable behaviour in that Dex100G4 was
cytotoxic relative to the PBS control (p<0.05) while Dex100G16, Dex6G4 and Dex6G16 did
not display any statistically significant differences at the p<0.05 level with reference to
the same control. It appears that a decrease in the molecular weight of dextran reduces
cytotoxicity, though the degree of substitution with alkylgyceryl chains is clearly another
contributing factor.
Figure 5.3: Relative viability as a function of dose response of alkyl cyanoacrylate NPs against bend3 cells, each incubated at specified concentrations (10 μg/mL, 25 μg/mL 50 μg/mL 100 μg/mL) for 24 h; MTT assay; Triton –X100 and media blank (n =3; ±SD; Triton-X100 positive control).
To identify a range of safe concentrations, a dose response study has been carried out;
the apparent toxicity induced by PECA was also compared to that of poly(butyl
cyanoacrylate), by testing nanoparticles that were prepared from the same materials but
where ECA was replaced by BCA. We found that PBCA-Dex100G4 NPs at concentrations
of up to 50 µg/mL were well tolerated by bend3 cells (Figure 5.3, Table 5.1) while NPs of
PECA-Dex100G4 (1:1) and PECA-Dex100G4 (1:6) began to exhibit toxic effects at
concentrations >25 µg/mL.
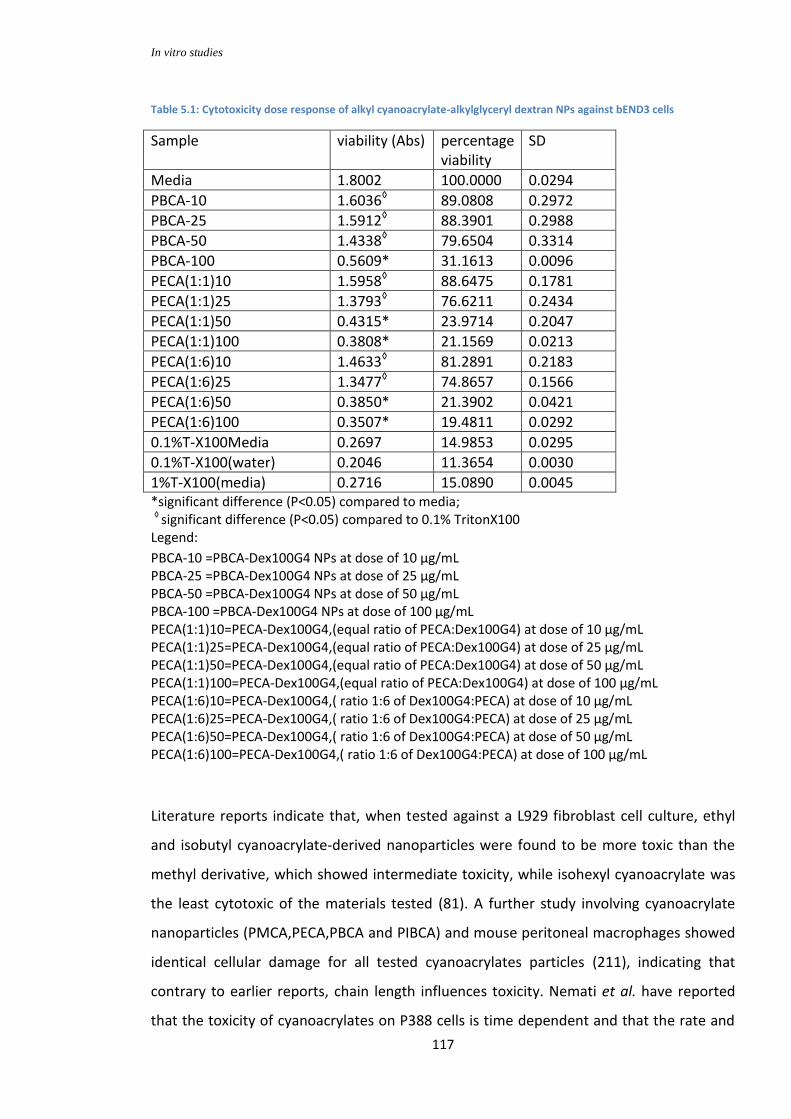
In vitro studies
117
Table 5.1: Cytotoxicity dose response of alkyl cyanoacrylate-alkylglyceryl dextran NPs against bEND3 cells
Sample viability (Abs) percentage viability
SD
Media 1.8002 100.0000 0.0294
PBCA-10 1.6036◊ 89.0808 0.2972
PBCA-25 1.5912◊ 88.3901 0.2988
PBCA-50 1.4338◊ 79.6504 0.3314
PBCA-100 0.5609* 31.1613 0.0096
PECA(1:1)10 1.5958◊ 88.6475 0.1781
PECA(1:1)25 1.3793◊ 76.6211 0.2434
PECA(1:1)50 0.4315* 23.9714 0.2047
PECA(1:1)100 0.3808* 21.1569 0.0213
PECA(1:6)10 1.4633◊ 81.2891 0.2183
PECA(1:6)25 1.3477◊ 74.8657 0.1566
PECA(1:6)50 0.3850* 21.3902 0.0421
PECA(1:6)100 0.3507* 19.4811 0.0292
0.1%T-X100Media 0.2697 14.9853 0.0295
0.1%T-X100(water) 0.2046 11.3654 0.0030
1%T-X100(media) 0.2716 15.0890 0.0045 *significant difference (P<0.05) compared to media; ◊ significant difference (P<0.05) compared to 0.1% TritonX100 Legend:
PBCA-10 =PBCA-Dex100G4 NPs at dose of 10 µg/mL PBCA-25 =PBCA-Dex100G4 NPs at dose of 25 µg/mL PBCA-50 =PBCA-Dex100G4 NPs at dose of 50 µg/mL PBCA-100 =PBCA-Dex100G4 NPs at dose of 100 µg/mL PECA(1:1)10=PECA-Dex100G4,(equal ratio of PECA:Dex100G4) at dose of 10 µg/mL PECA(1:1)25=PECA-Dex100G4,(equal ratio of PECA:Dex100G4) at dose of 25 µg/mL PECA(1:1)50=PECA-Dex100G4,(equal ratio of PECA:Dex100G4) at dose of 50 µg/mL PECA(1:1)100=PECA-Dex100G4,(equal ratio of PECA:Dex100G4) at dose of 100 µg/mL PECA(1:6)10=PECA-Dex100G4,( ratio 1:6 of Dex100G4:PECA) at dose of 10 µg/mL PECA(1:6)25=PECA-Dex100G4,( ratio 1:6 of Dex100G4:PECA) at dose of 25 µg/mL PECA(1:6)50=PECA-Dex100G4,( ratio 1:6 of Dex100G4:PECA) at dose of 50 µg/mL PECA(1:6)100=PECA-Dex100G4,( ratio 1:6 of Dex100G4:PECA) at dose of 100 µg/mL
Literature reports indicate that, when tested against a L929 fibroblast cell culture, ethyl
and isobutyl cyanoacrylate-derived nanoparticles were found to be more toxic than the
methyl derivative, which showed intermediate toxicity, while isohexyl cyanoacrylate was
the least cytotoxic of the materials tested (81). A further study involving cyanoacrylate
nanoparticles (PMCA,PECA,PBCA and PIBCA) and mouse peritoneal macrophages showed
identical cellular damage for all tested cyanoacrylates particles (211), indicating that
contrary to earlier reports, chain length influences toxicity. Nemati et al. have reported
that the toxicity of cyanoacrylates on P388 cells is time dependent and that the rate and

In vitro studies
118
amount of uptake is determined by the cell types against which the evaluation is
conducted (212).
The cytotoxicity of poly(cyanoacrylate) nanoparticles seems to be more complex than the
direct contributions of each of the released degradation products, stimulation of
inflammation mediators and cell adhesion (107, 213): concentration and time appear to
play an important role. For example, literature indicates that PBCA nanospheres did not
induce any cytotoxicity at a concentration of 75 µg/mL while membrane damage was
observed at a concentration of 150 µg/mL (107). This in turn indicates that PBCA may
become cytotoxic at a specified concentration >75 µg/mL. In another example,
poly(isobutyl cyanoacrylate) nanospheres at 100 µg/mL exhibited no cell toxicity within
the 7 h timescale but showed notable mortality beyond 24 h (81). Other reports on the
cytotoxicity of cyanoacrylates are available in the literature, but those are limited to the
concentration level of 0.1 mg/mL (214).
Although retro-Knoevenagel to poly(acrylic acid) and the corresponding alcohol is
assumed to be the major degradation pathway of cyanoacrylate polymers, the cellular
cytotoxicity of cyanoacrylate polymers has been shown to be directly related to the
release of formaldehyde (215), which is produced though a minor pathway during the
degradation of PACA (214). The rate of degradation is primarily determined by the length
of the side chain, with shorter chain homologues degrading more readily (presumably due
to the steric hindrance effects exerted by the longer-chain materials; (216). Due to its
relative high propensity to adhere to cells (81, 107) PECA would be expected to exhibit
higher toxicity than its shorter-chain homologue PMCA. Contrary to expectation, when
tested against fibroblasts, PMCA was found to be more toxic than PECA (214). A study of
the cytotoxicity of PBCA and POCA (10 µg/mL) against human foreskin fibroblasts showed
that the former material is more toxic (217).
As compared with the PBS control, the PECA and PECA-derived nanoparticles evaluated in
this study at concentration of (1 mg/mL) exhibited marked toxic effects against all cells
tested (bend.3) (Figure 5.1). Complementary dose-response experiments that included
PBCA-derived nanoparticles have demonstrated that the respective toxicities of PBCA-
Dex100G4 NPs, and PECA-Dex100G4 (both 1:1 and 1:6 ratio samples) nanoparticles are
notable at the 100 μg/mL and the 50 μg/mL levels, respectively (Figure 5.3 and Table 5.1).
With reference to the PBS control, Dex100G4 appeared significantly more toxic but no

In vitro studies
119
significant difference in toxicity could be identified (P<0.05) with Dex100G16, Dex6G16 or
Dex6G4 (Figure 5.2).
Consistent with the findings of Wiegand et al. who reported the molecular-weight-
dependent toxic effects of chitosan on human keratinocyte cell lines (218), the
percentage viabilities (214) determined for alkylglyceryl dextran samples of different
molecular weights imply that similar molecular-weight-dependent effects operate with
the latter class of molecules. Notably however, tested against CT-26 cells, dextran derived
micelles did not appear to exhibit a significant molecular weight-related effect (219).
5.3. Conclusions
Since complementary studies have indicated that the chain length of PACAs influences
their rate of degradation, it is assumed that there is a relationship between chain length
and toxicity: the shorter the chain, the faster the degradation and the more toxic the
parent structure. It is notable however that the toxicity of degradation products of PACA
nanoparticle is reported, through the evaluation of data from clinical trials, not to induce
any adverse effects of therapeutic significance (220). The molecular weight of native
dextran and the degree of substitution with alkylglyceryl chains also appear to influence
the cytotoxicity of the nanoparticulate formulations tested.

General Conclusions
120
6
6. General Conclusions and suggestions for further work The delivery of therapeutic agents to the brain is often limited by the BBB. Research
findings have indicated that this barrier may be overcome by the use of nanoparticulate
drug delivery vehicles which incorporate the therapeutic molecule that is not capable of
crossing the BBB. To achieve this goal, it is essential that nanocarriers that do not alter
the integrity of the BBB are developed.
This study designed and evaluated one such class of drug-carrying polymeric
nanoparticles. To this end, dextran derivatives have been prepared through attachment
of alkylglycerol of systematically varied chain length to the dextran core. These
macromolecular structures were then combined with a widely used class of
biocompatible moieties, the alkyl cyanoacrylates, to formulate nanoparticles.
Alkylglycerols of systematically varied chain lengths were utilised to generate alkylglyceryl
derivatives of two native dextrans with average molecular weights of 6 kD and 100 kD.
These alkylglyceryl dextrans were characterised by MALDI-TOF MS, TGA, GPC, FTIR and
NMR. The degree of substitution of each of the synthesised alkyl glyceryl dextrans, as
determined using 1H-NMR spectroscopy, ranged between 30% and 200%. It was found
that the longer the chain length of the progenitor alkylglycerol the lower the
hydrophilicity of the alkylglyceryl dextran. GPC results demonstrated that the
polydispersity index of alkylglyceryl dextrans was lower than that of the precursor
dextran irrespective of average molecular weight (6 kDa or 100 kDa).
In the chemical attachment of alkylglycerol to dextran the carbon at position 2 was seen
to be regioselectively favoured, as is consistent with its expected higher reactivity. The
synthesised alkylglyceryl dextrans were readily amenable to formulation into
nanoparticles through combination with alkyl cyanoacrylates (ethyl or butyl); the
techniques of nanoprecipitation and emulsion polymerisation were both usefully
employed for this purpose. Nanoparticles were characterised by DLS, NTA, elemental
(CHN) analysis, NMR, FTIR, MALDI-TOF MS, SEM, DSC and TGA. Elemental analysis
calculations determined that the ratio of alkylglyceryl dextran to alkyl cyanoacrylate in

General Conclusions
121
the formulated nanoparticles was in the respective, formulation-dependent, range of 3-
19% and 80-95%; this was in agreement with NMR data.
The sizes of nanoparticles were of the order of 100-500 nm. Studies involving the
systematic variation of the alkylglyceryl chain length indicated that there is no direct
relationship between chain length and nanoparticle size. Notably, nanoparticles that had
been prepared from alkylglyceryl dextrans exhibited consistently higher negative zeta
potentials than their congeners that had been formulated from native dextrans.
Autotitration experiments revealed that empty NPs exhibit decreasing zeta potentials
with decreasing pH. The average sizes of nanoparticles appeared relatively stable across
the pH range considered, while the sizes decreased with decrease in pH for some of the
tested nanoparticles.
The nanoparticles were amenable to tagging with fluorophores and to loading with a
range of model drugs (MIA, EGFP, Curcumin, Doxorubicin, Evans blue, TMRCA).
Experiments involving nanoparticles that had been loaded with Curcumin demonstrated
that the longer the alkylglyceryl chain length the smaller the size of nanoparticles.
Studies of the release of loaded Evans blue have shown the rapid release of this agent
from the nanoparticulate matrix, presumably due to the incompatibility in the surface
charges of the negatively charged Evans blue and the negative-zeta-potential
nanoparticles. The release of Doxorubicin or that of Curcumin from their nanoparticulate
host was notably slower than that observed with Evans blue.
Evaluated for cytotoxicity against bend3 cells, nanoparticles exhibited dose-dependent
toxicity profiles: PBCA-Dex100G4 NPs were found to be more biocompatible than PECA-
Dex100G4 NPs.
Integral to the future development of the technology towards clinical applications is an in
vitro study that evaluates nanoparticles for their capability to permeate modelled BBB
structures.

References
122
7
7. References 1. Wittchen H-U, Jacobi F, Rehm J, Gustavsson A, Svensson M, Jönsson B, et al. The size and burden of mental disorders and other disorders of the brain in Europe 2010. European Neuropsychopharmacology. 2011;21(9):655-79. 2. Kessler RC, Üstün TB. The WHO World Mental Health Surveys: global perspectives on the epidemiology of mental disorders: Cambridge University Press New York:; 2008. 3. Collins PY, Patel V, Joestl SS, March D, Insel TR, Daar AS, et al. Grand challenges in global mental health. Nature. 2011;475(7354):27-30. 4. Yi X, Manickam DS, Brynskikh A, Kabanov AV. Agile Delivery of Protein Therapeutics to CNS. Journal of Controlled Release. 2014;190:637-663. 5. Administrator. Structure of the Brain. 2014. Available from: http://controlmind.info/human-brain/structure-of-the-brain . 6. De Boer AG, Gaillard PJ. Drug targeting to the brain. Annual Review of Pharmacology and Toxicology. 2007;47:323-55. 7. de Vries HE, Kuiper J, de Boer AG, Van Berkel TJC, Breimer DD. The blood-brain barrier in neuroinflammatory diseases. Pharmacological Reviews. 1997;49(2):143-56. 8. Zlokovic BV. The blood-brain barrier in health and chronic neurodegenerative disorders. Neuron. 2008;57(2):178-201. 9. Gabathuler R. Approaches to transport therapeutic drugs across the blood–brain barrier to treat brain diseases. Neurobiology of Disease. 2010;37(1):48-57. 10. Alyautdin R, Khalin I, Nafeeza MI, Haron MH, Kuznetsov D. Nanoscale drug delivery systems and the blood–brain barrier. International Journal of Nanomedicine. 2014;9:795-811. 11. Bechmann I, Galea I, Perry VH. What is the blood–brain barrier (not)? Trends in Immunology. 2007;28(1):5-11. 12. Hawkins RA, O'Kane RL, Simpson IA, Viña JR. Structure of the blood–brain barrier and its role in the transport of amino acids. The Journal of Nutrition. 2006;136(1):218S-26S. 13. Obermeier B, Daneman R, Ransohoff RM. Development, maintenance and disruption of the blood-brain barrier. Nature Medicine. 2013;19(12):1584-96. 14. Wolburg H, Lippoldt A. Tight junctions of the blood–brain barrier: development, composition and regulation. Vascular Pharmacology. 2002;38(6):323-37. 15. Pardridge WM. Blood–brain barrier delivery. Drug Discovery Today. 2007;12(1):54-61. 16. Pardridge WM. CNS drug design based on principles of blood-brain barrier transport. Journal of Neurochemistry. 1998;70(5):1781-1792. 17. Palmer AM. The blood–brain barrier. Neurobiology of Disease. 2010;37(1):1-2. 18. Abbott NJ, Ronnback L, Hansson E. Astrocyte-endothelial interactions at the blood-brain barrier. Nature Reviews Neuroscience. 2006;7(1):41-53. 19. Bernacki J, Dobrowolska A, Nierwiñska K, Malecki A. Physiology and pharmacological role of the blood-brain barrier. Pharmacological Reports. 2008;60(5):600-22. 20. Chen Y, Liu L. Modern methods for delivery of drugs across the blood–brain barrier. Advanced Drug Delivery Reviews. 2012;64(7):640-65. 21. Begley DJ. Delivery of therapeutic agents to the central nervous system: the problems and the possibilities. Pharmacology & Therapeutics. 2004;104(1):29-45. 22. Jallouli Y, Paillard A, Chang J, Sevin E, Betbeder D. Influence of surface charge and inner composition of porous nanoparticles to cross blood-brain barrier in vitro. International Journal of Pharmaceutics. 2007;344(1-2):103-109. 23. Gee JR, Keller JN. Astrocytes: regulation of brain homeostasis via Apolipoprotein E. The International Journal of Biochemistry & Cell Biology. 2005;37(6):1145-50. 24. Kreuter J, Ramge P, Petrov V, Hamm S, Gelperina SE, Engelhardt B, et al. Direct evidence that polysorbate-80-coated poly( butylcyanoacrylate) nanoparticles deliver drugs to the CNS via

References
123
specific mechanisms requiring prior binding of drug to the nanoparticles. Pharmaceutical Research. 2003;20(3):409-16. 25. Watson CP, Dogruel M, Mihoreanu L, Begley DJ, Weksler BB, Couraud PO, et al. The transport of nifurtimox, an anti-trypanosomal drug, in an in vitro model of the human blood–brain barrier: Evidence for involvement of breast cancer resistance protein. Brain Research. 2012;1436(0):111-21. 26. Junctions CbT. 2011 Group 3 Project - Cellbiology 2014. Available from: http://php.med.unsw.edu.au/cellbiology/index.php?title=2011_Group_3_Project. 27. Bazzoni G, Dejana E. Endothelial cell-to-cell junctions: molecular organisation and role in vascular homeostasis. Physiological Reviews. 2004;84(3):869-901. 28. Ohtsuki S, Terasaki T. Contribution of carrier-mediated transport systems to the blood–brain barrier as a supporting and protecting interface for the brain; importance for CNS drug discovery and development. Pharmaceutical Research. 2007;24(9):1745-58. 29. Simpson IA, Carruthers A, Vannucci SJ. Supply and demand in cerebral energy metabolism: the role of nutrient transporters. Journal of Cerebral Blood Flow & Metabolism. 2007;27(11):1766-91. 30. Bendayan R, Ronaldson PT, Gingras D, Bendayan M. In situ localisation of P-glycoprotein (ABCB1) in human and rat brain. Journal of Histochemistry & Cytochemistry. 2006;54(10):1159-67. 31. Taylor CJ, Nicola PA, Wang S, Barrand MA, Hladky SB. Transporters involved in regulation of intracellular pH in primary cultured rat brain endothelial cells. The Journal of Physiology. 2006;576(3):769-85. 32. Kroll RA, Neuwelt EA. Outwitting the blood-brain barrier for therapeutic purposes: osmotic opening and other means. Neurosurgery. 1998;42(5):1083-99. 33. Rousselle C, Clair P, Lefauconnier J-M, Kaczorek M, Scherrmann J-M, Temsamani J. New advances in the transport of Doxorubicin through the blood-brain barrier by a peptide vector-mediated strategy. Molecular Pharmacology. 2000;57(4):679-86. 34. Pardridge WM. Chapter 31. Strategies for Delivery of Drugs Through the Blood-Brain Barrier. In: Denis MB, editor. Annual Reports in Medicinal Chemistry. Volume 20: Academic Press; 1985. p. 305-13. 35. Erdlenbruch B, Alipour M, Fricker G, Miller DS, Kugler W, Eibl H, et al. Alkylglycerol opening of the blood–brain barrier to small and large fluorescence markers in normal and C6 glioma‐bearing rats and isolated rat brain capillaries. British Journal of Pharmacology. 2003;140(7):1201-10. 36. Kuo Y-C, Chen H-H. Effect of nanoparticulate polybutylcyanoacrylate and methylmethacrylate–sulfopropylmethacrylate on the permeability of zidovudine and lamivudine across the in vitro blood–brain barrier. International Journal of Pharmaceutics. 2006;327(1):160-9. 37. Stam R. Electromagnetic fields and the blood–brain barrier. Brain Research Reviews. 2010;65(1):80-97. 38. Zhou JX, Ding GR, Zhang J, Zhou YC, Zhang YJ, Guo GZ. Detrimental Effect of Electromagnetic Pulse Exposure on Permeability of< i> In Vitro</i> Blood-brain-barrier Model. Biomedical and Environmental Sciences. 2013;26(2):128-37. 39. Kondoh M, Takahashi A, Fujii M, Yagi K, Watanabe Y. A novel strategy for a drug delivery system using a claudin modulator. Biological and Pharmaceutical Bulletin. 2006;29(9):1783-9. 40. Salama NN, Eddington ND, Fasano A. Tight junction modulation and its relationship to drug delivery. Advanced Drug Delivery Reviews. 2006;58(1):15-28. 41. Alyautdin RN, Tezikov EB, Ramge P, Kharkevich DA, Begley DJ, Kreuter J. Significant entry of tubocurarine into the brain of rats by adsorption to polysorbate 80-coated polybutylcyanoacrylate nanoparticles: an in situ brain perfusion study. Journal of Microencapsulation. 1998;15(1):67-74. 42. Halmos T, Santarromana M, Antonakis K, Scherman D. Synthesis of glucose-chlorambucil derivatives and their recognition by the human GLUT1 glucose transporter. European Journal of Pharmacology. 1996;318(2–3):477-84.

References
124
43. Koo OM, Rubinstein I, Onyuksel H. Role of nanotechnology in targeted drug delivery and imaging: a concise review. Nanomedicine: Nanotechnology, Biology and Medicine. 2005;1(3):193-212. 44. Danhier F, Feron O, Préat V. To exploit the tumor microenvironment: Passive and active tumor targeting of nanocarriers for anti-cancer drug delivery. Journal of Controlled Release. 2010;148(2):135-46. 45. Costas Kaparissides SA, Katerina Kotti and Sotira Chaitidou. Recent Advances in Novel Drug Delivery Systems. 2014. Available from: http://www.azonano.com/article.aspx?ArticleID=1538. 46. Wissing SA, Kayser O, Müller RH. Solid lipid nanoparticles for parenteral drug delivery. Advanced Drug Delivery Reviews. 2004;56(9):1257-72. 47. Riganti C, Voena C, Kopecka J, Corsetto PA, Montorfano G, Enrico E, et al. Liposome-encapsulated Doxorubicin reverses drug resistance by inhibiting P-glycoprotein in human cancer cells. Molecular Pharmaceutics. 2011;8(3):683-700. 48. Krishna R, Mayer LD. Liposomal Doxorubicin circumvents PSC 833-free drug interactions, resulting in effective therapy of multidrug-resistant solid tumors. Cancer Research. 1997;57(23):5246-53. 49. Wang J, Goh B, Lu W, Zhang Q, Chang A, Liu XY, et al. In vitro cytotoxicity of Stealth liposomes co-encapsulating Doxorubicin and verapamil on Doxorubicin-resistant tumor cells. Biological and Pharmaceutical Bulletin. 2005;28(5):822-8. 50. Orive G, Anitua E, Pedraz JL, Emerich DF. Biomaterials for promoting brain protection, repair and regeneration. Nature Reviews Neuroscience. 2009;10(9):682-92. 51. Gagliardi M, Bardi G, Bifone A. Polymeric nanocarriers for controlled and enhanced delivery of therapeutic agents to the CNS. Therapeutic Delivery. 2012;3(7):875-87. 52. Masserini M. Nanoparticles for brain drug delivery. International Scholarly Research Notices. 2013;2013. 53. Dhanikula RS, Hammady T, Hildgen P. On the mechanism and dynamics of uptake and permeation of polyether‐copolyester dendrimers across an in vitro blood–brain barrier model. Journal of Pharmaceutical Sciences. 2009;98(10):3748-60. 54. Singh R, Lillard Jr JW. Nanoparticle-based targeted drug delivery. Experimental and Molecular Pathology. 2009;86(3):215-23. 55. Escobar-Chávez JJ, Revilla-Vázquez AL, Domínguez-Delgado CL, Rodríguez-Cruz IM, Aléncaster NC, Díaz-Torres R. Nanocarrier systems for transdermal drug delivery, recent advances in novel drug carrier systems, Ali Demir Sezer (Ed.): InTech; 2012. Available from: http://www.intechopen.com/books/recent-advances-in-novel-drug-carrier-systems/nanocarrier-systems-for-transdermal-drug-delivery 56. Welch MJ, Hawker CJ, Wooley KL. The advantages of nanoparticles for PET. Journal of Nuclear Medicine. 2009;50(11):1743-6. 57. Kumari A, Yadav SK, Yadav SC. Biodegradable polymeric nanoparticles based drug delivery systems. Colloids and Surfaces B-Biointerfaces. 2010;75(1):1-18. 58. Hans ML, Lowman AM. Biodegradable nanoparticles for drug delivery and targeting. Current Opinion in Solid State and Materials Science. 2002;6(4):319-27. 59. Couvreur P. Polyalkylcyanoacrylates as colloidal drug carriers. Critical Reviews in Therapeutic Drug Carrier Systems. 1988;5(1):1-20. 60. Nicolas J, Couvreur P. Synthesis of poly(alkyl cyanoacrylate)-based colloidal nanomedicines. Wiley Interdisciplinary Reviews-Nanomedicine and Nanobiotechnology. 2009;1(1):111-127. 61. Liu Z, Jiao Y, Wang Y, Zhou C, Zhang Z. Polysaccharides-based nanoparticles as drug delivery systems. Advanced Drug Delivery Reviews. 2008;60(15):1650-62. 62. Vezin WR, Florence AT. In vitro heterogeneous degradation of poly(n-alkyl alpha-cyanoacrylates). Journal of Biomedical Materials Research. 1980;14(2):93-106. 63. Allaker RP, Ren G. Potential impact of nanotechnology on the control of infectious diseases. Transactions of the Royal Society of Tropical Medicine and Hygiene. 2008;102(1):1-2.

References
125
64. Nel AE, Madler L, Velegol D, Xia T, Hoek EMV, Somasundaran P, et al. Understanding biophysicochemical interactions at the nano-bio interface. Nature Materials. 2009;8(7):543-57. 65. Seetharam RN, Sridhar KR. Nanotoxicity: Threat posed by nanoparticles. Current Science. 2007;93(6):769-70. 66. Allaker RP, Memarzadeh K. Nanoparticles and the control of oral infections. International Journal of Antimicrobial Agents.2014; 43(2): 95-104. 67. Olivier J-C. Drug transport to brain with targeted nanoparticles. NeuroRx: The Journal of the American Society for Experimental NeuroTherapeutics. 2005;2(1):108-119. 68. Kreuter J. Drug delivery to the central nervous system by polymeric nanoparticles: What do we know? Advanced Drug Delivery Reviews. 2014;71(0):2-14. 69. Fresta M, Cavallaro G, Giammona G, Wehrli E, Puglisi G. Preparation and characterisation of polyethyl-2-cyanoacrylate nanocapsules containing antiepileptic drugs. Biomaterials. 1996;17(8):751-8. 70. Costantino L, Boraschi D. Is there a clinical future for polymeric nanoparticles as brain-targeting drug delivery agents? Drug Discovery Today. 2012;17(7):367-78. 71. Zhang L, Gu FX, Chan JM, Wang AZ, Langer RS, Farokhzad OC. Nanoparticles in medicine: therapeutic applications and developments. Clinical Pharmacology & Therapeutics. 2007;83(5):761-9. 72. Chen H, Khemtong C, Yang X, Chang X, Gao J. Nanonisation strategies for poorly water-soluble drugs. Drug Discovery Today. 2011;16(7):354-60. 73. Sindhu D, Anjali J, Wahid K, Abraham JD. Biodegradable polymers-an overview. Polymers for Advanced Technologies.2014;25(5):427-435. 74. Vauthier C, Dubernet C, Chauvierre C, Brigger I, Couvreur P. Drug delivery to resistant tumors: the potential of poly(alkyl cyanoacrylate) nanoparticles. Journal of Controlled Release. 2003;93(2):151-60. 75. Murakami H, Kobayashi M, Takeuchi H, Kawashima Y. Further application of a modified spontaneous emulsification solvent diffusion method to various types of PLGA and PLA polymers for preparation of nanoparticles. Powder Technology. 2000;107(1):137-43. 76. Neha B, Ganesh B, Preeti K. Drug delivery to the brain using polymeric nanoparticles: a review. International Journal of Pharmaceutical and Life Sciences. 2013;2(3):107-32. 77. Bouten PJM, Zonjee M, Bender J, Yauw STK, van Goor H, van Hest J, et al. The chemistry of tissue adhesive materials. Progress in Polymer Science. 2014;39(7):1375-1405. 78. Fang C, Shi B, Pei YY, Hong MH, Wu J, Chen HZ. In vivo tumor targeting of tumor necrosis factor-alpha-loaded stealth nanoparticles: Effect of MePEG molecular weight and particle size. European Journal of Pharmaceutical Sciences. 2006;27(1):27-36. 79. Schroder U, Sabel BA. Nanoparticles, a drug carrier system to pass the blood-brain barrier, permit central analgesic effects of iv dalargin injections. Brain Research. 1996;710(1-2):121-4. 80. Robello DR, Eldridge TD, Swanson MT. Degradation and stabilisation of polycyanoacrylates. Journal of Polymer Science Part A - Polymer Chemistry. 1999;37(24):4570-4581. 81. Lherm C, Muller RH, Puisieux F, Couvreur P. Alkylcyanoacrylate drug carriers .2. cytotoxicity of cyanoacrylate nanoparticles with different alkyl chain-length. International Journal of Pharmaceutics. 1992;84(1):13-22. 82. Mueller RH, Lherm C, Herbort J, Blunk T, Couvreur P. Alkylcyanoacrylate drug carriers i. physicochemical characterisation of nanoparticles with different alkyl chain length. International Journal of Pharmaceutics (Kidlington). 1992;84(1):1-11. 83. Dossi M, Storti G, Moscatelli D, editors. Synthesis of poly (alkyl cyanoacrylates) as biodegradable polymers for drug delivery applications. Macromolecular Symposia. 2010;289(1):124-128. 84. Song B, Zhang H, Wang H, Yang S, Jin L, Hu D, et al. Synthesis and antiviral activity of novel chiral cyanoacrylate derivatives. Journal of Agricultural and Food Chemistry. 2005;53(20):7886-91. 85. Exline DL, Wallace C, Roux C, Lennard C, Nelson MP, Treado PJ. Forensic applications of chemical imaging: latent fingerprint detection using visible absorption and luminescence. Journal of Forensic Sciences. 2003;48(5):1047-53.

References
126
86. Edwards HGM, Day JS. Fourier transform Raman spectroscopic studies of the curing of cyanoacrylate glue. Journal of Raman Spectroscopy. 2004;35(7):555-60. 87. Mankidy PJ, Rajagopalan R, Foley HC. Influence of initiators on the growth of poly (ethyl 2-cyanoacrylate) nanofibers. Polymer. 2008;49(9):2235-42. 88. Troster SD, Muller U, Kreuter J. Modification of the body distribution of poly(methyl methacrylate) nanoparticles in rats by coating with surfactants. International Journal of Pharmaceutics. 1990;61(1-2):85-100. 89. Crespy D, Landfester K. Miniemulsion polymerisation as a versatile tool for the synthesis of functionalized polymers. Beilstein Journal of Organic Chemistry. 2010;6(1):1132-1148. 90. Alyautdin RN, Petrov VE, Langer K, Berthold A, Kharkevich DA, Kreuter J. Delivery of loperamide across the blood-brain barrier with polysorbate 80-coated polybutylcyanoacrylate nanoparticles. Pharmaceutical Research. 1997;14(3):325-8. 91. Gulyaev AE, Gelperina SE, Skidan IN, Antropov AS, Kivman GY, Kreuter J. Significant transport of Doxorubicin into the brain with polysorbate 80-coated nanoparticles. Pharmaceutical Research. 1999;16(10):1564-1569. 92. Kreuter J, Alyautdin RN, Kharkevich DA, Ivanov AA. Passage of peptides through the blood-brain-barrier with colloidal polymer particles (nanoparticles). Brain Research. 1995;674(1):171-4. 93. Olivier JC, Fenart L, Chauvet R, Pariat C, Cecchelli R, Couet W. Indirect evidence that drug brain targeting using polysorbate 80-coated polybutylcyanoacrylate nanoparticles is related to toxicity. Pharmaceutical Research. 1999;16(12):1836-42. 94. Kreuter J. Drug delivery to the central nervous system by polymeric nanoparticles: What do we know? Advanced Drug Delivery Reviews. 2014;71(0):2-14. 95. Gessner A, Olbrich C, Schroder W, Kayser O, Muller RH. The role of plasma proteins in brain targeting: species dependent protein adsorption patterns on brain-specific lipid drug conjugate (LDC) nanoparticles. International Journal of Pharmaceutics. 2001;214(1-2). 96. Chen B-K, Wu T-Y, Chang Y-M, Chen AF. Ductile polylactic acid prepared with ionic liquids. Chemical Engineering Journal. 2013;215:886-93. 97. Garlotta D. A literature review of poly (lactic acid). Journal of Polymers and the Environment. 2001;9(2):63-84. 98. Rouzes C, Gref R, Leonard M, Delgado AD, Dellacherie E. Surface modification of poly(lactic acid) nanospheres using hydrophobically modified dextrans as stabilizers in an o/w emulsion/evaporation technique. Journal of Biomedical Materials Research. 2000;50(4):557-565. 99. Nordmeier E. Static and dynamic light-scattering solution behavior of pullulan and dextran in comparison. Journal of Physical Chemistry. 1993;97(21):5770-5785. 100. Sidebotham RL. Dextrans. Advances in Carbohydrate Chemistry and Biochemistry. 1974;30:371-444. 101. Triguero D, Buciak J, Pardridge WM. Capillary depletion method for quantification of blood–brain barrier transport of circulating peptides and plasma proteins. Journal of Neurochemistry. 1990;54(6):1882-8. 102. Cadee JA, van Luyn MJA, Brouwer LA, Plantinga JA, van Wachem PB, de Groot CJ, et al. In vivo biocompatibility of dextran-based hydrogels. Journal of Biomedical Materials Research. 2000;50(3):397-404. 103. Arias JL, Gallardo V, Gomez-Lopera SA, Plaza RC, Delgado AV. Synthesis and characterisation of poly (ethyl-2-cyanoacrylate) nanoparticles with a magnetic core. Journal of Controlled Release. 2001;77(3):309-21. 104. Probes M. Dextran conjugates - Documents & Support | Life Technologies 2014. Available from: https://www.lifetechnologies.com/search/global/searchAction.action?resultPage=1&resultsPerPage=15&query=dextran+conjugates&autocomplete=true&personaFilterTerm=Support+%26+Troubleshoot&firstSearch=false&e71complete=false. 105. Mehvar R. Dextrans for targeted and sustained delivery of therapeutic and imaging agents. Journal of Controlled Release. 2000;69(1):1-25.

References
127
106. Kreuter J. Direct evidence that polysorbate-80-coated poly(butylcyanoacrylate) nanoparticles deliver drugs to the CNS via specific mechanisms requiring prior binding of drug to the nanoparticles. Pharmaceutical Research. 2003;20:409-16. 107. Vauthier C, Dubernet C, Fattal E, Pinto-Alphandary H, Couvreur P. Poly(alkylcyanoacrylates) as biodegradable materials for biomedical applications. Advanced Drug Delivery Reviews. 2003;55(4):519-48. 108. Han MG, Kim S, Liu SX. Synthesis and degradation behavior of poly(ethyl cyanoacrylate). Polymer Degradation and Stability. 2008;93(7):1243-51. 109. Gibaud S, Rousseau C, Weingarten C, Favier R, Douay L, Andreux JP, et al. Polyalkylcyanoacrylate nanoparticles as carriers for granulocyte-colony stimulating factor (G-CSF). Journal of Controlled Release. 1998;52(1):131-9. 110. Qi L, Xu Z, Jiang X, Hu C, Zou X. Preparation and antibacterial activity of chitosan nanoparticles. Carbohydrate Research. 2004;339(16):2693-700. 111. Dudhani AR, Kosaraju SL. Bioadhesive chitosan nanoparticles: Preparation and characterisation. Carbohydrate Polymers. 2010;81(2):243-51. 112. Banerjee T, Mitra S, Kumar Singh A, Kumar Sharma R, Maitra A. Preparation, characterisation and biodistribution of ultrafine chitosan nanoparticles. International Journal of Pharmaceutics. 2002;243(1–2):93-105. 113. Fernández-Urrusuno R, Calvo P, Remuñán-López C, Vila-Jato JL, Alonso MJ. Enhancement of nasal absorption of insulin using chitosan nanoparticles. Pharmaceutical Research. 1999;16(10):1576-81. 114. Kim S, Evans K, Biswas A. Production of BSA-poly (ethyl cyanoacrylate) nanoparticles as a coating material that improves wetting property. Colloids and Surfaces B: Biointerfaces. 2013;107:68-75. 115. Behan N, Birkinshaw C, Clarke N. Poly n-butyl cyanoacrylate nanoparticles: a mechanistic study of polymerisation and particle formation. Biomaterials. 2001;22(11):1335-44. 116. Wischke C, Schneider C, Neffe AT, Lendlein A. Polyalkylcyanoacrylates as in situ formed diffusion barriers in multimaterial drug carriers. Journal of Controlled Release. 2013;169(3):321-8. 117. Puglisi G, Fresta M, Giammona G, Ventura CA. Influence of the preparation conditions on poly (ethylcyanoacrylate) nanocapsule formation. International Journal of Pharmaceutics. 1995;125(2):283-7. 118. Kattan J, Droz J-P, Couvreur P, Marino J-P, Boutan-Laroze A, Rougier P, et al. Phase I clinical trial and pharmacokinetic evaluation of Doxorubicin carried by polyisohexylcyanoacrylate nanoparticles. Investigational New Drugs. 1992;10(3):191-9. 119. Rao JP, Geckeler KE. Polymer nanoparticles: Preparation techniques and size-control parameters. Progress in Polymer Science. 2011;36(7):887-913. 120. Quintanar-Guerrero D, Allemann E, Doelker E, Fessi H. Preparation and characterisation of nanocapsules from preformed polymers by a new process based on emulsification-diffusion technique. Pharmaceutical Research. 1998;15(7):1056-62. 121. Xu D, Wu F, Chen Y, Wei L, Yuan W. pH-sensitive degradable nanoparticles for highly efficient intracellular delivery of exogenous protein. International Journal of Nanomedicine. 2013;8:3405-3414. 122. Ling Y, Huang Y, editors. Preparation and release efficiency of poly (lactic-co-glycolic) acid nanoparticles for drug loaded paclitaxel. IFMBE Proceedings. 2008;19:514-517. 123. Huang C-Y, Chen C-M, Lee Y-D. Synthesis of high loading and encapsulation efficient paclitaxel-loaded poly (n-butyl cyanoacrylate) nanoparticles via miniemulsion. International Journal of Pharmaceutics. 2007;338(1):267-75. 124. Bertholon I, Lesieur S, Labarre D, Besnard M, Vauthier C. Characterisation of dextran-poly (isobutylcyanoacrylate) copolymers obtained by redox radical and anionic emulsion polymerisation. Macromolecules. 2006;39(10):3559-67. 125. Gref R, and P. Couvreur. Nanocapsules: preparation, characterisation and therapeutic applications." Nanoparticulates as drug carries (ed. V Torchilin). 2006. p. 255-76. 126. Karas M, Hillenkamp F. Laser desorption ionisation of proteins with molecular masses exceeding 10,000 daltons. Analytical Chemistry. 1988;60(20):2299-301.

References
128
127. Lewis JK, Wei J, Siuzdak G. Matrix‐Assisted Laser Desorption/Ionisation Mass Spectrometry in Peptide and Protein Analysis. Encyclopedia of Analytical Chemistry. 2000. 128. Jagtap RN, Ambre AH. Overview literature on matrix assisted laser desorption ionisation mass spectroscopy (MALDI MS): basics and its applications in characterising polymeric materials. Bulletin of Materials Science. 2005;28(6):515-28. 129. Wu KJ, Odom RW. Peer Reviewed: Characterising Synthetic Polymers by MALDI MS. Analytical Chemistry. 1998;70(13):456A-61A. 130. Lin Y-S, Chen Y-C. Laser desorption/ionisation time-of-flight mass spectrometry on sol-gel-derived 2, 5-dihydroxybenzoic acid film. Analytical chemistry. 2002;74(22):5793-8. 131. Mank M, Stahl B, Boehm G. 2, 5-Dihydroxybenzoic acid butylamine and other ionic liquid matrixes for enhanced MALDI-MS analysis of biomolecules. Analytical Chemistry. 2004;76(10):2938-50. 132. Russell DH, Edmondson RD. High‐resolution mass spectrometry and accurate mass measurements with emphasis on the characterisation of peptides and proteins by matrix‐assisted laser desorption/ionisation time‐of‐flight mass spectrometry. Journal of Mass Spectrometry. 1997;32(3):263-76. 133. Carr B, Wright M. Nanoparticle Tracking Analysis - A review of applications and usage. Nanosight Ltd. Amesbury: 2013. 134. Instruments M. BCF Zetasizer Nano 2015. Available from: http://bcf.assic.sinica.edu.tw/zeta.htm. 135. Coats AW, Redfern JP. Thermogravimetric analysis. A review. Analyst. 1963;88(1053):906-924. 136. Wittke JH. Instrumentation 2015. Available from: http://www4.nau.edu/microanalysis/microprobe-sem/instrumentation.htmL. 137. Arias JL, Gallardo V, Ruiz MA, Delgado AV. Ftorafur loading and controlled release from poly(ethyl-2-cyanoacrylate) and poly(butylcyanoacrylate) nanospheres. International Journal of Pharmaceutics. 2007;337(1-2):282-90. 138. Rodrigues MR. Hydrophobic derivatives of dextran polysaccharide: Characterisation and properties. Journal of Carbohydrate Chemistry. 2005;24(7):733-744. 139. Aumelas A, Serrero A, Durand A, Dellacherie E, Leonard M. Nanoparticles of hydrophobically modified dextrans as potential drug carrier systems. Colloids and Surfaces B-Biointerfaces. 2007;59(1):74-80. 140. Rotureau E, Leonard M, Dellacherie E, Durand A. Amphiphilic derivatives of dextran: Adsorption at air/water and oil/water interfaces. Journal of Colloid and Interface Science. 2004;279(1):68-77. 141. Rotureau E, Chassenieux C, Dellacherie E, Durand A. Neutral polymeric Surfactants derived from dextran: A study of their aqueous solution behavior. Macromolecular Chemistry and Physics. 2005;206(20):2038-2046. 142. Rotureau E, Marie E, Leonard M, Dellacherie E, Camesano TA, Durand A. From polymeric surfactants to colloidal systems (2): Preparation of colloidal dispersions. Colloids and Surfaces a-Physicochemical and Engineering Aspects. 2006;288(1-3):62-70. 143. Chiewpattanakul P, Covis R, Vanderesse R, Thanomsub B, Marie E, Durand A. Design of polymeric nanoparticles for the encapsulation of monoacylglycerol. Colloid and Polymer Science. 2010;288(9):959-967. 144. Carrier O, Covis R, Marie E, Durand A. Inverse emulsions stabilized by a hydrophobically modified polysaccharide. Carbohydrate Polymers. 2011;84(1):599-604. 145. Lu M, Johansson G, Albertsson PA, Tjerneld F. Partitioning of proteins in dextran/hydrophobically modified dextran aqueous two-phase systems. Bioseparation. 1995;5(6) :351-358. 146. Sadtler VM, Imbert P, Dellacherie E. Ostwald ripening of oil-in-water emulsions stabilized by phenoxy-substituted dextrans. Journal of Colloid and Interface Science. 2002;254(2):355-361. 147. Rouzes C, Durand A, Leonard M, Dellacherie E. Surface activity and emulsification properties of hydrophobically modified dextrans. Journal of Colloid and Interface Science. 2002;253(1):217-223.

References
129
148. Fournier C, Leonard M, Dellacherie E, Chikhi M, Hommel H, Legrand AP. EPR spectroscopy analysis of hydrophobically modified dextran-coated polystyrene. Journal of Colloid and Interface Science. 1998;198(1):27-33. 149. Molnar E, Barbu E, Lien C-F, Gorecki DC, Tsibouklis J. Toward Drug Delivery into the Brain: Synthesis, Characterisation, and Preliminary In Vitro Assessment of Alkylglyceryl-Functionalized Chitosan Nanoparticles. Biomacromolecules. 2010;11(11):2880-9. 150. Tam S-C, Blumenstein J, Wong JT. Soluble dextran-hemoglobin complex as a potential blood substitute. Proceedings of the National Academy of Sciences. 1976;73(6):2128-31. 151. Gil EC, Colarte AI, El Ghzaoui A, Durand D, Delarbre JL, Bataille B. A sugar cane native dextran as an innovative functional excipient for the development of pharmaceutical tablets. European Journal of Pharmaceutics and Biopharmaceutics. 2008;68(2):319-29. 152. Karas M, Bahr U, Strupat K, Hillenkamp F, Tsarbopoulos A, Pramanik BN. Matrix dependence of metastable fragmentation of glycoproteins in MALDI TOF mass spectrometry. Analytical Chemistry. 1995;67(3):675-9. 153. Harvey DJ. Matrix-assisted laser desorption/ionisation mass spectrometry of carbohydrates. Mass Spectrometry Reviews. 1999;18(6):349-450. 154. Hung W-T, Wang S-H, Chen Y-T, Yu H-M, Chen C-H, Yang W-B. MALDI-TOF MS analysis of native and permethylated or benzimidazole-derivatized polysaccharides. Molecules. 2012;17(5):4950-61. 155. Tang M, Dou H, Sun K. One-step synthesis of dextran-based stable nanoparticles assisted by self-assembly. Polymer. 2006;47(2):728-34. 156. Stenekes RJH, Talsma H, Hennink WE. Formation of dextran hydrogels by crystallisation. Biomaterials. 2001;22(13):1891-8. 157. Marvin LF, Roberts MA, Fay LB. Matrix-assisted laser desorption/ionisation time-of-flight mass spectrometry in clinical chemistry. Clinica chimica acta. 2003;337(1):11-21. 158. Garrozzo D, Impallomeni G, Spina E, Sturiale L, Zanetti F. Matrix‐assisted laser desorption/ionisation mass spectrometry of polysaccharides. Rapid Communications in Mass Spectrometry. 1995;9(10):937-41. 159. Wondraczek H, Elschner T, Heinze T. Synthesis of highly functionalized dextran alkyl carbonates showing nanosphere formation. Carbohydrate Polymers. 2011;83(3):1112-8. 160. Robello DR, Eldridge TD, Swanson MT. Degradation and stabilisation of polycyanoacrylates. Journal of Polymer Science Part A Polymer Chemistry. 1999;37:4570-81. 161. Denchev Z, Tomanova M, Lederer A. On the anionic homo‐and copolymerisation of ethyl‐and butyl‐2‐cyanoacrylates. Journal of Polymer Science Part A - Polymer Chemistry. 2008;46(15):5142-56. 162. Klemarczyk P. The isolation of a zwitterionic initiating species for ethyl cyanoacrylate (ECA) polymerisation and the identification of the reaction products between 1°, 2°, and 3° amines with ECA. Polymer.2001; 42(7):2837-2848. 163. Poupaert JH, Couvreur P. A computationally derived structural model of Doxorubicin interacting with oligomeric polyalkylcyanoacrylate in nanoparticles. Journal of Controlled Release. 2003;92(1):19-26. 164. TomLinson SK, Ghita OR, Hooper RM, Evans KE. The use of near-infrared spectroscopy for the cure monitoring of an ethyl cyanoacrylate adhesive. Vibrational Spectroscopy. 2006;40(1):133-41. 165. Choi S-W, Kim J-H. Design of surface-modified poly(d,l-lactide-co-glycolide) nanoparticles for targeted drug delivery to bone. Journal of Controlled Release. 2007;122(1):24-30. 166. Choi K-C, Bang J-Y, Kim C, Kim P-I, Lee S-R, Chung W-T, et al. Antitumor Effect of Adriamycin-Encapsulated Nanoparticles of Poly(DL-lactide-co-glycolide)-Grafted Dextran. Journal of Pharmaceutical Sciences. 2009;98(6):2104-12. 167. Sullivan CO, Birkinshaw C. In vitro degradation of insulin-loaded poly (n-butylcyanoacrylate) nanoparticles. Biomaterials. 2004;25(18):4375-82. 168. O'Sullivan C, Birkinshaw C. Hydrolysis of poly (n-butylcyanoacrylate) nanoparticles using esterase. Polymer Degradation and Stability. 2002;78(1):7-15.

References
130
169. Chauvierre C, Labarre D, Couvreur P, Vauthier C. Radical emulsion polymerisation of alkylcyanoacrylates initiated by the redox system dextran-cerium(IV) under acidic aqueous conditions. Macromolecules. 2003;36(16):6018-27. 170. Pirker S, Kruse J, Noe C, Langer K, Zimmer A, Kreuter J. Characterisation of polybutyleyanoacrylate nanoparticles. Part II: determination of polymer content by NMR-analysis. International Journal of Pharmaceutics. 1996;128(1):189-95. 171. De Jong SJ, De Smedt SC, Demeester J, Van Nostrum CF, Kettenes-Van Den Bosch JJ, Hennink WE. Biodegradable hydrogels based on stereocomplex formation between lactic acid oligomers grafted to dextran. Journal of Controlled Release. 2001;72(1):47-56. 172. Bashari M, Lagnika C, Ocen D, Chen H, Wang J, Xu X, et al. Separation and characterisation of dextran extracted from deteriorated sugarcane. International Journal of Biological Macromolecules. 2013;59:246-54. 173. Yordanov G. Influence of the preparation method on the physicochemical properties of econazole-loaded poly(butyl cyanoacrylate) colloidal nanoparticles. Colloids and Surfaces A: Physicochemical and Engineering Aspects. 2012;413(0):260-5. 174. Siddiqui NN, Aman A, Silipo A, Qader SAU, Molinaro A. Structural analysis and characterisation of dextran produced by wild and mutant strains of Leuconostoc mesenteroides. Carbohydrate Polymers. 2014;99(0):331-8. 175. Elschner T, Wondraczek H, Heinze T. Syntheses and detailed structure characterisation of dextran carbonates. Carbohydrate Polymers. 2013;93(1):216-23. 176. Arranz F, Roman JS, Sanchezchaves M. C-13 NMR-study of the selectivity in the modification of dextran with ethyl chloroformate. Macromolecules. 1987;20(4):801-806. 177. Covis R, Ladaviere C, Desbrieres J, Marie E, Durand A. Synthesis of water-soluble and water-insoluble amphiphilic derivatives of dextran in organic medium. Carbohydrate Polymers. 2013;95(1):360-5. 178. Van Dijk-Wolthuis WNE, Franssen O, Talsma H, Van Steenbergen MJ, Kettenes-Van Den Bosch JJ, Hennink WE. Synthesis, characterisation, and polymerisation of glycidyl methacrylate derivatized dextran. Macromolecules. 1995;28(18):6317-22. 179. Espartero JL, Rashkov I, Li SM, Manolova N, Vert M. NMR analysis of low molecular weight poly (lactic acid) s. Macromolecules. 1996;29(10):3535-9. 180. Jain AK, Goyal AK, Gupta PN, Khatri K, Mishra N, Mehta A, et al. Synthesis, characterisation and evaluation of novel triblock copolymer based nanoparticles for vaccine delivery against hepatitis B. Journal of Controlled Release. 2009;136(2):161-9. 181. Muller RH, Lherm C, Herbort J, Blunk T, Couvreur P. Alkylcyanoacrylate drug carriers .1. physicochemical characterisation of nanoparticles with different alkyl chain-length. International Journal of Pharmaceutics. 1992;84(1):1-11. 182. Scherer D, Robinson JR, Kreuter J. Influence of enzymes on the stability of polybutylcyanoacrylate nanoparticles. International Journal of Pharmaceutics. 1994;101(1–2):165-168. 183. Sharma RA, Gescher AJ, Steward WP. Curcumin: the story so far. European Journal of Cancer. 2005;41(13):1955-68. 184. Wu F-Y, Sun M-Z, Xiang Y-L, Wu Y-M, Tong D-Q. Curcumin as a colorimetric and fluorescent chemosensor for selective recognition of fluoride ion. Journal of Luminescence. 2010;130(2):304-8. 185. Bong P-H. Spectral and photophysical behaviors of Curcumin and Curcuminoids. Bulletin-Korean Chemical Society. 2000;21(1):81-6. 186. Yang K-Y, Lin L-C, Tseng T-Y, Wang S-C, Tsai T-H. Oral bioavailability of Curcumin in rat and the herbal analysis from Curcuma longa by LC–MS/MS. Journal of Chromatography B. 2007;853(1):183-9. 187. Kunwar A, Barik A, Priyadarsini KI, Pandey R. Absorption and fluorescence studies of Curcumin bound to liposome and living cells. BARC Newsletter. 2007;285:213. 188. Patra D, Barakat C. Synchronous fluorescence spectroscopic study of solvatochromic Curcumin dye. Spectrochimica Acta Part A: Molecular and Biomolecular Spectroscopy. 2011;79(5):1034-41.

References
131
189. Arcamone F, Animati F, Capranico G, Lombardi P, Pratesi G, Manzini S, et al. New developments in antitumor anthracyclines. Pharmacology & Therapeutics. 1997;76(1–3):117-24. 190. Binaschi M, Bigioni M, Cipollone A, Rossi C, Goso C, Maggi CA, et al. Anthracyclines: selected new developments. Current Medicinal Chemistry-Anti-Cancer Agents. 2001;1(2):113-30. 191. Toffoli G, Corona G, Sorio R, Bertola A, Boiocchi M. Reversal activity of cyclosporin A and its metabolites M1, M17 and M21 in multidrug‐resistant cells. International Journal of Cancer. 1997;71(5):900-6. 192. Lehne G. P-glycoprotein as a drug target in the treatment of multidrug resistant cancer. Current Drug Targets. 2000;1(1):85-99. 193. Steiniger SCJ, Kreuter J, Khalansky AS, Skidan IN, Bobruskin AI, Smirnova ZS, et al. Chemotherapy of glioblastoma in rats using Doxorubicin‐loaded nanoparticles. International Journal of Cancer. 2004;109(5):759-67. 194. Emilienne Soma C, Dubernet C, Bentolila D, Benita S, Couvreur P. Reversion of multidrug resistance by co-encapsulation of Doxorubicin and cyclosporin A in polyalkylcyanoacrylate nanoparticles. Biomaterials. 2000;21(1):1-7. 195. de Verdiere AC, Dubernet C, Nemati F, Soma E, Appel M, Ferte J, et al. Reversion of multidrug resistance with polyalkylcyanoacrylate nanoparticles: towards a mechanism of action. British Journal of Cancer. 1997;76(2):198-205. 196. Duan J, Mansour HM, Zhang Y, Deng X, Chen Y, Wang J, et al. Reversion of multidrug resistance by co-encapsulation of Doxorubicin and Curcumin in chitosan/poly(butyl cyanoacrylate) nanoparticles. International Journal of Pharmaceutics. 2012;426(1–2):193-201. 197. Carvalho C, Santos RX, Cardoso S, Correia S, Oliveira PJ, Santos MS, et al. Doxorubicin: the good, the bad and the ugly effect. Current Medicinal Chemistry. 2009;16(25):3267-85. 198. Thorn CF, Oshiro C, Marsh S, Hernandez-Boussard T, McLeod H, Klein TE, et al. Doxorubicin pathways: pharmacodynamics and adverse effects. Pharmacogenetics and Genomics. 2011;21(7):440-446. 199. Lee S-H, Baek H-H, Kim JH, Choi S-W. Core-shell poly (d, l-lactide-co-glycolide)/poly (ethyl 2-cyanoacrylate) microparticles with Doxorubicin to reduce initial burst release. Macromolecular Research. 2009;17(12):1010-4. 200. Yang SC, Ge HX, Hu Y, Jiang XQ, Yang CZ. Doxorubicin‐loaded poly (butylcyanoacrylate) nanoparticles produced by emulsifier‐free emulsion polymerisation. Journal of Applied Polymer Science. 2000;78(3):517-26. 201. Rejinold NS, Muthunarayanan M, Divyarani VV, Sreerekha PR, Chennazhi KP, Nair SV, et al. Curcumin-loaded biocompatible thermoresponsive polymeric nanoparticles for cancer drug delivery. Journal of Colloid and Interface Science. 2011;360(1):39-51. 202. DeAngelis PL. Polysaccharide labeling with N-methylisatoic anhydride: Generation of ultraviolet chromophores and blue fluorophores. Analytical Biochemistry. 2000;284(1):167-169. 203. Wan CPL, Letchford K, Jackson JK, Burt HM. The combined use of paclitaxel-loaded nanoparticles with a low-molecular-weight copolymer inhibitor of P-glycoprotein to overcome drug resistance. International Journal of Nanomedicine. 2013;8:379-391 204. Xiong XY, Guo L, Gong YC, Li ZL, Li YP, Liu ZY, et al. In vitro & in vivo targeting behaviors of biotinylated Pluronic F127/poly (lactic acid) nanoparticles through biotin–avidin interaction. European Journal of Pharmaceutical Sciences. 2012;46(5):537-44. 205. Luo L, Tam J, Maysinger D, Eisenberg A. Cellular internalisation of poly (ethylene oxide)-b-poly (ε-caprolactone) diblock copolymer micelles. Bioconjugate Chemistry. 2002;13(6):1259-65. 206. Xu J, Zhao Q, Jin Y, Qiu L. High loading of hydrophilic/hydrophobic Doxorubicin into polyphosphazene polymersome for breast cancer therapy. Nanomedicine: Nanotechnology, Biology and Medicine. 2014;10(2):349-58. 207. Lowe TL, Tenhu H, Tylli H. Effect of hydrophobicity of a drug on its release from hydrogels with different topological structures. Journal of Applied Polymer Science. 1999;73(6):1031-9. 208. Wang B-L, Shen Y-m, Zhang Q-w, Li Y-l, Luo M, Liu Z, et al. Codelivery of Curcumin and Doxorubicin by MPEG-PCL results in improved efficacy of systemically administered chemotherapy in mice with lung cancer. International Journal of Nanomedicine. 2013;8:3521-3531

References
132
209. Mathew A, Fukuda T, Nagaoka Y, Hasumura T, Morimoto H, Yoshida Y, et al. Curcumin loaded-PLGA nanoparticles conjugated with Tet-1 peptide for potential use in Alzheimer's disease. PLoS One. 2012;7(3):e32616. 210. Mosmann T. Rapid colorimetric assay for cellular growth and survival: application to proliferation and cytotoxicity assays. Journal of Immunological Methods. 1983;65(1):55-63. 211. Cruz T, Gaspar R, Donato A, Lopes C. Interaction between polyalkylcyanoacrylate nanoparticles and peritoneal macrophages: MTT metabolism, NET reduction, and NO production. Pharmaceutical Research. 1997;14(1):73-9. 212. Nemati F, Dubernet C, De Verdière AC, Poupon MF, Treupel-Acar L, Puisieux F, et al. Some parameters influencing cytotoxicity of free Doxorubicin and Doxorubicin-loaded nanoparticles in sensitive and multidrug resistant leucemic murine cells: incubation time, number of nanoparticles per cell. International Journal of Pharmaceutics. 1994;102(1):55-62. 213. Maassen S, Fattal E, Müller RH, Couvreur P. Cell cultures for the assessment of toxicity and uptake of polymeric particulate drug carriers. STP Pharma Sciences. 1993;3(1):11-22. 214. Zange R, Kissel T. Comparative in vitro biocompatibility testing of polycyanoacrylates and poly(d,l-lactide-co-glycolide) using different mouse fibroblast (L929) biocompatibility test models. European Journal of Pharmaceutics and Biopharmaceutics. 1997;44(2):149-57. 215. Hee Park D, Bum Kim S, Ahn KD, Yong Kim E, Jun Kim Y, Keun Han D. In vitro degradation and cytotoxicity of alkyl 2‐cyanoacrylate polymers for application to tissue adhesives. Journal of Applied Polymer Science. 2003;89(12):3272-8. 216. Gipps EM, Groscurth P, Kreuter J, Speiser PP. The effects of polyalkylcyanoacrylate nanoparticles on human normal and malignant mesenchymal cells in vitro. International Journal of Pharmaceutics. 1987;40(1):23-31. 217. Huang C-Y, Lee Y-D. Core-shell type of nanoparticles composed of poly[(n-butyl cyanoacrylate)-co-(2-octyl cyanoacrylate)] copolymers for drug delivery application: Synthesis, characterisation and in vitro degradation. International Journal of Pharmaceutics. 2006;325(1–2):132-9. 218. Wiegand C, Winter D, Hipler UC. Molecular-weight-dependent toxic effects of chitosans on the human keratinocyte cell line HaCaT. Skin Pharmacology and Physiology. 2010;23(3):164-70. 219. Varshosaz J, Hassanzadeh F, Sadeghi H, Firozian F, Mirian M. Effect of molecular weight and molar ratio of dextran on self-assembly of dextran stearate polymeric micelles as nanocarriers for etoposide. Journal of Nanomaterials. 2012;2012:120. 220. Chauvierre C, Marden MC, Vauthier C, Labarre D, Couvreur P, Leclerc L. Heparin coated poly (alkylcyanoacrylate) nanoparticles coupled to hemoglobin: a new oxygen carrier. Biomaterials. 2004;25(15):3081-6.
Appendices
133
8
8. Appendices
APPENDIX 1 1H and 13C NMR spectra of butyl glycidyl ether
APPENDIX 2 1H AND 13C NMR spectra of tetradecyl glycidyl ether
APPENDIX 3 1H AND 13C NMR spectra of hexadecyl glycidyl ether
APPENDIX 4 SEM image of PECA-Dex100G4
APPENDIX 5 Snapshot of video measurement for PECA-NP loaded Rhodamine B
and coated with Polysorbate 80
APPENDIX 6 Thermograms of modified dextrans
APPENDIX 7 MALDI TOF spectra of modified dextrans
APPENDIX 8 MALDI TOF spectra of nanoparticles
APPENDIX 9 PECA-Dex100G8 tagged with MIA in PBS (confocal microscope)
APPENDIX 10 SEM image of PECA-Dex100G8 EGFP NPs
APPENDIX 11 Equations for elemental analysis determination
APPENDIX 12 Calibration curve for Curcumin
APPENDIX 13 SEM images of native dextran and Dex100G4
APPENDIX 14 Calibration curve for Doxorubicin
APPENDIX 15 Calibration curve for BSA
APPENDIX 16 Calibration curve for Evans blue
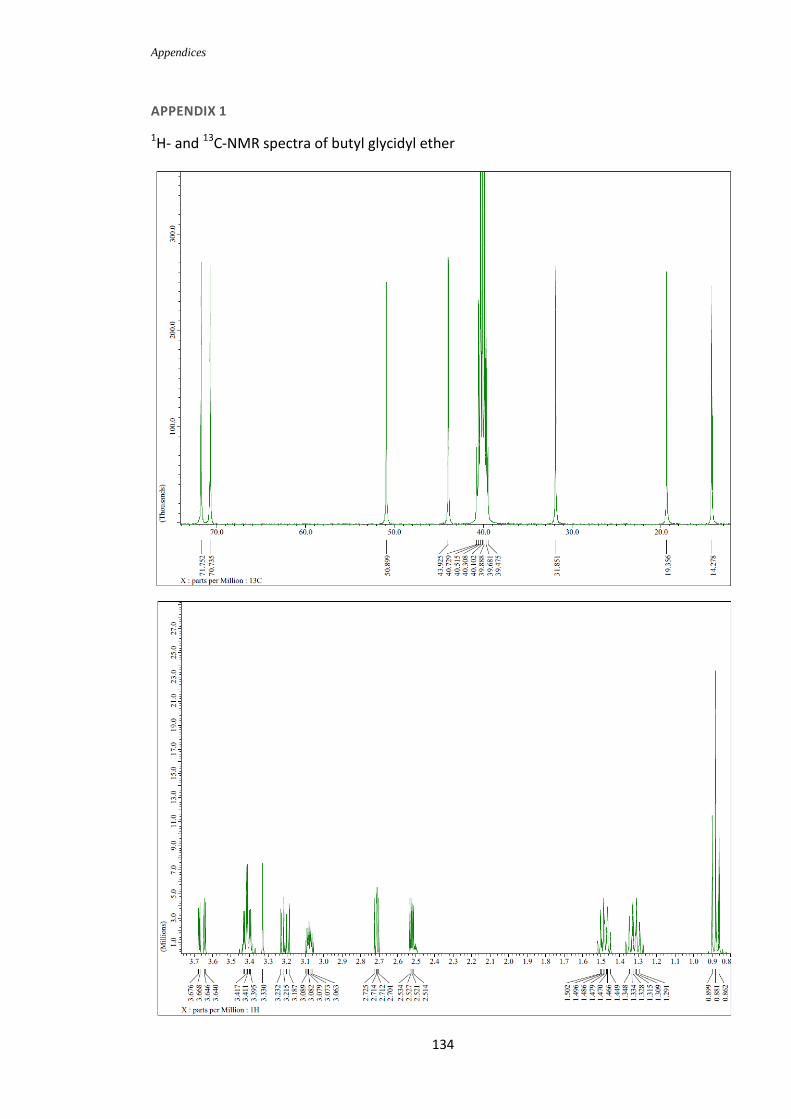
Appendices
134
APPENDIX 1
1H- and 13C-NMR spectra of butyl glycidyl ether

Appendices
135
APPENDIX 2
1H- AND 13C-NMR spectra of tetradecyl glycidyl ether

Appendices
136
APPENDIX 3
1H- AND 13C-NMR spectra of hexadecyl glycidyl ether

Appendices
137
APPENDIX 4
SEM image of PECA-Dex100G4

Appendices
138
APPENDIX 5
Video snapshot of PECA-NP loaded Rhodamine B and coated with Polysorbate 80

Appendices
139
APPENDIX 6 Thermograms of modified dextrans
Figure A6.1: TGA results of Dex6G8
Figure A6.2: TGA results of Dex6G12

Appendices
140
Figure A6.3: TGA results of Dex6G14
Figure A6.4: TGA results of Dex6G16

Appendices
141
Figure A6.5: TGA results of Dex100
Figure A6.6: TGA results of Dex100G4

Appendices
142
Figure A6.7: TGA results of Dex100G8
Figure A6.8: TGA results of Dex100G12

Appendices
143
Figure A6.9: TGA results of Dex100G14
Figure A6.10: TGA results of Dex100G16

Appendices
144
APPENDIX 7 MALDI TOF spectra of modified dextrans
Figure A7.1 MALDI- TOF Spectrum of Dex100G4
Figure A7.2: MALDI TOF spectrum of Dex6G8
O
OOH
OH
O
O
O
OH
C7H
11O
6
191.0556 Da
C7H
15O
2
131.1072 Da
Molecular Formula = C14
H26
O8
146.0
130.1
O
OOH
OH
O
O
O
OH
C7H
11O
6
191.0556 Da
C11
H23
O2
187.1698 Da
56.2.

Appendices
145
Figure A7.3: MALDI TOF Spectrum of Dex100G8
Figure A7.4 MALDI TOF spectrum ofDex6G12
OO
OH
OH
O
O
OOH
C7H
11O
6
191.0556 Da
C15
H31
O2
243.2324 Da
242.2
O
OOH
OH
O
O
O
OH
C9H
17O
6
221.1025 Da
C11
H23
O2
187.1698 Da
C18
H35
O8
379.2332 Da
C7H
11O
6
191.0556 Da
~186
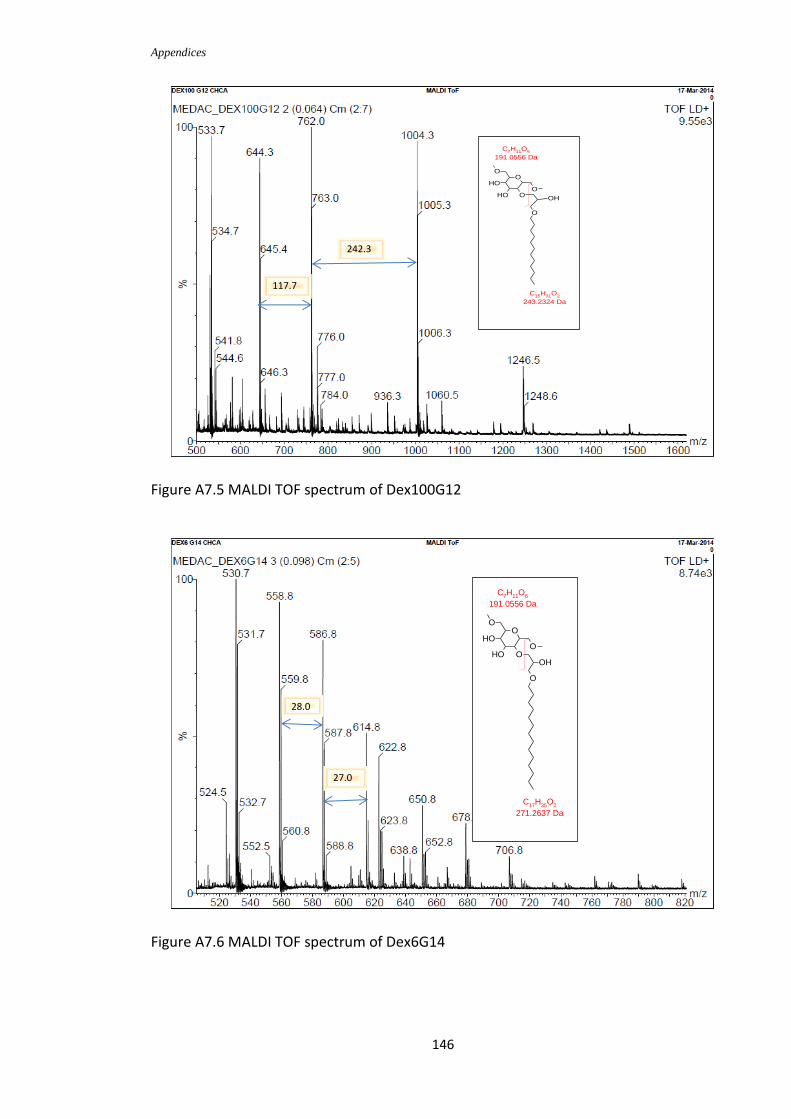
Appendices
146
Figure A7.5 MALDI TOF spectrum of Dex100G12
Figure A7.6 MALDI TOF spectrum of Dex6G14
O
OOH
OH
O
O
O
OH
C7H
11O
6
191.0556 Da
C17
H35
O2
271.2637 Da
28.0
27.0
O
OOH
OH
O
O
O
OH
C7H
11O
6
191.0556 Da
C15
H31
O2
243.2324 Da
242.3
117.7

Appendices
147
Figure A7.7 MALDI TOF spectrum of Dex100G14
Figure A7.8 MALDI TOF Spectrum of Dex6G16
O
OOH
OH
O
O
O
OH
C7H
11O
6
191.0556 Da
C19
H39
O2
299.295 Da 187.3
OO
OH
OH
O
O
OOH
C7H
11O
6
191.0556 Da
C17
H35
O2
271.2637 Da 56.0

Appendices
148
Figure A7.9 MALDI TOF spectrum of Dex100G16
OO
OH
OH
O
O
OOH
C7H
11O
6
191.0556 Da
C19
H39
O2
299.295 Da
127.3

Appendices
149
APPENDIX 8
MALDI TOF spectra of nanoparticles
Figure A8.1 MALDI TOF spectrum of PECADex100G4
Figure A8.2: MALDI TOF spectrum of PECADex6G8
O
O
OHOO
O
O
OH
O
O
N
C14
H25
O8
321.1549 Da
C6H
7NO
2
125.0477 Da
130.2
OO
OH
O O
O
O
OHO
O
N
C18
H33
O8
377.2175 Da
C6H
7NO
2
125.0477 Da
125.1
??

Appendices
150
Figure A8.3: MALDI TOF spectrum of PECADex100G8
Figure A8.4: MALDI TOF spectrum of PECADex100G12
O
O
OHO
OO
O
OH
O
ON
C18
H33
O8
377.2175 Da
C6H
7NO
2
125.0477 Da
125.1
OO
OHO O
O
O
OH
O
O N
C22
H41
O8
433.2801 Da
C6H
7NO
2
125.0477 Da
125.1
125.1

Appendices
151
Figure A8.5: MALDI TOF spectrum of PECADex6G16
Figure A8.6: MALDI TOF spectrum of PECADex100G16
O
OOH
O
O
O
O
OH
O
O
N
C28
H55
O8
519.3897 Da
C6H
7NO
2
125.0477 Da
125.1
O
O
OHO
O
O
O
OH
O
O N
C28
H55
O8
519.3897 Da
C6H
8NO
2
126.0555 Da
C31
H58
NO8
572.4162 Da
C3H
5O
2
73.029 Da

Appendices
152
APPENDIX 9
Confocal microscopy image of PECA-Dex100G8 tagged with MIA in PBS
125.1
125.1

Appendices
153
APPENDIX 10
SEM image of PECA-Dex100G8 EGFP nanoparticles

Appendices
154
APPENDIX 11
Equations used to calculate the polymer mass composition from the results of elemental analysis
100*).....*()...()*...(
)]..*)4...(*[)..*...()...**..(%
ChainGlycerolAlkylofmassmolarDSdDexofmassmolarXPECAofmassmolar
massatomicHratiomgHDSdMassatomicHratiomDexHratiomPECAHXmassatomicHH
100*).....*()...()*...(
)]..*)2...(*[)..*...()...**..(%
ChainGlycerolAlkylofmassmolarDSdDexofmassmolarXPECAofmassmolar
massatomicCratiomgCDSdMassatomicCratiomDexCratiomPECACXmassatomicCC
100*).....*()...()*...(
)...**..(%
ChainGlycerolAlkylofmassmolarDSdDexofmassmolarXPECAofmassmolar
ratiomPECANXmassatomicNN
100*).....*()...()*...(
)*...(%
ChainGlycerolAlkylofmassmolarDSdDexofmassmolarXPECAofmassmolar
XPECAofmassmPECA

Appendices
155
APPENDIX 12
Calibration curves used for the determination of Curcumin
y = 159.56x + 0.019 R² = 0.9964
0
0.5
1
1.5
2
2.5
3
0 0.002 0.004 0.006 0.008 0.01 0.012 0.014 0.016 0.018
Ab
sorb
ance
@ 4
35
.54
nm
Concentration µg/µl
Calibration curve of Curcumin in DMSO
y = 97.601x + 6.5747 R² = 0.9997
0
10
20
30
40
50
60
0 0.1 0.2 0.3 0.4 0.5 0.6
Flu
ore
sce
nce
inte
nsi
ty
µg/mL
Curcumin calibration curve in PBS (0.1% Polysorbate 80)

Appendices
156
APPENDIX 13
SEM images of native dextran and Dex100G4
native dextran
Dex100G4

Appendices
157
APPENDIX 14
Calibration curves for Doxorubicin
y = 34296x + 10.862 R² = 0.9995
0
10
20
30
40
50
60
0 0.0002 0.0004 0.0006 0.0008 0.001 0.0012 0.0014
Flu
ore
sce
nce
inte
nsi
ty
concentration mg/mL
Calibration curve of Doxorubicin in DMSO
y = 9020.8x + 0.2966 R² = 0.9947
0
1
2
3
4
5
6
7
0 0.0001 0.0002 0.0003 0.0004 0.0005 0.0006 0.0007
Flu
ore
sce
nce
inte
nsi
ty
Concentration mg/mL
Calibration curve of doxorubicin in PBS

Appendices
158
APPENDIX 15
Calibration curve for BSA

Appendices
159
APPENDIX 16
Calibration curve for Evans blue
Calibration curve of Evans blue
y = 0.0254x + 0.0088 R² = 0.9999
0
0.2
0.4
0.6
0.8
1
1.2
1.4
1.6
1.8
2
0 10 20 30 40 50 60 70 80
Ab
sorb
ance
Concentration µg/mL
Calibration curve of Evans blue in water