functional acuity contrast test f.a.c.t. appendix · functional vision than does standard snellen...
TRANSCRIPT
FUNCTIONAL ACUITY
CONTRAST TEST
F.A.C.T.®
APPENDIX
Stereo Optical Company, Inc.
8600 W. Catalpa Avenue, Suite 703Chicago, IL 60656 - USAPhone: 1.800.344.9500Email: [email protected] Website: www.StereoOptical.com
P/N 56181
™

TABLE OF CONTENTS
SUBJECT PAGE Introduction 1
Product Description 2
Normative Values 2
Applications 3
Contact Lenses 3
Refractive Disorders 3
Refractive Surgery 4
Cataract 4
Glaucoma 4
Macular Degeneration 4
Diabetic Retinopathy 4
Optic Neuropathies 4
Amblyopia 4
Pituitary Adenoma 5
Drugs 5
Toxic Chemicals 5
Functional Vision 5
Normal Variation and Seeing Everyday Objects 5
Motor Vehicle Operators 5
Aircraft Pilots 6
Advanced Topics 6
Examination Procedure 6
Method 1 6
Method 2 6
Contrast Sensitivity Value Table 9
References 10
FUNCTIONAL ACUITY
CONTRAST TEST
INSTRUCTIONS FOR USE
INTRODUCTION
The new Functional Acuity Contrast Test (F.A.C.T.®) is an improvement on the original Contrast Sensitivity Test developed by Arthur P. Ginsburg, Ph.D., in 1983. The F.A.C.T.® also developed by Arthur P. Ginsburg, Ph.D., a pioneer of contrast sensitivity technology, offers a more sensitive and comprehensive measure of functional vision than does standard Snellen acuity.
Normal Snellen acuity only tests the ability to identify progressively smaller, high contrast letters. Although this may be adequate for quantifying refractive errors, it often fails to detect early vision loss due to a wide variety of eye disease and visual pathway disorders such as cataracts, glaucoma, macular and retinal dysfunction, optic nerve disease, toxic chemicals, etc.
Real-world vision is not always high contrast black and white. Rather, it consists of objects havng a wide range of sizes viewed under a variety of visually degrading conditions, such as fog, nighttime, bright sun, etc. Many visual disorders will show more significant vision loss under these conditions.
The F.A.C.T. more effectively evaluates your patient’s vision over a range of size and contrast, which closely simulates their normal environment.
1
PRODUCT DESCRIPTION
Specification of the test slides are as follows:
1. The progression of the high quality sine-wave grating sizechanges in steps equal to one octave (i.e., a factor of two)between rows A, B, C and D and half octave between rows Dand E. The corresponding spatial frequencies are 1.5, 3, 6, 12and 18 (cpd).
2. The contrast step between each grating patch is 0.15 log units.This means that there is a 50% loss or a 100% gain in contrastfor any two contrast step increase or decrease, respectively.The contrast range exceeds the normal population range ofcontrast sensitivity.14
3. The gratings are tapered into an average graybackground to eliminate ghost images (aliasing) and keepthe mean retinal illumination constant.1
4. The grating patch size, 1.7 degrees, exceeds the size of themacula (1 to 1.5 degrees).
5. The gratings are tilted +15˚, 0˚ and -15˚ to keep them withinthe orientation bandwidth of visual channels.
Normative Values
On average, a healthy visual system is expected to have contrast sensitivity within the normal range shown by the dotted region on the recording form. This should be considered an average performance level. Normative limits, which include 90% of the normal population, can be used to help minimize the potential for false positives.
This normative range is useful for comparing the shape of a contrast sensitivity curve outside the normative limit.
If the curve is below the normal range for either eye at one or more rows, then the patient should be suspect.15,16
2
APPLICATIONS
F.A.C.T. is designed to help identify vision loss from a variety of disorders, many of which are not detected by high or low contrast Snellen Acuity tests.
Many conditions hinder the ability to recognize low contrast objects,
while having limited impact on the ability to identify high contrast
items. Visual pathway dysfunction can cause visual loss that is quite
different from the visual loss caused by refractive error. Visual
pathway dysfunction can reduce the ability to see large objects while
sparing the ability to see small objects.4,5 The visual pathway contains
several kinds of contrast sensitive neurons, some responding only to
objects of larger size, some to intermediate size and some only to
smaller sized objects.
Contrast sensitivity tests address this weakness of Snellen high
contrast acuity by varying two parameters: grating size and contrast
level. Unlike letters, the visibility of gratings can generalize to the
visibility of other objects including letters. The following gives more
specific information on its use in many of these conditions.
Contact Lenses
Contrast Sensitivity is useful for helping to ensure proper contact
lens fit as well as determining when replacement is necessary. For
example, uncorrected residual astigmatism from a soft contact lens
can result in decreased contrast sensitivity generally at the higher
spatial frequencies when compared to hard lenses. Significant
contact lens deposits can result in decreased contrast sensitivity at
the middle and higher spatial frequencies when compared to
contrast sensitivity obtained when the contact lenses are new.11,16
Refractive Disorders
Generally, refractive disorders manifest themselves as a decline in contrast sensitivity first at the smaller grating sizes or higher spatial frequencies for mild refractive disorders. As the degree of refractive disorder increases, contrast sensitivity declines at the middle and then larger grating sizes (middle to lower spatial frequencies).
3
Refractive Surgery
Refractive surgery can generally result in contrast sensitivity curves similar to refractive error if surgery results in undercorrection.17,18
Cataracts
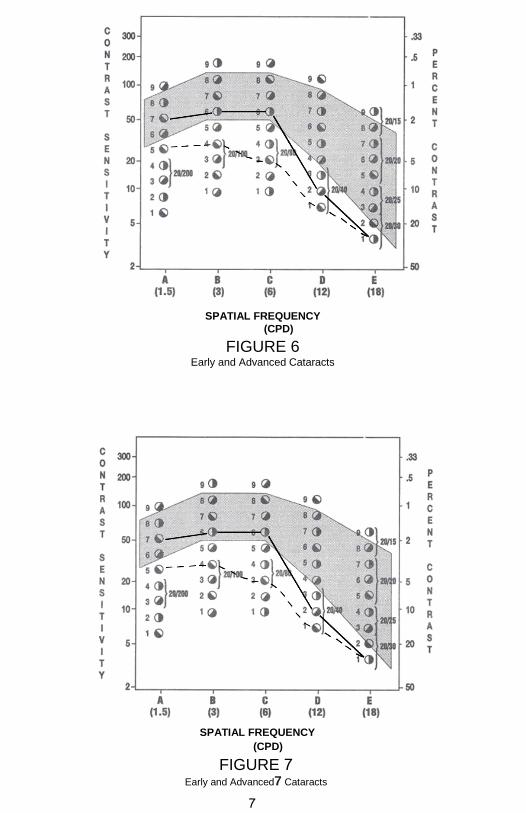
Early cataracts generally cause contrast sensitivity losses similar to refractive disorders at higher spatial frequencies, rows D and E. Later cataract can reduce contrast sensitivity evenly or unevenly over the lower and middle as well as the higher spatial frequencies (fig. 6).19,20
The addition of a glare source will exacerbate the results for patients
with cataracts, producing a lower contrast sensitivity at some or all
grating sizes.21, 22
Glaucoma
Although glaucoma can reduce contrast sensitivity for all grating sizes, a number of studies have shown reduced contrast sensitivity mostly at the middle spatial frequencies, especially for row C (fig. 7).23-25
Macular Degeneration
Macular degeneration patients as a group appear to exhibit greater contrast sensitivity loss for all grating sizes with increased degeneration.26
Diabetic Retinopathy
In diabetic patients, contrast sensitivity loss may occur for all grating sizes.27
Optic Neuropathies
A variety of optic neuropathies including afferent pupillary defect, optic neuritis, multiple sclerosis, etc. will effect contrast sensitivity losses over some or all grating sizes. Multiple sclerosis can sometimes effect only the middle sizes.28
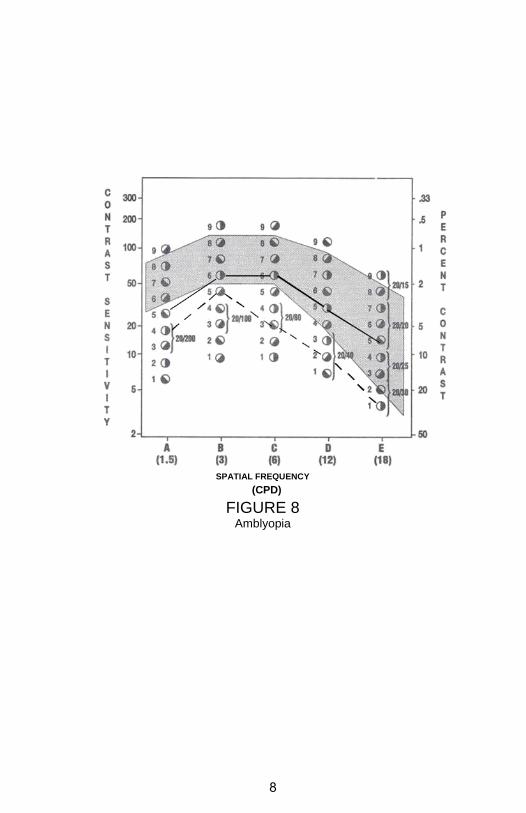
Amblyopia
Vision loss due to amblyopia can be identified when tests from the amblyopic eye are compared to its fellow eye (as described in the Recording and Evaluation of Test Results section of
4
this manual). Typically, the amblyopic eye has lower contrast sensitivity for all grating sizes than the fellow eye. This has been shown with both anisometropic and strabismic amblyopia, however anisometropic amblyopes appear to have greater losses (fig. 8).29,30
Pituitary Adenoma
Pituitary adenoma has been shown to cause contrast sensitivity loss at the middle grating sizes, row C.31
Drugs
Certain drugs such as alcohol and Ibuprofen can cause losses in contrast sensitivity.32,33
Toxic Chemicals
Exposure to organic solvents of micro electronic workers has been shown to reduce contrast sensitivity for the middle size gratings.34
FUNCTIONAL VISION
Normal Variation and Seeing Everyday Objects
Individuals with normal contrast sensitivity, that is without any detectable vision problem or eye disease, can have significant differences in grating contrast sensitivity within the normal range over different grating sizes that can effect their visual capability. Differences in seeing letters, aircraft silhouettes, faces and head-up displays have been related to grating contrast sensitivity.8,35
Motor Vehicle Operators
Older drivers, having reduced normal grating contrast sensitivity as compared to younger drivers, have been shown to require to be 24% closer than younger drivers to correctly discriminate road signs even though both groups had better than 20/20 Snellen acuity.36
Older drivers have been shown to have significantly higher crash rates correlated to lower grating contrast sensitivity.7,9
5
Aircraft Pilots
Pilots have been shown to have significantly longer detection ranges
for detecting targets in a flight simulator and field trials that related to individual differences in grating contrast sensitivity.6,8
The Canadian Air Force used individual grating contrast sensitivity for pilot selection.37
ADVANCED TOPICS
Examination Procedure
Methods 1 and 2 below are similar and are used primarily in research. Researchers generally tend to use repeated measures to minimize possible effects of test errors (increase test reliability) and allow statistical analysis. The clinician may want to adopt one of these methods.
Method 1
1. The patient is shown the test rows in a random sequence andtested three times. For example, row sequence C, A, E, D, B, E,C, A, B, D, A, C, E, D, B. Each response is recorded.
2. A final contrast sensitivity score is determined by the lowestcontrast patch having at least two of three correct responses.
3. Record the responses on the recording forms.
Method 2
1. The rows are tested in a random sequence two or more times.Each correct response is recorded.
2. Convert each correct patch number into contrast sensitivityfrom Table 1 and determine the mean score for each row.Standard deviations or other statistics may also bedetermined.
3. Record mean score for each row on the attached recordingform described in Method 1.
4. As with previous methods, scores for each row are connectedand compared to the normative curves.
6
SPATIAL FREQUENCY
(CPD)
FIGURE 6 Early and Advanced Cataracts
SPATIAL FREQUENCY
(CPD)
FIGURE 7Early and Advanced7 Cataracts
7
SPATIAL FREQUENCY
(CPD)
FIGURE 8 Amblyopia
8
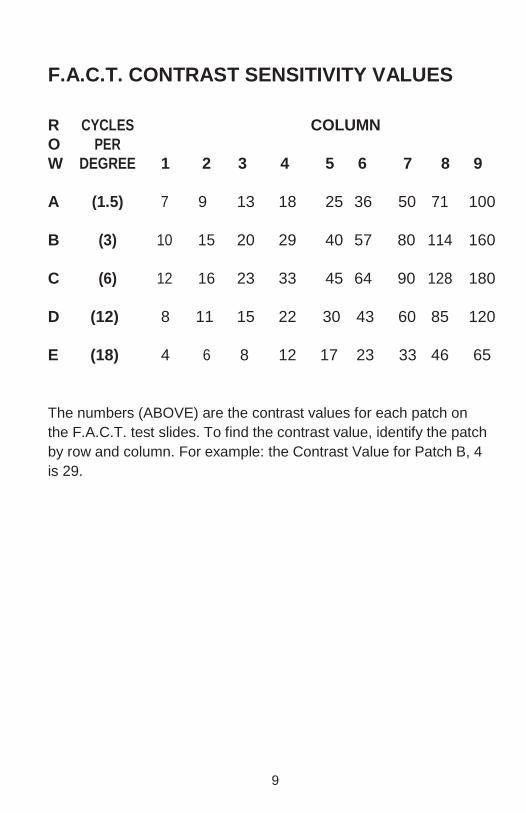
F.A.C.T. CONTRAST SENSITIVITY VALUES
R CYCLES COLUMN
O PER
W DEGREE 1 2 3 4 5 6 7 8 9
A (1.5) 7 9 13 18 25 36 50 71 100
B (3) 10 15 20 29 40 57 80 114 160
C (6) 12 16 23 33 45 64 90 128 180
D (12) 8 11 15 22 30 43 60 85 120
E (18) 4 6 8 12 17 23 33 46 65
The numbers (ABOVE) are the contrast values for each patch on
the F.A.C.T. test slides. To find the contrast value, identify the patch
by row and column. For example: the Contrast Value for Patch B, 4
is 29.
9
REFERENCES
1. Ginsburg, A.P. (December 28, 1982) “Spatial Frequency andContrast Test Chart.” U.S. Patent No. 4365873.
2. Ginsburg, A.P. (1984) “A New Contrast Sensitivity: Vision TestChart,” Am. J. Opt. Physiol. Opt., 61(6), 403.
3. Ginsburg, A.P. (1987) “Clinical Findings From a New ContrastSensitivity Test Chart,” Fiorentini, A., Guyton, D.L. and Siegel,I.M. eds., Advances in Diagnostic Visual Optics, BerlinHeidelberg: Springer-Verlag, 132.
4. Ginsburg, A.P. (1981) “Spatial Filtering and Vision:Implications for Normal and Abnormal Vision,” Proenza, L.,Enoch, J. and Jambolsky, A., eds., Clinical Applications ofVisual Psychophysics, New York:The Cambridge University Press, 70.
5. Nadler, M.P., Miller, D. and Nadler, D.J. (1990) “Glare andContrast Sensitivity For Clinicians,” NY: Springer-Verlag.
6. Ginsburg, A.P., Evans, D., Sekuler, R. and Harp, S.A. (1982)“Contrast Sensitivity Predicts Performance in AircraftSimulators,” Am. J. Opt. Physiol. Opt., 59(1), 105.
7. Evans, D. and Ginsburg, A.P. (1985) “Contrast SensitivityPredicts Age-related Differences in HIghway SignsDiscriminiability,” Human Factors, 27(12), 637.
8. Ginsburg, A.P. (1986) “Spatial Filtering and Visual FormPerception,” Boff, K., ed, In Handbook of Perception andHuman Performance, Vol. II., ed, New York: John Wiley &Sons.
9. Decina, L.E., Staplin, L., Spiegel, A. and Knoebel, K.V.(1991) “Contrast Sensitivity and Driver Vision Screening: AnAccident Analysis.” 35th Ann. Pro. Assoc. Adv. AutomotiveMedicine, October 7-9, Toronto, Canada.
10
10. Stager, P. and Hameluck, D. (June 1986) “ContrastSensitivity and Visual Detection In Search and Rescue.”Prepared for the Defense and Civil Institute of EnvironmentalMedicine, Toronto, Canada.
11. Kluka, D.A. and Love, P.A. “The Effects of Daily-WearContact Lenses Upon Contrast Sensitivity in SelectedProfessional and Collegiate Female Tennis PLayers,” UBA atBirmingham.
12. “Emergent Techniques for Assessment of VisualPerformance”(1985) Committee on Vision, Commission onBehavioral and Social Sciences and Education, NationalResearch Council, Washington, D.C: National AcademyPress.
13. “Recommended Standard Procedures for the ClinicalMeasurement and Specification of Visual Acuity” (1980)National Academy of Sciences-National Research Council.Report of Working Group 39. Advances in Ophthalmology, 41,103.
14. Ginsburg, A.P., Evans, D., Cannon, M. and Mulvanny, P.(1984) “Large Sample Norms for Contrast Sensitivity.” Am. J.Opt. Physiol. Opt., 61(2), 80.
15. Marmor, M.F. and Gawande, A. (1988) “Effect of VisualBlur on Contrast Sensitivity” Ophthalmology, 95, 139.
16. Ginsburg, A.P. (January 1987) “The Evaluation of ContactLenses and Refractive Surgery Using Contrast Sensitivity,”Contact Lenses: The CLAO Guide to Basic Science andClinical Science Update 2, Dabezies, O.H. (ed)
17. Ginsburg, A.P., Waring, G., Steinberg, E., Williams, P., Justin,N., Reinging Dietz, J., Roska-Duggan, V., Blauvelt, K. andBourn, L. (1990) “Contrast Sensitivity Under PhotopicConditions in the Prospective Evaluation of Radial Keratotomy(PERK) Study,” J. Refractive Corneal Surgery, 6(2), 82.
18. Krasnov, M.M, Avetisov, S.E., Makashove, N.V., Mamikonian,V.R. (1988) “The Effect of Radial Keratotomy on ContrastSensitivity” Am. J. Ophthalmology, 105, 651.
11
19. Hess, R. and Woo, G. (1978) “Vision Through Cataracts,”Invest. Ophthal. Vis. Sci., 17, 438.
20. Ginsburg, A.P. and Tedesco, J. (1986) “Evaluation ofFunctional Vision of Cataract and YAG PosteriorCapsulotomy Patients Using the Vistech Contrast SensitivityChart,” Invest. Ophthal. Vis. Sci., 27(3), (Suppl.), 107.
21. Sjostrand, J., Abrahamson, M. and Hard, A.L. (1987) “GlareDisability as a Cause of Deterioration of Vision in CataractPatients.” Acta Ophthalmol., 65, 103.
22. Ginsburg, A.P., Osher, R.P., Blauvelt, K. and Blosser, E.
(1987) “The Assessment of Contrast and Glare Sensitivity
in Patients Having Cataract,” Invest. Ophthal. Vis. Sci.,
28(3), (Suppl.), 397.
23. Ross, J.E., Bron, A.J., Reeves, D.L. and Emmerson, P.G.,(1985) “Detection of Optic Nerve Damage in OcularHypertension,” Br. J. Ophthal., 69, 897.
24. Blanchard, D.L. (1988) “Contrast Sensitivity: A UsefulTool in Glaucoma,” Glaucoma, 10, 151.
25. Faye, E., Ginsburg, A.P. and Sponsel, R. “Case Reports:Reversibility of Contrast Sensitivity Changes in Treated Open-Angle Glaucoma,” Submitted For Publication.
26. Loshin, D.S. and White, J. (1984) “Contrast Sensitivity: TheVisual Rehabilitation of the Patient with MacularDegeneration,” Arch. Ophthal., 102, 1303.
27. Trick, G.L., Burde, R.N., Gordon, M.O., Santiago, J.V. andKilo, C. (1988) “The Relationship Between Hue Discriminationand Contrast Sensitivity Deficits in Patients with DiabetesMellitus,” Ophthal., 95(5), 693.
28. Regan, D., Raymond, J., Ginsburg, A.P. and Murray, T. (1981)“Contrast Sensitivity, Visual Acuity and the Discrimination ofSnellen Letters in Multiple Sclerosis,” Brain, 104, 333.
12
29. Bosse, J.C. and Lederer, P.J. (1987) “Contrast SensitivityUsed for Detection of Shallow Amblyopia,” J. Opt. Vis.Development, Vol. XVIII, December, 10.
30. Lequire, L.E., Rogers, G.L. and Bremer, D.L. (1987)“Functional Amblyopia is a Single Continuum of VisualImpairment on Contrast Sensitivity Functions,” Binoc. Vis.,2(4), 199.
31. Kurzer, A.R. (1986) “Contrast Sensitivity Signals PituitaryAdenoma,” Rev. of Opt., 123(4), 119.
32. Ginsburg, A.P., Evans, D., McNinch, L., Blauvelt, K. andSiegel, H. (1985) “The Effect of Alcohol on ContrastSensitivity,” Presented at the Annual Meeting of the HumanFactors Society.
33. Ridder, W.H. and Tomlinson, A. (1992) “Effect ofIbuprofen on Contrast Sensitivity,” Opt. and Vis. Sci.,69(8), 652.
34. Frenette, B., Mergler, D. and Bowler, R. (1991) “ContrastSensitivity Loss in a Group of Former MicroelectronicsWorkers with Normal Visual Acuity,” Opt. and Sci., 68(7),556.
35. Oswley, C. and Sloane, M.E. (1987) “Contrast Sensitivity
Acuity, and the Perception of”Real-World” Targets” Brit. J.
Ophth., 71, 791.
36. Shinar, D. and Gilead, E., “Contrast Sensitivity as aPredictor of Complex Target Detection,” Presented atHuman Factors Society meeting, Oct. 22, 1987, New York.
13

NOTES

NOTES


©2018 Stereo Optical Co., Inc. All rights reserved. Unless indicated otherwise, all trademarks are the property of Stereo Optical Co., Inc. in the United States and other countries.
Rev
. 03
/12/
201
8