full-scale burning tests for retail shop …...international journal on engineering...
TRANSCRIPT
International Journal on Engineering Performance-Based Fire Codes, Volume 6, Number 3, p.94-121, 2004
94
FULL-SCALE BURNING TESTS FOR RETAIL SHOP FIRES: PRELIMINARY STUDIES W.K. Chow and Candy M.Y. Ng Department of Building Services Engineering, The Hong Kong Polytechnic University, Hong Kong, China G.W. Zou, H. Dong and Y. Gao Department of Building Engineering, Harbin Engineering University, Harbin, Heilongjiang, China (Received 20 January 2004; Accepted 30 October 2004) ABSTRACT High combustible contents are stored in small retail shops including those located in crowded shopping malls. As the number of non-accidental fires appeared to be increasing, the general public is now quite concerned about the hidden fire hazard. For assessing the consequences of a fire, the possible heat release rates should be studied experimentally. Not only that, conducting full-scale burning tests for local retail shops under flashover conditions is necessary and had been carried out recently. In this paper, the resultant heat release rates by burning those combustibles in a shop fire before and after flashover will be studied. Experimental data on heat release rate, oxygen concentration, temperature and radiative heat flux are presented. Whether the heat release rate can be reduced by discharging water mists will also be investigated. 1. INTRODUCTION Because of the high land price, many retail shops in Hong Kong are small and packed with combustibles [e.g. 1,2], such as shops selling personal computers, video compact disks (VCD), toys and cartoons in shopping malls. The total amount of combustibles stored in a shop can be quantified by the fire load density FLD (in MJm-2), i.e. the total heat generated for burning all items per floor area. The upper limit of FLD under local codes [3] is 1135 MJm-2. Fire safety in these small retail shops should be considered carefully, especially for those in terminals and public transport interchanges where the passenger loading is extremely high during rush hours [4]. For hazard assessment, the heat release rate (HRR) (in MW) has to be known [e.g. 5,6] and this quantity is very different from FLD which would give the maximum amount of heat released (in J) upon burning up all the combustibles. But this would happen only when there is adequate ventilation and high enough temperature. The ‘design fire scenario’ [7] is one of the primary uncertainties in fire safety engineering. A design fire depends on the use of the building and the materials used and stored, therefore it cannot be decided without understanding the combustibles present. The HRR [e.g. 5,6] has to be known and results can be used as input parameters for fire models in studying fire environment. Values used for different local application [e.g. 1] were up to 7
MW for terminal halls; 5 MW for shopping malls; and up to 7 MW for atriums. It is difficult to decide the value as there is no database for local combustibles. It appears that the number of fires not due to accident is increasing in the past few years as observed in karaokes in Hong Kong [8], discos in USA [9], World Trade Centre in USA [10], underground railway fire in Korea [11] and the recent underground train fire in Hong Kong [12]. Whether the fire safety provisions are for protection against accidental fire, arson fire, terrorist attack fire or mass fire due to big disasters such as earthquakes or explosion of big gas tanks have to be clarified [10]. Anyway, rigs similar to an ‘industry calorimeter’ in Sweden [e.g. 13] should be developed to burn an actual retail shop for studying how much heat would be released. This is expensive but necessary, and the concept is pointed out with preliminary tests reported in this paper. There were some data on total HRR for burning combustibles in retail shops, libraries and stores. For example, design fires deduced from large-scale fire tests in a sprinklered calorimeter were reported [5]. But these tests were started from a small fire such as an ‘igniter’ due to a short-circuited electrical appliance, a litter bin, or a gas burner as used in some standard fire tests. There is no radiation heat flux applied to test the samples as in a cone calorimeter. Results are useful for understanding how a fire grows, develops to flashover and then spreads to adjacent areas. But
International Journal on Engineering Performance-Based Fire Codes
95
this will not give the contribution of materials, nor their assemblies, to a fire under flashover condition. The HRR measured would not be too high as only a small amount of the combustibles were ignited. And for most cases, fire suppression systems might be operated to reduce the resultant HRR. The tests then become a demonstration on how the system would act at the tested fire, but not for understanding the actual HRR and the possibility of igniting the combustibles under flashover condition. The situation should be reviewed as more fires other than due to accidents were reported. Effect of high thermal radiation heat flux (such as 20 kWm-2 for flashover) on combustibles in a shop should be included in studying the possible HRR. Missing this point might be quite serious for retail shops. Combustible items stored there such as plastic dolls, especially those without quality control through standard fire tests, might be ignited easily by the incident heat flux if there is an accidental fire. Note that flashover would occur easily in such small retail shops as raised before [2]. Upon ignition of those combustibles, much larger quantity of heat and smoke would be liberated and spread to the hall space outside the shop. What will happen if the big hall is overcrowded? Better understanding on the probable HRR under flashover is strongly recommended [14]. Preliminary burning tests of several fire scenarios in small retail shops under flashover condition were performed in a new full-scale burning facility, the Chinese Assembly Calorimeter [15]. That facility was just developed as a collaboration project between the Harbin Engineering University (HEU). Results on HRR in flashover shop fires will be reported in this paper. 2. COMBUSTIBLES IN A SMALL
RETAIL SHOP As reviewed before for local small retail areas [1,2], combustibles include plastic toys in blister packs stored in vertical stacks; paper boxes and hanging arms; soft toys, pillows on wire display baskets; video cassettes and CD displays; sweets and candies with plastic bags; and sports wares, jackets on plastic hangers with plastic bags for keeping out the dust. But for those small retail shops located in terminal halls or public transport interchanges, only selected combustibles are allowed to store. Examples are newspapers and magazines; cigarettes and tobacco; alcohols up to 75 l; shoes, not selling, but repairing and polishing; clothes; furniture including polyurethane foam sofas or cushions; coffee tables with wood or other timber products and chairs.
Flame spreading of building materials used would be controlled. Fibreglass composites and flammable aerosols are usually not allowed. The likelihood of flashover in the shop had been pointed out with points of concern identified: Consequences of flashover [e.g. 16] in a shop
should be watched. The HRR of combustibles stored in the shop are key factors [17]. Storing products of HRR higher than the value giving flashover under a certain ventilation condition should be watched carefully.
Effectiveness of operating sprinkler system in controlling a fire should be watched and water mist system [e.g. 18] might be used if necessary.
Fire safety management schemes [e.g. 19] including training of the storekeepers and the building management staff are to be worked out carefully. For example, keeping a fire to be smaller than the design fires for sizing the sprinkler and smoke extraction systems should be ensured.
All points should be analyzed carefully to provide total fire safety. Performing full-scale burning tests on some selected shops is necessary to observe key fire issues. Performance of fire safety provisions such as water mist fire suppression system on those shops in big halls [14,20] can also be demonstrated. Consequences of flashover fires for some dangerous arrangements of concern must be studied. It is difficult to work out fire safety regulations and recommend good fire safety management without in-depth studies on fire dynamics. 3. PRELIMINARY FULL-SCALE
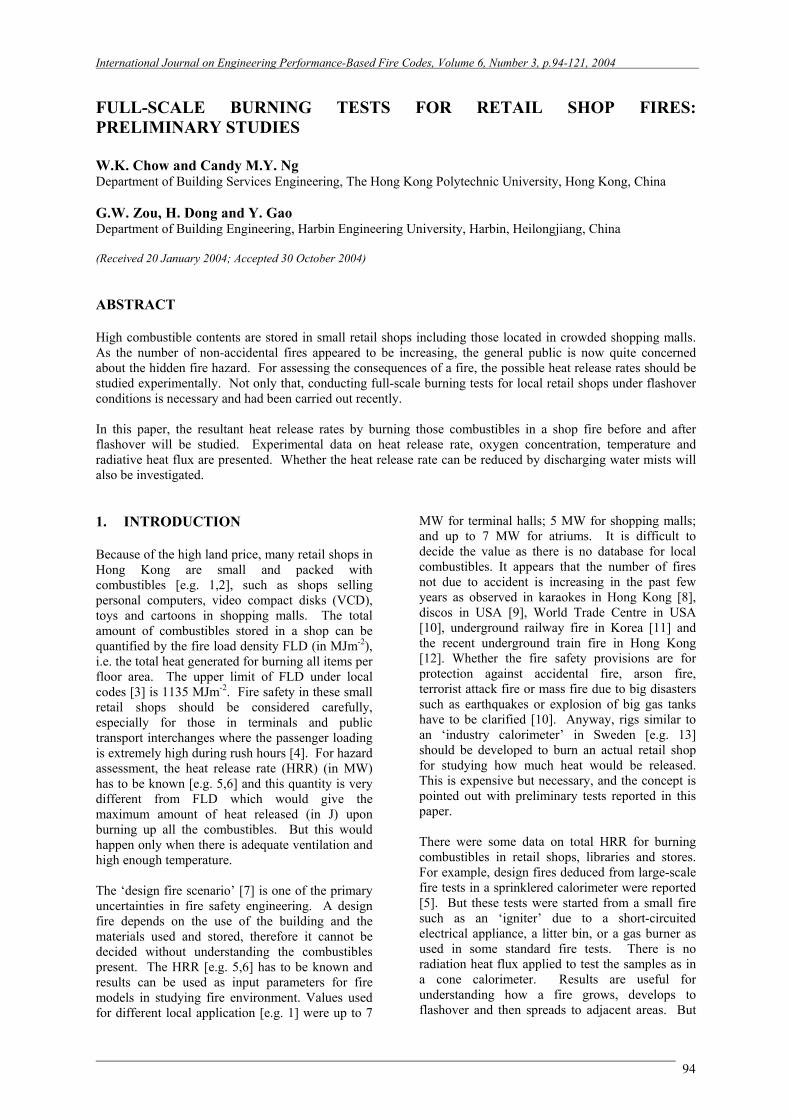
BURNING TESTS A set of preliminary full-scale burning tests were carried out to study the HRR resulted from burning combustible items in small retail shops. These were measured in the Chinese Assembly Calorimeter [14,15] located in Lanxi, a remote area in Harbin, Heilongjiang, China as shown in the first paper of this issue. An exhaust hood with a fan-duct system was developed for measuring HRR using the oxygen consumption method [e.g. 5]. The tests were carried out in a room of length 3.6 m, width 2.4 m and height 2.4 m with a door of height 2 m and width 0.8 m as shown in Fig. 1. Six fire scenarios labelled as B1 to B6 were tested for assessing boutiques. Goods with an iron clothes hanger with short sleeves T-shirts made of 100% cotton were taken as combustibles. Three fire
International Journal on Engineering Performance-Based Fire Codes
96
scenarios C1 to C3 were tested for retailing shops selling CDs. Those scenarios displaying CDs are arranged in the test room and under pre-flashover and post-flashover condition. Flashover was set off by burning sufficient amount of gasoline. That is similar to testing materials by a cone calorimeter [e.g. 5] where the samples are exposed under a radiative heat flux of values varying about 20 kWm-2, while in pre-flashover condition, fire would only be started manually by an igniter. 4. TESTS FOR BOUTIQUE SELLING
CLOTHES • Test B1: The clothes were ignited by an igniter
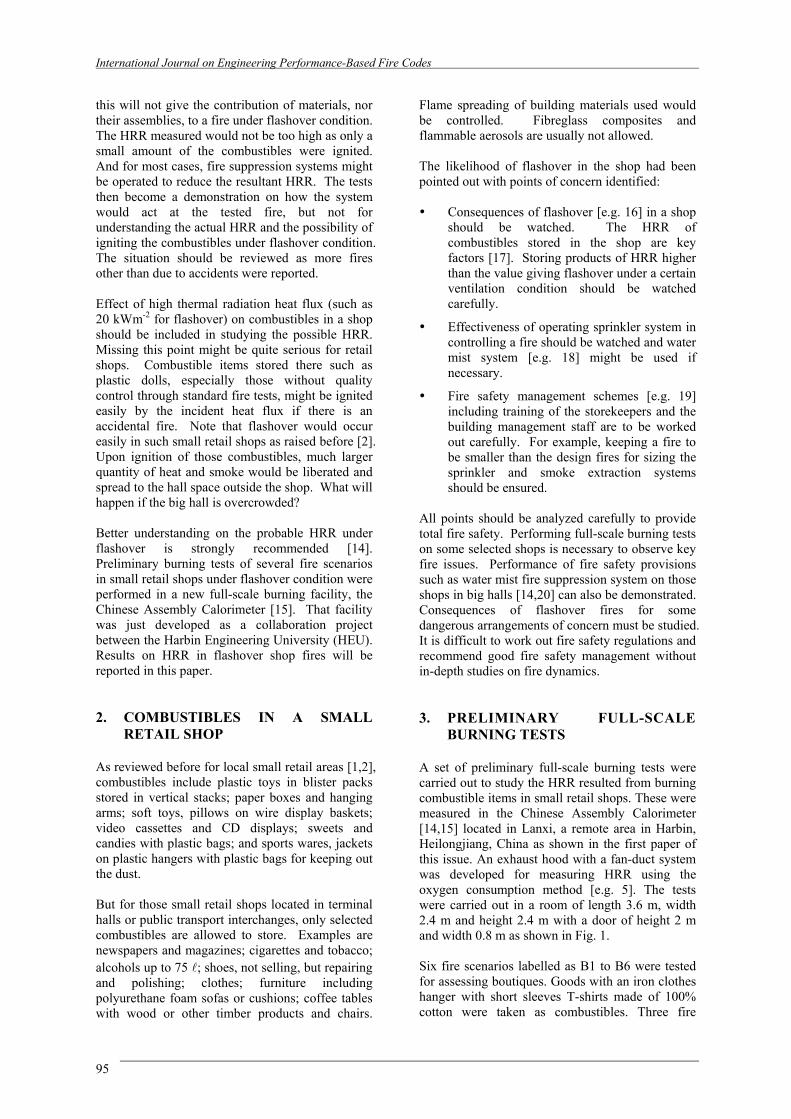
The diagram of an iron clothes hanger of length 2.1 m, width 0.7 m and height 1.2 m is shown in Fig. 2. The hanger was put at the centre of the room. There are four iron racks on the clothes hanger. Twenty-four T-shirts were hung
vertically on each iron rack and therefore 96 T-shirts would be hung on the iron hanger. The T-shirts were of the same size and each T-shirt was covered by a transparent plastic bag.
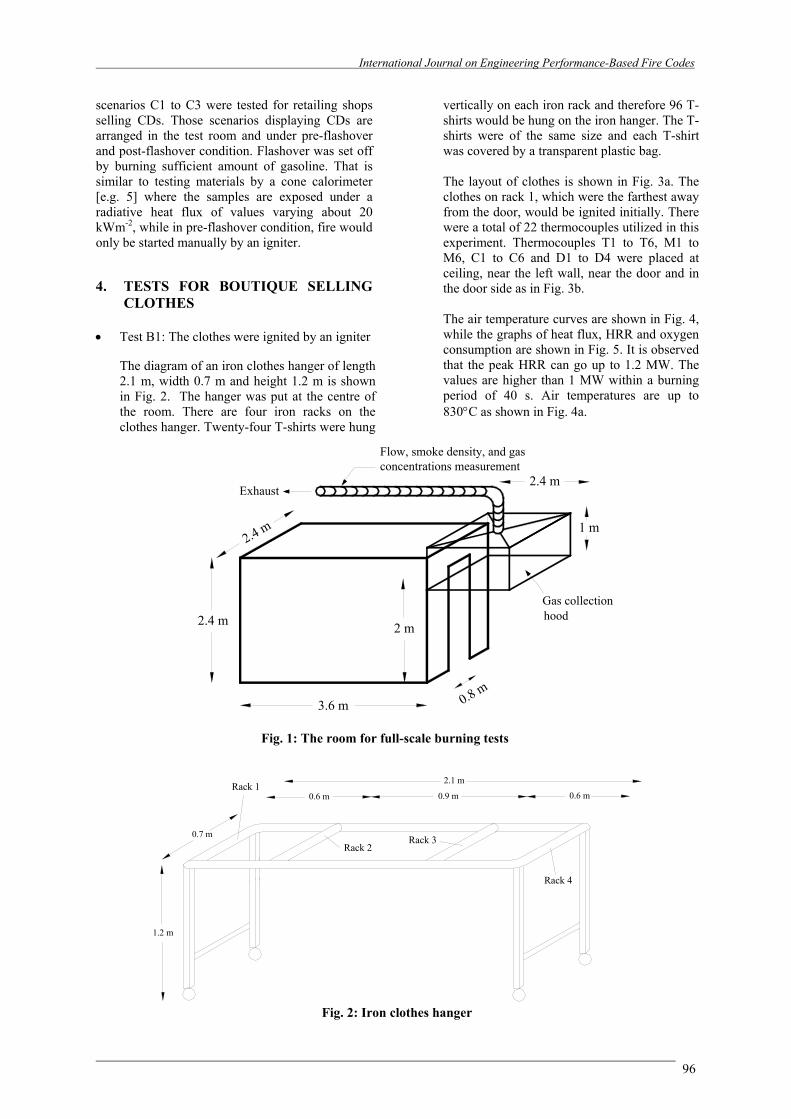
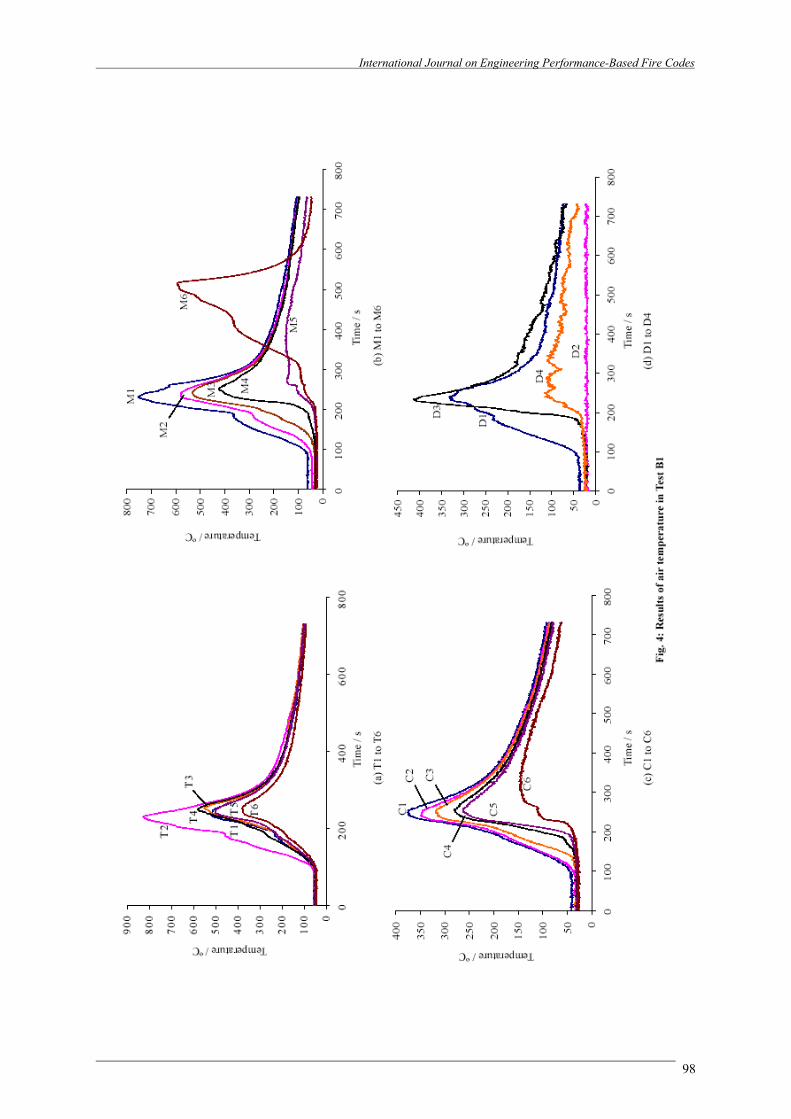
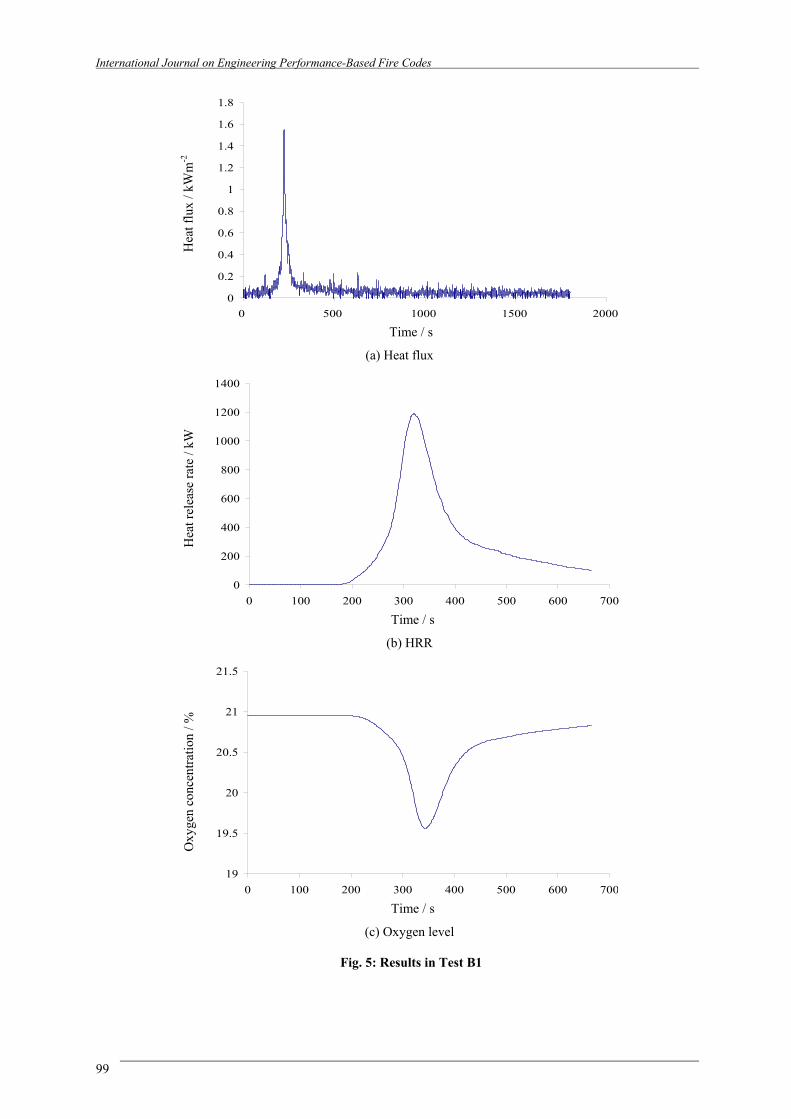
The layout of clothes is shown in Fig. 3a. The clothes on rack 1, which were the farthest away from the door, would be ignited initially. There were a total of 22 thermocouples utilized in this experiment. Thermocouples T1 to T6, M1 to M6, C1 to C6 and D1 to D4 were placed at ceiling, near the left wall, near the door and in the door side as in Fig. 3b. The air temperature curves are shown in Fig. 4, while the graphs of heat flux, HRR and oxygen consumption are shown in Fig. 5. It is observed that the peak HRR can go up to 1.2 MW. The values are higher than 1 MW within a burning period of 40 s. Air temperatures are up to 830°C as shown in Fig. 4a.
Fig. 1: The room for full-scale burning tests
0.7 m
1.2 m
2.1 mRack 1
0.6 m 0.9 m 0.6 m
Rack 2Rack 3
Rack 4
Fig. 2: Iron clothes hanger
Exhaust
Flow, smoke density, and gasconcentrations measurement
Gas collectionhood
3.6 m
2.4 m
2.4 m
2 m
0.8 m
2.4 m
1 m
International Journal on Engineering Performance-Based Fire Codes
97
(a) Clothes arrangement
Heat Flux
T6
M50.4 m
M6
0.25 m
0.25 m
T1
0.6 m
0.3 m
0.4 m
0.4 m
M4
0.4 mM3
M2
T2
T5
0.1 mM1
T3
T4
0.9 m
C6
C5
1.27
m 1.42
m
0.03 m
0.3 m
0.27 m
0.3 m
D2
C3
C4
C2
D3
D4
C1D1
0.97
m
C6
C5
C3
C4
C2
C1
1.57
m1.
72 m 2.
1 m
0.4 m
0.8 m
0.3 m
0.3 m
Heat Flux
Thermocouple
0.3 m
(b) Thermocouple trees
Fig. 3: Layout of Tests B1 to B4
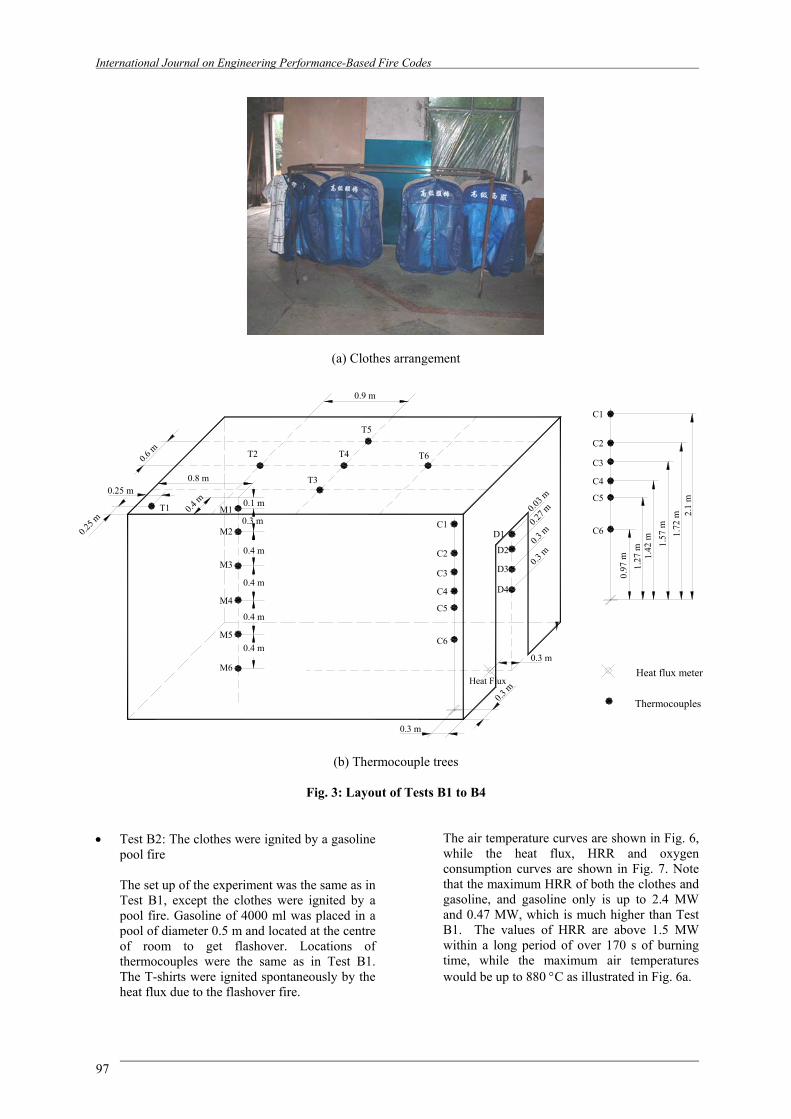
• Test B2: The clothes were ignited by a gasoline
pool fire The set up of the experiment was the same as in Test B1, except the clothes were ignited by a pool fire. Gasoline of 4000 ml was placed in a pool of diameter 0.5 m and located at the centre of room to get flashover. Locations of thermocouples were the same as in Test B1. The T-shirts were ignited spontaneously by the heat flux due to the flashover fire.
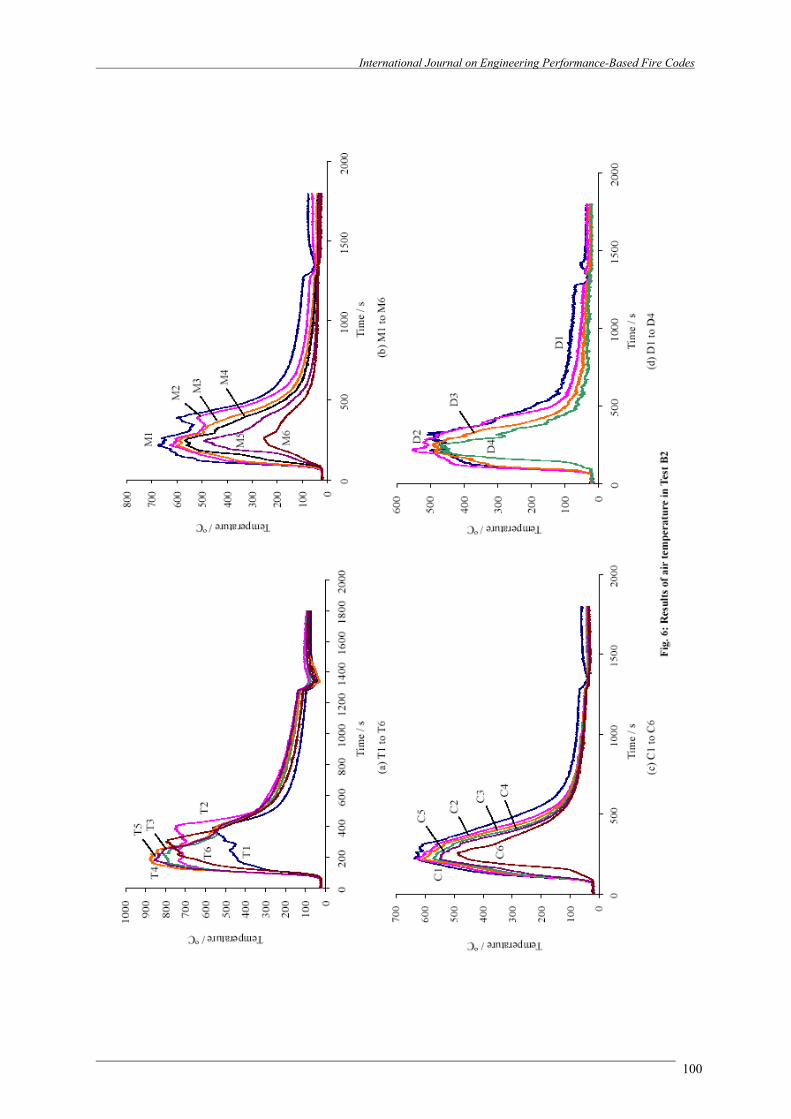
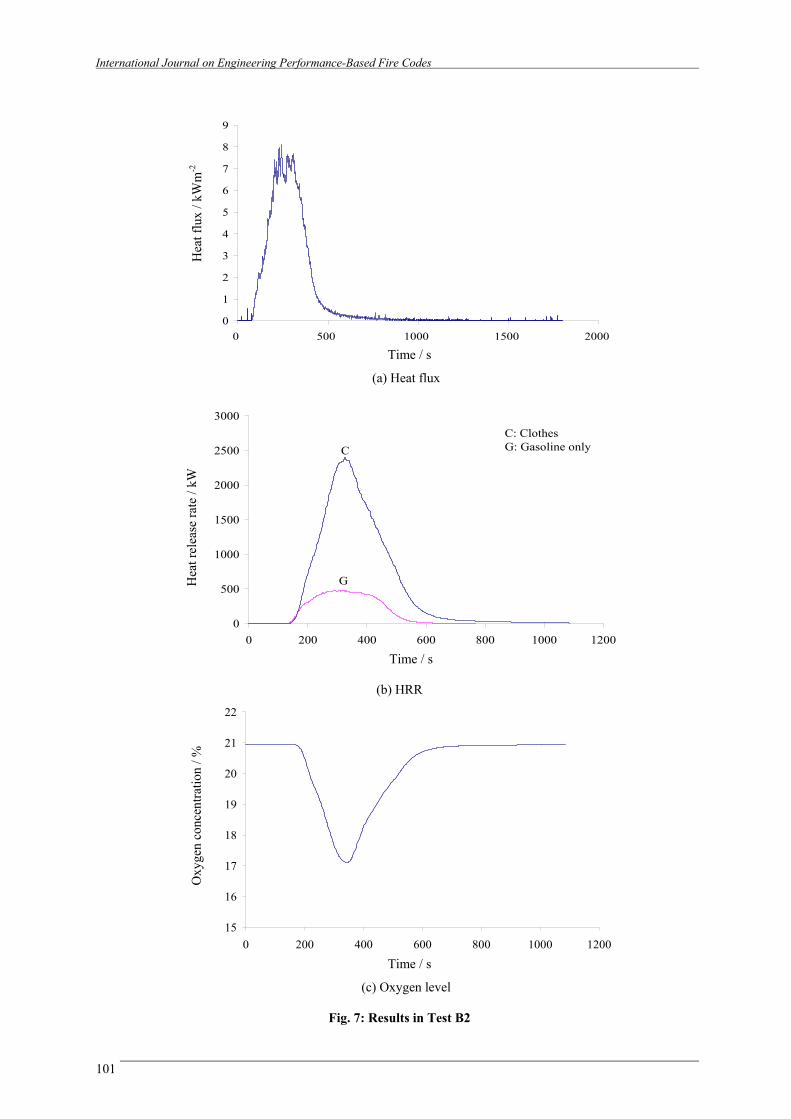
The air temperature curves are shown in Fig. 6, while the heat flux, HRR and oxygen consumption curves are shown in Fig. 7. Note that the maximum HRR of both the clothes and gasoline, and gasoline only is up to 2.4 MW and 0.47 MW, which is much higher than Test B1. The values of HRR are above 1.5 MW within a long period of over 170 s of burning time, while the maximum air temperatures would be up to 880 °C as illustrated in Fig. 6a.
Thermocouples
Heat flux meter
International Journal on Engineering Performance-Based Fire Codes
98
International Journal on Engineering Performance-Based Fire Codes
99
0
0.2
0.4
0.6
0.8
1
1.2
1.4
1.6
1.8
0 500 1000 1500 2000 Time / s
(a) Heat flux
0
200
400
600
800
1000
1200
1400
0 100 200 300 400 500 600 700 Time / s
(b) HRR
19
19.5
20
20.5
21
21.5
0 100 200 300 400 500 600 700 Time / s
(c) Oxygen level
Fig. 5: Results in Test B1
Oxy
gen
conc
entra
tion
/ %
H
eat r
elea
se ra
te /
kW
Hea
t flu
x / k
Wm
-2
International Journal on Engineering Performance-Based Fire Codes
100
International Journal on Engineering Performance-Based Fire Codes
101
0
1
2
3
4
5
6
7
8
9
0 500 1000 1500 2000 Time / s
(a) Heat flux
0
500
1000
1500
2000
2500
3000
0 200 400 600 800 1000 1200
G
CC: ClothesG: Gasoline only
Time / s
(b) HRR
15
16
17
18
19
20
21
22
0 200 400 600 800 1000 1200 Time / s
(c) Oxygen level
Fig. 7: Results in Test B2
O
xyge
n co
ncen
tratio
n / %
H
eat r
elea
se ra
te /
kW
H
eat f
lux
/ kW
m-2
International Journal on Engineering Performance-Based Fire Codes
102
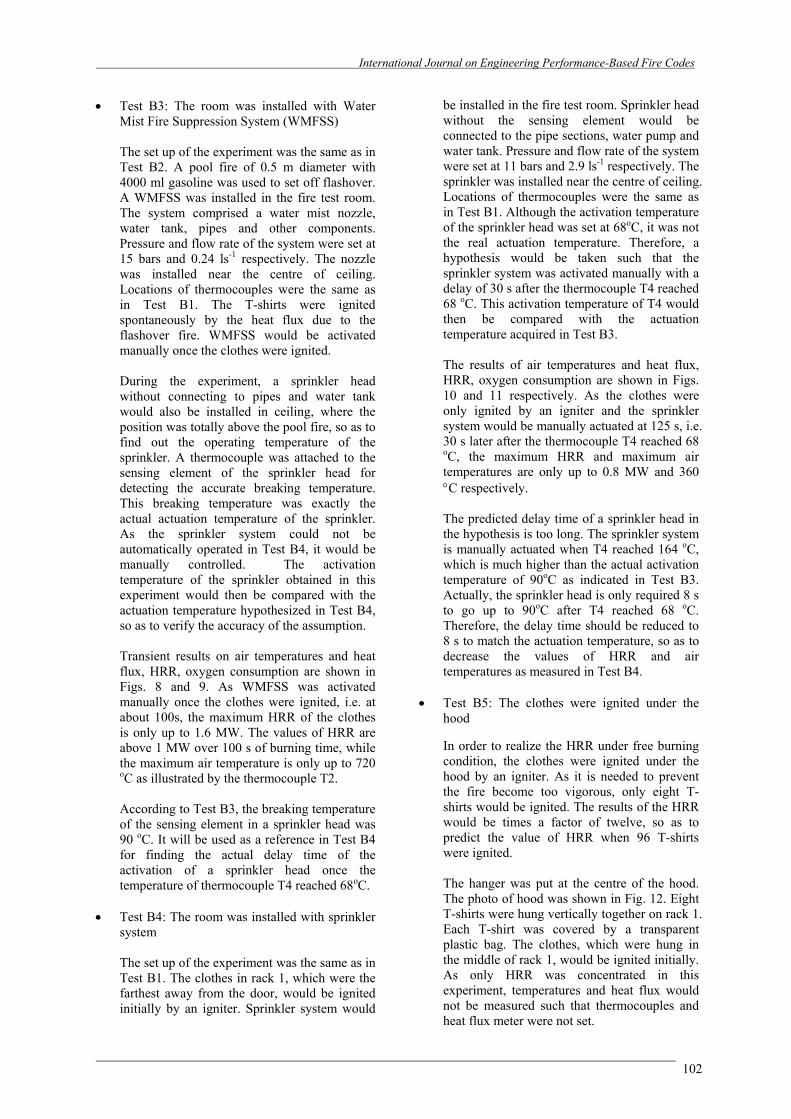
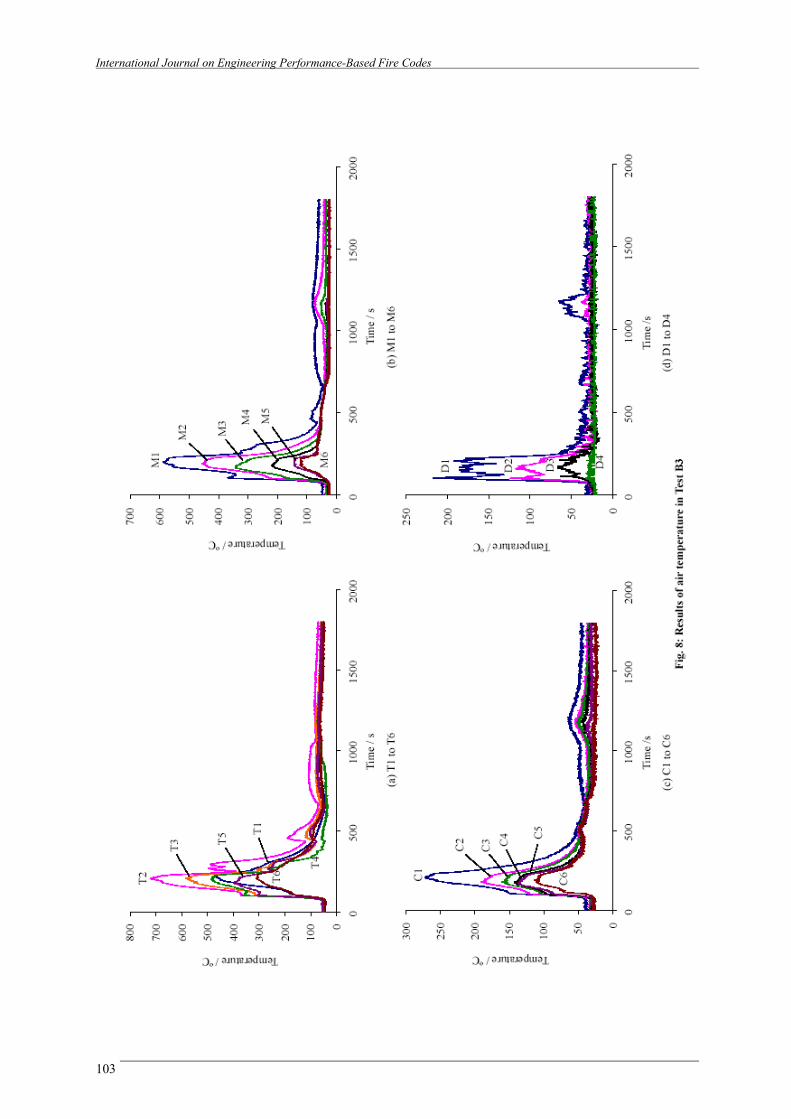
• Test B3: The room was installed with Water Mist Fire Suppression System (WMFSS) The set up of the experiment was the same as in Test B2. A pool fire of 0.5 m diameter with 4000 ml gasoline was used to set off flashover. A WMFSS was installed in the fire test room. The system comprised a water mist nozzle, water tank, pipes and other components. Pressure and flow rate of the system were set at 15 bars and 0.24 ls-1 respectively. The nozzle was installed near the centre of ceiling. Locations of thermocouples were the same as in Test B1. The T-shirts were ignited spontaneously by the heat flux due to the flashover fire. WMFSS would be activated manually once the clothes were ignited. During the experiment, a sprinkler head without connecting to pipes and water tank would also be installed in ceiling, where the position was totally above the pool fire, so as to find out the operating temperature of the sprinkler. A thermocouple was attached to the sensing element of the sprinkler head for detecting the accurate breaking temperature. This breaking temperature was exactly the actual actuation temperature of the sprinkler. As the sprinkler system could not be automatically operated in Test B4, it would be manually controlled. The activation temperature of the sprinkler obtained in this experiment would then be compared with the actuation temperature hypothesized in Test B4, so as to verify the accuracy of the assumption. Transient results on air temperatures and heat flux, HRR, oxygen consumption are shown in Figs. 8 and 9. As WMFSS was activated manually once the clothes were ignited, i.e. at about 100s, the maximum HRR of the clothes is only up to 1.6 MW. The values of HRR are above 1 MW over 100 s of burning time, while the maximum air temperature is only up to 720 oC as illustrated by the thermocouple T2. According to Test B3, the breaking temperature of the sensing element in a sprinkler head was 90 oC. It will be used as a reference in Test B4 for finding the actual delay time of the activation of a sprinkler head once the temperature of thermocouple T4 reached 68oC.
• Test B4: The room was installed with sprinkler system The set up of the experiment was the same as in Test B1. The clothes in rack 1, which were the farthest away from the door, would be ignited initially by an igniter. Sprinkler system would
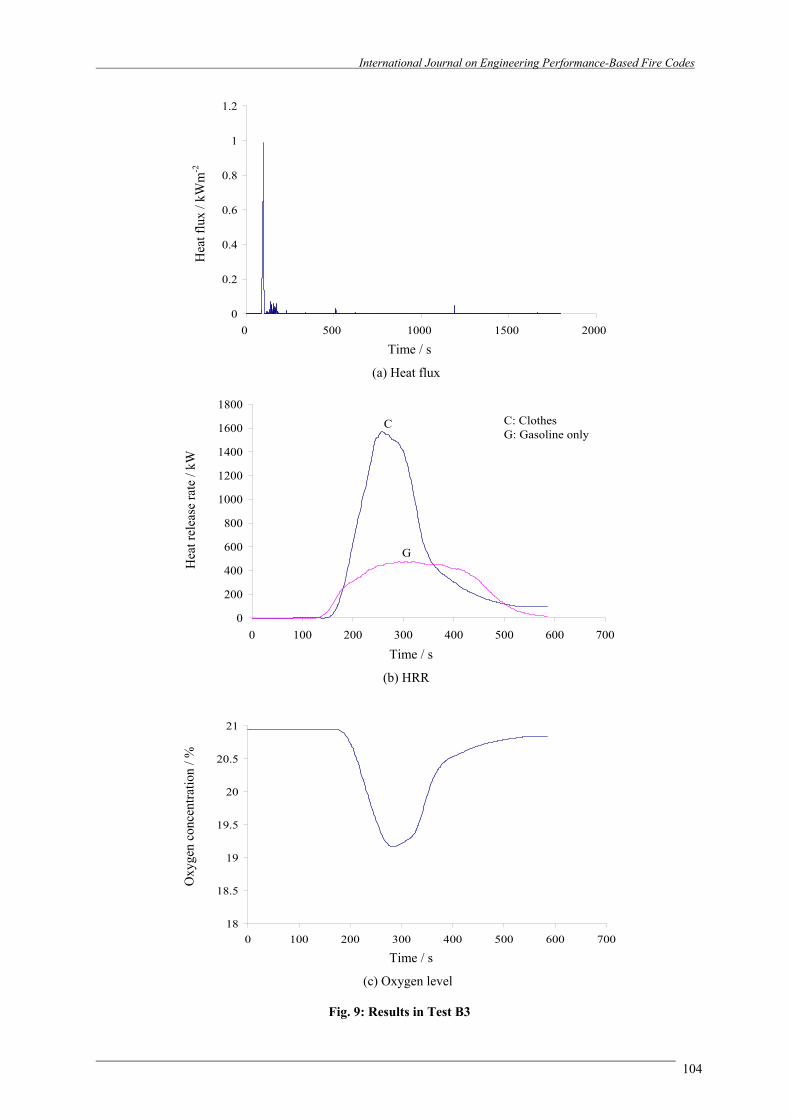
be installed in the fire test room. Sprinkler head without the sensing element would be connected to the pipe sections, water pump and water tank. Pressure and flow rate of the system were set at 11 bars and 2.9 ls-1 respectively. The sprinkler was installed near the centre of ceiling. Locations of thermocouples were the same as in Test B1. Although the activation temperature of the sprinkler head was set at 68oC, it was not the real actuation temperature. Therefore, a hypothesis would be taken such that the sprinkler system was activated manually with a delay of 30 s after the thermocouple T4 reached 68 oC. This activation temperature of T4 would then be compared with the actuation temperature acquired in Test B3. The results of air temperatures and heat flux, HRR, oxygen consumption are shown in Figs. 10 and 11 respectively. As the clothes were only ignited by an igniter and the sprinkler system would be manually actuated at 125 s, i.e. 30 s later after the thermocouple T4 reached 68 oC, the maximum HRR and maximum air temperatures are only up to 0.8 MW and 360 °C respectively. The predicted delay time of a sprinkler head in the hypothesis is too long. The sprinkler system is manually actuated when T4 reached 164 oC, which is much higher than the actual activation temperature of 90oC as indicated in Test B3. Actually, the sprinkler head is only required 8 s to go up to 90oC after T4 reached 68 oC. Therefore, the delay time should be reduced to 8 s to match the actuation temperature, so as to decrease the values of HRR and air temperatures as measured in Test B4.
• Test B5: The clothes were ignited under the hood
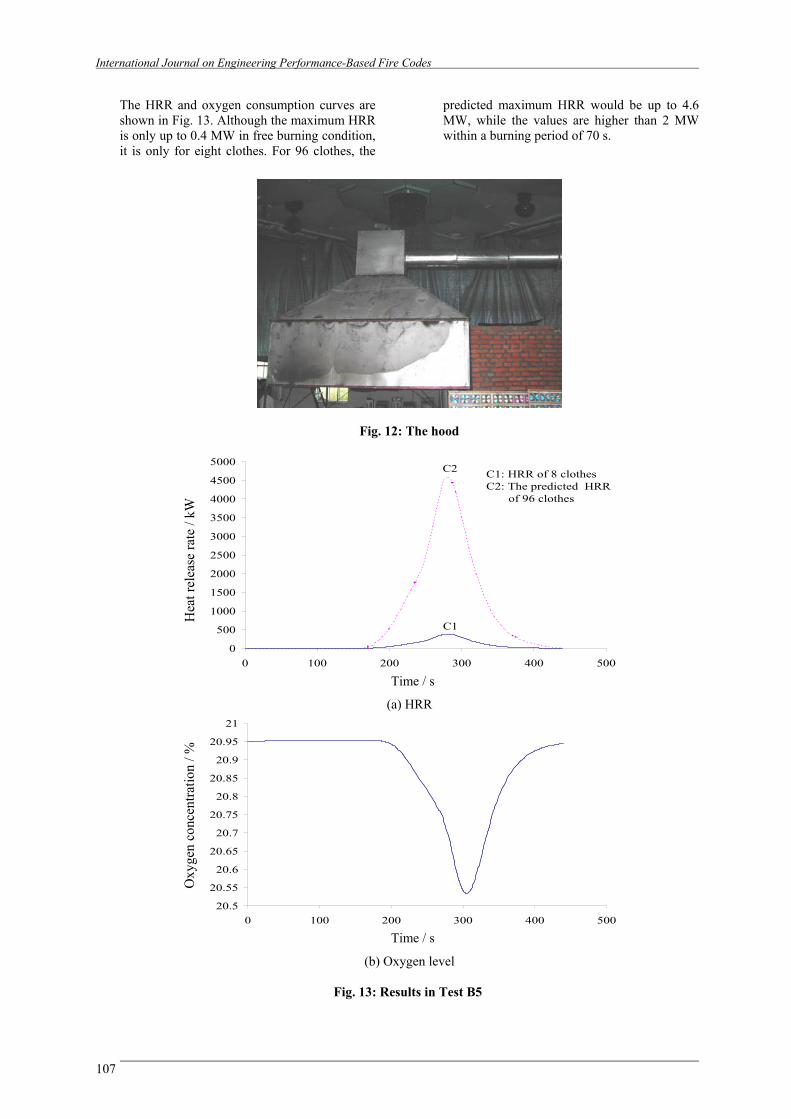
In order to realize the HRR under free burning condition, the clothes were ignited under the hood by an igniter. As it is needed to prevent the fire become too vigorous, only eight T-shirts would be ignited. The results of the HRR would be times a factor of twelve, so as to predict the value of HRR when 96 T-shirts were ignited. The hanger was put at the centre of the hood. The photo of hood was shown in Fig. 12. Eight T-shirts were hung vertically together on rack 1. Each T-shirt was covered by a transparent plastic bag. The clothes, which were hung in the middle of rack 1, would be ignited initially. As only HRR was concentrated in this experiment, temperatures and heat flux would not be measured such that thermocouples and heat flux meter were not set.
International Journal on Engineering Performance-Based Fire Codes
103
International Journal on Engineering Performance-Based Fire Codes
104
0
0.2
0.4
0.6
0.8
1
1.2
0 500 1000 1500 2000 Time / s
(a) Heat flux
0
200
400
600
800
1000
1200
1400
1600
1800
0 100 200 300 400 500 600 700
C
G
C: ClothesG: Gasoline only
Time / s
(b) HRR
18
18.5
19
19.5
20
20.5
21
0 100 200 300 400 500 600 700 Time / s
(c) Oxygen level
Fig. 9: Results in Test B3
O
xyge
n co
ncen
tratio
n / %
H
eat r
elea
se ra
te /
kW
H
eat f
lux
/ kW
m-2
International Journal on Engineering Performance-Based Fire Codes
105

International Journal on Engineering Performance-Based Fire Codes
106
0
0.02
0.04
0.06
0.08
0.1
0.12
0.14
0.16
0 200 400 600 800 1000 Time / s
(a) Heat flux
0
10
20
30
40
50
60
70
80
90
0 100 200 300 400 500 600 Time / s
(b) HRR
20.8
20.82
20.84
20.86
20.88
20.9
20.92
20.94
20.96
20.98
21
0 100 200 300 400 500 600 Time / s
(c) Oxygen level
Fig. 11: Results in Test B4
Oxy
gen
conc
entra
tion
/ %
Hea
t rel
ease
rate
/ kW
H
eat f
lux
/ kW
m-2
International Journal on Engineering Performance-Based Fire Codes
107
The HRR and oxygen consumption curves are shown in Fig. 13. Although the maximum HRR is only up to 0.4 MW in free burning condition, it is only for eight clothes. For 96 clothes, the
predicted maximum HRR would be up to 4.6 MW, while the values are higher than 2 MW within a burning period of 70 s.
Fig. 12: The hood
0
500
1000
1500
2000
2500
3000
3500
4000
4500
5000
0 100 200 300 400 500
C1
C2 C1: HRR of 8 clothesC2: The predicted HRR of 96 clothes
Time / s
(a) HRR
20.5
20.55
20.6
20.65
20.7
20.75
20.8
20.85
20.9
20.95
21
0 100 200 300 400 500 Time / s
(b) Oxygen level
Fig. 13: Results in Test B5
O
xyge
n co
ncen
tratio
n / %
H
eat r
elea
se ra
te /
kW
International Journal on Engineering Performance-Based Fire Codes
108
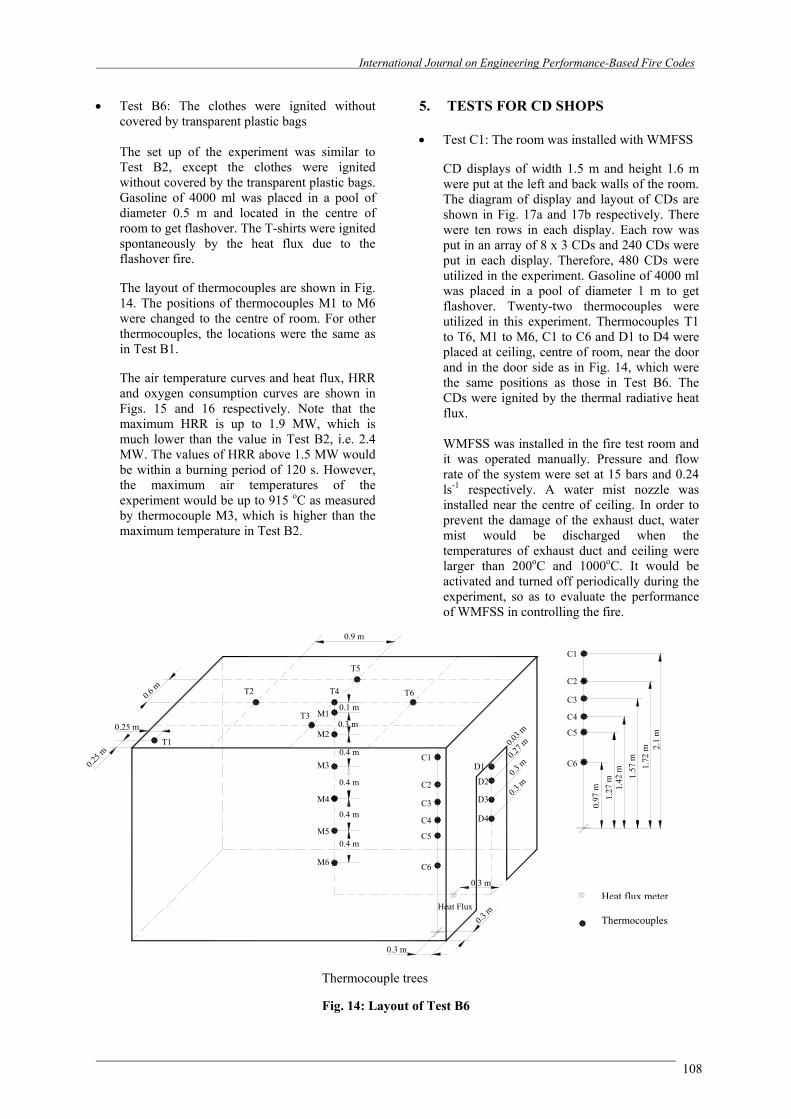
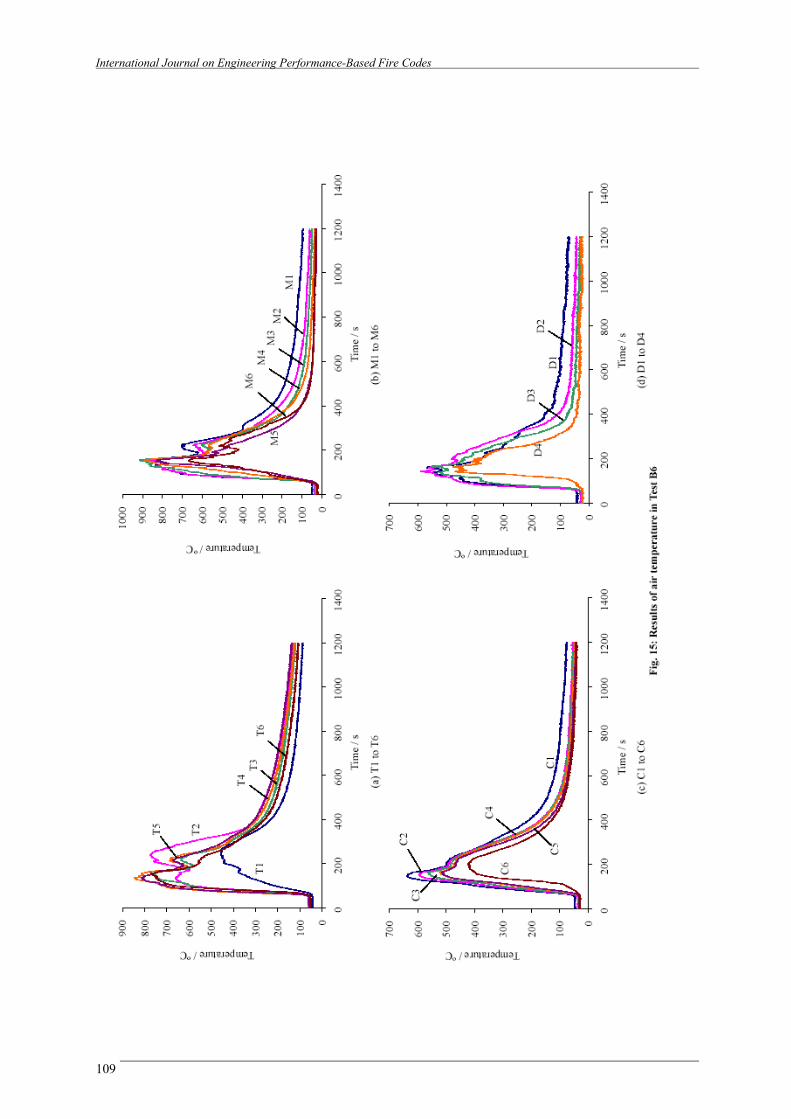
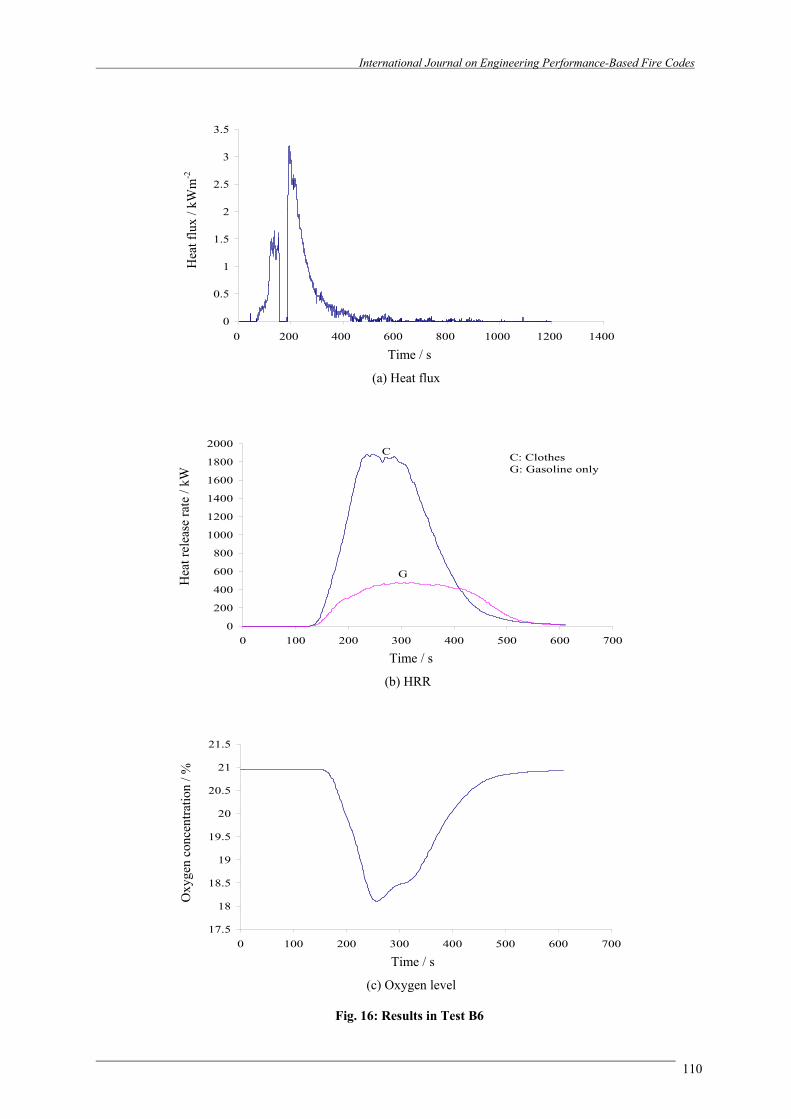
• Test B6: The clothes were ignited without covered by transparent plastic bags The set up of the experiment was similar to Test B2, except the clothes were ignited without covered by the transparent plastic bags. Gasoline of 4000 ml was placed in a pool of diameter 0.5 m and located in the centre of room to get flashover. The T-shirts were ignited spontaneously by the heat flux due to the flashover fire. The layout of thermocouples are shown in Fig. 14. The positions of thermocouples M1 to M6 were changed to the centre of room. For other thermocouples, the locations were the same as in Test B1. The air temperature curves and heat flux, HRR and oxygen consumption curves are shown in Figs. 15 and 16 respectively. Note that the maximum HRR is up to 1.9 MW, which is much lower than the value in Test B2, i.e. 2.4 MW. The values of HRR above 1.5 MW would be within a burning period of 120 s. However, the maximum air temperatures of the experiment would be up to 915 oC as measured by thermocouple M3, which is higher than the maximum temperature in Test B2.
5. TESTS FOR CD SHOPS • Test C1: The room was installed with WMFSS
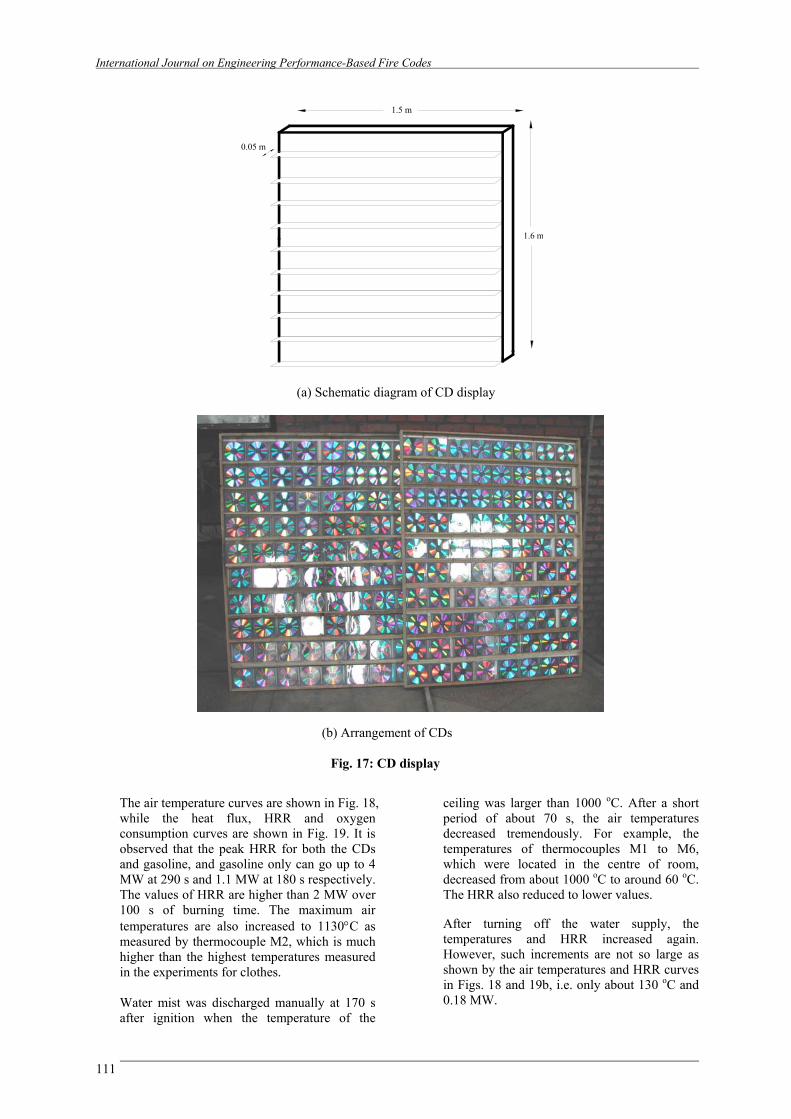
CD displays of width 1.5 m and height 1.6 m were put at the left and back walls of the room. The diagram of display and layout of CDs are shown in Fig. 17a and 17b respectively. There were ten rows in each display. Each row was put in an array of 8 x 3 CDs and 240 CDs were put in each display. Therefore, 480 CDs were utilized in the experiment. Gasoline of 4000 ml was placed in a pool of diameter 1 m to get flashover. Twenty-two thermocouples were utilized in this experiment. Thermocouples T1 to T6, M1 to M6, C1 to C6 and D1 to D4 were placed at ceiling, centre of room, near the door and in the door side as in Fig. 14, which were the same positions as those in Test B6. The CDs were ignited by the thermal radiative heat flux. WMFSS was installed in the fire test room and it was operated manually. Pressure and flow rate of the system were set at 15 bars and 0.24 ls-1 respectively. A water mist nozzle was installed near the centre of ceiling. In order to prevent the damage of the exhaust duct, water mist would be discharged when the temperatures of exhaust duct and ceiling were larger than 200oC and 1000oC. It would be activated and turned off periodically during the experiment, so as to evaluate the performance of WMFSS in controlling the fire.
Heat Flux
M6
M5
0.4 m
0.4 m
0.25 m
T1
0.6 m
0.25 m
T5
T2
M2
M4
M30.4 m
0.4 m
T4
T3 M10.3 m
0.1 m
0.9 m
0.97
m
C3 D3
0.3 m
0.3 m
C5
C4
C6
0.3 m
D4
Heat Flux
Thermocouple
C2
C1
T6
0.03 m
0.27 m
0.3 m
0.3 mD2
D1
2.1
mC5
1.27
m
C6
1.42
m 1.57
m1.
72 m
C2
C4
C3
C1
Thermocouple trees
Fig. 14: Layout of Test B6
Heat flux meter
Thermocouples
International Journal on Engineering Performance-Based Fire Codes
109
International Journal on Engineering Performance-Based Fire Codes
110
0
0.5
1
1.5
2
2.5
3
3.5
0 200 400 600 800 1000 1200 1400 Time / s
(a) Heat flux
0
200
400
600
800
1000
1200
1400
1600
1800
2000
0 100 200 300 400 500 600 700
C
G
C: ClothesG: Gasoline only
Time / s
(b) HRR
17.5
18
18.5
19
19.5
20
20.5
21
21.5
0 100 200 300 400 500 600 700 Time / s
(c) Oxygen level
Fig. 16: Results in Test B6
Oxy
gen
conc
entra
tion
/ %
Hea
t rel
ease
rate
/ kW
H
eat f
lux
/ kW
m-2
International Journal on Engineering Performance-Based Fire Codes
111
(a) Schematic diagram of CD display
(a) Schematic diagram of CD display
(b) Arrangement of CDs
Fig. 17: CD display
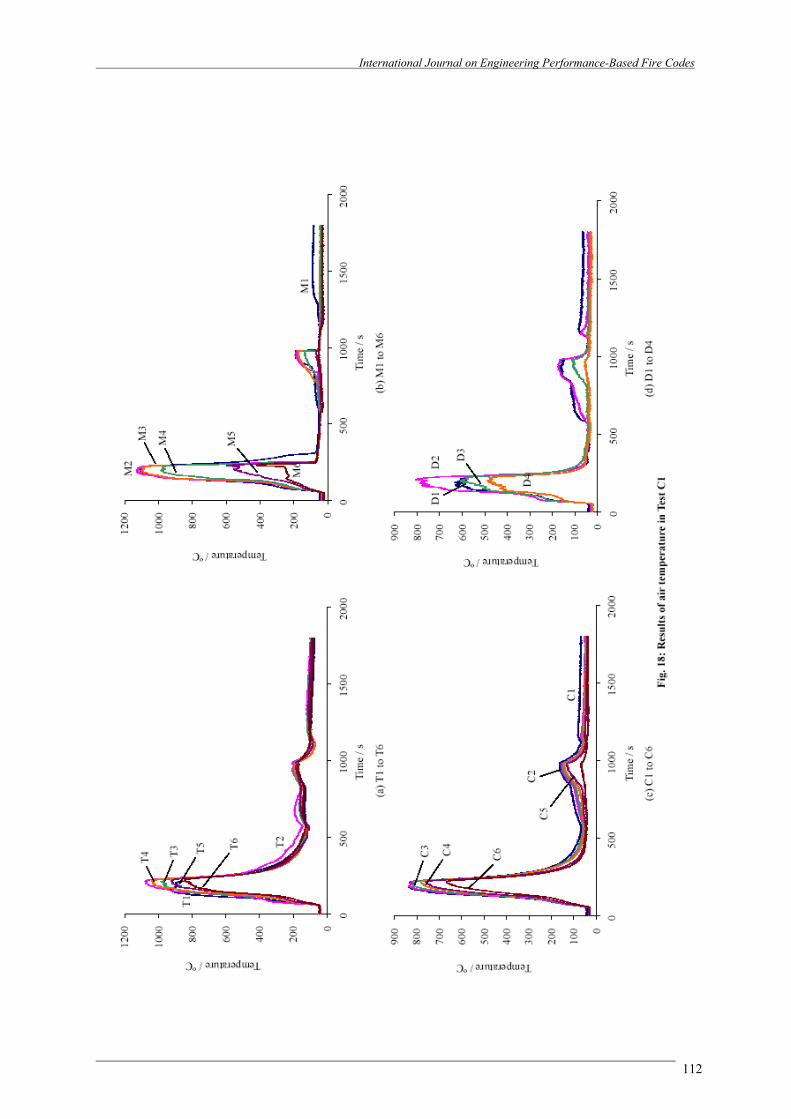
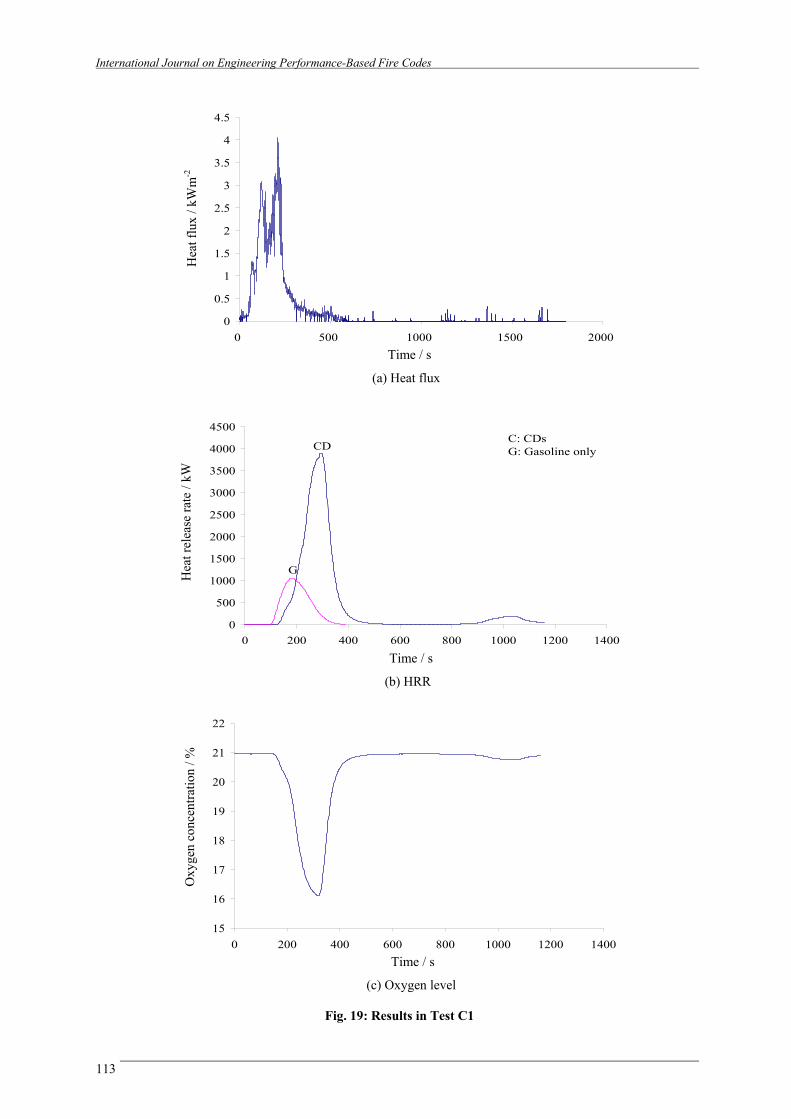
The air temperature curves are shown in Fig. 18, while the heat flux, HRR and oxygen consumption curves are shown in Fig. 19. It is observed that the peak HRR for both the CDs and gasoline, and gasoline only can go up to 4 MW at 290 s and 1.1 MW at 180 s respectively. The values of HRR are higher than 2 MW over 100 s of burning time. The maximum air temperatures are also increased to 1130°C as measured by thermocouple M2, which is much higher than the highest temperatures measured in the experiments for clothes. Water mist was discharged manually at 170 s after ignition when the temperature of the
ceiling was larger than 1000 oC. After a short period of about 70 s, the air temperatures decreased tremendously. For example, the temperatures of thermocouples M1 to M6, which were located in the centre of room, decreased from about 1000 oC to around 60 oC. The HRR also reduced to lower values. After turning off the water supply, the temperatures and HRR increased again. However, such increments are not so large as shown by the air temperatures and HRR curves in Figs. 18 and 19b, i.e. only about 130 oC and 0.18 MW.
1.6 m
1.5 m
0.05 m
International Journal on Engineering Performance-Based Fire Codes
112
International Journal on Engineering Performance-Based Fire Codes
113
0
0.5
1
1.5
2
2.5
3
3.5
4
4.5
0 500 1000 1500 2000 Time / s
(a) Heat flux
0
500
1000
1500
2000
2500
3000
3500
4000
4500
0 200 400 600 800 1000 1200 1400
CD
G
C: CDsG: Gasoline only
Time / s
(b) HRR
15
16
17
18
19
20
21
22
0 200 400 600 800 1000 1200 1400 Time / s
(c) Oxygen level
Fig. 19: Results in Test C1
Oxy
gen
conc
entra
tion
/ %
Hea
t rel
ease
rate
/ kW
H
eat f
lux
/ kW
m-2
International Journal on Engineering Performance-Based Fire Codes
114
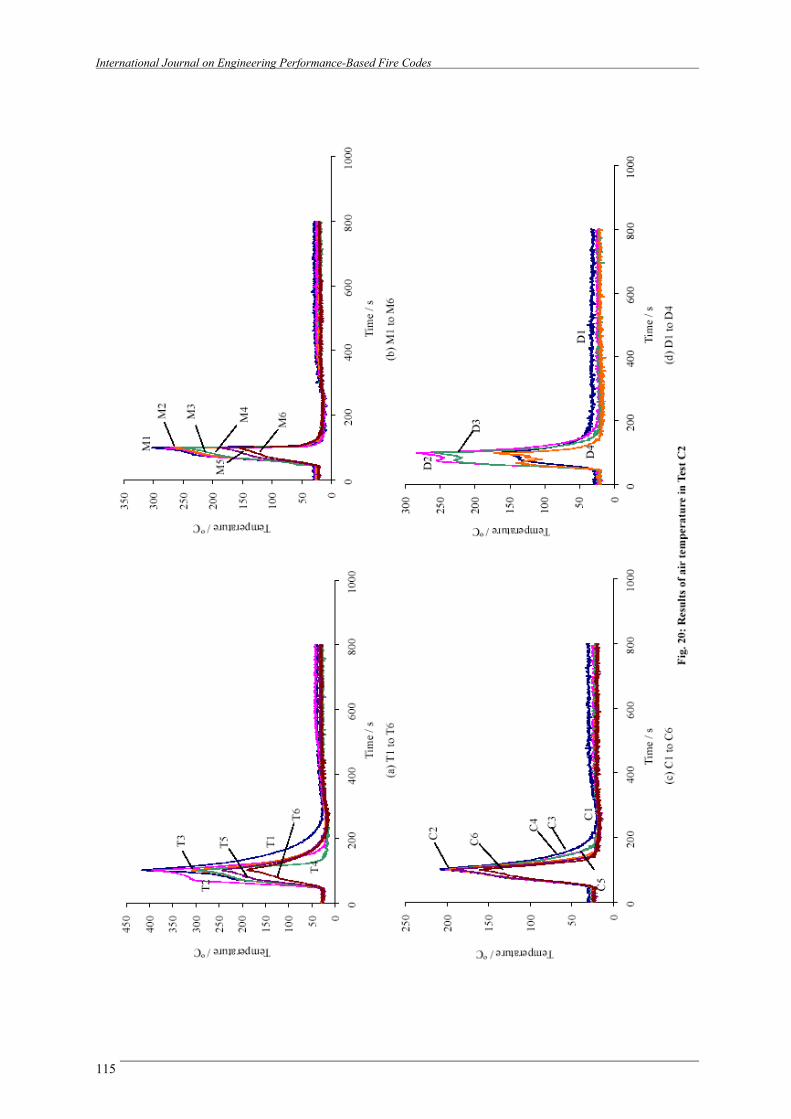
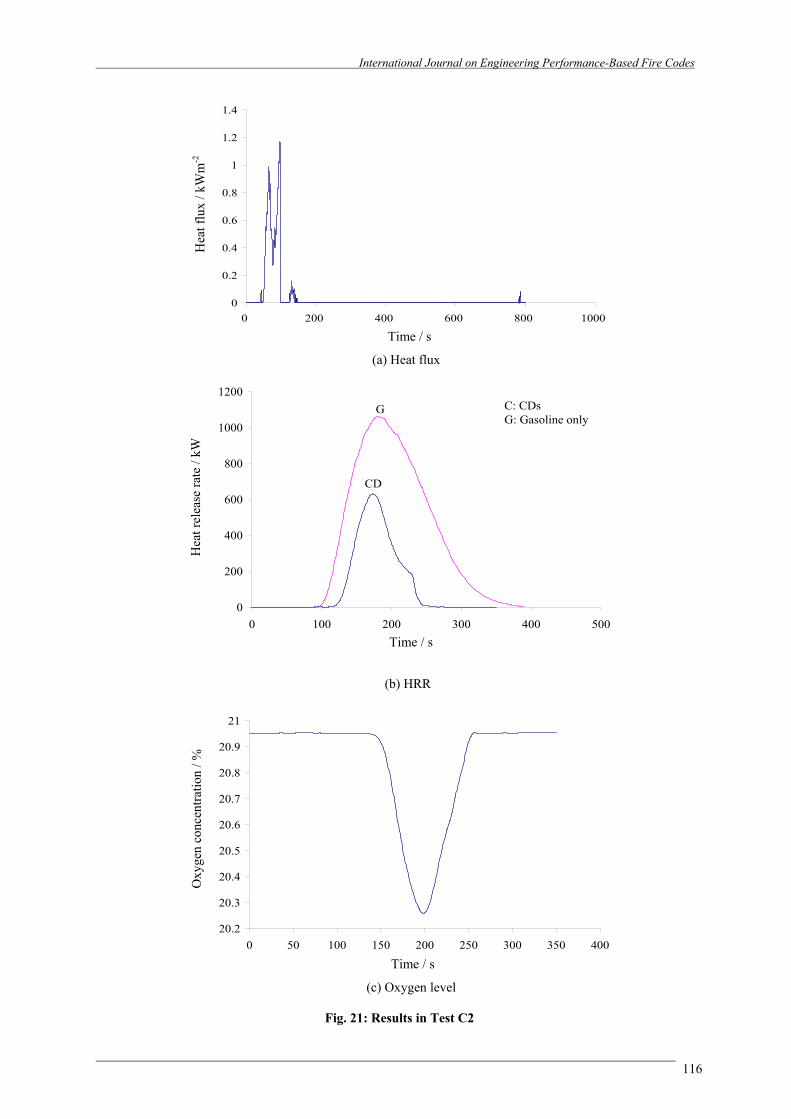
• Test C2: The room was installed with WMFSS The set up of the experiment was the same as in Test C1. A pool fire of 1 m diameter with 4000 ml gasoline was used to set off flashover. Locations of thermocouples and water mist nozzle, pressure and flow rate of WMFSS were the same as in Test C1. WMFSS was actuated manually once a row of CDs was ignited. The mist would be discharged continually until the fire was extinguished. Results of air temperatures and heat flux, HRR, oxygen consumption are shown in Figs. 20 and 21 respectively. As WMFSS was actuated manually once a row of CDs was ignited, the heat flux, air temperatures, HRR and oxygen consumption of the experiment did not reach the peak when compared with Test C1. The maximum air temperatures and HRR are only about 520 oC and 0.7 MW respectively, which are smaller than the values for igniting the gasoline only, i.e. 535 oC and 1.1 MW. As the mist was discharged continually, the air temperatures and HRR would only be decreased gradually and not increased again.
• Test C3: The room was installed with sprinkler system
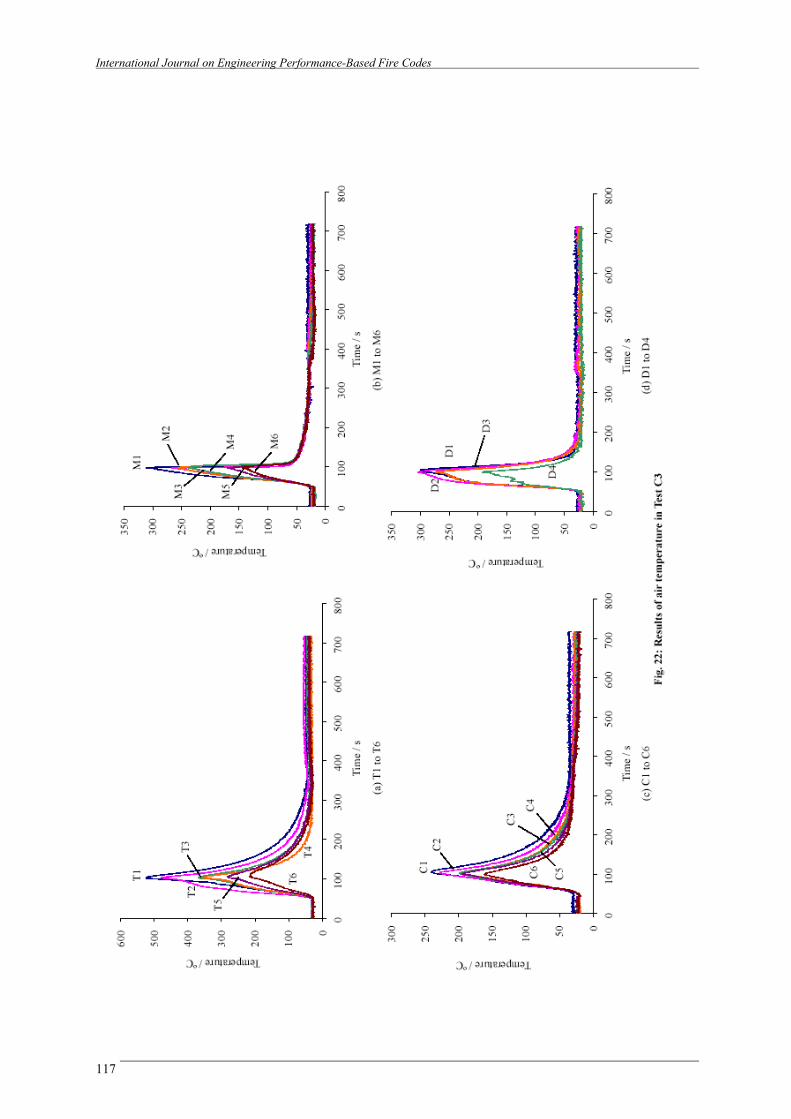
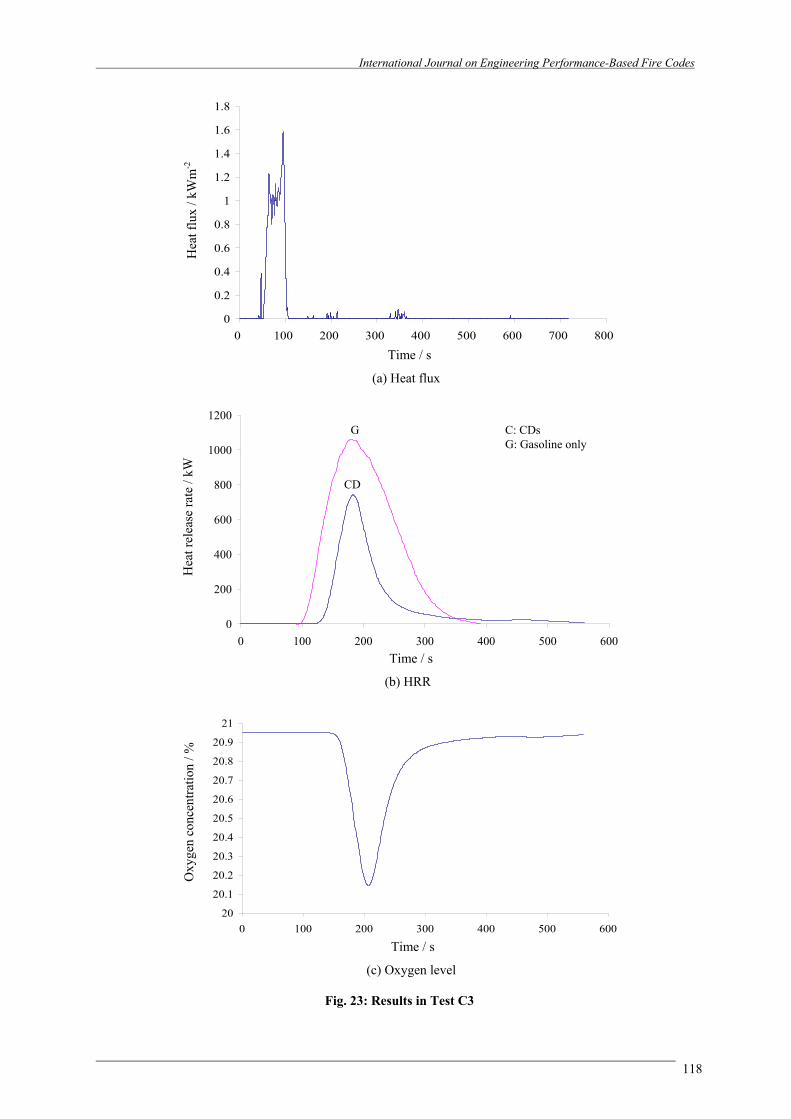
The set up of the experiment was the same as in Test C2. A pool of 1 m diameter and 4000 ml of gasoline was used to give a flashover fire. Sprinkler system would be installed in the fire test room. The pressure and flow rate of the system were set at 11 bars and 2.9 ls-1 respectively. A sprinkler head without the sensing element was installed near the centre of ceiling. Locations of thermocouples were the same as in Test C1. The CDs were ignited vigorously by the heat flux due to the flashover fire. Once a row of CDs was ignited, the system would be activated manually. It would continue to operate until the fire was put out. Transient results on air temperatures and heat flux, HRR, oxygen consumption are shown in Figs. 22 and 23. Same as Test C2, the sprinkler system was activated once a row of CDs was ignited. The heat flux, air temperatures, HRR and oxygen consumption are not as high as in Test C1. The maximum air temperatures and HRR are only about 410 oC and 0.6 MW respectively, which are much smaller than the values for igniting gasoline only, i.e. 535 oC and 1.1 MW.
6. DISCUSSIONS
Flashover is defined as the transition from a glowing fire to a fully developed fire in which all the combustibles in the room are involved in fire [21]. In normal condition, it is difficult to recognize whether flashover has happened inside the room. Therefore, three practical criteria are used to assess the occurrence of flashover. If anyone of the following criteria is satisfied, flashover would occur: Upper layer temperature inside the room
reaches 550 to 600 oC. The heat flux at the floor level reaches 20
kWm-2. The flame is coming out from the openings of
the room. When the flame reaches the ceiling, it would be deflected horizontally. By observation, when the flame of the upper layer becomes yellow, i.e. temperature of the upper level reaches 550 to 600 oC, flashover is said to have occurred. The radiative heat fluxes in the upper level would be transferred to the lower level and cause the combustibles to reach their ignition temperatures. The heat fluxes would then be transferred between the combustibles and finally, all the combustibles in the compartment would be ignited together. The amount of gasoline used for setting off flashover was adjusted to 4000 ml. Sufficient gasoline was used but the liquid pool fire should not give out high HRR when other combustibles in the shop were ignited. HRR curves for burning the gasoline only are shown in Figs. 7b, 9b, 16b and 19b. These curves demonstrated that heat liberated from the pool fire is much lower than from the shop contents. However, for the experiments of CDs in Tests C2 and C3, the HRR curves for burning the gasoline only are higher than igniting the CDs. This is due to the WMFSS in Test C2 and sprinkler system in Test C3 was activated once a row of CDs was ignited. The heat liberated by the CDs was cooled down by the mists or water discharged before reaching its maximum level. The following are observed from the full-scale burning tests on boutique: As the clothes were hung vertically and the
bottom parts would be ignited initially, the flame and hot gases would spread vertically upward. The flame spread rate upon the T-shirts would be very fast [22]. The clothes were burnt completely and would not be self-extinguished in the tests.
International Journal on Engineering Performance-Based Fire Codes
115
International Journal on Engineering Performance-Based Fire Codes
116
0
0.2
0.4
0.6
0.8
1
1.2
1.4
0 200 400 600 800 1000 Time / s
(a) Heat flux
0
200
400
600
800
1000
1200
0 100 200 300 400 500
CD
G C: CDsG: Gasoline only
Time / s
(b) HRR
20.2
20.3
20.4
20.5
20.6
20.7
20.8
20.9
21
0 50 100 150 200 250 300 350 400 Time / s
(c) Oxygen level
Fig. 21: Results in Test C2
Oxy
gen
conc
entra
tion
/ %
Hea
t rel
ease
rate
/ kW
Hea
t flu
x / k
Wm
-2
International Journal on Engineering Performance-Based Fire Codes
117
International Journal on Engineering Performance-Based Fire Codes
118
0
0.2
0.4
0.6
0.8
1
1.2
1.4
1.6
1.8
0 100 200 300 400 500 600 700 800 Time / s
(a) Heat flux
0
200
400
600
800
1000
1200
0 100 200 300 400 500 600
CD
G C: CDsG: Gasoline only
Time / s
(b) HRR
20
20.1
20.2
20.3
20.4
20.5
20.6
20.7
20.8
20.9
21
0 100 200 300 400 500 600 Time / s
(c) Oxygen level
Fig. 23: Results in Test C3
Oxy
gen
conc
entra
tion
/ %
H
eat r
elea
se ra
te /
kW
Hea
t flu
x / k
Wm
-2
International Journal on Engineering Performance-Based Fire Codes
119
For the clothes which were ignited by an igniter in Test B1, only the T-shirts on racks 1 and 2 were ignited. As the clothes on those racks were not burnt thoroughly and the distance between racks 2 and 3 is quite long, the clothes on racks 3 and 4 could not be ignited. Therefore, only the clothes on two racks would be ignited in Test B1. By observation, flashover was said to have occurred at around 195 s, as thermocouple T2 reached 550 oC and flame was coming out from the door at that time.
Based on the same condition, the HRR of Test
B2 is much higher than that in Test B6, in which the clothes were not covered by the transparent plastic bags. The difference between the HRR is about 0.5 MW. As the locations of the thermocouple tree are different for those tests, i.e. the tree was located in the centre of room for Test B6, which is much closer to the pool, the maximum temperature measured in Test B6 is much higher that in Test B2.
As the heat flux meter was covered by the
burnt clothes at around 170 s in Test B6, the heat flux measured suddenly dropped to 0 kWm-2 at that time. The heat flux became normal again at 190 s and rose to its maximum point, i.e. 3.3 kWm-2.
The burning time of the clothes in Test B4 is
much shorter than that in Test B3. This is due to the clothes in Test B4 were ignited by an igniter only, while the clothes in Test B3 were ignited by the pool fire. On the other hand, the water discharged by the sprinkler system, i.e. 2.9 ls-1, is much higher than the WMFSS, i.e. 0.24 ls-1. As the clothes were wet by large amount of water in Test B4, only some of the T-shirts would be ignited.
In Test B5, the clothes were ignited vigorously
under free burning condition. Although only 8 T-shirts were ignited, the HRR is quite high. As the fire was fuel-controlled, i.e. sufficient air was provided for all the clothes to burn, such that the HRR would be higher than the ventilation-controlled fire. The HRR in the test was only affected by the burning of T-shirts and not the room environment. Little CO would be formed as the combustion would be near-complete [23].
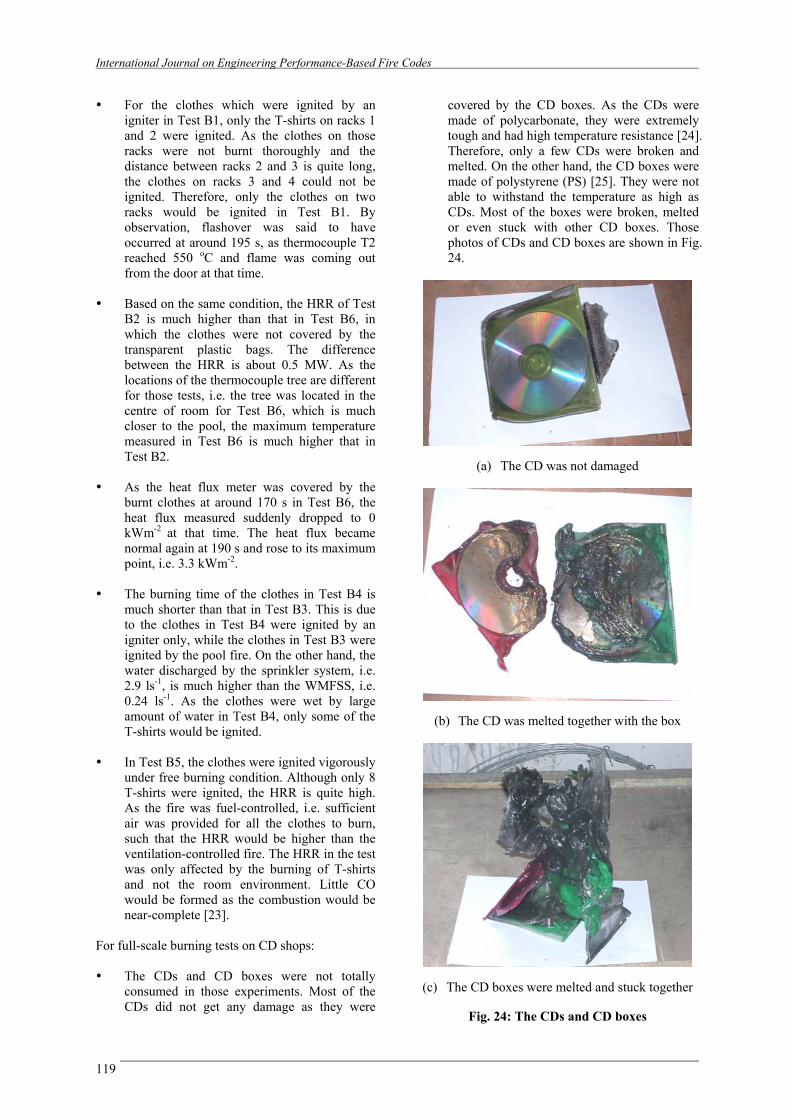
For full-scale burning tests on CD shops: The CDs and CD boxes were not totally
consumed in those experiments. Most of the CDs did not get any damage as they were
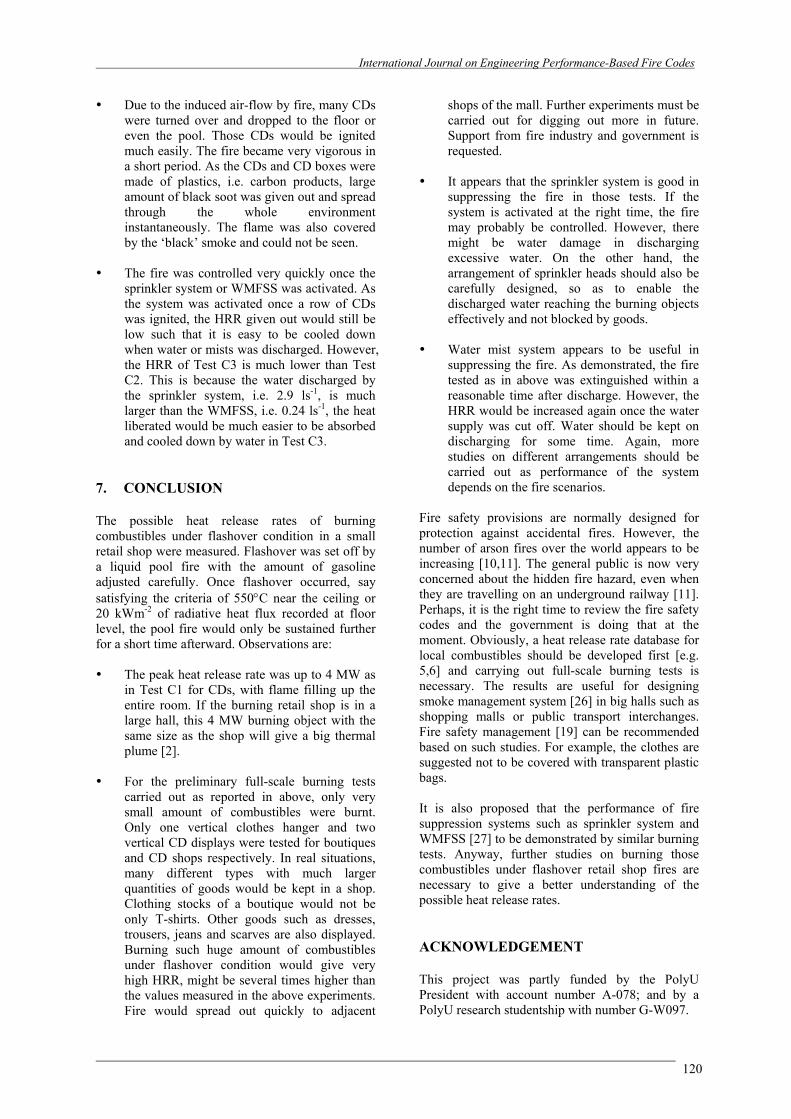
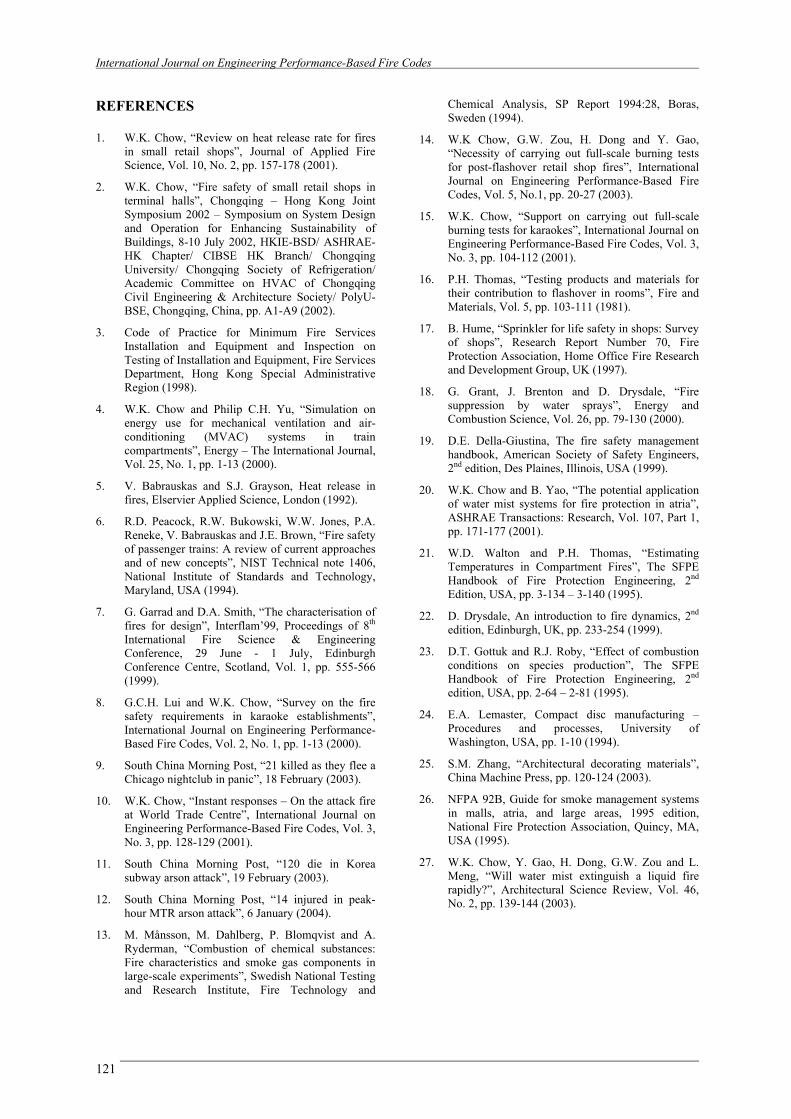
covered by the CD boxes. As the CDs were made of polycarbonate, they were extremely tough and had high temperature resistance [24]. Therefore, only a few CDs were broken and melted. On the other hand, the CD boxes were made of polystyrene (PS) [25]. They were not able to withstand the temperature as high as CDs. Most of the boxes were broken, melted or even stuck with other CD boxes. Those photos of CDs and CD boxes are shown in Fig. 24.
(a) The CD was not damaged
(b) The CD was melted together with the box
(c) The CD boxes were melted and stuck together
Fig. 24: The CDs and CD boxes
International Journal on Engineering Performance-Based Fire Codes
120
Due to the induced air-flow by fire, many CDs were turned over and dropped to the floor or even the pool. Those CDs would be ignited much easily. The fire became very vigorous in a short period. As the CDs and CD boxes were made of plastics, i.e. carbon products, large amount of black soot was given out and spread through the whole environment instantaneously. The flame was also covered by the ‘black’ smoke and could not be seen.
The fire was controlled very quickly once the
sprinkler system or WMFSS was activated. As the system was activated once a row of CDs was ignited, the HRR given out would still be low such that it is easy to be cooled down when water or mists was discharged. However, the HRR of Test C3 is much lower than Test C2. This is because the water discharged by the sprinkler system, i.e. 2.9 ls-1, is much larger than the WMFSS, i.e. 0.24 ls-1, the heat liberated would be much easier to be absorbed and cooled down by water in Test C3.
7. CONCLUSION
The possible heat release rates of burning combustibles under flashover condition in a small retail shop were measured. Flashover was set off by a liquid pool fire with the amount of gasoline adjusted carefully. Once flashover occurred, say satisfying the criteria of 550°C near the ceiling or 20 kWm-2 of radiative heat flux recorded at floor level, the pool fire would only be sustained further for a short time afterward. Observations are: The peak heat release rate was up to 4 MW as
in Test C1 for CDs, with flame filling up the entire room. If the burning retail shop is in a large hall, this 4 MW burning object with the same size as the shop will give a big thermal plume [2].
For the preliminary full-scale burning tests
carried out as reported in above, only very small amount of combustibles were burnt. Only one vertical clothes hanger and two vertical CD displays were tested for boutiques and CD shops respectively. In real situations, many different types with much larger quantities of goods would be kept in a shop. Clothing stocks of a boutique would not be only T-shirts. Other goods such as dresses, trousers, jeans and scarves are also displayed. Burning such huge amount of combustibles under flashover condition would give very high HRR, might be several times higher than the values measured in the above experiments. Fire would spread out quickly to adjacent
shops of the mall. Further experiments must be carried out for digging out more in future. Support from fire industry and government is requested.
It appears that the sprinkler system is good in
suppressing the fire in those tests. If the system is activated at the right time, the fire may probably be controlled. However, there might be water damage in discharging excessive water. On the other hand, the arrangement of sprinkler heads should also be carefully designed, so as to enable the discharged water reaching the burning objects effectively and not blocked by goods.
Water mist system appears to be useful in
suppressing the fire. As demonstrated, the fire tested as in above was extinguished within a reasonable time after discharge. However, the HRR would be increased again once the water supply was cut off. Water should be kept on discharging for some time. Again, more studies on different arrangements should be carried out as performance of the system depends on the fire scenarios.
Fire safety provisions are normally designed for protection against accidental fires. However, the number of arson fires over the world appears to be increasing [10,11]. The general public is now very concerned about the hidden fire hazard, even when they are travelling on an underground railway [11]. Perhaps, it is the right time to review the fire safety codes and the government is doing that at the moment. Obviously, a heat release rate database for local combustibles should be developed first [e.g. 5,6] and carrying out full-scale burning tests is necessary. The results are useful for designing smoke management system [26] in big halls such as shopping malls or public transport interchanges. Fire safety management [19] can be recommended based on such studies. For example, the clothes are suggested not to be covered with transparent plastic bags. It is also proposed that the performance of fire suppression systems such as sprinkler system and WMFSS [27] to be demonstrated by similar burning tests. Anyway, further studies on burning those combustibles under flashover retail shop fires are necessary to give a better understanding of the possible heat release rates. ACKNOWLEDGEMENT This project was partly funded by the PolyU President with account number A-078; and by a PolyU research studentship with number G-W097.
International Journal on Engineering Performance-Based Fire Codes
121
REFERENCES 1. W.K. Chow, “Review on heat release rate for fires
in small retail shops”, Journal of Applied Fire Science, Vol. 10, No. 2, pp. 157-178 (2001).
2. W.K. Chow, “Fire safety of small retail shops in terminal halls”, Chongqing – Hong Kong Joint Symposium 2002 – Symposium on System Design and Operation for Enhancing Sustainability of Buildings, 8-10 July 2002, HKIE-BSD/ ASHRAE-HK Chapter/ CIBSE HK Branch/ Chongqing University/ Chongqing Society of Refrigeration/ Academic Committee on HVAC of Chongqing Civil Engineering & Architecture Society/ PolyU-BSE, Chongqing, China, pp. A1-A9 (2002).
3. Code of Practice for Minimum Fire Services Installation and Equipment and Inspection on Testing of Installation and Equipment, Fire Services Department, Hong Kong Special Administrative Region (1998).
4. W.K. Chow and Philip C.H. Yu, “Simulation on energy use for mechanical ventilation and air-conditioning (MVAC) systems in train compartments”, Energy – The International Journal, Vol. 25, No. 1, pp. 1-13 (2000).
5. V. Babrauskas and S.J. Grayson, Heat release in fires, Elservier Applied Science, London (1992).
6. R.D. Peacock, R.W. Bukowski, W.W. Jones, P.A. Reneke, V. Babrauskas and J.E. Brown, “Fire safety of passenger trains: A review of current approaches and of new concepts”, NIST Technical note 1406, National Institute of Standards and Technology, Maryland, USA (1994).
7. G. Garrad and D.A. Smith, “The characterisation of fires for design”, Interflam’99, Proceedings of 8th International Fire Science & Engineering Conference, 29 June - 1 July, Edinburgh Conference Centre, Scotland, Vol. 1, pp. 555-566 (1999).
8. G.C.H. Lui and W.K. Chow, “Survey on the fire safety requirements in karaoke establishments”, International Journal on Engineering Performance-Based Fire Codes, Vol. 2, No. 1, pp. 1-13 (2000).
9. South China Morning Post, “21 killed as they flee a Chicago nightclub in panic”, 18 February (2003).
10. W.K. Chow, “Instant responses – On the attack fire at World Trade Centre”, International Journal on Engineering Performance-Based Fire Codes, Vol. 3, No. 3, pp. 128-129 (2001).
11. South China Morning Post, “120 die in Korea subway arson attack”, 19 February (2003).
12. South China Morning Post, “14 injured in peak-hour MTR arson attack”, 6 January (2004).
13. M. Månsson, M. Dahlberg, P. Blomqvist and A. Ryderman, “Combustion of chemical substances: Fire characteristics and smoke gas components in large-scale experiments”, Swedish National Testing and Research Institute, Fire Technology and
Chemical Analysis, SP Report 1994:28, Boras, Sweden (1994).
14. W.K Chow, G.W. Zou, H. Dong and Y. Gao, “Necessity of carrying out full-scale burning tests for post-flashover retail shop fires”, International Journal on Engineering Performance-Based Fire Codes, Vol. 5, No.1, pp. 20-27 (2003).
15. W.K. Chow, “Support on carrying out full-scale burning tests for karaokes”, International Journal on Engineering Performance-Based Fire Codes, Vol. 3, No. 3, pp. 104-112 (2001).
16. P.H. Thomas, “Testing products and materials for their contribution to flashover in rooms”, Fire and Materials, Vol. 5, pp. 103-111 (1981).
17. B. Hume, “Sprinkler for life safety in shops: Survey of shops”, Research Report Number 70, Fire Protection Association, Home Office Fire Research and Development Group, UK (1997).
18. G. Grant, J. Brenton and D. Drysdale, “Fire suppression by water sprays”, Energy and Combustion Science, Vol. 26, pp. 79-130 (2000).
19. D.E. Della-Giustina, The fire safety management handbook, American Society of Safety Engineers, 2nd edition, Des Plaines, Illinois, USA (1999).
20. W.K. Chow and B. Yao, “The potential application of water mist systems for fire protection in atria”, ASHRAE Transactions: Research, Vol. 107, Part 1, pp. 171-177 (2001).
21. W.D. Walton and P.H. Thomas, “Estimating Temperatures in Compartment Fires”, The SFPE Handbook of Fire Protection Engineering, 2nd Edition, USA, pp. 3-134 – 3-140 (1995).
22. D. Drysdale, An introduction to fire dynamics, 2nd edition, Edinburgh, UK, pp. 233-254 (1999).
23. D.T. Gottuk and R.J. Roby, “Effect of combustion conditions on species production”, The SFPE Handbook of Fire Protection Engineering, 2nd edition, USA, pp. 2-64 – 2-81 (1995).
24. E.A. Lemaster, Compact disc manufacturing – Procedures and processes, University of Washington, USA, pp. 1-10 (1994).
25. S.M. Zhang, “Architectural decorating materials”, China Machine Press, pp. 120-124 (2003).
26. NFPA 92B, Guide for smoke management systems in malls, atria, and large areas, 1995 edition, National Fire Protection Association, Quincy, MA, USA (1995).
27. W.K. Chow, Y. Gao, H. Dong, G.W. Zou and L. Meng, “Will water mist extinguish a liquid fire rapidly?”, Architectural Science Review, Vol. 46, No. 2, pp. 139-144 (2003).