fukushima accident || fukushima radioactivity impact
TRANSCRIPT
Fu
Co
5
FUKUSHIMARADIOACTIVITY IMPACTCHAPTER OUTLINE
5.1 Japan 132ku
py
5.1.1 Atmosphere 132
shima A
right � 2
5.1.1.1 Emergency Monitoring of AirborneRadioactivity 132
5.1.1.2 Source Monitoring 1335.1.1.3 Air Monitoring Carried out in Japan
(Except MEXT) 1355.1.1.4 Radionuclides Measured in Regional
and Local Monitoring Sites 1365.1.1.5 Air Monitoring in Remote Sites in Japan 148
5.1.2 Dry Deposition and Precipitation 149
5.1.2.1 Daily Deposition at Local and Regional Stations 1495.1.2.2 Spatial Distributions of Monthly Deposition 1535.1.2.3 Temporal Variations of the Fukushima-DerivedRadionuclides 1575.1.2.4 Wet Deposition Processes 1605.1.2.5 Dry Deposition Processes 1615.1.2.6 Resuspension Processes 163
5.1.3 Radionuclides in Grass, Crop, Livestock and Soil 169
5.1.3.1 Radionuclides in Soil 1695.1.3.2 Radionuclides in Grass 1805.1.3.3 Radionuclides in Crop 1825.1.4 Radionuclides in River and Lake Waters 1865.1.5 Radionuclides in Biota from Freshwater 1915.1.6 Radionuclides in Groundwater 1935.1.7 Radionuclides in Coastal Waters 193
5.1.7.1 Trends in 134Cs and 137Cs Concentrations Close to theAccident Site 193
5.1.7.2 Trends in 134Cs and 137Cs Concentrations at Hasakiand Onahama (South of FNPP1) 194
5.1.8 Radionuclides in Coastal Biota 198
5.1.8.1 Radionuclides in Fish 1985.1.8.2 Seaweeds 202ccident. http://dx.doi.org/10.1016/B978-0-12-408132-1.00005-X
013 Elsevier Inc. All rights reserved. 131
132 Chapter 5 FUKUSHIMA RADIOACTIVITY IMPACT
5.1.8.3 Plankton 2045.1.8.4 Other Radionuclides in Biota 205
5.2 World Atmosphere 206
5.2.1 Radionuclide Source Terms Used in the ModelingExercises 2085.2.2 Data on Radioactivity of Aerosols over Europe 2095.2.3 Modeling the Air Mass Transport 211
5.2.3.1 Modeling of Forward and BackwardTrajectories 211
5.2.3.2 Lagrangian Dispersion Model 219
5.3 Pacific Ocean 2255.3.1 Radionuclides in Seawater 225
5.3.1.1 Seawater Sampling and Radionuclide Analyses 2275.3.1.2 Radionuclides in the North Pacific Ocean 2325.3.2 Radionuclides in Ocean Fish 2465.3.3 Modeling of Radionuclide Transport in the Ocean 248
5.3.3.1 LAMER Code 2495.3.3.2 Radionuclide Source Term Used
in Ocean Simulations 2495.3.3.3 Horizontal and Vertical Distribution of 137Cs in the
North Pacific Ocean 250
ReferencesHeavy environmental monitoring activities havebeen carried out by national Japan government,local governments, research institutes and univer-sities in Japan and worldwide to assess the impact ofthe Fukushima accident on the terrestrial andmarine environment. We shall discuss in detail animpact on the Japan terrestrial and the marineenvironment, as well as on the global atmosphereand the ocean.
5.1 Japan
5.1.1 Atmosphere 5.1.1.1 Emergency Monitoring of AirborneRadioactivityRadioactivity measurement in surface air is one ofthe most important issues in emergency environ-mental monitoring. Japanese Government includingPrefectural Governments started measurementsof radioactivity in surface air using monitoring cars
Chapter 5 FUKUSHIMA RADIOACTIVITY IMPACT 133
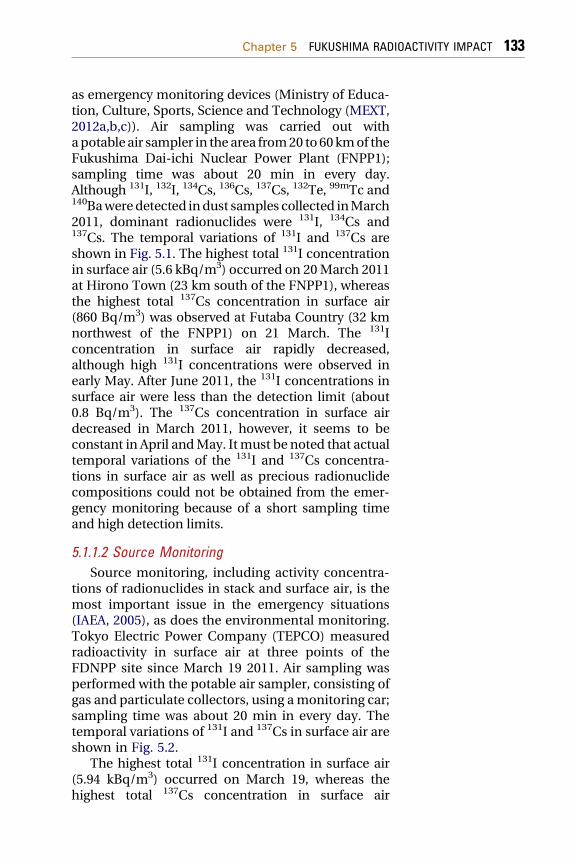
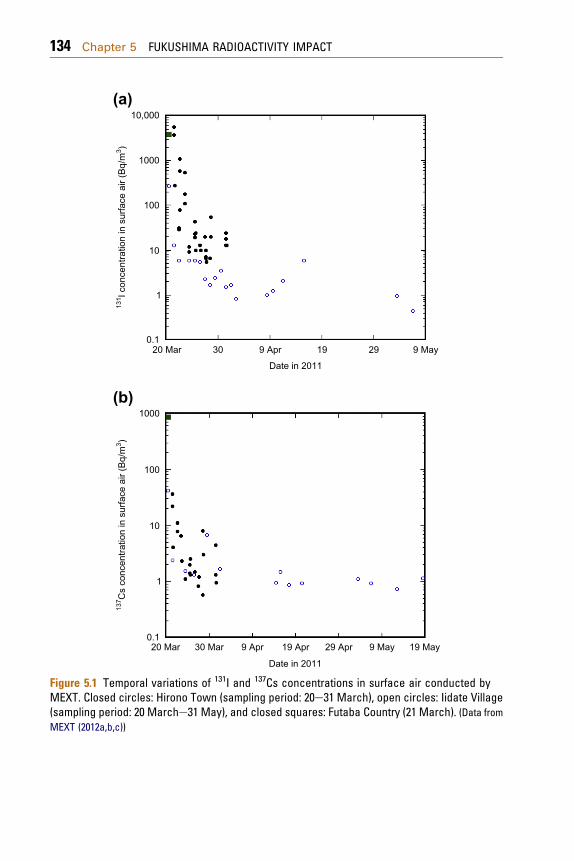
as emergency monitoring devices (Ministry of Educa-tion, Culture, Sports, Science and Technology (MEXT,2012a,b,c)). Air sampling was carried out withapotable air sampler in the area from20 to60kmof theFukushima Dai-ichi Nuclear Power Plant (FNPP1);sampling time was about 20 min in every day.Although 131I, 132I, 134Cs, 136Cs, 137Cs, 132Te, 99mTc and140Baweredetected indust samples collected inMarch2011, dominant radionuclides were 131I, 134Cs and137Cs. The temporal variations of 131I and 137Cs areshown in Fig. 5.1. The highest total 131I concentrationin surface air (5.6 kBq/m3) occurred on 20March 2011at Hirono Town (23 km south of the FNPP1), whereasthe highest total 137Cs concentration in surface air(860 Bq/m3) was observed at Futaba Country (32 kmnorthwest of the FNPP1) on 21 March. The 131Iconcentration in surface air rapidly decreased,although high 131I concentrations were observed inearly May. After June 2011, the 131I concentrations insurface air were less than the detection limit (about0.8 Bq/m3). The 137Cs concentration in surface airdecreased in March 2011, however, it seems to beconstant in April andMay. Itmust be noted that actualtemporal variations of the 131I and 137Cs concentra-tions in surface air as well as precious radionuclidecompositions could not be obtained from the emer-gency monitoring because of a short sampling timeand high detection limits.
5.1.1.2 Source MonitoringSource monitoring, including activity concentra-
tions of radionuclides in stack and surface air, is themost important issue in the emergency situations(IAEA, 2005), as does the environmental monitoring.Tokyo Electric Power Company (TEPCO) measuredradioactivity in surface air at three points of theFDNPP site since March 19 2011. Air sampling wasperformed with the potable air sampler, consisting ofgas and particulate collectors, using amonitoring car;sampling time was about 20 min in every day. Thetemporal variations of 131I and 137Cs in surface air areshown in Fig. 5.2.
The highest total 131I concentration in surface air(5.94 kBq/m3) occurred on March 19, whereas thehighest total 137Cs concentration in surface air
1000
100
137 C
s co
ncen
tratio
n in
sur
face
air
(Bq/
m3 )
10
1
0.120 Mar 30 Mar 9 Apr 19 Apr
Date in 2011
29 Apr 9 May 19 May
(b)
10,000(a)
1000
100
10
1
0.120 Mar 30 9 Apr
Date in 2011
131 I c
once
ntra
tion
in s
urfa
ce a
ir (B
q/m
3 )
19 29 9 May
Figure 5.1 Temporal variations of 131I and 137Cs concentrations in surface air conducted byMEXT. Closed circles: Hirono Town (sampling period: 20e31 March), open circles: Iidate Village(sampling period: 20 Marche31 May), and closed squares: Futaba Country (21 March). (Data fromMEXT (2012a,b,c))
134 Chapter 5 FUKUSHIMA RADIOACTIVITY IMPACT
10,000
Rad
ionu
clid
e co
ncen
tratio
ns in
sur
face
air
(Bq/
m3 )
1000
100
10
1
0.1
0.013/11 4/18 5/26 7/3 8/10
I–131
Cs–134
Cs–137
9/17 10/25 12/2
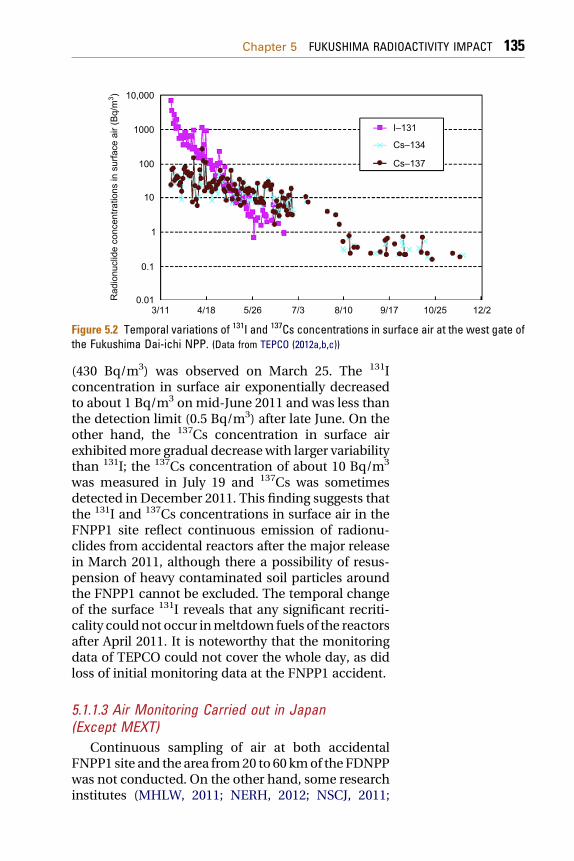
Figure 5.2 Temporal variations of 131I and 137Cs concentrations in surface air at the west gate ofthe Fukushima Dai-ichi NPP. (Data from TEPCO (2012a,b,c))
Chapter 5 FUKUSHIMA RADIOACTIVITY IMPACT 135
(430 Bq/m3) was observed on March 25. The 131Iconcentration in surface air exponentially decreasedto about 1 Bq/m3 onmid-June 2011 and was less thanthe detection limit (0.5 Bq/m3) after late June. On theother hand, the 137Cs concentration in surface airexhibitedmore gradual decreasewith larger variabilitythan 131I; the 137Cs concentration of about 10 Bq/m3
was measured in July 19 and 137Cs was sometimesdetected in December 2011. This finding suggests thatthe 131I and 137Cs concentrations in surface air in theFNPP1 site reflect continuous emission of radionu-clides from accidental reactors after the major releasein March 2011, although there a possibility of resus-pension of heavy contaminated soil particles aroundthe FNPP1 cannot be excluded. The temporal changeof the surface 131I reveals that any significant recriti-cality could not occur inmeltdown fuels of the reactorsafter April 2011. It is noteworthy that the monitoringdata of TEPCO could not cover the whole day, as didloss of initial monitoring data at the FNPP1 accident.
5.1.1.3 Air Monitoring Carried out in Japan(Except MEXT)
Continuous sampling of air at both accidentalFNPP1 site and the area from20 to 60 kmof the FDNPPwas not conducted. On the other hand, some researchinstitutes (MHLW, 2011; NERH, 2012; NSCJ, 2011;
136 Chapter 5 FUKUSHIMA RADIOACTIVITY IMPACT
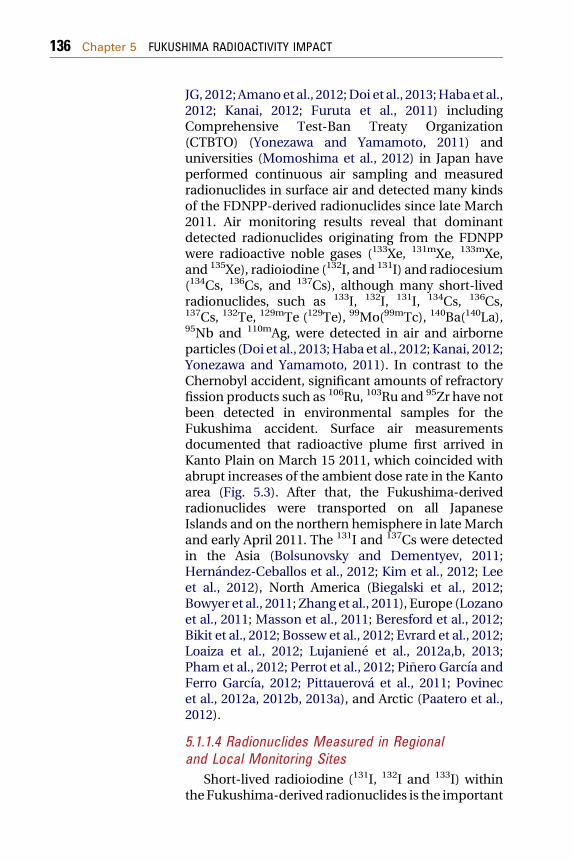
JG, 2012; Amanoet al., 2012;Doi et al., 2013;Habaet al.,2012; Kanai, 2012; Furuta et al., 2011) includingComprehensive Test-Ban Treaty Organization(CTBTO) (Yonezawa and Yamamoto, 2011) anduniversities (Momoshima et al., 2012) in Japan haveperformed continuous air sampling and measuredradionuclides in surface air and detected many kindsof the FDNPP-derived radionuclides since late March2011. Air monitoring results reveal that dominantdetected radionuclides originating from the FDNPPwere radioactive noble gases (133Xe, 131mXe, 133mXe,and 135Xe), radioiodine (132I, and 131I) and radiocesium(134Cs, 136Cs, and 137Cs), although many short-livedradionuclides, such as 133I, 132I, 131I, 134Cs, 136Cs,137Cs, 132Te, 129mTe (129Te), 99Mo(99mTc), 140Ba(140La),95Nb and 110mAg, were detected in air and airborneparticles (Doi et al., 2013;Habaet al., 2012; Kanai, 2012;Yonezawa and Yamamoto, 2011). In contrast to theChernobyl accident, significant amounts of refractoryfission products such as 106Ru, 103Ru and 95Zr have notbeen detected in environmental samples for theFukushima accident. Surface air measurementsdocumented that radioactive plume first arrived inKanto Plain on March 15 2011, which coincided withabrupt increases of the ambient dose rate in the Kantoarea (Fig. 5.3). After that, the Fukushima-derivedradionuclides were transported on all JapaneseIslands and on the northern hemisphere in late Marchand early April 2011. The 131I and 137Cs were detectedin the Asia (Bolsunovsky and Dementyev, 2011;Hernandez-Ceballos et al., 2012; Kim et al., 2012; Leeet al., 2012), North America (Biegalski et al., 2012;Bowyer et al., 2011; Zhang et al., 2011), Europe (Lozanoet al., 2011; Masson et al., 2011; Beresford et al., 2012;Bikit et al., 2012; Bossew et al., 2012; Evrard et al., 2012;Loaiza et al., 2012; Lujaniene et al., 2012a,b, 2013;Pham et al., 2012; Perrot et al., 2012; Pi�nero Garcıa andFerro Garcıa, 2012; Pittauerova et al., 2011; Povinecet al., 2012a, 2012b, 2013a), and Arctic (Paatero et al.,2012).
5.1.1.4 Radionuclides Measured in Regionaland Local Monitoring Sites
Short-lived radioiodine (131I, 132I and 133I) withintheFukushima-derived radionuclides is the important
100
10
1
0.1
0.0110 Mar 15 20 25 30 4 Apr 9 14 19
Date in 2011
Dos
e ra
te (S
v/h)
Figure 5.3 Ambient dose rates at Iidate (closed circles) and Fukushima City (open circles)Kitaibaraki (open square) observed by the Fukushima local government, and at Takahagi (closedsquares) observed by Ibaraki local government. Abrupt peaks of the ambient dose rate observedin Kitaibaraki and Takahagi on 15 March resulted in passage of the radioactive plume.
Chapter 5 FUKUSHIMA RADIOACTIVITY IMPACT 137
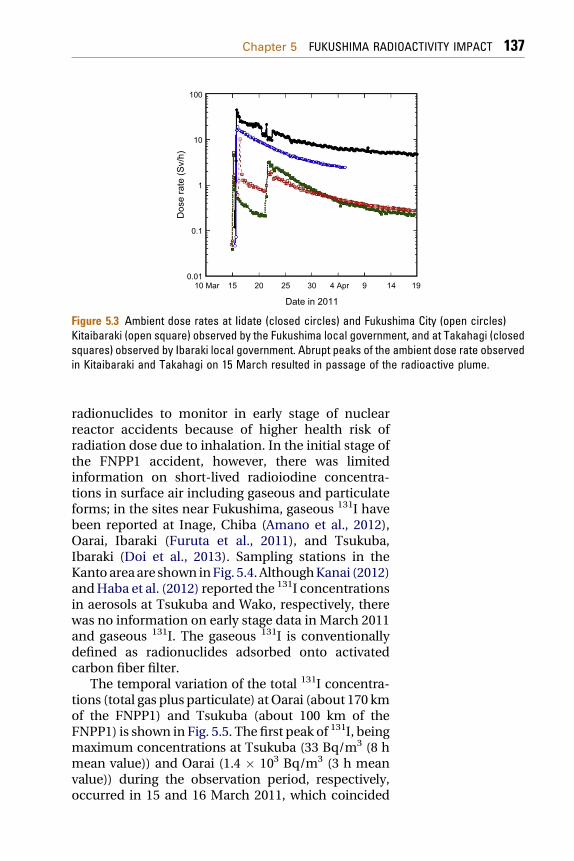
radionuclides to monitor in early stage of nuclearreactor accidents because of higher health risk ofradiation dose due to inhalation. In the initial stage ofthe FNPP1 accident, however, there was limitedinformation on short-lived radioiodine concentra-tions in surface air including gaseous and particulateforms; in the sites near Fukushima, gaseous 131I havebeen reported at Inage, Chiba (Amano et al., 2012),Oarai, Ibaraki (Furuta et al., 2011), and Tsukuba,Ibaraki (Doi et al., 2013). Sampling stations in theKantoareaare shown inFig. 5.4. AlthoughKanai (2012)andHaba et al. (2012) reported the 131I concentrationsin aerosols at Tsukuba and Wako, respectively, therewas no information on early stage data in March 2011and gaseous 131I. The gaseous 131I is conventionallydefined as radionuclides adsorbed onto activatedcarbon fiber filter.
The temporal variation of the total 131I concentra-tions (total gas plus particulate) atOarai (about 170 kmof the FNPP1) and Tsukuba (about 100 km of theFNPP1) is shown in Fig. 5.5. The first peak of 131I, beingmaximum concentrations at Tsukuba (33 Bq/m3 (8 hmean value)) and Oarai (1.4 � 103 Bq/m3 (3 h meanvalue)) during the observation period, respectively,occurred in 15 and 16 March 2011, which coincided
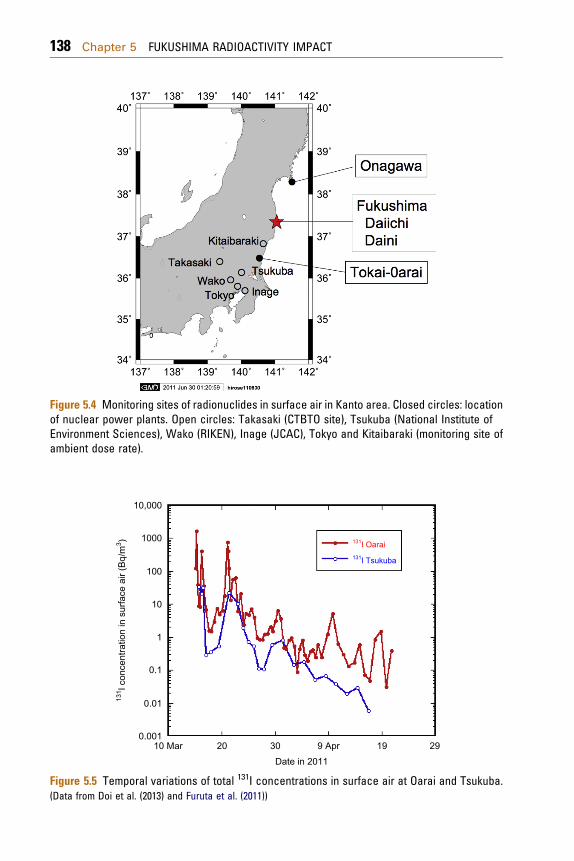
Figure 5.4 Monitoring sites of radionuclides in surface air in Kanto area. Closed circles: locationof nuclear power plants. Open circles: Takasaki (CTBTO site), Tsukuba (National Institute ofEnvironment Sciences), Wako (RIKEN), Inage (JCAC), Tokyo and Kitaibaraki (monitoring site ofambient dose rate).
10,000
1000
100
10
1
0.1
0.01
0.00110 Mar 20 30 9 Apr
Date in 2011
131I Oarai131I Tsukuba
131 I c
once
ntra
tion
in s
urfa
ce a
ir (B
q/m
3 )
19 29
Figure 5.5 Temporal variations of total 131I concentrations in surface air at Oarai and Tsukuba.(Data from Doi et al. (2013) and Furuta et al. (2011))
138 Chapter 5 FUKUSHIMA RADIOACTIVITY IMPACT
Chapter 5 FUKUSHIMA RADIOACTIVITY IMPACT 139
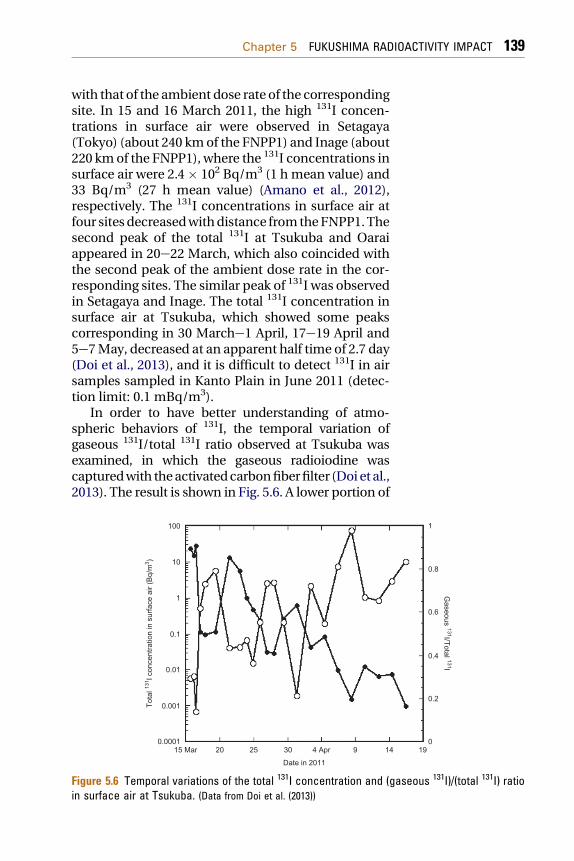
with that of the ambient dose rate of the correspondingsite. In 15 and 16 March 2011, the high 131I concen-trations in surface air were observed in Setagaya(Tokyo) (about 240 kmof the FNPP1) and Inage (about220 kmof the FNPP1), where the 131I concentrations insurface air were 2.4� 102 Bq/m3 (1 h mean value) and33 Bq/m3 (27 h mean value) (Amano et al., 2012),respectively. The 131I concentrations in surface air atfour sitesdecreasedwithdistance fromtheFNPP1.Thesecond peak of the total 131I at Tsukuba and Oaraiappeared in 20e22 March, which also coincided withthe second peak of the ambient dose rate in the cor-responding sites. The similar peak of 131I was observedin Setagaya and Inage. The total 131I concentration insurface air at Tsukuba, which showed some peakscorresponding in 30 Marche1 April, 17e19 April and5e7May, decreased at an apparent half time of 2.7 day(Doi et al., 2013), and it is difficult to detect 131I in airsamples sampled in Kanto Plain in June 2011 (detec-tion limit: 0.1 mBq/m3).
In order to have better understanding of atmo-spheric behaviors of 131I, the temporal variation ofgaseous 131I/total 131I ratio observed at Tsukuba wasexamined, in which the gaseous radioiodine wascapturedwith theactivatedcarbonfiberfilter (Doi et al.,2013). The result is shown in Fig. 5.6. A lower portion of
100
10
1
0.1
0.01
0.001
0.000115 Mar 20 25 30 4 Apr
Date in 2011
Tota
l 131 I c
once
ntra
tion
in s
urfa
ce a
ir (B
q/m
3 )
Gaseous 131I/Total 131I
9 14 190
0.2
0.4
0.6
0.8
1
Figure 5.6 Temporal variations of the total 131I concentration and (gaseous 131I)/(total 131I) ratioin surface air at Tsukuba. (Data from Doi et al. (2013))
140 Chapter 5 FUKUSHIMA RADIOACTIVITY IMPACT
the gaseous 131I almost corresponded to the peak of thetotal 131I concentration in surface air; the lowestpercentage of the gaseous 131I to the total 131I (13%)appeared in occurrence of the maximum total 131Iconcentration on 16 March. The percentage of thegaseous 131I to the total 131I in eachpeak increasedwithtime. The similar trend of increasing percentage of thegaseous 131I was observed in Oarai (Furuta et al., 2011).This finding suggests that as a possible process thegaseous 131I remained in the atmosphere longer thanthe particulate 131I, and as another possible process thegaseous 131Iwaspreferentially emitted intoatmospherecomparingwith theparticulate 131I due to changeof theradioactivity-released conditions in the accidentalreactors such as decline of temperature. Other possiblecause of increasing gaseous 131Imay be volatilization ofdeposited 131Idue tobiologicalprocesses (Amachiet al.,2001; Muramatsu and Yoshida, 1995).
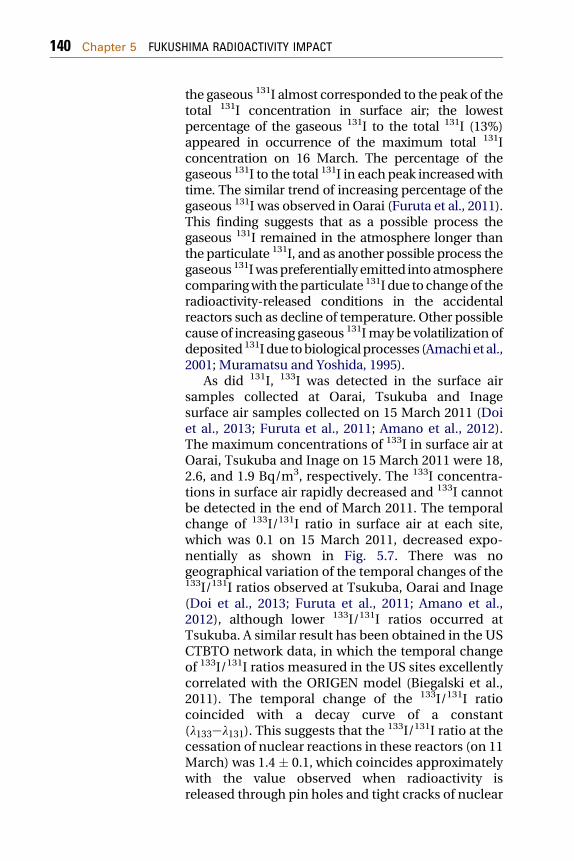
As did 131I, 133I was detected in the surface airsamples collected at Oarai, Tsukuba and Inagesurface air samples collected on 15 March 2011 (Doiet al., 2013; Furuta et al., 2011; Amano et al., 2012).The maximum concentrations of 133I in surface air atOarai, Tsukuba and Inage on 15 March 2011 were 18,2.6, and 1.9 Bq/m3, respectively. The 133I concentra-tions in surface air rapidly decreased and 133I cannotbe detected in the end of March 2011. The temporalchange of 133I/131I ratio in surface air at each site,which was 0.1 on 15 March 2011, decreased expo-nentially as shown in Fig. 5.7. There was nogeographical variation of the temporal changes of the133I/131I ratios observed at Tsukuba, Oarai and Inage(Doi et al., 2013; Furuta et al., 2011; Amano et al.,2012), although lower 133I/131I ratios occurred atTsukuba. A similar result has been obtained in the USCTBTO network data, in which the temporal changeof 133I/131I ratios measured in the US sites excellentlycorrelated with the ORIGEN model (Biegalski et al.,2011). The temporal change of the 133I/131I ratiocoincided with a decay curve of a constant(l133el131). This suggests that the
133I/131I ratio at thecessation of nuclear reactions in these reactors (on 11March) was 1.4 � 0.1, which coincides approximatelywith the value observed when radioactivity isreleased through pin holes and tight cracks of nuclear
1
0.1
0.01
133 I/13
1 I act
ivity
ratio
0.001
0.000115 Mar 16 17 18
Date in 201119 20 21 22
Figure 5.7 Temporal variations of 133I/131I activity ratios in surface air. Closed circles: Tsukuba,open circles: Inage, and closed squares: Oarai. (Data from Amano et al. (2012), Doi et al. (2013), andFuruta et al. (2011))
Chapter 5 FUKUSHIMA RADIOACTIVITY IMPACT 141
fuel rods in equilibrium with radioactivity inside thefuel cladding material (CPSMA, 1996).
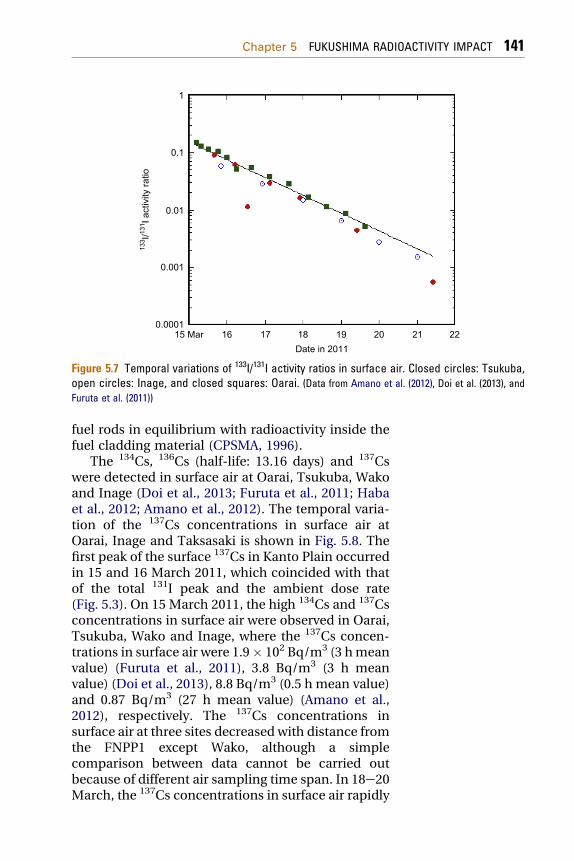
The 134Cs, 136Cs (half-life: 13.16 days) and 137Cswere detected in surface air at Oarai, Tsukuba, Wakoand Inage (Doi et al., 2013; Furuta et al., 2011; Habaet al., 2012; Amano et al., 2012). The temporal varia-tion of the 137Cs concentrations in surface air atOarai, Inage and Taksasaki is shown in Fig. 5.8. Thefirst peak of the surface 137Cs in Kanto Plain occurredin 15 and 16 March 2011, which coincided with thatof the total 131I peak and the ambient dose rate(Fig. 5.3). On 15 March 2011, the high 134Cs and 137Csconcentrations in surface air were observed in Oarai,Tsukuba, Wako and Inage, where the 137Cs concen-trations in surface air were 1.9� 102 Bq/m3 (3 hmeanvalue) (Furuta et al., 2011), 3.8 Bq/m3 (3 h meanvalue) (Doi et al., 2013), 8.8 Bq/m3 (0.5 h mean value)and 0.87 Bq/m3 (27 h mean value) (Amano et al.,2012), respectively. The 137Cs concentrations insurface air at three sites decreased with distance fromthe FNPP1 except Wako, although a simplecomparison between data cannot be carried outbecause of different air sampling time span. In 18e20March, the 137Cs concentrations in surface air rapidly
1000
100
10
1
137 C
s co
ncen
tratio
n in
sur
face
air
(Bq/
m3 )
0.1
0.01
0.001
0.000120 Mar 9 Apr 29 Apr
Date in 2011
19 May 8 June
Figure 5.8 Temporal variations of the 137Cs concentrations in surface air observed at Oarai(green squares), Tsukuba (closed circles) and Inage (open circles). (Data from Furuta et al. (2011),Doi et al. (2013), and Amano et al. (2012))
142 Chapter 5 FUKUSHIMA RADIOACTIVITY IMPACT
decreased to about three orders of magnitude lowerthan previous value in contrast of 131I. The secondpeak of the surface 137Cs in Kanto Plain appeared in20e22 March. The observed second peak concen-trations of 137Cs in surface air at Oarai, Tsukuba andInage were 160 Bq/m3 (9 h mean value), 4.6 Bq/m3
(48 h mean value) and 6.1 Bq/m3 (26 h mean value),respectively. The third peak of the surface 137Cs inKanto Plain appeared in 29e31 March. The observedthird peak concentrations of 137Cs in surface air atOarai, Tsukuba and Inage were 3.2 Bq/m3 (12 hmeanvalue), 0.23 Bq/m3 (48 h mean value) and 0.69 Bq/m3
(24 h mean value), respectively. After that, the 137Csconcentration in surface air in Kanto Plain graduallydecreased, although some 137Cs peaks occurred inAprileSeptember, and 137Cs can still be detected inair samples in early September 2011 (detection limit:0.05 mBq/m3). It is noteworthy that 134Cs and 137Csin surface air at Fukushima City have still beenobserved in the early 2012, whose concentrations
Chapter 5 FUKUSHIMA RADIOACTIVITY IMPACT 143
were 0.1 to several millibecquerel per cubic meter(MEXT, 2012a,b,c).
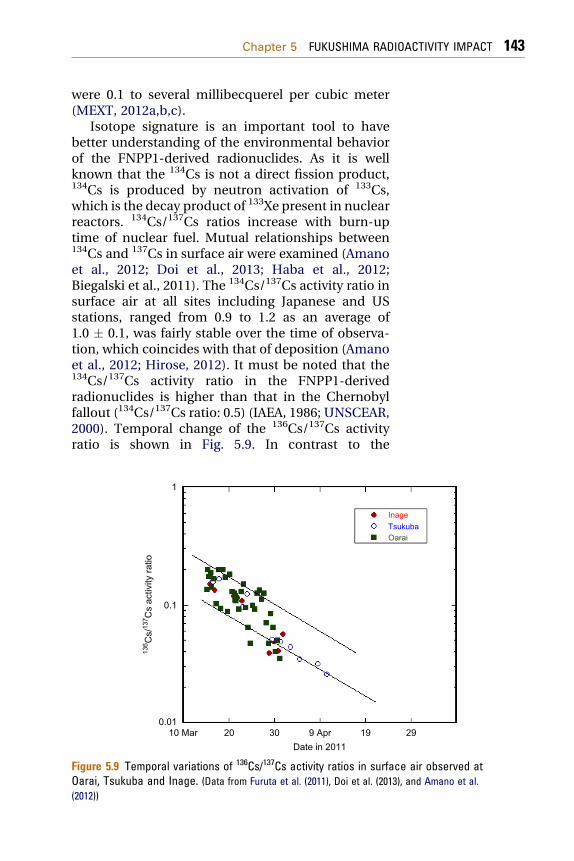
Isotope signature is an important tool to havebetter understanding of the environmental behaviorof the FNPP1-derived radionuclides. As it is wellknown that the 134Cs is not a direct fission product,134Cs is produced by neutron activation of 133Cs,which is the decay product of 133Xe present in nuclearreactors. 134Cs/137Cs ratios increase with burn-uptime of nuclear fuel. Mutual relationships between134Cs and 137Cs in surface air were examined (Amanoet al., 2012; Doi et al., 2013; Haba et al., 2012;Biegalski et al., 2011). The 134Cs/137Cs activity ratio insurface air at all sites including Japanese and USstations, ranged from 0.9 to 1.2 as an average of1.0 � 0.1, was fairly stable over the time of observa-tion, which coincides with that of deposition (Amanoet al., 2012; Hirose, 2012). It must be noted that the134Cs/137Cs activity ratio in the FNPP1-derivedradionuclides is higher than that in the Chernobylfallout (134Cs/137Cs ratio: 0.5) (IAEA, 1986; UNSCEAR,2000). Temporal change of the 136Cs/137Cs activityratio is shown in Fig. 5.9. In contrast to the
InageTsukubaOarai
1
0.1
136 C
s/13
7 Cs
activ
ity ra
tio
0.0110 Mar 20 30 9 Apr
Date in 201119 29
Figure 5.9 Temporal variations of 136Cs/137Cs activity ratios in surface air observed atOarai, Tsukuba and Inage. (Data from Furuta et al. (2011), Doi et al. (2013), and Amano et al.(2012))
144 Chapter 5 FUKUSHIMA RADIOACTIVITY IMPACT
134Cs/137Cs ratios, there was rather large variability ofthe 136Cs/137Cs ratio in surface air. The similardifferent nature of the 136Cs/137Cs ratio from the134Cs/137Cs ratio was observed in the US monitoringsites (Biegalski et al., 2011). Although the 136Cs/137Csratio decreased exponentially, the 136Cs/137Cs ratiosat three sites in Japan seem not to fit to a simpledecay curve of 136Cs; the 136Cs/137Cs ratios in lateMarcheApril 2011 were slightly lower than that in theperiod of the first and second peaks (15e22 March).The 136Cs/137Cs ratio was calculated to extrapolate atcease of reactors (11 March 2011) from the decaycurve of 136Cs. The initial 136Cs/137Cs ratio rangedfrom 0.09 to 0.27. These findings suggest that there isno isotopic fractionation between 134Cs and 137Cs,whereas the 136Cs/137Cs ratio may be changedbetween major emission and following minor emis-sion, although its cause is unknown. In this connec-tion, Biegalski et al. (2012) mentioned that excess137Cs could be present in the samples due to a releasefrom damaged fuel in the FNPP1 spent nuclear fuelpools, taking into account the fact that temporalchange of the 136Cs/137Cs ratios appear to be gener-ally below the ORIGEN model (ORNL, 2004). Al-though there is no report of the radioactivity releasefrom the FNPP1 spent nuclear fuel pools, a possibilityof radioactivity release from the spent fuel ponds(Units 2 and 3) could not be excluded (Chapter 3). Onthe other hand, it is noteworthy that determination of136Cs by gamma-spectrometry is rather complicatedin the initial stage because of interference of short-lived radionuclides.
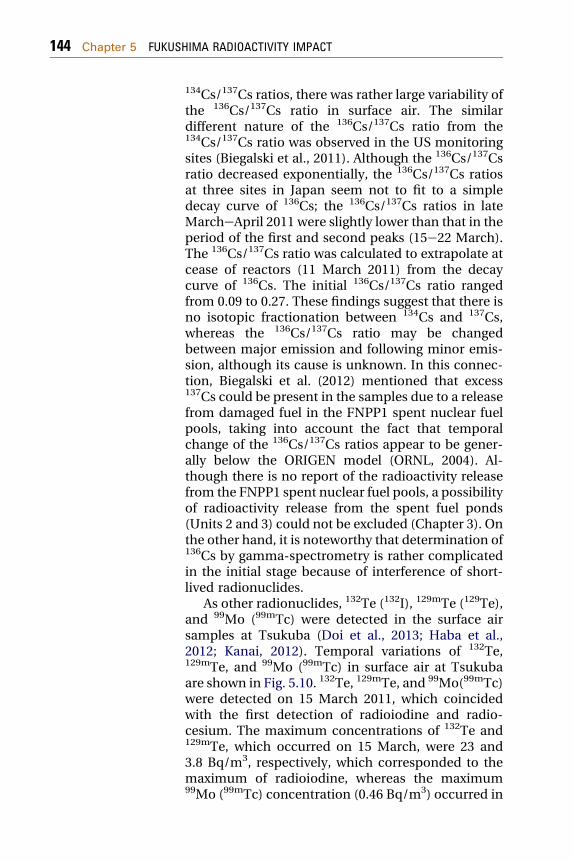
As other radionuclides, 132Te (132I), 129mTe (129Te),and 99Mo (99mTc) were detected in the surface airsamples at Tsukuba (Doi et al., 2013; Haba et al.,2012; Kanai, 2012). Temporal variations of 132Te,129mTe, and 99Mo (99mTc) in surface air at Tsukubaare shown in Fig. 5.10. 132Te, 129mTe, and 99Mo(99mTc)were detected on 15 March 2011, which coincidedwith the first detection of radioiodine and radio-cesium. The maximum concentrations of 132Te and129mTe, which occurred on 15 March, were 23 and3.8 Bq/m3, respectively, which corresponded to themaximum of radioiodine, whereas the maximum99Mo (99mTc) concentration (0.46 Bq/m3) occurred in
Figure 5.10 Temporal variations of 132Te, 129mTe and 99mTc concentrations in surface air atTsukuba. (Data from Doi et al. (2013))
Chapter 5 FUKUSHIMA RADIOACTIVITY IMPACT 145
20e22 March corresponding to the maximum ofradiocesium. The surface air concentrations of 132Te,129mTe, and 99Mo (99mTc) exhibited three majorpeaks, which corresponded with that of 131I and137Cs, and decreased to less than detection limit aftermid-April 2011.
In order to elucidate difference of atmosphericbehavior between radionuclides, mutual relation-ships between 132Te, 129mTe, and 99Mo (99mTc) wereexamined, in which activity concentrations of short-lived radionuclides were corrected radioactivedecay on 11 March 2011 (Doi et al., 2013). Thedecay-corrected 132Te concentration in surface airwell correlated with that of the decay-corrected129mTe, in which the 129mTe/132Te ratio was0.086 � 0.005. It is noteworthy that PMJC (2011)documented the 129mTe/132Te ratio of 0.04. The ratiosof the decay-corrected 132Te, decay-corrected 129mTe,and decay-corrected 99mTc concentrations to the137Cs concentration in surface air were calculated.The decay-corrected 132Te/137Cs and 129mTe/137Csratios were in the ranges of 4e65 and 0.3e5.4,respectively. Peaks of the decay-corrected132Te/137Cs and 129mTe/137Cs ratios appeared in
146 Chapter 5 FUKUSHIMA RADIOACTIVITY IMPACT
22e23 March after occurrence of the maximumconcentrations of 137Cs in 20e22 March. There wasrather large variation of 132Te/137Cs and 129mTe/137Csratios, suggesting that atmospheric behavior ofradiotellurium differed from that of the radiocesium.The decay-corrected 99Mo (99mTc)/137Cs, rangingfrom 0.16 to 22, showed larger variation than that ofthe decay-corrected 132Te/137Cs and 129mTe/137Cs.The decay-corrected 99Mo (99mTc)/137Cs increasedwith time. These findings suggest that the atmo-spheric behavior of 99Mo (99mTc) was significantlydifferent from that of 137Cs and 132Te.
Atmospheric behaviors of the Fukushima-derived radionuclides depend on physical andchemical properties of radionuclide-bearing parti-cles. Particle size distributions of the Fukishima-derived radionuclide-bearing particles collected atTsukuba were determined during the periods of4e11 April and 14e21 April 2011 (Doi et al., 2013)and 29 Aprile12 May and 12e26 May 2011(Kaneyasu et al., 2012). The activity median aero-dynamic diameters (AMAD) of 131I-bearing particleswere calculated to be 0.7 and 0.7 mm in 4e11 April2011 and in 14e21 April 2011, respectively, whereasthe AMADs of 134Cs and 137Cs-bearing particleswere 1.8 and 1.5 mm in 4e11 April 2011, and 1.0and 1.0 mm in 14e21 April 2011, respectively.Measurements of the particle-size distributions ofradiocesium-bearing particles in May (Kaneyasuet al., 2012) revealed that 137Cs as did 134Cs attachedon submicrometer particles, typically sulfate parti-cles. These findings suggest that the particle size ofthe 131I-bearing particles differed from those ofradiocesium, which implies that the dispersionand deposition behaviors of 131I differed from thatof 134Cs and 137Cs and that the particle size of theradiocesium-bearing particles varied with time. Theresult reveals that the FNPP1-derived 134Cs and137Cs-bearing particles observed in April 2011 werelarger than that of the Chernobyl 137Cs found inremote sites, which existed as submicrometerparticles observed in Japan (Aoyama et al., 1992).This finding suggests that the Fukushima-derivedradiocesium observed in April was preferentiallyremoved from atmosphere by dry and wet
Chapter 5 FUKUSHIMA RADIOACTIVITY IMPACT 147
deposition processes, and that as a result, theFukushima-derived radiocesium observed in May,existing as submicrometer particles, remained inthe atmosphere (Aoyama et al., 1992; Hirose et al.,1993; Hirose, 1995). Paatero et al. (2012) estimatedthat a significant part of the Fukushima-derivedradioactivity is in hot particles from autoradiogramof a filter sample from 1 to 4 April 2011 at Mt.Zeppelin, Ny-Alesund, Svalbard. It must be notedthat there is no information about particle size ofradionuclide-bearing particles in major radioactiveplume occurring in the late March 2011.
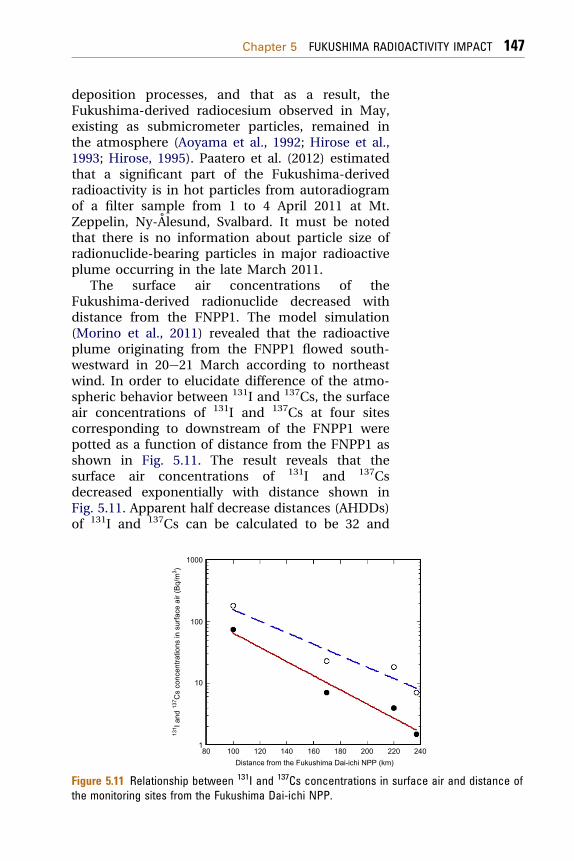
The surface air concentrations of theFukushima-derived radionuclide decreased withdistance from the FNPP1. The model simulation(Morino et al., 2011) revealed that the radioactiveplume originating from the FNPP1 flowed south-westward in 20e21 March according to northeastwind. In order to elucidate difference of the atmo-spheric behavior between 131I and 137Cs, the surfaceair concentrations of 131I and 137Cs at four sitescorresponding to downstream of the FNPP1 werepotted as a function of distance from the FNPP1 asshown in Fig. 5.11. The result reveals that thesurface air concentrations of 131I and 137Csdecreased exponentially with distance shown inFig. 5.11. Apparent half decrease distances (AHDDs)of 131I and 137Cs can be calculated to be 32 and
1000
131 I a
nd 13
7 Cs
conc
entra
tions
in s
urfa
ce a
ir (B
q/m
3 )
100
10
180 100 120 140
Distance from the Fukushima Dai-ichi NPP (km)160 180 200 220 240
Figure 5.11 Relationship between 131I and 137Cs concentrations in surface air and distance ofthe monitoring sites from the Fukushima Dai-ichi NPP.
10(a)
1
131 I c
once
ntra
tion
in s
urfa
ce a
ir (m
Bq/m
3 )
0.1
0.01
0.00110
(b) 10
137 C
s co
ncen
tratio
n in
sur
face
air
(mBq
/m3 )
0.1
1
0.0110
Figure 5.12 Temporal variatFukuoka and closed circles
148 Chapter 5 FUKUSHIMA RADIOACTIVITY IMPACT
26 km from the fitting curves, respectively. TheAHDD of 131I is longer than that of 137Cs, whichimplies that 137Cs emitted from the FNPP1 is easilyremoved from atmosphere comparing with 131I.
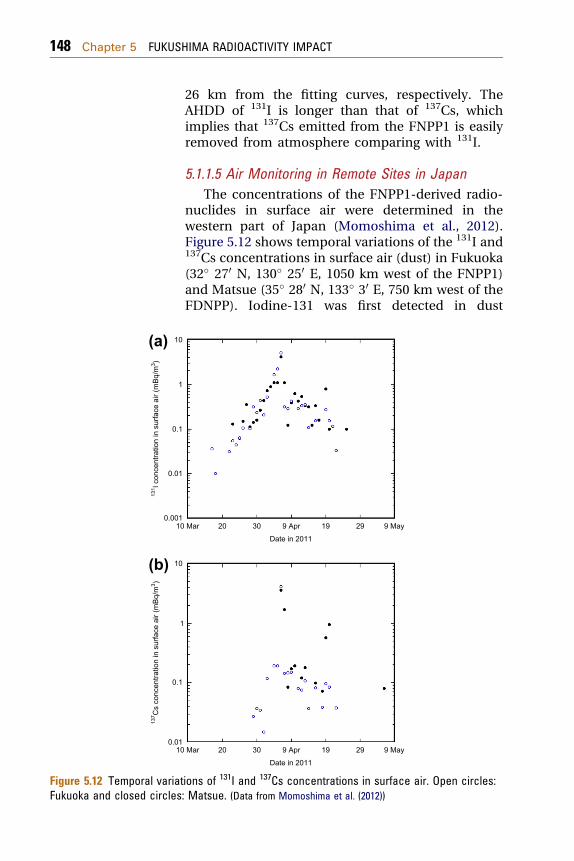
5.1.1.5 Air Monitoring in Remote Sites in JapanThe concentrations of the FNPP1-derived radio-
nuclides in surface air were determined in thewestern part of Japan (Momoshima et al., 2012).Figure 5.12 shows temporal variations of the 131I and137Cs concentrations in surface air (dust) in Fukuoka(32� 270 N, 130� 250 E, 1050 km west of the FNPP1)and Matsue (35� 280 N, 133� 30 E, 750 km west of theFDNPP). Iodine-131 was first detected in dust
Mar 20 30 9 Apr
Date in 2011
19 29 9 May
Mar 20 30 9 Apr
Date in 2011
19 29 9 May
ions of 131I and 137Cs concentrations in surface air. Open circles:: Matsue. (Data from Momoshima et al. (2012))
Chapter 5 FUKUSHIMA RADIOACTIVITY IMPACT 149
samples on 17 March 2011 at Fukuoka, although itslevel was very low (0.036 mBq/m3) in contrast of thestations in Kanto Plain. At Fukuoka and Matsue, the131I concentrations in surface air exponentiallyincreased and reached a maximum on 6 April. Afteroccurrence of a first peak, the 131I concentration insurface air decreased. On 20 April, a weak secondpeak of the surface 131I occurred, in which the secondpeak was more remarkable at Matsue. After that, the131I concentration decreased and was less thandetection limit until end of April.
Cesium-137 was first detected in dust samples on29March 2011 at Fukuoka, although its level was verylow (0.027 mBq/m3) as did 131I. At Fukuoka, the 137Csconcentrations in surface air rapidly increased andreached a maximum on 6 April, when coincided withthe maximum of 131I. After occurrence of a peak, the137Cs concentration in surface air in Fukuokadecreased and was less than the detection limit untilthe end of April, whereas a marked second peakappeared on 20 April. A similar peak of the 137Csconcentrations in surface air was observed in SouthKorea (Busan; 35� 270 N, 129� 060 E) and NorthTaiwan (Pengchiayu Islet; 25� 370 1200 N, 122� 40 1200 E)on 7 April (Huh et al., 2012; Kim et al., 2012).
5.1.2 Dry Deposition and Precipitation
5.1.2.1 Daily Deposition at Local and Regional StationsMeasurements of radionuclides in daily deposi-tion samples, which include wet and dry depositions,started on 18 March as emergency monitoring atJapanese Government monitoring stations (MEXT,2012a,b,c). Daily radioactive deposition rates in 44stations in Japan were recorded until the end of 2011.High radioactive deposition derived from the FNPP1accident occurred in a wide area of Kanto Plain andSouth Tohoku from 21e23 March 2011. On the otherhand, the record of the ambient dose rate in the area(Fukushima Prefecture) adjacent to the FNPP1(Fig. 5.3) suggests that high radioactive depositionoccurred in 15e16 March accompanied withsnowfall, although there was no measurement of thedaily radioactivity deposition during the period ofMarch 2011.
1,00,000(a)
80,000
60,000D
aily
131 I d
epos
ition
(Bq/
m2 )
40,000
20,000
010 Mar 20 30
Date in 20119 Apr 19
(b) 14,000
12,000
10,000
Dai
ly 13
7 Cs
depo
sitio
n (B
q/m
2 )
8000
6000
4000
2000
010 Mar 20 30
Date in 20119 Apr 19 29
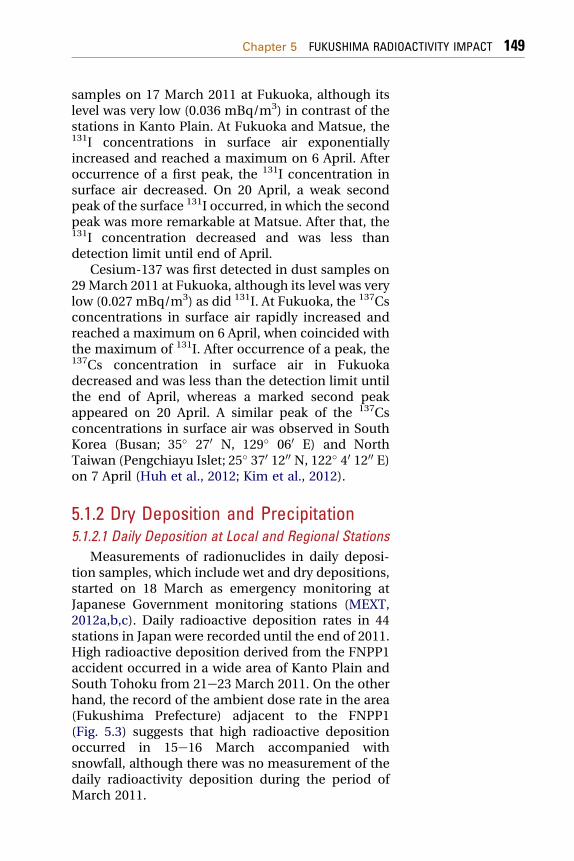
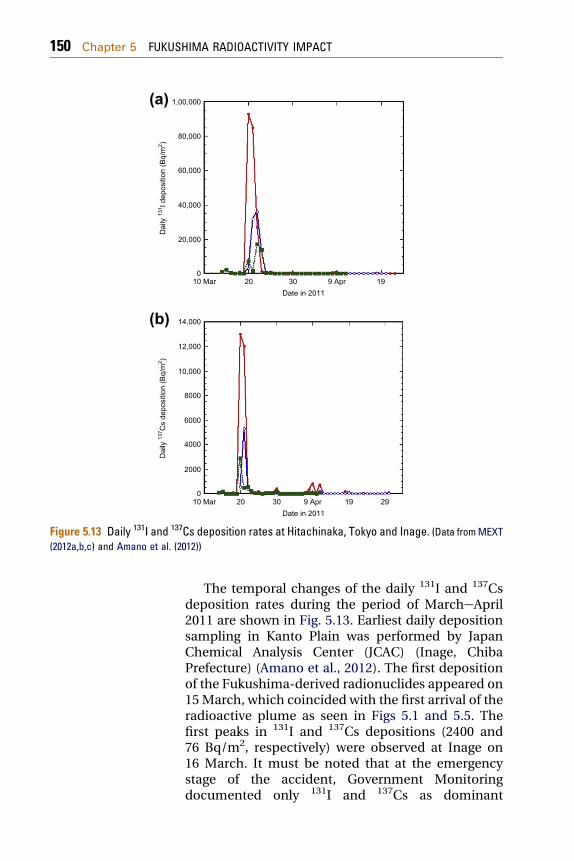
Figure 5.13 Daily 131I and 137Cs deposition rates at Hitachinaka, Tokyo and Inage. (Data fromMEXT(2012a,b,c) and Amano et al. (2012))
150 Chapter 5 FUKUSHIMA RADIOACTIVITY IMPACT
The temporal changes of the daily 131I and 137Csdeposition rates during the period of MarcheApril2011 are shown in Fig. 5.13. Earliest daily depositionsampling in Kanto Plain was performed by JapanChemical Analysis Center (JCAC) (Inage, ChibaPrefecture) (Amano et al., 2012). The first depositionof the Fukushima-derived radionuclides appeared on15March, which coincided with the first arrival of theradioactive plume as seen in Figs 5.1 and 5.5. Thefirst peaks in 131I and 137Cs depositions (2400 and76 Bq/m2, respectively) were observed at Inage on16 March. It must be noted that at the emergencystage of the accident, Government Monitoringdocumented only 131I and 137Cs as dominant
Chapter 5 FUKUSHIMA RADIOACTIVITY IMPACT 151
radionuclides in deposition samples from the FDNPPaccident by MEXT (MEXT, 2012a,b,c). On 20March, the level of 131I, a dominant radionuclide, atHitachinaka (36.40� N, 140.54� E), which is locatedabout 120 km south of the FNPP1, was 91 kBq/m2 dayas a maximum value, and 137Cs deposition atHitachinaka was 13 kBq/m2 day.
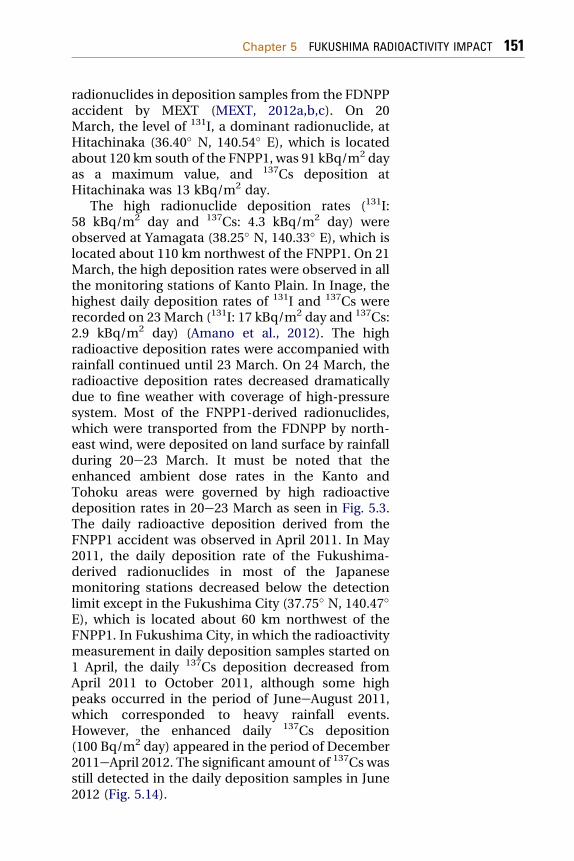
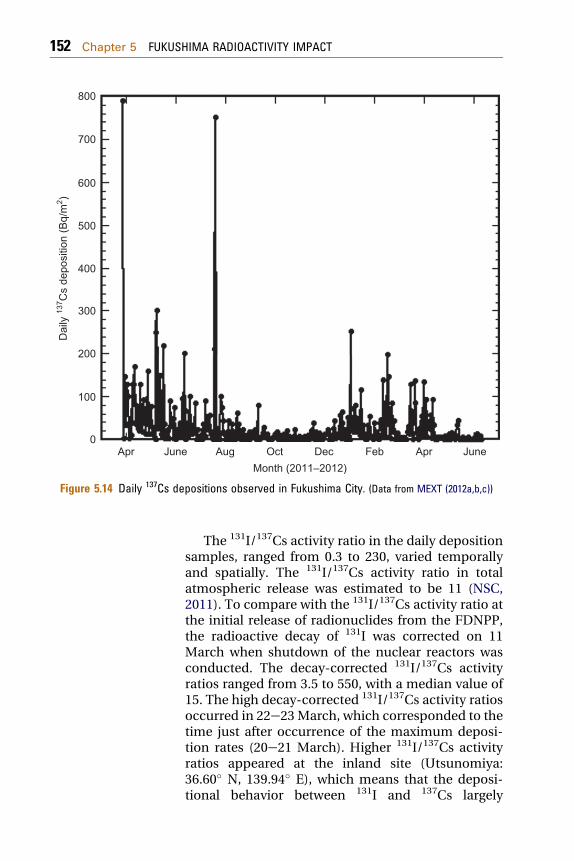
The high radionuclide deposition rates (131I:58 kBq/m2 day and 137Cs: 4.3 kBq/m2 day) wereobserved at Yamagata (38.25� N, 140.33� E), which islocated about 110 km northwest of the FNPP1. On 21March, the high deposition rates were observed in allthe monitoring stations of Kanto Plain. In Inage, thehighest daily deposition rates of 131I and 137Cs wererecorded on 23 March (131I: 17 kBq/m2 day and 137Cs:2.9 kBq/m2 day) (Amano et al., 2012). The highradioactive deposition rates were accompanied withrainfall continued until 23 March. On 24 March, theradioactive deposition rates decreased dramaticallydue to fine weather with coverage of high-pressuresystem. Most of the FNPP1-derived radionuclides,which were transported from the FDNPP by north-east wind, were deposited on land surface by rainfallduring 20e23 March. It must be noted that theenhanced ambient dose rates in the Kanto andTohoku areas were governed by high radioactivedeposition rates in 20e23 March as seen in Fig. 5.3.The daily radioactive deposition derived from theFNPP1 accident was observed in April 2011. In May2011, the daily deposition rate of the Fukushima-derived radionuclides in most of the Japanesemonitoring stations decreased below the detectionlimit except in the Fukushima City (37.75� N, 140.47�E), which is located about 60 km northwest of theFNPP1. In Fukushima City, in which the radioactivitymeasurement in daily deposition samples started on1 April, the daily 137Cs deposition decreased fromApril 2011 to October 2011, although some highpeaks occurred in the period of JuneeAugust 2011,which corresponded to heavy rainfall events.However, the enhanced daily 137Cs deposition(100 Bq/m2 day) appeared in the period of December2011eApril 2012. The significant amount of 137Cs wasstill detected in the daily deposition samples in June2012 (Fig. 5.14).
Apr
800
700
600
500
400
300
Dai
ly 13
7 Cs
depo
sitio
n (B
q/m
2 )
200
100
0June Aug Oct
Month (2011–2012)Dec Feb Apr June
Figure 5.14 Daily 137Cs depositions observed in Fukushima City. (Data from MEXT (2012a,b,c))
152 Chapter 5 FUKUSHIMA RADIOACTIVITY IMPACT
The 131I/137Cs activity ratio in the daily depositionsamples, ranged from 0.3 to 230, varied temporallyand spatially. The 131I/137Cs activity ratio in totalatmospheric release was estimated to be 11 (NSC,2011). To compare with the 131I/137Cs activity ratio atthe initial release of radionuclides from the FDNPP,the radioactive decay of 131I was corrected on 11March when shutdown of the nuclear reactors wasconducted. The decay-corrected 131I/137Cs activityratios ranged from 3.5 to 550, with a median value of15. The high decay-corrected 131I/137Cs activity ratiosoccurred in 22e23March, which corresponded to thetime just after occurrence of the maximum deposi-tion rates (20e21 March). Higher 131I/137Cs activityratios appeared at the inland site (Utsunomiya:36.60� N, 139.94� E), which means that the deposi-tional behavior between 131I and 137Cs largely
Chapter 5 FUKUSHIMA RADIOACTIVITY IMPACT 153
differed from each other. The 134Cs/137Cs activityratios in the daily deposition samples (¼1.0) wereconstant (Amano et al., 2012).
5.1.2.2 Spatial Distributions of Monthly DepositionEnvironmental Monitoring Centers in Local
Governments have determined the Fukushima-derived radionuclides in monthly depositionsamples. 131I, 134Cs and 137Cs were measured asdominant radionuclides in the monthly depositionsamples in Japan, whereas 129mTe, 129Te, 136Cs,110mAg, 95Zr, 95Nb (half-life: 35 days), 140Ba and 140La(half-life: 1.68 days) were detected as minor radio-nuclides in the monthly deposition samples at themonitoring stations within 300 km of the FNPP1. Forthe monthly deposition, long-lived radionuclides(134Cs, 137Cs and 110mAg) are meaningful because themonthly deposition rates of the short-lived radionu-clides are not well defined. Activity ratios of134Cs/137Cs observed on March, ranged from 1.0 to1.1 as an average of 1.03, were constant in caseswhere the monthly 137Cs deposition exceeded100 Bq/m2. The 134Cs/137Cs activity ratios on Apriland May at MEXT monitoring sites were from 0.99 to1.09 with an average of 1.03 and from 0.93 to 1.04with an average of 0.99, respectively. The resultsuggests that there were no spatial and temporalvariations of the 134Cs/137Cs activity ratios in themonthly deposition samples during the period fromMarch to May 2011. Activity ratios of 110mAg/137Csobserved on March ranged from 0.0009 to 0.006 as anaverage of 0.0019.
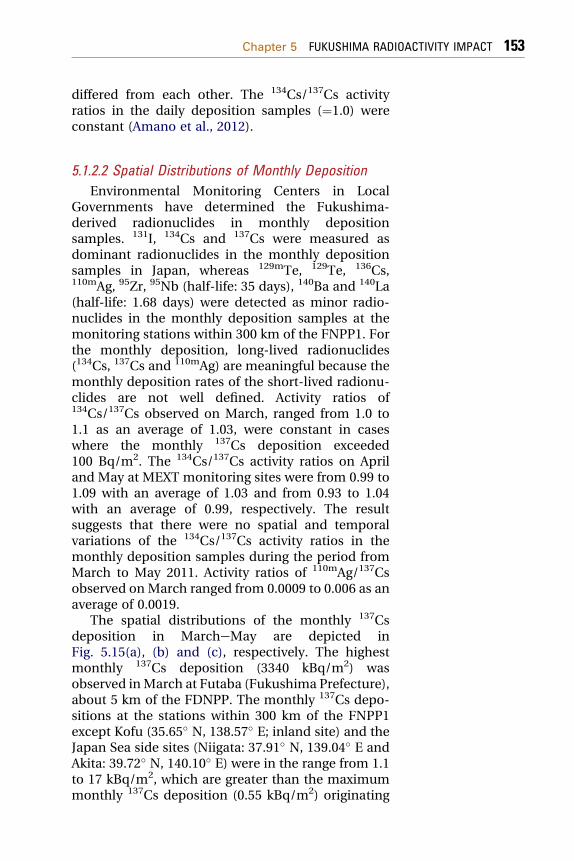
The spatial distributions of the monthly 137Csdeposition in MarcheMay are depicted inFig. 5.15(a), (b) and (c), respectively. The highestmonthly 137Cs deposition (3340 kBq/m2) wasobserved inMarch at Futaba (Fukushima Prefecture),about 5 km of the FDNPP. The monthly 137Cs depo-sitions at the stations within 300 km of the FNPP1except Kofu (35.65� N, 138.57� E; inland site) and theJapan Sea side sites (Niigata: 37.91� N, 139.04� E andAkita: 39.72� N, 140.10� E) were in the range from 1.1to 17 kBq/m2, which are greater than the maximummonthly 137Cs deposition (0.55 kBq/m2) originating
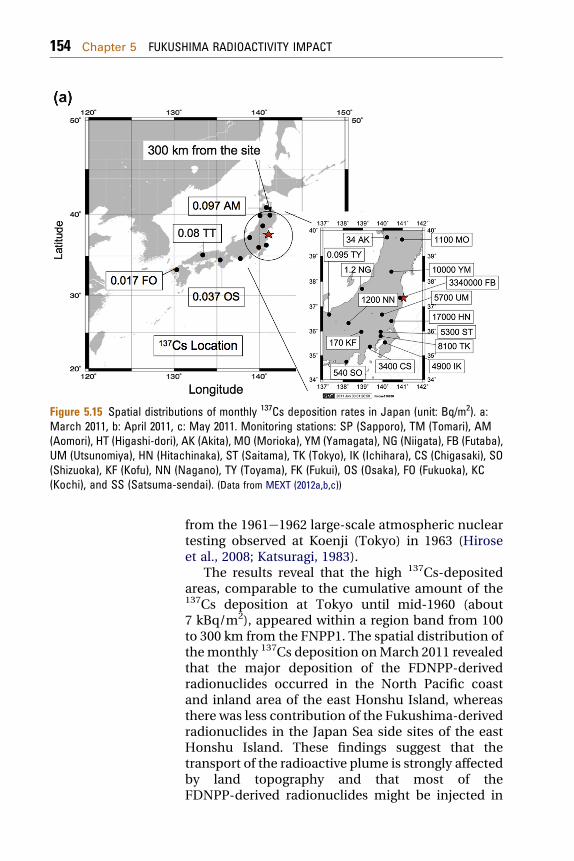
Figure 5.15 Spatial distributions of monthly 137Cs deposition rates in Japan (unit: Bq/m2). a:March 2011, b: April 2011, c: May 2011. Monitoring stations: SP (Sapporo), TM (Tomari), AM(Aomori), HT (Higashi-dori), AK (Akita), MO (Morioka), YM (Yamagata), NG (Niigata), FB (Futaba),UM (Utsunomiya), HN (Hitachinaka), ST (Saitama), TK (Tokyo), IK (Ichihara), CS (Chigasaki), SO(Shizuoka), KF (Kofu), NN (Nagano), TY (Toyama), FK (Fukui), OS (Osaka), FO (Fukuoka), KC(Kochi), and SS (Satsuma-sendai). (Data from MEXT (2012a,b,c))
154 Chapter 5 FUKUSHIMA RADIOACTIVITY IMPACT
from the 1961e1962 large-scale atmospheric nucleartesting observed at Koenji (Tokyo) in 1963 (Hiroseet al., 2008; Katsuragi, 1983).
The results reveal that the high 137Cs-depositedareas, comparable to the cumulative amount of the137Cs deposition at Tokyo until mid-1960 (about7 kBq/m2), appeared within a region band from 100to 300 km from the FNPP1. The spatial distribution ofthemonthly 137Cs deposition onMarch 2011 revealedthat the major deposition of the FDNPP-derivedradionuclides occurred in the North Pacific coastand inland area of the east Honshu Island, whereasthere was less contribution of the Fukushima-derivedradionuclides in the Japan Sea side sites of the eastHonshu Island. These findings suggest that thetransport of the radioactive plume is strongly affectedby land topography and that most of theFDNPP-derived radionuclides might be injected in
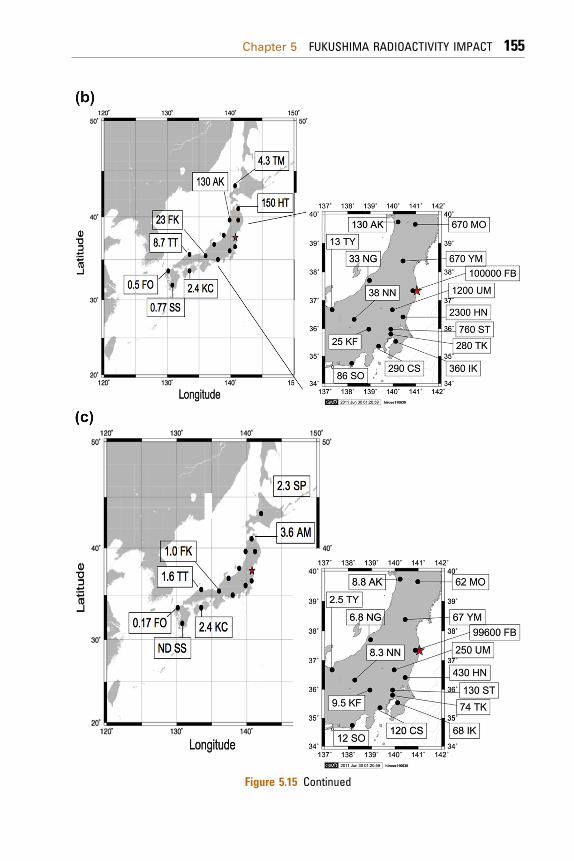
Figure 5.15 Continued
Chapter 5 FUKUSHIMA RADIOACTIVITY IMPACT 155
156 Chapter 5 FUKUSHIMA RADIOACTIVITY IMPACT
the boundary layer (about 1000m). Model simulation(Morino et al., 2011) revealed that land topographycontrols the transport of the Fukushima-derivedradioactive plume.
The highermonthly 137Cs deposition (0.17 Bq/m2),which was one order of magnitude higher than pre-Fukushima levels (Hirose et al., 2008; Igarashi et al.,2003, 2005), was observed on March at Fukuoka(33.51� N, 130.50� E) and Uruma (26.31� N, 127.90� E,Okinawa), which are located about 1050 and 1750 kmsouthwest apart from the FDNPP, respectively.Detection of 131I and 134Cs in the same samplerevealed that the FDNPP-derived radionuclides weretransported to Fukuoka and Uruma in the lateMarch,which is consistent with the results of the Fukushima-derived radionuclides in surface air (Momoshimaet al., 2012). The highest monthly deposition rates ofradiocesium occurred at Fukuoka and Uruma in April2011; the monthly 137Cs depositions at Fukuoka andUruma were 0.5 and 3.7 Bq/m2, respectively. It mustbe noted that the 137Cs deposition at Uruma is higherthan that at Fukuoka. Model simulation (Takemuraet al., 2011) suggested that the FDNPP-derivedradioactivity plume spread far eastern Siberia on 24March 2011. Another model simulation (Huh et al.,2012) revealed that the FDNPP-derived radioactiveplume was predominantly transported toward thesouthwest under phases of northern-easterly windsin the first week of April (6e7). It is likely thatthe Fukushima-derived radionuclides observed atFukuoka and Uruma were transported via the eastSiberia or the North Pacific southwest of HonshuIslands rather than the round globe.
In April, higher monthly 137Cs depositions wereobserved at the North Pacific side stations and EastJapan inland stations, although its levels decreasedmarkedly. This suggests that the atmospheric emis-sion of radionuclides from the FNPP1 at leastcontinued within April 2011, although the releaserate of radioactive materials dramatically decreased.On the other hand, the monthly 137Cs depositionincreased at southwest sites in Japan and at the JapanSea side sites comparing with that in March, sug-gesting that the Fukushima-derived radioactivecloud dominantly affected north part of the Northern
Chapter 5 FUKUSHIMA RADIOACTIVITY IMPACT 157
Hemisphere atmosphere. In May, the monthly 137Csdepositions decreased at all the monitoring stationsof Japan (Fig. 5.15(c)), although the higher 137Csdepositions were observed within 300 km of theFNPP1. In August, the monthly 137Cs depositions atmany monitoring stations in southwest Japandecreased below detection limit.
5.1.2.3 Temporal Variations of the Fukushima-DerivedRadionuclides
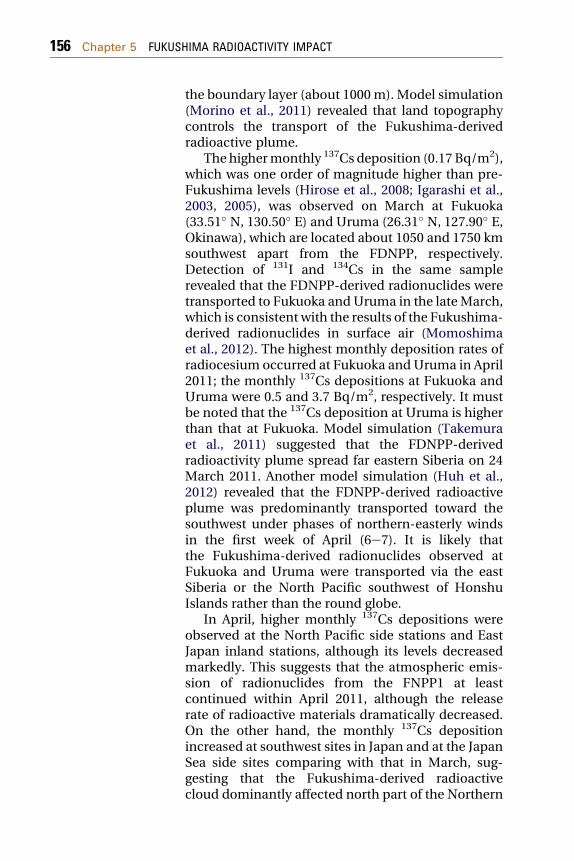
In order to elucidate the depositional behavior ofthe Fukushima-derived radionuclides, it is importantto examine the temporal variationof themonthly 137Csdeposition in each monitoring station. The monthly137Cs deposition at the sites within 300 km of theFNPP1 except Futaba (Fukushima) exhibited expo-nential decreases during the period of MarcheJune asshown in Fig. 5.16. Apparent half-lives of theFukushima-derived atmospheric 137Cs ranged from8.8 days for Tokyo to 14 days for Morioka (39.70� N,141.16� E) (Hirose et al., 2012). The Chernobyl-derived137Cs in surface air observed at Chilton, Gibraltar,Tromso andHong Kong declined a half-life of 6.3 days
100,000
10,000
1000
100
10
1Feb Mar Apr May June July
Month (2011)
Mon
thly
137 C
s de
posi
tion
(Bq/
m2 )
Figure 5.16 Temporal variations of monthly 137Cs deposition rates. Closed circles: Tokyo,open circles: Hitachinaka, closed squares: Maebashi, and open squares: Morioka, rhombics:Utsunomiya. (Data from MEXT (2012a,b,c))
158 Chapter 5 FUKUSHIMA RADIOACTIVITY IMPACT
during 2 months after the Chernobyl accident(Chamberlain, 1991).
The apparent atmospheric half-life of theFukushima-derived 137Cs is similar to the atmo-spheric half-residence time (8 days) estimated for210Pb over the west central United States, based onthe radioactive equilibrium of 210Pb with its short-lived progenies (Moore et al., 1973). Lambert et al.(1982) estimated a global mean aerosol half-residencetime of 6.5 days by using atmospheric inventories of222Rn and 210Pb extrapolated from observations andcomputing the 210Pb deposition sink to balance 222Rndecay. The half-residence times of troposphericaerosols inferred from a global three-dimensionalsimulation of 210Pb were 5e10 days, which dependson season and latitude (Balkanski et al., 1993). On theother hand, longer troposphere residence time ofaerosols (about 30 days) was obtained from radioac-tive debris of atmospheric nuclear explosions(Katsuragi, 1983). A similar long residence time wasestimated for the Chernobyl 137Cs (25 days) (Aoyama,1988), which was emitted as submicrometer particles(Hirose, 1995). The residence times of aerosols introposphere, which are in the range of 5e30 days,have been determined by natural and anthropogenicradionuclides, which depend on particles size andaltitude (Ehhalt, 1973). The shorter half-life of theFukushima-derived radionuclides suggests thatmost of the Fukushima-derived radionuclides wereinjected into the lower layer of the troposphereand/or emitted as larger particles in the atmosphere.As another possible process, the apparent half-lifemay partly reflect a time course of the atmosphericemission because the radioactive emission from theFNPP1 continued still now (the end of 2011) althoughthe emission rate of radioactivity dramaticallydecreased (TEPCO, 2011a,b).
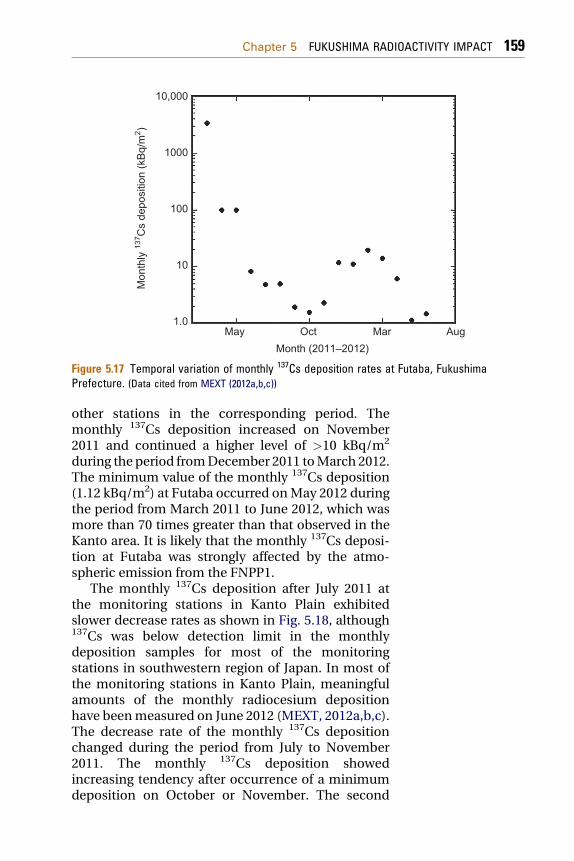
In Futaba, the monthly 137Cs deposition showeddifferent deposition history from other monitoringstations as shown in Fig. 5.17. After the record of thehighest monthly deposition (3.34 MBq/m2) on March2011, rapid decrease of the monthly 137Cs depositionoccurred on April, after that, the 137Cs monthly depo-sition decreased until October 2011. The decrease rateof themonthly 137Csdepositionwasslower than thatof
10,000
1000
100
10
1.0Mar AugMay Oct
Month (2011–2012)
Mon
thly
137 C
s de
posi
tion
(kBq
/m2 )
Figure 5.17 Temporal variation of monthly 137Cs deposition rates at Futaba, FukushimaPrefecture. (Data cited from MEXT (2012a,b,c))
Chapter 5 FUKUSHIMA RADIOACTIVITY IMPACT 159
other stations in the corresponding period. Themonthly 137Cs deposition increased on November2011 and continued a higher level of >10 kBq/m2
during the period fromDecember 2011 toMarch 2012.The minimum value of the monthly 137Cs deposition(1.12 kBq/m2) at Futaba occurred onMay 2012 duringthe period from March 2011 to June 2012, which wasmore than 70 times greater than that observed in theKanto area. It is likely that the monthly 137Cs deposi-tion at Futaba was strongly affected by the atmo-spheric emission from the FNPP1.
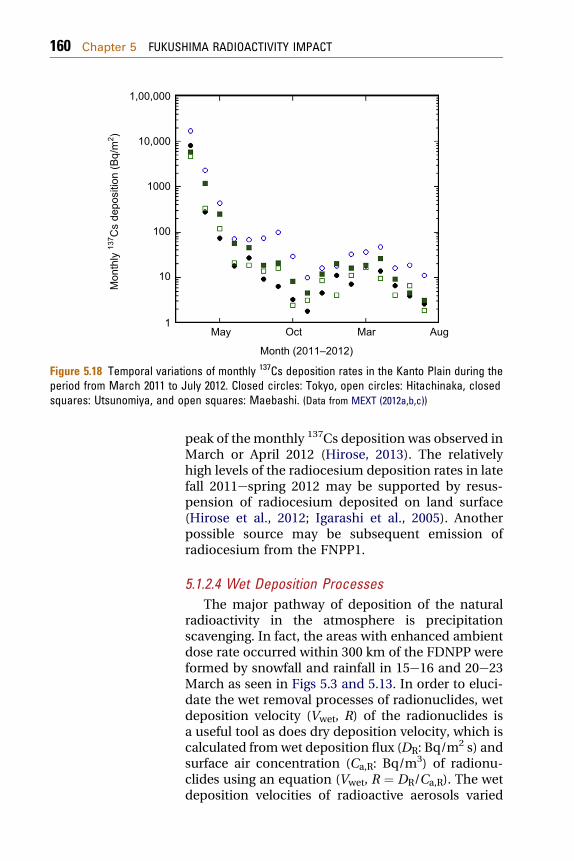
The monthly 137Cs deposition after July 2011 atthe monitoring stations in Kanto Plain exhibitedslower decrease rates as shown in Fig. 5.18, although137Cs was below detection limit in the monthlydeposition samples for most of the monitoringstations in southwestern region of Japan. In most ofthe monitoring stations in Kanto Plain, meaningfulamounts of the monthly radiocesium depositionhave beenmeasured on June 2012 (MEXT, 2012a,b,c).The decrease rate of the monthly 137Cs depositionchanged during the period from July to November2011. The monthly 137Cs deposition showedincreasing tendency after occurrence of a minimumdeposition on October or November. The second
1,00,000
10,000
1000
100
10
1Mar AugMay Oct
Month (2011–2012)
Mon
thly
137 C
s de
posi
tion
(Bq/
m2 )
Figure 5.18 Temporal variations of monthly 137Cs deposition rates in the Kanto Plain during theperiod from March 2011 to July 2012. Closed circles: Tokyo, open circles: Hitachinaka, closedsquares: Utsunomiya, and open squares: Maebashi. (Data from MEXT (2012a,b,c))
160 Chapter 5 FUKUSHIMA RADIOACTIVITY IMPACT
peak of the monthly 137Cs deposition was observed inMarch or April 2012 (Hirose, 2013). The relativelyhigh levels of the radiocesium deposition rates in latefall 2011espring 2012 may be supported by resus-pension of radiocesium deposited on land surface(Hirose et al., 2012; Igarashi et al., 2005). Anotherpossible source may be subsequent emission ofradiocesium from the FNPP1.
5.1.2.4 Wet Deposition ProcessesThe major pathway of deposition of the natural
radioactivity in the atmosphere is precipitationscavenging. In fact, the areas with enhanced ambientdose rate occurred within 300 km of the FDNPP wereformed by snowfall and rainfall in 15e16 and 20e23March as seen in Figs 5.3 and 5.13. In order to eluci-date the wet removal processes of radionuclides, wetdeposition velocity (Vwet, R) of the radionuclides isa useful tool as does dry deposition velocity, which iscalculated fromwet deposition flux (DR: Bq/m
2 s) andsurface air concentration (Ca,R: Bq/m
3) of radionu-clides using an equation (Vwet, R ¼ DR/Ca,R). The wetdeposition velocities of radioactive aerosols varied
Chapter 5 FUKUSHIMA RADIOACTIVITY IMPACT 161
considerably and depended on the type of radionu-clides and rainfall events (Hirose, 2000). Wet deposi-tion velocity is a useful indicator to have betterunderstanding of the atmospheric behavior of theFukushima-derived radionuclides. Amano et al.(2012) have determined the wet deposition velocitiesof the Fukushima-derived 131I and 137Cs during theperiods of 21e24March, corresponding to the secondarrival (heavier rainfall: 38 mm), respectively. The wetdeposition velocities, corresponding to the secondarrival of the radioactive plume, were around0.01e0.14m/s for 134Cs and 137Cs and 0.004e0.03m/sfor 131I. The wet deposition velocities of the Cher-nobyl fallout were determined to be 0.0026e0.11 m/sfor 137Cs (Hirose et al., 1993). The results suggest thatradiocesium is slightly easily removed from theatmosphere by wet deposition processes comparingwith radioiodine. The wet deposition velocities of theFukushima-derived radiocesium are the same orderof magnitude as those of the Chernobyl fallout,although the wet deposition velocities depend on sizeand chemical characteristics of radionuclide-bearingparticles and meteorological conditions such asrainfall intensity (Harvey andMatthews, 1989; Hirose,2000; Hirose et al., 1993; McNeary and Baskaran,2003; Slinn, 1978).
5.1.2.5 Dry Deposition ProcessesDry deposition is one of the important pathways
for the removal of radioactive particles from atmo-sphere. Theoretical and experimental studies of drydeposition processes for particles and gases werecarried out and reviewed by many researchers(Chamberlain, 1953; Schmel, 1980; Slinn, 1978;Underwood, 2001). Dry deposition, which dependson conditions of land surface such as grass, plat plainand others and on meteorological conditions, iscontrolled by gravitational settling, Brownian diffu-sion and compaction, as does physicochemical formof radioactive aerosols. Radioactive aerosols are animportant tool to have better understanding of drydeposition processes of aerosols in environments.
The dry deposition velocity has been applied inevaluation of aerosol transfer to the earth’s surface.
162 Chapter 5 FUKUSHIMA RADIOACTIVITY IMPACT
The dry deposition velocity, Vd,r, is defined as theratio of dry deposition flux to land to surface airconcentration.
Vd;r ¼ Fr=Cair;r ð5:1Þ
whereFr andCair,r are thedepositionfluxof radioactiveaerosols (Bq/m2 s) and the surface air concentrationofradioactive aerosols (Bq/m3), respectively. The drydeposition velocity is a function of particle size andwind velocity; the dry deposition velocity increaseswith decreasing particle diameter in the particle sizerange of <0.1 mm, which may be controlled by theBrownian diffusion, exhibits a minimum in theparticle size range of 0.1e1 mm, and increases withincreasing particle diameter in the particle size rangeofmore than 1 mm,where impaction and gravitationalsettling govern shape of increasing curve. The gravi-tational settling rate of soil particles is calculated to bearound 1 � 10�3 m/s for a mean particle size of 7 mmand a particle density of about 1.5 g/cm3, which is theminimum value because the dry deposition velocityincreases due to friction velocity and surface condi-tions (Schmel, 1980).
The dry deposition velocities of radioactive aero-sols have been determined by field observations. Thedry deposition velocities depend on the kind ofradionuclides and isotopes. For 7Be-bearing particles,the dry deposition velocity varied from 1.0 � 10�3 to3.4 � 10�2 m/s (Chamberlain, 1953; Small, 1960;Peirson et al., 1973; Young and Silker, 1980; Turekianet al., 1983; Todd et al., 1989; Papastefanou et al., 1995;Rosner et al., 1997; McNeary and Baskaran, 2003). Forthe 210Pb-bearing particles, the dry depositionvelocity ranged from 0.7 � 10�2 to 1.1 � 10�2 m/s(Turekian et al., 1983; Todd et al., 1989; McNeary andBaskaran, 2003). For the 137Cs-bearing particles, thedry deposition velocity varied from 3.8 � 10�4 to6.3 � 10�2 m/s (Aoyama et al., 1992; Papastefanouet al., 1995; Rosner et al., 1997). Amano et al. (2012)have determined the dry deposition velocities of theFukushima-derived 131I and 137Cs during the periodsof 14e17 March, which were around2 � 10�3e3 � 10�3 m/s for 134Cs and 137Cs and1 � 10�3e3 � 10�3 m/s for 131I. The dry deposition
Chapter 5 FUKUSHIMA RADIOACTIVITY IMPACT 163
velocities of thorium isotopes, which are a typicalindicator of soil dust, ranged from 3.8 � 10�3 to4.0 � 10�2 m/s (Hirose, 2000) and from 2.0 � 10�3 to6.4 � 10�2 m/s (Crecelius et al., 1978). The dry depo-sition velocities of the Fukushima-derived radionu-clides were the same order of magnitude as that ofprevious, although they were lower than that of soilparticles.
5.1.2.6 Resuspension ProcessesRelatively large amounts of the 137Cs and 134Cs
depositions within 300 km of the FDNPP have beenmeasured until June 2012. Resuspension is animportant process to sustain a level of anthropogenicradionuclides in the surface air and deposition. Theradionuclides deposited onto ground and/or vegeta-tion are adsorbed onto fine organic or mineral parti-cles. Somemeteorological conditions such as dry andstrong wind may blow off fragments of dried soil andvegetation. Initially resuspension process was con-cerned about inhalation of resuspended radioactivity,especially plutonium, for radioactivity-contaminatedarea by nuclear tests and accidental release fromnuclear facilities. To characterize resuspension ofradioactive aerosols, resuspension factor, kr, andresuspension ratio,L, have been introduced, which isdefined as a ratio of the radioactivity concentration inthe air (Cair: Bq/m
3) to the radioactivity deposited onthe ground (Ds: Bq/m
2) and the ratio of vertical flux(Q: Bq/m2 s) to the radioactivity deposited on theground (Ds: Bq/m
2), respectively.
kr ¼ Cair=Ds ð5:2ÞL ¼ Q=Ds ð5:3Þ
The resuspension factor is a measure of resuspensionphenomenon. The resuspension factors have beencalculated for aerosols associated with 7Be and 137Cs.For the 7Be-bearing particles, the resuspension factorvaried from 1.4 � 10�4 to 4.2 � 10�4/m (average2.3 � 10�4; Papastefanou et al., 1995). For the 137Cs-bearing particles, the resuspension factor, rangingfrom 10�8 to 1.2 � 10�4/m (Stewart, 1966; Garlandand Cambray, 1988; Papastefanou et al., 1995),
164 Chapter 5 FUKUSHIMA RADIOACTIVITY IMPACT
showed large variability. Shinn et al. (1983) deducedthe lower resuspension factor (a mean value:3 � 10�10/m) from measurements of aerosol Pu overa bare field near the Savannah River Processing Plant.The resuspension factor depends on meteorologicalfactors such as wind velocity and humidity, landconditions (climatologically factors, industrial andagricultural activities) and chemical and physicalproperties of radionuclide-bearing particles.
After the 1990s, the anthropogenic radionuclidesobserved in surface air and rainwater over the globeexcept the Chernobyl fallout are considered to havebeen derived from the resuspension of falloutradionuclides deposited on the land surface (Arimotoet al., 2005; Karlsson et al., 2008; Nicholson, 1988;Rosner and Winkler, 2001). After more than 10 yearssince the cessation of atmospheric nuclear testing,the atmospheric deposition of 137Cs, 90Sr and239,240Pu derived from atmospheric nuclear tests isnegligible. It is likely that the anthropogenic radio-nuclides and their activity ratios in surface air andrainwater reflect their redistribution processes on theland surface. Especially, regional transport of soildust from the desert and arid region (e.g. the Saharadust in Europe and the Asian dust in East Asia) is animportant factor for resuspension of the anthropo-genic radionuclides (Fujiwara et al., 2007; Igarashiet al., 2001, 2003, 2005, 2009; Hirose et al., 2003, 2004;Lee et al., 2002; Masson et al., 2010; Pham et al., 2011,2013; Povinec et al., 2012d; Sykora et al., 2012).
Although levels of dominant anthropogenicradionuclides (137Cs, 90Sr and 239,240Pu) in surface airin the 1990s and 2000s were supported by resus-pension, atmospheric behavior differs among theanthropogenic radionuclides. In fact, 90Sr and 137Csdeposition fluxes observed in Japan since 1990 weredecreasing slowly, whereas 239,240Pu deposition hasbeen almost constant since 1985, although there isinterannual variability of the 239,240Pu deposition.The monthly anthropogenic radionuclide deposi-tions in East Asia exhibited seasonal changes, witha maximum in spring (Hirose et al., 2003, 2008;Igarashi et al., 2001, 2003); especially, 239,240Pudeposition showed the most typical seasonal varia-tion among 137Cs, 90Sr, and 239,240Pu (Hirose et al.,
Chapter 5 FUKUSHIMA RADIOACTIVITY IMPACT 165
2003, 2008). The annual and seasonal changes in239,240Pu deposition coincide with those of theoccurrence of the Kosa (Asian dust) event observed inspring (typically, March and April) in Japan (Hiroseet al., 2007). These findings suggest that the majororigin of resuspension of the anthropogenic radio-active aerosols in Japan in the 1990s and 2000s isaeolian dust produced in the East Asian deserts andarid areas (Hirose et al., 2003; Igarashi et al., 2001).
Natural radionuclides, especially lithogenicelements, are a useful tool to elucidate resuspensionprocesses. Most of the thorium in aerosols originatesfrom soil particles (Hirose, 2000). The variation ofthorium in surface air, therefore, provides a key tosolve factors controlling resuspension. The temporalvariation of 232Th deposition in the 1990s and 2000sshows marked increase in spring coinciding with theAsian dust (Kosa) events. Residual materials indeposition samples consist of soil dust, fly ash, seasalt and others. Soil dust in residual materialscomprises local soil and long-range transported soilparticles so-called “Kosa”. The specific activities ofthorium in deposition samples collected at Tsukubaranged from 1.5 to 23 mBq/g (Hirose et al., 2012). Thethorium concentration in surface soil at Tsukuba is17 mBq/g in average (range: 4.4e32 mBq/g, unpub-lished data). The 232Th-specific activities in deposi-tion are roughly lower than the mean 232Thconcentration in surface soil because soil particlesoccupy a part of residual materials in deposition. The230Th/232Th activity ratios vary according to sources,in which its ratio is high in the local cultivated fieldsdue to fertilization and low in arid and desert soils,and can therefore be used to differentiate betweenlocally derived and remotely derived 232Th (Hiroseet al., 2010). The 230Th/232Th activity ratios in aerosoland deposition samples showed large variability withhigh ratios occurring in early spring. These high230Th/232Th ratios in deposition can be attributed tolocal dust storms that cause resuspension of soilsfrom cultivated fields. The 230Th/232Th ratios indeposition allow us to separate locally derived andremotely derived 232Th fractions. The results revealthat both locally and remotely derived 232Th depo-sitions showed seasonal variations with maxima in
166 Chapter 5 FUKUSHIMA RADIOACTIVITY IMPACT
spring although the remotely derived fraction isdominant rather than the locally derived one. Thelocally derived 232Th deposition showed a peak inearly spring, which can be attributed to local duststorm events. The 232Th depositionmaximum later inspring is attributable to the remotely derived fraction,corresponding to the Kosa events. Thorium isotopesin aerosols clearly show coexistence of two compo-nents of resuspension, i.e. locally and remotelyderived components.
Although, since July 2011, the decrease rate of themonthly 137Cs deposition in each sampling station ofKanto Plain was declined, the level of the monthly137Cs deposition in Fukushima Prefecture and KantoPlain is more than two orders of magnitude higherthan the pre-Fukushima level (Hirose, 2013; Hiroseet al., 2008). These findings and the detection of 134Csreveal that the emission of the Fukushima-derivedradionuclides has affected the atmospheric environ-ment even in 2012. It is considered that there werepossible processes supporting the monthly 137Csdeposition after July 2011 such as resuspension of theFukushima-derived 137Cs deposited on land surfaceand continuous emission of radionuclides from theFNPP1. In order to elucidate atmospheric effects ofthe Fukushima-derived radioactivity, it is importantto estimate levels of resuspended 137Cs (Hirose,2013).
In order to evaluate contribution of resuspensionof the Fukushima-derived radionuclides, it is neededto estimate amounts of locally derived soil dust indeposition samples, which comprises locally derivedsoil and long-range transported soil particles(“Kosa”). Thorium in deposition samples is a goodindicator of soil particles because it is one of thetypical lithogenic elements (Hirose et al., 2010). Themassic activities of thorium in deposition samplescollected at Tsukuba ranged from 1.5 to 23 mBq/g(Hirose et al., 2012). The thorium concentration insurface soils at Tsukuba is 17 mBq/g as an average(range: 4.4e32 mBq/g, unpublished data). The 232Thmassic activities in deposition are roughly lower thanthe mean 232Th concentration in surface soil becausesoil particles occupy a part of residual materials. The137Cs massic activities in deposition samples at
Chapter 5 FUKUSHIMA RADIOACTIVITY IMPACT 167
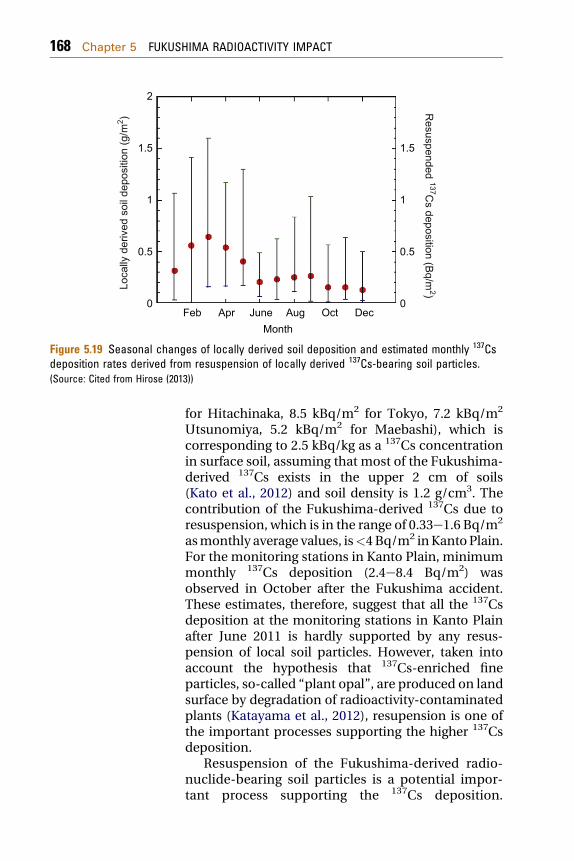
Tsukuba are calculated to range from 2.4 to 16mBq/gand 1.3e8.5 mBq/g for dust season (JanuaryeMay)and nondust season (JuneeDecember) in2000e2007. The 137Cs concentration in surface soil atTsukuba is 10 mBq/g as an average (range:0.92e20 mBq/g, unpublished data). As did thorium,the 137Cs massic activities in deposition are roughlylower than the mean 137Cs concentration in surfacesoil. If amounts of resuspended materials derivedfrom locally derived soil particles are estimated,a portion of the resupended FDNPP-derived 137Cs tothe total 137Cs deposition can be calculated. Hiroseet al. (2012) have estimated the locally and remotelyderived thorium fractions for thorium deposition.The amount of locally derived soil in residual mate-rials is estimated from the locally derived thorium.Unfortunately, weights of residual materials inmonthly deposition samples in monitoring stationsas done in the case of locally derived thorium depo-sition have not been recorded in the MEXT database(MEXT, 2012a,b,c). Therefore, the data set of theweight of residual materials in the monthly deposi-tion measured by Meteorological Research Institute(MRI) during the period 1990e2007 was used. Theamount of the locally derived soils in monthlydeposition at Tsukuba may be representative ofthat in monitoring stations located in the KantoPlain. Seasonal variation of locally derived soilcontributions observed at Tsukuba is shown inFig. 5.19. The locally derived soil amount in themonthly deposition showed seasonal variation withhigh deposition in JanuaryeMay and low inOctobereDecember, in which soil dust includingfilaments of withered plants is blown by strong windof dry spring in Kanto Plain. The temporal variationof the FDNPP-derived 137Cs deposition at severalstations of Kanto Plain in 2012, having a maximum inMarch or April, is similar to that of the resupension ofthe local soil. Hirose (2013) estimated contribution ofresuspension of radionuclide-bearing soil particles tothe radioactivity deposition.
According to the monitoring data of 137Cs depo-sition and airborne monitoring (Yoshida andTakahashi, 2012), the Fukushima-derived 137Csdeposition inKantoPlainwas<60 kBq/m2 (20 kBq/m2
Feb
2
1.5
1
0.5
0
1.5
1
0.5
0Apr June
MonthAug Oct Dec
Loca
lly d
eriv
ed s
oil d
epos
ition
(g/m
2 ) Resuspended 137C
s deposition (Bq/m2)
Figure 5.19 Seasonal changes of locally derived soil deposition and estimated monthly 137Csdeposition rates derived from resuspension of locally derived 137Cs-bearing soil particles.(Source: Cited from Hirose (2013))
168 Chapter 5 FUKUSHIMA RADIOACTIVITY IMPACT
for Hitachinaka, 8.5 kBq/m2 for Tokyo, 7.2 kBq/m2
Utsunomiya, 5.2 kBq/m2 for Maebashi), which iscorresponding to 2.5 kBq/kg as a 137Cs concentrationin surface soil, assuming that most of the Fukushima-derived 137Cs exists in the upper 2 cm of soils(Kato et al., 2012) and soil density is 1.2 g/cm3. Thecontribution of the Fukushima-derived 137Cs due toresuspension, which is in the range of 0.33e1.6 Bq/m2
asmonthly average values, is<4Bq/m2 inKantoPlain.For the monitoring stations in Kanto Plain, minimummonthly 137Cs deposition (2.4e8.4 Bq/m2) wasobserved in October after the Fukushima accident.These estimates, therefore, suggest that all the 137Csdeposition at the monitoring stations in Kanto Plainafter June 2011 is hardly supported by any resus-pension of local soil particles. However, taken intoaccount the hypothesis that 137Cs-enriched fineparticles, so-called “plant opal”, are produced on landsurface by degradation of radioactivity-contaminatedplants (Katayama et al., 2012), resupension is one ofthe important processes supporting the higher 137Csdeposition.
Resuspension of the Fukushima-derived radio-nuclide-bearing soil particles is a potential impor-tant process supporting the 137Cs deposition.
Chapter 5 FUKUSHIMA RADIOACTIVITY IMPACT 169
However, it is inadequate to disregard the possibilityof other processes to enhance the atmospheric 137Cs.Small-scale biomass burning, which occurred inNovembereDecember in Kanto Plain, is consideredto be a potential source to the 137Cs deposition asanother process, which has been recognized for theChernobyl fallout (Lujaniene et al., 2009). It must benoted that the direct emission of radionuclides fromthe FNPP1 has continued at least up to October 2011.The amounts of released radionuclides were,however, more than three orders of magnitude lowerthan the initial release as a monthly emission(TEPCO, 2011a,b).
5.1.3 Radionuclides in Grass, Crop,Livestock and Soil
5.1.3.1 Radionuclides in SoilMEXT started the emergency monitoring of envi-ronmental samples on 18 March, including radioac-tivity measurements of soil and grass samples atthe area from 20 km to about 50 km of the FNPP1(MEXT, 2012a,b,c). The radioactivity monitoring ofsoil samples, which can provide information abouttotal ground deposition and kinds of emitted radio-nuclides, is important to find highly contaminatedareas so-called “hot spot”. This is important toimplement early protective actions to mediateradiological effects. In the emergency monitoring,radioactivity concentrations in surface soil is definedas a mean value of five points in the sampling site, inwhich samples collected with a cylinder sampler with5 cm diameter and 5 cm depth were homogenizedand subjected by gamma-spectrometry. The numberof soil sampling sites was about 60. Althoughmeasured radionuclides included 131I, 134Cs, 136Cs,137Cs, 129mTe, 132Te, and 90Sr, major target radionu-clides were 131I, 134Cs, and 137Cs. The highestconcentration of 131I in soil (340 kBq/kg) collected on30 March was observed at the site of 34 km northwestof the FNPP1. The early radioactivity monitoringrevealed that the spatial distribution of radionuclideconcentrations in soil was very variable, dependingon sampling and local conditions.
170 Chapter 5 FUKUSHIMA RADIOACTIVITY IMPACT
Besides MEXT emergency monitoring, someuniversity teams (Endo et al., 2012; Kinoshita et al.,2011; Fujiwara et al., 2012; Kato et al., 2012) con-ducted environmental radioactivity monitoring ofsurface soil. Endo et al. (2012) collected undisturbedsoil samples (6.5 cm diameter and 0e5 cm and5e10 cm depths) at a site (Futaba-Yamada), 5 km ofthe FNPP1, and 15 sites in the area of 20e40 km of theFNPP1 in the period of 15e30 March and measuredactivity concentrations in soil samples. The resultreveals that following gamma-emitting radionuclideswere detected in soil samples: 131I, 134Cs, 136Cs, 137Cs,129mTe, 129Te, 132Te, 132I, 140Ba, 140La, 99mTc and110mAg. The highest concentrations of gamma-emitting radionuclides in soil samples, which were2.38 MBq/kg (131I), 1.43 MBq/kg (132Te), 1.33 MBq/kg(132I), 0.186 MBq/kg (134Cs), 0.04 MBq/kg (136Cs) and0.193 MBq/kg (137Cs), were found at Futaba-Yamadaon 15 March. The higher concentrations of theradionuclides in soil were observed in the areanorthwest of the FNPP1, which coincided with theairborne monitoring (Lyons and Colton, 2012). Theresult suggests that dominant radionuclides emittedfrom the FNPP1 were volatile ones such as 131I, 134Cs,137Cs, 132Te and 132I, whereas refractory radionu-clides such as 95Zr, 103Ru and 106Ru, which weredetected in the Chernobyl accident, could not bedetected. Kinoshita et al. (2011) collected a lot of soilsamples in Fukushima and Ibaraki prefectures in theperiod of late MarcheApril in order to constructgeographical maps of the Fukushima-derived radio-nuclides. Kinoshita et al. (2011) depicted spatialdistributions of 131I, 134Cs, 137Cs, 129mTe and 136Cs inFukushima and Ibaraki prefectures except the evac-uation area. Yamamoto et al. (2012) documentedconcentrations of gamma-emitting radionuclides(131I, 134Cs, 136Cs, 137Cs, 129mTe, 129Te, 132I, and 140La)in soil samples collected in 20e60 zones of the FNPP1on 27 March and in Okuma Town (1.7 km to about5 km west and south of the FNPP1) on 25 May 2011.Watanabe et al. (2012) reported concentrations ofgamma-emitting radionuclides (110mAg, 134Cs, 137Cs,and 129mTe) in 35 soil samples collected in Miyagiprefecture located just north of Fukushima prefec-ture on 16e29 April 2011. They detected 110mAg in 16
Chapter 5 FUKUSHIMA RADIOACTIVITY IMPACT 171
soil samples, in which the 110mAg concentrations insoil ranged from 2.6 to 48.4 Bq/kg and 110mAg/137Csactivity ratios were in a range of 0.002e0.011, whichwere roughly higher than values (0.0009e0.006) indeposition samples in the regional sites (Hirose et al.,2012). Fujiwara et al. (2012) measured concentra-tions of gamma-emitting radionuclides in soilsamples collected in 50 sites in the eastern Fukushimaprefecture (within 60 km of the FNPP1) on 20 April.For most of the sampling sites, only one soil samplewas collected with a cylinder sampler of 5 cmdiameter and 5 cm depth and at several sites, soilcore samples were collected. The results reveal thathigher concentrations of the Fukushima-derivedradionuclides spread northwest direction and largespatial variation of 131I/137Cs ratio occurred,whereas there was a small spatial variation of136Cs/137Cs ratios (0.17e0.25, radioactive decaycorrected on 11 March), which is consistent withthe ratio (0.27) observed in surface air (Doi et al.,2013). The vertical profiles of radionuclides in thesoil core samples indicated that most of the 131I and137Cs exist in the surface layer, although 131Imigrates deeper layer than 137Cs. Tagami et al.(2011) reported concentrations of radionuclides insoil samples collected at J Village, about 20 kmsouth of the FNPP1 site, on 20 and 28 April and 4May 2011, in which radioiodine and radiocesiumwere detected as major nuclides and trace amountsof 95Nb, 110mAg and 140La were found. The averageactivity ratios of 131I/137Cs, 134Cs/137Cs, 136Cs/137Csand 129mTe/137Cs were 55, 0.90, 0.22 and 4.0(radioactive decay corrected on 11 March) in thesurface soil (0e2 cm). Measurements for three soillayers (0e2, 5e7, and 10e12 cm depth) revealedthat most of the radionuclides deposited on soilsurface existed a surface layer (0e2 cm). Ohno et al.(2012) measured radioactivity in soil core samplescollected in a wheat field, a rice paddy, an orchard,and a cedar forest in Koriyama, which is locatedabout 60 km west of the FNPP1. Soil sampling wasconducted using a stainless core sampler (30 cm inlength and 5 cm in diameter) on 23 and 24 April2011. The measurement of radioiodine and radio-cesium was performed for six layers of soil cores
Verti
10
2
4
6
8Dep
th (c
m)
10
12
14
Figure 5.20 Vertical profiles(2012))
172 Chapter 5 FUKUSHIMA RADIOACTIVITY IMPACT
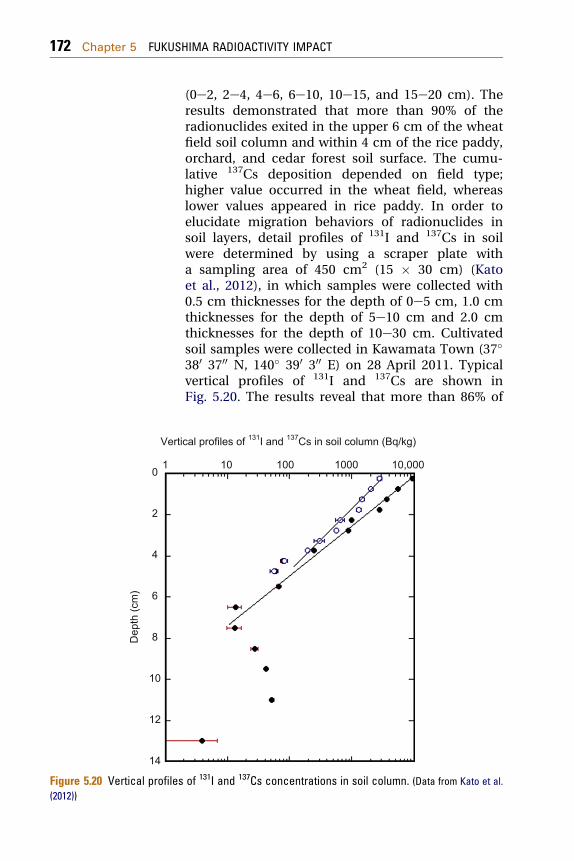
(0e2, 2e4, 4e6, 6e10, 10e15, and 15e20 cm). Theresults demonstrated that more than 90% of theradionuclides exited in the upper 6 cm of the wheatfield soil column and within 4 cm of the rice paddy,orchard, and cedar forest soil surface. The cumu-lative 137Cs deposition depended on field type;higher value occurred in the wheat field, whereaslower values appeared in rice paddy. In order toelucidate migration behaviors of radionuclides insoil layers, detail profiles of 131I and 137Cs in soilwere determined by using a scraper plate witha sampling area of 450 cm2 (15 � 30 cm) (Katoet al., 2012), in which samples were collected with0.5 cm thicknesses for the depth of 0e5 cm, 1.0 cmthicknesses for the depth of 5e10 cm and 2.0 cmthicknesses for the depth of 10e30 cm. Cultivatedsoil samples were collected in Kawamata Town (37�380 3700 N, 140� 390 300 E) on 28 April 2011. Typicalvertical profiles of 131I and 137Cs are shown inFig. 5.20. The results reveal that more than 86% of
cal profiles of 131I and 137Cs in soil column (Bq/kg)
10 100 1000 10,000
of 131I and 137Cs concentrations in soil column. (Data from Kato et al.
Chapter 5 FUKUSHIMA RADIOACTIVITY IMPACT 173
the total radiocesium and 79% of the total 131I wereabsorbed onto soil particles in the upper 2.0 cmlayer of the soil profile. The 131I and 137Csconcentrations in soil layers exponentiallydecreased with increasing depth. These findingssuggest that most of the radiocesium and 131I weretightly absorbed onto soil particles in surface layerjust after the deposition, although the verticalmigration of radionuclides depends on the fieldtype, soil type and clay content.
To construct maps of the Fukushima-derivedradionuclides with a 2 km mesh within a 100 kmradius of the FNPP1, the MEXT team, in cooperationwith Japan Atomic Energy Agency (JAEA), JCAC andJapan universities, collected soil samples at 2200 sitesthroughout Fukushima prefecture and northernIbaraki and southern Miyagi prefectures during theperiod of 4e29 June 2011. The soil sampling was thesame as the Emergency sampling method. The resultof radionuclide profiles in soil (Endo et al., 2012;Fujiwara et al., 2012; Kato et al., 2012; Ohno et al.,2012; Tagami et al., 2011) suggested that more than90% of the Fukushima-derived radionuclides exist inthe upper 5 cm layer. Therefore, the radionuclideconcentrations in the upper 5 cm soil layer canbe converted to the cumulative ground deposition(unit: Bq/m2). MEXT documented the maps of thecumulative depositions of 134Cs, 137Cs, 129mTe and110mAg, whereas the fine-mesh mapping of the 131Ideposition failed due to decay out of 131I in most ofthe sampling sites because of delay of sampling(meaningful values of 131I in soil samples were ob-tained only for 20% of the sites).
The spatial distribution of the cumulative 137Csdeposition calculated in soil samples as shown inFig. 5.21 revealed that the highly contaminated areacovered the area northwest of the FNPP1, which isconsistent with the airborne monitoring results andpreliminarysoil surveys (Kinoshitaetal., 2011;Fujiwaraet al., 2012). The highest cumulative 137Cs deposition(15.5MBq/m2)wasmeasured inOkumaTown, close tothe NPP (<3 km), where an annual radiation dose at1 m height was 480 mSv. Higher cumulative 137Csdeposition (7.9 MBq/m2) occurred around the borderbetween Namie Town and Iidate Village, about 30 km
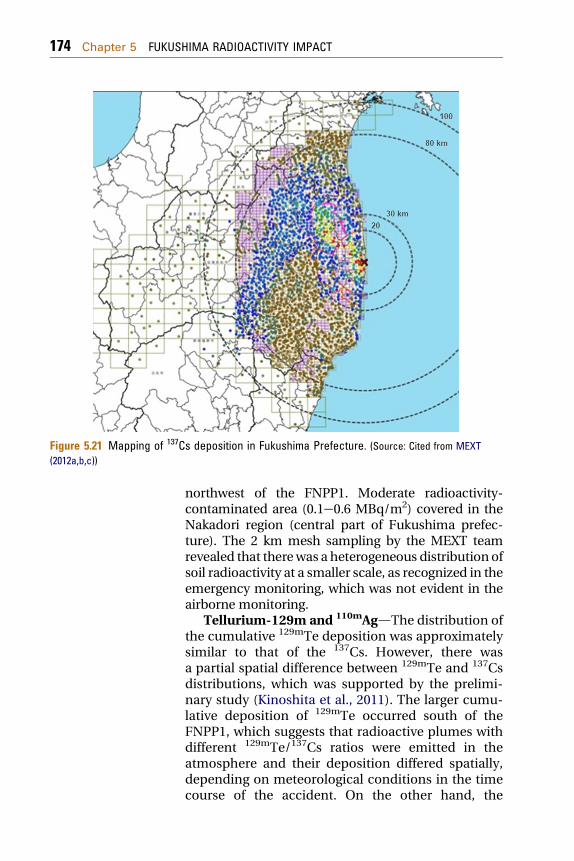
Figure 5.21 Mapping of 137Cs deposition in Fukushima Prefecture. (Source: Cited from MEXT(2012a,b,c))
174 Chapter 5 FUKUSHIMA RADIOACTIVITY IMPACT
northwest of the FNPP1. Moderate radioactivity-contaminated area (0.1e0.6 MBq/m2) covered in theNakadori region (central part of Fukushima prefec-ture). The 2 km mesh sampling by the MEXT teamrevealed that therewas a heterogeneous distribution ofsoil radioactivity at a smaller scale, as recognized in theemergency monitoring, which was not evident in theairborne monitoring.
Tellurium-129m and 110mAgdThe distribution ofthe cumulative 129mTe deposition was approximatelysimilar to that of the 137Cs. However, there wasa partial spatial difference between 129mTe and 137Csdistributions, which was supported by the prelimi-nary study (Kinoshita et al., 2011). The larger cumu-lative deposition of 129mTe occurred south of theFNPP1, which suggests that radioactive plumes withdifferent 129mTe/137Cs ratios were emitted in theatmosphere and their deposition differed spatially,depending on meteorological conditions in the timecourse of the accident. On the other hand, the
Chapter 5 FUKUSHIMA RADIOACTIVITY IMPACT 175
distribution of the cumulative 110mAg deposition didnot coincide with that of the 137Cs. This findingsuggests that the emission processes of 110mAg fromthe FNPP1 were significantly different from those of129mTe and 137Cs because of refractory property of Agin contrast of 129mTe and 137Cs.
Iodine-131din order to assess stochastic effectsdue to radiation exposure from radioiodine, it isimportant to elucidate the spatial distribution of thecumulative 131I deposition. Unfortunately, MEXTteam failed to reconstruct precious mapping of thecumulative 131I deposition due to decay out of mostof 131I. Kinoshita et al. (2011) conducted earlymapping of the cumulative 131I deposition using soilmeasurements. The high 131I deposition regionspread northwest of the FDNPP, which was similar tothat of radiocesium, whereas the relatively high 131Ideposition comparing with 137Cs occurred in thesouth region of the FDNPP, including Ibarakiprefecture. The result suggested that the depositionalbehaviors of 131I differed from that of the 137Cs. Thisfinding reveals that it is difficult to reconstruct thefine-mesh map of the 131I deposition from the fine-mesh mapping of 137Cs and 131I/137Cs ratio.
Iodine-129 is a minor activity component ina reactor accident. If the 129I/131I ratio is constant inradionuclides emitted throughout the accident, thedistribution of 129I, determined by accelerator massspectrometry (AMS), allows us to depict more reliabledistribution of the 131I deposition. The 129I concen-trations in soil samples, in which the 131I concentra-tionshadbeendetermined (Fujiwaraet al., 2012),weremeasured by AMS (Miyake et al., 2012). The cumula-tive 129I deposition estimated from soil data was in therange of 0.0156e6.06 Bq/m2. Soil samples in Japanwere generally contaminated with 129I derived fromglobal fallout due to the atmospheric nuclearweaponstesting (Matsuzaki et al., 2007;Muramatsu et al., 2008).In order to distinguish between the Fukushima-derived 129I and global fallout-derived 129I, 129I/127Iatom ratios were plotted to 127I (stable isotope). Mostof the plots of 129I/127I vs 127I in the Fukushima soilsamples were deviated from the relationship between129I/127I and 127I for global fallout. This implies that 129Iin the Fukushima soil samples was derived from the
176 Chapter 5 FUKUSHIMA RADIOACTIVITY IMPACT
Fukushima accident. The 129I deposition linearlycorrelated with the 131I deposition and the average129I/131I atom ratio was 31.6� 8.9. Themeasurementsof 129I, therefore, are desirable to depict the detailed131I map (Yoshida and Takahashi, 2012).
Radiostrontium (89Sr, 90Sr) attracted publicconcerns because radiostrontium has a higher riskfor internal radiation exposure via ingestions ofcontaminated agricultural crops. The data of radio-strontium in soil samples were limited becauseradiochemical analysis with longer chemical sepa-ration/purification processes and resulting longermeasurement time is required for measurements ofradiostrontium because of their beta-emitter. TEPCOand MEXT documented preliminary results of 89Srand 90Sr concentrations in surface soils collected atthree points in the FNPP1 site, five points within20 km of the FNPP1 and three points in the area of30e40 km from the FNPP1, which are summarized inTable 5.1. The 90Sr concentrations in surface soilsamples ranged from 2.5 to 570 Bq/kg. The 89Sr/90Srratios in surface soils (89Sr radioactive decay cor-rected at 11 March 2011) were 12e13. The 90Sr/137Csratios were almost <0.001. In order to depict thespatial distribution of radiostrontium, MEXT incooperation with JCAC measured concentrations ofradiostrontium in 100 soil samples, which wereselected from 2200 samples of the 2 km meshsampling. A significant amount of radiostrontiumwas released from the FNPP1 in the area within80 km since 89Sr was detected at about 70% of thesites. Maximum cumulative 89Sr and 90Sr deposi-tions, which were 22 and 4.8 kBq/m2, occurred inNamie Town. The 89Sr/90Sr activity ratios (samplenumber: 15 (90Sr > 500 Bq/m2), 89Sr radioactivedecay corrected at 11 March 2011) ranged from 6.5 to15.7 with an average of 13.3. The result suggests thatthe high radiostrontium deposition was localized toa narrow area northwest of the FNPP1.
Plutonium attracted public concerns becauseplutonium isotopes have a higher risk for internalradiation exposure via ingestions of contaminatedagricultural crops. Major plutonium isotopesare 238Pu (half-life: 87.74 years), 239Pu (half-life:24,110 years), 240Pu (half-life: 6563 years), and 241Pu
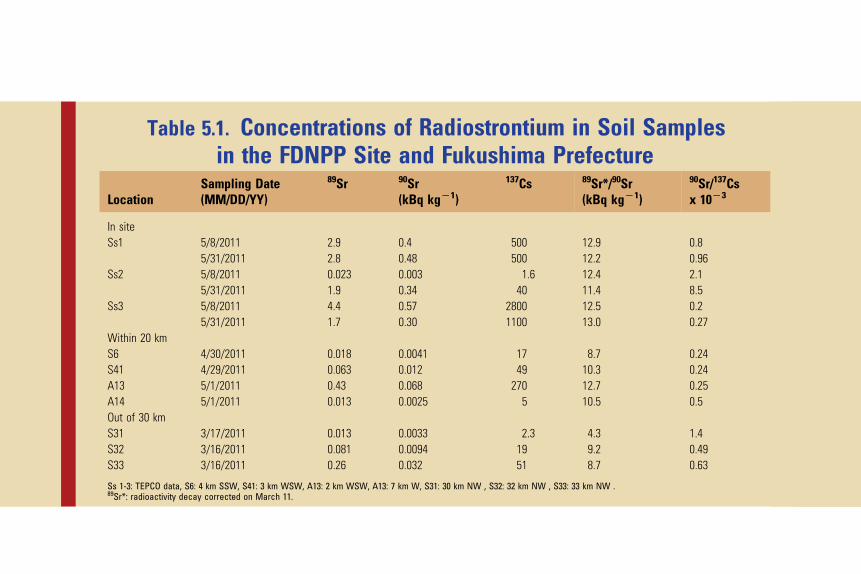
Table 5.1. Concentrations of Radiostrontium in Soil Samplesin the FDNPP Site and Fukushima Prefecture
LocationSampling Date(MM/DD/YY)
89Sr 90Sr(kBq kgL1)
137Cs 89Sr*/90Sr(kBq kgL1)
90Sr/137Csx 10L3
In siteSs1 5/8/2011 2.9 0.4 500 12.9 0.8
5/31/2011 2.8 0.48 500 12.2 0.96Ss2 5/8/2011 0.023 0.003 1.6 12.4 2.1
5/31/2011 1.9 0.34 40 11.4 8.5Ss3 5/8/2011 4.4 0.57 2800 12.5 0.2
5/31/2011 1.7 0.30 1100 13.0 0.27Within 20 kmS6 4/30/2011 0.018 0.0041 17 8.7 0.24S41 4/29/2011 0.063 0.012 49 10.3 0.24A13 5/1/2011 0.43 0.068 270 12.7 0.25A14 5/1/2011 0.013 0.0025 5 10.5 0.5Out of 30 kmS31 3/17/2011 0.013 0.0033 2.3 4.3 1.4S32 3/16/2011 0.081 0.0094 19 9.2 0.49S33 3/16/2011 0.26 0.032 51 8.7 0.63
Ss 1-3: TEPCO data, S6: 4 km SSW, S41: 3 km WSW, A13: 2 km WSW, A13: 7 km W, S31: 30 km NW , S32: 32 km NW , S33: 33 km NW .89Sr*: radioactivity decay corrected on March 11.
178 Chapter 5 FUKUSHIMA RADIOACTIVITY IMPACT
(half-life: 14.36 years). Plutonium isotope ratios suchas 238Pu/239,240Pu, 241Pu/239,240Pu activity ratios and240Pu/239Pu atom ratio depend on sources and burn-up time of nuclear fuel. Therefore, the accuratemeasurements of Pu isotopic compositions provideinformation on the extent of destruction of thedamaged reactors including nuclear fuels and releaseprocesses. TEPCO reported that trace amounts of239,240Pu, ranging from 0.018 to 0.75 Bq/kg with anaverage of 0.078 Bq/kg, are detected in soil samplescollected in the FNPP1 site, in which radiochemicalanalysis and alpha spectrometry were conducted bythe JCAC and JAEA. The Fukushima-derived pluto-nium was evident from observed higher238Pu/239,240Pu activity ratios (range: 1.2e3.3, mean:2.2), which are about two orders of magnitude higherthan those of global fallout (0.026). A median of137Cs/239,240Pu ratios in the Fukushima soil was7.5 � 106. Yamamoto et al. (2012) documentedplutonium isotope measurements in soil samplescollected at 11 sites outside the evacuation zone, foursites in Iidate Village and 10 sites in Okuma Town.Although high 239,240Pu concentrations in soil(0e5 cm), ranged from 0.0022 to 0.27 Bq/kg, were notobserved, evidently high 238Pu/239,240Pu activityratios (0.05e1.2) occurred in the Iidate soil samples.Zheng et al. (2012) measured 241Pu/239,240Pu activityratios and 240Pu/239Pu atom ratio and 239,240Puconcentrations in litter and soil samples collected inIidate Village and J Village using a sector-fieldinductively coupled plasma mass spectrometry(ICP-MS). The 239,240Pu concentrations in soil(0e2 cm) ranged from 0.019 to 1.4 Bq/kg. Thesefindings suggest that the 239,240Pu concentrations insoil collected in Fukushima were generally ina concentration range (0.15e4.31 Bq/kg) of the globalfallout-derived plutonium in Japanese soils beforethe Fukushima accident (Muramatsu et al., 2003). Onthe other hand, Zheng et al. (2012) found higher241Pu/239Pu (0.103e0.135) and 240Pu/239Pu atomratios (0.303e0.330) in the soils and litters than thoseof the global fallout, in which mean 241Pu/239,240Puand 240Pu/239Pu atom ratios are 0.00194 � 0.00014and 0.180 � 0.007, respectively (Kelley et al., 1999).The typical 241Pu/239,240Pu and 137Cs/239,240Pu
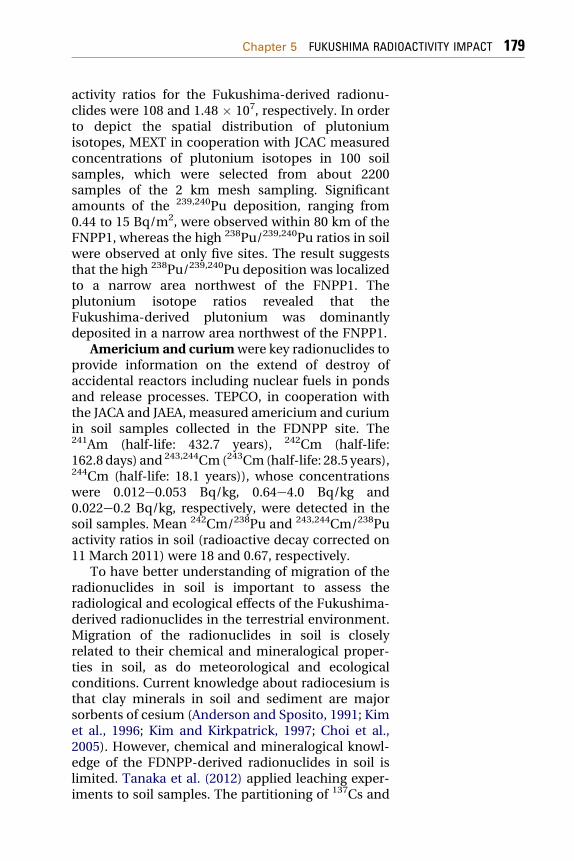
Chapter 5 FUKUSHIMA RADIOACTIVITY IMPACT 179
activity ratios for the Fukushima-derived radionu-clides were 108 and 1.48 � 107, respectively. In orderto depict the spatial distribution of plutoniumisotopes, MEXT in cooperation with JCAC measuredconcentrations of plutonium isotopes in 100 soilsamples, which were selected from about 2200samples of the 2 km mesh sampling. Significantamounts of the 239,240Pu deposition, ranging from0.44 to 15 Bq/m2, were observed within 80 km of theFNPP1, whereas the high 238Pu/239,240Pu ratios in soilwere observed at only five sites. The result suggeststhat the high 238Pu/239,240Pu deposition was localizedto a narrow area northwest of the FNPP1. Theplutonium isotope ratios revealed that theFukushima-derived plutonium was dominantlydeposited in a narrow area northwest of the FNPP1.
Americium and curiumwere key radionuclides toprovide information on the extend of destroy ofaccidental reactors including nuclear fuels in pondsand release processes. TEPCO, in cooperation withthe JACA and JAEA, measured americium and curiumin soil samples collected in the FDNPP site. The241Am (half-life: 432.7 years), 242Cm (half-life:162.8 days) and 243,244Cm(243Cm(half-life: 28.5 years),244Cm (half-life: 18.1 years)), whose concentrationswere 0.012e0.053 Bq/kg, 0.64e4.0 Bq/kg and0.022e0.2 Bq/kg, respectively, were detected in thesoil samples. Mean 242Cm/238Pu and 243,244Cm/238Puactivity ratios in soil (radioactive decay corrected on11 March 2011) were 18 and 0.67, respectively.
To have better understanding of migration of theradionuclides in soil is important to assess theradiological and ecological effects of the Fukushima-derived radionuclides in the terrestrial environment.Migration of the radionuclides in soil is closelyrelated to their chemical and mineralogical proper-ties in soil, as do meteorological and ecologicalconditions. Current knowledge about radiocesium isthat clay minerals in soil and sediment are majorsorbents of cesium (Anderson and Sposito, 1991; Kimet al., 1996; Kim and Kirkpatrick, 1997; Choi et al.,2005). However, chemical and mineralogical knowl-edge of the FDNPP-derived radionuclides in soil islimited. Tanaka et al. (2012) applied leaching exper-iments to soil samples. The partitioning of 137Cs and
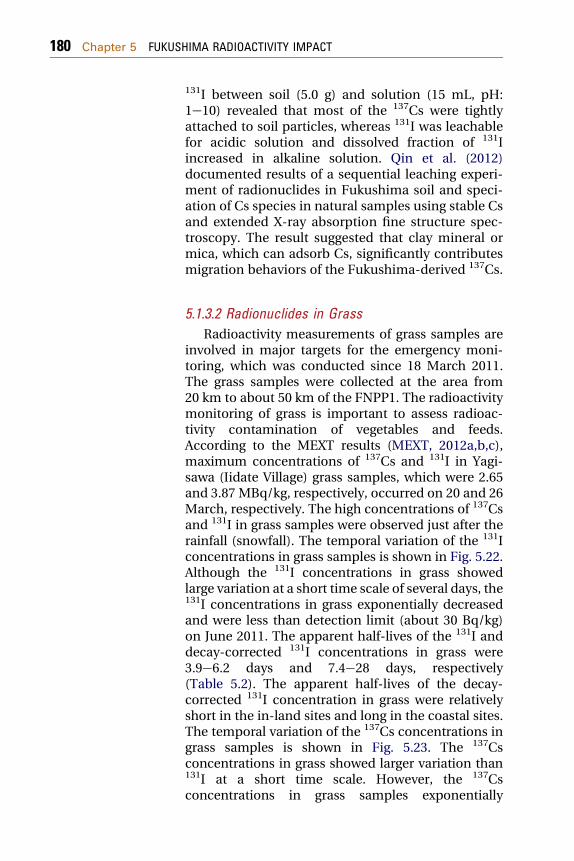
180 Chapter 5 FUKUSHIMA RADIOACTIVITY IMPACT
131I between soil (5.0 g) and solution (15 mL, pH:1e10) revealed that most of the 137Cs were tightlyattached to soil particles, whereas 131I was leachablefor acidic solution and dissolved fraction of 131Iincreased in alkaline solution. Qin et al. (2012)documented results of a sequential leaching experi-ment of radionuclides in Fukushima soil and speci-ation of Cs species in natural samples using stable Csand extended X-ray absorption fine structure spec-troscopy. The result suggested that clay mineral ormica, which can adsorb Cs, significantly contributesmigration behaviors of the Fukushima-derived 137Cs.
5.1.3.2 Radionuclides in GrassRadioactivity measurements of grass samples are
involved in major targets for the emergency moni-toring, which was conducted since 18 March 2011.The grass samples were collected at the area from20 km to about 50 km of the FNPP1. The radioactivitymonitoring of grass is important to assess radioac-tivity contamination of vegetables and feeds.According to the MEXT results (MEXT, 2012a,b,c),maximum concentrations of 137Cs and 131I in Yagi-sawa (Iidate Village) grass samples, which were 2.65and 3.87 MBq/kg, respectively, occurred on 20 and 26March, respectively. The high concentrations of 137Csand 131I in grass samples were observed just after therainfall (snowfall). The temporal variation of the 131Iconcentrations in grass samples is shown in Fig. 5.22.Although the 131I concentrations in grass showedlarge variation at a short time scale of several days, the131I concentrations in grass exponentially decreasedand were less than detection limit (about 30 Bq/kg)on June 2011. The apparent half-lives of the 131I anddecay-corrected 131I concentrations in grass were3.9e6.2 days and 7.4e28 days, respectively(Table 5.2). The apparent half-lives of the decay-corrected 131I concentration in grass were relativelyshort in the in-land sites and long in the coastal sites.The temporal variation of the 137Cs concentrations ingrass samples is shown in Fig. 5.23. The 137Csconcentrations in grass showed larger variation than131I at a short time scale. However, the 137Csconcentrations in grass samples exponentially
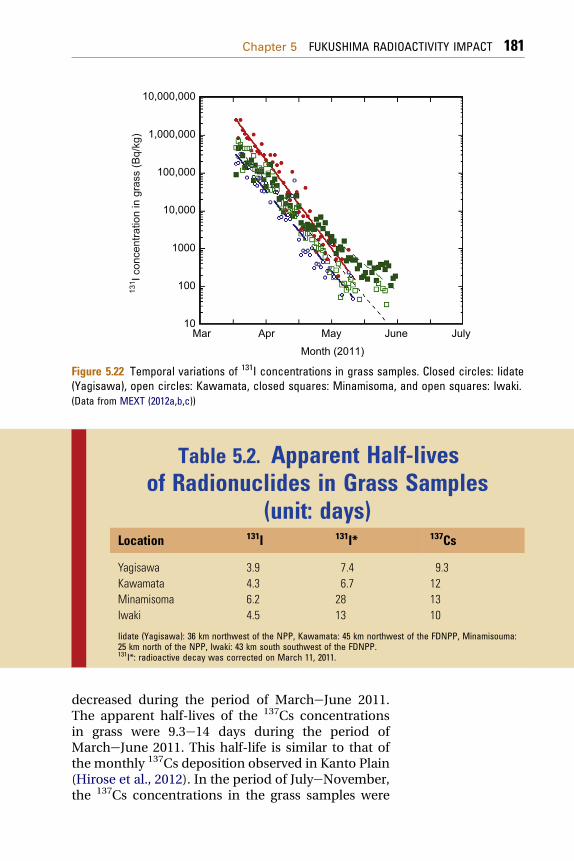
131 I c
once
ntra
tion
in g
rass
(Bq/
kg)
Mar Apr MayMonth (2011)
June July
10,000,000
1,000,000
100,000
10,000
1000
100
10
Figure 5.22 Temporal variations of 131I concentrations in grass samples. Closed circles: Iidate(Yagisawa), open circles: Kawamata, closed squares: Minamisoma, and open squares: Iwaki.(Data from MEXT (2012a,b,c))
Table 5.2. Apparent Half-livesof Radionuclides in Grass Samples
(unit: days)Location 131I 131I* 137Cs
Yagisawa 3.9 7.4 9.3Kawamata 4.3 6.7 12Minamisoma 6.2 28 13Iwaki 4.5 13 10
Iidate (Yagisawa): 36 km northwest of the NPP, Kawamata: 45 km northwest of the FDNPP, Minamisouma:25 km north of the NPP, Iwaki: 43 km south southwest of the FDNPP.131I*: radioactive decay was corrected on March 11, 2011.
Chapter 5 FUKUSHIMA RADIOACTIVITY IMPACT 181
decreased during the period of MarcheJune 2011.The apparent half-lives of the 137Cs concentrationsin grass were 9.3e14 days during the period ofMarcheJune 2011. This half-life is similar to that ofthe monthly 137Cs deposition observed in Kanto Plain(Hirose et al., 2012). In the period of JulyeNovember,the 137Cs concentrations in the grass samples were
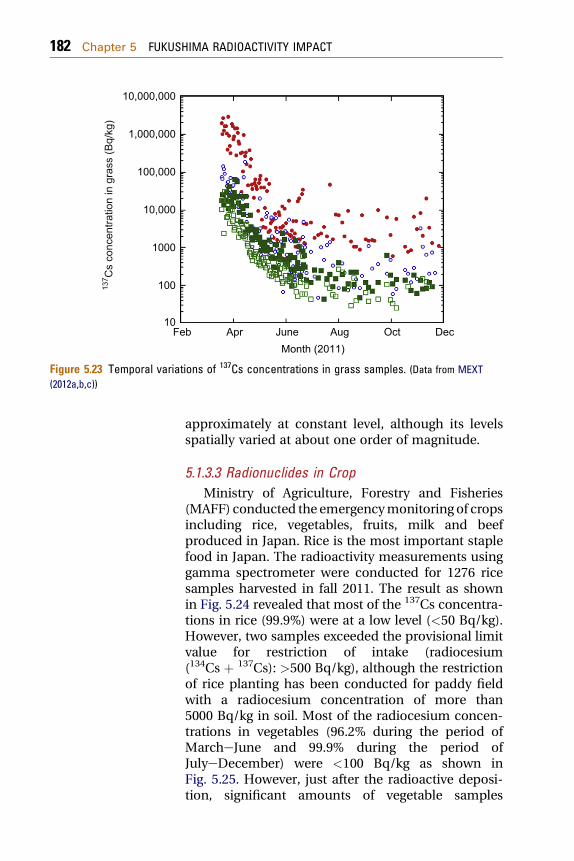
137 C
s co
ncen
tratio
n in
gra
ss (B
q/kg
)10,000,000
1,000,000
100,000
10,000
1000
100
10Feb Apr June
Month (2011)Aug Oct Dec
Figure 5.23 Temporal variations of 137Cs concentrations in grass samples. (Data from MEXT(2012a,b,c))
182 Chapter 5 FUKUSHIMA RADIOACTIVITY IMPACT
approximately at constant level, although its levelsspatially varied at about one order of magnitude.
5.1.3.3 Radionuclides in CropMinistry of Agriculture, Forestry and Fisheries
(MAFF) conducted the emergencymonitoring of cropsincluding rice, vegetables, fruits, milk and beefproduced in Japan. Rice is the most important staplefood in Japan. The radioactivity measurements usinggamma spectrometer were conducted for 1276 ricesamples harvested in fall 2011. The result as shownin Fig. 5.24 revealed that most of the 137Cs concentra-tions in rice (99.9%) were at a low level (<50 Bq/kg).However, two samples exceeded the provisional limitvalue for restriction of intake (radiocesium(134Cs þ 137Cs): >500 Bq/kg), although the restrictionof rice planting has been conducted for paddy fieldwith a radiocesium concentration of more than5000 Bq/kg in soil. Most of the radiocesium concen-trations in vegetables (96.2% during the period ofMarcheJune and 99.9% during the period ofJulyeDecember) were <100 Bq/kg as shown inFig. 5.25. However, just after the radioactive deposi-tion, significant amounts of vegetable samples
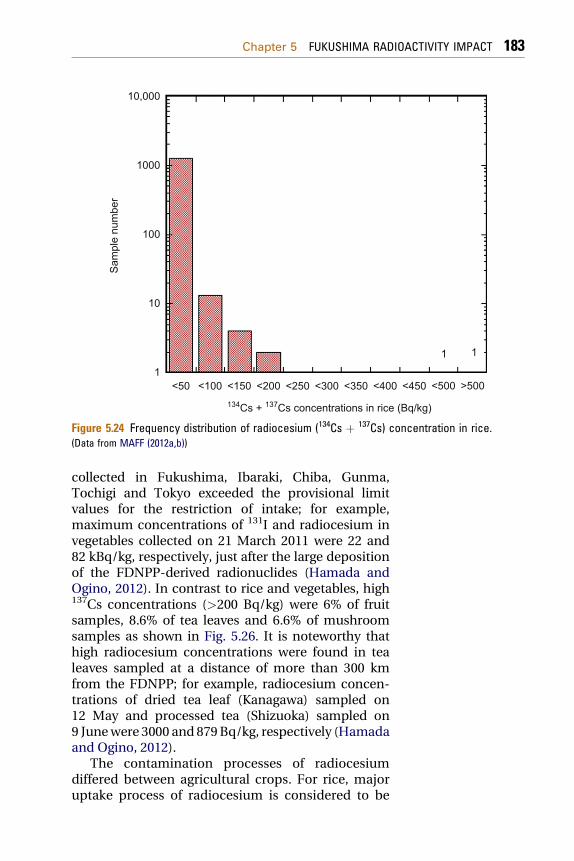
134Cs + 137Cs concentrations in rice (Bq/kg)
10,000
1000
100
10
1
Sam
ple
num
ber
<50 <100 <150 <200 <250 <300 <350 <400 <450 <500 >500
1 1
Figure 5.24 Frequency distribution of radiocesium (134Cs þ 137Cs) concentration in rice.(Data from MAFF (2012a,b))
Chapter 5 FUKUSHIMA RADIOACTIVITY IMPACT 183
collected in Fukushima, Ibaraki, Chiba, Gunma,Tochigi and Tokyo exceeded the provisional limitvalues for the restriction of intake; for example,maximum concentrations of 131I and radiocesium invegetables collected on 21 March 2011 were 22 and82 kBq/kg, respectively, just after the large depositionof the FDNPP-derived radionuclides (Hamada andOgino, 2012). In contrast to rice and vegetables, high137Cs concentrations (>200 Bq/kg) were 6% of fruitsamples, 8.6% of tea leaves and 6.6% of mushroomsamples as shown in Fig. 5.26. It is noteworthy thathigh radiocesium concentrations were found in tealeaves sampled at a distance of more than 300 kmfrom the FDNPP; for example, radiocesium concen-trations of dried tea leaf (Kanagawa) sampled on12 May and processed tea (Shizuoka) sampled on9 Junewere 3000 and 879Bq/kg, respectively (Hamadaand Ogino, 2012).
The contamination processes of radiocesiumdiffered between agricultural crops. For rice, majoruptake process of radiocesium is considered to be
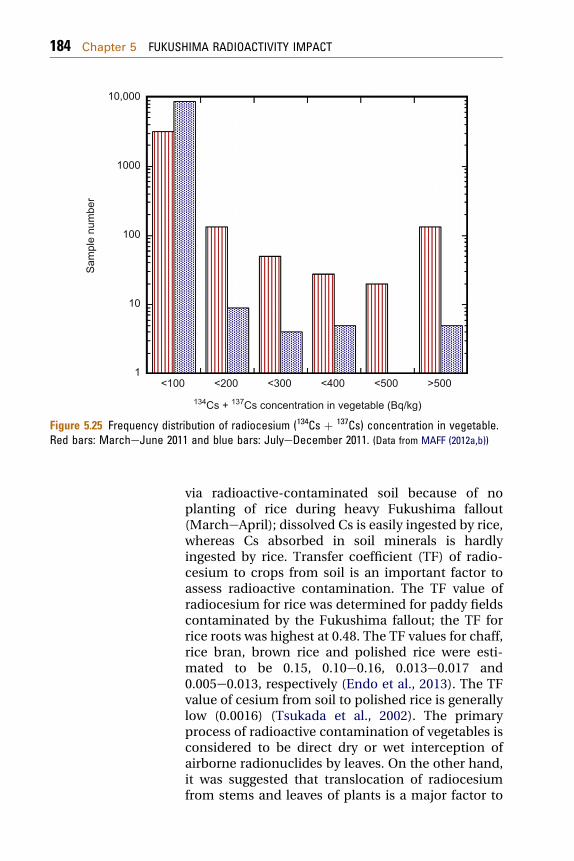
10,000
1000
100
10
1
Sam
ple
num
ber
<100 <200 <300 <400 <500 >500134Cs + 137Cs concentration in vegetable (Bq/kg)
Figure 5.25 Frequency distribution of radiocesium (134Cs þ 137Cs) concentration in vegetable.Red bars: MarcheJune 2011 and blue bars: JulyeDecember 2011. (Data from MAFF (2012a,b))
184 Chapter 5 FUKUSHIMA RADIOACTIVITY IMPACT
via radioactive-contaminated soil because of noplanting of rice during heavy Fukushima fallout(MarcheApril); dissolved Cs is easily ingested by rice,whereas Cs absorbed in soil minerals is hardlyingested by rice. Transfer coefficient (TF) of radio-cesium to crops from soil is an important factor toassess radioactive contamination. The TF value ofradiocesium for rice was determined for paddy fieldscontaminated by the Fukushima fallout; the TF forrice roots was highest at 0.48. The TF values for chaff,rice bran, brown rice and polished rice were esti-mated to be 0.15, 0.10e0.16, 0.013e0.017 and0.005e0.013, respectively (Endo et al., 2013). The TFvalue of cesium from soil to polished rice is generallylow (0.0016) (Tsukada et al., 2002). The primaryprocess of radioactive contamination of vegetables isconsidered to be direct dry or wet interception ofairborne radionuclides by leaves. On the other hand,it was suggested that translocation of radiocesiumfrom stems and leaves of plants is a major factor to
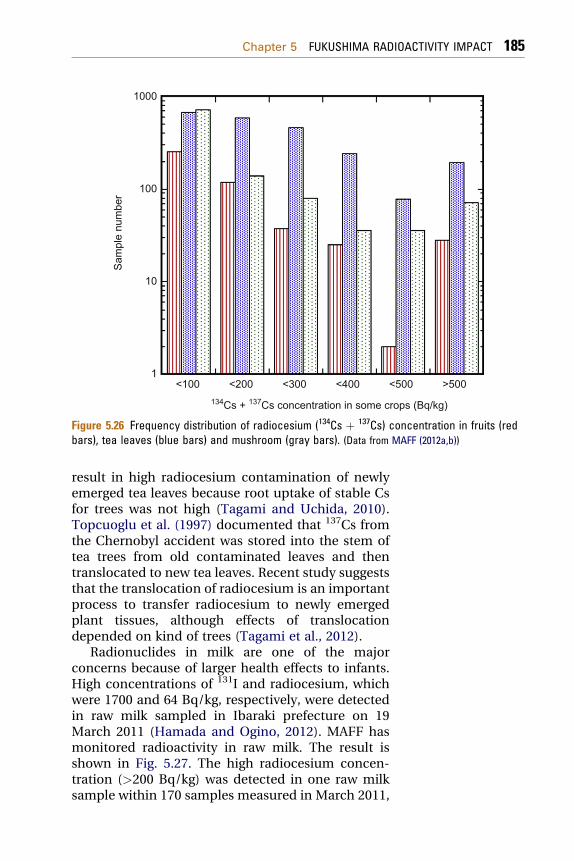
1000
100
10
1
Sam
ple
num
ber
<100 <200 <300 <400 <500 >500134Cs + 137Cs concentration in some crops (Bq/kg)
Figure 5.26 Frequency distribution of radiocesium (134Cs þ 137Cs) concentration in fruits (redbars), tea leaves (blue bars) and mushroom (gray bars). (Data from MAFF (2012a,b))
Chapter 5 FUKUSHIMA RADIOACTIVITY IMPACT 185
result in high radiocesium contamination of newlyemerged tea leaves because root uptake of stable Csfor trees was not high (Tagami and Uchida, 2010).Topcuoglu et al. (1997) documented that 137Cs fromthe Chernobyl accident was stored into the stem oftea trees from old contaminated leaves and thentranslocated to new tea leaves. Recent study suggeststhat the translocation of radiocesium is an importantprocess to transfer radiocesium to newly emergedplant tissues, although effects of translocationdepended on kind of trees (Tagami et al., 2012).
Radionuclides in milk are one of the majorconcerns because of larger health effects to infants.High concentrations of 131I and radiocesium, whichwere 1700 and 64 Bq/kg, respectively, were detectedin raw milk sampled in Ibaraki prefecture on 19March 2011 (Hamada and Ogino, 2012). MAFF hasmonitored radioactivity in raw milk. The result isshown in Fig. 5.27. The high radiocesium concen-tration (>200 Bq/kg) was detected in one raw milksample within 170 samples measured in March 2011,
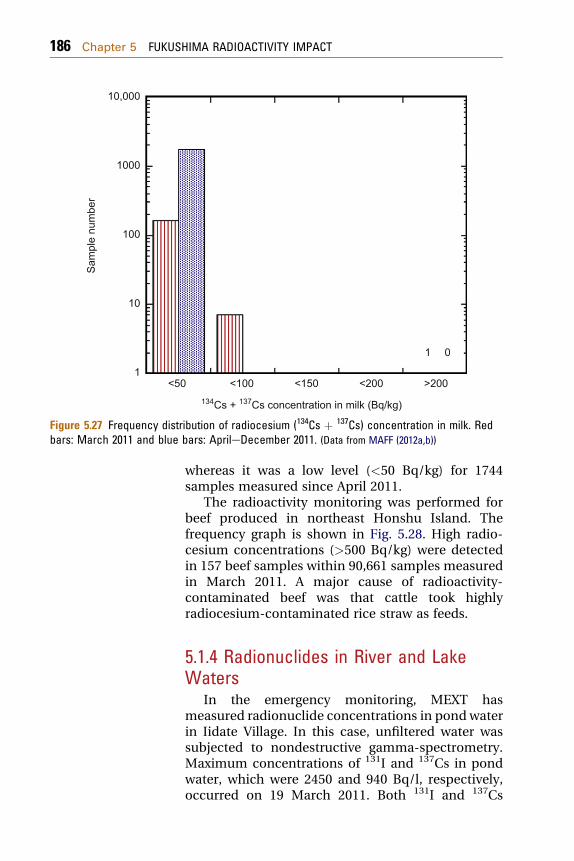
10,000
1000
100
10
1
Sam
ple
num
ber
<50 <100 <150 <200 >200
1 0
134Cs + 137Cs concentration in milk (Bq/kg)
Figure 5.27 Frequency distribution of radiocesium (134Cs þ 137Cs) concentration in milk. Redbars: March 2011 and blue bars: AprileDecember 2011. (Data from MAFF (2012a,b))
186 Chapter 5 FUKUSHIMA RADIOACTIVITY IMPACT
whereas it was a low level (<50 Bq/kg) for 1744samples measured since April 2011.
The radioactivity monitoring was performed forbeef produced in northeast Honshu Island. Thefrequency graph is shown in Fig. 5.28. High radio-cesium concentrations (>500 Bq/kg) were detectedin 157 beef samples within 90,661 samples measuredin March 2011. A major cause of radioactivity-contaminated beef was that cattle took highlyradiocesium-contaminated rice straw as feeds.
5.1.4 Radionuclides in River and LakeWaters
In the emergency monitoring, MEXT hasmeasured radionuclide concentrations in pond waterin Iidate Village. In this case, unfiltered water wassubjected to nondestructive gamma-spectrometry.Maximum concentrations of 131I and 137Cs in pondwater, which were 2450 and 940 Bq/l, respectively,occurred on 19 March 2011. Both 131I and 137Cs
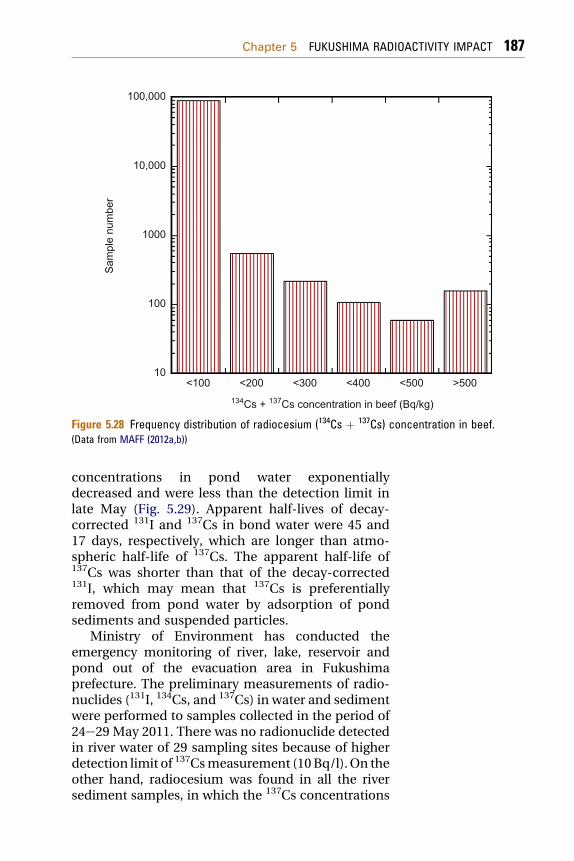
100,000
10,000
1000
100
10
Sam
ple
num
ber
<100 <200 <300 <400 <500 >500134Cs + 137Cs concentration in beef (Bq/kg)
Figure 5.28 Frequency distribution of radiocesium (134Cs þ 137Cs) concentration in beef.(Data from MAFF (2012a,b))
Chapter 5 FUKUSHIMA RADIOACTIVITY IMPACT 187
concentrations in pond water exponentiallydecreased and were less than the detection limit inlate May (Fig. 5.29). Apparent half-lives of decay-corrected 131I and 137Cs in bond water were 45 and17 days, respectively, which are longer than atmo-spheric half-life of 137Cs. The apparent half-life of137Cs was shorter than that of the decay-corrected131I, which may mean that 137Cs is preferentiallyremoved from pond water by adsorption of pondsediments and suspended particles.
Ministry of Environment has conducted theemergency monitoring of river, lake, reservoir andpond out of the evacuation area in Fukushimaprefecture. The preliminary measurements of radio-nuclides (131I, 134Cs, and 137Cs) in water and sedimentwere performed to samples collected in the period of24e29 May 2011. There was no radionuclide detectedin river water of 29 sampling sites because of higherdetection limit of 137Csmeasurement (10Bq/l). On theother hand, radiocesium was found in all the riversediment samples, in which the 137Cs concentrations
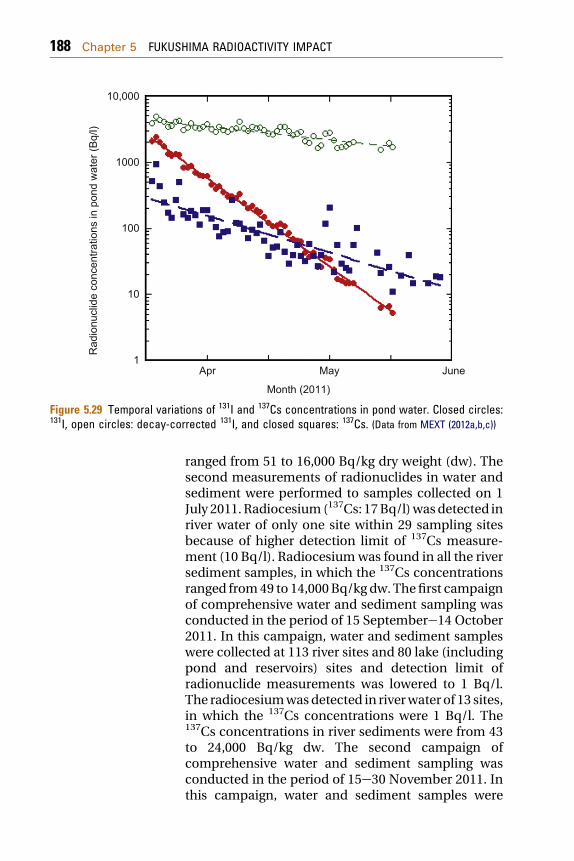
10,000
1000
100
10
1Apr May June
Rad
ionu
clid
e co
ncen
tratio
ns in
pon
d w
ater
(Bq/
l)
Month (2011)
Figure 5.29 Temporal variations of 131I and 137Cs concentrations in pond water. Closed circles:131I, open circles: decay-corrected 131I, and closed squares: 137Cs. (Data from MEXT (2012a,b,c))
188 Chapter 5 FUKUSHIMA RADIOACTIVITY IMPACT
ranged from 51 to 16,000 Bq/kg dry weight (dw). Thesecond measurements of radionuclides in water andsediment were performed to samples collected on 1July 2011.Radiocesium (137Cs: 17Bq/l)wasdetected inriver water of only one site within 29 sampling sitesbecause of higher detection limit of 137Cs measure-ment (10 Bq/l). Radiocesiumwas found in all the riversediment samples, in which the 137Cs concentrationsranged from49 to 14,000Bq/kgdw.Thefirst campaignof comprehensive water and sediment sampling wasconducted in the period of 15 Septembere14 October2011. In this campaign, water and sediment sampleswere collected at 113 river sites and 80 lake (includingpond and reservoirs) sites and detection limit ofradionuclide measurements was lowered to 1 Bq/l.The radiocesiumwasdetected in riverwater of 13 sites,in which the 137Cs concentrations were 1 Bq/l. The137Cs concentrations in river sediments were from 43to 24,000 Bq/kg dw. The second campaign ofcomprehensive water and sediment sampling wasconducted in the period of 15e30 November 2011. Inthis campaign, water and sediment samples were
Chapter 5 FUKUSHIMA RADIOACTIVITY IMPACT 189
collected at 113 river sites and 46 lake (including pondand reservoirs) sites. The radiocesiumwas detected inriver water of only one site, in which the 137Csconcentration was 4 Bq/l. The 137Cs concentrations inriver sediments were from <10 to 49,000 Bq/kg dw.The radiocesium was detected in lake water of eightsites, in which the 137Cs concentrations were in therange of 1e15 Bq/l. The 137Cs concentrations in lakesediments were from <10 to 38,000 Bq/kg dw. Thethird campaign of comprehensivewater and sedimentsampling was conducted in the period of 15e30January 2012. In this campaign, water and sedimentsamples were collected at 113 river sites and 32 lake(includingpondand reservoirs) sites. The radiocesiumconcentrations in river waters were less than thedetection limit (1 Bq/l) at all sampling sites. The 137Csconcentrations in river sediments were from <10 to30,000 Bq/kg dw. The radiocesiumwas detected in thelake water of two sites, in which the 137Cs concentra-tions were in the range of 1e5 Bq/l. The 137Csconcentrations in lake sediments were from <10 to45,000 Bq/kg dw. The fourth campaign of compre-hensive water and sediment sampling was conductedin the period of 25 Februarye14 March 2012. In thiscampaign,water and sediment sampleswere collectedat 113 river sites and 25 lake (including pond andreservoirs) sites. The radiocesium was detected in theriver water of three sites, in which the 137Cs concen-trations were 1 Bq/l. The 137Cs concentrations in riversediments were from <10 to 54,000 Bq/kg dw. Theradiocesium was detected in the lake water of twosites, in which the 137Cs concentrations were 1 Bq/l.The 137Cs concentrations in lake sediments were from<10 to 150,000 Bq/kg dw. The results revealed that theconcentrations of the Fukushima-derived radionu-clides in freshwaters were generally lower than theprovisional limit value of drinking water since June2011. The bottom sediments in river, lake, reservoirand pond were contaminated by the Fukushima-derived radiocesium, although the concentrations ofradiocesium in sediments varied largely, dependingon chemical and mineralogical properties of sedi-ments and location. Unfortunately, there is littleinformation about behaviors of the Fukushima-derived radionuclides in terrestrial environments
190 Chapter 5 FUKUSHIMA RADIOACTIVITY IMPACT
including river, lake and ponds. It is noteworthy thatthe detection limit of radiocesium in freshwater is toohigh to assess the effects of radiocesium to the fresh-water ecosystem because of high concentrationfactors (CFs) (6000: Saxen et al., 2010) of biota infreshwater.
The precious measurements of radionuclides inriverwater (KuchibutoRiver andAbukumaRiver), andpaddy inflow and outflowwere performed (Sakaguchiet al., 2012). Uranium isotopes, plutonium and radi-ocesium in filtered river water collected in JuneeJuly2011 were determined by AMS, ICP-MS and gamma-spectrometry, respectively. 236U among uraniumisotopes is a good indicator to contamination ofreactor-uranium because 236U is enriched in nuclearreactors (Boulyga and Heumann, 2006). The 137Csconcentrations dissolved in river waters were0.02e0.46 Bq/kg, which are more than three orders ofmagnitude greater than that collected in Kuji River(Ibaraki prefecture) in 1988 (0.05e0.12 mBq/kg)(Matsunaga et al., 1991) and about two orders ofmagnitude larger than that collected in Tone River(Kanto Plain) just after the Chernobyl fallout(1.4 mBq/l) (Hirose et al., 1990). The 137Cs concen-trations in inflow and outflow waters of theFukushima paddy fields were 0.10 Bq/kg. The236U/238U atom ratios in riverwaterswere in the rangeof 2.57 � 10�9 to 8.2 � 10�9 and the 236U concentra-tions were (0.82e4.48) � 105 atoms/kg. The resultsindicate that therewasnoevidenceof enriched 236U inriver waters and therefore there was no indication ofrelease of nuclear fuels.
The Fukushima-derived radionuclides in riverwaters in Kanto Plain were determined in late Marchand early April 2011 (Oura and Ebihara, 2012). A highconcentration of 131I in Edogawa River (31 Bq/l)occurred on 28 March, which corresponded to thefirst sampling time, whereas a peak of 137Csconcentration (2.5 Bq/l) appeared on 31 March.
The available monitoring data of the Fukushima-derived radionuclides in freshwaters were limitednow. The further monitoring data in freshwaterswould be needed to have better understanding ofmigration of the radionuclides in the environmentand transfer processes of the radionuclides to plants.
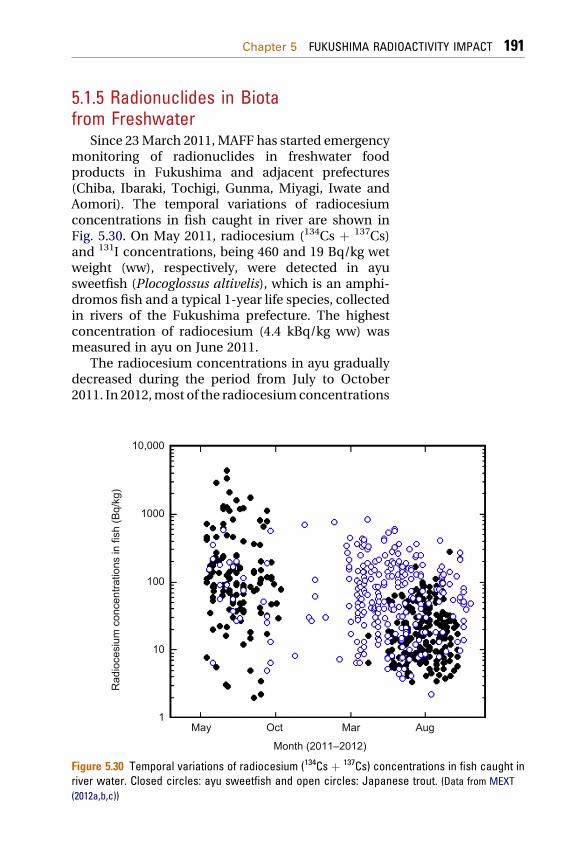
Chapter 5 FUKUSHIMA RADIOACTIVITY IMPACT 191
5.1.5 Radionuclides in Biotafrom Freshwater
Since 23March 2011,MAFF has started emergencymonitoring of radionuclides in freshwater foodproducts in Fukushima and adjacent prefectures(Chiba, Ibaraki, Tochigi, Gunma, Miyagi, Iwate andAomori). The temporal variations of radiocesiumconcentrations in fish caught in river are shown inFig. 5.30. On May 2011, radiocesium (134Cs þ 137Cs)and 131I concentrations, being 460 and 19 Bq/kg wetweight (ww), respectively, were detected in ayusweetfish (Plocoglossus altivelis), which is an amphi-dromos fish and a typical 1-year life species, collectedin rivers of the Fukushima prefecture. The highestconcentration of radiocesium (4.4 kBq/kg ww) wasmeasured in ayu on June 2011.
The radiocesium concentrations in ayu graduallydecreased during the period from July to October2011. In 2012,most of the radiocesiumconcentrations
10,000
1000
100
10
1May Oct Mar Aug
Rad
ioce
sium
con
cent
ratio
ns in
fish
(Bq/
kg)
Month (2011–2012)
Figure 5.30 Temporal variations of radiocesium (134Cs þ 137Cs) concentrations in fish caught inriver water. Closed circles: ayu sweetfish and open circles: Japanese trout. (Data from MEXT(2012a,b,c))
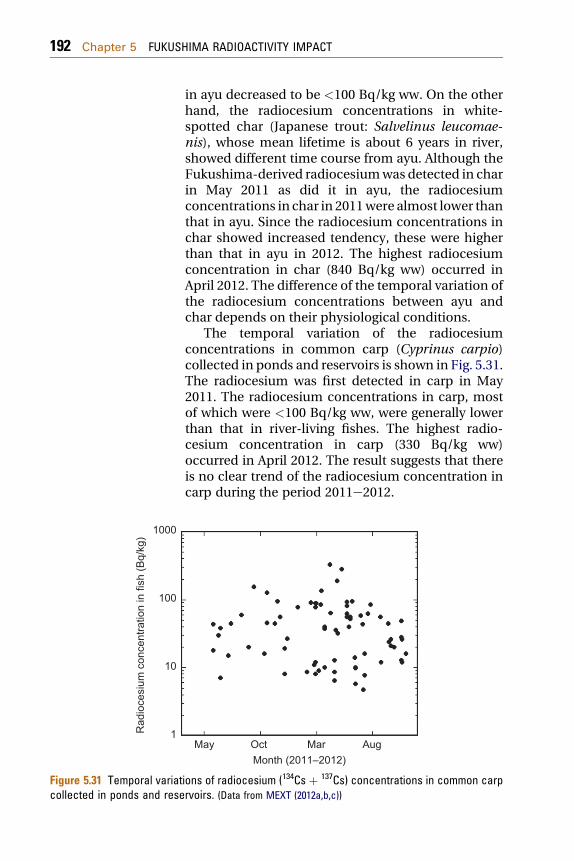
1000
100
10
1Rad
ioce
sium
con
cent
ratio
n in
fish
(Bq/
kg)
Figure 5.31 Temporal variatcollected in ponds and rese
192 Chapter 5 FUKUSHIMA RADIOACTIVITY IMPACT
in ayu decreased to be <100 Bq/kg ww. On the otherhand, the radiocesium concentrations in white-spotted char (Japanese trout: Salvelinus leucomae-nis), whose mean lifetime is about 6 years in river,showed different time course from ayu. Although theFukushima-derived radiocesiumwas detected in charin May 2011 as did it in ayu, the radiocesiumconcentrations in char in 2011were almost lower thanthat in ayu. Since the radiocesium concentrations inchar showed increased tendency, these were higherthan that in ayu in 2012. The highest radiocesiumconcentration in char (840 Bq/kg ww) occurred inApril 2012. The difference of the temporal variation ofthe radiocesium concentrations between ayu andchar depends on their physiological conditions.
The temporal variation of the radiocesiumconcentrations in common carp (Cyprinus carpio)collected in ponds and reservoirs is shown in Fig. 5.31.The radiocesium was first detected in carp in May2011. The radiocesium concentrations in carp, mostof which were <100 Bq/kg ww, were generally lowerthan that in river-living fishes. The highest radio-cesium concentration in carp (330 Bq/kg ww)occurred in April 2012. The result suggests that thereis no clear trend of the radiocesium concentration incarp during the period 2011e2012.
May Oct Mar AugMonth (2011–2012)
ions of radiocesium (134Cs þ 137Cs) concentrations in common carprvoirs. (Data from MEXT (2012a,b,c))
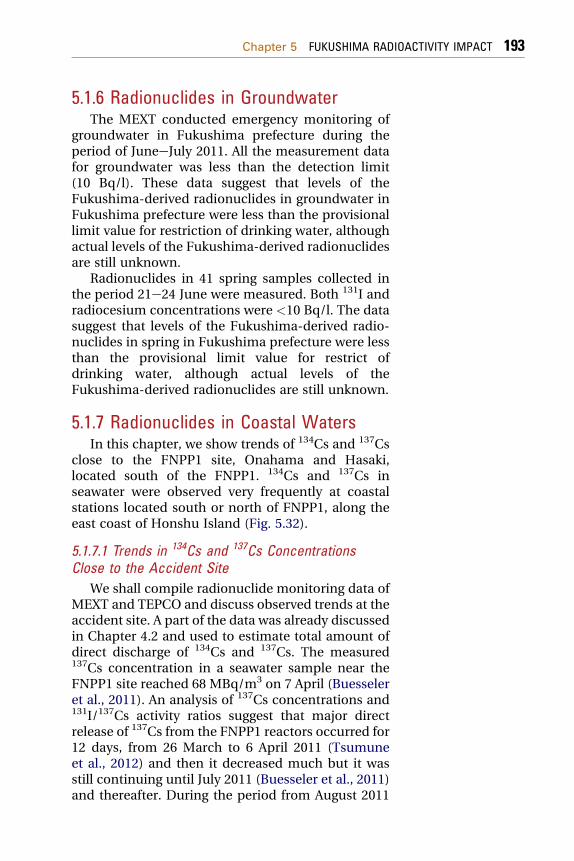
Chapter 5 FUKUSHIMA RADIOACTIVITY IMPACT 193
5.1.6 Radionuclides in Groundwater
The MEXT conducted emergency monitoring ofgroundwater in Fukushima prefecture during theperiod of JuneeJuly 2011. All the measurement datafor groundwater was less than the detection limit(10 Bq/l). These data suggest that levels of theFukushima-derived radionuclides in groundwater inFukushima prefecture were less than the provisionallimit value for restriction of drinking water, althoughactual levels of the Fukushima-derived radionuclidesare still unknown.
Radionuclides in 41 spring samples collected inthe period 21e24 June were measured. Both 131I andradiocesium concentrations were <10 Bq/l. The datasuggest that levels of the Fukushima-derived radio-nuclides in spring in Fukushima prefecture were lessthan the provisional limit value for restrict ofdrinking water, although actual levels of theFukushima-derived radionuclides are still unknown.
5.1.7 Radionuclides in Coastal Waters
In this chapter, we show trends of 134Cs and 137Csclose to the FNPP1 site, Onahama and Hasaki,located south of the FNPP1. 134Cs and 137Cs inseawater were observed very frequently at coastalstations located south or north of FNPP1, along theeast coast of Honshu Island (Fig. 5.32).
5.1.7.1 Trends in 134Cs and 137Cs ConcentrationsClose to the Accident Site
We shall compile radionuclide monitoring data ofMEXT and TEPCO and discuss observed trends at theaccident site. A part of the data was already discussedin Chapter 4.2 and used to estimate total amount ofdirect discharge of 134Cs and 137Cs. The measured137Cs concentration in a seawater sample near theFNPP1 site reached 68 MBq/m3 on 7 April (Buesseleret al., 2011). An analysis of 137Cs concentrations and131I/137Cs activity ratios suggest that major directrelease of 137Cs from the FNPP1 reactors occurred for12 days, from 26 March to 6 April 2011 (Tsumuneet al., 2012) and then it decreased much but it wasstill continuing until July 2011 (Buesseler et al., 2011)and thereafter. During the period from August 2011
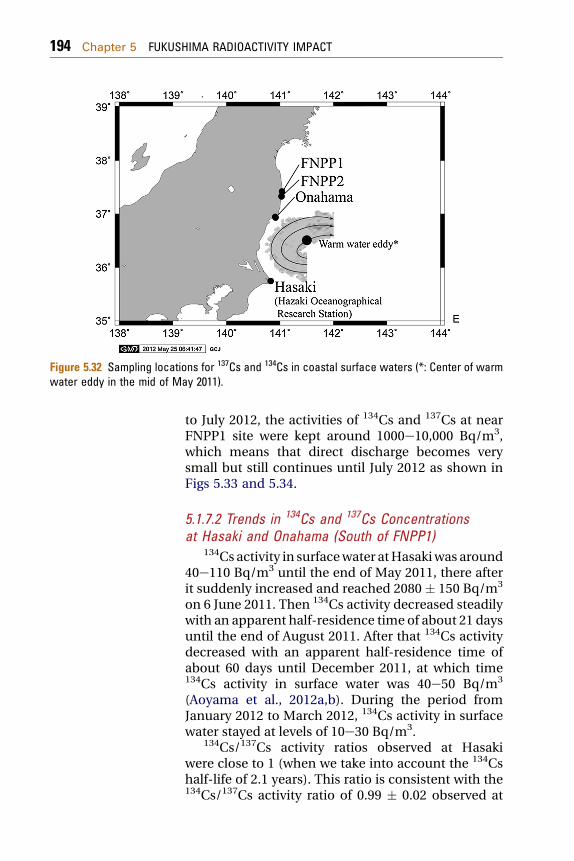
Figure 5.32 Sampling locations for 137Cs and 134Cs in coastal surface waters (*: Center of warmwater eddy in the mid of May 2011).
194 Chapter 5 FUKUSHIMA RADIOACTIVITY IMPACT
to July 2012, the activities of 134Cs and 137Cs at nearFNPP1 site were kept around 1000e10,000 Bq/m3,which means that direct discharge becomes verysmall but still continues until July 2012 as shown inFigs 5.33 and 5.34.
5.1.7.2 Trends in 134Cs and 137Cs Concentrationsat Hasaki and Onahama (South of FNPP1)
134Cs activity in surfacewater atHasakiwas around40e110 Bq/m3 until the end of May 2011, there afterit suddenly increased and reached 2080 � 150 Bq/m3
on 6 June 2011. Then 134Cs activity decreased steadilywith an apparent half-residence time of about 21 daysuntil the end of August 2011. After that 134Cs activitydecreased with an apparent half-residence time ofabout 60 days until December 2011, at which time134Cs activity in surface water was 40e50 Bq/m3
(Aoyama et al., 2012a,b). During the period fromJanuary 2012 to March 2012, 134Cs activity in surfacewater stayed at levels of 10e30 Bq/m3.
134Cs/137Cs activity ratios observed at Hasakiwere close to 1 (when we take into account the 134Cshalf-life of 2.1 years). This ratio is consistent with the134Cs/137Cs activity ratio of 0.99 � 0.02 observed at
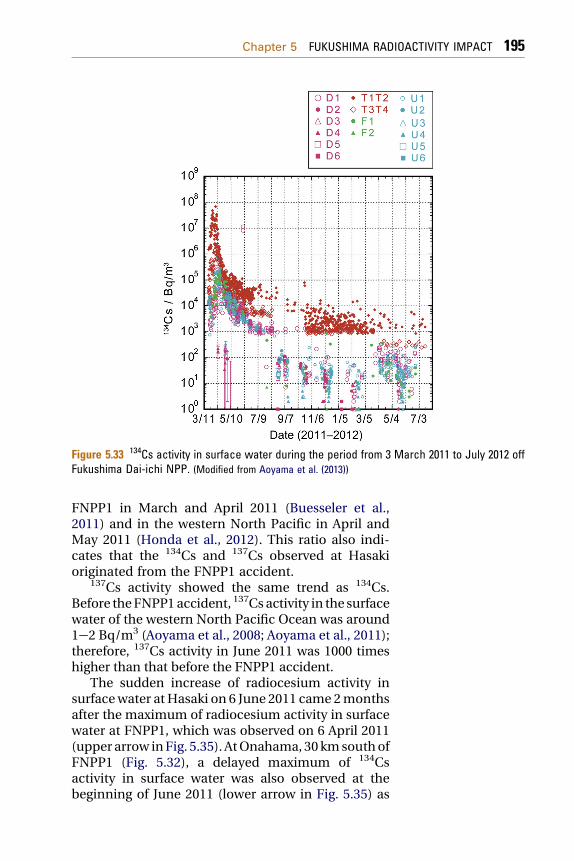
Figure 5.33 134Cs activity in surface water during the period from 3 March 2011 to July 2012 offFukushima Dai-ichi NPP. (Modified from Aoyama et al. (2013))
Chapter 5 FUKUSHIMA RADIOACTIVITY IMPACT 195
FNPP1 in March and April 2011 (Buesseler et al.,2011) and in the western North Pacific in April andMay 2011 (Honda et al., 2012). This ratio also indi-cates that the 134Cs and 137Cs observed at Hasakioriginated from the FNPP1 accident.
137Cs activity showed the same trend as 134Cs.Before theFNPP1accident, 137Cs activity in the surfacewater of the western North Pacific Ocean was around1e2 Bq/m3 (Aoyama et al., 2008; Aoyama et al., 2011);therefore, 137Cs activity in June 2011 was 1000 timeshigher than that before the FNPP1 accident.
The sudden increase of radiocesium activity insurfacewater atHasaki on 6 June 2011 came 2monthsafter the maximum of radiocesium activity in surfacewater at FNPP1, which was observed on 6 April 2011(upper arrow inFig. 5.35). AtOnahama, 30 kmsouthofFNPP1 (Fig. 5.32), a delayed maximum of 134Csactivity in surface water was also observed at thebeginning of June 2011 (lower arrow in Fig. 5.35) as
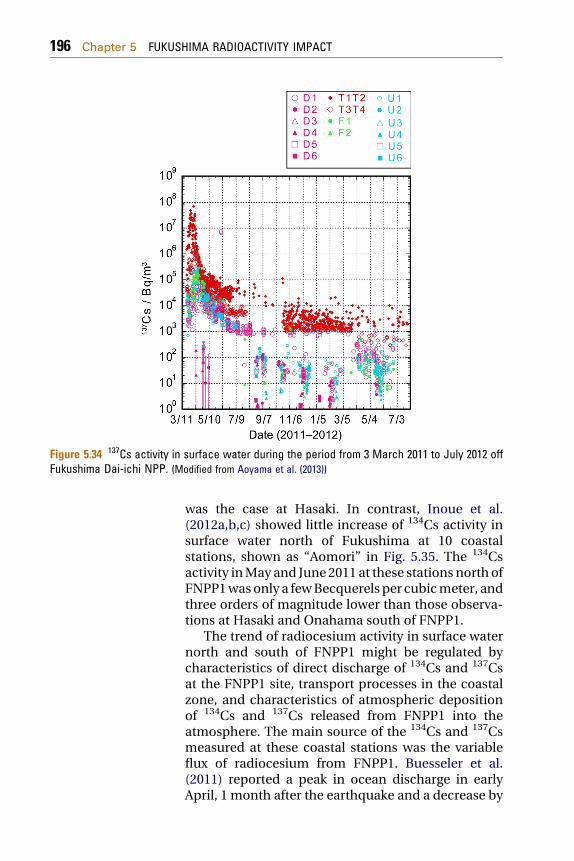
Figure 5.34 137Cs activity in surface water during the period from 3 March 2011 to July 2012 offFukushima Dai-ichi NPP. (Modified from Aoyama et al. (2013))
196 Chapter 5 FUKUSHIMA RADIOACTIVITY IMPACT
was the case at Hasaki. In contrast, Inoue et al.(2012a,b,c) showed little increase of 134Cs activity insurface water north of Fukushima at 10 coastalstations, shown as “Aomori” in Fig. 5.35. The 134Csactivity inMay and June2011 at these stations north ofFNPP1wasonly a fewBecquerels per cubicmeter, andthree orders of magnitude lower than those observa-tions at Hasaki and Onahama south of FNPP1.
The trend of radiocesium activity in surface waternorth and south of FNPP1 might be regulated bycharacteristics of direct discharge of 134Cs and 137Csat the FNPP1 site, transport processes in the coastalzone, and characteristics of atmospheric depositionof 134Cs and 137Cs released from FNPP1 into theatmosphere. The main source of the 134Cs and 137Csmeasured at these coastal stations was the variableflux of radiocesium from FNPP1. Buesseler et al.(2011) reported a peak in ocean discharge in earlyApril, 1 month after the earthquake and a decrease by
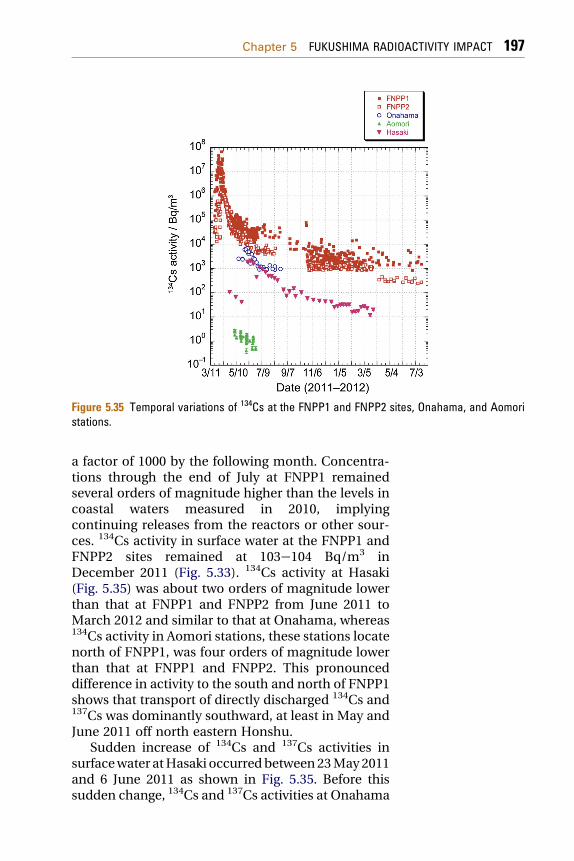
Figure 5.35 Temporal variations of 134Cs at the FNPP1 and FNPP2 sites, Onahama, and Aomoristations.
Chapter 5 FUKUSHIMA RADIOACTIVITY IMPACT 197
a factor of 1000 by the following month. Concentra-tions through the end of July at FNPP1 remainedseveral orders of magnitude higher than the levels incoastal waters measured in 2010, implyingcontinuing releases from the reactors or other sour-ces. 134Cs activity in surface water at the FNPP1 andFNPP2 sites remained at 103e104 Bq/m3 inDecember 2011 (Fig. 5.33). 134Cs activity at Hasaki(Fig. 5.35) was about two orders of magnitude lowerthan that at FNPP1 and FNPP2 from June 2011 toMarch 2012 and similar to that at Onahama, whereas134Cs activity in Aomori stations, these stations locatenorth of FNPP1, was four orders of magnitude lowerthan that at FNPP1 and FNPP2. This pronounceddifference in activity to the south and north of FNPP1shows that transport of directly discharged 134Cs and137Cs was dominantly southward, at least in May andJune 2011 off north eastern Honshu.
Sudden increase of 134Cs and 137Cs activities insurfacewater atHasaki occurredbetween23May2011and 6 June 2011 as shown in Fig. 5.35. Before thissudden change, 134Cs and 137Cs activities at Onahama
198 Chapter 5 FUKUSHIMA RADIOACTIVITY IMPACT
already exceeded 2000 Bq/m3 while those at Hasakiwere only around 50e100 Bq/m3 in mid of May 2011(Fig. 5.35). This indicates that southward transport of134Cs and 137Cs released from FNPP1 to Hasaki wererelatively limited rather than southward transport toOanahama until the end of May 2011. Coast transportprocesses are very complex in this sea area and thesemight be controlled by Kuroshio, mesoscale eddiesassociated with Kuroshio and freshwater flux fromland. Therefore, it is interesting and important todiscuss about the sudden increase of 134Cs and 137Csactivities at Hasaki regarding with hydrographicconditions near the coast of this region. In fact, therewasawarmwater eddyofwhich center locatedat 36.5�N, 141.4� E off Iwaki between Onahama andHasaki inthe middle of May 2011 as shown in Fig. 5.32. Clock-wise current associated with this warm water eddy,which means northward current east of this warmwater eddy, might be able to prevent southwardtransport of 134Cs and 137Cs as we stated previously.This warm water eddy disappeared on 30 May 2011and as a consequence, sudden increase of 134Cs and137Cs activities in surface water at Hasaki and Ona-hama were observed. Just before these changes,a difference of 134Cs and 137Cs activities in surfacewater between Hasaki and FNPP1 was 500 times ormore. After the suddenchanges, thedifferenceof 134Csand 137Cs activities in surface water between bothstations decreased to only 30 times indicating thatincreased southward transport reaching at Hasakimade less activity difference between these twostations. We also can see small decrease of 134Cs and137Cs activities in surface water at FNPP1 and FNPP2between the end of May and the beginning of June2011 as shown in Fig. 5.35. These small decreasesoccurring at the similar period with increases ofHasaki and Onahama may also indicate enhancedsouthward transport as discussed above, if we canassume less changeon134Csand137CsfluxesatFNPP1.
5.1.8 Radionuclides in Coastal Biota
5.1.8.1 Radionuclides in FishThe Japanese MAFF has continuously beenmonitoring radionuclides in fish and other seafood
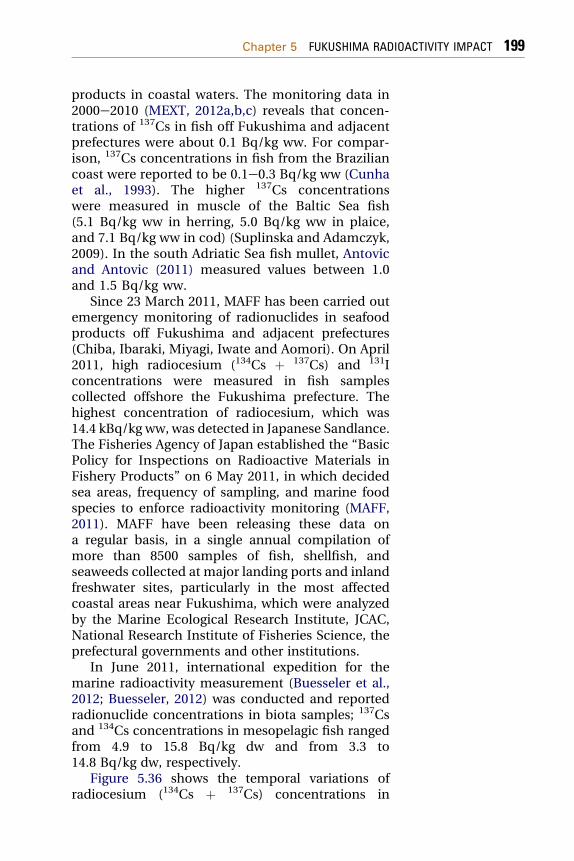
Chapter 5 FUKUSHIMA RADIOACTIVITY IMPACT 199
products in coastal waters. The monitoring data in2000e2010 (MEXT, 2012a,b,c) reveals that concen-trations of 137Cs in fish off Fukushima and adjacentprefectures were about 0.1 Bq/kg ww. For compar-ison, 137Cs concentrations in fish from the Braziliancoast were reported to be 0.1e0.3 Bq/kg ww (Cunhaet al., 1993). The higher 137Cs concentrationswere measured in muscle of the Baltic Sea fish(5.1 Bq/kg ww in herring, 5.0 Bq/kg ww in plaice,and 7.1 Bq/kg ww in cod) (Suplinska and Adamczyk,2009). In the south Adriatic Sea fish mullet, Antovicand Antovic (2011) measured values between 1.0and 1.5 Bq/kg ww.
Since 23 March 2011, MAFF has been carried outemergency monitoring of radionuclides in seafoodproducts off Fukushima and adjacent prefectures(Chiba, Ibaraki, Miyagi, Iwate and Aomori). On April2011, high radiocesium (134Cs þ 137Cs) and 131Iconcentrations were measured in fish samplescollected offshore the Fukushima prefecture. Thehighest concentration of radiocesium, which was14.4 kBq/kg ww, was detected in Japanese Sandlance.The Fisheries Agency of Japan established the “BasicPolicy for Inspections on Radioactive Materials inFishery Products” on 6 May 2011, in which decidedsea areas, frequency of sampling, and marine foodspecies to enforce radioactivity monitoring (MAFF,2011). MAFF have been releasing these data ona regular basis, in a single annual compilation ofmore than 8500 samples of fish, shellfish, andseaweeds collected at major landing ports and inlandfreshwater sites, particularly in the most affectedcoastal areas near Fukushima, which were analyzedby the Marine Ecological Research Institute, JCAC,National Research Institute of Fisheries Science, theprefectural governments and other institutions.
In June 2011, international expedition for themarine radioactivity measurement (Buesseler et al.,2012; Buesseler, 2012) was conducted and reportedradionuclide concentrations in biota samples; 137Csand 134Cs concentrations in mesopelagic fish rangedfrom 4.9 to 15.8 Bq/kg dw and from 3.3 to14.8 Bq/kg dw, respectively.
Figure 5.36 shows the temporal variations ofradiocesium (134Cs þ 137Cs) concentrations in
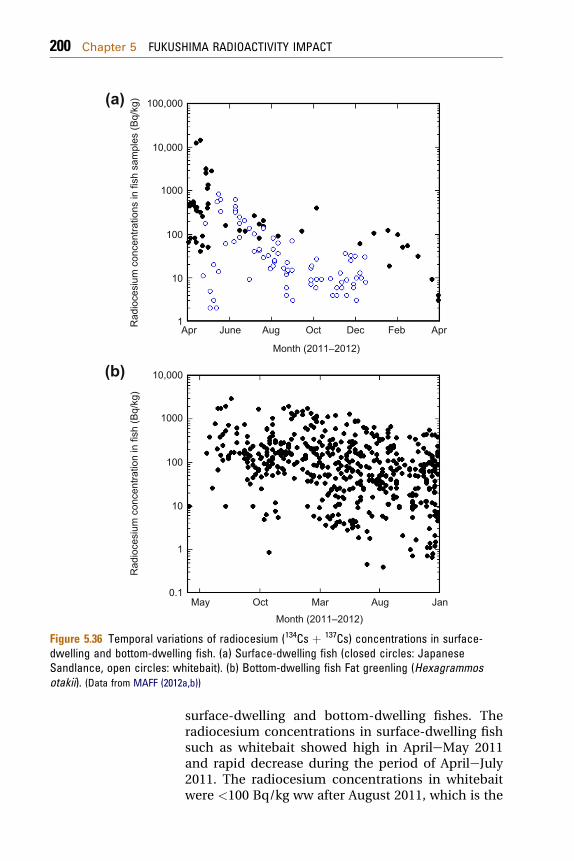
Month (2011–2012)May Oct Mar Aug Jan
Apr
(a)
(b)
Rad
ioce
sium
con
cent
ratio
ns in
fish
sam
ples
(Bq/
kg)
Rad
ioce
sium
con
cent
ratio
n in
fish
(Bq/
kg)
100,000
10,000
1000
100
10
1
10,000
1000
100
10
1
0.1
June Aug
Month (2011–2012)
Oct Dec Feb Apr
Figure 5.36 Temporal variations of radiocesium (134Cs þ 137Cs) concentrations in surface-dwelling and bottom-dwelling fish. (a) Surface-dwelling fish (closed circles: JapaneseSandlance, open circles: whitebait). (b) Bottom-dwelling fish Fat greenling (Hexagrammosotakii). (Data from MAFF (2012a,b))
200 Chapter 5 FUKUSHIMA RADIOACTIVITY IMPACT
surface-dwelling and bottom-dwelling fishes. Theradiocesium concentrations in surface-dwelling fishsuch as whitebait showed high in AprileMay 2011and rapid decrease during the period of AprileJuly2011. The radiocesium concentrations in whitebaitwere <100 Bq/kg ww after August 2011, which is the
Chapter 5 FUKUSHIMA RADIOACTIVITY IMPACT 201
new regulatory limit for food consumption. On theother hand, the high radiocesium concentrations inbottom-dwelling fish appeared in May 2011.Although its concentrations in Fat Greenling sampledoff Fukushima gradually decreased, they still excee-ded the new regulatory limit in the end of 2012. TheMAFF results show that total radiocesium levels indemersal (bottom-dwelling) fish, including manyimportant commercial species, are highest offFukushima and lower in four prefectures to the northand south (Buesseler et al., 2012). Fishing for thesespecies is banned off Fukushima, where 40% of fishare above the new regulatory limit (MAFF, 2012a).
Demersal fish have higher cesium levels thanother marine fish types, grouped here as epipelagic(near-surface), pelagic (open ocean), and neuston(surface-dwelling) fish. Contamination levels ofdemersal fish are comparable only to those offreshwater fish. Radiocesium levels have notdecreased 1 year after the accident, except perhaps inneuston, and as of August 2012, fish are still beingfound with radiocesium levels above 100 Bq/kg ww.The highest total radiocesium levels found to date,more than 25 kBq/kg ww, were from two greenlingcaught in August 2012, closer to the shore offFukushima (TEPCO, 2012a,b,c).
In order to understand transfer of radiocesiumfrom seawater to marine biota, CFs have beenintroduced, which are defined as the ratio ofa radionuclide concentration in biota (becquerel perkilogram wet sample) to corresponding dissolvedconcentration in seawater (becquerel per kilogram).To determine a CF value, the concentrations of 137Csand stable Cs in some marine fish have previouslybeen studied (Suzuki et al., 1973). Generally, 137Csconcentrations in fish muscle were higher than inviscera, and marine fishes have CF values of 43 � 12(arithmetic mean and standard deviation). The CFvalues for 137Cs were determined in Japanese coastalfishes collected from 1984 to 1990 (Tateda andKoyanagi, 1996), in which 137Cs/Cs (stable) atomratios were also examined to clarify the distributionequilibrium of 137Cs between marine coastal fishand seawater. The geometric mean of the CF inJapanese coastal fishes was 52� 4 (standard error of
202 Chapter 5 FUKUSHIMA RADIOACTIVITY IMPACT
the mean), with values ranging from 14 to 133. The137Cs/Cs atom ratios in both marine fish andseawater, which were (5.2 � 1.4) � 10�9 and(4.5 � 1.1) � 10�9 atom ratios, respectively, indicatethat the distribution of 137Cs was in equilibriumbetween fish muscle and seawater. The 137Cs CFvalues for the South Adriatic Sea mullet were re-ported to be 38e46 in muscle (Antovic and Antovic,2011). The IAEA (2004) recommended a value of 100as a generalized CF for 137Cs in fish. This recom-mended value was confirmed by Steel (1991), whoreported the CF of 92 � 43 (cod), 58 � 17 (haddock),39 � 16 (plaice) and 150 � 82 (whiting) (arithmeticmean and standard deviation) for North Sea fishcollected from 1978 to 1985. These findings suggestthat radiocesium accumulates in fish muscle tissueswith relatively modest CFs; the 137Cs concentrationin fish is typically 100 times that in the surroundingseawater. The CFs increase only slightly as onemoves up the food chain (Doi et al., 2012). Bio-accumulation is much higher in general in fresh-water fish because of lower salinities, in which theCF of freshwater fish such as pike was 6000 (Saxenet al., 2010). Uptake of cesium is balanced by lossback to the ocean, which increases with body sizeand metabolic rate (Doi et al., 2012). The loss rate isa few percentage per day on average and hasbeen shown to be faster if the cesium supply ispulsed rather than steady (Rowan and Rasmussen,1995). The average 137Cs CF between fish (SouthAdriatic Sea mullet) and sediment was calculatedto be 1.4 � 0.4 (Antovic and Antovic, 2011). Incase when the sediment was seriously contami-nated by radiocesium, this CF value suggests thatthere is a possibility of occurrence of highlyradiocesium-contaminated demersal fish even if theradiocesium concentrations in seawater decreased<1 Bq/l.
5.1.8.2 SeaweedsThe background levels of 137Cs concentrations in
blown algae were summarized byMorita et al. (2010a).The 137Cs concentrations in blown algae offshoreJapan ranged from 0.02 to 0.09 Bq/kg ww during the
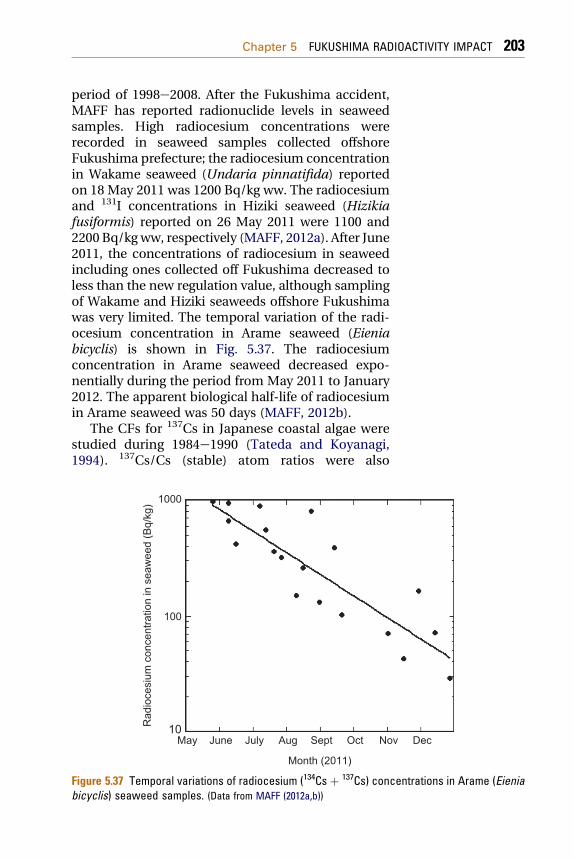
Chapter 5 FUKUSHIMA RADIOACTIVITY IMPACT 203
period of 1998e2008. After the Fukushima accident,MAFF has reported radionuclide levels in seaweedsamples. High radiocesium concentrations wererecorded in seaweed samples collected offshoreFukushima prefecture; the radiocesium concentrationin Wakame seaweed (Undaria pinnatifida) reportedon 18 May 2011 was 1200 Bq/kg ww. The radiocesiumand 131I concentrations in Hiziki seaweed (Hizikiafusiformis) reported on 26 May 2011 were 1100 and2200 Bq/kg ww, respectively (MAFF, 2012a). After June2011, the concentrations of radiocesium in seaweedincluding ones collected off Fukushima decreased toless than the new regulation value, although samplingof Wakame and Hiziki seaweeds offshore Fukushimawas very limited. The temporal variation of the radi-ocesium concentration in Arame seaweed (Eieniabicyclis) is shown in Fig. 5.37. The radiocesiumconcentration in Arame seaweed decreased expo-nentially during the period from May 2011 to January2012. The apparent biological half-life of radiocesiumin Arame seaweed was 50 days (MAFF, 2012b).
The CFs for 137Cs in Japanese coastal algae werestudied during 1984e1990 (Tateda and Koyanagi,1994). 137Cs/Cs (stable) atom ratios were also
May
1000
100
10Rad
ioce
sium
con
cent
ratio
n in
sea
wee
d (B
q/kg
)
June July Aug Sept
Month (2011)
Oct Nov Dec
Figure 5.37 Temporal variations of radiocesium (134Cs þ 137Cs) concentrations in Arame (Eieniabicyclis) seaweed samples. (Data from MAFF (2012a,b))
204 Chapter 5 FUKUSHIMA RADIOACTIVITY IMPACT
examined to clarify the distribution equilibrium of137Cs in marine algae and seawater. The CF values inmarine algae were within the range from 5.4 to 92,and the geometric mean of CF was 28 � 2 (standarderror) in Japanese coastal species. The CF values inedible species were within the range from 5.4 to 67,and the geometric mean of CF was 26 � 4 (standarderror). The values of 137Cs/Cs atom ratios in marinealgae and seawater, being (4.6 � 0.6) � 10�9 (ediblealgae) and (4.5 � 0.4) � 10�9 atom ratios, respec-tively, indicated that 137Cs reached an equilibriumstate in partition between algae and seawater.Therefore, the CF value obtained in this study can beregarded as an equilibrated value. The temporalvariation of the CF value for 137Cs at the Japan Seacoastal area were examined during 1975e2007(Morita et al., 2010a). The CF values, ranging from 3.6to 45 for 137Cs, showed gradual increase in thisperiod, although its level was similar to that of theprevious reports (Tateda and Koyanagi, 1994). Theresults revealed that the CF values for 137Cs in Japa-nese coastal algae were consistent with the Japaneseguideline CFs, although they were smaller than therecommended value of 50 by IAEA (2004).
5.1.8.3 PlanktonMAFF has been analyzing radiocesium in
zooplankton off Fukushima and Miyagi prefectures.The radiocesium (134Cs þ 137Cs) concentrations inzooplankton sampled in July 2011eFebruary 2012ranged from 0.3 to 8.4 Bq/kg ww (MAFF, 2012b). Theradiocesium in zooplankton collected at station K2(47� N, 160� E) and S1 (30� N, 145� E) in AprileMay2011was determined byHonda et al. (2012). The 137Csconcentration in zooplankton from the surface mixedlayer (upper 80 m) was 13.5 Bq/kg dw, and that inzooplankton from the subsurface layer (80e200 m)was 59.2 Bq/kg dw. The corresponding values at S1were 71.5 Bq/kg dw in the surface mixed layer (upper50 m) and 57.7 Bq/kg dw in the subsurface layer(50e200m). 134Cswas also detected in all zooplanktonsamples, with 134Cs/137Cs ratios of nearly 1. The 137Csconcentrations in zooplankton on a wet-weight basiswere estimated using the water contents of respective
Chapter 5 FUKUSHIMA RADIOACTIVITY IMPACT 205
zooplankton samples (about 90%), which corre-sponded to 1.7 (4.0) and 3.2 (4.3) Bq/kg ww in surfaceand subsurface from K2 (S1), respectively.
According to the result of the international expe-dition for the marine radioactivity measurement(Buesseler et al., 2012), conducted in June 2011, 137Csand 134Cs concentrations in zooplankton rangedfrom 0.3 to 56.4, and from not detected to 45.5 Bq/kgdw, respectively. Pre-Fukushima 137Cs level inzooplankton around Japan was <0.1 Bq/kg ww(w0.08 Bq/kg ww) (Kasamatsu and Ishikawa, 1997)and 0.01e0.02 Bq/kg ww (Kaeriyama et al., 2008).These findings revealed that the radiocesium levels inpost-Fukushima zooplankton were more than oneorder of magnitude greater than that of pre-Fukushima. These concentrations are comparableto those observed just after the Chernobyl accident,in which the 137Cs concentration in zooplankton inthe southern Baltic Sea and the northern Adriatic Seawere 0.4e2.1 Bq/kg ww (Knapinska-Skiba et al., 2003)and about 5 Bq/kg ww (Marzano and Triulzi, 2003),respectively.
The CF was also determined for 137Cs inzooplankton. The reported CF values for zooplanktonoff Japan are 10e100 (Kasamatsu and Ishikawa, 1997;Kaeriyama et al., 2008). For Fukushima-derivedradiocesium, the median values of CF (Buesseleret al., 2012) were 44 for 137Cs and 36 for 134Cs,comparable to the recommended InternationalAtomic Energy Agency (IAEA) value of 40 forzooplankton (IAEA, 2004).
5.1.8.4 Other Radionuclides in BiotaSignificant amounts of radiostrontium have also
been discharged in marine environment due to theFukushima accident (Povinec et al., 2012c). MAFFhas measured radiostrontium in biota samples(MAFF, 2012c). Although the level of radiostrontiumin biota was generally low (<0.1 Bq/kg ww), inwhich the IAEA recommended CF for fish (IAEA,2004) is 3. The 89Sr and 90Sr concentrations of 0.45and 1.2 Bq/kg ww, respectively, were detected ina Rockfish (Sebastes cheni) sample collected on 12December 2011.
206 Chapter 5 FUKUSHIMA RADIOACTIVITY IMPACT
Silver is known to be one of the highly biologicalactive elements, which is enriched in squid organs(Oikawa et al., 2003) and in crabs (Morita et al.,2010b). Buesseler et al. (2012) documented that110mAg was detected in zooplankton samples withconcentrations ranging from 0.5 to 23.6 Bq/kg dw,whereas it was undetectable in all fish samples.Although no direct releases of 110mAg to the coastalocean have been reported, the Fukushima-derived110mAg was measured in deposition samples as wellas in soil samples. Pathway to zooplankton is unclearbecause dissolved 110mAg concentrations in seawatercould not be measured.
5.2 World AtmosphereLarge radionuclide releases during MarcheApril
2011 from the tsunami-damaged Fukushima Dai-ichiNPP caused measurable radionuclide contaminationof the global environment. As the prevailing winddirection in Japan is from the west to the east, theradioactive plume was transported over the PacificOcean to be registered first by the CTBTO radionu-clide monitoring stations in Hawaii, and later at thewest coast of USA (Diaz Leon et al., 2011), in Europe atIsland, and later by many national laboratories(Masson et al., 2011; Baeza et al., 2012; Barsanti et al.,2012;Bossevet al., 2012;Carvalhoet al., 2012;Clemenzaet al., 2012; Cosma et al., 2012; Ioannidou et al.,2012; Kritidis et al., 2012; Lujaniene et al., 2012a,b,2013; Manolopoulou et al., 2011; Pi�nero Garcıa andFerro Garcıa, 2012; Povinec et al., 2012a,c, 2013a).
The most often detected radionuclides were 137Cs(T1/2 ¼ 30.17 years), 134Cs (T1/2 ¼ 2.06 years) and 131I(T1/2 ¼ 8.02 days). They represent anthropogenicradionuclides without natural contribution, whichhavebeen released fromnuclear reprocessing facilitiesand nuclear reactors (Livingston and Povinec, 2000;Mizutani et al., 2009). Under normal conditions only137Cs, released during atmospheric tests of nuclearweapons and during the Chernobyl accident, is stillpresent in the environment due to its long half-life(Livingston and Povinec, 2002). The 137Cs has been ofgreat radiological concern due to its relatively longphysical half-life and its bioavailability. Because ofhigh abundance and accumulation in human tissue, it
Chapter 5 FUKUSHIMA RADIOACTIVITY IMPACT 207
hr1
vettnP
damrtedA1eKK
atf1
atbie2mrra
bdtssat
asbeen important fromthepointof viewofdeliveringadiation doses to the public (Aarkrog et al., 1997). The37Cs is present in atmospheric aerosols, soil andegetation. It has been used worldwide as a tracer ofnvironmental processes, specifically for studyingransport process in atmospheric, marine and terres-rial ecosystems (Livingston and Povinec, 2002; Povi-ec et al., 2003a,b; Lee et al., 2002; Igarashi et al., 2005;hametal., 2010, 2011; Lujaniene et al., 2006a,b, 2009).Radionuclides released after the Fukushima acci-
ent to the atmosphereweremostly in the gaseousanderosol forms. The first group has been representedainly by 133Xe (half-life of 5.24 days), which had also
eached the highest released activities from a short-erm source (13e20 � 1018 Bq as estimated by Stohlt al. (2011)). Radionuclide release rates from theamaged Fukushima NPP have large uncertainties.tmospheric releases for 137Cs are in the range of3e15 PBq, and liquid releases directly to the sea werestimated to be from 1 to 41 PBq (Chino et al., 2011;awamura et al., 2011; Tsumune et al., 2012; Dietz andriest, 2012; Bailly du Bois et al., 2012).The 131I represents a radionuclide released to the
tmosphere during a nuclear accident in large quan-ities mostly in gaseous, aerosol, acid and organicorms (Povinec et al., 1988;Masson et al., 2011). While31I is radioecologically one of the most importantnthropogenic radionuclides because of its associa-ion with thyroid cancer, 129I on the other hand isecause of its long half-life (1.57 � 107 years) a usefulsotope tracer for studying transport processes in thenvironment (Raisbeck and Yiou, 1999; Povinec et al.,010). The last group of radionuclides, representedainly by 137Cs, is after release to the atmosphere
apidly associatedwith aerosol particles. This groupofadionuclides represents a major reservoir of radio-ctive contaminants of the atmosphere.The radionuclides associated with aerosols have
een deposited on the Earth’s surface by wet and dryepositions. Before the Chernobyl accident,emporal variations of 137Cs in the surface air weretrongly related to global fallout, which was strato-pherically controlled. Concentrations of 137Cs in thetmosphere had a decreasing trend after the mora-orium on testing nuclear weapons in the atmo-sphere signed in 1963. Similarly as for other global
208 Chapter 5 FUKUSHIMA RADIOACTIVITY IMPACT
fallout radionuclides, the 137Cs atmosphericconcentration peaked in 1963 (Livingston andPovinec, 2002). The second marked 137Cs peak in thesurface air occurred in 1986, just after the Chernobylaccident. For example, the maximum 137Cs activityconcentration measured in the Bratislava air in 1986was 4 Bq/m3, about 200,000 higher than the pre-Chernobyl value (Povinec et al., 1988). A few yearsafter the Chernobyl accident, the summer maximacharacteristic for the transport of 137Cs from thestratosphere to the troposphere were still visible,later, during the 1990s, the main source of atmo-spheric 137Cs became the soil resuspension (Phamet al., 2011, 2013; Povinec et al., 2012a). Therefore,most of the pre-Fukushima 137Cs found in the ground-level air had been from resuspension of the deposited137Cs (of global fallout and the Chernobyl origin) insoil. The 137Cs levels measured during the pre-Fukushima period ranged in Bratislava from 0.04 to1.6 mBq/m3, with the mean value of 0.49 mBq/m3
(Povinec et al., 2012a). Short-lived radionuclidessuch as 131I and 134Cs have already decayed after theChernobyl accident. Their maximum levels observedduring AprileMay 1986 in the Bratislava air were 14Bq/m3 and2Bq/m3, respectively (Povinec et al., 1988).
In this subchapter, we shall discuss global atmo-spheric dispersion of particles from the FukushimaNPP using a Lagrangian stochastic dispersion model,and compare them with the radionuclide measure-ments in aerosols. We are focusing on 131I, 134Cs and137Cs, as they are considered to be the most impor-tant for the long-term radiological impact because oflarge releases, relatively long half-lives and theircontributions to radiation doses of the public. Suchinvestigations are important prerequisite of radio-logical assessment of the Fukushima accident in theterrestrial and marine environments, as well as infuture possible accidental releases of radionuclidesfrom nuclear installations.
5.2.1 Radionuclide Source Terms Usedin the Modeling Exercises
The discharged radioactive materials from theFukushima NPP consisted of many types of
Chapter 5 FUKUSHIMA RADIOACTIVITY IMPACT 209
radionuclides; however, we list in Table 5.3 only themost important ones. Radionuclide release ratesfrom the Fukushima NPP (Chino et al., 2011;Kawamura et al., 2011) were estimated on the basis ofTEPCO, Nuclear and Industrial Safety Agency andIAEA press releases to the public (TEPCO, 2011a;NISA, 2011a,b; IAEA, 2011). Following pressureventing of the reactor containments, hydrogenexplosions and fires in the Fukushima Dai-ichi NPP,themain atmospheric radionuclide releases occurredbetween 12 and 16 March 2011, with smaller contri-butions up to 24 March. The total atmosphericreleases of 131I and 137Cs were estimated to be around160 and 15 PBq, respectively (Table 5.3). The contri-bution of 134Cs was similar to 137Cs as the 134Cs/137Csactivity ratio was close to one. The estimated releaserates in the cases of 131I and 137Cs are well above1 PBq which require specific terrestrial and marineradioactivity assessment studies (Livingston andPovinec, 2000), necessary for the radiation protectionof the total environment, i.e. the man, fauna andflora. However, as there are still large uncertainties inthe estimation of the radionuclide source terms, weshall use in our simulation experiments as an inputa 137Cs release into the atmosphere of 1 PBq. Thisunit input value will enable to adjust the obtainedmodeling results by multiplying them by a factorvalue which may be better known at the later timewhen more precise radionuclide source-term func-tions will be available.
5.2.2 Data on Radioactivity of Aerosolsover Europe
In order to compare modeling and measure-ment approaches in the spatial and temporalvariations of the distribution of Fukushima-derivedradionuclides over the Europe, an integrated dataset presented in Fig. 5.38 has been used. The 131Idata (which have had the highest spatial resolutionand smallest experimental uncertainties) reportedby the northern European stations (Masson et al.,2011; JER, 2012) have been combined to presenta general view on its spatial and temporal
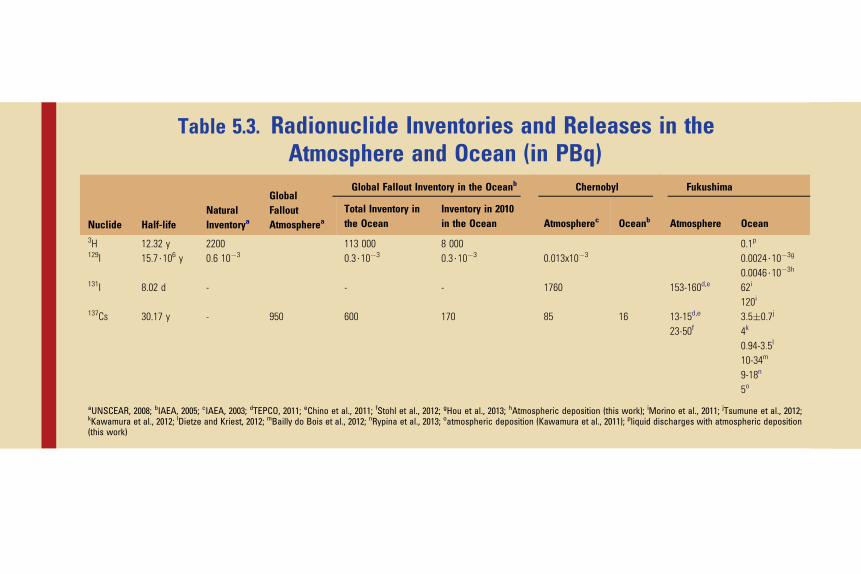
Table 5.3. Radionuclide Inventorie and Releases in theAtmosphere and Ocea (in PBq)
Nuclide Half-lifeNaturalInventorya
GlobalFalloutAtmospherea
Global Fallout Inventory in the Oce nb Chernobyl Fukushima
Total Inventory inthe Ocean
Inventory in 2 0in the Ocean Atmospherec Oceanb Atmosphere Ocean
3H 12.32 y 2200 113 000 8 000 0.1p129I 15.7$106 y 0.6 10�3 0.3$10�3 0.3$10�3 0.013x10�3 0.0024$10�3g
0.0046$10�3h
131I 8.02 d - - - 1760 153-160d,e 62i
120i137Cs 30.17 y - 950 600 170 85 16 13-15d,e
23-50f3.5�0.7j
4k
0.94-3.5l
10-34m
9-18n
5o
aUNSCEAR, 2008; bIAEA, 2005; cIAEA, 2003; dTEPCO, 2011; eChino et al., 2011; fStohl et al., 2012; gHou et al., 201 hAtmospheric deposition (this work); iMorino et al., 2011; jTsumune et al., 2012;kKawamura et al., 2012; lDietze and Kriest, 2012; mBailly do Bois et al., 2012; nRypina et al., 2013; oatmospheric d osition (Kawamura et al., 2011); pliquid discharges with atmospheric deposition(this work)
sna
01
3;ep
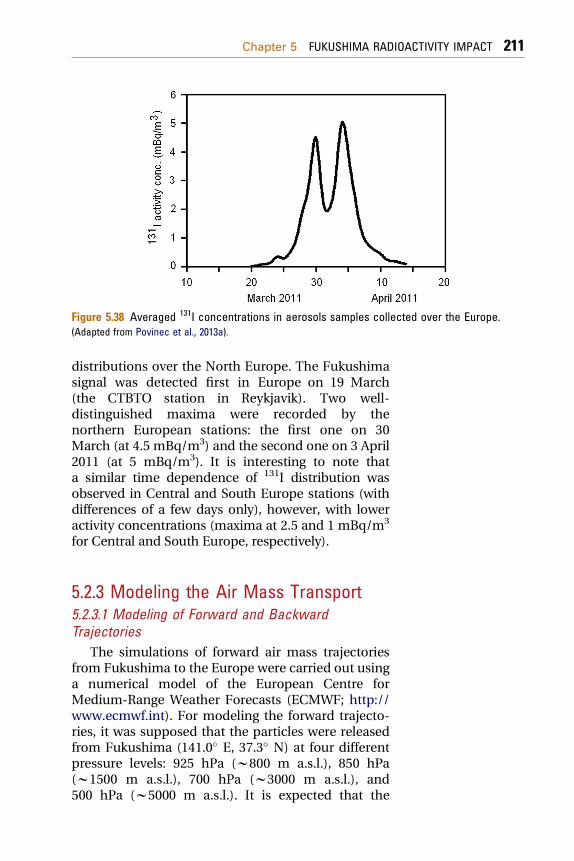
Figure 5.38 Averaged 131I concentrations in aerosols samples collected over the Europe.(Adapted from Povinec et al., 2013a).
Chapter 5 FUKUSHIMA RADIOACTIVITY IMPACT 211
distributions over the North Europe. The Fukushimasignal was detected first in Europe on 19 March(the CTBTO station in Reykjavik). Two well-distinguished maxima were recorded by thenorthern European stations: the first one on 30March (at 4.5 mBq/m3) and the second one on 3 April2011 (at 5 mBq/m3). It is interesting to note thata similar time dependence of 131I distribution wasobserved in Central and South Europe stations (withdifferences of a few days only), however, with loweractivity concentrations (maxima at 2.5 and 1 mBq/m3
for Central and South Europe, respectively).
5.2.3 Modeling the Air Mass Transport
5.2.3.1 Modeling of Forward and BackwardTrajectoriesThe simulations of forward air mass trajectoriesfrom Fukushima to the Europe were carried out usinga numerical model of the European Centre forMedium-Range Weather Forecasts (ECMWF; http://www.ecmwf.int). For modeling the forward trajecto-ries, it was supposed that the particles were releasedfrom Fukushima (141.0� E, 37.3� N) at four differentpressure levels: 925 hPa (w800 m a.s.l.), 850 hPa(w1500 m a.s.l.), 700 hPa (w3000 m a.s.l.), and500 hPa (w5000 m a.s.l.). It is expected that the
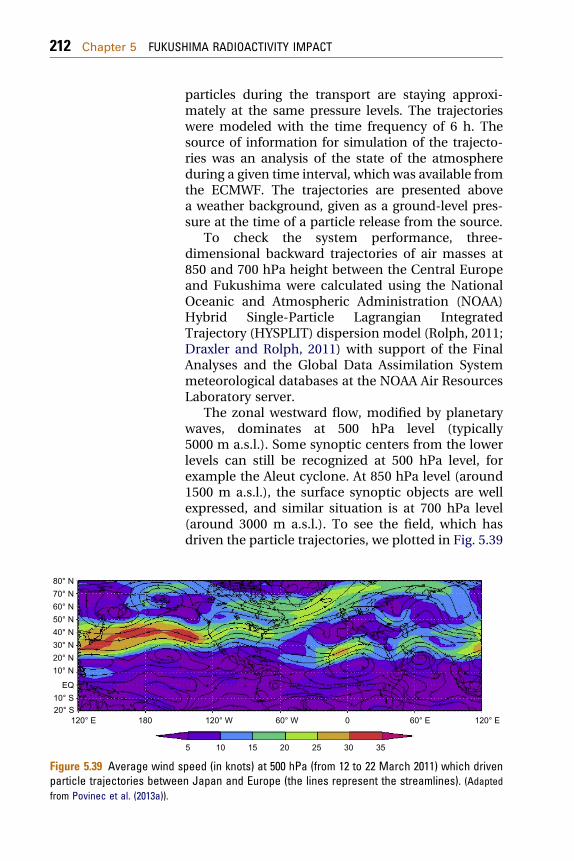
120° E
80° N70° N60° N50° N40° N30° N20° N10° N
EQ10° S20° S
180
Figure 5.39 Average wind sparticle trajectories betweefrom Povinec et al. (2013a)).
212 Chapter 5 FUKUSHIMA RADIOACTIVITY IMPACT
particles during the transport are staying approxi-mately at the same pressure levels. The trajectorieswere modeled with the time frequency of 6 h. Thesource of information for simulation of the trajecto-ries was an analysis of the state of the atmosphereduring a given time interval, which was available fromthe ECMWF. The trajectories are presented abovea weather background, given as a ground-level pres-sure at the time of a particle release from the source.
To check the system performance, three-dimensional backward trajectories of air masses at850 and 700 hPa height between the Central Europeand Fukushima were calculated using the NationalOceanic and Atmospheric Administration (NOAA)Hybrid Single-Particle Lagrangian IntegratedTrajectory (HYSPLIT) dispersion model (Rolph, 2011;Draxler and Rolph, 2011) with support of the FinalAnalyses and the Global Data Assimilation Systemmeteorological databases at the NOAA Air ResourcesLaboratory server.
The zonal westward flow, modified by planetarywaves, dominates at 500 hPa level (typically5000 m a.s.l.). Some synoptic centers from the lowerlevels can still be recognized at 500 hPa level, forexample the Aleut cyclone. At 850 hPa level (around1500 m a.s.l.), the surface synoptic objects are wellexpressed, and similar situation is at 700 hPa level(around 3000 m a.s.l.). To see the field, which hasdriven the particle trajectories, we plotted in Fig. 5.39
5
120° W 60° W 0 60° E 120° E
10 15 20 25 30 35
peed (in knots) at 500 hPa (from 12 to 22 March 2011) which drivenn Japan and Europe (the lines represent the streamlines). (Adapted
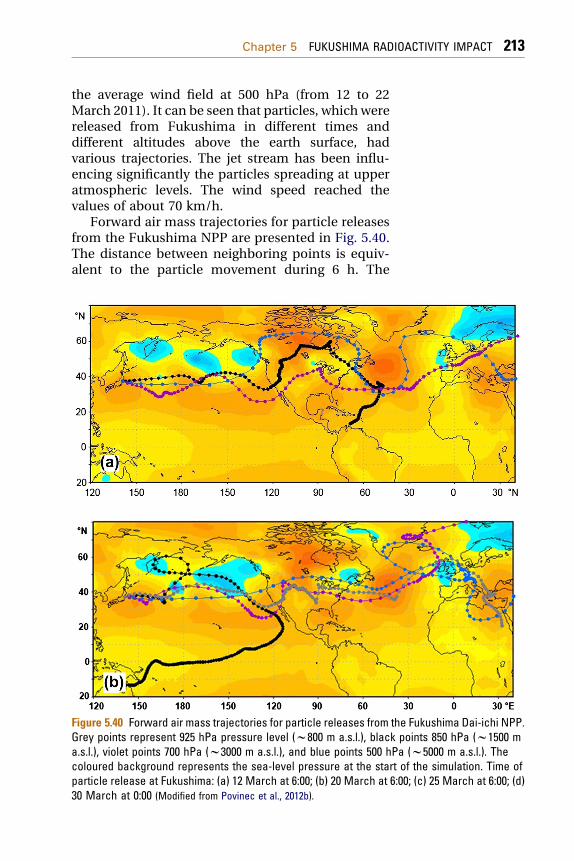
Chapter 5 FUKUSHIMA RADIOACTIVITY IMPACT 213
the average wind field at 500 hPa (from 12 to 22March 2011). It can be seen that particles, which werereleased from Fukushima in different times anddifferent altitudes above the earth surface, hadvarious trajectories. The jet stream has been influ-encing significantly the particles spreading at upperatmospheric levels. The wind speed reached thevalues of about 70 km/h.
Forward air mass trajectories for particle releasesfrom the Fukushima NPP are presented in Fig. 5.40.The distance between neighboring points is equiv-alent to the particle movement during 6 h. The
Figure 5.40 Forward air mass trajectories for particle releases from the Fukushima Dai-ichi NPP.Grey points represent 925 hPa pressure level (w800 m a.s.l.), black points 850 hPa (w1500 ma.s.l.), violet points 700 hPa (w3000 m a.s.l.), and blue points 500 hPa (w5000 m a.s.l.). Thecoloured background represents the sea-level pressure at the start of the simulation. Time ofparticle release at Fukushima: (a) 12 March at 6:00; (b) 20 March at 6:00; (c) 25 March at 6:00; (d)30 March at 0:00 (Modified from Povinec et al., 2012b).
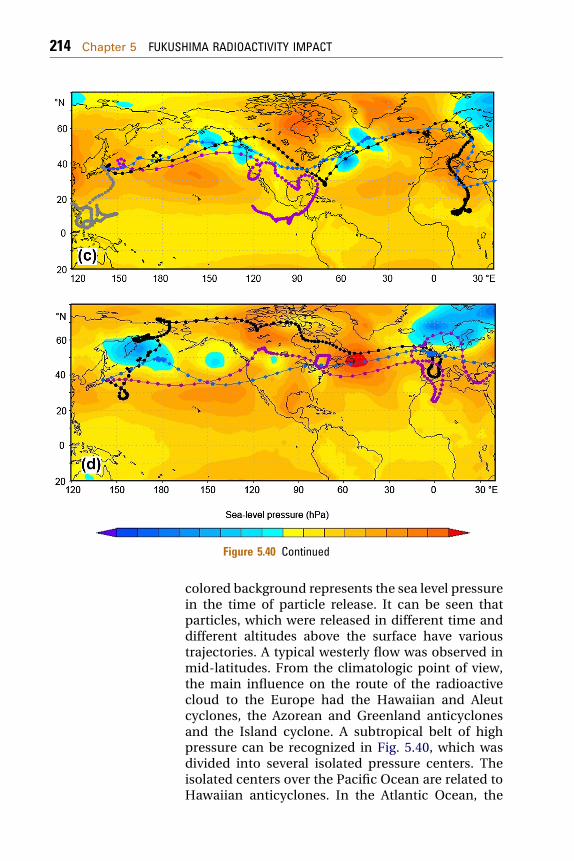
Figure 5.40 Continued
214 Chapter 5 FUKUSHIMA RADIOACTIVITY IMPACT
colored background represents the sea level pressurein the time of particle release. It can be seen thatparticles, which were released in different time anddifferent altitudes above the surface have varioustrajectories. A typical westerly flow was observed inmid-latitudes. From the climatologic point of view,the main influence on the route of the radioactivecloud to the Europe had the Hawaiian and Aleutcyclones, the Azorean and Greenland anticyclonesand the Island cyclone. A subtropical belt of highpressure can be recognized in Fig. 5.40, which wasdivided into several isolated pressure centers. Theisolated centers over the Pacific Ocean are related toHawaiian anticyclones. In the Atlantic Ocean, the

Chapter 5 FUKUSHIMA RADIOACTIVITY IMPACT 215
situation differed from the average atmosphericcirculation. The Azorean anticyclone center is shif-ted to northwestern direction, where interactionwith the Greenland anticyclone is observed, which isblocking a straight propagation of particles to theeast. The low polar pressure belt is broken toa cyclone with center close to the Kamchatkapeninsula and the Bering Sea. In the Atlantic Ocean,the center of low pressure is located in the Norwe-gian and Barents Seas. These pressure objectsmodified the zonal prevalent flow. Sea level pres-sures presented in Fig. 5.40 in the background arefrom initial time releases. During several days ofspreading of particles in the air, the pressure fieldsare naturally modified. This fact has been includedin the computation of trajectories.
The simulations revealed that particles releasedfrom Fukushima on 11 March arrived to Europe at850 hPa on 13 April, at 700 hPa on 30 March and at500 hPa on 20 March. The particles released on 12March at 00:00 Coordinated Universal Time did notreach the European territory at all. A different situationis observed for particles released just 6 h laterdtheparticles at 700 hPa reached the Europe on 1 April, at500 hPa on 20 March, and at 850 hPa, they did notreach the European territory.
The origin of the first radionuclide signal observedin the European air should be associated with the firstlarge radionuclide releases, which originated inFukushima on 11e12 March. The simulations indi-cate particle trajectories at 500 hPa level arriving toEurope on 20e22March (Fig. 5.40; as we have limitedspace available, in all modeling exercises we shallpresent only a few dispersion maps). The main jetstream of the plume was traveling over the PacificOcean, North America, Greenland, the AtlanticOcean, Island and Scandinavia to the Central Europe.
In other to better understand variations in the airtransport at different altitudes and arrival times ofthe Fukushima radioactive plumes in Europe, weused a backward-trajectory approach based on theECMWF and NOAA HYSPLITmodels. A large numberof air mass backward trajectories were calculatedover the time of interest. The results obtained usingthe ECMWF model (Fig. 5.41A) are in a reasonable
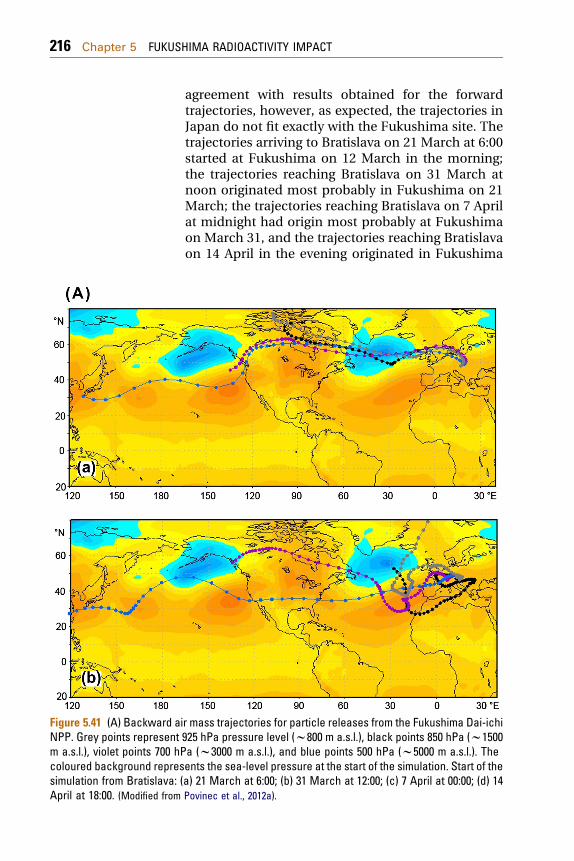
Figure 5.41 (A) Backward aiNPP. Grey points representm a.s.l.), violet points 700 hPcoloured background repressimulation from Bratislava: (April at 18:00. (Modified from
216 Chapter 5 FUKUSHIMA RADIOACTIVITY IMPACT
agreement with results obtained for the forwardtrajectories, however, as expected, the trajectories inJapan do not fit exactly with the Fukushima site. Thetrajectories arriving to Bratislava on 21 March at 6:00started at Fukushima on 12 March in the morning;the trajectories reaching Bratislava on 31 March atnoon originated most probably in Fukushima on 21March; the trajectories reaching Bratislava on 7 Aprilat midnight had origin most probably at Fukushimaon March 31, and the trajectories reaching Bratislavaon 14 April in the evening originated in Fukushima
r mass trajectories for particle releases from the Fukushima Dai-ichi925 hPa pressure level (w800 m a.s.l.), black points 850 hPa (w1500a (w3000 m a.s.l.), and blue points 500 hPa (w5000 m a.s.l.). Theents the sea-level pressure at the start of the simulation. Start of thea) 21 March at 6:00; (b) 31 March at 12:00; (c) 7 April at 00:00; (d) 14Povinec et al., 2012a).
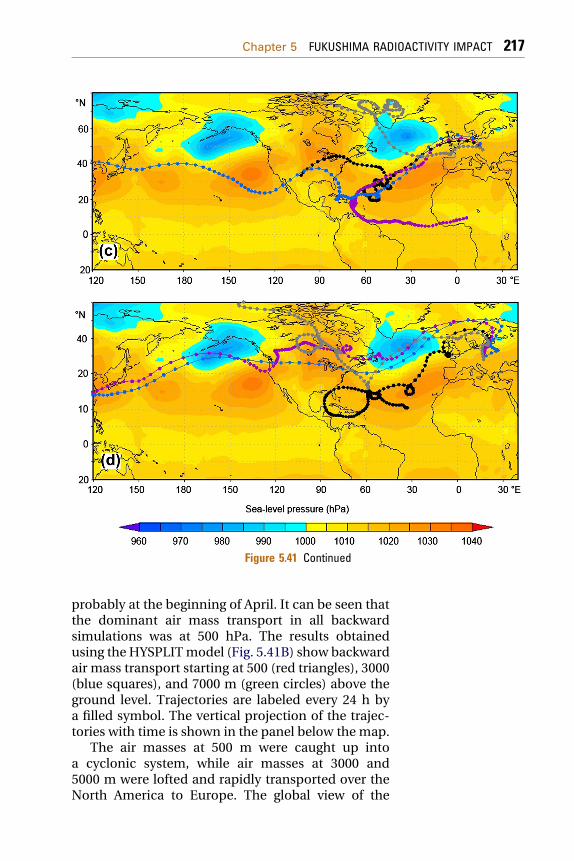
Figure 5.41 Continued
Chapter 5 FUKUSHIMA RADIOACTIVITY IMPACT 217
probably at the beginning of April. It can be seen thatthe dominant air mass transport in all backwardsimulations was at 500 hPa. The results obtainedusing the HYSPLITmodel (Fig. 5.41B) show backwardair mass transport starting at 500 (red triangles), 3000(blue squares), and 7000 m (green circles) above theground level. Trajectories are labeled every 24 h bya filled symbol. The vertical projection of the trajec-tories with time is shown in the panel below the map.
The air masses at 500 m were caught up intoa cyclonic system, while air masses at 3000 and5000 m were lofted and rapidly transported over theNorth America to Europe. The global view of the
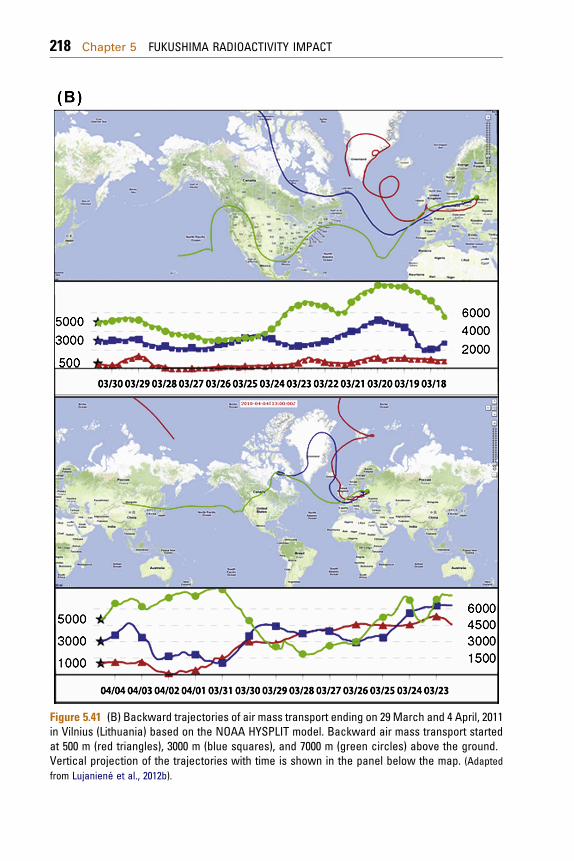
Figure 5.41 (B) Backward trajectories of air mass transport ending on 29 March and 4 April, 2011in Vilnius (Lithuania) based on the NOAA HYSPLIT model. Backward air mass transport startedat 500 m (red triangles), 3000 m (blue squares), and 7000 m (green circles) above the ground.Vertical projection of the trajectories with time is shown in the panel below the map. (Adaptedfrom Lujaniené et al., 2012b).
218 Chapter 5 FUKUSHIMA RADIOACTIVITY IMPACT
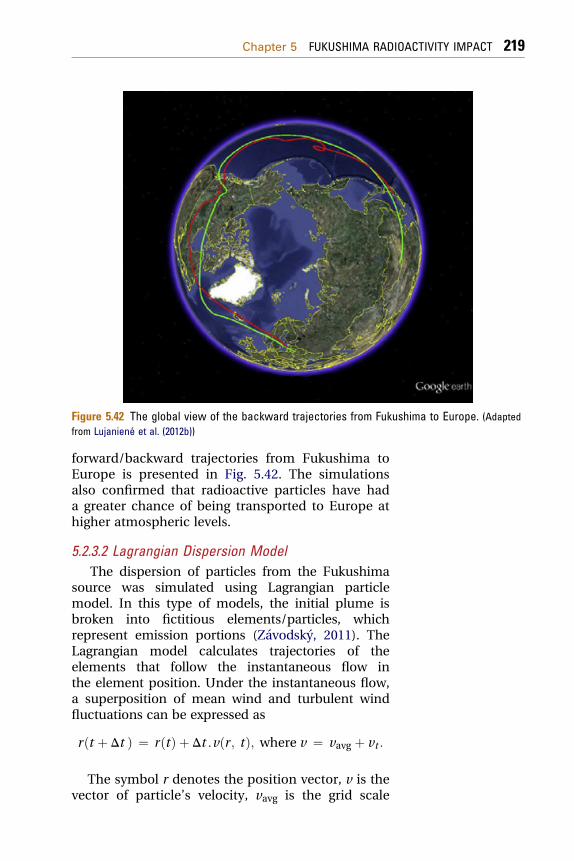
Figure 5.42 The global view of the backward trajectories from Fukushima to Europe. (Adaptedfrom Lujaniené et al. (2012b))
Chapter 5 FUKUSHIMA RADIOACTIVITY IMPACT 219
forward/backward trajectories from Fukushima toEurope is presented in Fig. 5.42. The simulationsalso confirmed that radioactive particles have hada greater chance of being transported to Europe athigher atmospheric levels.
5.2.3.2 Lagrangian Dispersion ModelThe dispersion of particles from the Fukushima
source was simulated using Lagrangian particlemodel. In this type of models, the initial plume isbroken into fictitious elements/particles, whichrepresent emission portions (Zavodsky, 2011). TheLagrangian model calculates trajectories of theelements that follow the instantaneous flow inthe element position. Under the instantaneous flow,a superposition of mean wind and turbulent windfluctuations can be expressed as
rðt þ Dt Þ ¼ rðtÞ þ Dt$vðr; tÞ; where v ¼ vavg þ vt :
The symbol r denotes the position vector, v is thevector of particle’s velocity, vavg is the grid scale
220 Chapter 5 FUKUSHIMA RADIOACTIVITY IMPACT
mean wind, and vt represents the turbulent windfluctuations.
The output particle velocity is a sum of the deter-ministic velocity and the semirandom stochasticvelocity, generatedusingMonteCarlo techniques. Theprobability density function for the random compo-nent, which simulates the atmospheric turbulence, isdependent on the state of the atmospheric boundarylayer. Thus, both basic scales of atmospheric motionsare taken into account. The model can also take intoaccount a decay of radioactive particles on their wayfrom the source to theobserver, aswell as a scavengingby wet and dry depositions.
For the meteorological input, the IntegratedMonitoring System Model Suite Lagrangian disper-sion model has been used (Gera et al., 2013;MICROSTEP-MIS, 2012). It calculates the spreadingof radioactive material with regard to changes inatmospheric conditions, especially changes in thewind direction. The meteorological input for thedispersion model was a time-sequence analysis ofatmospheric state in GRIB format (WMO, 2009). TheGlobal Forecast System global weather model wasused in simulation time span from 12 March to 27March 2011. The 3D wind parameters (u, v andvertical velocity) at upper air model levels wereneeded to simulate dispersion due to large-scalewinds. Surface meteorological parameters influ-encing thermal and mechanical turbulence andsurface roughness were needed for simulation ofturbulent wind fluctuations. The values of inputmeteorological parameters in the intergrid locationswere bilinear interpolations of the gridded values.
The vertical velocity, particle dissipation andturbulence during the particle transport wereconsidered in the Lagrangian modeling. A singlerelease of 1 PBq of 137Cs, which occurred on 12March 2011 from the damaged Fukushima nuclearreactors was considered. The initial plume height, asa result of initial vertical velocity and buoyancy, waskept at 2000e3000 m. The meteorological data andsimulated trajectories revealed that the arrival timesof particles released on different days were not thesame. The jet stream affected the transport ofemitted particles at upper atmospheric levels as the
Chapter 5 FUKUSHIMA RADIOACTIVITY IMPACT 221
particles were transported at different altitudes. Thesimulated trajectories using the Lagrangian disper-sion model show that the first signal from theFukushima accident could be detected in Europe on19 March 2011 (Island, Fig. 5.43). The color range inthe figures should be interpreted as follows: shadesof red indicate particles from the bottom up to 3 km,black to dark blue color indicates the middle layerup to 6 km, and light blue represents an upper layer.Particles are organized into two vortices. Figure 5.43for 20 March shows the predominance of particles inthe upper levels above the European territory. Thereis predominance of dark blue color, later, after 21March, the red color points are visible as well. On 20March, the signal could be detected over thenorthern Europe, and on 21e22 March, the entireEurope was covered with the radioactive plume.
For a comparison of modeling predictions withreal radionuclide data, we need to have the followingin mind:1. Particles released from Fukushima at a later stage
could arrive to Europe earlier, depending onspecific meteorological conditions.
2. Particles traveling in different heights could havedifferent arriving times in Europe.
3. Particles from the upper air levels could be trans-ported to the ground air depending on specificmeteorological conditions.The modeling results of Masson et al. (2011) are
in a reasonable agreement with real observationscarried out in the North America and in Europe(Island) as the first detection of contaminated airmasses occurred on 17 and 19 March, respectively(see also discussion to Fig. 5.43). The northernScandinavia registered the plume on 20 March, andthe other European countries between 21 and 22March (Masson et al., 2011; Lujaniene et al., 2012a;Povinec et al., 2012a,b, 2013a). Usually two activityconcentration maxima of 131I, 134Cs and 137Cswere observed in European aerosols (Fig. 5.38).Depending on the position in the Europe, the 131Iactivity concentrations varied in the maxima up to6 mBq/m3 (w1 mBq/m3 for 137Cs) for the NorthernEuropean countries, up to 3 mBq/m3 (w0.1 mBq/m3
for 137Cs) for the Central Europe, and up to 1 mBq/m3
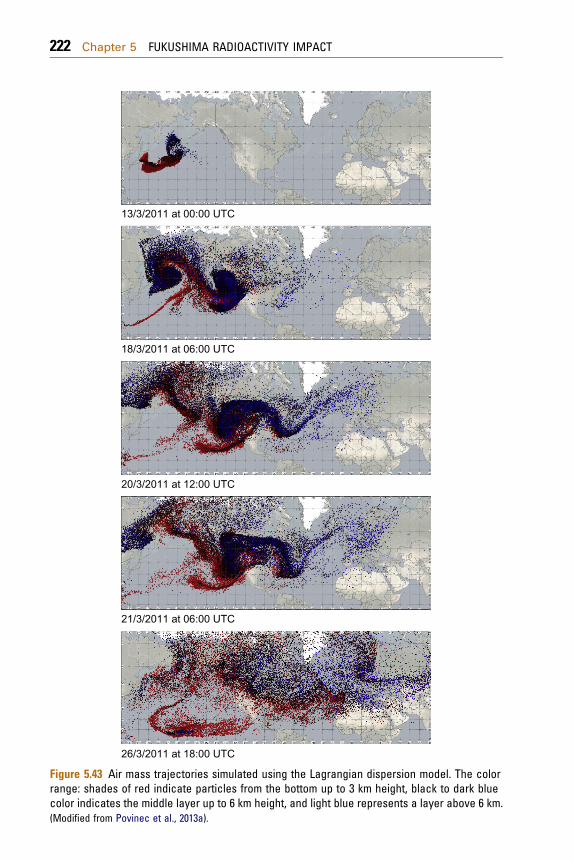
13/3/2011 at 00:00 UTC
18/3/2011 at 06:00 UTC
20/3/2011 at 12:00 UTC
21/3/2011 at 06:00 UTC
26/3/2011 at 18:00 UTC
Figure 5.43 Air mass trajectories simulated using the Lagrangian dispersion model. The colorrange: shades of red indicate particles from the bottom up to 3 km height, black to dark bluecolor indicates the middle layer up to 6 km height, and light blue represents a layer above 6 km.(Modified from Povinec et al., 2013a).
222 Chapter 5 FUKUSHIMA RADIOACTIVITY IMPACT
Chapter 5 FUKUSHIMA RADIOACTIVITY IMPACT 223
(w0.05 mBq/m3 for 137Cs) for the South Europeancountries. While the first maximum was observed inEurope on 30March, the second one was observed on3 April 2011 (Fig. 5.38). The origin of the first peakshould be associated with first large radionuclidereleases, which originated on 12e13 March, and theorigin of the second peak could be associated withthe largest releases which occurred on 15 March.The decreasing radionuclide levels observed betweenthese peaksmay be due to pronounced rainfall events,which occurred over most part of Europe. Theincreased 131I and 134,137Cs concentrations in theEuropean air persisted for approximately 20 days,locally dependingonprecipitation conditions. The 131Iwas vertically well mixed, as confirmed by measure-ments at the high altitudes. The Jungfraujoch station(46.5� N, 8� E; 3580 m a.s.l.) measured 131I levels upto 0.9 mBq/m3. High-altitude samples taken withairplanes on 30 March above Switzerland (up to8000m)andabovenorthernGermany (up to10,000m)showed 131I levels around 2 mBq/m3 (Masson et al.,2011).
Different meteorological conditions at the Euro-pean sites (e.g. rainfall characteristics, fog formationor growth of aerosol particles and their deposition)could affect the activity concentrations at theground-level air (Gera et al., in preparation). Theamount of precipitation (above 10 mm) could havea certain effect on changes in activity concentrationsof studied radionuclides at the ground-level air.However, no correlation was found between the 131Iand 137Cs activity concentrations and the amount ofprecipitation (Lujaniene et al., 2012a,b), indicatingthat the influence of precipitation on deposition ofradionuclides in Europe was generally negligible.
The Fukushima radionuclide levels on aerosolsmeasured in Europe were three to four orders ofmagnitude lower than the activity levels encoun-tered in Europe after the Chernobyl accident inApril 1986. For example, the maximum 131I and137Cs levels measured on 30 March 2011 in Bra-tislava (0.5 and 0.07 mBq/m3, respectively; Povinecet al., 2012a,b) were much lower than the Chernobylvalues (14 and 4 Bq/m3, respectively; Povinec et al.,1988).
224 Chapter 5 FUKUSHIMA RADIOACTIVITY IMPACT
Although there have been too many uncertainties(estimation of the source terms, changeable meteo-rological conditions along the pass from Japan toEurope affecting scavenging efficiency for radionu-clides), the dispersion of radionuclides has beenreasonably well predicted. It has been found that theair masses mostly traveled from Japan to Europe at500 hPa (5000 m) height level. The vertical radionu-clide distribution was measured only in a few placesof the world; therefore, we do not have enoughinformation on the vertical mixing. The horizontaldispersion in the Europe reached about 4000 km,however, as shown by Lagrangian modeling, theentire world has been marked with the Fukushimaradionuclides (Fig. 5.43), although at very low levels.If we take an average distance between Japan andEurope over the Pacific Ocean, North America andthe Atlantic Ocean (18 000 km), and the travel time of10e15 days, we can estimate an average speed ofthe plume to be 50e70 km/h, what is in reason-able agreement with meteorological observations(Lujaniene et al., 2012a,b). It is interesting to noticethat the plumes between North America and Europemostly traveled close to the North Pole (over theGreenland), as is a typical travel journey for com-mercial airplanes.
We may conclude that the temporal and spatialdistributions of Fukushima-derived radionuclides inaerosols revealed the presence of two dominantradionuclidemaximawhichwereobserved throughoutthe Europewith decreasing amplitudes from theNorthto the South, which were associated with different airmasses present in the European air. Modeled forwardand backward trajectories indicated a preferentialtransport of air masses between Fukushima andEurope at 500 hPa (5000 m a. s. l.) air heights. TheLagrangian modeling showed that the horizontaldispersion in the Europe reached about 4000-km-widebelt, however, the entire world has been labeled withthe Fukushima radionuclides, although at very lowlevels. A typical travel time between Fukushima andEuropehasbeenestimated tobeof 10e15days,with anaverage speed of the plume of 50e70 km/h. An average131I concentration, which was measured over theEurope (w1mBq/m3),would result in the total amount
Chapter 5 FUKUSHIMA RADIOACTIVITY IMPACT 225
of dispersed 131I of about 1 PBq. Although this repre-sents a high release rate (almost 1%of the total amountof 131I released from the Fukushima NPP), as it wasdistributed over a huge area, it has not been of anyradiological significance for European citizens.
5.3 Pacific Ocean
5.3.1 Radionuclides in SeawaterAs for distribution of the radionuclides releasedfrom the Fukushima Dai-ichi NPP accident in theocean, the early distribution is formed mainly by theradionuclides emitted into the atmosphere, thendeposited to the ocean, and released directly into theocean (a direct discharge). And in addition to thesetwo major pathways, radionuclides also may becarried into the ocean by river runoff or groundwaterdischarge to the ocean. Since larger portion ofradionuclides released from the FNPP1 are in dis-solved form, they moved with seawater; therefore,the distribution of radionuclides changed withmovement of seawater.
The FNPP1 locates on the coastline at Fukushima,Japan, and the strong coastal flow was dominated tothe south near the FNPP1 site, therefore it is thoughtthat the radionuclides were transported by thesouthward flow instead of diffusion. In the openocean, east of theHonshu Island, the Oyashio Currentgoes south along the Chishima Islands and the Hon-shu Island. The Kuroshio Current goes north alongPhilippines and Okinawa Island. Then both Currentsflow to the east as a Kuroshio Extension after theywere merged. At the time of FNPP1 accident, thecoastal flow went south, and the radionuclidesreleased from FNPP1 were transported to the Kur-oshio Extension, south first and then to the east. As forthe part which deposited to the ocean via the atmo-sphere, our observation showed heterogeneousdeposition over the wide area in the North PacificOcean (Aoyama et al., 2012a) during the radioactiveplume traveled over the North Pacific Ocean. We alsocannot forget the portion, which interacts withmarine sediment, or an interaction with the particu-late matter in the ocean, either.
226 Chapter 5 FUKUSHIMA RADIOACTIVITY IMPACT
This chapter will describe the research resultsincluding the measurements of the radionuclides inthe ocean based on an article by Aoyama et al. 2013and model research results.
On 11March 2011, an extraordinary earthquake ofmagnitude 9.0 centered about 130 km off the Pacificcoast of Japan’s main island, at 38.3� N, 142.4� E, wasfollowed by a huge tsunami with waves reaching upto 40 m height in Iwate region and about 10 m inFukushima region (The-2011-Tohoku-Earthquake-Tsunami-Joint-Survey-Group, 2011; Mori et al.,2011). These events caused the loss of about 16,000lives, missing of about 4000 lives and an extensivedamage. One of the consequences was a stationblackout (total loss of alternating current electricpower) at the TEPCO Fukushima Dai-ichi NPP. Thestation blackout developed into a disaster that leftthree of the six FNPP1 reactors heavily damaged andcaused radionuclides to be discharged into the airand ocean (Chino et al., 2011; Kawamura et al., 2011;Morino et al., 2011; Stohl et al., 2012; Tsumune et al.,2012; Estournel et al., 2012).
134Cs and 137Cs were released to the North PacificOcean by two major likely pathways, direct dischargefrom the FNPP1 accident site and atmosphericdeposition off Honshu Islands of Japan, east andnortheast of the site. 134Cs and 137Cs activities in thesurface water in the North Pacific Ocean were alreadyreported (Aoyama et al., 2012a; Honda et al., 2012)and those ranged a few to 1000 Bq/m3 in AprileMay2011. Distributions of 134Cs and 137Cs activities in thesurface water off Honshu and coastal stations aroundJapan during the period from April 2011 to November2011 (Inoue et al., 2012a,b; Aoyama et al., 2012a;Miyazawa et al., 2012; Buesseler et al., 2011;Buesseler, 2012) were also reported and discussed.
During the first month of release period, 134Cs and137Csactivities ratioswerevery close toone (0.99� 0.03for FNPP1 north and south discharge channels) andextremely uniform (Buesseler et al., 2011). The pres-ence of 134Cs is a unique isotopic signature for trackingthese waters and calculating mixing ratios. In theoceans, the behavior of cesium is thought to beconservative, i.e. it is soluble (<1% attached to marineparticles) and is carried primarily with ocean waters
Chapter 5 FUKUSHIMA RADIOACTIVITY IMPACT 227
and as such has been used as a tracer of water massmixing and transport (Buesseler et al., 2011).
Results of observations of 134Cs and 137Cs activi-ties in surface water from April to December 2011at Hasaki, a coastal station 180 km south of theFNPP1 site, showed the maximum activity, around2000 Bq/m3 in June 2011, representing a delay of2 months from the corresponding maximum in April2011 at FNPP1. Directly discharged 134Cs and 137Cswere transported dominantly southward along thecoastline of northeastern Honshu. The reasons forthe 2-month delay at Hasaki are not yet clear,however, clockwise current associated with a warmwater eddy of which center located at 36.5� N, 141.4�E off Iwaki between Onahama and Hasaki in the midof May 2011 might prevent southward transport of134Cs and 137Cs released from FNPP1 to Hasaki untilthe end of May 2011 (Aoyama et al., 2012b).
Fukushima-derived 134Cs and 137Cs were detectedthroughout waters 30e600 km offshore, with thehighest activities associated with near-shore eddiesand the Kuroshio Current acting as a southernboundary for transport in June 2011. Buesseler et al.(2012) calculated a total 137Cs inventory of1.9e2.1 PBq in an ocean area of 150,000 km2.A similar value of 2.2 � 0.3 PBq has been obtained byPovinec et al. (2013b) for the same ocean area.
High-density sampling of surface seawater tomeasure 134Cs and 137Cs activities were carried out by17 cargo ships as Voluntary Observing Ship (VOS)cruises and several research vessel cruises sinceMarch 2011 till March 2012 in the North PacificOcean. We also discuss these behaviors of theradioactive plume in the North Pacific Oceanthrough March 2012.
5.3.1.1 Seawater Sampling and Radionuclide AnalysesWe shall discuss in this chapter two types of
samples collected in the northwestern Pacific Oceanafter the Fukushima accident. The first group ofsamples was collected at more than 300 stations asshown in Fig. 5.44. A typical sample size was 2 l ofsurface seawater. The samples were treated by animproved ammonium phosphomolybdate (AMP)procedure developed by M. Aoyama (Hirose et al.,
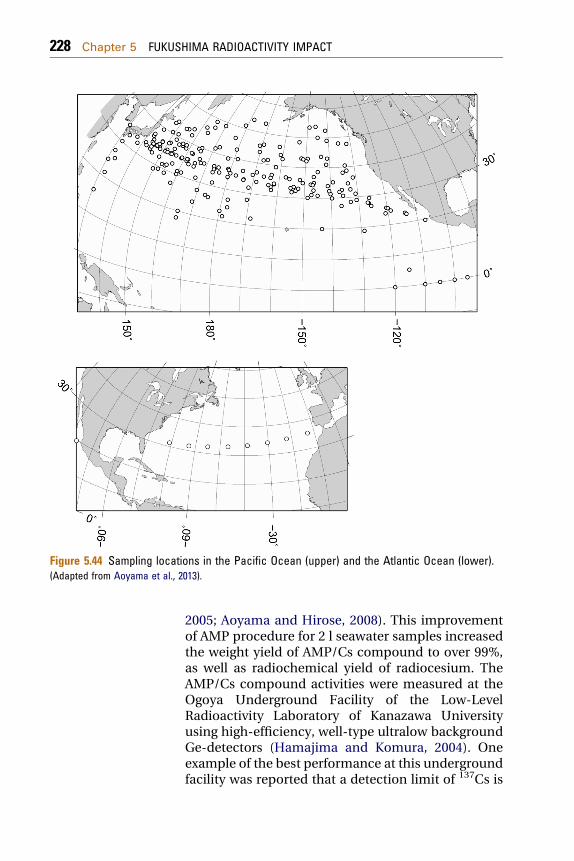
Figure 5.44 Sampling locations in the Pacific Ocean (upper) and the Atlantic Ocean (lower).(Adapted from Aoyama et al., 2013).
228 Chapter 5 FUKUSHIMA RADIOACTIVITY IMPACT
2005; Aoyama and Hirose, 2008). This improvementof AMP procedure for 2 l seawater samples increasedthe weight yield of AMP/Cs compound to over 99%,as well as radiochemical yield of radiocesium. TheAMP/Cs compound activities were measured at theOgoya Underground Facility of the Low-LevelRadioactivity Laboratory of Kanazawa Universityusing high-efficiency, well-type ultralow backgroundGe-detectors (Hamajima and Komura, 2004). Oneexample of the best performance at this undergroundfacility was reported that a detection limit of 137Cs is
Chapter 5 FUKUSHIMA RADIOACTIVITY IMPACT 229
0.18 mBq for a counting time of 10,000 min (Hiroseet al., 2005). Therefore, this development permitsus to use the residue of nuclear weapon tests asuseful tracers in oceanography (Aoyama et al., 2011;Povinec et al., 2011a,b; Sanchez-Cabeza et al., 2011)and to measure released 134Cs and 137Cs from theFNPP1 in 2 l samples with activities <1 Bq/m3, too.
Because reagents can add trace levels of radioac-tivity, skewing small volume measurements, it isimportant to know the specific activity of analytes suchas 137Cs in the reagents. The 137Cs activity in CsCl wasmeasured to be 0.03 mBq/g by using extremely lowbackground gamma-spectrometry and we neglect thisamount of 137Cs because we use only 0.26 g as carrier.The 137Cs activity in AMP we used was 0.024 mBq/gand we subtract the corresponding amount of 137Cs inthe AMPused to extract radiocesium from the samplesbecauseweuse4e6g for extraction.There isnoseriouscontamination of 137Cs from other reagents. For 134Cscontaminations, we did not observe any 134Cscontaminations from the reagents.
The second set of seawater samples discussed inthis chapter was collected offshore Fukushima duringthe international research cruise with participation of13 institutions, which was organized by USscientists on 3e17 June 2011 using the research vesselKa‘imikai-o-Kanaloa (KOK’ 2011) of the University ofHawaii (Buesseler et al., 2012). The cruise trackextended from 34 to 37� N, and from 142 to 147� E(fromabout 30 to 600 kmoff Japan), visiting altogether50 sampling stations (Fig. 5.45). Both surface andwater profile samples were collected. Most of thecollected seawater samples were analyzed by Buess-eler et al. (2012). Eleven depth profiles were analyzedin this work for 137Cs and 134Cs by the InternationalAtomic Energy Agency’s Environment Laboratories(IAEA-EL) in Monaco, and four depth profiles wereanalyzed for 129I and 3H (Hou et al., 2013; Povinecet al., 2013b). The collected seawater samples fortritiumand 129I analyseswere stored in 1 l glass bottleswith air-tight covering so no exchange with thesurrounding air was possible. The samples for cesiumanalysis were stored in plastic containers from 1 l(profiles) to 15 l (surface) volumes.
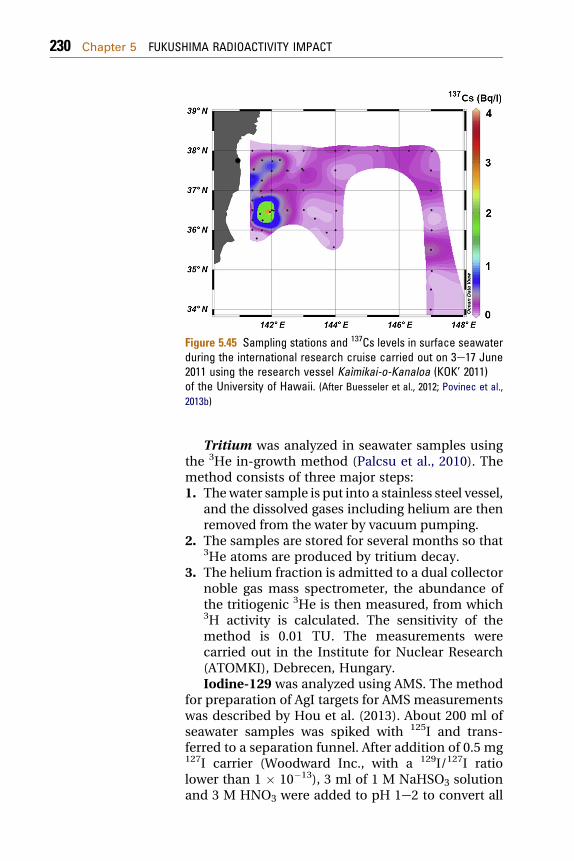
Figure 5.45 Sampling stations and 137Cs levels in surface seawaterduring the international research cruise carried out on 3e17 June2011 using the research vessel Kaìmikai-o-Kanaloa (KOK’ 2011)of the University of Hawaii. (After Buesseler et al., 2012; Povinec et al.,2013b)
230 Chapter 5 FUKUSHIMA RADIOACTIVITY IMPACT
Tritium was analyzed in seawater samples usingthe 3He in-growth method (Palcsu et al., 2010). Themethod consists of three major steps:1. Thewater sample is put into a stainless steel vessel,
and the dissolved gases including helium are thenremoved from the water by vacuum pumping.
2. The samples are stored for several months so that3He atoms are produced by tritium decay.
3. The helium fraction is admitted to a dual collectornoble gas mass spectrometer, the abundance ofthe tritiogenic 3He is then measured, from which3H activity is calculated. The sensitivity of themethod is 0.01 TU. The measurements werecarried out in the Institute for Nuclear Research(ATOMKI), Debrecen, Hungary.Iodine-129 was analyzed using AMS. The method
for preparation of AgI targets for AMS measurementswas described by Hou et al. (2013). About 200 ml ofseawater samples was spiked with 125I and trans-ferred to a separation funnel. After addition of 0.5 mg127I carrier (Woodward Inc., with a 129I/127I ratiolower than 1 � 10�13), 3 ml of 1 M NaHSO3 solutionand 3 M HNO3 were added to pH 1e2 to convert all
Chapter 5 FUKUSHIMA RADIOACTIVITY IMPACT 231
inorganic iodine to iodide. Iodine was then extractedinto CHCl3 after addition of NaNO2 to oxidize iodideto I2. Iodine in CHCl3 phase was then back-extractedto the water phase using 10 ml of 0.1 mM NaHSO3
solution. Half milliliter of 1.0 mol/l AgNO3 solutionwas added to the back-extracted aqueous phases toprecipitate iodide as AgI, which was separated bycentrifuge. The obtained AgI precipitate was dried at70 �C and used for AMS measurement of 129I. 125I inthe precipitate was counted using a NaI(Tl) gamma-detector to monitor the chemical yield of iodine inthe separation (Hou et al., 2007). An ICP-MS system(X Series II, Thermo Fisher Scientific, Waltham, USA)equipped with an Xs-skimmer cone and standardconcentric nebulizer was used for measurement of127I. Csþ (to 2.0 ppb) as internal standard and 1%NH3
media were applied for measurements Hou et al.(2007, 2009a,b).
The 129I/127I ratios in total iodine samples weredetermined by AMS at the Vienna EnvironmentalResearchAccelerator of theUniversity of Viennausinga 3MVPelletron (Wallner et al., 2007), and at the 3MVPelletron AMS facility of the University of Arizona(Biddulph et al., 2000). The machine 129I/127I back-ground ratio was w3� 10�14. The blanks preparedusing the same procedure as the samples gave for the129I/127I ratios values below 1 � 10�13, which was byabout three orders of magnitude lower than themeasured 129I/127I ratios in seawater samples.
Cesium-137 and 134Cs analysis of seawatersamples was carried out using the method describedin detail by Levy et al. (2011) and Povinec et al.(2012b). In low-activity samples, radiocesium waspreconcentrated by adsorption onto ammoniumphosphomolybdate (AMP) at pH 2. The AMP sus-pension was allowed to settle and the supernatantsolution was decanted or siphoned away. The AMPsolid particle in the remaining suspension was sepa-rated by centrifuge. The separated AMP solid waswashed with water. The Cs recovery was obtained bydetermination of stable 133Cs concentration in waterbefore and after AMP absorption by ICP-MS. TheAMP sample was analyzed for the presence of 134Csand 137Cs in the CAVE (Counting laboratory forenvironmental radionuclides) underground facility of
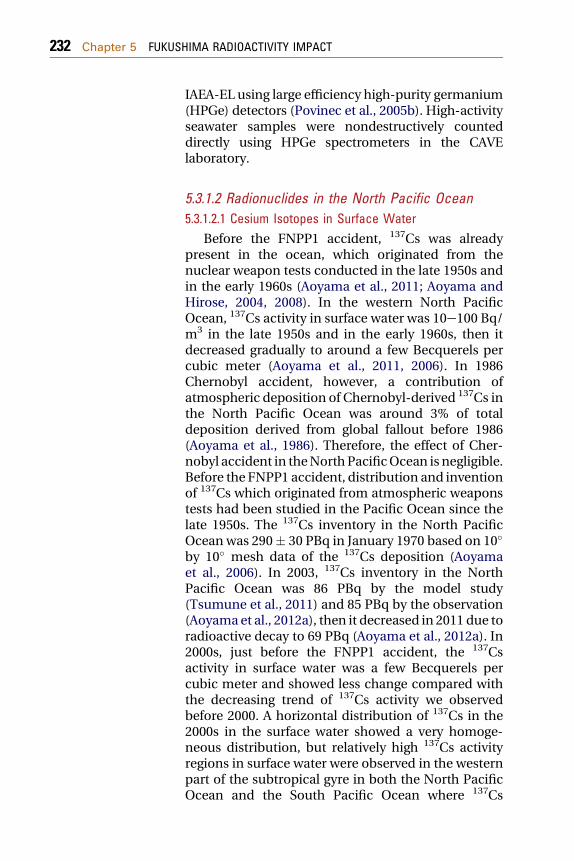
232 Chapter 5 FUKUSHIMA RADIOACTIVITY IMPACT
IAEA-EL using large efficiency high-purity germanium(HPGe) detectors (Povinec et al., 2005b). High-activityseawater samples were nondestructively counteddirectly using HPGe spectrometers in the CAVElaboratory.
5.3.1.2 Radionuclides in the North Pacific Ocean5.3.1.2.1 Cesium Isotopes in Surface Water
Before the FNPP1 accident, 137Cs was alreadypresent in the ocean, which originated from thenuclear weapon tests conducted in the late 1950s andin the early 1960s (Aoyama et al., 2011; Aoyama andHirose, 2004, 2008). In the western North PacificOcean, 137Cs activity in surface water was 10e100 Bq/m3 in the late 1950s and in the early 1960s, then itdecreased gradually to around a few Becquerels percubic meter (Aoyama et al., 2011, 2006). In 1986Chernobyl accident, however, a contribution ofatmospheric deposition of Chernobyl-derived 137Cs inthe North Pacific Ocean was around 3% of totaldeposition derived from global fallout before 1986(Aoyama et al., 1986). Therefore, the effect of Cher-nobyl accident in theNorthPacificOcean is negligible.Before the FNPP1 accident, distribution and inventionof 137Cs which originated from atmospheric weaponstests had been studied in the Pacific Ocean since thelate 1950s. The 137Cs inventory in the North PacificOcean was 290� 30 PBq in January 1970 based on 10�by 10� mesh data of the 137Cs deposition (Aoyamaet al., 2006). In 2003, 137Cs inventory in the NorthPacific Ocean was 86 PBq by the model study(Tsumune et al., 2011) and 85 PBq by the observation(Aoyamaet al., 2012a), then it decreased in 2011 due toradioactive decay to 69 PBq (Aoyama et al., 2012a). In2000s, just before the FNPP1 accident, the 137Csactivity in surface water was a few Becquerels percubic meter and showed less change compared withthe decreasing trend of 137Cs activity we observedbefore 2000. A horizontal distribution of 137Cs in the2000s in the surface water showed a very homoge-neous distribution, but relatively high 137Cs activityregions in surface water were observed in the westernpart of the subtropical gyre in both the North PacificOcean and the South Pacific Ocean where 137Cs
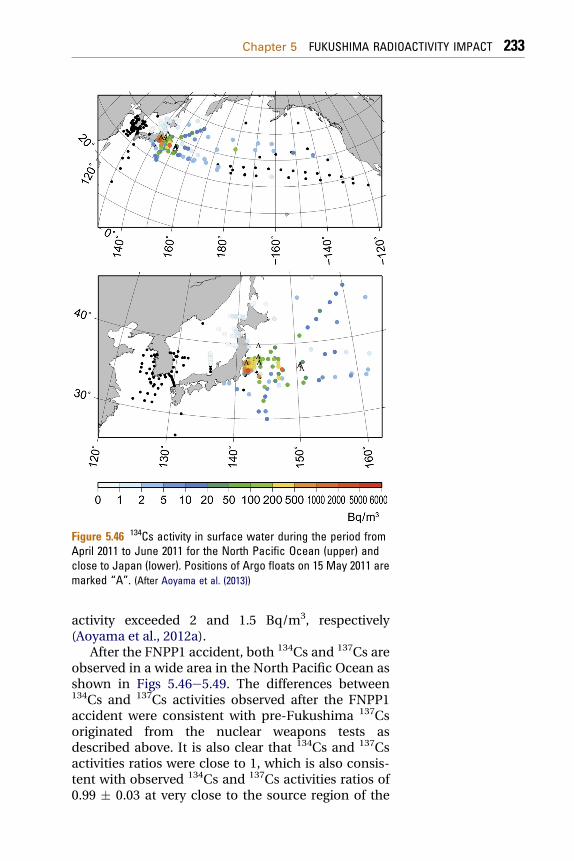
Figure 5.46 134Cs activity in surface water during the period fromApril 2011 to June 2011 for the North Pacific Ocean (upper) andclose to Japan (lower). Positions of Argo floats on 15 May 2011 aremarked “A”. (After Aoyama et al. (2013))
Chapter 5 FUKUSHIMA RADIOACTIVITY IMPACT 233
activity exceeded 2 and 1.5 Bq/m3, respectively(Aoyama et al., 2012a).
After the FNPP1 accident, both 134Cs and 137Cs areobserved in a wide area in the North Pacific Ocean asshown in Figs 5.46e5.49. The differences between134Cs and 137Cs activities observed after the FNPP1accident were consistent with pre-Fukushima 137Csoriginated from the nuclear weapons tests asdescribed above. It is also clear that 134Cs and 137Csactivities ratios were close to 1, which is also consis-tent with observed 134Cs and 137Cs activities ratios of0.99 � 0.03 at very close to the source region of the
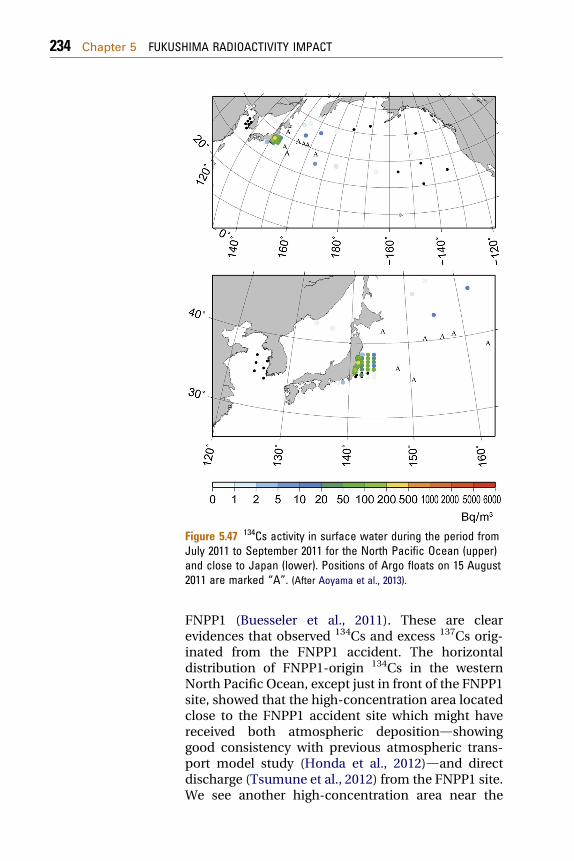
Figure 5.47 134Cs activity in surface water during the period fromJuly 2011 to September 2011 for the North Pacific Ocean (upper)and close to Japan (lower). Positions of Argo floats on 15 August2011 are marked “A”. (After Aoyama et al., 2013).
234 Chapter 5 FUKUSHIMA RADIOACTIVITY IMPACT
FNPP1 (Buesseler et al., 2011). These are clearevidences that observed 134Cs and excess 137Cs orig-inated from the FNPP1 accident. The horizontaldistribution of FNPP1-origin 134Cs in the westernNorth Pacific Ocean, except just in front of the FNPP1site, showed that the high-concentration area locatedclose to the FNPP1 accident site which might havereceived both atmospheric depositiondshowinggood consistency with previous atmospheric trans-port model study (Honda et al., 2012)dand directdischarge (Tsumune et al., 2012) from the FNPP1 site.We see another high-concentration area near the
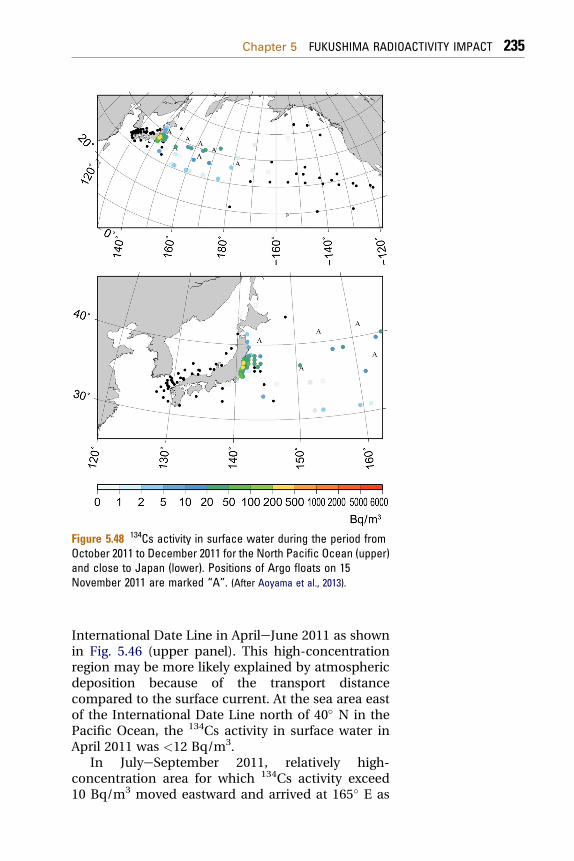
Figure 5.48 134Cs activity in surface water during the period fromOctober 2011 to December 2011 for the North Pacific Ocean (upper)and close to Japan (lower). Positions of Argo floats on 15November 2011 are marked “A”. (After Aoyama et al., 2013).
Chapter 5 FUKUSHIMA RADIOACTIVITY IMPACT 235
International Date Line in AprileJune 2011 as shownin Fig. 5.46 (upper panel). This high-concentrationregion may be more likely explained by atmosphericdeposition because of the transport distancecompared to the surface current. At the sea area eastof the International Date Line north of 40� N in thePacific Ocean, the 134Cs activity in surface water inApril 2011 was <12 Bq/m3.
In JulyeSeptember 2011, relatively high-concentration area for which 134Cs activity exceed10 Bq/m3 moved eastward and arrived at 165� E as
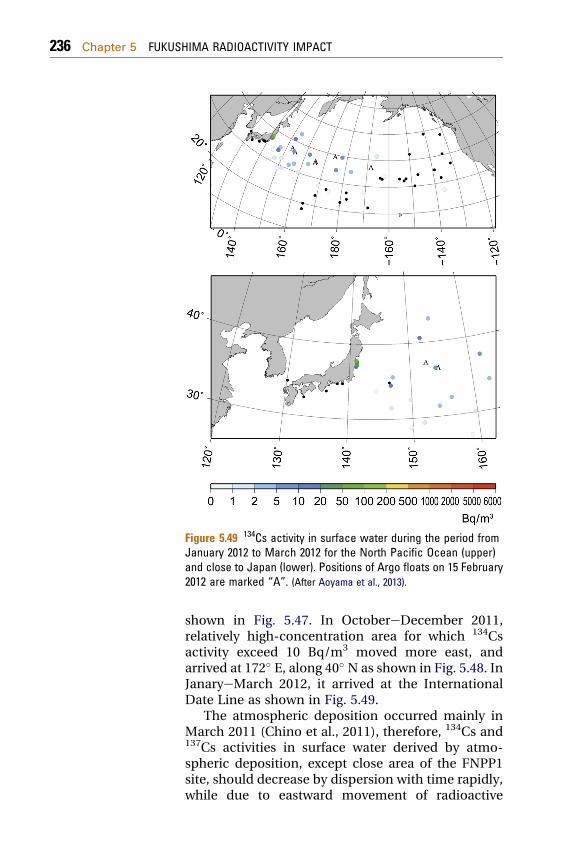
Figure 5.49 134Cs activity in surface water during the period fromJanuary 2012 to March 2012 for the North Pacific Ocean (upper)and close to Japan (lower). Positions of Argo floats on 15 February2012 are marked “A”. (After Aoyama et al., 2013).
236 Chapter 5 FUKUSHIMA RADIOACTIVITY IMPACT
shown in Fig. 5.47. In OctobereDecember 2011,relatively high-concentration area for which 134Csactivity exceed 10 Bq/m3 moved more east, andarrived at 172� E, along 40� N as shown in Fig. 5.48. InJanaryeMarch 2012, it arrived at the InternationalDate Line as shown in Fig. 5.49.
The atmospheric deposition occurred mainly inMarch 2011 (Chino et al., 2011), therefore, 134Cs and137Cs activities in surface water derived by atmo-spheric deposition, except close area of the FNPP1site, should decrease by dispersion with time rapidly,while due to eastward movement of radioactive
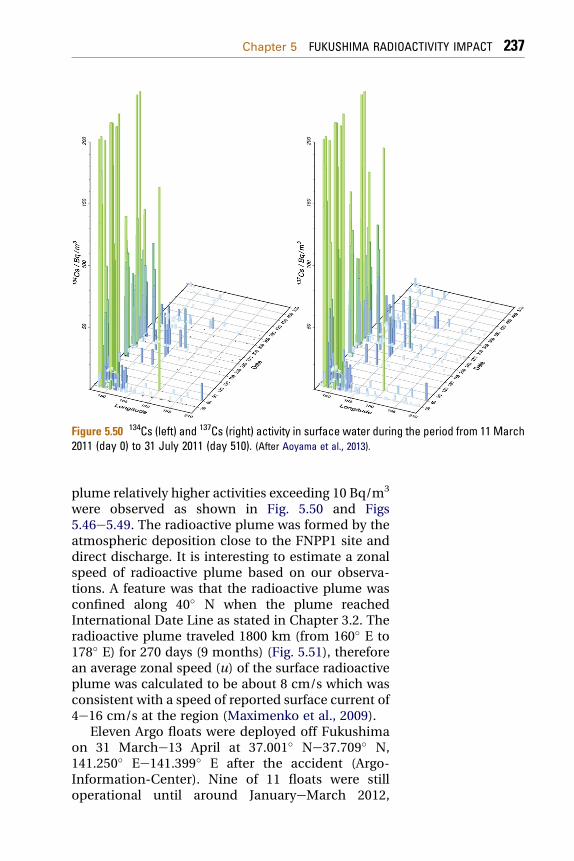
Figure 5.50 134Cs (left) and 137Cs (right) activity in surface water during the period from 11 March2011 (day 0) to 31 July 2011 (day 510). (After Aoyama et al., 2013).
Chapter 5 FUKUSHIMA RADIOACTIVITY IMPACT 237
plume relatively higher activities exceeding 10 Bq/m3
were observed as shown in Fig. 5.50 and Figs5.46e5.49. The radioactive plume was formed by theatmospheric deposition close to the FNPP1 site anddirect discharge. It is interesting to estimate a zonalspeed of radioactive plume based on our observa-tions. A feature was that the radioactive plume wasconfined along 40� N when the plume reachedInternational Date Line as stated in Chapter 3.2. Theradioactive plume traveled 1800 km (from 160� E to178� E) for 270 days (9 months) (Fig. 5.51), thereforean average zonal speed (u) of the surface radioactiveplume was calculated to be about 8 cm/s which wasconsistent with a speed of reported surface current of4e16 cm/s at the region (Maximenko et al., 2009).
Eleven Argo floats were deployed off Fukushimaon 31 Marche13 April at 37.001� Ne37.709� N,141.250� Ee141.399� E after the accident (Argo-Information-Center). Nine of 11 floats were stilloperational until around JanuaryeMarch 2012,
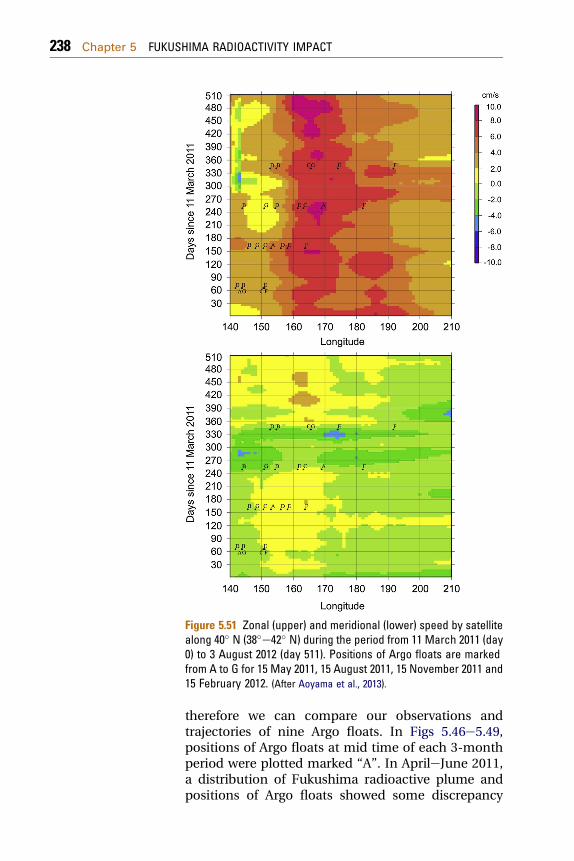
Figure 5.51 Zonal (upper) and meridional (lower) speed by satellitealong 40� N (38�e42� N) during the period from 11 March 2011 (day0) to 3 August 2012 (day 511). Positions of Argo floats are markedfrom A to G for 15 May 2011, 15 August 2011, 15 November 2011 and15 February 2012. (After Aoyama et al., 2013).
238 Chapter 5 FUKUSHIMA RADIOACTIVITY IMPACT
therefore we can compare our observations andtrajectories of nine Argo floats. In Figs 5.46e5.49,positions of Argo floats at mid time of each 3-monthperiod were plotted marked “A”. In AprileJune 2011,a distribution of Fukushima radioactive plume andpositions of Argo floats showed some discrepancy
Chapter 5 FUKUSHIMA RADIOACTIVITY IMPACT 239
because the distribution of Fukushima radioactiveplume was formed by both combination of atmo-spheric deposition and direct discharge as stated inChapter 3.2. In JulyeSeptember 2011, positions ofArgo floats were moved more eastward up to 165� E,although observed results were so sparse radioactiveplume also moved to east as well as Argo floats asshown in Fig. 5.47. Three months later, bothFukushima radioactive plume and Argo floats movedmore east, up to 172� E as shown in Fig. 5.48. Almost1 year after the accident, again we observed thatboth Fukushima radioactive plume and Argo floatsmoved more eastward up to 180� E as shown inFig. 5.49. A zonal speed, u, based on trajectories ofnine Argo floats between May 2011 and August 2011ranged from 0.1 to 15.6 cm/s with an average of7.8 cm/s. A zonal speed, u, based on trajectories ofnine Argo floats between August 2011 and November2011 ranged from �1.9 to 20.1 cm/s with an averageof 7.7 cm/s. In between November 2011 andFebruary 2012, it ranged from �1.7 to 16.7 cm/s withan average of 8.9 cm/s. These zonal speeds by Argofloats showed excellent agreement with zonal speedof Fukushima radioactive plume (about 8 cm/s)derived by our observations. Therefore, we can saythat deploying Argo floats just after nuclear reactoraccidents near the coastline might be good totrace radioactive plume, which moves in the surfacelayer.
We can also assume that Fukushima radioactiveplume moved with surface water. Therefore it is alsointerested to compare between surface current speedby satellite observations and actual movement ofFukushima radiocesiumobtained by our observationsas stated in Chapter 3.2. We look at surface currentobservation by satellite (Bonjean and Lagerloef, 2002)along 40� N (38� Ne42� N). Zonal speed during theperiod from April 2011 toMarch 2012 ranged from 1.5to 7.4 cm/s. The average speed estimated by advectionof Fukushima radioactivity was 8 cm/s in average andthis zonal speed by observation showed good agree-ment with satellite-derived surface current as well asthe zonal speed obtained bymovement of Argo floats.It should be also noted that there exist larger vari-abilities in the radioactive plume as shown in Fig. 5.51.
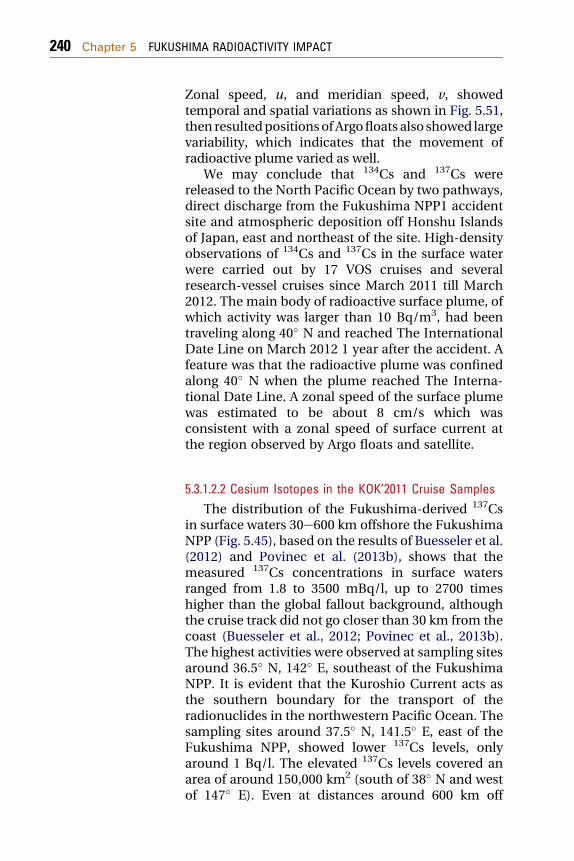
240 Chapter 5 FUKUSHIMA RADIOACTIVITY IMPACT
Zonal speed, u, and meridian speed, v, showedtemporal and spatial variations as shown in Fig. 5.51,then resultedpositionsofArgofloats also showed largevariability, which indicates that the movement ofradioactive plume varied as well.
We may conclude that 134Cs and 137Cs werereleased to the North Pacific Ocean by two pathways,direct discharge from the Fukushima NPP1 accidentsite and atmospheric deposition off Honshu Islandsof Japan, east and northeast of the site. High-densityobservations of 134Cs and 137Cs in the surface waterwere carried out by 17 VOS cruises and severalresearch-vessel cruises since March 2011 till March2012. The main body of radioactive surface plume, ofwhich activity was larger than 10 Bq/m3, had beentraveling along 40� N and reached The InternationalDate Line on March 2012 1 year after the accident. Afeature was that the radioactive plume was confinedalong 40� N when the plume reached The Interna-tional Date Line. A zonal speed of the surface plumewas estimated to be about 8 cm/s which wasconsistent with a zonal speed of surface current atthe region observed by Argo floats and satellite.
5.3.1.2.2 Cesium Isotopes in the KOK’2011 Cruise SamplesThe distribution of the Fukushima-derived 137Cs
in surface waters 30e600 km offshore the FukushimaNPP (Fig. 5.45), based on the results of Buesseler et al.(2012) and Povinec et al. (2013b), shows that themeasured 137Cs concentrations in surface watersranged from 1.8 to 3500 mBq/l, up to 2700 timeshigher than the global fallout background, althoughthe cruise track did not go closer than 30 km from thecoast (Buesseler et al., 2012; Povinec et al., 2013b).The highest activities were observed at sampling sitesaround 36.5� N, 142� E, southeast of the FukushimaNPP. It is evident that the Kuroshio Current acts asthe southern boundary for the transport of theradionuclides in the northwestern Pacific Ocean. Thesampling sites around 37.5� N, 141.5� E, east of theFukushima NPP, showed lower 137Cs levels, onlyaround 1 Bq/l. The elevated 137Cs levels covered anarea of around 150,000 km2 (south of 38� N and westof 147� E). Even at distances around 600 km off
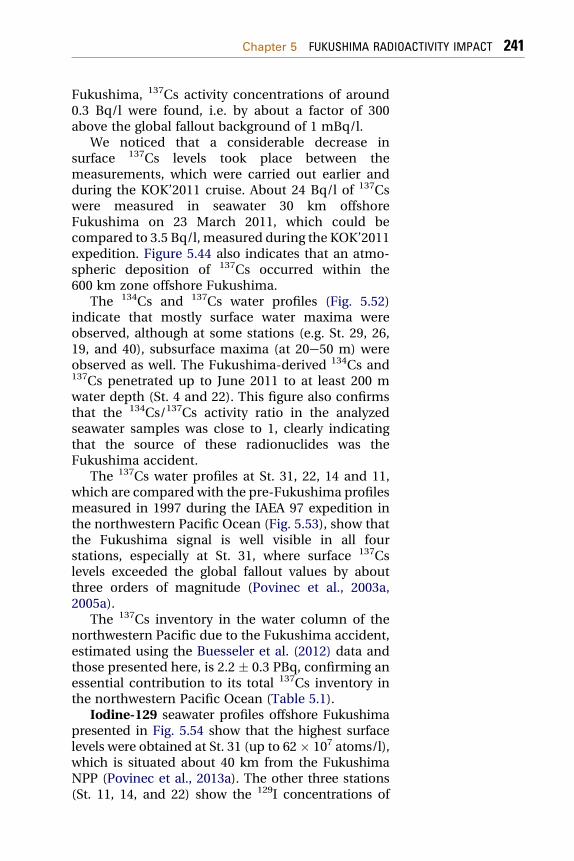
Chapter 5 FUKUSHIMA RADIOACTIVITY IMPACT 241
Fukushima, 137Cs activity concentrations of around0.3 Bq/l were found, i.e. by about a factor of 300above the global fallout background of 1 mBq/l.
We noticed that a considerable decrease insurface 137Cs levels took place between themeasurements, which were carried out earlier andduring the KOK’2011 cruise. About 24 Bq/l of 137Cswere measured in seawater 30 km offshoreFukushima on 23 March 2011, which could becompared to 3.5 Bq/l, measured during the KOK’2011expedition. Figure 5.44 also indicates that an atmo-spheric deposition of 137Cs occurred within the600 km zone offshore Fukushima.
The 134Cs and 137Cs water profiles (Fig. 5.52)indicate that mostly surface water maxima wereobserved, although at some stations (e.g. St. 29, 26,19, and 40), subsurface maxima (at 20e50 m) wereobserved as well. The Fukushima-derived 134Cs and137Cs penetrated up to June 2011 to at least 200 mwater depth (St. 4 and 22). This figure also confirmsthat the 134Cs/137Cs activity ratio in the analyzedseawater samples was close to 1, clearly indicatingthat the source of these radionuclides was theFukushima accident.
The 137Cs water profiles at St. 31, 22, 14 and 11,which are compared with the pre-Fukushima profilesmeasured in 1997 during the IAEA 97 expedition inthe northwestern Pacific Ocean (Fig. 5.53), show thatthe Fukushima signal is well visible in all fourstations, especially at St. 31, where surface 137Cslevels exceeded the global fallout values by aboutthree orders of magnitude (Povinec et al., 2003a,2005a).
The 137Cs inventory in the water column of thenorthwestern Pacific due to the Fukushima accident,estimated using the Buesseler et al. (2012) data andthose presented here, is 2.2 � 0.3 PBq, confirming anessential contribution to its total 137Cs inventory inthe northwestern Pacific Ocean (Table 5.1).
Iodine-129 seawater profiles offshore Fukushimapresented in Fig. 5.54 show that the highest surfacelevels were obtained at St. 31 (up to 62 � 107 atoms/l),which is situated about 40 km from the FukushimaNPP (Povinec et al., 2013a). The other three stations(St. 11, 14, and 22) show the 129I concentrations of
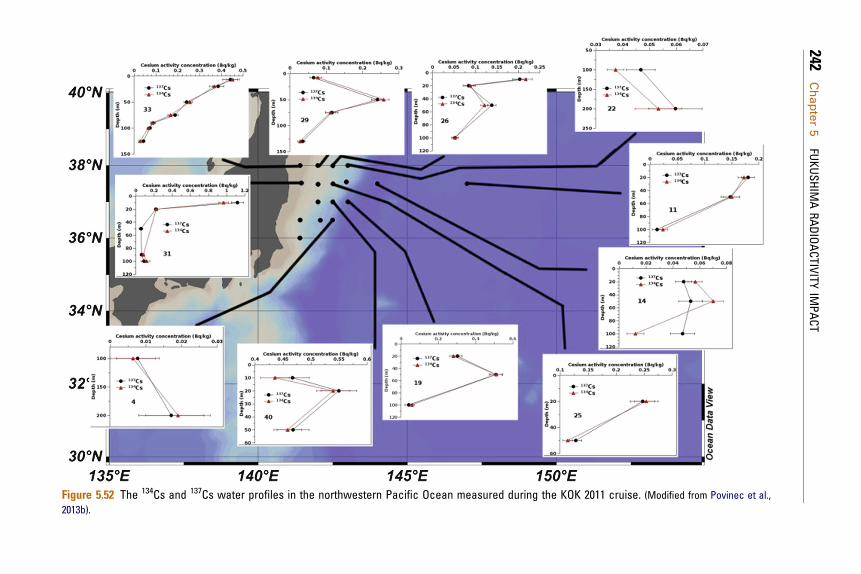
Figure 5.52 The 134Cs and 137Cs water profiles in the northwestern Pacific Ocean measured during the KOK 2011 cruise. (Modified from Povinec et al.,2013b).
242Chap
ter5
FUKUSHIMARADIOACTIVITY
IMPACT
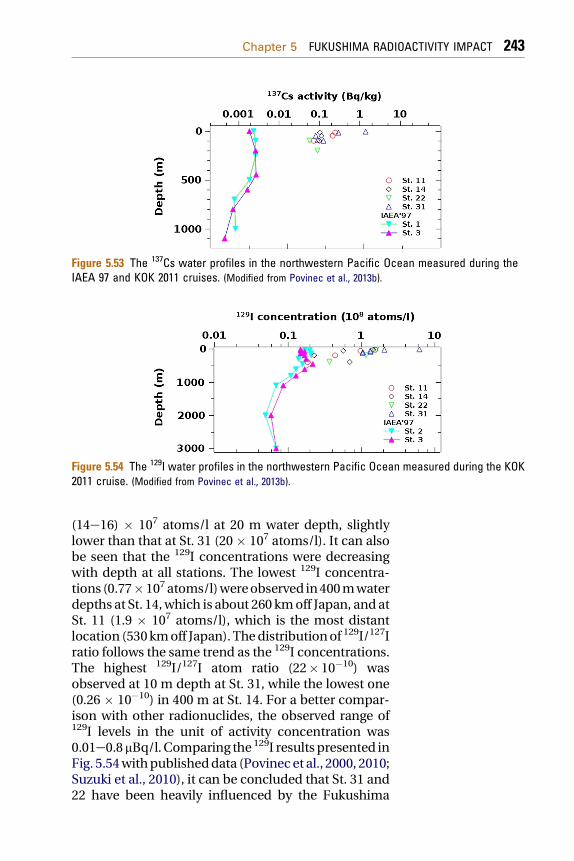
Figure 5.53 The 137Cs water profiles in the northwestern Pacific Ocean measured during theIAEA 97 and KOK 2011 cruises. (Modified from Povinec et al., 2013b).
Figure 5.54 The 129I water profiles in the northwestern Pacific Ocean measured during the KOK2011 cruise. (Modified from Povinec et al., 2013b).
Chapter 5 FUKUSHIMA RADIOACTIVITY IMPACT 243
(14e16) � 107 atoms/l at 20 m water depth, slightlylower than that at St. 31 (20 � 107 atoms/l). It can alsobe seen that the 129I concentrations were decreasingwith depth at all stations. The lowest 129I concentra-tions (0.77�107atoms/l)wereobserved in400mwaterdepths at St. 14,which is about 260 kmoff Japan, and atSt. 11 (1.9 � 107 atoms/l), which is the most distantlocation (530kmoff Japan). Thedistributionof 129I/127Iratio follows the same trend as the 129I concentrations.The highest 129I/127I atom ratio (22� 10�10) wasobserved at 10 m depth at St. 31, while the lowest one(0.26 � 10�10) in 400 m at St. 14. For a better compar-ison with other radionuclides, the observed range of129I levels in the unit of activity concentration was0.01e0.8mBq/l.Comparing the 129I resultspresented inFig. 5.54withpublisheddata (Povinecet al., 2000, 2010;Suzuki et al., 2010), it can be concluded that St. 31 and22 have been heavily influenced by the Fukushima
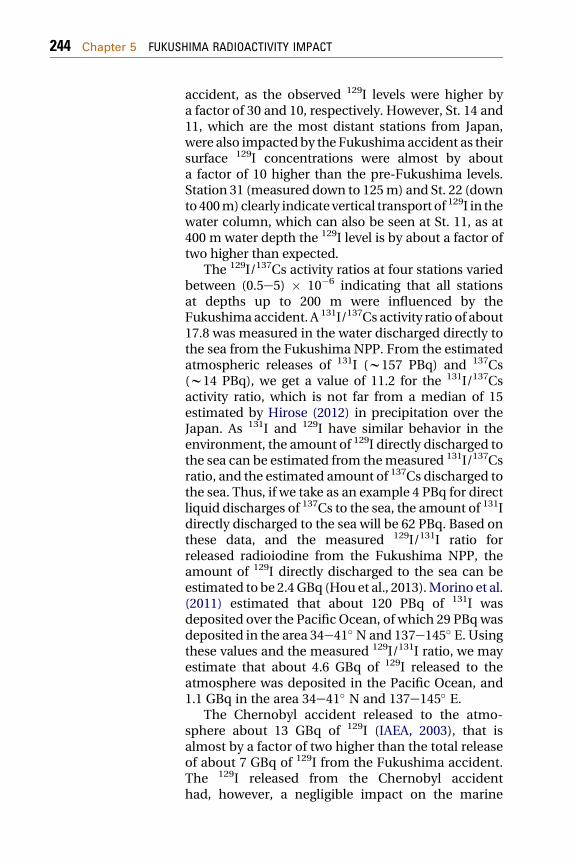
244 Chapter 5 FUKUSHIMA RADIOACTIVITY IMPACT
accident, as the observed 129I levels were higher bya factor of 30 and 10, respectively. However, St. 14 and11, which are the most distant stations from Japan,were also impactedby the Fukushima accident as theirsurface 129I concentrations were almost by abouta factor of 10 higher than the pre-Fukushima levels.Station 31 (measured down to 125m) and St. 22 (downto400m)clearly indicate vertical transport of 129I in thewater column, which can also be seen at St. 11, as at400 m water depth the 129I level is by about a factor oftwo higher than expected.
The 129I/137Cs activity ratios at four stations variedbetween (0.5e5) � 10�6 indicating that all stationsat depths up to 200 m were influenced by theFukushima accident. A 131I/137Cs activity ratio of about17.8 was measured in the water discharged directly tothe sea from the Fukushima NPP. From the estimatedatmospheric releases of 131I (w157 PBq) and 137Cs(w14 PBq), we get a value of 11.2 for the 131I/137Csactivity ratio, which is not far from a median of 15estimated by Hirose (2012) in precipitation over theJapan. As 131I and 129I have similar behavior in theenvironment, the amount of 129I directly discharged tothe sea can be estimated from themeasured 131I/137Csratio, and the estimated amount of 137Cs discharged tothe sea. Thus, if we take as an example 4 PBq for directliquid discharges of 137Cs to the sea, the amount of 131Idirectly discharged to the sea will be 62 PBq. Based onthese data, and the measured 129I/131I ratio forreleased radioiodine from the Fukushima NPP, theamount of 129I directly discharged to the sea can beestimated to be 2.4GBq (Houet al., 2013).Morino et al.(2011) estimated that about 120 PBq of 131I wasdeposited over the Pacific Ocean, of which 29 PBqwasdeposited in the area 34e41� N and 137e145� E. Usingthese values and the measured 129I/131I ratio, we mayestimate that about 4.6 GBq of 129I released to theatmosphere was deposited in the Pacific Ocean, and1.1 GBq in the area 34e41� N and 137e145� E.
The Chernobyl accident released to the atmo-sphere about 13 GBq of 129I (IAEA, 2003), that isalmost by a factor of two higher than the total releaseof about 7 GBq of 129I from the Fukushima accident.The 129I released from the Chernobyl accidenthad, however, a negligible impact on the marine
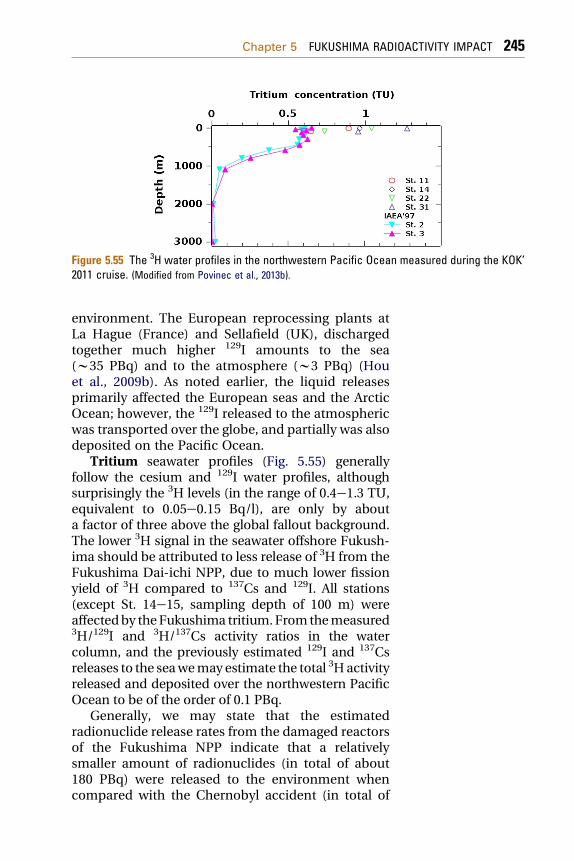
Figure 5.55 The 3H water profiles in the northwestern Pacific Ocean measured during the KOK’2011 cruise. (Modified from Povinec et al., 2013b).
Chapter 5 FUKUSHIMA RADIOACTIVITY IMPACT 245
environment. The European reprocessing plants atLa Hague (France) and Sellafield (UK), dischargedtogether much higher 129I amounts to the sea(w35 PBq) and to the atmosphere (w3 PBq) (Houet al., 2009b). As noted earlier, the liquid releasesprimarily affected the European seas and the ArcticOcean; however, the 129I released to the atmosphericwas transported over the globe, and partially was alsodeposited on the Pacific Ocean.
Tritium seawater profiles (Fig. 5.55) generallyfollow the cesium and 129I water profiles, althoughsurprisingly the 3H levels (in the range of 0.4e1.3 TU,equivalent to 0.05e0.15 Bq/l), are only by abouta factor of three above the global fallout background.The lower 3H signal in the seawater offshore Fukush-ima should be attributed to less release of 3H from theFukushima Dai-ichi NPP, due to much lower fissionyield of 3H compared to 137Cs and 129I. All stations(except St. 14e15, sampling depth of 100 m) wereaffectedby theFukushima tritium.Fromthemeasured3H/129I and 3H/137Cs activity ratios in the watercolumn, and the previously estimated 129I and 137Csreleases to the seawemay estimate the total 3Hactivityreleased and deposited over the northwestern PacificOcean to be of the order of 0.1 PBq.
Generally, we may state that the estimatedradionuclide release rates from the damaged reactorsof the Fukushima NPP indicate that a relativelysmaller amount of radionuclides (in total of about180 PBq) were released to the environment whencompared with the Chernobyl accident (in total of
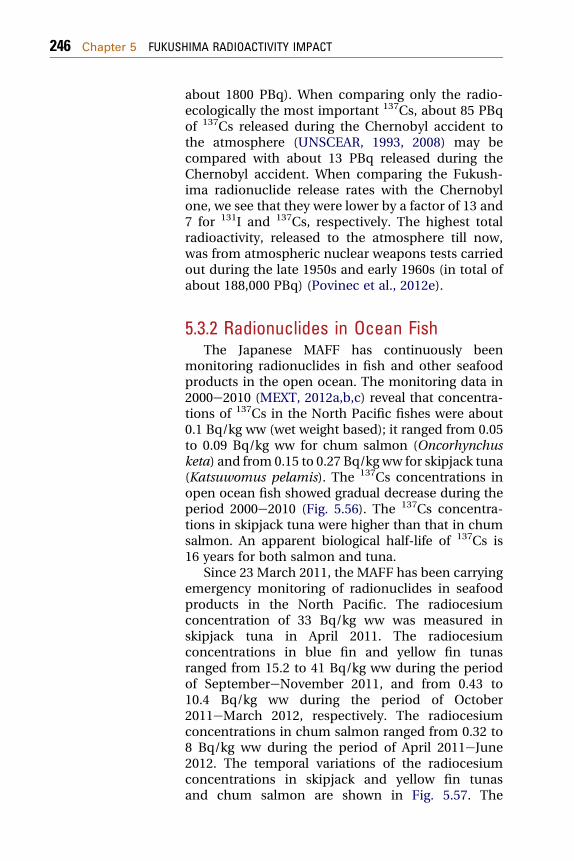
246 Chapter 5 FUKUSHIMA RADIOACTIVITY IMPACT
about 1800 PBq). When comparing only the radio-ecologically the most important 137Cs, about 85 PBqof 137Cs released during the Chernobyl accident tothe atmosphere (UNSCEAR, 1993, 2008) may becompared with about 13 PBq released during theChernobyl accident. When comparing the Fukush-ima radionuclide release rates with the Chernobylone, we see that they were lower by a factor of 13 and7 for 131I and 137Cs, respectively. The highest totalradioactivity, released to the atmosphere till now,was from atmospheric nuclear weapons tests carriedout during the late 1950s and early 1960s (in total ofabout 188,000 PBq) (Povinec et al., 2012e).
5.3.2 Radionuclides in Ocean Fish
The Japanese MAFF has continuously beenmonitoring radionuclides in fish and other seafoodproducts in the open ocean. The monitoring data in2000e2010 (MEXT, 2012a,b,c) reveal that concentra-tions of 137Cs in the North Pacific fishes were about0.1 Bq/kg ww (wet weight based); it ranged from 0.05to 0.09 Bq/kg ww for chum salmon (Oncorhynchusketa) and from 0.15 to 0.27 Bq/kg ww for skipjack tuna(Katsuwomus pelamis). The 137Cs concentrations inopen ocean fish showed gradual decrease during theperiod 2000e2010 (Fig. 5.56). The 137Cs concentra-tions in skipjack tuna were higher than that in chumsalmon. An apparent biological half-life of 137Cs is16 years for both salmon and tuna.
Since 23 March 2011, the MAFF has been carryingemergency monitoring of radionuclides in seafoodproducts in the North Pacific. The radiocesiumconcentration of 33 Bq/kg ww was measured inskipjack tuna in April 2011. The radiocesiumconcentrations in blue fin and yellow fin tunasranged from 15.2 to 41 Bq/kg ww during the periodof SeptembereNovember 2011, and from 0.43 to10.4 Bq/kg ww during the period of October2011eMarch 2012, respectively. The radiocesiumconcentrations in chum salmon ranged from 0.32 to8 Bq/kg ww during the period of April 2011eJune2012. The temporal variations of the radiocesiumconcentrations in skipjack and yellow fin tunasand chum salmon are shown in Fig. 5.57. The
Rad
ioce
sium
con
cent
ratio
ns in
fish
es (B
q/kg
)
100
10
1
0.1May Oct Mar Aug
Month (2011 – 2012)
Figure 5.57 Temporal variations of radiocesium concentrations in skipjack and yellow fintunas, and chum salmon.
1
0.1
01998 2000 2002 2004 2006 2008 2010 2012
Year
137 C
s co
ncen
tratio
ns in
fish
es (B
q/kg
)
Figure 5.56 The 137Cs concentrations in open ocean fish showing gradual decrease during theperiod 2000e2010.
Chapter 5 FUKUSHIMA RADIOACTIVITY IMPACT 247
248 Chapter 5 FUKUSHIMA RADIOACTIVITY IMPACT
radiocesium concentrations in tunas decreasedexponentially during the period of April 2011eNovember 2012, in which an apparent biological half-life of radiocesium in tunas is about 90 days.
The Fukushima-derived radiocesium was detectedin Pacific blue fin tuna caught in the remote sea area,California Current region (Madigan et al., 2012). The134Cs and 137Cs concentrations in 15 Pacific blue fintunas sampled in August 2011weremeasured to be 4.0and 6.3 Bq/kg dw, respectively. This finding suggeststhat Pacific blue fin tuna can rapidly transport radio-nuclides from a point source in Japan coast to distantecoregions and demonstrate the importance ofmigratory animals as transport vectorsof radionuclidesbecause there were no 134Cs and background levels(w1 Bq/kg dw) of 137Cs in pre-Fukushima blue fin andpost-Fukushima yellow fin tunas in the California.
5.3.3 Modeling of RadionuclideTransport in the Ocean
Several types of circulation models have beendeveloped to simulate radionuclide concentrationsin surface and subsurface seawater (e.g. Monte et al.,2009; Tsumune et al., 2011, 2012; Rypina et al., 2013).Tsumune et al. (2011, 2012) recently describeda high-resolution Ocean General Circulation Model(OGCM) with vertical mixing, horizontal viscosityand eddy flux parametrization which has been usedfor tracing global fallout radionuclides in theSouthern Hemisphere oceans.
We shall discuss in this chapter simulations of137Cs dispersion in the world ocean after releasesfrom the Fukushima Dai-ichi NPP using the Long-term Assessment Model of Radionuclides (LAMER)in the oceans code. The model was developed withthe aim to assess impacts of multilateral radioactiveeffluents from nuclear facilities to the ocean duringnormal or accidental situations (Nakano, 2004, 2006,2008). The LAMER is based on the OGCM developedfor the long-term assessment of 137Cs and otherradionuclides with similar behavior in seawater (e.g.90Sr and 129I) (Nakano and Povinec, 2003a), as well asfor particle-reactive radionuclides (e.g. Pu isotopes
Chapter 5 FUKUSHIMA RADIOACTIVITY IMPACT 249
and 241Am) (Nakano and Povinec, 2003b; Nakano,2006) in the water column of the world ocean.
5.3.3.1 LAMER CodeThe LAMER code is a calculation program simu-
lating radionuclide transport in the ocean viaadvection, diffusion and scavenging processes. Theaveraged annual three-dimensional velocity fields,obtained by the OGCMwere used in the calculations.The LAMER code represents a medium-resolutionOGCM with the grids of 2� for latitudinal and longi-tudinal directions. In the vertical direction, we used15 layers from the ocean surface to its bottom fordetermination of the velocity fields. The model canalso deal with scavenging processes, which areespecially required when modeling the dispersion ofparticle-reactive radionuclides such as plutoniumand americium (Nakano and Povinec, 2003b).However, for cesium, the distribution coefficient (Kd)is only 2000 (compared to 100,000 for Pu) (IAEA,2004), therefore scavenging processes in this case arenot of great importance. Actually, a part of Cs inseawater would sink to the seafloor, and some wouldresuspend back to seawater from the sediment.However, this study is focusing only on Cs (or similarradionuclides), therefore, scavenging processes arenot considered.
The characteristics of the LAMER code and param-eters used in simulations have already been described,therefore we shall not repeat them there (Nakano andPovinec, 2003a, 2003b, 2012; Nakano, 2004). We shallfocus on the evaluation of the simulations, and theircomparison with experimental data on the 137Csdistribution in the North Pacific Ocean after theFukushima accident (Povinec et al., 2013a, b).
5.3.3.2 Radionuclide Source Term Usedin Ocean Simulations
The radionuclide source term used in marinesimulations consisted of two parts:1. A direct release of radioactive water to the marine
environment.2. A deposition of radionuclides from the atmo-
sphere on the ocean surface.
250 Chapter 5 FUKUSHIMA RADIOACTIVITY IMPACT
We shall focus on 137Cs only as this radionuclide isconsidered to be the most important for the long-term impact due to large releases, relatively longhalf-life and its contributions to radiation doses ofthe public (Aarkrog et al., 1997). Following the resultspresented in previous chapters, we shall do thesimulations for the unit of 137Cs release to the oceanequivalent of 1 PBq. The real 137Cs activity concen-trations can be then adjusted whenmore exact valuesof radionuclide source terms will be available, just bymultiplying the simulated results. Using the aboveinformation on the 137Cs release rates, the LAMERcalculated the three-dimensional distribution of137Cs in the world ocean up to the year 2041, i.e.30 years after the accident.
5.3.3.3 Horizontal and Vertical Distributionof 137Cs in the North Pacific Ocean
The ocean global circulation model (with unitrelease of 1 PBq of 137Cs) shows that the 137Cs plumein surface seawater will move from the Fukushimacoast to the eastward with Kuroshio Current and itsextension (Fig. 5.58). Then, it will move relativelyslowly with the North Pacific Current, as it will take4e5 years to arrive at the US west coast with 137Cslevels of w0.3 Bq/m3. In 2022, the entire NorthPacific Ocean will be labeled with Fukushima 137Cswith concentrations bellow 0.1 Bq/m3. Themaximum predicted 137Cs activity concentrationsdue to the Fukushima accident in 2012 in surfaceseawater of the open western North Pacific Ocean(at 38� N, 164� E) will be w2 Bq/m3.
If we take presently the most probable total 137Csrelease rate, composed from direct liquid releases(4 PBq) and the atmospheric deposition over thenorthwestern Pacific Ocean (5 PBq; Nakano andPovinec, 2012) and multiply the above predicted137Cs activity concentrations for this total release,then the levels expected at the US coast will be byabout 3 Bq/m3. The model-predicted values ofsurface 137Cs concentrations in the Pacific Ocean canbe compared with the historical observations gath-ered in the framework of the Worldwide MarineRadioactivity Studies (WOMARS) project (Povinec
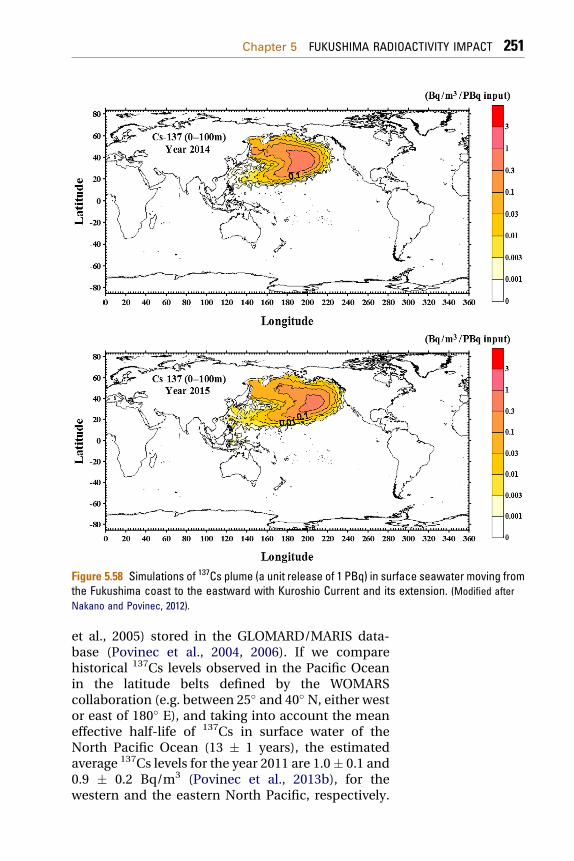
Figure 5.58 Simulations of 137Cs plume (a unit release of 1 PBq) in surface seawater moving fromthe Fukushima coast to the eastward with Kuroshio Current and its extension. (Modified afterNakano and Povinec, 2012).
Chapter 5 FUKUSHIMA RADIOACTIVITY IMPACT 251
et al., 2005) stored in the GLOMARD/MARIS data-base (Povinec et al., 2004, 2006). If we comparehistorical 137Cs levels observed in the Pacific Oceanin the latitude belts defined by the WOMARScollaboration (e.g. between 25� and 40� N, either westor east of 180� E), and taking into account the meaneffective half-life of 137Cs in surface water of theNorth Pacific Ocean (13 � 1 years), the estimatedaverage 137Cs levels for the year 2011 are 1.0� 0.1 and0.9 � 0.2 Bq/m3 (Povinec et al., 2013b), for thewestern and the eastern North Pacific, respectively.
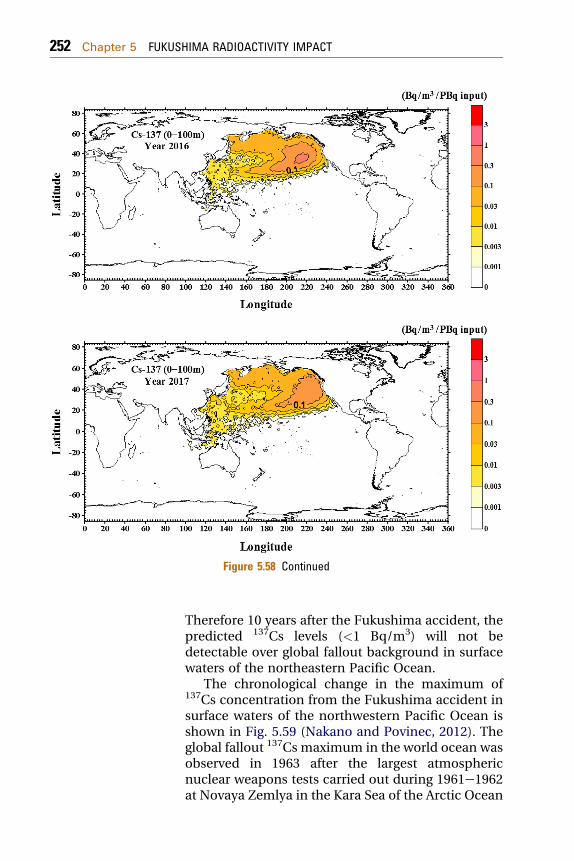
Figure 5.58 Continued
252 Chapter 5 FUKUSHIMA RADIOACTIVITY IMPACT
Therefore 10 years after the Fukushima accident, thepredicted 137Cs levels (<1 Bq/m3) will not bedetectable over global fallout background in surfacewaters of the northeastern Pacific Ocean.
The chronological change in the maximum of137Cs concentration from the Fukushima accident insurface waters of the northwestern Pacific Ocean isshown in Fig. 5.59 (Nakano and Povinec, 2012). Theglobal fallout 137Cs maximum in the world ocean wasobserved in 1963 after the largest atmosphericnuclear weapons tests carried out during 1961e1962at Novaya Zemlya in the Kara Sea of the Arctic Ocean
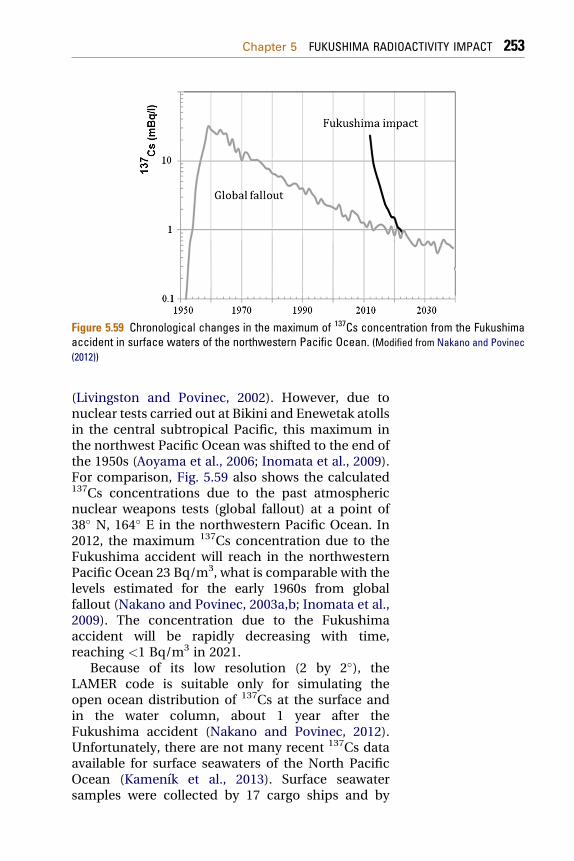
Figure 5.59 Chronological changes in the maximum of 137Cs concentration from the Fukushimaaccident in surface waters of the northwestern Pacific Ocean. (Modified from Nakano and Povinec(2012))
Chapter 5 FUKUSHIMA RADIOACTIVITY IMPACT 253
(Livingston and Povinec, 2002). However, due tonuclear tests carried out at Bikini and Enewetak atollsin the central subtropical Pacific, this maximum inthe northwest Pacific Ocean was shifted to the end ofthe 1950s (Aoyama et al., 2006; Inomata et al., 2009).For comparison, Fig. 5.59 also shows the calculated137Cs concentrations due to the past atmosphericnuclear weapons tests (global fallout) at a point of38� N, 164� E in the northwestern Pacific Ocean. In2012, the maximum 137Cs concentration due to theFukushima accident will reach in the northwesternPacific Ocean 23 Bq/m3, what is comparable with thelevels estimated for the early 1960s from globalfallout (Nakano and Povinec, 2003a,b; Inomata et al.,2009). The concentration due to the Fukushimaaccident will be rapidly decreasing with time,reaching <1 Bq/m3 in 2021.
Because of its low resolution (2 by 2�), theLAMER code is suitable only for simulating theopen ocean distribution of 137Cs at the surface andin the water column, about 1 year after theFukushima accident (Nakano and Povinec, 2012).Unfortunately, there are not many recent 137Cs dataavailable for surface seawaters of the North PacificOcean (Kamenık et al., 2013). Surface seawatersamples were collected by 17 cargo ships and by
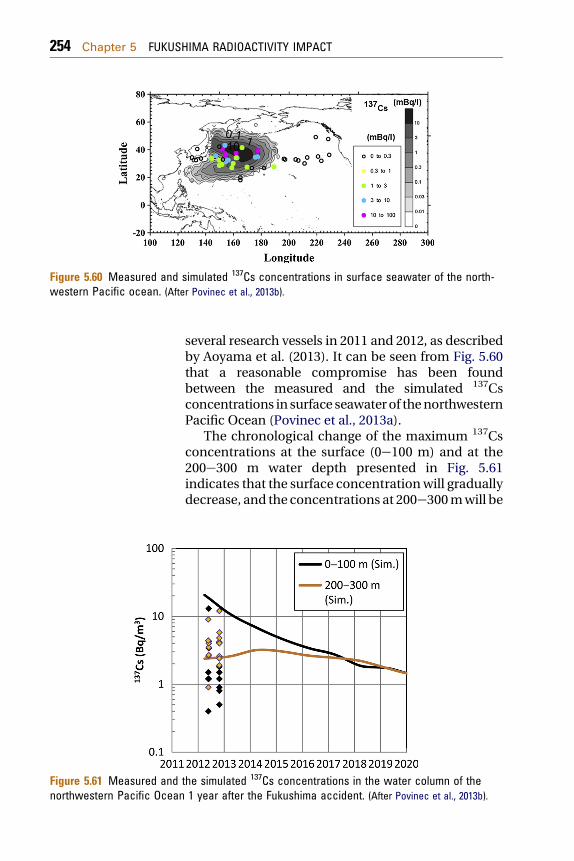
Figure 5.61 Measured andnorthwestern Pacific Ocean
Figure 5.60 Measured and simulated 137Cs concentrations in surface seawater of the north-western Pacific ocean. (After Povinec et al., 2013b).
254 Chapter 5 FUKUSHIMA RADIOACTIVITY IMPACT
several research vessels in 2011 and 2012, as describedby Aoyama et al. (2013). It can be seen from Fig. 5.60that a reasonable compromise has been foundbetween the measured and the simulated 137Csconcentrations in surface seawaterof thenorthwesternPacific Ocean (Povinec et al., 2013a).
The chronological change of the maximum 137Csconcentrations at the surface (0e100 m) and at the200e300 m water depth presented in Fig. 5.61indicates that the surface concentrationwill graduallydecrease, and the concentrations at 200e300mwill be
the simulated 137Cs concentrations in the water column of the1 year after the Fukushima accident. (After Povinec et al., 2013b).
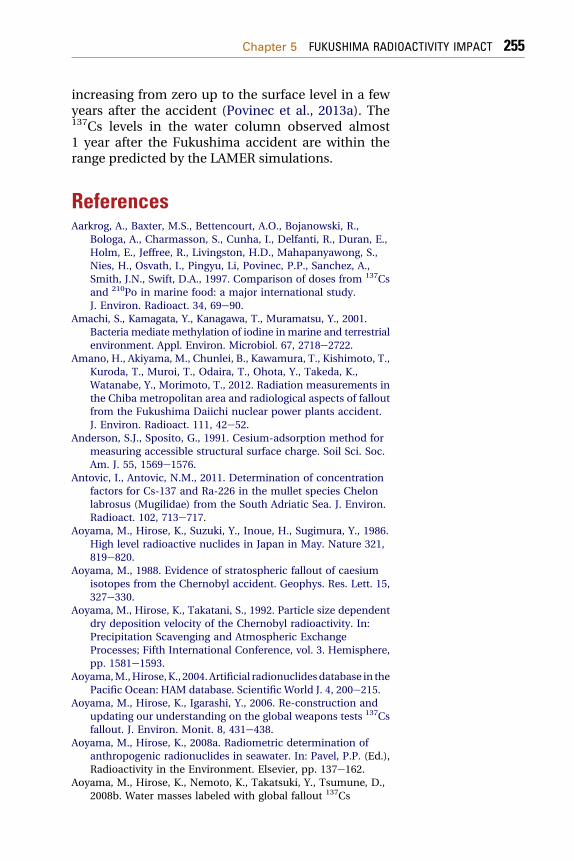
Chapter 5 FUKUSHIMA RADIOACTIVITY IMPACT 255
increasing from zero up to the surface level in a fewyears after the accident (Povinec et al., 2013a). The137Cs levels in the water column observed almost1 year after the Fukushima accident are within therange predicted by the LAMER simulations.
ReferencesAarkrog, A., Baxter, M.S., Bettencourt, A.O., Bojanowski, R.,
Bologa, A., Charmasson, S., Cunha, I., Delfanti, R., Duran, E.,
Holm, E., Jeffree, R., Livingston, H.D., Mahapanyawong, S.,
Nies, H., Osvath, I., Pingyu, Li, Povinec, P.P., Sanchez, A.,
Smith, J.N., Swift, D.A., 1997. Comparison of doses from 137Cs
and 210Po in marine food: a major international study.
J. Environ. Radioact. 34, 69e90.
Amachi, S., Kamagata, Y., Kanagawa, T., Muramatsu, Y., 2001.
Bacteria mediate methylation of iodine in marine and terrestrial
environment. Appl. Environ. Microbiol. 67, 2718e2722.Amano, H., Akiyama, M., Chunlei, B., Kawamura, T., Kishimoto, T.,
Kuroda, T., Muroi, T., Odaira, T., Ohota, Y., Takeda, K.,
Watanabe, Y., Morimoto, T., 2012. Radiation measurements in
the Chiba metropolitan area and radiological aspects of fallout
from the Fukushima Daiichi nuclear power plants accident.
J. Environ. Radioact. 111, 42e52.
Anderson, S.J., Sposito, G., 1991. Cesium-adsorption method for
measuring accessible structural surface charge. Soil Sci. Soc.
Am. J. 55, 1569e1576.
Antovic, I., Antovic, N.M., 2011. Determination of concentration
factors for Cs-137 and Ra-226 in the mullet species Chelon
labrosus (Mugilidae) from the South Adriatic Sea. J. Environ.
Radioact. 102, 713e717.
Aoyama, M., Hirose, K., Suzuki, Y., Inoue, H., Sugimura, Y., 1986.
High level radioactive nuclides in Japan in May. Nature 321,
819e820.
Aoyama, M., 1988. Evidence of stratospheric fallout of caesium
isotopes from the Chernobyl accident. Geophys. Res. Lett. 15,
327e330.
Aoyama, M., Hirose, K., Takatani, S., 1992. Particle size dependent
dry deposition velocity of the Chernobyl radioactivity. In:
Precipitation Scavenging and Atmospheric Exchange
Processes; Fifth International Conference, vol. 3. Hemisphere,
pp. 1581e1593.
Aoyama,M.,Hirose,K., 2004.Artificial radionuclidesdatabase in the
Pacific Ocean: HAM database. Scientific World J. 4, 200e215.Aoyama, M., Hirose, K., Igarashi, Y., 2006. Re-construction and
updating our understanding on the global weapons tests 137Cs
fallout. J. Environ. Monit. 8, 431e438.
Aoyama, M., Hirose, K., 2008a. Radiometric determination of
anthropogenic radionuclides in seawater. In: Pavel, P.P. (Ed.),
Radioactivity in the Environment. Elsevier, pp. 137e162.
Aoyama, M., Hirose, K., Nemoto, K., Takatsuki, Y., Tsumune, D.,
2008b. Water masses labeled with global fallout 137Cs
256 Chapter 5 FUKUSHIMA RADIOACTIVITY IMPACT
formed by subduction in the North Pacific. Geophys. Res. Lett.
35, L01604. http://dx.doi.org/10.1029/2007GL031964.
Aoyama, M., Fukasawa, M., Hirose, K., Hamajima, Y., Kawano, T.,
Povinec, P.P., Sanchez-Cabeza, J.A., 2011. Cross equator
transport of 137Cs from North Pacific Ocean to South Pacific
Ocean (BEAGLE2003 cruises). Prog. Oceanography 89, 7e16.
http://dx.doi.org/10.1016/j.pocean.2010.12.003.
Aoyama, M., Tsumune, D., Hamajima, Y., 2012a. Distribution of137Cs and 134Cs in the North Pacific Ocean: impacts of the
TEPCO Fukushima Dai-chi NPP accident. J. Radioanal. Nucl.
Chem. http://dx.doi.org/10.1007/s10967-012-2033-2.
Aoyama, M., Tsumune, D., Uematsu, M., Kondo, F., Hamajima, Y.,
2012b. Temporal variation of 134Cs and 137Cs activities in
surface water at stations along the coastline near the
Fukushima Dai-ichi nuclear power plant accident site, Japan.
Geochem. J. 46, 321e325.Aoyama, M., Uematsu, M., Tsumune, D., Hamajima, Y., 2013.
Surface pathway of radioactive plume of TEPCO Fukushima
NPP1 released 134Cs and 137Cs, Biogeosciences Discuss. 10,
3067e3078. http://dx.doi.org/10.5194/bgd-10-265-2013.
Arimoto, R., Webb, J.L., Conley, M., 2005. Radioactive
contamination of atmospheric dust over southeastern
New Mexico. Atmos. Environ. 39, 4745e4754.
Bailly du Bois, P., Laguionie, P., Boust, D., Korsakissok, I.,
Didier, D., Fievet, B., 2012. Estimation of marine source-term
following Fukushima Dai-ichi accident. J. Environ. Radioact.
114, 2e9.Baeza, A., Corbacho, J.A., Rodrıguez, A., Galvan, J., Garcıa-
Tenorio, R., Manjon, G., Mantero, J., Vioque, I., Arnold, D.,
Grossi, C., Serrano, I., Valles, I., Vargas, A., 2012. Influence of
the Fukushima Dai-ichi nuclear accident on Spanish
environmental radioactivity levels. J. Environ. Radioact. 114,
138e145.
Balkanski, Y.J., Jacob, D.J., Gardner, G.M., Graustein, W.C.,
Turekian, K.K., 1993. Transport and residence time of
tropospheric aerosols inferred from a global three-
dimensional simulation of 210Pb. J. Geophys. Res. 98,
20573e20586.Barsanti, M., Conte, F., Delbono, I., Iurlaro, G., Battisti, P.,
Bartoluzzi, S., Lorenzelli, R., Salvi, S., Zicari, S., Papucci, C.,
Delfanti, R., 2012. Environmental radioactivity analyses in Italy
following the Fukushima Dai-chi nuclear accident. J. Environ.
Radioact. 114, 126e130.
Beresford, N.A., Barnett, C.L., Howard, B.J., Howard, D.C.,
Wells, C., Tyler, A.N., Bradley, S., Copplestone, D., 2012.
Observations of Fukushima fallout in Great Britain. J. Environ.
Radioact. 114, 48e53.
Biddulph, D.L., Beck, J.W., Burr, G.S., Donahue, D.J.,
Hatheway, A.L., Jull, A.J.T., 2000. Measurement of the
radioisotope 129I at the NSF-Arizona AMS. Nucl. Instrum.
Methods Phys. Res. B 172, 693e698.
Biegalski, S.R., Bowyer, T.W., Eslinger, P.W., Friese, J.A.,
Greenwood, L.R., Haas, D.A., Hayes, J.C., Hoffman, I.,
Chapter 5 FUKUSHIMA RADIOACTIVITY IMPACT 257
Keillor, M., Miley, H.S., Moring, M., 2012. Analysis of data from
sensitive U.S. monitoring stations for the Fukushima Dai-ichi
nuclear reactor accident. J. Environ. Radioact. 114, 15e21.
Bikit, I., Mrda, D., Todorovic, N., Nikolov, J., Krmar, M.,
Veskovic, M., Slivka, J., Hansman, J., Forkapic, S.,
Jovancevic, N., 2012. Airborne radioiodine in northern Serbia
from Fukushima. J. Environ. Radioact. 114, 89e93.
Bolsunovsky, A., Dementyev, D., 2011. Evidence of the
radioactive fallout in the center of Asia (Russia) following
the Fukushima nuclear accident. J. Environ. Radioact. 102,
1062e1064.
Bonjean, F., Lagerloef, G.S.E., 2002. Diagnostic model and analysis
of the surface currents in the tropical Pacific Ocean. J. Phys.
Oceanogr. 32, 2938e2954. http://dx.doi.org/10.1175/1520-
0485. 032<2938:DMAAOT>2.0.CO;2.
Bossew, P., Kirchner, G., De Cort, M., De Vries, G., Nishev, A., De
felice, L., 2012. Radioactivity from Fukushima Dai-ichi in air
over Europe: part 1: spatio-temporal analysis. J. Environ.
Radioact. 114, 22e34.
Boulyga, S.F., Heumann, K.G., 2006. Determination of extremely
low 236U/238U isotope ratios in environmental samples by
sector-field inductively coupled plasma mass spectrometry
using high-efficiency sample introduction. J. Environ.
Radioact. 88, 1e10.Bowyer, T.W., Biegalski, S.R., Cooper, M., Eslinger, P.W., Haas, D.,
Hayes, J.C., et al., 2011. Elevated radioxenon detected remotely
following the Fukushima nuclear accident. J. Environ.
Radioact. 102, 681e687.
Buesseler, K.O., 2012. Fishing for answers off Fukushima. Science
338, 480e482.
Buesseler, K., Aoyama, M., Fukasawa, M., 2011. Impacts of the
Fukushima nuclear power plants on marine radioactivity.
Environ. Sci. Technol. 45, 9931e9935.
Buesseler, K.O., Jayne, S.R., Fisher, N.S., Rypina, I.I., Baumann, H.,
Baumann, Z., Breier, C.F., Douglass, E.M., George, J.,
Macdonald, A.M., Miyamoto, H., Nishikawa, J., Pike, S.M.,
Yoshida, S., 2012. Fukushima-derived radionuclides in the
ocean and biota off Japan. Proc. Natl. Acad. Sci. U S A 109,
5984e5988.
Carvalho, F.P., Reis, M.C., Oliveira, J.M., Malta, M., Silva, L., 2012.
Radioactivity from Fukushima nuclear accident detected in
Lisbon. Portugal. J. Environ. Radioact. 114, 152e156.Chamberlain, A.C., 1953. Experiments on the deposition of iodine-
131 vapour onto surfaces from an airstream. Phil. Mag. 44,
1145e1153.
Chamberlain, A.C., 1991. Radioactive Aerosols. In: Cambridge
Environmental Chemistry Series, vol. 3. University Press,
Cambridge.
Chino, M., Nakayama, H., Nagai, H., Terada, H., Katata, G.,
Yamazawa, H., 2011. Preliminary estimation of release
amounts of 131I and 137Cs accidentally discharged from the
Fukushima Daiichi nuclear power plant into the atmosphere.
J. Nucl. Sci. Technol. 48, 1129e1134.
258 Chapter 5 FUKUSHIMA RADIOACTIVITY IMPACT
Choi, H.J., Amistadi, M., Chorover, J., 2005. Clay mineral
weathering and contaminant dynamics in a caustic aqueous
system I. Wet chemistry and aging effects. Geochim.
Cosmochim. Acta 69, 4425e4436.
Clemenza, M., Fiorini, E., Previtali, E., Sala, E., 2012. Measurement
of airborne 131I, 134Cs and 137Cs due to the Fukushima
reactor incident in Milan (Italy). J. Environ. Radioact. 114,
113e118.
Cosma, C., Iurian, A.R., Nita, D.C., Begy, R., Cindea, C., 2012.
Indicators of the Fukushima radioactive release in NW
Romania. J. Environ. Radioact. 114, 94e99.
CPSMA (Commission on Physical Sciences, Mathematics and
Applications), 1996. Radiochemistry in Nuclear Power
Reactors. The National Academy of Sciences, USA. http://
www.nap.adu/openbook/NI000156/htm/50.html.
Crecelius, E.A., Robertson, D.E., Abel, K.H., Cochran, D.A.,
Weimer, W.C., 1978. Atmospheric deposition of 7Be and
other elements on the Washington coast, Pacific Northwest
Laboratory Annual Report for 1977 to the DOE Assistant
Secretary for Environment: Ecological Sciences, PNL-2500
PT-2, Battelle, Pacific Northwest Laboratory, pp. 7.25e7.26.
Cunha, I.L., Minita, C.S., Paiva, R.P., Teixeira, A., 1993. Levels of
cesium-137 in seawater and fish from the Brazilian coast. Sci.
Total Environ. 140, 431e435.Diaz Leon, J., Jaffe, D.A., Kaspar, J., Knecht, A., Miller, M.L.,
Robertson, R.G.H., Schubert, A.G., 2011. Arrival time and
magnitude of airborne fission products from the Fukushima,
Japan, reactor incident as measured in Seattle, WA, USA.
J. Environ. Radioact. http://dx.doi.org/10.1016/
j.jenvrad.2011.06.005.
Dietze, H., Kriest, I., 2012. 137Cs off FukushimaDai-ichi, Japan:model
based estimates of dilution and fate. Ocean Sci. 8, 319e332.
Doi, T., Masumoto, K., Toyoda, A., Tanaka, A., Shibata, Y.,
Hirose, K., 2013. Anthropogenic radionuclides in the
atmosphere observed at Tsukuba: characteristics of the
radionuclides derived from Fukushima. J. Environ. Radioact.
122, 55e62.
Doi, H., Takahata, T., Tanaka, K., 2012. Trophic position and
metabolic rate predict the long-term decay process of
radioactive cesium in fish: a meta-analysis. PLOS One 7,
e29295.
Draxler, R.R., Rolph, G.D., 2011. HYSPLIT (Hybrid Single-particle
Lagrangian Integrated Trajectory). NOAA Air Resources
Laboratory. http://ready.arl.noaa.gov/HYSPLIT.php.
Ehhalt, D.H., 1973. Turnover times of 137Cs and HTO in the
troposphere and removal rates of natural particles and water
vapor. J. Geophys. Res. 78, 7076e7086.
Endo, S., Kajimoto, T., Shizuma, K., 2013. Paddy-field
contamination with 134Cs and 137Cs due to Fukushima Dai-
ichi nuclear power plant accident and soil-to rice transfer
coefficients. J. Environ. Radioact. 116, 59e64.
Endo, S., Kimura, S., Takatsuji, T., Nanasawa, K., Imanaka, T.,
Shizuma, K., 2012. Measurement of soil contamination by
Chapter 5 FUKUSHIMA RADIOACTIVITY IMPACT 259
radionuclides due to the Fukushima Daiichi nuclear power
plant accident and associated estimated cumulative external
dose estimation. J. Environ. Radioact. 111, 18e27.
Environmental Impacts of the Fukushima Accident (PART II),
HYPERLINK “http://www.sciencedirect.com/science/journal/
0265931X/114” Volume 114, pp. 1-170 (December 2012).
Estournel, C., Bosc, E., Bocquet, M., Ulses, C., Marsaleix, P.,
Winiarek, V., Osvath, I., Nguyen, C., Duhaut, T., Lyard, F.,
Michaud, H., Auclair, F., 2012. Assessment of the amount of
cesium-137 released into the Pacific Ocean after the
Fukushima accident and analysis of its dispersion in Japanese
coastal waters. J. Geophys. Res. 117, C11014. http://dx.doi.org/
10.1029/2012JC007933.
Evrard, O., Van Beek, P., Gateuille, D., Pont, V., Lefevre, I.,
Lansard, B., Bonte, P., 2012. Evidence of the radioactive fallout
in France due to the Fukushima nuclear accident. J. Environ.
Radioact. 114, 54e60.
Fujiwara, H., Fukuyama, T., Shirato, Y., Ohkuro, T., Taniyama, I.,
Zhang, T.-H., 2007. Deposition of atmospheric 137Cs in Japan
associated with the Asian dust event of March 2002. Sci. Total
Environ. 384, 306e315.
Fujiwara, T., Saito, T., Muroya, Y., Sawahata, H., Yamashita, Y.,
Nagasaki, S., Okamoto, K., Takahashi, H., Uesaka, M.,
Katsumura, Y., Tanaka, S., 2012. Isotopic ratio and vertical
distribution of radionuclides in soil affected by the accident of
Fukushima Dai-ichi nuclear power plants. J. Environ.
Radioact., 13e44.Furuta, S., Sumiya, S., Watanabe, H., Nakano, M., Imaizumi, K.,
Takeyasu, M., Nakada, A., Fujita, M., Mizutani, T.,
Morisawa, M., Kokubun, Y., Kono, T., Nagaoka, M.,
Yokoyama, H., Hokama, T., Isozaki, T., Nemoto, M., Hiyama, Y.,
Onuma, T., Kato, C., Kurachi, T., 2011. Results of the
environmental radiation monitoring following the accident at
the Fukushima Daiichi nuclear power plant e Interim report
(ambient radiation dose rate, radioactivity concentration in the
air and radioactivity concentration in the fallout). JAEA-Review
2011-035, 1e84 (In Japanese).
Garland, J.A., Cambray, R.S., 1988. Deposition, resuspension and
the long-term variation of airborne radioactivity from
Chernobyl. In: Proceedings of IVth Symposium International
de Radioecologie de Caderache. Centre d’Etudie Nucleaire de
Cadarache, France (tome 1), pp. B36eB31.Gera, M., Povinec, P.P., et al. (in preparation).
Haba, H., Kanaya, J., Mukai, H., Kambara, T., Kase, M., 2012. One-
year monitoring of airborne radionuclides in Wako, Japan,
after the Fukushima Dai-ichi nuclear power plant accident in
2011. Geochem. J. 46, 271e278.
Hamada, N., Ogino, H., 2012. Food safety regulations: what we
learned from the Fukushima nuclear accident. J. Environ.
Radioact. 111, 83e99.
Hamajima, Y., Komura, K., 2004. Background components of
Ge detectors in ogoya underground laboratory. Appl. Radiat.
Isot. 61, 179e183. http://dx.doi.org/10.1016/j.apradiso.2004.03.041.
260 Chapter 5 FUKUSHIMA RADIOACTIVITY IMPACT
Harvey, M.J., Matthews, K.M., 1989. 7Be deposition in a high-
rainfall area of New Zealand. J. Atmos. Chem. 8, 299e306.
Hernandez-Ceballos, M.A., Hong, G.H., Lozano, R.L., Kim, Y.I.,
Lee, H.M., Kim, S.H., Yeh, S.W., Bolıvar, J.P., Baskaran, M.,
2012. Tracking the complete revolution of surface westerlies
over Northern Hemisphere using radionuclides emitted from
Fukushima. Sci. Total Environ. 438, 80e85.
Hirose, K., 1995. Geochemical studies on the Chernobyl
radioactivity in environmental samples. J. Radioanal. Nucl.
Chem. 197, 315e335 (Articles).
Hirose, K., 2000. Dry and wet deposition behaviors of thorium
isotopes. J. Aerosol Res. Japan 15, 256e263.Hirose, K., 2012. 2011 Fukushima Daiichi nuclear power plant
accident: summary of regional radioactivity deposition
monitoring results. J. Environ. Radioact. 111, 13e17.
Hirose, K., 2013. Temporal variation of monthly 137Cs deposition
observed in Japan: effects of the Fukushima Daiichi
nuclear power plant accident, Appl. Radiat. Isot., http://dx.doi.
org/10.1016/j.apradiso.2013.03.076
Hirose, K., Aoyama, M., Sugimura, Y., 1990. Plutonium and cesium
isotopes in river waters in Japan. J. Radioanal. Nucl. Chem.
141, 191e202.
Hirose, K., Igarashi, Y., Aoyama, M., Kim, C.K., Kim, C.S.,
Chang, B.W., 2003. Recent trends of plutonium fallout
observed in Japan: plutonium as a proxy for desertification.
J. Environ. Monit. 5, 1e7.
Hirose, K., Aoyama, M., Igarashi, Y., Komura, K., 2005. Ultra-
sensitive mass spectrometric and other methods applied to
environmental problems. J. Radioanal. Nucl. Chem. 263,
349e353. http://dx.doi.org/10.1007/s10967-005-0593-0.
Hirose, K., Igarashi, Y., Aoyama, M., 2007. Recent trends of
plutonium fallout observed in Japan: Comparison with
national lithogenic radionuclides, thorium isotopes.
J. Radioanal. Nucl. Chem. 273, 115e118.
Hirose, K., Igarashi, Y., Aoyama, M., 2008. Analysis of 50 years
records of atmospheric deposition of long-lived radionuclides
in Japan. Appl. Radiat. Isot. 66, 1675e1678.
Hirose, K., Igarashi, Y., Aoyama, M., Inomata, Y., 2010.
Depositional behaviors of plutonium and thorium at Tsukuba
and Mt. Haruna in Japan indicate the sources of atmospheric
dust. J. Environ. Radioact. 101, 106e112.
Hirose, K., Kim, C.K., Kim, C.S., Chang, B.W., Igarashi, Y.,
Aoyama, M., 2004. Plutonium deposition observed in Daejeon,
Korea: wet and dry depositions of plutonium. Sci. Total
Environ. 332, 243e252.
Hirose, K., Kikawada, Y., Igarashi, Y., 2012. Temporal variation and
provenance of thorium deposition observed at Tsukuba,
Japan. J. Environ. Radioact. 108, 24e28.
Hirose, K., Takatani, S., Aoyama, M., 1993. Wet deposition of long-
lived radionuclides derived from the Chernobyl accident.
J. Atmos. Chem. 17, 61e71.
Honda, M., Aono, T., Aoyama, M., Hamajima, Y., Kawakami, H.,
Kitamura, M., Masumoto, Y., Miyazawa, Y., Takigawa, M.,
Chapter 5 FUKUSHIMA RADIOACTIVITY IMPACT 261
Saino, T., 2012. Dispersion of artificial caesium-134 and -137
in the western North Pacific one month after the Fukushima
accident. Geochem. J. 46, 1e9.
Hou, X.L., Aldahan, A., Nislen, S., Possnert, G., Nies, H.,
Hedfords, J., 2007. Speciation of 129I and 127I in seawater and
implications for sources and transport pathways in North Sea.
Environ. Sci. Technol. 41, 5993e5999.
Hou, X.L., Aldahan, A., Nielsen, S.P., Possnert, G., 2009a. Time
series of 129I and 127I speciation in precipitation from
Denmark. Environ. Sci. Technol. 43, 6522e6528.
Hou, X.L., Hansen, V., Aldahan, A., Possnert, G., Lind, O.C.,
Lujaniene, G., 2009b. A review on speciation of iodine-129 in
the environmental and biological samples. Anal. Chim. Acta
632, 181e196.
Hou, X.L., Povinec, P.P., Zhang, L.Y., Biddulph, D., Chang, C.-C.,
Fan, Y.K., Golser, R., Je�skovsky, M., Jull, A.J.T., Liu, Q., Shi, K.L.,
Steier, P., Zhou, W.J., 2013. Iodine-129 in seawater offshore
Fukushima: distribution, speciation, sources, and budget.
Environ. Sci. Technol. 47, 3091e3098.
Huh, C.A., Hsu, S.-C., Lin, C.-Y., 2012. Fukushima-derived
fission nuclides monitored around Taiwan: free tropospheric
versus boundary layer transport. Earth Planet. Sci. Lett.
319e320, 9e14.
IAEA, International Atomic Energy Agency, 1986. Summary Report
on the Post-Accident Review Meeting on the Chernobyl
Accident, Safety Series No. 75-INSAG-1. IAEA, Vienna.
IAEA, International Atomic Energy Agency, 2003. Chernobyl’s
Legacy: Health, Environmental and Socio-economic Impacts.
IAEA, Vienna.
IAEA, International Atomic Energy Agency, 2004. Sediment
Distribution Coefficients and Concentration Factors for Biota
in the Marine Environment. Technical Reports Series no. 422.
IAEA, Vienna.
IAEA, International Atomic Energy Agency, 2005. Worldwide
Marine Radioactivity Studies (WOMARS). Radionuclide Levels
in Oceans and Sea. IAEA-TECDOC-1429. IAEA, Vienna.
IAEA, International Atomic Energy Agency, 2011. Briefings on
Fukushima nuclear accident. www.iaea.org/.
Igarashi, Y., Aoyama, M., Hirose, K., Miyao, T., Yabuki, S., 2001. Is
it possible to use 90Sr and 137Cs as tracers for the aeolian
transport? Water Air Soil Pollut. 130, 349e354.
Igarashi, Y., Aoyama, M., Hirose, K., Miyao, T., Nemoto, K.,
Tomita, M., Fujikawa, T., 2003. Resuspension: decadal
monitoring time series of the anthropogenic radioactivity
deposition in Japan. J. Radiat. Res. 44, 319e328.
Igarashi, Y., Aoyama, M., Hirose, K., Povinec, P.P., Yabuki, S., 2005.
What anthropogenic radionuclides (90Sr and 137Cs) in
atmospheric deposition, surface soils and Aeolian dusts
suggest for dust transport over Japan. Water Air Soil Pollut.
Focus 5, 51e69.
Igarashi, Y., Inomata, Y., Aoyama, M., Hirose, K., Takahashi, H.,
Shinoda, Y., Sugimoto, N., Shimizu, A., Chiba, M., 2009.
Possible change in Asian dust source suggested by
262 Chapter 5 FUKUSHIMA RADIOACTIVITY IMPACT
atmospheric anthropogenic radionuclides during the 2000s.
Atmos. Environ. 43, 2971e2980.
Inomata, Y., Aoyama, M., Hirose, K., 2009. Analysis of 50-y record
of surface 137Cs concentrations in the global ocean using the
HAM-global database. J. Environ. Monit. 11, 116e125.Inoue, M., Kofuji, H., Hamajima, Y., Nagao, S., Yoshida, K.,
Yamamoto, M., 2012a. 134Cs and 137Cs activities in coastal
seawater along Northern Sanriku and Tsugaru Strait,
northeastern Japan, after Fukushima Dai-ichi nuclear power
plant accident. J. Environ. Radioact. 111, 116e119. http://
dx.doi.org/10.1016/j.jenvrad.2011.09.012.
Inoue, M., Kofuji, H.Y., Hamajima, Y., Nagao, S., Yoshida, K.,
Yamamoto, M., 2012b. 134Cs and 137Cs activities in coastal
seawater along Northern Sanriku and Tsugaru Strait,
northeastern Japan, after Fukushima Dai-ichi nuclear power
plant accident. J. Environ. Radioact. 111, 116e119.Inoue, M., Kofuji, H., Nagao, S., Yamamoto, M., Hamajima, Y.,
Fujimoto, K., Yoshida, K., Suzuki, A., Takashiro, H.,
Hayakawa, K., 2012c. Low levels of 134Cs and 137Cs in surface
seawaters around the Japanese archipelago after the
Fukushima Dai-ichi nuclear power plant accident in 2011.
Geochem. J. 46, 311e320.
Ioannidou, A., Manenti, S., Gini, L., Groppi, F., 2012. Fukushima
fallout at Milano, Italy. J. Environ. Radioact. 114, 119e125.
JER, Journal of Environmental Radioactivity, 2012. Special issues:
Environmental Impacts of the Fukushima Accident (Part I),
“http://www.sciencedirect.com/science/journal/0265931X/
111” Volume 111, pp. 1e126 (September 2012); Environmental
Impacts of the Fukushima Accident (PART II), “http://www.
sciencedirect.com/science/journal/0265931X/114” Volume
114, pp. 1e170 (December 2012).
JG, Japanese Government Report. http://www.kantei.go.jp/jp/
Topics/2011/iaea_houkokusho.html (accessed 10.07.12.).
Kaeriyama, H., Watabe, T., Kusakabe, M., 2008. 137Cs
concentration in zooplankton and its relation to taxonomic
composition in the western North Pacific Ocean. J. Environ.
Radioact. 99, 1838e1845.
Kamenık, J., Dulaiova, H., Buesseler, K.O., Pike, S.M., �St’astna, K.,2013. Cesium-134 and 137 activities in the central North
Pacific Ocean after the Fukushima Dai-ichi nuclear power
plant accident. Biogeosciences Discuss.
Kanai, Y., 2012. Monitoring of aerosols in Tsukuba after
Fukushima nuclar power plant incident in 2011. J. Environ.
Radioact. 111, 33e37.
Kaneyasu, N., Ohashi, H., Suzuki, F., Okuda, T., Ikemori, F., 2012.
Sulfate aerosol as a potential transport medium of
radiocesium from the Fukushima nuclear accident. Environ.
Sci. Technol. 46, 5720e5726.
Karlsson, L., Hernandez, F., Rodrıguez, S., Lopez-Perez, M.,
Hernandez-Armas, J., Alonso-Perez, S., Cuevas, E., 2008. Using137Cs and 40K to identify natural Saharan dust contributions to
PM10 concentrations and air quality impairment in the
Canary Islands. Atmos. Environ. 42 7034e7032.
Chapter 5 FUKUSHIMA RADIOACTIVITY IMPACT 263
Kasamatsu, F., Ishikawa, Y., 1997. Natural variation of
radionuclide 137Cs concentration in marine organisms with
special reference to the effect of food habits and trophic level.
Mar. Ecol. Prog. Ser. 160, 109e120.
Katayama, E., Kawakami, I., Okumura, T., 2012. Contribution of
Plant-opal to Radioactive-Cesium Contamination of Forested-
Terrain. 49th Conference of Radioisotope and Radiation Study,
Tokyo, Abstract Book, pp. 59. (In Japanese).
Kato, H., Onda, Y., Teramage, M., 2012. Depth distribution of137Cs, 134Cs, and 131I in soil profile after the Fukushima
Daiichi nuclear plant accident. J. Environ. Radioact. 111,
59e64.Katsuragi, Y., 1983. A study of 90Sr fallout in Japan. Pap. Meteor.
Geophys. 33, 277e291.
Kawamura, H., Kobayashi, T., Furuno, A., In, T., Ishikawa, Y.,
Nakayama, T., Shima, S., Awaji, T., 2011. Preliminary
numerical experiments on oceanic dispersion 131I and 137Cs
discharged into the ocean because of the Fukushima Dai-ichi
nuclear power plant disaster. J. Nucl. Sci. Technol. 48,
1349e1356.Kelley, J.M., Bond, L.A., Beasley, T.M., 1999. Global distribution of
Pu isotope and Np. Sci. Total Environ. 237/238, 483e500.
Kim, Y., Cygan, R.T., Kirkpatrick, R.J., 1996. 133Cs NMR and XPS
investigation of cesium adsorbed on clay minerals and related
phases. Geochim. Cosmochim. Acta 60, 1041e1052.
Kim, Y., Kirkpatrick, R.J., 1997. 23Na and 133Cs NMR study of cation
adsorption on mineral surfaces: local environments, dynamics
and effects of mixed cations. Geochim. Cosmochim. Acta 61,
5199e5208.
Kim,C.-K.,Byun, J.-I.,Chae, J.-S.,Choi,H.-Y.,Choi, S.-W.,Kim,D.-J., et
al., 2012. Radiological impact in Korea following the Fukushima
nuclear accident. J. Environ. Radioact. 111, 70e82.
Kinoshita, N., Sueki, K., et al., 2011. Assessment of individual
radionuclide distributions from the Fukushima nuclear
accident covering central-east Japan. Proc. Natl. Acad. Sci. 108
(49), 19526e19529.
Knapinska-Skiba, D., Bojanowski, R., Piekos, R., 2003. Activity
concentration of caesium-137 in seawater and plankton of the
Pomeranian Bay (The southern Baltic Sea) before and after
flood in 1997. Mar. Pollut. Bull. 46, 1558e1562.
Kritidis, P., Florou, H., Eleftheriadis, K., Evangeliou, N., Gini, M.,
Sotiropoulou, M., Diapouli, E., Vratolis, 2012. Radioactive
pollution of Athens, Greece due to the Fukushima nuclear
accident. J. Environ. Radioact. 114, 100e104.
Lambert, G., Polian, G., Sanak, J., Ardouin, B., Buisson, A.,
Jegou, A., Leroulley, J.C., 1982. Cycle du radon et de ses
descendants: application a l’etude des echanges troposphere-
stratosphere. Ann. Geophys. 38, 497e531.
Lee, S.H., Pham, M.K., Povinec, P.P., 2002. Radionuclide variations
in the air over Monaco. J. Radioanal. Nucl. Chem. 254,
445e453.
Lee, S.-H., Heo, D.-H., Kang, H.-B., Oh, P.-J., Lee, J.-M., Park, T.-S.,
Lee, K.B., Oh, J.S., Suh, J.-K., 2012. Distribution of 131I, 134Cs,
264 Chapter 5 FUKUSHIMA RADIOACTIVITY IMPACT
137Cs and 239,240Pu concentrations in Korean rainwater
after the Fukushima nuclear power plant accident. J.
Radioanal. Nucl. Chem.. http://dx.doi.org/10.1007/s10967-
012-2030-5.
Levy, I., Povinec, P.P., Aoyama, M., Hirose, K., Sanchez-
Cabeza, J.A., Comanducci, J.-F., Gastaud, J., et al., 2011.
Marine anthropogenic radiotracers in the Southern
Hemisphere: new sampling and analytical strategies. Prog.
Oceanogr. 89, 120e133.
Livingston, H.D., Povinec, P.P., 2000. Anthropogenic marine
radioactivity. Ocean Coastal Manage. 43, 689e712.
Livingston, H.D., Povinec, P.P., 2002. A millennium perspective on
the contribution of global fallout radionuclides to ocean
science. Health Phys. 82, 656e668.
Loaiza, P., Brudanin, V., Piquemal, F., Reyss, J.L., Stekl, I.,
Warot, G., Zampaolo, M., 2012. Air radioactivity levels
following the Fukushima reactor accident measured at the
LaboratoireSouterrain de Modane, France. J. Environ.
Radioact. 114, 66e70.
Lozano, R.L., Hernandez-Ceballos, M.A., Adame, J.A., Casas-
Ruız, M., Sorribas, M., San Miguel, E.G., Bolıvar, J.P., 2011.
Radioactive impact of Fukushima accident on the Iberian
Peninsula: evolution and plume previous pathway. Environ.
Int. 37, 1259e1264.Lujaniene, G., Jok�sas, K., �Silobritiene, B., Mork�uniene, R., 2006a.
Physical and chemical characteristics of 137Cs in the Baltic Sea.
Radioactivity Environ. 8, 165e179.Lujaniene, G., �Sapolaite, J., Remeikis, V., Lujanas, V., Jermolajev, A.,
2006b. Caesium, americium and plutonium isotopes in ground
level air of Vilnius. Czechoslovak J. Phys. 56, D55eD61.
Lujaniene, G., Aninkevicius, A., Lujanas, V., 2009. Artificial
radionuclides in the atmosphere over Lithuania. J. Environ.
Radioact. 100, 108e119.
Lujaniene, G., By�cenkiene, S., Povinec, P.P., Gera, M., 2012a.
Radionuclides from the Fukushima accident in the air over
Lithuania: measurement and modeling approaches.
J. Environ. Radioact. 114, 71e80.
Lujanien _e, G., Valiulis, D., By�cenkien _e, S., �Sakalys, J., Povinec, P.P.,2012b. Plutonium isotopes and 241Am in the atmosphere of
Lithuania: a comparison of different source terms. Atmos.
Environ. 61, 419e427.
Lujanien _e, G., By�cenkien _e, S., Povinec, P.P., 2013. Radionuclides inaerosol samples from the Fukushima accident in Vilnius/
Lithuania: modeling of aerosol transport. Appl. Rad. Isot.
http://dx.doi.org/10.1016/j.apradiso.2013.03.072.
Lyons, C., Colton, D., 2012. Aerial measuring system in Japan.
Health Phys. 102, 509e515.
MAFF, 2011. Basic policy for inspection on radioactive materials in
fishery products. http://www.jfa.maff.go.jp/j/press/sigen/
110506.html.
MAFF, 2012a. Results of the inspection on radioactivity materials
in fisheries products (press release March 2011 to December
2012). www.jfa.maff.go.jp/e/inspection/index.html.
Chapter 5 FUKUSHIMA RADIOACTIVITY IMPACT 265
MAFF, 2012b. Report on investigation to assess the effects of
radioactive materials. http://www.jfa.maff.go.jp/j/sigen/
housyaseibussitutyousakekka/pdf/h23report_final_1.pdf.
MAFF, 2012c. Results of the inspection on strontium in fisheries
products (press release August 2012). www.jfa.maff.go.jp/j/
press/kenkyu/110830html.
Madigan, D.J., Baumann, Z., Fisher, N.S., 2012. Pacific Blue
fin tuna transport Fukushima-derived radionuclides from
Japan to California. Proc. Natl. Acad. Sci. U S A 109,
9483e9486.
Manolopoulou, M., Vagena, E., Stoulos, A., Ioannidou, A.,
Papastefanou, C., 2011. Radioidine and radiocesium in
Thessaloniki, Northern Greece due to the Fukushima nuclear
accident. J. Environ. Radioact. 102, 796e797.
Marzano, F.N., Triulzi, C., 2003. A radiological survey of northern
and middle Adriatic Sea before and after the Chernobyl event.
Mar. Pollut. Bull. 28, 244e253.
Masson, O., Piga, D., Gurriaran, R., D’Amico, D., 2010. Impact of
an exceptional Saharan dust outbreak in France: PM10 and
artificial radionuclides concentrations in air and in dust
deposit. Atmos. Environ. 44, 2478e2486.
Masson,O., Baeza,A.,Bieringer, J.,Brudecki,K.,Bucci, S., Cappai,M.,
Carvalho, F.P., Connan, O., Cosma, C., Dalheimer, A., Didier, D.,
Depuydt, G., De Geer, L.E., De Vismes, A., Gini, L., Groppi, F.,
Gudnason, K., Gurriaran, R., Hainz, D., Halldorsson, O.,
Hammond,D.,Hanley,O.,Holey, K.,Homoki, Zs., Ioannidou, A.,
Isajenko, K., Jankovick, M., Katzlberger, C., Kettunen, M.,
Kierepko, R., Kontro, R., Kwakman, P.J.M., Lecomte, M., Leon
Vintro,L., Leppanen,A.-P.,Lind,B., Lujaniene,G.,McGinnity, P.,
Mc Mahon, C., Mala, H., Manenti, S., Manolopoulou, M.,
Mattila, A., Mauring, A., Mietelski, J.W., Møller, B.S., Nielsen, P.,
Nikolick, J., Overwater, R.M.W., Palsson, S.E., Papastefanou, C.,
Penev, I., Pham, M.K., Povinec, P.P., Rameback, H., Reis, M.C.,
Ringer, W., Rodriguez, A., Rulık, P., Saey, P.R.J., Samsonov, V.,
Schlosser, C., Sgorbati, G., Silobritiene, B.V., Soderstrom, C.,
Sogni, R., Solier, L., Sonck, M., Steinhauser, G., Steinkopff, T.,
Steinmann, P., Stoulos, S., Sykora, I., Todorovic, D.,
Tooloutalaie, N., Tositti, L., Tschiersch, J., Ugron, A., Vagena, E.,
Vargas, A., Wershofen, H., Zhukova, O., 2011. Tracking of
airborne radionuclides from the damaged Fukushima Dai-Ichi
nuclear reactors by European networks. Environ. Sci. Technol.
45, 7670e7677.Matsunaga, T., Amano, H., Yanase, N., 1991. Discharge of
dissolved and particulate 137Cs in the Kuji River, Japan. Appl.
Geochem. 6, 159e167.
Matsuzaki, H., Muramatsu, Y., Kato, K., Yasumoto, M., Nakano, C.,
2007. Development of 129I-AMS system at MALT and
measurements of 129I concentrations in several Japanese soils.
Nucl. Instr. Methods Phys. Res. B259, 721e726.Maximenko, N., Niiler, P., Centurioni, L., Rio, M.-H.,
Melnichenko, O., Chambers, D., Zlotnicki, V., Galperin, B.,
2009. Mean dynamic topography of the ocean derived from
satellite and drifting buoy data using three different
266 Chapter 5 FUKUSHIMA RADIOACTIVITY IMPACT
techniques*. J. Atmos. Oceanic Technol. 26, 1910e1919.http://dx.doi.org/10.1175/2009jtecho672.1.
McNeary, D., Baskaran, M., 2003. Depositional characteristics of7Be and 210Pb in southeastern Michigan. J. Geophys. Res. 108
(D7), 4201. http://dx.doi.org/10.1029/2002JD003021.
MEXT, Ministry of Education, Culture, Sports, Science and
Technology, 2012a. http://www.mext.go.jp/amenu/
saigaijyouhou/index.htm.
MEXT, Ministry of Education, Culture, Sports, Science and
Technology, 2012b. Environmental radioactivity database.
http://search.kankyo-hoshano.go.jp/servlet/search.top.
MEXT, Ministry of Education, Culture, Sports, Science and
Technology, 2012c. Monitoring information of environmental
radioactivity levels. http://radioactivity.mext.go.jp/en/
(accessed 10.10.12.).
MHLW, Ministry of Health, Labour and Welfare, 2010. National
health and nutrition examination survey in 2008 (in Japanese).
Available at: http://www.mhlw.go.jp/bunya/kenkou/eiyou/dl/
h20-houkoku-01b.pdf (accessed 20.06.11).
MICROSTEP-MIS, 2012. MICROSTEP-MIS Report, Bratislava.
Mizutani, T., Koarashi, J., Takeishi, M., 2009. Monitoring of low-
level radioactive liquid effluent in Tokai reprocessing plant.
J. Nucl. Sci. Technol. 46, 665e672.
Miyake, Y., Matsuzaki, H., Fujiwara, T., Saito, T., Yamagata, T.,
Honda, M., Muramatsu, Y., 2012. Isotopic ratio of radioactive
iodine (129I/131I) released from Fukushima Daiichi NPP
accident. Geochem. J. 46 (4), 327e333.Miyazawa, Y., Masumoto, Y., Varlamov, S.M., Miyama, T., 2012.
Transport simulation of the radionuclide from the shelf to open
ocean around Fukushima. Continental Shelf Res. 16e29, 50e51.
Momoshima, N., Sugihara, S., Ichikawa, R., Yokoyama, H., 2012.
Atmospheric radionuclides transported to Fukuoka, Japan
remote from the Fukushima Dai-ichi nuclear power complex
following the nuclear accident. J. Environ. Radioact. 111,
28e32.Monte, L., Perianez, R., Boyer, P., Smith, J.T., Brittain, J.E., 2009.
The role of physical processes controlling the behaviour of
radionuclide contaminants in the aquatic environment:
a review of state-of-the-art modelling approaches. J. Environ.
Radioact. 100, 779e784.
Moore, H.E., Poet, S.E., Martell, E.A., 1973. 222Rn, 210Pb, 210Bi, and210Po profiles and aerosol residence times versus altitude.
J. Geophys. Res. 78, 7065e7075.
Mori, N., Takahashi, T., Yasuda, T., Yanagisawa, H., 2011. Survey of
2011 Tohoku earthquake tsunami inundation and run-up.
Geophys. Res. Lett. 38. http://dx.doi.org/10.1029/
2011gl049210.
Morino, Y., Ohara, T., Nishizawa, M., 2011. Atmospheric behavior,
deposition, and budget of radioactive materials from the
Fukushima Daiichi nuclear power plant in March 2011.
Geophys. Res. Lett. 38, L00G11.
Morita, T., Fujimoto, K., Kasai, H., Yamada, H., Nishiuchi, K.,
2010a. Temporal variations of 90Sr and 137Cs concentrations
Chapter 5 FUKUSHIMA RADIOACTIVITY IMPACT 267
and the 90Sr/137Cs activity ratio in marine brown algae,
Undaria pinnatifida and Laminaria longissima, collected in
coastal areas of Japan. J. Environ. Monit. 12, 1179e1186.
Morita, T., Ohtsuka, Y., Fujimoto, K., Minamisako, Y., Iida, R.,
Namamura, M., Kayama, T., 2010b. Concentrations of 137Cs,90Sr, 108mAg, 239þ240Pu and atom ratio of 240Pu/239Pu in
tanner crabs, Chionoecetes japonicus and Chionoecetes
opilio collected around Japan. Mar. Poll. Bull. 60,
2311e2322.Muramatsu, Y., Yoshida, S., 1995. Volatilization of methyl iodine
from soil-plant system. Atmos. Environ. 29, 21e25.
Muramatsu, Y., Takada, Y., Matsuzaki, H., Yoshida, S., 2008.
AMS analysis of 129I in Japanese soil samples collected from
background areas far from nuclear facilities. Quarter.
Geochronol. 3, 291e297.
Muramatsu, Y., Yoshida, S., Tanaka, A., 2003. Determination of Pu
concentration and its isotope ratio in Japanese soils by
HR-ICP-MS. J. Radioanal. Nucl. Chem. 255, 477e480.
Nakano, M., 2004. Long-term assessment model of radionuclides
in the oceans (LAMER) e Development and validation of the
diffusion model in global oceans. JNC Tech. Rev. 22, 67e76
(in Japanese with English abstracts) JNC, Tokai.
Nakano, M., 2006. Simulation of the advection-diffusion-
scavenging processes for 137Cs and 239,240Pu in the Japan Sea.
In: Povinec, P.P., Sanchez-Cabeza, J.A. (Eds.), Radionuclides in
the Environment. Elsevier, Amsterdam, pp. 433e448.
Nakano, M., 2008. LAMER: Long-term Assessment Model of
Radionuclides in the Oceans. JAEA-Data/Code 2007-024
(in Japanese). JAEA, Tokai.
Nakano, M., Povinec, P.P., 2003a. Oceanic general circulation
model for the assessment of the distribution of 137Cs in the
world ocean. Deep-sea Res. II 50, 2803e2816.
Nakano, M., Povinec, P.P., 2003b. Modelling the distribution of
plutonium in thePacificOcean. J. Environ. Radioact. 69, 85e106.
Nakano, M., Povinec, P.P., 2012. Long-term simulations of the137Cs dispersion from the Fukushima accident in the world
ocean. J. Environ. Radioact. 111, 109e115.
NERH, Nuclear Emergency Response Headquarters, Government
of Japan: report of the Japanese government to the IAEA
ministerial conference on nuclear safety e the accident at
TEPCO’s Fukushima nuclear power stations, 7 June, Available
at: http://www.iaea.org/newscenter/focus/fukushima/japan-
report/ (accessed 10.10.12.).
Nicholson, K.W., 1988. A review of particle resuspension. Atmos.
Environ. 22, 2639e2651.
NISA, Nuclear and Industrial Safety Agency, 2011a. Regarding the
Evaluation of the Conditions on Reactor Cores of Unit 1, 2 and
3 Related to the Accident at Fukushima Daiichi Nuclear Power
Station. Available at:. Tokyo Electric Power Co. Inc. (accessed
20.06.11.) http://www.nisa.meti.go.jp/english/press/2011/06/
en20110615-5.pdf.
NISA, Nuclear and Industrial Safety Agency, 2011b. Regarding the
discharge of the waste water, of which the concentration of
268 Chapter 5 FUKUSHIMA RADIOACTIVITY IMPACT
radioactive materials exceeds the concentration limit by the
notification, to the sea. http://www.nisa.meti.go.jp/english/
files/en20110416-10.pdf (accessed on 20.06.11.).
NSC, Nuclear Safety Commission, 2011. The equivalent dose at
thyroid (trial calculation by SPEEDI from 6 o’clock in 12th
March to 0 o’clock in 24th March). Available at: http://www.
nsc.go.jp/mext_speedi/0312-0324_in.pdf#page¼1 (accessed
20.06.11.).
NSCJ: Nuclear Safety Commission of Japan, 2011. Trial estimation
of emission of radioactive materials (I-131, Cs-137) into the
atmosphere from Fukushima Dai-ichi nuclear power station,
Tokyo. Available at: http://www.nsc.go.jp/NSCenglish/geje/
2011%200412%20press.pdf.
Ohno, T., Muramatsu, Y., Miura, Y., Oda, K., Inagawa, N.,
Ogawa, H., Yamazaki, A., Toyama, C., Sato, M., 2012. Depth
profiles of radioactive cesium and iodine released from the
Fukushima Daiichi nuclear power plant in different
agricultural fields and forests. Geochem. J. 46 (4), 287e295.
Oikawa, S., Song, S.J., Maeyama, T., Kishimoto, T., Tomura, K.,
Higuchi, H., 2003. Determination of trace metals in squid
organs by inductively coupled plasma mass spectrometry
and neutron activation analysis. Bunseki Kagaku 52,
551e557.
ORNL, Oak Ridge National Laboratory, 2004. Origine-ARP-2,
ORNL.
Oura, Y., Ebihara, M., 2012. Radioactivity concentrations of 131I,134Cs and 137Cs in river water in the greater Tokyo
metropolitan area after the Fukushima Daiichi nuclear power
plant accident. Geochem. J. 46 (4), 303e309.
Paatero, J., Vira, J., Siitari-Kauppi, M., Hatakka, J., Holmen, K.,
Viisanen, Y., 2012. Airborne fission products in the high Arctic
after the Fukushima nuclear accident. J. Environ. Radioact.
114, 41e47.
Palcsu, L., Major, Z., Koll}o, Z., Papp, L., 2010. Using an ultrapure4He spike in tritium measurements of environmental water
samples by the 3He-ingrowth method. Rapid Commun. Mass
Spectrom. 24, 698e704.
Papastefanou, C., Ioannidou, A., Stoulos, S., Manolopoulou, M.,
1995. Atmospheric deposition of cosmogenic 7Be and 137Cs
from fallout of the Chernobyl accident. Sci. Total Environ. 170,
151e156.
Peirson, D.H., Cawse, P.A., Salmon, L., Cambray, R.S., 1973. Trace
elements in the atmospheric environment. Nature 241, 252e256.
Perrot, F., Hubert, Ph., Marquet, Ch., Pravikoff, M.S.,
Bourquin, P., Chiron, H., Guernion, P.-Y., Nachab, A., 2012.
Evidence of 131I and 134,137Cs activities in Bordeaux, France
due to the Fukushima nuclear accident. J. Environ. Radioact.
114, 61e65.
Pham, M.K., Betti, M., Povinec, P.P., Alfimov, V., Biddulph, D.,
Gastaud, J., Kieser, W.E., Lopez Gutierez, J.M., Possnert, G.,
Sanchez-Cabeza, J.A., Suzuki, T., 2010. Certified reference
material IAEA-418: 129I in Mediterranean Sea water. J.
Radioanal. Nucl. Chem. 286, 121e127.
Chapter 5 FUKUSHIMA RADIOACTIVITY IMPACT 269
Pham, M.K., Betti, M., Nies, H., Povinec, P.P., 2011. Temporal
changes of 7Be, 137Cs and 210Pb activity concentrations in
surface air at Monaco and their correlation with meteorological
parameters. J. Environ. Radioact. 102, 1045e1054.
Pham, M.K., Eriksson, M., Levi, I., Nies, H., Osvath, I., Betti, M.,
2012. Detection of Fukushima Dai-ichi nuclear power plant
accident radioactive traces in Monaco. J. Environ. Radioact.
114, 131e137.
Pham, K.K., Povinec, P.P., Nies, H., Betti, M., 2013. Dry and wet
deposition of 7Be, 210Pb and 137Cs in Monaco air during
1998e2010: seasonal variations of deposition fluxes. J.
Environ. Radioact. 120, 45e57.Pi�nero Garcıa, F., Ferro Garcıa, M.A., 2012. Traces of fission
products in southeast Spain after the Fukushima nuclear
accident. J. Environ. Radioact. 114, 146e151.
Pittauerova, D., Hettwig, B., Fischer, H.W., 2011. Fukushima
fallout in Northwest German environmental media. J. Environ.
Radioact. 102, 877e880.
PMJC (Prime Minister of Japan and his Cabinet), 2011. Report of
Japanese government to the IAEA ministerial conference on
nuclear safety-the accident at TEPCO’s Fukushima nuclear
power stations. http://www.kantei.go.jp/jp/Topics/2011/iaea_
houkokusho.html.
Povinec, P., Chudy, M., Sykora, I., Szarka, J., Pikna, M., Holy, K.,
1988. Aerosol radioactivity monitoring in Bratislava following
the Chernobyl accident. J. Radioanal. Nucl. Chem. Lett. 126,
467e478.
Povinec, P.P., Oregioni, B., Jull, A.J.T., Kieser, W.E., Zhao, X.-L.,
2000. AMS measurements of 14C and 129I in seawater around
radioactive waste dump sites. Nucl. Instrum. Methods Phys.
Res. B 172, 672e678.Povinec, P.P., Livingston, H.D., Shima, S., Aoyama, M., Gastaud, J.,
Goroncy, I., Hirose, K., Huyhn-Ngoc, L., Ikeuchi, Y., Ito, To., La
Rosa, J., Liong Wee Kwong, L., Lee, S.-H., Moriya, H.,
Mulsow, S., Oregioni, B., Pettersson, H., Togawa, O., 2003a.
IAEA’97 expedition to the NW Pacific Ocean e results of
oceanographic and radionuclide investigations of the water
column. Deep-Sea Res. II 50, 2607e2638.Povinec, P.P., Bailly Du Bois, P., Kershaw, P.J., Nies, H., Scotto, P.,
2003b. Temporal and spatial trends in the distribution of137Cs in surface waters of Northern European Seas e a record
of 40 years of investigations. Deep-Sea Res. Part II 50,
2785e2801.
Povinec, P.P., Hirose, K., Honda, T., Ito, T., Scott, E.M., Togawa, O.,
2004. Spatial distribution of 3H, 90Sr, 137Cs and 239,240Pu in
surface waters of the Pacific and Indian Oceans e GLOMARD
database. J. Environ. Radioact. 76, 113e137.
Povinec, P.P., Aarkrog, A., Buesseler, K.O., Delfanti, R., Hirose, K.,
Hong, G.-H., Ito, T., Livingston, H.D., Nies, H., Noshkin, V.E.,
Shima, S., Togawa, O., 2005a. 90Sr, 137Cs and 239,240Pu
concentration surface water time series in the Pacific and
Indian Oceans e WOMARS results. J. Environ. Radioact. 81,
63e87.
270 Chapter 5 FUKUSHIMA RADIOACTIVITY IMPACT
Povinec, P.P., Comanducci, J.F., Levy-Palomo, I., 2005b.
IAEA-MEL’s underground counting laboratory (CAVE) for the
analysis of radionuclides in the environment at very low-
levels. J. Radioanal. Nucl. Chem. 263, 441e445.
Povinec, P.P., Scotto, Ph., Osvath, I., Ramadan, H., 2006. The
Marine Information System (MARIS). Isotopes in
Environmental Studies. Aquatic Forum 2004. IAEA, Vienna,
pp. 68e69.
Povinec, P.P., Lee, S.H., Liong Wee Kwong, L., Oregioni, B.,
Jull, A.J.T., Kieser, W.E., Morgenstern, U., Top, Z., 2010.
Tritium, radiocarbon, 90Sr and 129I in the Pacific and Indian
Oceans. Nucl. Instrum. Methods Phys. Res. B 268, 1214e1218.Povinec, P.P., Breier, R., Coppola, L., Groening, M., Jeandel, C.,
Jull, A.J.T., Kieser, W.E., Top, Z., 2011a. Tracing of water
masses using a multi-isotope approach in the southern Indian
Ocean. Earth Planetary Sci. Lett. 302, 14e26.Povinec, P.P., Aoyama, M., Fukasawa, M., Hirose, K., Komura, K.,
Sanchez-Cabeza, J.A., Gastaud, J., Je�skovsky, M., Levy, I.,
Sykora, I., 2011b. 137Cs water profiles in the South Indian
Ocean e an evidence for accumulation of pollutants in the
subtropical gyre. Prog. Oceanogr. 89, 17e30. http://dx.doi.org/
10.1016/j.pocean.2010.12.004.
Povinec, P.P., Sykora, I., Holy, K., Gera, M., Kova�cik, A.,
Brest’akova, L., 2012a. Aerosol radioactivity record in
Bratislava/Slovakia following the Fukushima accident e
a comparison with global fallout and the Chernobyl accident.
J. Environ. Radioact. 114, 81e88.Povinec, P.P., Sykora, I., Gera, M., Holy, K., Brest’akova, L.,
Kova�cik, A., 2012b. Fukushima-derived radionuclides in
ground-level air of Central Europe: a comparison with
simulated forward and backward trajectories. J. Radioanal.
Nucl. Chem. http://dx.doi.org/10.1007/s10967-012-1943-3.
Povinec, P.P., Hirose, K., Aoyama, M., 2012c. Radiostronium in the
western North Pacific: characteristics, behavior, and the
Fukushima impact. Environ. Sci. Technol. 46, 10356e10363.
Povinec, P.P., Holy, K., Chudy, M., �Sivo, A., Sykora, I.,
Je�skovsky, M., Richtarikova, M., 2012d. Long-term variations
of 14C and 137Cs in the Bratislava air e implications of different
atmospheric transport processes. J. Environ. Radioact. 108,
33e40.
Povinec, P.P., Eriksson, M., Scholten, J., Betti, M., 2012e. Marine
radioactivity analysis. In: L’Annunziata, M.F. (Ed.),
Handbook on Radioactivity Analysis. Academic Press,
Amsterdam, pp. 770e832.
Povinec, P.P., Gera, M., Hirose, K., Lujaniene, G., Nakano, M.,
Plastino, W., Bartok, J., 2013a. Dispersion of Fukushima
radionuclides in the global atmosphere and the ocean. Appl.
Rad. Isot. http://dx.doi.org/10.1016/j.apradiso.2013.03.058.
Povinec, P.P., Aoyama, M., Biddulph, D., Breier, R., Buesseler, K.,
Chang, C.C., Golser, R., Hou, X.L., Je�skovsky, M., Jull, A.J.T.,
Kaizer, J., Nakano, M., Nies, H., Palcsu, L., Papp, L.,
Pham, M.K., Steier, P., Zhang, L.Y., 2013b. Cesium, iodine and
tritium in NW Pacific waters e a comparison of the Fukushima
Chapter 5 FUKUSHIMA RADIOACTIVITY IMPACT 271
impact with global fallout. Biogeosciences Discuss 10,
6377e6416. http://dx.doi.org/10.5194/bgd-10-6377-2013.
Qin, H., Yokoyama, Y., Fan, Q., Iwatani, H., Tanaka, K.,
Sakaguchi, A., Kanai, Y., Zhu, J., Onda, Y., Takahashi, Y.,
2012. Investigation of cesium adsorption on soil and
sediment samples from Fukushima prefecture by sequential
extraction and EXAFS technique. Geochem. J. 46 (4),
297e302.
Raisbeck, G.M., Yiou, F., 1999. 129I in the oceans: origins and
applications. Sci. Total Environ. 237/238, 31e41.
Rolph, G.D., 2011. Real-time Environmental Applications and
Display system (READY) (http://ready.arl.noaa.gov). NOAA Air
Resources Laboratory, Silver Spring, USA.
Rosner, G., Winkler, R., 2001. Long-term variation (1986e1998) of
post-Chernobyl 90Sr, 137Cs, 238Pu and 239,240Pu concentrations
in air, depositions to ground, resuspension factors and
resuspension rates in south Germany. Sci. Total Environ. 273,
11e25.
Rosner, G., Hotzl, H., Winkler, R., 1997. Long-term behaviour of
plutonium in air, and deposition and the role of resuspension
in semi-rural environment in Germany. Sci. Total Environ.
196, 255e261.
Rowan, D.J., Rasmussen, J.B., 1995. The elimination of
radiocesium from fish. J. Appl. Ecol. 32, 739e744.Rypina, I.I., Jayne, S.R., Yoshida, S., Macdonald, A.M., Douglass, E.,
Buesseler, K., 2013. Short-term dispersal of Fukushima-
derived radionuclides off Japan: modeling efforts and model-
data intercomparison. Biogeosciences Discuss. http://
dx.doi.org/10.5194/bgd-10-1517-2013.
Sakaguchi, A., Kadokura, A., Steier, P., Tanaka, K., Takahashi, Y.,
Chiga, H., Matsushima, A., Nakashima, S., Onda, Y., 2012.
Isotopic determination of U, Pu and Cs in environmental
waters following the Fukushima Daiichi nuclear power plant
accident. Geochem. J. 46 (4), 355e360.
Sanchez-Cabeza, J.A., Levy, I., Gastaud, J., Eriksson, M., Osvath, I.,
Aoyama, M., Povinec, P.P., Komura, K., 2011. Transport of
North Pacific 137Cs labeled waters to the south-eastern
Atlantic Ocean. Prog. Oceanogr. 89, 31e37. http://dx.doi.org/10.1016/j.pocean.2010.12.005.
Saxen, R., Heinavaara, S., Rask, M., Ruuhijarvi, J., Rand, H., 2010.
Transfer of 137Cs into fish in small forest lakes. J. Environ.
Radioact. 101, 647e653.Schmel, G.A., 1980. Particle and gas dry deposition: a review.
Atmos. Environ. 14, 983e1011.
Shinn, J.H., Homan,D.N., Gray,D.D., 1983. Plutoniumaerosol fluxes
and pulmonary exposure rates during re-suspension from bare
soils near a chemical separation facility. In: Pruppacher, H.R.,
Semonin, R.G., Slinn, W.G.N. (Eds.), Precipitation Scavenging,
Dry Deposition and Re-suspension. Elsevier, Amsterdam, pp.
1131e1143.
Slinn, W.G.N., 1978. Parameterizations for resuspension and for
wet and dry deposition of particles and gases for use in
radiation dose calculations. Nucl. Saf. 19, 205e219.
272 Chapter 5 FUKUSHIMA RADIOACTIVITY IMPACT
Small, S.H., 1960. Wet and dry deposition of fallout materials at
Kjeller. Tellus 12, 308e314.
Stewart, K., 1966. The resuspension of particulate material from
surface. In: Fish, B.R. (Ed.), Surface Contamination. Pergamon
Press, Oxford, pp. 63e74.Steel, A.K., 1991. Derived concentration factors for caesium-137 in
edible species of North Sea fish. J. Rad. Res. 14, 382e391.
Stohl, A., Seibert, P., Wotawa, G., Arnold, D., Burkhart, J.F.,
Eckhardt, S., Tapia, C., Vargas, A., Yasunari, T.J., 2011.
Xenon-133 and caesium-137 releases into the atmosphere
from the Fukushima Dai-ichi nuclear power plant:
determination of the source term, atmospheric dispersion,
and deposition. Atmos. Chem. Phys. Discuss. 11,
28319e28394.
Stohl, A., Seibert, P., Wotawa, G., Arnold, D., Burkhart, J.F.,
Eckhardt, S., Tapia, C., Vargas, A., Yasunari, T.J., 2012. Xenon-
133 and caesium-137 releases into the atmosphere from the
Fukushima Dai-ichi nuclear power plant: determination of the
source term, atmospheric dispersion, and deposition. Atmos.
Chem. Phys. 12, 2313e2343.Suplinska, M., Adamczyk, A., 2009. Cs-137, Ra-226 and K-40 in the
southern Baltic Sea fish flesh, Helsinki Commission, HELCOM
MORS-PRO 14/2009.
Suzuki, Y., Nakahara, R., Ueda, T., 1973. Caesium-137
contamination of marine fishes from the coasts of Japan.
J. Radiat. Res. 14, 382e391.
Suzuki, T., Minakawa, M., Amano, H., Togawa, O., 2010. The
vertical profiles of iodine-129 in the Pacific Ocean and the
Japan Sea before the routine operation of a new nuclear fuel
reprocessing plant. Nucl. Instr. Methods Phys. Res. B 268,
1229e1231.
Sykora, I., Povinec, P.P., Brest’akova, L., Florek, M., Holy, K.,
Masarik, J., 2012. Resuspension processes control variations of137Cs activity concentrations in the ground-level air.
J. Radioanal. Nucl. Chem. 293, 595e599.Tagami, K., Uchida, S., 2010. Can elemental composition data of
crop leaves be used to estimate radionuclide transfer to tree
leaves. Radiat. Environ. Biophys. 49, 583e590.Tagami, K., Uchida, S., Uchihori, Y., Ishii, N., Kitamura, H.,
Shirakawa, Y., 2011. Specific activity and activity ratios of
radionuclides in soil collected about 20 km from the
Fukushima Daiichi nuclear power plant: radionuclide release
to the south and southwest. Sci. Total Environ. 409 (22),
4885e4888.
Tagami, K., Uchida, S., Ishii, N., Kagiya, S., 2012. Translocation of
radiocesium from stems and leaves of plants and the effect on
radiocesium concentrations in newly emerged plant tissues.
J. Environ. Radioact. 111, 65e69.
Takemura, T., Nakamura, H., Takigawa, M., Kondo, H.,
Satomura, T., Miyasaka, T., Nakajima, T., 2011. A numerical
simulation of global transport of atmospheric particles
emitted from the Fukushima Daiichi nuclear power plant.
Sora 7, 101e104.
Chapter 5 FUKUSHIMA RADIOACTIVITY IMPACT 273
Tanaka, K., Takahashi, Y., Sakaguchi, A., Umeo, M., Hayakawa, S.,
Tanida, H., Saito, T., Kanai, Y., 2012. Vertical profiles of
iodine-131 and cesium-137 in soils in Fukushima prefecture
related to the Fukushima Daiichi nuclear power station
accident. Geochem. J. 46 (1), 73e76.Tateda, Y., Koyanagi, T., 1994. Concentration factors for Cs-137 in
marine algae from Japanese coastal waters. J. Rad. Res. 35,
213e221.
Tateda, Y., Koyanagi, T., 1996. Concentration factors for 137Cs
in Japanese coastal fish (1984e1990). J. Radiat. Res. 37, 71e79.
TEPCO: Tokyo Electric Power Company, 2011a. http://www.tepco.
co.jp/en/press/corp-com/release/11042103-e.html (accessed
20.06.11.).
TEPCO, Tokyo Electric Power Company, 2011b. Countermeasures
to outflow of radioactive water off the site near water intake of
unit 3 at Fukushima Daiichi nuclear power station. http://
www.tepco.co.jp/en/press/corp-com/release/11052102-e.
html (accessed 20.06.11.).
TEPCO, Tokyo Electric Power Company, 2012a. Present status of
Fukushima Daiichi NPS and implemented countermeasure.
http://www.tepco.co.jp/en/nu/fukushima-np/review/
review2_1-e.html (accessed 30.09.12.).
TEPCO, Tokyo Electric Power Company, 2012b. Fukushima
Daiichi nuclear power station unit 2: countermeasures to
stop the outflow of contaminated water and the water
amount flowed out into the sea. http://www.tepco.co.jp/en/
press/corp-com/release/11042103-e.html (accessed
10.10.12.).
TEPCO, Tokyo Electric Power Company, 2012c. Nuclide analysis
results of fish and shellfish (August 2012). www.tepco.co.jp/
en/nu/fukushima-np/images/handouts_120821_01-e.pdf.
The-2011-Tohoku-Earthquake-Tsunami-Joint-Survey-Group,
2011. Nationwide field survey of the 2011 off the Pacific
coast of Tohoku earthquake tsunami. J. Jpn Soc. Civil Eng.
Ser. B 67, 63e66.
Todd, J.F., Wong, G.T.F., Olsen, C.R., Larsen, I.L., 1989.
Atmospheric depositional characteristics of beryllium-7 and
lead-210 along southeastern Virginia coast. J. Geophys. Res.
94, 11106e11116.
Topcuoglu, S., Gungor, N., Kose, A., Varinlioglu, A., 1997.
Translocation and depuration of 137Cs in tea plants.
J. Radioanal. Nucl. Chem. 218, 263e266.Tsukada, H., Hasegawa, H., Hisamatsu, S., Yamasaki, S., 2002.
Transfer of 137Cs and stable Cs from paddy soil to polished rice
in Aomori, Japan. J. Environ. Radioact. 59, 351e363.
Tsumune, D., Aoyama, M., Hirose, K., Bryan, F.O., Lindsay, K.,
Danabasoglu, G., 2011. Transport of 137Cs in the Southern
Hemisphere in an ocean general circulation model. Prog.
Oceanogr. 89, 38e48.Tsumune, D., Tsubono, T., Aoyama, M., Hirose, K., 2012.
Distribution of oceanic 137Cs from the Fukushima Dai-ichi
nuclear power plant simulated numerically by a regional
ocean model. J. Environ. Radioact. 111, 100e108.
274 Chapter 5 FUKUSHIMA RADIOACTIVITY IMPACT
Turekian, K.K., Benninger, L.K., Dion, E.P., 1983. 7Be and 210Pb
total deposition fluxes at New Haven, Connecticut and at
Bermuda. J. Geophys. Res. 88, 5411e5415.
Underwood, B.Y., 2001. Review of Deposition Velocity and
Washout Coefficient. AEA Technology, Harwell.
UNSCEAR, United Nations Scientific Committee on the Effects of
Atomic Radiation, 1993. Sources and Effects of Ionizing
Radiation. Report to the General Assembly. United Nations,
New York, p. 922.
UNSCEAR, United Nations Scientific Committee on the Effects of
Atomic Radiation, 2000. Sources and Effects of Ionizing
Radiation, vol. 1: Sources, United Nations, New York, p. 654.
UNSCEAR, United Nations Scientific Committee on the Effects of
Atomic Radiation, 2008. Sources and Effects of Ionizing
Radiation. Report to the General Assembly. United Nations,
New York, USA.
Wallner, G., Steier, P., Brandl, T., Friesacher, M.E., Hille, P.,
Kutschera, W., Tatzber, M., Ayromlou, S., 2007. Developments
toward the measurement of I-129 in lignite. Nucl. Instr. Meth.
B 259, 714e720.Watanabe, T., Tsuchiya, N., Oura, Y., Ebihara, M., Inoue, C.,
Hirano, N., Yamada, R., Yamasaki, S., Okamoto, A., Watanabe-
Nara, F., Nunohara, K., 2012. Distribution of artificial
radionuclides (110mAg, 129mTe, 134Cs, 137Cs) in surface soils from
Miyagi prefecture, northeast Japan, following the 2011
Fukushima Dai-ichi nuclear power plant accident. Geochem. J.
46 (4), 279e285.
WMO, World Meteorological Organization, 2009. Manual on
Codes. International Codes. vol. I.2. Part B e Binary Codes.
Part C e Common Features to Binary and Alphanumeric
Codes. WMO-No. 306. WMO, Geneva, p. 740.
Yamamoto, M., Takada, T., Nagao, S., Koike, T., Shimada, K.,
Hoshi, M., Zhumadilov, K., Shima, T., Fukuoka, M.,
Imanaka, T., Endo, S., Sakaguchi, A., Kimura, S., 2012. An early
survey of the radioactive contamination of soil due to the
Fukushima Dai-ichi nuclear power plant accident, with
emphasis on plutonium analysis. Geochem. J. 46 (4), 341e353.
Yonezawa, C., Yamamoto, Y., 2011. Measurements of artificial
radionuclides in surface air by CTBTO. Bunseki, 451e458
(in Japanese).
Yoshida, N., Takahashi, Y., 2012. Land-surface contamination by
radionuclides from the Fukushima Daiichi nuclear power
plant accident. Elements 8, 201e206.
Young, J.A., Silker, W.B., 1980. Aerosol deposition velocities on the
Pacific and Atlantic Oceans calculated from 7Be
measurements. Earth Planet. Sci. Lett. 50, 92e104.Zavodsky, D., 2011. Atmospheric Chemistry and Air Pollution
Modelling. Leonardo da Vinci Programme. Matej Bel
University, Banska Bystrica, p. 127.
Zhang, W., Bean, M., Benotto, M., Cheung, J., Ungar, K.,
Ahier, B., 2011. Development of a new aerosol monitoring
system and its application in Fukushima nuclear accident
related aerosol radioactivity measurement at the CTBT
Chapter 5 FUKUSHIMA RADIOACTIVITY IMPACT 275
radionuclide station in Sidney of Canada. J. Environ.
Radioact. 102, 1065e1069.
Zheng, J., Tagami, K., Watanabe, Y., Uchida, S., Aono, T., Ishii, N.,
Yoshida, S., Kubota, Y., Fuma, S., Ihara, S., 2012. Isotopic
evidence of plutonium release into the environment from the
Fukushima DNPP accident. Scientific Rep. 2, 304. http://
dx.doi.org/10.1038/step00304.