fujii hidemichia , managi shunsuke - rieti · dp rieti discussion paper series 17-e-066 trends and...
TRANSCRIPT
DPRIETI Discussion Paper Series 17-E-066
Trends and Priority Shifts in Artificial Intelligence Technology Invention: A global patent analysis
FUJII HidemichiNagasaki University
MANAGI ShunsukeRIETI
The Research Institute of Economy, Trade and Industryhttp://www.rieti.go.jp/en/

1
RIETI Discussion Paper Series 17-E-066
May2017
Trends and Priority Shifts in Artificial Intelligence Technology Invention: A global patent analysis1
FUJII Hidemichi2, MANAGI Shunsuke3
Abstract
Artificial intelligence (AI) technology can play a critical role in economic development, resource
conservation, and environmental protection by increasing efficiency. This study is the first to apply a
decomposition framework to clarify the determinants of AI technology invention. Exploiting data
from the World Intellectual Property Organization, this study clarifies the determining factors that
contribute to AI technology patent publications based on technology type. Consisting of 13,567 AI
technology patents for the 2000-2016 period, our worldwide dataset includes patent publication data
from the United States, Japan, China, Europe, and the Patent Cooperation Treaty (PCT). We find that
priority has shifted from biological- and knowledge-based models to specific mathematical models
and other AI technologies, particularly in the United States and Japan. Our technology type and
country comparison shows that the characteristics of AI technology patent publication differ among
companies and countries.
Keywords: Artificial intelligence, Patent decomposition analysis, Research and development strategy, Biological
model, Knowledge based modeling
JEL classification: O30, O34, L00
RIETI Discussion Papers Series aims at widely disseminating research results in the form of professional
papers, thereby stimulating lively discussion. The views expressed in the papers are solely those of the
author(s), and neither represent those of the organization to which the author(s) belong(s) nor the Research
Institute of Economy, Trade and Industry.
1This study is conducted as a part of the “Economics of Artificial Intelligence” project undertaken at the Research Institute of Economy, Trade and Industry (RIETI). The author is grateful for helpful comments and suggestions by Makoto Yano (RIETI), Hiroshi Ohashi (University of Tokyo), Masayuki Morikawa (RIETI), and Discussion Paper seminar participants at RIETI. 2 Graduate School of Fisheries and Environmental Sciences, Nagasaki University, 1-14 Bunkyo-machi, Nagasaki 852-8521, Japan 3 Urban Institute & School of Engineering, Kyushu University, Japan; Research Institute of Economy, Trade and Industry (RIETI)
2
1. Introduction
By enhancing and creating efficiencies, artificial intelligence (AI) technology can play
a critical role in improving social well-being in areas as diverse as economic development,
precision medicine, public welfare, and environmental protection (National Science and
Technology Council, 2016; Parkes and Wellman, 2015). AI technology will significantly
contribute to increases in human welfare across a wide range of sectors, including
transportation, service robotics, healthcare, education, low-resource communities, public
safety, employment, and entertainment (Stone et al., 2016). According to (Teactica, 2015),
market opportunities for AI systems will increase from $202.5 million in 2015 to $11.1 billion
by 2024.
The global importance of AI technology has been growing. The 2015 Strategy for
American Innovation established nine high-priority research areas, including the BRAIN
initiative (Insel et al., 2013) and the Precision Medicine initiative (Hodson, 2016). Additionally,
AI is listed as a high-priority technology for a super-smart society in Japan’s 5th Science and
Technology Basic Plan (2016 to 2020). These research and development (R&D) strategies
focus on the expansion of the AI business market and are intended to improve international
market competitiveness.
Generally, patents grant inventors hold exclusive rights to protect their knowledge and
technology from the competitor (Maresh et al., 2016). This action is also observed in A.I.
3
technology patenting. According to Bajpai (2016), IBM, world largest A.I. patent inventor, has
projected that one billion consumers will be reached via Watson by end of 2017, primarily
through its partnerships across companies. This report also pointed out sufficient A.I. patenting
gives IBM a lead against companies which have just begun to work in the field of A.I. Thus,
A.I. patenting is key corporate R&D strategy to have business collaboration with protecting
intellectual property and to gain the position in rapid growing market.
Against the backdrop of this acceleration of AI technology development across the
globe, the number of patents granted has rapidly increased. Figure 1 shows the number of AI
patents granted by application country and technology type and reveals that the number of AI
patents has increased more than threefold, i.e., from 708 items in 2012 to 2,888 items in 2016.
In particular, AI patents granted in the U.S. increased by 1,628 items during this period (Figure
1(a)), which represents approximately 75% of the AI patent increase worldwide.
<Figure 1 about here>
As shown in Figure 1(b), the patent share of each AI technology type changed from
2012 to 2016. In 2012, biological and knowledge-based models were the leaders in patented
AI technologies. However, from 2012 to 2016, the number of patents granted for specific
mathematical models and other AI technologies rapidly increased, doubling from 2015 to 2016.

4
These two figures show the short-term trend of AI patenting based on country and technology.
However, Figure 1 is not able to reveal why the number of patents granted for each AI
technology type changed.
To clarify why the trend in AI patenting changed, the R&D strategies of the inventors
must be clarified. This strategy is the key driver of technology development (Fujii and Managi,
2016). Notably, not all AI technologies contribute equally to improved economic performance.
Certain AI technologies directly contribute to profits by creating new products and services,
whereas others contribute indirectly and only minimally. Therefore, the incentives for
companies to invent AI technologies vary depending on the type of technology considered. A
determinant analysis of inventions that focuses on the characteristics of each type of AI
technology is important if we are to suggest effective policies to encourage R&D in such
technology.
This study is the first to use a decomposition framework to clarify the determinants of
AI technology invention. Application of the decomposition method to technological invention
was proposed by Fujii and Managi (2016). This application can clarify the main factors that
promote innovation, whether they are the corporate priority given to specific technology
inventions or the result of the scale effect of R&D activities. This new decomposition
application is useful to policymakers because it yields a better understanding of policies at both
the macro and micro levels that can effectively encourage the invention of specific AI

5
technology inventions (such as biological, knowledge-based, and specific mathematical
models).
The objective of this study is to clarify the determining factors that contribute to AI
technology patent publications based on technology type. We also discuss how inventors’
industrial characteristics and national R&D policy affect the invention of AI technology by
country using company-level data. The novel contribution of this research is to clarify the
primary driver of AI patent granting using a patent decomposition framework and the log mean
Divisia index analysis. By combining these two approaches, we can distinguish the
contribution of the R&D strategy factor and the R&D scale factor. Many previous studies have
focused exclusively on the number of patent publications, which is affected by both the priority
given to inventions and the scale of research activity (Cecere et al., 2014; Lybbert and Zolas,
2014; Park, 2014; Roper and Hewitt-Dundas, 2015). This study attempts to derive a pure
measure of the priority given to inventions from patent publication data by controlling for the
scale effect (Fujii, 2016).
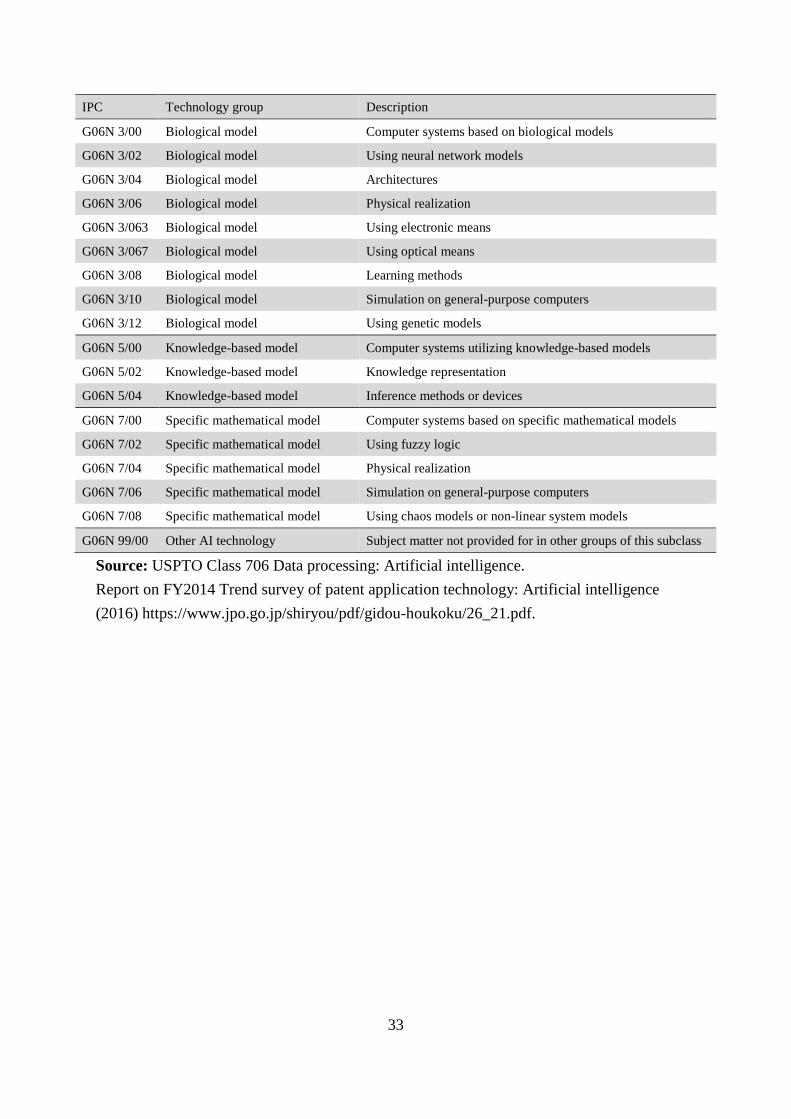
To consider the characteristics of each AI technology, we followed the practice of the
USPTO and the Japan patent office (JPO) (Appendix 1) and divided the patent data into the
following four AI technology groups: (1) biological models, (2) knowledge-based models, (3)
specific mathematical models, and (4) other AI technology models.
6
2. Methodology
We apply a decomposition analysis framework to clarify the changing factors involved
in granting AI technology patents. We use the following three indicators to decompose the AI
technology patents granted: the priority of a specific AI technology (PRIORITY), the
importance of AI technology among all patents granted (AItech), and the scale of R&D activity
(SCALE).
We define the PRIORITY indicator as the number of specific AI patents granted divided
by the total number of AI patents granted, thus providing the share of specific AI patents
granted among total AI patents. This indicator can be increased if the number of specific AI
patents granted increases more quickly than the total number of AI patents granted, thus
indicating that inventors are concentrating their research resources on specific types of AI
technology inventions. Inventors are prioritizing specific AI technology types over other types
when PRIORITY is increased.
Similarly, the AItech indicator is defined as the total number of AI patents granted
divided by the total number of patents granted, which indicates the share of total AI patents out
of total patents. This indicator can be increased if the number of total AI patents granted
increases more quickly than the number of total patents granted, thus indicating that inventors
are concentrating their research resources on AI technology inventions. Inventors are
prioritizing the invention of AI technology over other types of technology when AItech is

7
increased.
The SCALE indicator is defined as the total number of patents granted and thus
represents the scale of R&D activities. Generally, active R&D efforts promote the invention of
new technologies. Thus, the total number of patents granted reflects the level of active R&D
efforts. Additionally, R&D activities in companies depend on corporate financial circumstances
because the number patents granted is associated with the cost of researcher salaries, the
operating cost of experimental materials, and the cost of applying for and registering patents.
For example, following the financial crisis caused by the collapse of Lehman Brothers, the
number of patents granted decreased (Fujii and Managi, 2016). Thus, companies with serious
financial difficulties decreased their R&D activities to reduce their bankruptcy risk. This
decrease in R&D activities led to a decrease in the number of new patents granted, including
those related to AI technologies. Therefore, the scale of R&D activity is an important factor in
understanding why the number of AI patents granted has changed. SCALE increase as the total
number of patents granted increases. The number of patents granted for AI technology would
be increased by an increase in overall R&D activities if the SCALE score increased.
Here, we introduce the decomposition approach using the biological model-based
technology patent group as a specific type of AI patent granted (Table 1). The number of
biological model-based technology patents granted (BIOLOGICAL) is decomposed using the
total AI patents granted (AIpatent) and total patents granted (TOTAL), as in equation (1).

8
<Table 1 about here>
BIOLOGICAL= BIOLOGICALAIpatent
× AIpatentTOTAL
× TOTAL = PRIORITY × AItech × SCALE (1)
We consider the change in biological model-based patents granted from year t-1
(BIOLOGICALt-1) to year t (BIOLOGICALt). Using equation (1), the growth ratio of
biological model-based patents granted can be represented as follows:
BIOLOGICALt
BIOLOGICALt−1=
PRIORITYt
PRIORITYt−1 ×AItecht
AItecht−1×
SCALEt
SCALEt−1 (2)
We transform equation (2) into a natural logarithmic function and thus obtain equation
(3). Notably, zero values in the dataset cause problems in the formulation of the decomposition
due to the properties of logarithmic functions. To solve this problem, the logarithmic mean
Divisia index (LMDI) literature suggests replacing zero values with a small positive number
(Ang and Liu, 2007).
lnBIOLOGICAL𝑡𝑡 − lnBIOLOGICAL𝑡𝑡−1 = ln�PRIORITY𝑡𝑡
PRIORITY𝑡𝑡−1�+ln�
AItech𝑡𝑡
AItech𝑡𝑡−1� + ln�
SCALE𝑡𝑡
SCALE𝑡𝑡−1� (3)
Multiplying both sides of equation (3) by ω𝑖𝑖𝑡𝑡 = (BIOLOGICAL𝑡𝑡 − BIOLOGICAL𝑡𝑡−1)/
(lnBIOLOGICAL𝑡𝑡 − lnBIOLOGICAL𝑡𝑡−1) yields equation (4) as follows.
BIOLOGICAL𝑡𝑡 − BIOLOGICAL𝑡𝑡−1 = ⊿BIOLOGICAL𝑡𝑡,𝑡𝑡−1
= ω𝑖𝑖𝑡𝑡ln�
PRIORITY𝑡𝑡
PRIORITY𝑡𝑡−1�+ω𝑖𝑖
𝑡𝑡ln�AItech𝑡𝑡
AItech𝑡𝑡−1�+ω𝑖𝑖
𝑡𝑡ln�SCALE𝑡𝑡
SCALE𝑡𝑡−1� (4)
Therefore, changes in the number of patents granted for biological model-based
technologies (⊿BIOLOGICAL) are decomposed by changes in PRIORITY (first term), AItech
9
(second term) and SCALE (third term). The term 𝜔𝜔𝑖𝑖𝑡𝑡 operates as an additive weight for the
estimated number of patents granted for biological model-based technologies. This
decomposition technique was developed by Ang et al. (1998). and is termed the LMDI.
The novel aspect of this research is that it clarifies the R&D strategies of companies
using LMDI analysis. Many previous studies have focused exclusively on the number of
patents granted, which is affected by prioritizing certain invention types and the scale of
research activity. This study attempts to derive the pure priority of inventions from patent-
granted data by controlling for the scale effect. Fujii (2016) applies a decomposition framework
to patent data analysis using the two factors of priority and scale. In this study, we propose an
approach developed to distinguish the priority change of specific AI technology and that of
total AI technology.
3. Data and results
3.1 Data
We used patent-granted data from PATENTSCOPE, which is provided by the World
Intellectual Property Organization (WIPO). The PATENTSCOPE database covers more than
56 million patents granted. We specified AI certain technology patents based on the patent
clarification provided by both the USPTO and JPO (Appendix 1). We collected the patent-
granted data on 7 February 2017 from the PATENTSCOPE database.

10
As explained in Table 1, this study focuses on four AI technology types: (1) biological
model-based technology (BIOLOGICAL), (2) knowledge-based model technology
(KNOWLEDGE), (3) specific mathematical model-based technology (MATHEMATICAL),
and (4) other AI technology (OTHER). Following Fujii (2016) and Fujii and Managi (2016)
we use only the primary IPC code and the primary applicant name to construct the patent
dataset to avoid double-counting patent data.
3.2 Comparative analysis of AI patents granted
3.2.1 When was a specific AI technology patent invented and where?
Table 2 represents the change of AI patents granted by type of technology at each
patent office. Table 2 shows that the composition of patent-granted shares differs among
countries. The knowledge-based model represents more than half of the total number of AI
patents granted by the USPTO, whereas the biological model is the major technology type
granted by the SIPO and JPO. Another finding is that the share of the specific mathematical
model is only 1.7% in the JPO, which is extremely low compared with that of other patent
offices. This outcome occurs because Japanese AI researchers primarily focus on android
technology-based R&D (and not mathematical elements), which represents the core AI
technology (The Japan News, 2017). PCT, EPO, and the patent offices of other countries
exhibit similar trends with respect to the technology share pattern of AI patent publications.
11
<Table 2 about here>
Next, we consider the numerical change of AI patents granted. As shown in Table 2, all
the patent offices except the JPO published the largest number of AI patents from 2015 to 2016.
Notably, the number of patents granted more than doubled at the USPTO, SIPO, and PCT.
However, the average number of patents granted per year at the JPO was the largest from 2005
to 2009 for the biological model and from 2010 to 2014 for the knowledge-based model.
One interpretation of this result is that the Japanese market is less attractive for AI
technology application. Most AI technology services are strongly related to big data collection
through the internet (such as social network systems, credit card payments, and sensors).
Because of concerns among its residents, Japan is strict regarding the use of private information
for business (Kawasaki, 2015). The business barrier regarding big data collection and use
minimizes the incentive to obtain AI patents in Japan. In the U.S., the government has
established rules and regulations regarding the use of private information as big data (Hardy
and Maurushat, 2017; Manyika et al., 2011). Additionally, there are large governmental R&D
expenditures for AI technology innovation in the U.S., which is another strong incentive for AI
technology development (National Science and Technology Council, 2016).
3.2.2 Who invented which AI technology patent?

12
Table 3 lists the top 30 applicants for AI patents granted worldwide. The bottom rows
represent the number of patents granted to universities in the U.S., China, and Japan. As shown
in Table 3, IBM is the world’s leading recipient for AI patents granted. Additionally, of the top
30 grantees for AI patents granted, 18 applicants are U.S. companies, 8 applicants are Japanese
companies, and 4 applicants are companies from other countries. Notably, Chinese companies
and universities are not listed among the top 30 countries evaluated for the 2000-2016 period,
which implies that AI patents granted in China are obtained by many applicants.
<Table 3 about here>
Next, we discuss the composition of the AI technology patent share for each applicant.
Table 3 indicates that the patent portfolio of AI technology varies among applicants. Qualcomm
and BRAIN corporation garnered the highest share for the biological model. However, SAP
and Cognitive Scale had the largest share for the knowledge-based model. D-wave obtained
92% of other AI patents, an outcome that represents a completely different trend from other
companies. Notably, the companies listed in the top half of the list obtained patents in a wide
range of AI technology areas.
According to Table 3, a large proportion of the AI patents granted to Chinese and
Japanese universities were for technology based on the biological model. This trend differs

13
from that found for U.S. universities. In addition, U.S. universities have obtained a large
proportion of patents for AI technology that uses a knowledge-based model. This trend
resembles that found for the composition of patents granted by the USPTO (Table 2). One
interpretation of these results is that U.S. universities have an advantage with respect to
accessing and analyzing big data. Generally, U.S. universities have more opportunity to
collaborate with U.S. companies, which control big data for AI technology development.
Access to big data is a key factor in developing a knowledge-based analysis (Gu et al., 2017).
Additionally, U.S. universities more successfully train students with substantial analytical
talent in graduate school (Manyika et al., 2011) than the universities of other countries. Human
resources for big data analysis are another important driver of technology development on the
knowledge-based model in the U.S.
3.2.3 Who invented a patented AI technology and where?
In this section, we discuss the distribution of AI patent applications by applicant. As
shown in Table 4, most U.S. companies have a large share of AI patent invention according to
the USPTO data. By contrast, the share of patented inventions of U.S. companies from the JPO
and SIPO is small. With the exception of NTT, non-U.S. companies have more than a 16%
patent share at the USPTO. Specifically, Samsung has 61% of all AI patents issued by the
USPTO. Surprisingly, four of the eight Japanese companies were granted more AI patents by
the USPTO than by the JPO. These results imply that Japanese companies have strong
14
incentives to obtain AI patents from the USPTO, while there is less incentive for U.S.
companies to obtain AI patents from the JPO. This result is consistent with the interpretation
that big data use creates an advantage for the U.S. market with respect to AI technology
application.
<Table 4 about here>
Based on Table 4, universities clearly tend to apply for AI patents at domestic patent
offices. In particular, 98% of the AI patents obtained by Chinese universities were granted by
the SIPO, with a low number granted by other patent offices. By contrast, U.S. and Japanese
universities apply for AI patents at the PCT in addition to at their domestic patent offices.
Notably, approximately 45% of the AI technology patents granted in China were obtained by
Chinese universities. This outcome is unique. In other countries, private companies are the
primary patent applicants. This trend is also observed in other technological fields (e.g.,
nanotechnology (Huang and Wu, 2012) and aquaculture technology) (Fujii et al., 2017). Fong
et al. (2015) note that “China’s National Medium and Long Term Science and Technology
Development Planning (2006–2020)” significantly improved Chinese university technology
transfer. Additionally, the same scholars conclude that economic incentives and royalties are
key factors incentivizing the increase in the number of patented inventions at Chinese

15
universities.
Moreover, the Chinese government sets a high priority on AI technology development
in China’s 13th Five-Year Plan (2016-2020). Under this plan, research institutes and universities
are encouraged to invent new AI technologies. These governmental targets can be considered
the key factor driving the increase in the priority placed on AI technology in China.
3.3 Patent decomposition analysis
Figure 2 shows the results of a decomposition analysis for four specific AI technology
patents granted at all the patent offices listed in Appendix 2. Because the AI patent trend
changes beginning in 2012 (Figure 1), we divided the decomposition analysis results into two
periods (the first period runs from 2000 to 2011, and the second period from 2012 to 2016).
The plotted point in red indicates the change in the number of specific patents granted, and the
bar chart shows the effects of each decomposed factor on the number of patents granted related
to specific AI technologies. The sum of the bars is equivalent to the value of the plotted point.
The figure shows the differences in the driving factors for patents granted based on the type of
AI technology. Detailed results from the decomposition analysis are provided in Appendices
3-6.
<Figure 2 about here>
16
Figure 2 shows that the number of patents granted for technology based on the
biological and knowledge-based models increased during the first period. However, the priority
of specific AI technology affects these two technology types differently. As shown in Figure 2,
during the first period, the relative priority of the biological model was negative, whereas that
of the knowledge-based model was positive. This result implies that the priority of AI
technology patent invention shifted from the biological model to the knowledge-based model
over the first period. The number of patents granted for the other two technology types did not
change significantly during the first period, which indicates that these two technologies were
treated as less important than technologies based on the biological and knowledge-based
models during that period.
Based on the results for the second period, the number of patents granted substantially
increased for all four AI technologies. In addition, the priority of specific technologies shifted
from the biological and knowledge-based models to the specific mathematical model and other
AI model during the second period. Specifically, the number of patents granted for other AI
technology was 624 items during the second period, which is more than that for the biological
model (565 items) and close to that for the knowledge-based model (693 items) (see red points
in Figure 2).
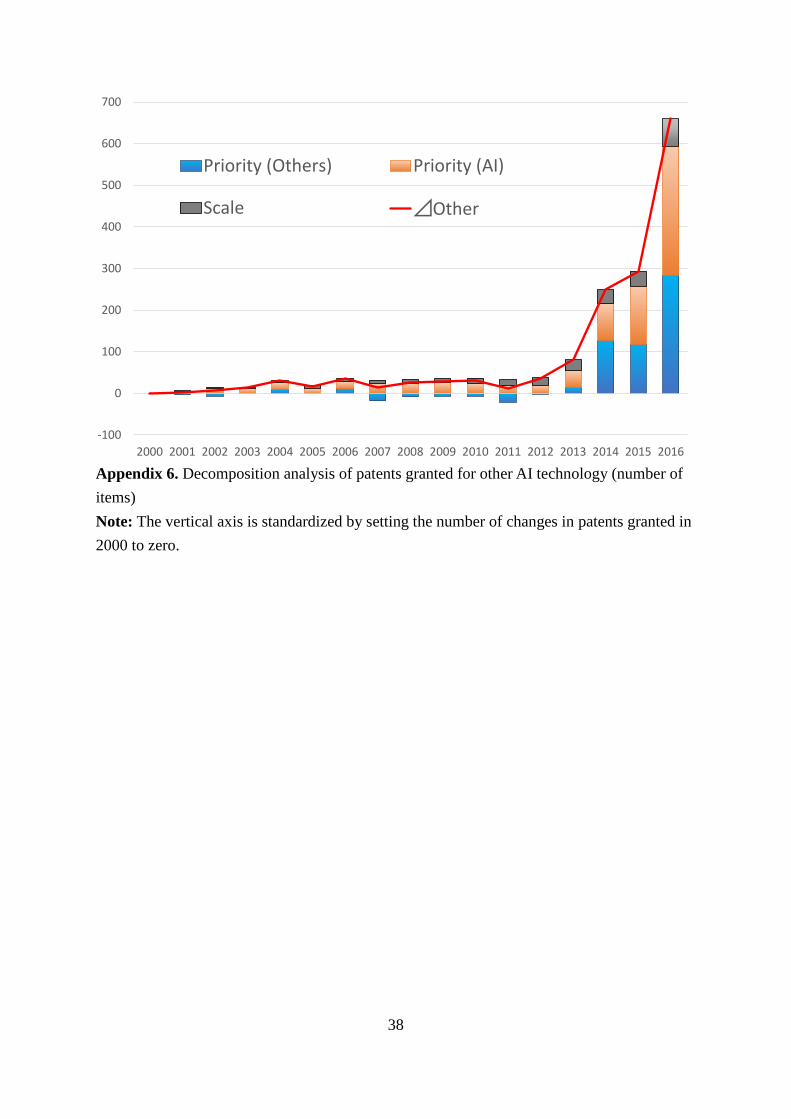
There are two main reasons why the number of patents granted for other AI technology
17
increased during the second period. First, technology based on the biological and knowledge-
based models that use big data have garnered attention in the business market in recent years
as the technology demand for high information-processing capabilities became stronger. This
technology demand exerted a strong incentive to invent the quantum computer, which is
categorized as other AI technology (Lloyd et al., 2016).
Second, the range of AI technology became broader and more complex during the
second period, which makes it difficult to categorize AI technology patents into the major
technology groups, such as the biological model or the knowledge-based model. Here, we
examine the breakdown for AI technology patents whose primary IPC code is G06N99 to
investigate the primary driver of other AI technology patent growth. There are 611 items whose
IPC is solely G06N99 that are not registered using a secondary IPC code. The number of
patents whose second IPC is G06N5/02, G06N5/04, or G06N7/00 total 83, 129, and 106 items,
respectively. These IPC codes are included under the knowledge-based model and specific
mathematical models (Appendix 1). Thus, other AI technology patents includes patent items
that are strongly related to knowledge-based or specific mathematical models.
Patent items categorized as other AI technology and registered with a second IPC code
of G06F17/30 (information retrieval; therefore, database structures) include 86 items from
2000 to 2015 and 77 items published after 2015. This technology group contributes to creating
data labeling and tagging to achieve more efficient machine learning. For example, IBM listed
18
“Labeling of data for machine learning (US20150356457)”, and Microsoft listed “Metadata
tag description generation” in publication number US20160358096. These AI patents involve
crucial technology that is used to rapidly analyze big data collected by social network services
and sensors for the Internet of Things. However, there is no appropriate IPC clarification for
these technologies, and such patent items are registered under other AI technology.
Table 5 shows the patent decomposition analysis results by patent office. The table
shows that the main contributors of patents granted are mixed in the first period among the
patent offices. However, AI technology commonly contributed as the main driver of patent
invention for the biological and knowledge-based models during the second period at all the
patent offices. Additionally, the priority of a specific technology increased other AI technology
at all the patent offices during the second period. Based on these two findings, the R&D priority
of AI technology became stronger during the second period—particularly for other AI
technology—at the five patent offices. In addition, the priority of specific mathematical models
increased at the USPTO and JPO but decreased at the EPO. Thus, the priority of specific
technology commonly contributed to other AI technology invention at the five patent offices
and the specific mathematical model at the USPTO and JPO.
<Table 5 about here>
19
The key point of the results for the first period is that the scale change of R&D activity
contributes at the SIPO for all four AI technology types. One interpretation of this trend is that
the Chinese patent application law revisions in 2001 and 2009 simplified patent applications
for domestic companies that used the subsidy program (Dang and Motohashi, 2015). Hu et al.
(2017) noted that a rapid patent application increase at the SIPO was caused by external factors,
such as the revision of the patent law and a new subsidy system and not by internal factors (e.g.,
R&D priority changes and human resources for R&D). Thus, the revision of the Chinese patent
application system contributed to expanding R&D activities (e.g., patent applications) at the
SIPO, which increased the number of patents for AI inventions.
At the USPTO, the priority of AI technology increased the number of patents granted
for the four AI technology types during both the first and second periods. This result was
observed only at the USPTO and indicates that AI patent invention behavior in the U.S. is
unique and successfully incentivized by U.S. governmental policies (National Science and
Technology Council, 2016; Taylor, 2016). Additionally, the contribution of the priority of
specific technology shifted from the knowledge-based model to the specific mathematical
model and other AI technology at the USPTO and JPO during the second period. Nonetheless,
the priority of specific technology negatively affected the specific mathematical models at the
SIPO, PCT, and EPO.
20
4. Summary and conclusions
This study examined the trend and priority change of AI technology using patent-
granted data from 2000 to 2016. We focused on the following four technology types: (1)
biological model, (2) knowledge-based model, (3) specific mathematical model, and (4) other
AI technology. Employing a patent decomposition analysis framework, we clarified the trends
and priority changes for patent inventions for these four technology types. The main results are
summarized as follows.
First, AI technology patents were primarily granted at the USPTO to private U.S.
companies, and in particular to IBM, Microsoft, and Qualcomm. Additionally, many U.S.
companies primarily applied for patents at the USPTO and have little share at other patent
offices. Non-U.S. companies also focused on obtaining patents from the USPTO in addition to
their domestic patent offices. These results show that the U.S. market is attractive for both U.S.
and non-U.S. companies. However, other countries’ markets are not particularly attractive for
U.S. companies.
Second, universities are key AI technology inventors in the U.S. and China. Specifically,
45% of AI technology patents granted at the SIPO were obtained by Chinese universities. Other
important findings include that 98% of the AI technology patents granted to Chinese
universities were registered at SIPO, whereas U.S. and Japanese universities received 72% and

21
78% of their relevant patents from domestic patent offices, respectively.
Finally, we find that the relative priority of R&D shifted from the biological and
knowledge-based models to specific mathematical models and other AI technology,
particularly in the U.S. and Japan. Additionally, R&D priority characteristics vary among the
patent offices and AI technology types. These results imply that the international framework
for AI technology development should be considered for effective R&D policy construction.

22
References
Ang, B.W., Liu, N., 2007. Handling zero values in the logarithmic mean Divisia index
decomposition approach. Energy Policy 35, 238-46.
Ang, B.W., Zhang, F.Q., Choi, K.H., 1998. Factorizing changes in energy and environmental
indicators through decomposition. Energy 23, 489-95.
Bajpai, P. (2016) IBM's Astonishing Patent Strategy Shows Where It's Going Next. News
Headlines, Technology, Stocks in Nasdaq. http://www.nasdaq.com/article/ibms-
astonishing-patent-strategy-shows-where-its-going-next-cm725790 (accessed 28th
April, 2017)
Cecere, G., Corrocher, N., Gossart, C., Ozman, M., 2014. Technological pervasiveness and
variety of innovators in Green ICT: A patent-based analysis. Research Policy 43,
1827-39.
Dang, J., Motohashi, K., 2015. Patent statistics: A good indicator for innovation in China?
Patent subsidy program impacts on patent quality. China Economic Review 35, 137-
55.
Fong, P.S.W., Chang, X., Chen, Q., 2015. Faculty patent assignment in the Chinese mainland:
Evidence from the top 35 patent application universities. The Journal of Technology
Transfer, 1-27. doi:10.1007/s10961-015-9434-7
Fujii, H., 2016. Decomposition analysis of green chemical technology inventions from 1971
23
to 2010 in Japan. Journal of Cleaner Production 112, 4835-43.
Fujii, H., Managi, S., 2016. Research and development strategy for environmental technology
in Japan: A comparative study of the private and public sectors. Technological
Forecasting and Social Change 112, 293-302.
Fujii, H., Sakakura, Y., Soyano, K., Matsushita, Y., Hagiwara, A., 2017. Research and
development strategy of fisheries technology innovation. Nagasaki university.
Gu, D., Li, J., Li, X., Liang, C., 2017. Visualizing the knowledge structure and evolution of
big data research in healthcare informatics. International Journal of Medical
Informatics 98, 22-32.
Hardy, K., Maurushat, A., 2017. Opening up government data for Big Data analysis and
public benefit. Computer Law and Security Review 33, 30-7.
Hodson, R., 2016. Precision medicine. Nature 537, S49.
Hu, A.G.Z., Zhang, P., Zhao, L., 2017. China as number one? Evidence from China's most
recent patenting surge. Journal of Development Economics 124, 107-19.
Huang, C., Wu, Y., 2012. State-led technological development: A case of China’s
nanotechnology development. World Development 40, 970-82.
Insel, T.R., Landis, S.C., Collins, F.S., 2013. The NIH brain initiative. Science 340, 687-8.
Kawasaki, S., 2015. The challenges of transportation/traffic statistics in Japan and directions
for the future. IATSS Research 39, 1-8.
24
Lloyd, S., Garnerone, S., Zanardi, P., 2016. Quantum algorithms for topological and
geometric analysis of data. Nature Communications 7, 10138.
Lybbert, T.J., Zolas, N.J., 2014. Getting patents and economic data to speak to each other: An
‘Algorithmic Links with Probabilities’ approach for joint analyses of patenting and
economic activity. Research Policy 43, 530-42.
Manyika, J., Chui, M., Brown, B., Bughin, J., Dobbs, R., Roxburgh, C., Byers, A.H.,
McKinsey Global Institute, 2011. Big Data: The Next Frontier for Innovation,
Competition, and Productivity. McKinsey, Incorporated.
Maresch, D., Fink, M., Harms, R. When patents matter: The impact of competition and patent
age on the performance contribution of intellectual property rights protection.
Technovation 57–58, 14–20.
National Science and Technology Council, 2016. The National Artificial Intelligence
Research and Development Strategic Plan. CreateSpace Independent Publishing
Platform, Washington, D.C.
Park, J.Y., 2014. The evolution of waste into a resource: Examining innovation in
technologies reusing coal combustion by-products using patent data. Research Policy
43, 1816-26.
Parkes, D.C., Wellman, M.P., 2015. Economic reasoning and artificial intelligence. Science
349, 267.

25
Roper, S., Hewitt-Dundas, N., 2015. Knowledge stocks, knowledge flows and innovation:
Evidence from matched patents and innovation panel data. Research Policy 44, 1327-
40.
Stone, P., Brooks, R., Brynjolfsson, E., Calo, R., Etzioni, O., Hager, G., Hirschberg, J.,
Kalyanakrishnan, S., Kamar, E., Kraus, S., Leyton-Brown, K., Parkes, D., Press, W.,
Saxenian, A., Shah, J., Tambe, M., Teller, A., 2016. Artificial intelligence and life in
2030. one hundred year study on artificial intelligence: Report of the 2015-2016
Study Panel. Stanford University, Stanford, CA.
Taylor, R.D., 2016. The next stage of U.S. communications policy: The emerging embedded
infosphere. Telecommunications Policy. doi: 10.1016/j.telpol.2016.11.007.
Teactica, 2015. Artificial Intelligence for Enterprise Applications to Reach $11.1 Billion in
Market Value by 2024.
The Japan News, 2017. Japan’s Critically Late Start in AI Research (from http://www.the-
japan-news.com/news/article/0003514495).

26
Table 1. Description of AI technology patent group
Patent group Description of patent group [IPC code]
Biological model
Computer systems based on biological models, including neural network models, genetic models, architectures, physical realization, learning methods, biomolecular computers, and artificial life [IPC=G06N3/00].
Knowledge-based model
Computer systems that utilize knowledge-based models, including knowledge engineering, knowledge acquisition, extracting rules from data, and inference methods or devices [IPC=G06N5/00].
Specific mathematical model
Computer systems based on specific mathematical models, including fuzzy logic, physical realization, chaos models or non-linear system models, and probabilistic networks [G06/N7/00].
Other AI technology
Subject matter not provided for previously described groups of the G06N3 subclass, including quantum computers, learning machines, and molecular computers [G06/N99/00].
Source: USPTO Class 706 Data processing: Artificial intelligence.
Report on FY2014 Trend survey of patent application technology: Artificial intelligence
(2016) https://www.jpo.go.jp/shiryou/pdf/gidou-houkoku/26_21.pdf.

27
Table 2. Data description of AI technology patents granted (item)
Patent office
AI technology type
2000-2016 Share
Yearly average number of patents granted
2000-2004
2005-2009
2010-2014
2015-2016
USPTO
Biological 1,455 19.9% 44 63 80 259 Knowledge 4,152 56.9% 50 166 320 738 Mathematical 672 9.2% 9 18 30 194 Other 1,019 14.0% 1 3 57 359
SIPO
Biological 1,184 73.7% 9 32 103 232 Knowledge 219 13.6% 1 9 16 45 Mathematical 114 7.1% 4 6 8 14 Other 90 5.6% 1 7 4 15
JPO
Biological 679 56.4% 12 62 46 40 Knowledge 410 34.1% 4 31 37 25 Mathematical 21 1.7% 1 1 1 5 Other 94 7.8% 1 4 3 26
PCT
Biological 723 46.3% 35 30 38 104 Knowledge 480 30.7% 18 26 29 58 Mathematical 114 7.3% 2 5 9 16 Other 244 15.6% 7 8 12 56
EPO
Biological 452 44.0% 26 24 24 42 Knowledge 306 29.8% 8 22 20 26 Mathematical 106 10.3% 2 5 10 12 Other 164 16.0% 7 8 10 22
Other patent
office
Biological 434 49.9% 25 13 31 45 Knowledge 220 25.3% 10 8 17 23 Mathematical 135 15.5% 4 3 13 16 Other 80 9.2% 3 4 5 9
Source: Author estimate using IPC code in Appendix 1 and PATSTAT database.
Note: USPTO: United States Patent and Trademark Office; SIPO: State Intellectual Property
Office of The People's Republic of China; JPO: Japan Patent Office; PCT: Patent
Cooperation Treaty; EPO is European Patent Office.

28
Table 3. Number of AI patents granted and technology portfolios: 2000 to 2016
Rank Applicant name Country Total patents
Patent portfolio of AI technology Biological Knowledge Mathematical Other
1 IBM USA 1,057 22% 56% 8% 14% 2 Microsoft USA 466 22% 44% 9% 24% 3 Qualcomm USA 450 83% 7% 3% 7% 4 NEC Japan 255 23% 49% 8% 20% 5 Sony Japan 212 51% 33% 6% 10% 6 Google USA 195 41% 36% 7% 17% 7 Siemens Germany 192 54% 31% 10% 5% 8 Fujitsu Japan 154 27% 60% 9% 4% 9 Samsung Korea 119 56% 28% 3% 13%
10 NTT Japan 94 35% 49% 0% 16% 11 Hewlett-Packard USA 93 22% 44% 4% 30% 12 Yahoo USA 88 14% 57% 16% 14% 13 Toshiba Japan 86 22% 57% 7% 14% 14 D-wave Canada 77 1% 4% 3% 92% 15 Hitachi Japan 69 20% 38% 12% 30% 15 SAP USA 69 23% 70% 6% 1% 17 Canon Japan 68 59% 28% 3% 10% 18 Xerox USA 62 15% 45% 18% 23% 19 GE USA 59 14% 59% 22% 5% 20 Mitsubishi Electric Japan 53 49% 43% 2% 6% 21 Honeywell USA 49 24% 51% 22% 2% 22 Boeing USA 48 31% 60% 4% 4% 23 Cisco USA 47 15% 38% 0% 47% 23 Oracle USA 47 17% 55% 9% 19% 25 British Telecomm UK 44 41% 57% 2% 0% 26 Intel USA 43 35% 51% 5% 9% 27 Amazon USA 41 15% 39% 2% 44% 28 Brain Corporation USA 40 80% 15% 3% 3% 28 Cognitive scale USA 40 0% 88% 0% 13% 28 Facebook USA 40 0% 40% 13% 48%
University total World 1,177 69% 19% 6% 6% U.S. university USA 241 41% 38% 7% 14% Chinese university China 725 82% 10% 5% 3% Japanese university Japan 93 83% 15% 1% 1%
Source: Author estimate using IPC code in Appendix 1 and PATSTAT database.
29
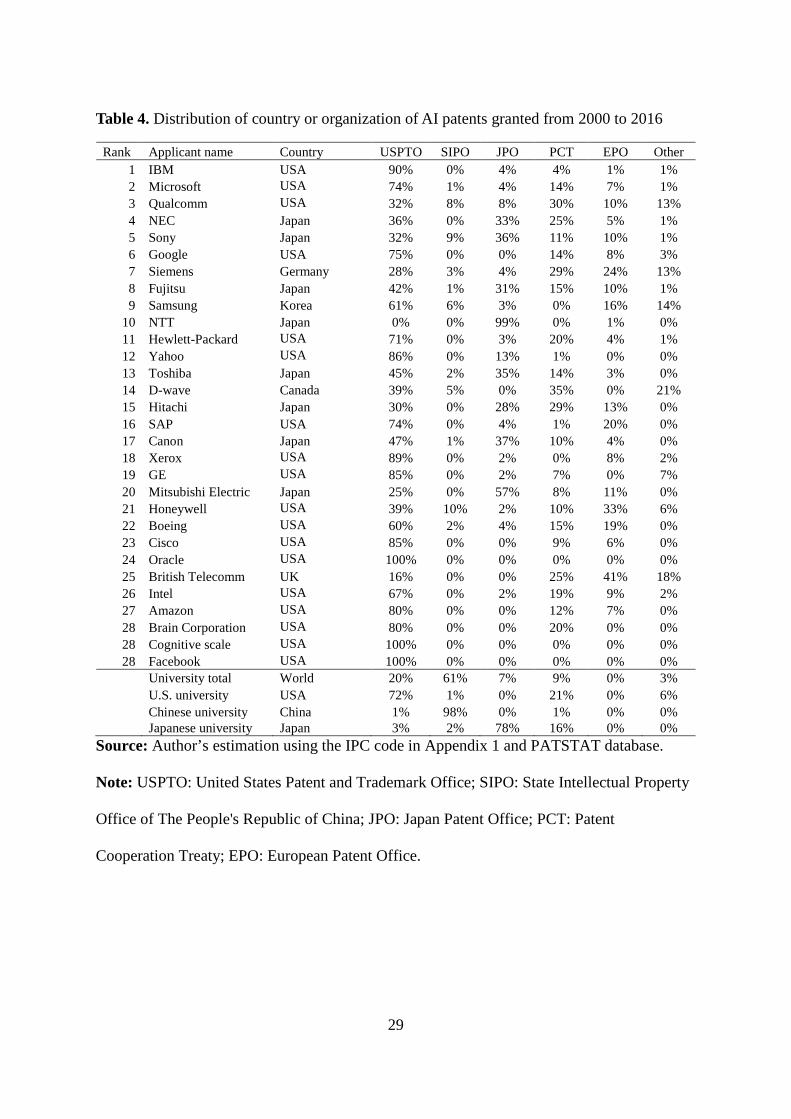
Table 4. Distribution of country or organization of AI patents granted from 2000 to 2016
Rank Applicant name Country USPTO SIPO JPO PCT EPO Other 1 IBM USA 90% 0% 4% 4% 1% 1% 2 Microsoft USA 74% 1% 4% 14% 7% 1% 3 Qualcomm USA 32% 8% 8% 30% 10% 13% 4 NEC Japan 36% 0% 33% 25% 5% 1% 5 Sony Japan 32% 9% 36% 11% 10% 1% 6 Google USA 75% 0% 0% 14% 8% 3% 7 Siemens Germany 28% 3% 4% 29% 24% 13% 8 Fujitsu Japan 42% 1% 31% 15% 10% 1% 9 Samsung Korea 61% 6% 3% 0% 16% 14%
10 NTT Japan 0% 0% 99% 0% 1% 0% 11 Hewlett-Packard USA 71% 0% 3% 20% 4% 1% 12 Yahoo USA 86% 0% 13% 1% 0% 0% 13 Toshiba Japan 45% 2% 35% 14% 3% 0% 14 D-wave Canada 39% 5% 0% 35% 0% 21% 15 Hitachi Japan 30% 0% 28% 29% 13% 0% 16 SAP USA 74% 0% 4% 1% 20% 0% 17 Canon Japan 47% 1% 37% 10% 4% 0% 18 Xerox USA 89% 0% 2% 0% 8% 2% 19 GE USA 85% 0% 2% 7% 0% 7% 20 Mitsubishi Electric Japan 25% 0% 57% 8% 11% 0% 21 Honeywell USA 39% 10% 2% 10% 33% 6% 22 Boeing USA 60% 2% 4% 15% 19% 0% 23 Cisco USA 85% 0% 0% 9% 6% 0% 24 Oracle USA 100% 0% 0% 0% 0% 0% 25 British Telecomm UK 16% 0% 0% 25% 41% 18% 26 Intel USA 67% 0% 2% 19% 9% 2% 27 Amazon USA 80% 0% 0% 12% 7% 0% 28 Brain Corporation USA 80% 0% 0% 20% 0% 0% 28 Cognitive scale USA 100% 0% 0% 0% 0% 0% 28 Facebook USA 100% 0% 0% 0% 0% 0%
University total World 20% 61% 7% 9% 0% 3% U.S. university USA 72% 1% 0% 21% 0% 6% Chinese university China 1% 98% 0% 1% 0% 0%
Japanese university Japan 3% 2% 78% 16% 0% 0% Source: Author’s estimation using the IPC code in Appendix 1 and PATSTAT database.
Note: USPTO: United States Patent and Trademark Office; SIPO: State Intellectual Property
Office of The People's Republic of China; JPO: Japan Patent Office; PCT: Patent
Cooperation Treaty; EPO: European Patent Office.

30
Table 5. Results of decomposition analysis by patent office: 2000 to 2016
Specific technology
Patent office
Change from 2000 to 2012 Change from 2012 to 2016 ⊿Specific technology
patent
Decomposed factors ⊿Specific technology
patent
Decomposed factors Priority (specific)
Priority (AI)
Scale
Priority (specific)
Priority (AI)
Scale
Biological
model
USPTO 39 -73.2 85.2 26.9 260 -10.6 286.0 -15.3 SIPO 89 22.9 -9.1 75.1 183 -14.3 109.6 87.7 JPO 39 -17.9 73.5 -16.6 -4 -12.1 28.3 -20.3 PCT -3 -16.4 -8.5 21.9 74 -10.9 75.8 9.2 EPO 19 -17.3 26.0 10.4 29 5.1 29.6 -5.7
Knowledge-
based model
USPTO 239 85.2 123.8 30.0 612 -292.6 938.3 -33.8 SIPO 13 0.0 2.6 10.3 36 1.7 19.0 15.3 JPO 40 38.2 12.3 -10.4 -19 -25.1 18.2 -12.1 PCT 11 5.7 -10.0 15.3 48 -7.6 48.9 6.7 EPO 11 7.4 -1.6 5.2 12 -4.5 18.8 -2.3
Specific
mathematical
model
USPTO 15 -6.9 14.3 7.5 265 122.6 156.8 -14.4 SIPO 4 -10.6 3.6 11.0 10 -0.5 5.8 4.7 JPO 0 -0.1 0.3 -0.2 8 7.6 1.4 -1.0 PCT 2 2.0 -1.3 1.2 15 -1.0 14.3 1.7 EPO 12 12.2 -1.4 1.3 -1 -8.6 9.3 -1.7
Other AI
technology
USPTO 10 4.6 4.4 1.0 491 191.5 326.9 -27.4 SIPO 3 -5.5 -0.7 9.2 21 14.7 3.5 2.8 JPO 2 -3.1 6.4 -1.3 34 30.7 11.4 -8.2 PCT 9 5.7 -1.9 5.2 54 21.1 29.6 3.3 EPO 8 4.7 0.3 3.0 21 9.3 14.5 -2.8
Note: USPTO: United States Patent and Trademark Office; SIPO: State Intellectual Property
Office of The People's Republic of China; JPO: Japan Patent Office; PCT: Patent
Cooperation Treaty; EPO: European Patent Office.

31
Figure. 1. Trend of AI patents granted: 2000 to 2016 (number of items)
Source: Author estimate using IPC code in Appendix 1 and PATSTAT database.
Note: USPTO: United States Patent and Trademark Office; SIPO: State Intellectual Property
Office of The People's Republic of China; JPO: Japan Patent Office; PCT: Patent
Cooperation Treaty; EPO: European Patent Office
0
500
1000
1500
2000
2500
3000
2000
2001
2002
2003
2004
2005
2006
2007
2008
2009
2010
2011
2012
2013
2014
2015
2016
USPTO
SIPO
JPO
PCT
EPO
Other
0
500
1000
1500
2000
2500
3000
2000
2001
2002
2003
2004
2005
2006
2007
2008
2009
2010
2011
2012
2013
2014
2015
2016
Other AI technology
Mathematical
Knowledge
Biological
Figure 1a. Number of AI patents granted by country Figure 1b. Number of AI patents granted by technology

32
Figure. 2. Results of patent decomposition analysis (number of items)
Note: The vertical axis is standardized by setting the number of changes in patents granted in
2000 and 2012 to zero.
Supplementary Information Appendix 1. International patent clarification related to AI technologies
-400
-200
0
200
400
600
800
1,000
Biological Knowledge Math Other Biological Knowledge Math Other
Priority (specific)
Priority (AI)
Scale
Change from 2000 to 2012 (1st period) Change from 2012 to 2016 (2nd period)
33
IPC Technology group Description
G06N 3/00 Biological model Computer systems based on biological models
G06N 3/02 Biological model Using neural network models
G06N 3/04 Biological model Architectures
G06N 3/06 Biological model Physical realization
G06N 3/063 Biological model Using electronic means
G06N 3/067 Biological model Using optical means
G06N 3/08 Biological model Learning methods
G06N 3/10 Biological model Simulation on general-purpose computers
G06N 3/12 Biological model Using genetic models
G06N 5/00 Knowledge-based model Computer systems utilizing knowledge-based models
G06N 5/02 Knowledge-based model Knowledge representation
G06N 5/04 Knowledge-based model Inference methods or devices
G06N 7/00 Specific mathematical model Computer systems based on specific mathematical models
G06N 7/02 Specific mathematical model Using fuzzy logic
G06N 7/04 Specific mathematical model Physical realization
G06N 7/06 Specific mathematical model Simulation on general-purpose computers
G06N 7/08 Specific mathematical model Using chaos models or non-linear system models
G06N 99/00 Other AI technology Subject matter not provided for in other groups of this subclass
Source: USPTO Class 706 Data processing: Artificial intelligence. Report on FY2014 Trend survey of patent application technology: Artificial intelligence (2016) https://www.jpo.go.jp/shiryou/pdf/gidou-houkoku/26_21.pdf.
34
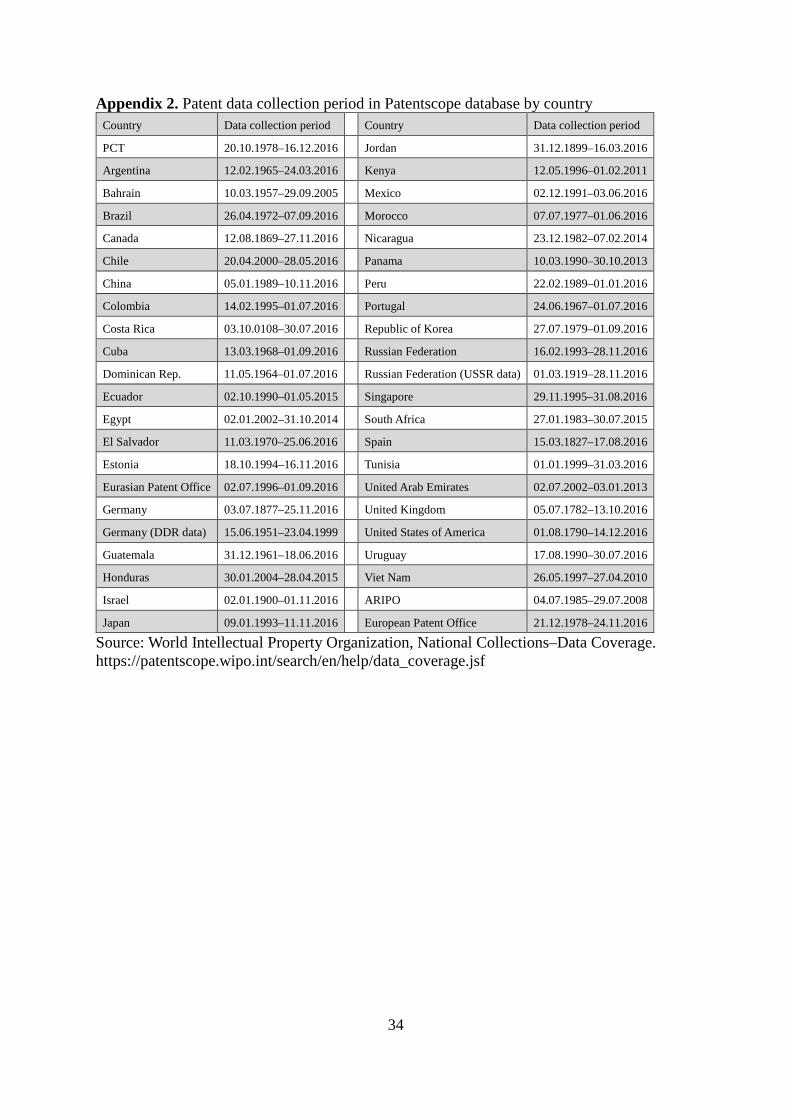
Appendix 2. Patent data collection period in Patentscope database by country Country Data collection period Country Data collection period PCT 20.10.1978–16.12.2016 Jordan 31.12.1899–16.03.2016
Argentina 12.02.1965–24.03.2016 Kenya 12.05.1996–01.02.2011 Bahrain 10.03.1957–29.09.2005 Mexico 02.12.1991–03.06.2016 Brazil 26.04.1972–07.09.2016 Morocco 07.07.1977–01.06.2016 Canada 12.08.1869–27.11.2016 Nicaragua 23.12.1982–07.02.2014 Chile 20.04.2000–28.05.2016 Panama 10.03.1990–30.10.2013 China 05.01.1989–10.11.2016 Peru 22.02.1989–01.01.2016 Colombia 14.02.1995–01.07.2016 Portugal 24.06.1967–01.07.2016 Costa Rica 03.10.0108–30.07.2016 Republic of Korea 27.07.1979–01.09.2016 Cuba 13.03.1968–01.09.2016 Russian Federation 16.02.1993–28.11.2016 Dominican Rep. 11.05.1964–01.07.2016 Russian Federation (USSR data) 01.03.1919–28.11.2016 Ecuador 02.10.1990–01.05.2015 Singapore 29.11.1995–31.08.2016 Egypt 02.01.2002–31.10.2014 South Africa 27.01.1983–30.07.2015 El Salvador 11.03.1970–25.06.2016 Spain 15.03.1827–17.08.2016 Estonia 18.10.1994–16.11.2016 Tunisia 01.01.1999–31.03.2016 Eurasian Patent Office 02.07.1996–01.09.2016 United Arab Emirates 02.07.2002–03.01.2013 Germany 03.07.1877–25.11.2016 United Kingdom 05.07.1782–13.10.2016 Germany (DDR data) 15.06.1951–23.04.1999 United States of America 01.08.1790–14.12.2016 Guatemala 31.12.1961–18.06.2016 Uruguay 17.08.1990–30.07.2016 Honduras 30.01.2004–28.04.2015 Viet Nam 26.05.1997–27.04.2010 Israel 02.01.1900–01.11.2016 ARIPO 04.07.1985–29.07.2008 Japan 09.01.1993–11.11.2016 European Patent Office 21.12.1978–24.11.2016
Source: World Intellectual Property Organization, National Collections–Data Coverage. https://patentscope.wipo.int/search/en/help/data_coverage.jsf

35
Appendix 3. Decomposition analysis of patents granted for the biological model (number of items) Note: The vertical axis is standardized by setting the number of changes in patents granted in 2000 to zero.
-400
-200
0
200
400
600
800
1000
1200
2000 2001 2002 2003 2004 2005 2006 2007 2008 2009 2010 2011 2012 2013 2014 2015 2016
Priority (Biological) Priority (AI)
Scale ⊿BIOLOGICAL

36
Appendix 4. Decomposition analysis of patents granted for the knowledge-based model (number of items) Note: The vertical axis is standardized by setting the number of changes in patents granted in 2000 to zero.
-200
0
200
400
600
800
1000
1200
2000 2001 2002 2003 2004 2005 2006 2007 2008 2009 2010 2011 2012 2013 2014 2015 2016
Priority (Knowledge) Priority (AI)
Scale ⊿KNOWLEDGE

37
Appendix 5. Decomposition analysis of patents granted for specific mathematical model (number of items) Note: The vertical axis is standardized by setting the number of changes in patents granted in 2000 to zero.
-50
0
50
100
150
200
250
300
350
400
2000 2001 2002 2003 2004 2005 2006 2007 2008 2009 2010 2011 2012 2013 2014 2015 2016
Priority (Mathematical) Priority (AI)
Scale ⊿Mathematical
38
Appendix 6. Decomposition analysis of patents granted for other AI technology (number of items) Note: The vertical axis is standardized by setting the number of changes in patents granted in 2000 to zero.
-100
0
100
200
300
400
500
600
700
2000 2001 2002 2003 2004 2005 2006 2007 2008 2009 2010 2011 2012 2013 2014 2015 2016
Priority (Others) Priority (AI)
Scale ⊿Other