frustration in protein dna binding influences ... · frustration in protein–dna binding...
TRANSCRIPT

Frustration in protein–DNA binding influencesconformational switching and target search kineticsAmir Marcovitz and Yaakov Levy1
Department of Structural Biology, Weizmann Institute of Science, Rehovot, 76100, Israel
Edited by Arieh Warshel, University of Southern California, Los Angeles, CA, and approved August 15, 2011 (received for review June 14, 2011)
Rapid recognition of DNA target sites involves facilitated diffusionthrough which alternative sites are searched on genomic DNA. Akey mechanism facilitating the localization of the target by aDNA-binding protein (DBP) is one-dimensional diffusion (sliding)in which electrostatic forces attract the protein to the DNA. Asthe protein reaches its target DNA site, it switches from purely elec-trostatic binding to a specific set of interactionswith the DNA basesthat also involves hydrogen bonding and van der Waals forces.High overlap between the DBP patches used for nonspecific andspecific interactions with DNAmay enable an immediate transitionbetween the two binding modes following target site localization.By contrast, an imperfect overlap may result in greater frustrationbetween the two potentially competing binding modes and conse-quently slower switching between them. A structural analysis of125 DBPs indicates frustration between the two binding modesthat results in a large difference between the orientations of theprotein to the DNA when it slides compared to when it specificallyinteracts with DNA. Coarse-grained molecular dynamics simula-tions of in silico designed peptides comprising the full range offrustrations between the two interfaces show slower transitionfrom nonspecific to specific DNA binding as the overlap betweenthe patches involved in the two binding modes decreases. Thecomplex search kinetics may regulate the search by eliminatingtrapping of the protein in semispecific sites while sliding.
nonspecific binding ∣ energy landscape ∣ protein–DNA interactions
Many DNA-binding proteins (DBPs) recognize short DNAtarget sequences rapidly and specifically in an enormous
genomic background with many sites of similar sequence to thespecific target site. Various studies have suggested that proteinslocate DNA target sites through a combination of multidimen-sional search mechanisms that allow a relatively few protein co-pies to activate or repress genes within reasonable response times(1, 2). DBPs bind with moderate affinity to nonspecific DNAsequences and randomly diffuse along the linear contour of theDNA (“sliding”). Sliding is interrupted by short-range dissocia-tions to neighboring DNA segments (“hopping”) as well as dis-sociations to the bulk and transfers to distant DNA sequencesthat are spatially close (“intersegment transfer”).
The search kinetics for the target site may not be governedsolely by the scanning efficiency of nonspecific sites along thegenomic DNA: Its complexity can be increased and its pace slo-wed by other processes. For example, following the arrival of theprotein at the target site, additional events may be required forspecific DNA recognition to occur (3). This transition from theencounter complex that is stabilized by nonspecific interactions tothe specific protein–DNA complex may involve conformationalchanges to one or both biomolecules. Most likely the transitionis also coupled with expulsion of interfacial water molecules (4).
Probing the transition from nonspecific to specific protein–DNA binding is difficult because nonspecific interactions aretransient in nature. Several structures of proteins bound to semi-specific DNA sequences (i.e., with partial sequence similarityto the specific DNA target) have highlighted that nonspecificinteractions are mostly dominated by electrostatic interactionsbetween the positively charged protein side chains and the nega-
tively charged DNA backbone (5–7). This notion is supported bya greater dependence of the nonspecific interactions on salt con-centration in comparison with specific protein–DNA complexes(8–10). Generally, DBPs have substantial regions of positive elec-trostatic patches at their DNA-binding interface that complementthe negatively charged DNA (11, 12). Negatively charged aminoacids have a lower propensity in protein–DNA interfaces (13),though they might be observed and contribute to specificity byproperly orienting the protein relative to the DNA (14) or inter-act with the DNA through a cation such as Mg2þ, as observed inEcoRV endonuclease (15). Specificity in protein–DNA inter-actions is obtained mostly by a formation of hydrogen bondsbetween donors and acceptors from protein side chains andDNA bases (10, 16), stabilized by van der Waals and hydrophobicforces, electrostatics, and water-mediated interactions betweenpolar groups (4, 17).
Recent studies indicated a high degree of similarity betweenspecific and nonspecific protein–DNA binding. NMR studies ofthe HoxD9 homeodomain sliding dynamics and kinetics showedthat the protein utilizes similar interfaces for both nonspecificand specific DNA binding and that the positive patch on the pro-tein surface maintains a similar orientation with the DNA in thetwo binding modes (18). In addition, single molecule studies ofDBPs diffusion along DNA indicated a rotation-coupled slidingalong the DNA helical path, enabling a secondary structural ele-ment of the protein binding site to probe the DNA grooves (19).Molecular dynamic simulations also showed that the electrostaticpotential of DBPs is sufficient to orient the protein during slidingat the binding mode of the specific interaction (20, 21).
Although the nonspecific and specific interactions of DBPswith DNA are often very similar, they are not identical. Differ-ences between the two binding modes may originate from imper-fect overlap between the patch of positive electrostatic potentialthat interacts with the DNA backbone and the patch that inter-acts with the base pairs. The need to switch from the nonspecificupon specific recognition reflects a frustration between the twomodes because the protein has to exchange some electrostaticinteractions with the DNA backbone with hydrogen bonding withthe bases. Higher frustration between the two modes may involvevarying degrees of conformational changes in the protein or theDNA (22). For example, the contents of lac repressor with DNAare dramatically altered in the transition from nonspecific DNAbinding to the complex with its natural operator (7). In particular,base-pair interactions formed in the specific complex at the ex-pense of a partial loss of nonspecific charge–charge interactionsinduce a tilt in the protein relative to the DNA upon the transi-tion from the nonspecific to the specific complex, as well asdistorting the canonical B-DNA form of the DNA (7, 10).
Author contributions: A.M. and Y.L. designed research, performed research, analyzed dataand wrote the paper.
The authors declare no conflict of interest.
This article is a PNAS Direct Submission.1To whom correspondence should be addressed. E-mail: [email protected].
This article contains supporting information online at www.pnas.org/lookup/suppl/doi:10.1073/pnas.1109594108/-/DCSupplemental.
www.pnas.org/cgi/doi/10.1073/pnas.1109594108 PNAS ∣ November 1, 2011 ∣ vol. 108 ∣ no. 44 ∣ 17957–17962
BIOPH
YSICSAND
COMPU
TATIONALBIOLO
GY

Here we investigated the existence of frustration between non-specific and specific DNA binding by DBPs and its implicationsfor DNA search mechanisms and kinetics. We asked to whatextent the nonspecific binding modes of DBPs during sliding aresimilar to specific binding and in particular focused on whetherthe transition between the two introduces further kinetic com-plexity to the process of DNA target search by proteins.
Results and DiscussionCorrespondence Between the Specific and Nonspecific BindingPatches on DBPs. Under physiological conditions, DBPs have areasonable affinity to any DNA sequence. This trait allows theprotein to alternate between one-dimensional sliding to hoppingand dissociations from the DNA. Positively charged patches arecommon in DBPs and have unique features compared withpositively charged patches found in protein–protein interfaces(11, 12). For example, positively charged patches of DBPs arelarger, have a higher α-helical content, greater hydrogen-bondingpotency, and a higher degree of evolutionary conservation ofpositively charged residues than similar patches on non-DNAbinding proteins (11).
Here, we analyzed a dataset of 125 DBPs for which the crystalstructure with specific DNA sequence is available (12) (seeSI Text) and explored the dual role the positively charged patchmay have as a mediator of specific contact formation at the targetDNA site and of an efficient protein translocation process alongthe DNA. For each DBP in the dataset, a subgroup of residuesconstitute the patch for specific binding to DNA was definedaccording to its structure. The positively charged patches ofthe DBPs were probed using the electrostatic potential of theprotein obtained from Poisson–Boltzman calculations (11).
Fig. 1 (Upper) shows residues forming the specific DNA-bind-ing patch together with the electrostatic potential of the proteinsurface. In the DNA-binding domain of Skn-1, both the specificDNA-binding residues and the positively charged region occupythe recognition helix that interact with the DNA major groove
[Fig. 1A, Protein Data Bank (PDB) ID code 1skn]. The specificDNA binding residues of the chromosomal protein 7A are lo-cated in a β-sheet region, a less common DNA-binding motif, andare less localized in a region with positive electrostatic potential(Fig. 1B, PDB ID code 1c8c). In the monomeric lambda repres-sor, the positive potential at the protein surface is relatively non-uniform (Fig. 1C, PDB ID code 1lmb), with the specific DNAbinding residues being dispersed among regions with differingelectrostatic potentials. Variations in the electrostatic environ-ment of each residue that specifically interacts with the DNAare also illustrated by highlighting neighboring positively (Argand Lys) and negatively (Glu and Asp) charged residues in thevicinity of each residue of the specific patch (see Middle).
The similarity between the specific DNA-binding patch on theDBP and the positively charged nonspecific binding patch, wasquantified in two approaches. First, we calculated the overlapbetween the specific and nonspecific binding patches (denotedas SI-PP overlap), as the percentage of protein residues thatspecifically bind the DNA and also belong to the DBP largestpositive electrostatic patch. Second, we evaluated the surround-ing electrostatic environment for each individual residue i, witha measure χi that may range from −1 to 1 (for residues fullysurrounded by negatively or positively charged residues) (seeMethods, Eq. 1). For each protein, we then calculated χprot as themean of the χi values for the residues involved in specific DNAbinding. Clearly, a protein whose specific and nonspecific DNApatches overlap or even share a mutual common identity (i.e.,fully correspond) will have a higher χprot value.
Fig. 1 (Lower) highlights the heterogeneous χi values observedin three different DNA-binding proteins as well as the localiza-tion of the specific DNA-binding residues relative to the positivepatch region. In Skn-1 DNA-binding domain, with a χprot of 0.42,the specific DNA binding residues entirely overlap the positivepatch region (whose residues are indicated by blue markers atthe baseline). In the chromosomal protein 7A, only 63% of itsspecific DNA binding residues overlap with the positive patch
Fig. 1. Electrostatic potential ofthe patch for specific DNA binding.Three DBPs with varying degreesof correspondence between thepatches used for specific and non-specific binding are shown for theSkn-1 DNA-binding domain 1sknA(A), chromosomal protein 7A 1c8cA(B), and the monomeric λ-repressor1lmb3 (C). The residues that partici-pate in specific DNA binding areshown as green spheres. (Upper) Theelectrostatic potential calculatedusing adaptive Poisson–Boltzmannsolver (APBS) (35) is shown using ascale that ranges from red to blue.(Middle) The positively charged (Argand Lys) and negatively charged(Asp and Glu) amino acids that sur-round each of the specific DNA bind-ing residues (with a Cα–Cα distanceof <10 Å) are indicated with blueand red connecting lines, respec-tively. (Bottom) The values of χi(calculated according to Eq. 1), withgreen bars indicating the χ i valuesfor specific DNA binding residues(the mean of the green bars is de-noted by χprot). The percentageoverlap between the specific patchand the positively charged electro-static patch [the largest blue patch(Upper)] is denoted by SI-PP.
17958 ∣ www.pnas.org/cgi/doi/10.1073/pnas.1109594108 Marcovitz and Levy

and some are partially localized near negatively charged regions,giving rise to a χprot of 0.2. In the monomeric lambda repressor,many specific DNA binding residues are accommodated in thevicinity of negatively charged residues and are excluded from thepositive patch region, resulting in a χprot of approximately 0 andless than 50% overlap with the positive patch.
Fig. 2 summarizes the two quantifications of the structuralinterplay between specific DNA binding residues and their sur-rounding electrostatic environment for the entire DBP dataset(divided into seven structural/functional groups). For referencepurposes, we analyzed an additional dataset of 37 RNA-bindingproteins (RBPs), a protein–protein dataset of 16 heterodimersin which the macromolecular interface is dominated by electro-static interactions, and a dataset consisting of 129 homodimericprotein complexes in which the interfacial electrostatic obser-vables discussed above are expected to be negligible (see SI Textfor more details about the protein datasets).
Fig. 2A shows that the positive patch overlap is higher forDBPs than for RBPs and protein–protein complexes. This findingis consistent with the observation that positive patches on DBPstend to be larger than those on the surfaces of other proteins (11).However, for many DBPs, particularly enzymes, a significant frac-tion of the specific DNA binding residues is excluded from thepositive patch, which results in a reduced overlap.
In Fig. 2B, higher χprot values are observed for DBPs than forRBPs and protein–protein complexes, as protein interfaces forDNA binding are, on average, more enriched with positive chargesthan are interfaces for RNA and protein binding. However, DBPsexhibit mostly moderate χprot values (ranging from approximately0.05 to 0.25). We find that in many DBPs the observed χprot isbelow the maximal χprot available from an optimal rearrangementof the charges along the sequence (Fig. S1). This indicates a partialfrustration between specific and nonspecific DNA binding, asmany neutral and negatively charged residues surround residuesthat specifically bind DNA. Although examples exist for negativelycharged residues in the interface (14), these surrounding residuesmay introduce local electrostatic repulsion from the DNA. DBPswith higher χprot values are mostly those recognizing DNA throughα-helices (for example, leucine-zipper and zinc-coordinating pro-teins). By contrast, DBPs with low χprot values, such as enzymes,typically represent more complex DNA-binding sites with mixedpositively and negatively charged residues. These observationssuggest an implicit conflict within DBPs between their specific andnonspecific DNA-binding modes, which may induce structural dif-ferences between the specific binding and sliding conformationsas well as raising a kinetic barrier to transition between the two.
Differences Between the Orientations Adopted by Proteins Relative toDNA During Sliding and Specific Binding.During sliding, the proteinis attracted to the DNA mostly by electrostatics and most ofthe interactions exist in specific DNA binding (hydrogen bonds,van der Waals) are absent (9, 10). We ask whether the differentprotein–DNA interactions observed for sequence specific bindingcompared with purely electrostatic binding, as quantified and
described above, may dictate a different protein orientation re-lative to the DNA for nonspecific compared with specific binding.
To address this question, we studied the sliding dynamics offour proteins with varying χprot values. Sliding was studied alonga nonspecific 100-bp dsDNAmolecule at a low salt concentration.We used a coarse-grained model in which protein–DNA inter-actions were represented by electrostatic forces only and somimicked nonspecific interactions (see Methods). The optimizedprotein configuration in sliding was captured by gradually decreas-ing the temperature. We then compared the orientation of theprotein relative to the DNA during sliding with that seen in theexperimental specific-sequence protein–DNA complex. Fig. 3compares the relative orientations between the DBP and theDNA during specific and nonspecific DNA-binding modes. Forthe purpose of representation, we aligned each specific protein–DNA complex (shown in blue) with its corresponding sliding com-plex (protein shown in green, DNA in gray). The conformationsof the DNA in the two complexes are quite similar, so discrepan-cies between the two binding modes make little contributiontoward distorting the DNA from the canonical B-DNA form.
The nonspecific and specific interactions of the Skn-1 DNA-binding domain (χprot ¼ 0.42) with DNA are shown in Fig. 3A.The protein maintains a sliding orientation to the DNA that isvery similar to the specific binding found in the crystal structure.The recognition helix can therefore efficiently sense the specifictarget sequence and readily form the network of hydrogen bondsthat define the specific complex. We quantify the differencebetween the specific and nonspecific binding orientations bymeasuring the distance between the Cα atom of each residue thatspecifically bind DNA and the nearest DNA backbone phosphateatom in both the specific complex and the sliding conformation(each with its corresponding DNA). The mean difference be-tween the distances in the specific complex and the sliding con-formation (denoted as Δdsp-nsp) equals 1.3 Å for Skn-1, whichsupports the similarity between the two binding modes. Fig. 3 Band C show a comparison between the specific and sliding pro-tein–DNA complexes of two other DBPs: homeobox proteinHox-A9 and Smad-MH1 protein. These proteins have lowerχprot values of 0.35 and 0.18, respectively, which reflect a higherfrustration (lower overlap) between their specific binding resi-dues and charged residues. In these two proteins, the sliding or-ientation of the protein to the DNA differs more markedly fromthe orientation adopted in the specific complex than is observedfor the Skn1 DNA-binding protein, which has a higher valueof χprot. The increasing difference between the nonspecific andspecific binding modes observed for these three proteins is re-flected in increasing Δdsp-nsp values as χprot decreases.
A sliding conformation of a monomer from the restrictionendonuclease BamHI is shown (Fig. 3D, green) together with thespecific enzyme–DNA complex (blue) (23), as well as with astructure of the enzyme bound to a semispecific DNA sequencethat differs by a single base pair from the specific sequence (lightblue) (6). The low χprot value of 0.03 for this protein reflects asignificant difference between the electrostatic qualities of the
0.0
0.1
0.2
0.3 DNA-protein RNA-protein Protein-protein
Hom.
prot
eins
Het.
prot
eins
RNA-BP
's
Enzy
mes
Oth
ers
β pro
tein
s
othe
rα-
helix
Zipp
erTy
peZinc
C.
HTH
χ prot
0
25
50
75
100
Hom.
prot
eins
Oth
ers
Enzy
mes
RNA-BP
'sHet
.pr
otei
ns
Zipp
erTy
pe othe
rα-
helix
β pr
otei
ns
Zinc
C.
HTH
SI-
PP
ove
rlap
(%)
A B
Fig. 2. Frustration between specific and nonspecificinterfaces in DBPs, RBPs, and protein–protein com-plexes. The dataset of DBPs investigated includes 125proteins (grouped into 7 categories based on theirfold or function) and the dataset of RBPs includes37 proteins. Protein–protein complexes are repre-sented by 129 homodimeric and 16 heterodimericproteins. The conflict between the specific and non-specific interfaces is evaluated by (A) the overlap ofthe residues of the specific interface with the largestpositive patch (SI-PP overlap) and (B) by the values ofχprot (see Methods for additional details).
Marcovitz and Levy PNAS ∣ November 1, 2011 ∣ vol. 108 ∣ no. 44 ∣ 17959
BIOPH
YSICSAND
COMPU
TATIONALBIOLO
GY
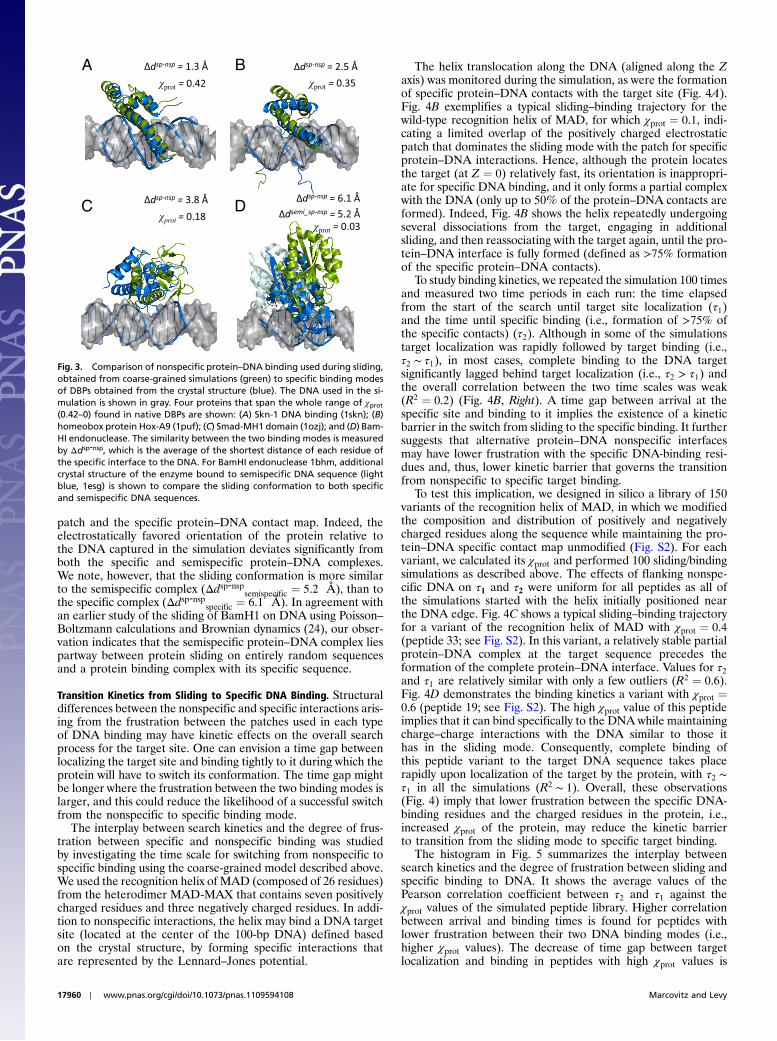
patch and the specific protein–DNA contact map. Indeed, theelectrostatically favored orientation of the protein relative tothe DNA captured in the simulation deviates significantly fromboth the specific and semispecific protein–DNA complexes.We note, however, that the sliding conformation is more similarto the semispecific complex (Δdsp-nspsemispecific ¼ 5.2 Å), than tothe specific complex (Δdsp-nspspecific ¼ 6.1 Å). In agreement withan earlier study of the sliding of BamH1 on DNA using Poisson–Boltzmann calculations and Brownian dynamics (24), our obser-vation indicates that the semispecific protein–DNA complex liespartway between protein sliding on entirely random sequencesand a protein binding complex with its specific sequence.
Transition Kinetics from Sliding to Specific DNA Binding. Structuraldifferences between the nonspecific and specific interactions aris-ing from the frustration between the patches used in each typeof DNA binding may have kinetic effects on the overall searchprocess for the target site. One can envision a time gap betweenlocalizing the target site and binding tightly to it during which theprotein will have to switch its conformation. The time gap mightbe longer where the frustration between the two binding modes islarger, and this could reduce the likelihood of a successful switchfrom the nonspecific to specific binding mode.
The interplay between search kinetics and the degree of frus-tration between specific and nonspecific binding was studiedby investigating the time scale for switching from nonspecific tospecific binding using the coarse-grained model described above.We used the recognition helix of MAD (composed of 26 residues)from the heterodimer MAD-MAX that contains seven positivelycharged residues and three negatively charged residues. In addi-tion to nonspecific interactions, the helix may bind a DNA targetsite (located at the center of the 100-bp DNA) defined basedon the crystal structure, by forming specific interactions thatare represented by the Lennard–Jones potential.
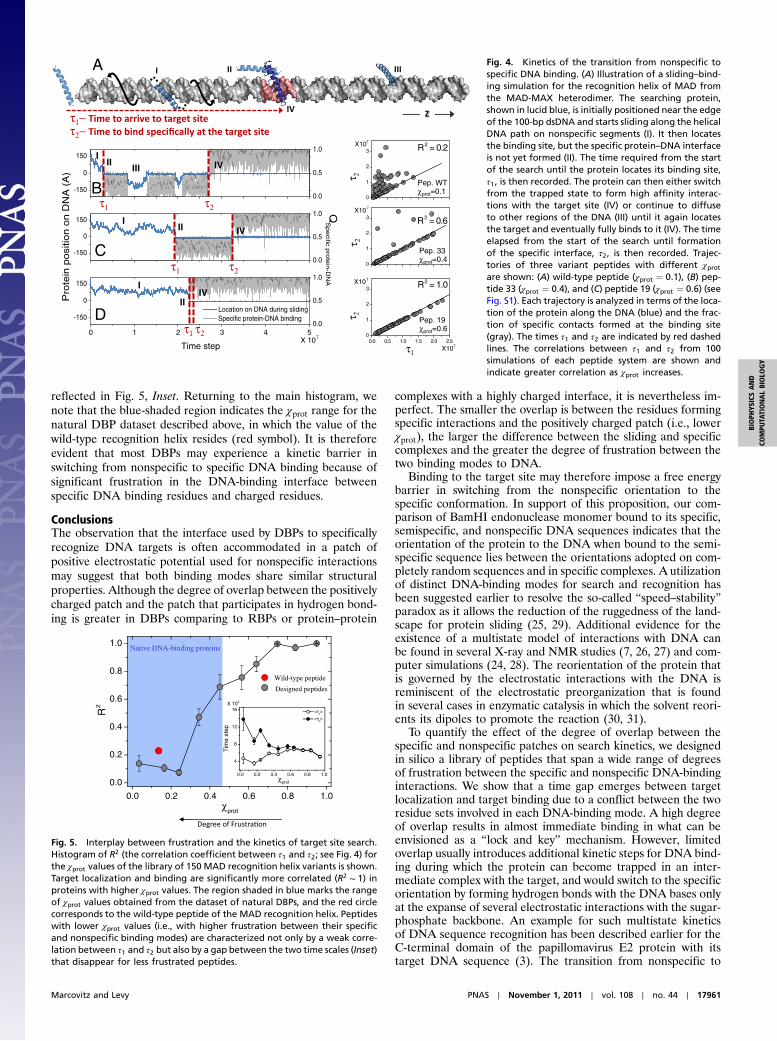
The helix translocation along the DNA (aligned along the Zaxis) was monitored during the simulation, as were the formationof specific protein–DNA contacts with the target site (Fig. 4A).Fig. 4B exemplifies a typical sliding–binding trajectory for thewild-type recognition helix of MAD, for which χprot ¼ 0.1, indi-cating a limited overlap of the positively charged electrostaticpatch that dominates the sliding mode with the patch for specificprotein–DNA interactions. Hence, although the protein locatesthe target (at Z ¼ 0) relatively fast, its orientation is inappropri-ate for specific DNA binding, and it only forms a partial complexwith the DNA (only up to 50% of the protein–DNA contacts areformed). Indeed, Fig. 4B shows the helix repeatedly undergoingseveral dissociations from the target, engaging in additionalsliding, and then reassociating with the target again, until the pro-tein–DNA interface is fully formed (defined as >75% formationof the specific protein–DNA contacts).
To study binding kinetics, we repeated the simulation 100 timesand measured two time periods in each run: the time elapsedfrom the start of the search until target site localization (τ1)and the time until specific binding (i.e., formation of >75% ofthe specific contacts) (τ2). Although in some of the simulationstarget localization was rapidly followed by target binding (i.e.,τ2 ∼ τ1), in most cases, complete binding to the DNA targetsignificantly lagged behind target localization (i.e., τ2 > τ1) andthe overall correlation between the two time scales was weak(R2 ¼ 0.2) (Fig. 4B, Right). A time gap between arrival at thespecific site and binding to it implies the existence of a kineticbarrier in the switch from sliding to the specific binding. It furthersuggests that alternative protein–DNA nonspecific interfacesmay have lower frustration with the specific DNA-binding resi-dues and, thus, lower kinetic barrier that governs the transitionfrom nonspecific to specific target binding.
To test this implication, we designed in silico a library of 150variants of the recognition helix of MAD, in which we modifiedthe composition and distribution of positively and negativelycharged residues along the sequence while maintaining the pro-tein–DNA specific contact map unmodified (Fig. S2). For eachvariant, we calculated its χprot and performed 100 sliding/bindingsimulations as described above. The effects of flanking nonspe-cific DNA on τ1 and τ2 were uniform for all peptides as all ofthe simulations started with the helix initially positioned nearthe DNA edge. Fig. 4C shows a typical sliding–binding trajectoryfor a variant of the recognition helix of MAD with χprot ¼ 0.4(peptide 33; see Fig. S2). In this variant, a relatively stable partialprotein–DNA complex at the target sequence precedes theformation of the complete protein–DNA interface. Values for τ2and τ1 are relatively similar with only a few outliers (R2 ¼ 0.6).Fig. 4D demonstrates the binding kinetics a variant with χprot ¼0.6 (peptide 19; see Fig. S2). The high χprot value of this peptideimplies that it can bind specifically to the DNA while maintainingcharge–charge interactions with the DNA similar to those ithas in the sliding mode. Consequently, complete binding ofthis peptide variant to the target DNA sequence takes placerapidly upon localization of the target by the protein, with τ2 ∼τ1 in all the simulations (R2 ∼ 1). Overall, these observations(Fig. 4) imply that lower frustration between the specific DNA-binding residues and the charged residues in the protein, i.e.,increased χprot of the protein, may reduce the kinetic barrierto transition from the sliding mode to specific target binding.
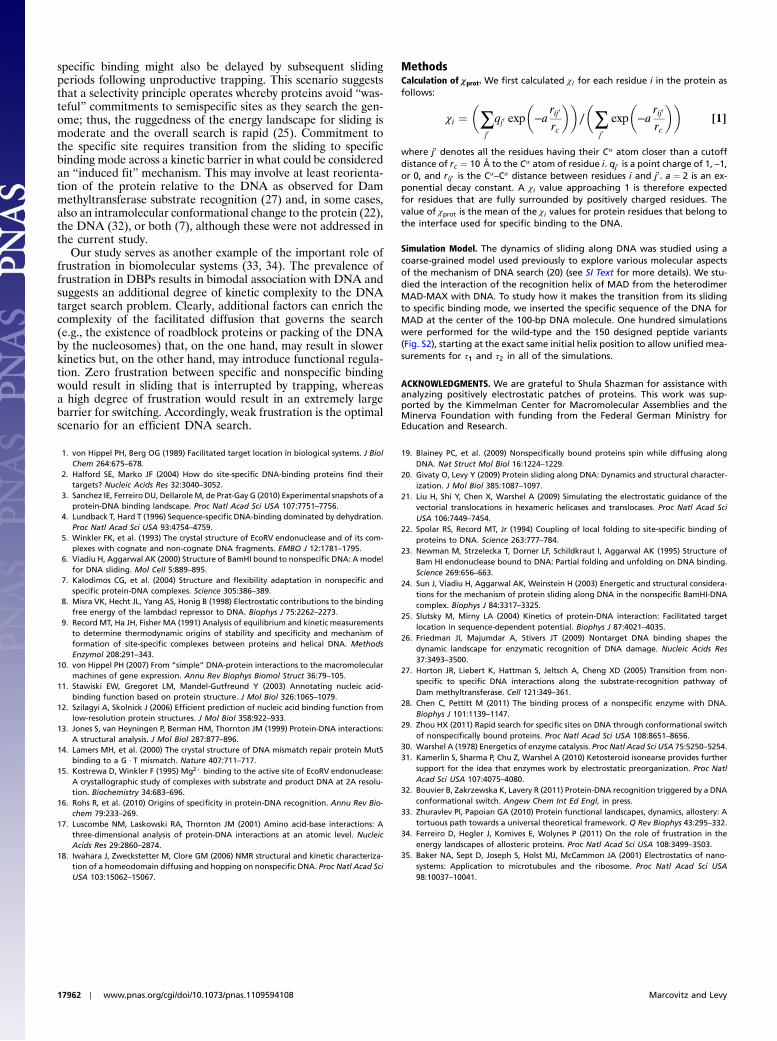
The histogram in Fig. 5 summarizes the interplay betweensearch kinetics and the degree of frustration between sliding andspecific binding to DNA. It shows the average values of thePearson correlation coefficient between τ2 and τ1 against theχprot values of the simulated peptide library. Higher correlationbetween arrival and binding times is found for peptides withlower frustration between their two DNA binding modes (i.e.,higher χprot values). The decrease of time gap between targetlocalization and binding in peptides with high χprot values is
A B
DC
Fig. 3. Comparison of nonspecific protein–DNA binding used during sliding,obtained from coarse-grained simulations (green) to specific binding modesof DBPs obtained from the crystal structure (blue). The DNA used in the si-mulation is shown in gray. Four proteins that span the whole range of χprot(0.42–0) found in native DBPs are shown: (A) Skn-1 DNA binding (1skn); (B)homeobox protein Hox-A9 (1puf); (C) Smad-MH1 domain (1ozj); and (D) Bam-HI endonuclease. The similarity between the two binding modes is measuredby Δdsp-nsp, which is the average of the shortest distance of each residue ofthe specific interface to the DNA. For BamHI endonuclease 1bhm, additionalcrystal structure of the enzyme bound to semispecific DNA sequence (lightblue, 1esg) is shown to compare the sliding conformation to both specificand semispecific DNA sequences.
17960 ∣ www.pnas.org/cgi/doi/10.1073/pnas.1109594108 Marcovitz and Levy
reflected in Fig. 5, Inset. Returning to the main histogram, wenote that the blue-shaded region indicates the χprot range for thenatural DBP dataset described above, in which the value of thewild-type recognition helix resides (red symbol). It is thereforeevident that most DBPs may experience a kinetic barrier inswitching from nonspecific to specific DNA binding because ofsignificant frustration in the DNA-binding interface betweenspecific DNA binding residues and charged residues.
ConclusionsThe observation that the interface used by DBPs to specificallyrecognize DNA targets is often accommodated in a patch ofpositive electrostatic potential used for nonspecific interactionsmay suggest that both binding modes share similar structuralproperties. Although the degree of overlap between the positivelycharged patch and the patch that participates in hydrogen bond-ing is greater in DBPs comparing to RBPs or protein–protein
complexes with a highly charged interface, it is nevertheless im-perfect. The smaller the overlap is between the residues formingspecific interactions and the positively charged patch (i.e., lowerχprot), the larger the difference between the sliding and specificcomplexes and the greater the degree of frustration between thetwo binding modes to DNA.
Binding to the target site may therefore impose a free energybarrier in switching from the nonspecific orientation to thespecific conformation. In support of this proposition, our com-parison of BamHI endonuclease monomer bound to its specific,semispecific, and nonspecific DNA sequences indicates that theorientation of the protein to the DNA when bound to the semi-specific sequence lies between the orientations adopted on com-pletely random sequences and in specific complexes. A utilizationof distinct DNA-binding modes for search and recognition hasbeen suggested earlier to resolve the so-called “speed–stability”paradox as it allows the reduction of the ruggedness of the land-scape for protein sliding (25, 29). Additional evidence for theexistence of a multistate model of interactions with DNA canbe found in several X-ray and NMR studies (7, 26, 27) and com-puter simulations (24, 28). The reorientation of the protein thatis governed by the electrostatic interactions with the DNA isreminiscent of the electrostatic preorganization that is foundin several cases in enzymatic catalysis in which the solvent reori-ents its dipoles to promote the reaction (30, 31).
To quantify the effect of the degree of overlap between thespecific and nonspecific patches on search kinetics, we designedin silico a library of peptides that span a wide range of degreesof frustration between the specific and nonspecific DNA-bindinginteractions. We show that a time gap emerges between targetlocalization and target binding due to a conflict between the tworesidue sets involved in each DNA-binding mode. A high degreeof overlap results in almost immediate binding in what can beenvisioned as a “lock and key” mechanism. However, limitedoverlap usually introduces additional kinetic steps for DNA bind-ing during which the protein can become trapped in an inter-mediate complex with the target, and would switch to the specificorientation by forming hydrogen bonds with the DNA bases onlyat the expanse of several electrostatic interactions with the sugar-phosphate backbone. An example for such multistate kineticsof DNA sequence recognition has been described earlier for theC-terminal domain of the papillomavirus E2 protein with itstarget DNA sequence (3). The transition from nonspecific to
0.0 0.5 1.0 1.5 2.0 2.50
1
2
3
X107
R2 = 1.0
R2 = 0.6
R2 = 0.2
0
1
2
3
0
1
2
3
X107
X107
X107
τ1
0 1 2 3 4 5
-150
0
150
Time step
-150
0
150
QS
pe
cific pro
tein
-DN
A
X 107
Pro
tein
posi
tion o
n D
NA
(A
)
-150
0
150
Location on DNA during sliding
0.0
0.5
1.0
0.0
0.5
1.0
0.0
0.5
1.0
Specific protein-DNA binding
I
I
I
II
II
II
III IV
IV
IV
τ1 τ2
τ1 τ2
τ1 τ2
τ 2τ 2
τ 2
τ1−τ2−
Pep. 33χprot=0.4
Pep. 19χprot=0.6
Pep. WTχprot=0.1
D
C
B
A Fig. 4. Kinetics of the transition from nonspecific tospecific DNA binding. (A) Illustration of a sliding–bind-ing simulation for the recognition helix of MAD fromthe MAD-MAX heterodimer. The searching protein,shown in lucid blue, is initially positioned near the edgeof the 100-bp dsDNA and starts sliding along the helicalDNA path on nonspecific segments (I). It then locatesthe binding site, but the specific protein–DNA interfaceis not yet formed (II). The time required from the startof the search until the protein locates its binding site,τ1, is then recorded. The protein can then either switchfrom the trapped state to form high affinity interac-tions with the target site (IV) or continue to diffuseto other regions of the DNA (III) until it again locatesthe target and eventually fully binds to it (IV). The timeelapsed from the start of the search until formationof the specific interface, τ2, is then recorded. Trajec-tories of three variant peptides with different χprotare shown: (A) wild-type peptide (χprot ¼ 0.1), (B) pep-tide 33 (χprot ¼ 0.4), and (C) peptide 19 (χprot ¼ 0.6) (seeFig. S1). Each trajectory is analyzed in terms of the loca-tion of the protein along the DNA (blue) and the frac-tion of specific contacts formed at the binding site(gray). The times τ1 and τ2 are indicated by red dashedlines. The correlations between τ1 and τ2 from 100simulations of each peptide system are shown andindicate greater correlation as χprot increases.
0.0 0.2 0.4 0.6 0.8 1.0
0.0
0.2
0.4
0.6
0.8
1.0
R2
χprot
Native DNA-binding proteins
0.0 0.2 0.4 0.6 0.8 1.0
4
8
12
16X 106
Tim
e st
ep
χprot
<τ1>
<τ2>
Designed peptides
Wild-type peptide
Fig. 5. Interplay between frustration and the kinetics of target site search.Histogram of R2 (the correlation coefficient between τ1 and τ2; see Fig. 4) forthe χprot values of the library of 150 MAD recognition helix variants is shown.Target localization and binding are significantly more correlated (R2 ∼ 1) inproteins with higher χprot values. The region shaded in blue marks the rangeof χprot values obtained from the dataset of natural DBPs, and the red circlecorresponds to the wild-type peptide of the MAD recognition helix. Peptideswith lower χprot values (i.e., with higher frustration between their specificand nonspecific binding modes) are characterized not only by a weak corre-lation between τ1 and τ2 but also by a gap between the two time scales (Inset)that disappear for less frustrated peptides.
Marcovitz and Levy PNAS ∣ November 1, 2011 ∣ vol. 108 ∣ no. 44 ∣ 17961
BIOPH
YSICSAND
COMPU
TATIONALBIOLO
GY
specific binding might also be delayed by subsequent slidingperiods following unproductive trapping. This scenario suggeststhat a selectivity principle operates whereby proteins avoid “was-teful” commitments to semispecific sites as they search the gen-ome; thus, the ruggedness of the energy landscape for sliding ismoderate and the overall search is rapid (25). Commitment tothe specific site requires transition from the sliding to specificbinding mode across a kinetic barrier in what could be consideredan “induced fit” mechanism. This may involve at least reorienta-tion of the protein relative to the DNA as observed for Dammethyltransferase substrate recognition (27) and, in some cases,also an intramolecular conformational change to the protein (22),the DNA (32), or both (7), although these were not addressed inthe current study.
Our study serves as another example of the important role offrustration in biomolecular systems (33, 34). The prevalence offrustration in DBPs results in bimodal association with DNA andsuggests an additional degree of kinetic complexity to the DNAtarget search problem. Clearly, additional factors can enrich thecomplexity of the facilitated diffusion that governs the search(e.g., the existence of roadblock proteins or packing of the DNAby the nucleosomes) that, on the one hand, may result in slowerkinetics but, on the other hand, may introduce functional regula-tion. Zero frustration between specific and nonspecific bindingwould result in sliding that is interrupted by trapping, whereasa high degree of frustration would result in an extremely largebarrier for switching. Accordingly, weak frustration is the optimalscenario for an efficient DNA search.
MethodsCalculation of χ prot. We first calculated χ i for each residue i in the protein asfollows:
χi ¼�∑j0qj0 exp
�−a
rij0
rc
��∕�∑j0exp
�−a
rij0
rc
��[1]
where j0 denotes all the residues having their Cα atom closer than a cutoffdistance of rc ¼ 10 Å to the Cα atom of residue i. qj0 is a point charge of 1, –1,or 0, and rij0 is the Cα–Cα distance between residues i and j0. a ¼ 2 is an ex-ponential decay constant. A χi value approaching 1 is therefore expectedfor residues that are fully surrounded by positively charged residues. Thevalue of χprot is the mean of the χi values for protein residues that belong tothe interface used for specific binding to the DNA.
Simulation Model. The dynamics of sliding along DNA was studied using acoarse-grained model used previously to explore various molecular aspectsof the mechanism of DNA search (20) (see SI Text for more details). We stu-died the interaction of the recognition helix of MAD from the heterodimerMAD-MAX with DNA. To study how it makes the transition from its slidingto specific binding mode, we inserted the specific sequence of the DNA forMAD at the center of the 100-bp DNA molecule. One hundred simulationswere performed for the wild-type and the 150 designed peptide variants(Fig. S2), starting at the exact same initial helix position to allow unified mea-surements for τ1 and τ2 in all of the simulations.
ACKNOWLEDGMENTS. We are grateful to Shula Shazman for assistance withanalyzing positively electrostatic patches of proteins. This work was sup-ported by the Kimmelman Center for Macromolecular Assemblies and theMinerva Foundation with funding from the Federal German Ministry forEducation and Research.
1. von Hippel PH, Berg OG (1989) Facilitated target location in biological systems. J BiolChem 264:675–678.
2. Halford SE, Marko JF (2004) How do site-specific DNA-binding proteins find theirtargets? Nucleic Acids Res 32:3040–3052.
3. Sanchez IE, Ferreiro DU, DellaroleM, de Prat-Gay G (2010) Experimental snapshots of aprotein-DNA binding landscape. Proc Natl Acad Sci USA 107:7751–7756.
4. Lundback T, Hard T (1996) Sequence-specific DNA-binding dominated by dehydration.Proc Natl Acad Sci USA 93:4754–4759.
5. Winkler FK, et al. (1993) The crystal structure of EcoRV endonuclease and of its com-plexes with cognate and non-cognate DNA fragments. EMBO J 12:1781–1795.
6. Viadiu H, Aggarwal AK (2000) Structure of BamHI bound to nonspecific DNA: A modelfor DNA sliding. Mol Cell 5:889–895.
7. Kalodimos CG, et al. (2004) Structure and flexibility adaptation in nonspecific andspecific protein-DNA complexes. Science 305:386–389.
8. Misra VK, Hecht JL, Yang AS, Honig B (1998) Electrostatic contributions to the bindingfree energy of the lambdacI repressor to DNA. Biophys J 75:2262–2273.
9. Record MT, Ha JH, Fisher MA (1991) Analysis of equilibrium and kinetic measurementsto determine thermodynamic origins of stability and specificity and mechanism offormation of site-specific complexes between proteins and helical DNA. MethodsEnzymol 208:291–343.
10. von Hippel PH (2007) From “simple” DNA-protein interactions to the macromolecularmachines of gene expression. Annu Rev Biophys Biomol Struct 36:79–105.
11. Stawiski EW, Gregoret LM, Mandel-Gutfreund Y (2003) Annotating nucleic acid-binding function based on protein structure. J Mol Biol 326:1065–1079.
12. Szilagyi A, Skolnick J (2006) Efficient prediction of nucleic acid binding function fromlow-resolution protein structures. J Mol Biol 358:922–933.
13. Jones S, van Heyningen P, Berman HM, Thornton JM (1999) Protein-DNA interactions:A structural analysis. J Mol Biol 287:877–896.
14. Lamers MH, et al. (2000) The crystal structure of DNA mismatch repair protein MutSbinding to a G · T mismatch. Nature 407:711–717.
15. Kostrewa D, Winkler F (1995) Mg2þ binding to the active site of EcoRV endonuclease:A crystallographic study of complexes with substrate and product DNA at 2A resolu-tion. Biochemistry 34:683–696.
16. Rohs R, et al. (2010) Origins of specificity in protein-DNA recognition. Annu Rev Bio-chem 79:233–269.
17. Luscombe NM, Laskowski RA, Thornton JM (2001) Amino acid-base interactions: Athree-dimensional analysis of protein-DNA interactions at an atomic level. NucleicAcids Res 29:2860–2874.
18. Iwahara J, Zweckstetter M, Clore GM (2006) NMR structural and kinetic characteriza-tion of a homeodomain diffusing and hopping on nonspecific DNA. Proc Natl Acad SciUSA 103:15062–15067.
19. Blainey PC, et al. (2009) Nonspecifically bound proteins spin while diffusing alongDNA. Nat Struct Mol Biol 16:1224–1229.
20. Givaty O, Levy Y (2009) Protein sliding along DNA: Dynamics and structural character-ization. J Mol Biol 385:1087–1097.
21. Liu H, Shi Y, Chen X, Warshel A (2009) Simulating the electrostatic guidance of thevectorial translocations in hexameric helicases and translocases. Proc Natl Acad SciUSA 106:7449–7454.
22. Spolar RS, Record MT, Jr (1994) Coupling of local folding to site-specific binding ofproteins to DNA. Science 263:777–784.
23. Newman M, Strzelecka T, Dorner LF, Schildkraut I, Aggarwal AK (1995) Structure ofBam HI endonuclease bound to DNA: Partial folding and unfolding on DNA binding.Science 269:656–663.
24. Sun J, Viadiu H, Aggarwal AK, Weinstein H (2003) Energetic and structural considera-tions for the mechanism of protein sliding along DNA in the nonspecific BamHI-DNAcomplex. Biophys J 84:3317–3325.
25. Slutsky M, Mirny LA (2004) Kinetics of protein-DNA interaction: Facilitated targetlocation in sequence-dependent potential. Biophys J 87:4021–4035.
26. Friedman JI, Majumdar A, Stivers JT (2009) Nontarget DNA binding shapes thedynamic landscape for enzymatic recognition of DNA damage. Nucleic Acids Res37:3493–3500.
27. Horton JR, Liebert K, Hattman S, Jeltsch A, Cheng XD (2005) Transition from non-specific to specific DNA interactions along the substrate-recognition pathway ofDam methyltransferase. Cell 121:349–361.
28. Chen C, Pettitt M (2011) The binding process of a nonspecific enzyme with DNA.Biophys J 101:1139–1147.
29. Zhou HX (2011) Rapid search for specific sites on DNA through conformational switchof nonspecifically bound proteins. Proc Natl Acad Sci USA 108:8651–8656.
30. Warshel A (1978) Energetics of enzyme catalysis. Proc Natl Acad Sci USA 75:5250–5254.31. Kamerlin S, Sharma P, Chu Z, Warshel A (2010) Ketosteroid isonearse provides further
support for the idea that enzymes work by electrostatic preorganization. Proc NatlAcad Sci USA 107:4075–4080.
32. Bouvier B, Zakrzewska K, Lavery R (2011) Protein-DNA recognition triggered by a DNAconformational switch. Angew Chem Int Ed Engl, in press.
33. Zhuravlev PI, Papoian GA (2010) Protein functional landscapes, dynamics, allostery: Atortuous path towards a universal theoretical framework. Q Rev Biophys 43:295–332.
34. Ferreiro D, Hegler J, Komives E, Wolynes P (2011) On the role of frustration in theenergy landscapes of allosteric proteins. Proc Natl Acad Sci USA 108:3499–3503.
35. Baker NA, Sept D, Joseph S, Holst MJ, McCammon JA (2001) Electrostatics of nano-systems: Application to microtubules and the ribosome. Proc Natl Acad Sci USA98:10037–10041.
17962 ∣ www.pnas.org/cgi/doi/10.1073/pnas.1109594108 Marcovitz and Levy