fruit and nut crops
TRANSCRIPT

Fruit and Nut Crops California Agricultural Statistics Review 2013-2014 56 Fruit and Nut Crops
alifornia accounts for 65 percent of the U.S. non-citrus fruit and nut production and 73 percent of the national value. Of the citrus crops, California accounts for 30 percent of the U.S. citrus production and 42 percent of the national value. In total, the state produced 16.7 million tons of fruit and nuts, 52 percent of the national total, up 1 percent from 2011. The state’s total value of all fruits and nuts in 2012 was $18.7 billion, up 20 percent from 2011.
In 2011, for the first time ever, almonds overtook grapes as the top valued fruit and nut crop in California. In 2012, grapes came back and reclaimed their number one spot, topping $5 billion in production value. Almonds were a close second at over $4.8 billion. California grapes accounted for over 90 percent of the United States utilized grape production in 2012. California is the top raisin producer in the world. Crops with record California production in 2012 were mandarins, pistachios, strawberries, and wine grapes. California accounted for all or nearly all the national production of almonds, dates, figs, kiwifruit, olives, Clingstone peaches, pistachios, dried plums, raisins, and walnuts.
According to the USDA’s Economic Research Service, California continued to be the number one exporter of agricultural commodities in the United States in 2012. Tree nuts were the number one agricultural export for California, followed by fruit and vegetables. Fruit and nut exports accounted for over 50 percent of the value of all California agricultural exports.
The United States is among the top producers and consumers of fruit and tree nuts in the world. The typical American consumes around 286 pounds of fruit and tree nuts (fresh and processed products) each year. Oranges, grapes, apples, and bananas
are the most popular fruit while almonds, walnuts, and pecans are the most preferred tree nuts. Per capita consumption of fruits and tree nuts is the third-largest among major food groups, after dairy products and vegetables.
The nation’s largest fruit producing states are California, Florida and Washington. California accounts for over half of the harvested fruit acreage in the country.
The value of U.S. tree nut production in 2012 was over $7 billion in value, with almonds, walnuts, pistachios and pecans accounting for most of the sales. California is the nation’s number one producer of tree nuts. For almonds and pistachios, California is the number one producer in the world, producing over 80 percent of the world’s almonds and around 40 percent of the world’s pistachios. Almonds are close to $5 billion per year in value, pistachios were well over $1 billion, while walnuts were over $1.5 billion for the first time in 2012. Over 90 percent of the U.S. tree nut production was harvested from Golden State orchards in 2012.
Notable Increases in California Production:
Olives…. .............................................. 125%Avocados…. ........................................... 53%Cherries, Sweet…. ................................. 36%Pecans…. ............................................... 30%Pistachios…. .......................................... 24%Grapes, Wine…. ..................................... 20%
Notable Decreases in California Production:
Plums......................................................28%Kiwifruit .................................................21%Nectarines ..............................................17%Grapes, Raisin ........................................16%
C
Fruit and Nut Crops

Fruit and Nut Crops California Agricultural Statistics Review 2013-2014 57 Fruit and Nut Crops
Harvested Yield Per Acre Production Value Per Unit 1 Total Value
Acres Cwt. Cwt. $/Cwt. $1,000
Blueberries 2 2005 1,900 48 91,000 446.00 40,5832006 2,000 50 100,000 232.00 23,1562007 2,300 72 165,000 183.00 30,2152008 2,500 56 140,000 347.00 48,5802009 3,000 81 242,000 294.00 71,1482010 3,900 72 280,000 271.00 75,9802011 4,300 98 421,000 241.00 101,4612012 4,700 87 409,000 327.00 133,743
Boysenberries 3 2003 200 60 12,000 89.10 1,0692004 300 100 30,000 120.00 3,6002005 110 90 9,900 133.00 1,3202006 110 113 12,400 107.00 1,3232007 110 106 11,700 72.20 8452008 70 76 5,300 72.80 3862009 --- --- --- --- ---2010 --- --- --- --- ---2011 --- --- --- --- ---2012 --- --- --- --- ---
Raspberries 2003 3,000 205 615,000 208.00 127,9202004 4,100 220 900,000 209.00 188,1002005 4,200 240 1,008,000 199.00 200,5922006 3,600 270 972,000 215.00 208,9802007 3,500 225 787,500 288.00 226,8002008 5,400 160 864,000 300.00 259,2002009 5,500 224 1,232,000 290.00 357,0552010 5,400 150 810,000 247.00 200,2882011 5,400 200 1,080,000 207.00 223,2002012 5,400 180 972,000 247.00 239,820
Strawberries, Fresh Market 2003 --- --- 14,377,000 72.80 1,046,6462004 --- --- 14,830,000 62.20 922,4262005 --- --- 15,825,000 62.60 990,6452006 --- --- 16,542,000 65.10 1,076,8842007 --- --- 17,159,000 75.70 1,298,9362008 --- --- 18,605,000 77.30 1,438,1672009 --- --- 20,040,000 79.00 1,583,1602010 --- --- 20,851,000 80.30 1,674,3352011 --- --- 20,462,000 86.10 1,761,7782012 --- --- 21,936,000 88.40 1,939,142
Strawberries, Processing 2003 --- --- 4,715,000 26.70 125,8912004 --- --- 4,758,000 24.90 118,4742005 --- --- 4,755,000 27.80 132,1892006 --- --- 4,621,000 26.50 122,4572007 --- --- 4,381,000 25.50 111,7162008 --- --- 4,070,000 34.40 140,0082009 --- --- 4,816,000 29.50 142,0722010 --- --- 5,008,000 27.80 139,2222011 --- --- 5,384,000 33.80 181,9792012 --- --- 5,701,000 32.00 182,432
Strawberries, All 2003 29,600 645 19,092,000 61.40 1,172,5372004 33,200 590 19,588,000 53.10 1,040,9002005 34,300 600 20,580,000 54.60 1,122,8342006 35,800 590 21,163,000 56.70 1,199,3412007 35,500 605 21,540,000 65.50 1,410,6522008 37,600 605 22,675,000 69.60 1,578,1752009 39,800 625 24,856,000 69.40 1,725,2322010 38,600 670 25,859,000 70.10 1,813,5572011 38,000 680 25,846,000 75.20 1,943,7572012 38,500 720 27,637,000 76.80 2,121,574
3 Estimates discontinued in 2009.
Berry Acreage, Production and Value, 2003-2012Crop Year
Crop
2 Estimates began in 2005.
1 The processed value is based on equivalent returns at the processing plant door. The fresh market value is at the point of first sale.

Fruit and Nut Crops California Agricultural Statistics Review 2013-2014 58 Fruit and Nut Crops
Jan. Feb. Mar. Apr. May June July Aug. Sept. Oct. Nov. Dec.Season
Average
2003 105.00 92.70 71.30 69.50 64.20 58.20 66.60 68.10 86.80 100.00 165.00 --- 72.802004 127.00 120.00 58.00 44.00 54.70 56.20 50.40 65.20 84.00 84.80 164.00 154.00 62.202005 114.00 110.00 62.00 54.00 59.00 55.00 56.00 66.00 70.00 57.00 77.00 154.00 62.602006 96.10 90.10 63.80 59.80 61.80 51.40 64.00 63.70 77.60 72.90 96.10 --- 65.102007 133.00 115.00 88.40 64.20 68.60 66.10 53.00 93.30 57.40 80.00 137.00 162.00 75.702008 185.00 107.00 95.20 65.50 83.30 61.90 65.90 91.00 70.10 72.00 87.60 215.00 77.302009 104.00 122.00 89.30 78.90 76.10 62.80 74.80 73.50 75.00 108.00 87.60 142.00 79.002010 187.00 150.00 88.40 66.90 78.90 67.70 62.00 81.70 73.30 87.60 139.00 206.00 80.302011 154.00 122.00 96.90 93.50 80.80 72.70 89.20 78.90 87.60 66.90 84.40 152.00 86.102012 122.00 115.00 105.00 94.40 82.70 74.40 74.00 85.00 87.60 90.10 139.00 168.00 88.40
$/Cwt
Crop Year
Strawberry Monthly and Season Average Prices Received, 2003-2012 1
1 Prices are average received at point of first sale.
Fruit and Nut Crops California Agricultural Statistics Review 2013-2014 59 Fruit and Nut Crops
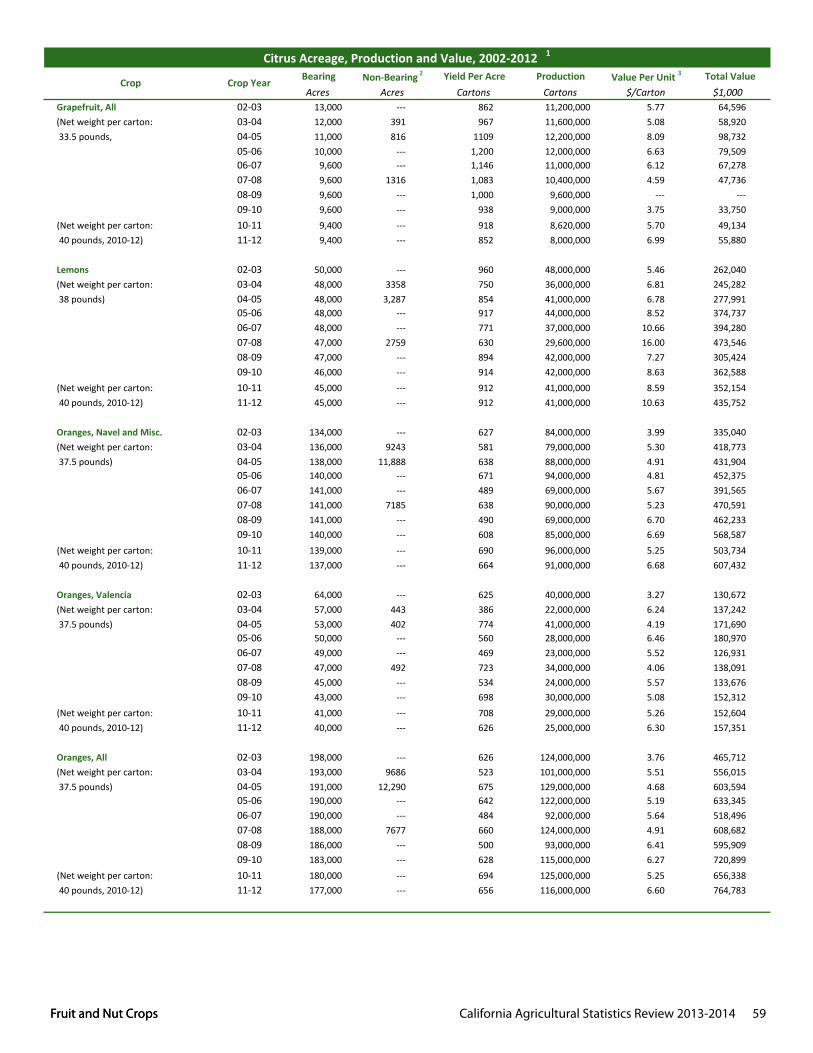
Bearing Non-Bearing 2 Yield Per Acre Production Value Per Unit 3 Total ValueAcres Acres Cartons Cartons $/Carton $1,000
Grapefruit, All 02-03 13,000 --- 862 11,200,000 5.77 64,596(Net weight per carton: 03-04 12,000 391 967 11,600,000 5.08 58,920 33.5 pounds, 04-05 11,000 816 1109 12,200,000 8.09 98,732
05-06 10,000 --- 1,200 12,000,000 6.63 79,50906-07 9,600 --- 1,146 11,000,000 6.12 67,27807-08 9,600 1316 1,083 10,400,000 4.59 47,73608-09 9,600 --- 1,000 9,600,000 --- ---09-10 9,600 --- 938 9,000,000 3.75 33,750
(Net weight per carton: 10-11 9,400 --- 918 8,620,000 5.70 49,134 40 pounds, 2010-12) 11-12 9,400 --- 852 8,000,000 6.99 55,880
Lemons 02-03 50,000 --- 960 48,000,000 5.46 262,040(Net weight per carton: 03-04 48,000 3358 750 36,000,000 6.81 245,282 38 pounds) 04-05 48,000 3,287 854 41,000,000 6.78 277,991
05-06 48,000 --- 917 44,000,000 8.52 374,73706-07 48,000 --- 771 37,000,000 10.66 394,28007-08 47,000 2759 630 29,600,000 16.00 473,54608-09 47,000 --- 894 42,000,000 7.27 305,42409-10 46,000 --- 914 42,000,000 8.63 362,588
(Net weight per carton: 10-11 45,000 --- 912 41,000,000 8.59 352,154 40 pounds, 2010-12) 11-12 45,000 --- 912 41,000,000 10.63 435,752
Oranges, Navel and Misc. 02-03 134,000 --- 627 84,000,000 3.99 335,040(Net weight per carton: 03-04 136,000 9243 581 79,000,000 5.30 418,773 37.5 pounds) 04-05 138,000 11,888 638 88,000,000 4.91 431,904
05-06 140,000 --- 671 94,000,000 4.81 452,37506-07 141,000 --- 489 69,000,000 5.67 391,56507-08 141,000 7185 638 90,000,000 5.23 470,59108-09 141,000 --- 490 69,000,000 6.70 462,23309-10 140,000 --- 608 85,000,000 6.69 568,587
(Net weight per carton: 10-11 139,000 --- 690 96,000,000 5.25 503,734 40 pounds, 2010-12) 11-12 137,000 --- 664 91,000,000 6.68 607,432
Oranges, Valencia 02-03 64,000 --- 625 40,000,000 3.27 130,672(Net weight per carton: 03-04 57,000 443 386 22,000,000 6.24 137,242 37.5 pounds) 04-05 53,000 402 774 41,000,000 4.19 171,690
05-06 50,000 --- 560 28,000,000 6.46 180,97006-07 49,000 --- 469 23,000,000 5.52 126,93107-08 47,000 492 723 34,000,000 4.06 138,09108-09 45,000 --- 534 24,000,000 5.57 133,67609-10 43,000 --- 698 30,000,000 5.08 152,312
(Net weight per carton: 10-11 41,000 --- 708 29,000,000 5.26 152,604 40 pounds, 2010-12) 11-12 40,000 --- 626 25,000,000 6.30 157,351
Oranges, All 02-03 198,000 --- 626 124,000,000 3.76 465,712(Net weight per carton: 03-04 193,000 9686 523 101,000,000 5.51 556,015 37.5 pounds) 04-05 191,000 12,290 675 129,000,000 4.68 603,594
05-06 190,000 --- 642 122,000,000 5.19 633,34506-07 190,000 --- 484 92,000,000 5.64 518,49607-08 188,000 7677 660 124,000,000 4.91 608,68208-09 186,000 --- 500 93,000,000 6.41 595,90909-10 183,000 --- 628 115,000,000 6.27 720,899
(Net weight per carton: 10-11 180,000 --- 694 125,000,000 5.25 656,338 40 pounds, 2010-12) 11-12 177,000 --- 656 116,000,000 6.60 764,783
Citrus Acreage, Production and Value, 2002-2012 1
Crop Crop Year

Fruit and Nut Crops California Agricultural Statistics Review 2013-2014 60 Fruit and Nut Crops
Bearing Non-Bearing 2 Yield Per Acre Production Value Per Unit 3 Total ValueAcres Acres Cartons Cartons $/Carton $1,000
Citrus Acreage, Production and Value, 2002-2012 1
Crop Crop Year
Mandarins and Mandarin 02-03 11,000 --- 509 5,600,000 7.90 44,202Hybrids (Includes Tangelos, 03-04 12,000 7,691 367 4,400,000 7.55 33,222Tangerines and Tangors) 04-05 13,000 11,834 446 5,800,000 9.21 53,432(Net weight per carton: 05-06 15,000 --- 480 7,200,000 8.21 59,134 37.5 pounds) 06-07 19,000 --- 368 7,000,000 11.02 77,152
07-08 23,000 5,707 583 13,400,000 12.58 168,62308-09 27,000 --- 496 13,400,000 --- ---09-10 30,000 --- 660 19,800,000 --- ---
(Net weight per carton: 10-11 33,000 --- 642 21,200,000 --- --- 40 pounds, 2010-12) 11-12 38,000 --- 568 21,600,000 --- ---
3 Equivalent packinghouse door returns.
1 Missing data not published to avoid disclosure of individual operations.2 Non-bearing shown only in year when acreage surveys were conducted.
Fruit and Nut Crops California Agricultural Statistics Review 2013-2014 61 Fruit and Nut Crops
Quantity Value 2 Quantity Value 2 Quantity Value 2
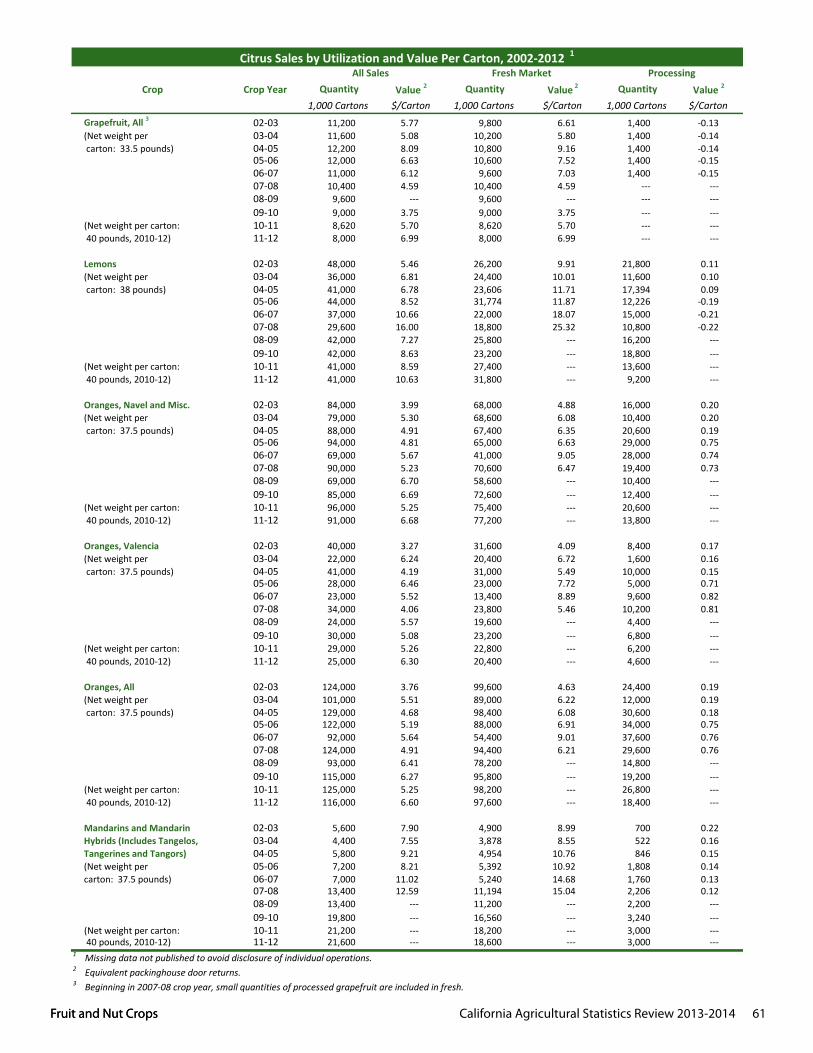
1,000 Cartons $/Carton 1,000 Cartons $/Carton 1,000 Cartons $/CartonGrapefruit, All 3 02-03 11,200 5.77 9,800 6.61 1,400 -0.13(Net weight per 03-04 11,600 5.08 10,200 5.80 1,400 -0.14 carton: 33.5 pounds) 04-05 12,200 8.09 10,800 9.16 1,400 -0.14
05-06 12,000 6.63 10,600 7.52 1,400 -0.1506-07 11,000 6.12 9,600 7.03 1,400 -0.1507-08 10,400 4.59 10,400 4.59 --- ---08-09 9,600 --- 9,600 --- --- ---09-10 9,000 3.75 9,000 3.75 --- ---
(Net weight per carton: 10-11 8,620 5.70 8,620 5.70 --- --- 40 pounds, 2010-12) 11-12 8,000 6.99 8,000 6.99 --- ---
Lemons 02-03 48,000 5.46 26,200 9.91 21,800 0.11(Net weight per 03-04 36,000 6.81 24,400 10.01 11,600 0.10 carton: 38 pounds) 04-05 41,000 6.78 23,606 11.71 17,394 0.09
05-06 44,000 8.52 31,774 11.87 12,226 -0.1906-07 37,000 10.66 22,000 18.07 15,000 -0.2107-08 29,600 16.00 18,800 25.32 10,800 -0.2208-09 42,000 7.27 25,800 --- 16,200 ---09-10 42,000 8.63 23,200 --- 18,800 ---
(Net weight per carton: 10-11 41,000 8.59 27,400 --- 13,600 --- 40 pounds, 2010-12) 11-12 41,000 10.63 31,800 --- 9,200 ---
Oranges, Navel and Misc. 02-03 84,000 3.99 68,000 4.88 16,000 0.20(Net weight per 03-04 79,000 5.30 68,600 6.08 10,400 0.20 carton: 37.5 pounds) 04-05 88,000 4.91 67,400 6.35 20,600 0.19
05-06 94,000 4.81 65,000 6.63 29,000 0.7506-07 69,000 5.67 41,000 9.05 28,000 0.7407-08 90,000 5.23 70,600 6.47 19,400 0.7308-09 69,000 6.70 58,600 --- 10,400 ---09-10 85,000 6.69 72,600 --- 12,400 ---
(Net weight per carton: 10-11 96,000 5.25 75,400 --- 20,600 --- 40 pounds, 2010-12) 11-12 91,000 6.68 77,200 --- 13,800 ---
Oranges, Valencia 02-03 40,000 3.27 31,600 4.09 8,400 0.17(Net weight per 03-04 22,000 6.24 20,400 6.72 1,600 0.16 carton: 37.5 pounds) 04-05 41,000 4.19 31,000 5.49 10,000 0.15
05-06 28,000 6.46 23,000 7.72 5,000 0.7106-07 23,000 5.52 13,400 8.89 9,600 0.8207-08 34,000 4.06 23,800 5.46 10,200 0.8108-09 24,000 5.57 19,600 --- 4,400 ---09-10 30,000 5.08 23,200 --- 6,800 ---
(Net weight per carton: 10-11 29,000 5.26 22,800 --- 6,200 --- 40 pounds, 2010-12) 11-12 25,000 6.30 20,400 --- 4,600 ---
Oranges, All 02-03 124,000 3.76 99,600 4.63 24,400 0.19(Net weight per 03-04 101,000 5.51 89,000 6.22 12,000 0.19 carton: 37.5 pounds) 04-05 129,000 4.68 98,400 6.08 30,600 0.18
05-06 122,000 5.19 88,000 6.91 34,000 0.7506-07 92,000 5.64 54,400 9.01 37,600 0.7607-08 124,000 4.91 94,400 6.21 29,600 0.7608-09 93,000 6.41 78,200 --- 14,800 ---09-10 115,000 6.27 95,800 --- 19,200 ---
(Net weight per carton: 10-11 125,000 5.25 98,200 --- 26,800 --- 40 pounds, 2010-12) 11-12 116,000 6.60 97,600 --- 18,400 ---
Mandarins and Mandarin 02-03 5,600 7.90 4,900 8.99 700 0.22Hybrids (Includes Tangelos, 03-04 4,400 7.55 3,878 8.55 522 0.16Tangerines and Tangors) 04-05 5,800 9.21 4,954 10.76 846 0.15(Net weight per 05-06 7,200 8.21 5,392 10.92 1,808 0.14carton: 37.5 pounds) 06-07 7,000 11.02 5,240 14.68 1,760 0.13
07-08 13,400 12.59 11,194 15.04 2,206 0.1208-09 13,400 --- 11,200 --- 2,200 ---09-10 19,800 --- 16,560 --- 3,240 ---
(Net weight per carton: 10-11 21,200 --- 18,200 --- 3,000 --- 40 pounds, 2010-12) 11-12 21,600 --- 18,600 --- 3,000 ---1 Missing data not published to avoid disclosure of individual operations.2 Equivalent packinghouse door returns.3 Beginning in 2007-08 crop year, small quantities of processed grapefruit are included in fresh.
Citrus Sales by Utilization and Value Per Carton, 2002-2012 1
Crop Crop YearAll Sales Fresh Market Processing

Fruit and Nut Crops California Agricultural Statistics Review 2013-2014 62 Fruit and Nut Crops
Nov. Dec. Jan. Feb. Mar. Apr. May June July Aug. Sept. Oct.Season
Average
Grapefruit, AllFresh Sales 02-03 7.26 7.21 5.91 5.21 3.81 5.26 6.96 7.81 6.56 6.01 9.06 7.41 6.61
03-04 5.75 5.05 5.15 4.45 2.90 4.05 5.60 5.65 5.25 5.45 8.70 6.95 5.8004-05 7.96 6.71 7.41 6.86 6.21 10.51 10.66 10.51 9.76 8.71 10.76 8.76 9.1605-06 6.42 5.52 5.67 4.97 4.62 7.07 9.27 8.02 8.22 8.27 7.82 8.67 7.5206-07 7.03 8.13 7.73 7.68 3.88 5.58 7.43 7.48 7.03 6.73 6.33 7.08 7.0307-08 4.59 4.99 4.64 4.84 3.09 5.54 5.99 4.74 4.19 3.24 4.24 4.44 4.5908-09 2.35 2.85 3.70 3.75 2.55 5.50 4.80 5.05 4.55 4.05 4.80 2.80 ---09-10 3.70 4.75 1.75 3.50 5.70 4.50 4.40 4.25 3.60 2.90 3.90 2.10 3.7510-11 4.85 5.85 7.20 3.20 5.30 7.30 6.25 5.80 5.15 4.60 5.80 4.55 5.7011-12 2.79 3.99 4.89 5.34 6.89 7.69 7.99 8.79 7.69 6.24 6.14 5.64 6.99
Processing 2 02-03 -0.13 -0.13 -0.13 -0.13 -0.13 -0.13 -0.13 -0.13 -0.13 -0.13 -0.13 -0.13 -0.1303-04 -0.14 -0.14 -0.14 -0.14 -0.14 -0.14 -0.14 -0.14 -0.14 -0.14 -0.14 -0.14 -0.1404-05 -0.14 -0.14 -0.14 -0.14 -0.14 -0.14 -0.14 -0.14 -0.14 -0.14 -0.14 -0.14 -0.1405-06 -0.15 -0.15 -0.15 -0.15 -0.15 -0.15 -0.15 -0.15 -0.15 -0.15 -0.15 -0.15 -0.1506-07 -0.15 -0.15 -0.15 -0.15 -0.15 -0.15 -0.15 -0.15 -0.15 -0.15 -0.15 -0.15 -0.1507-08 --- --- --- --- --- --- --- --- --- --- --- --- ---08-09 --- --- --- --- --- --- --- --- --- --- --- --- ---09-10 --- --- --- --- --- --- --- --- --- --- --- --- ---10-11 --- --- --- --- --- --- --- --- --- --- --- --- ---11-12 --- --- --- --- --- --- --- --- --- --- --- --- ---
All Sales 02-03 6.11 6.69 5.35 4.95 3.67 5.10 6.13 6.74 5.55 4.65 8.06 6.22 5.7703-04 4.88 4.71 4.66 4.31 2.73 3.93 4.94 4.88 4.48 4.29 7.88 5.91 5.0804-05 6.69 6.20 6.67 6.56 5.79 10.16 9.38 9.07 8.32 6.87 9.79 7.58 8.1005-06 5.39 5.10 5.09 4.78 4.34 6.85 8.14 6.92 6.97 6.52 7.12 7.54 6.6306-07 5.87 7.44 6.97 7.40 3.59 5.35 6.50 6.45 5.94 5.27 5.74 6.12 6.1207-08 4.59 4.99 4.64 4.84 3.09 5.54 5.99 4.74 4.19 3.24 4.24 4.44 4.5908-09 2.35 2.85 3.70 3.75 2.55 5.50 4.80 5.05 4.55 4.05 4.80 2.80 ---09-10 3.70 4.75 1.75 3.50 5.70 4.50 4.40 4.25 3.60 2.90 3.90 2.10 3.7510-11 4.85 5.85 7.20 3.20 5.30 7.30 6.25 5.80 5.15 4.60 5.80 4.55 5.7011-12 2.79 3.99 4.89 5.34 6.89 7.69 7.99 8.79 7.69 6.24 6.14 5.64 6.99
Aug. Sept. Oct. Nov. Dec. Jan. Feb. Mar. Apr. May June JulySeason
Average
Lemons, AllFresh Sales 02-03 14.81 14.66 13.06 10.91 8.56 7.11 4.96 4.91 8.16 10.31 11.26 11.46 9.91
03-04 11.41 9.46 7.71 7.76 7.21 6.61 7.56 9.46 10.76 11.11 12.31 13.06 10.0104-05 12.76 12.46 11.46 10.86 11.01 10.91 10.36 10.11 11.46 15.96 13.26 12.86 11.7105-06 10.52 9.32 8.57 8.72 9.07 8.37 9.62 10.67 14.57 16.67 16.47 15.77 11.8706-07 16.22 18.27 19.72 15.72 12.17 10.87 21.77 21.57 21.07 20.77 21.82 23.17 18.0707-08 24.47 25.82 26.62 26.72 24.32 25.62 26.32 25.72 24.37 24.97 25.72 24.27 25.3208-09 20.61 17.91 12.56 11.86 9.81 9.86 8.51 7.26 7.16 8.56 11.51 14.21 ---09-10 15.01 16.41 16.86 15.91 14.16 14.11 14.06 13.51 14.31 14.56 14.81 15.36 ---10-11 15.65 15.85 15.65 16.30 12.45 10.50 9.25 9.40 10.35 11.00 11.90 14.15 ---11-12 15.54 14.29 12.79 12.54 12.89 13.64 12.24 11.94 12.44 13.64 14.14 13.29 ---
Processing 02-03 0.11 0.11 0.11 0.11 0.11 0.11 0.11 0.11 0.11 0.11 0.11 0.11 0.1103-04 0.10 0.10 0.10 0.10 0.10 0.10 0.10 0.10 0.10 0.10 0.10 0.10 0.1004-05 0.09 0.09 0.09 0.09 0.09 0.09 0.09 0.09 0.09 0.09 0.09 0.09 0.0905-06 0.08 0.08 -0.20 -0.20 -0.20 -0.20 -0.20 -0.20 -0.20 -0.20 -0.20 -0.20 -0.1906-07 -0.21 -0.21 -0.21 -0.21 -0.21 -0.21 -0.21 -0.21 -0.21 -0.21 -0.21 -0.21 -0.2107-08 -0.22 -0.22 -0.22 -0.22 -0.22 -0.22 -0.22 -0.22 -0.22 -0.22 -0.22 -0.22 -0.2208-09 --- --- --- --- --- --- --- --- --- --- --- --- ---09-10 --- --- --- --- --- --- --- --- --- --- --- --- ---10-11 --- --- --- --- --- --- --- --- --- --- --- --- ---11-12 --- --- --- --- --- --- --- --- --- --- --- --- ---
All Sales 02-03 12.27 11.32 9.49 7.09 5.45 3.91 2.73 2.46 4.45 4.86 5.02 5.25 5.4603-04 8.75 7.37 5.63 5.06 4.09 3.53 4.48 5.93 7.10 8.46 9.71 9.58 6.8204-05 11.54 11.13 10.02 7.74 6.84 6.56 5.73 5.01 5.43 4.69 9.04 7.98 6.7805-06 8.82 7.85 6.62 7.22 6.29 5.12 8.53 7.43 9.40 10.20 11.15 12.10 8.5206-07 13.87 15.96 15.12 14.13 9.69 9.48 17.65 7.86 7.53 7.52 9.23 10.42 10.6607-08 19.53 19.31 19.91 19.98 14.50 14.14 16.84 14.80 14.91 13.12 16.16 15.63 16.0008-09 16.82 15.65 8.30 8.14 6.68 5.95 4.38 3.97 5.15 5.83 8.47 9.49 7.2709-10 8.19 11.68 11.98 11.35 9.88 8.35 7.49 7.45 7.62 7.17 8.50 9.74 8.6310-11 11.44 11.73 13.06 13.11 8.11 7.51 5.21 5.97 7.21 8.24 9.10 10.85 8.5911-12 14.38 11.99 9.35 9.81 10.14 9.80 9.04 9.28 10.77 11.59 11.05 11.64 10.63
Citrus Monthly and Season Average Prices Received, 2002-2012 1
Crop$/Carton
Crop Year
Crop Crop Year$/Carton

Fruit and Nut Crops California Agricultural Statistics Review 2013-2014 63 Fruit and Nut Crops
Nov. Dec. Jan. Feb. Mar. Apr. May June July Aug. Sept. Oct.Season
Average
Citrus Monthly and Season Average Prices Received, 2002-2012 1
Crop$/Carton
Crop Year
Oranges, Navel and Misc.
Fresh Sales 02-03 --- 6.73 5.33 4.03 3.28 4.38 5.48 6.18 7.58 6.43 --- --- 4.8803-04 --- 7.28 6.18 5.43 5.48 6.28 6.18 6.48 7.73 --- --- --- 6.0804-05 12.25 7.70 6.40 5.95 5.65 5.75 6.45 6.90 6.85 --- --- --- 6.3505-06 --- 7.73 6.53 5.78 5.78 5.88 7.03 8.23 11.03 --- --- --- 6.6306-07 7.20 6.00 7.45 7.45 13.60 12.65 12.80 13.95 --- --- --- --- 9.0507-08 10.22 9.02 6.77 6.02 5.42 5.52 5.07 6.42 10.12 --- --- --- 6.4708-09 --- 9.04 7.34 8.39 7.79 7.14 6.54 8.49 11.29 --- ---09-10 --- 10.21 7.86 7.11 6.76 6.66 6.66 8.66 10.31 10.11 --- --- ---10-11 --- 9.03 8.08 7.38 6.03 5.38 5.63 6.68 7.73 --- --- --- ---11-12 --- 9.25 8.00 7.10 6.80 6.70 8.10 9.40 9.55 --- --- --- ---
Processing 02-03 --- 0.20 0.20 0.20 0.20 0.20 0.20 0.20 0.20 0.20 --- --- 0.2003-04 --- 0.20 0.20 0.20 0.20 0.20 0.20 0.20 0.20 --- --- --- 0.2004-05 --- 0.19 0.19 0.19 0.19 0.19 0.19 0.19 0.19 --- --- --- 0.1905-06 --- 0.75 0.75 0.75 0.75 0.75 0.75 0.75 0.75 0.75 --- --- 0.7506-07 0.74 0.74 0.74 0.74 0.74 0.74 0.74 0.74 --- --- --- --- 0.7407-08 0.73 0.73 0.73 0.73 0.73 0.73 0.73 0.73 0.73 --- --- --- 0.7308-09 --- --- --- --- --- --- --- --- --- --- --- --- ---09-10 --- --- --- --- --- --- --- --- --- --- --- --- ---10-11 --- --- --- --- --- --- --- --- --- --- --- --- ---11-12 --- --- --- --- --- --- --- --- --- --- --- --- ---
All Sales 02-03 --- 5.98 4.92 3.48 2.70 3.41 4.24 4.72 5.47 4.36 --- --- 3.9903-04 --- 6.43 5.77 4.94 4.91 5.45 4.90 5.10 6.89 --- --- --- 5.3004-05 12.25 6.74 5.55 4.95 4.49 4.31 4.29 4.67 4.63 --- --- --- 4.9105-06 --- 6.57 5.46 4.64 4.23 4.17 4.69 5.26 5.55 0.75 --- --- 4.8206-07 5.76 5.41 6.59 6.56 3.37 6.79 6.00 3.47 --- --- --- --- 5.6807-08 8.95 7.81 5.92 5.30 4.44 4.37 3.83 4.57 7.18 --- --- --- 5.2308-09 --- 8.16 6.41 7.43 6.94 6.10 5.43 6.62 8.77 --- --- --- 6.7009-10 --- 9.43 7.25 6.36 5.88 5.96 5.64 6.96 8.10 8.81 --- --- 6.6910-11 --- 8.53 6.80 6.43 4.77 4.10 4.04 4.32 5.32 --- --- --- 5.2811-12 --- 7.78 7.13 6.15 5.46 5.72 6.90 8.66 8.04 --- --- --- 6.68
Feb. Mar. Apr. May June July Aug. Sept. Oct. Nov. Dec. Jan. Season Average
Oranges, ValenciaFresh Sales 02-03 5.04 4.79 5.19 4.54 3.79 3.69 4.04 3.69 3.64 --- --- --- 4.09
03-04 4.77 5.87 5.37 5.72 6.37 6.02 6.72 8.92 11.47 --- --- --- 6.7204-05 6.39 5.60 5.35 5.46 5.07 4.28 3.10 3.37 2.81 --- --- --- 5.4905-06 5.87 5.52 6.22 6.12 6.82 7.72 8.67 12.27 10.77 --- --- --- 7.7206-07 13.54 10.19 11.24 10.99 10.29 9.69 8.59 7.69 6.09 4.69 --- --- 8.8907-08 --- 5.06 5.16 5.21 5.06 5.16 5.16 6.41 6.36 6.36 --- --- 5.4608-09 --- 6.68 5.83 5.58 5.78 6.58 6.83 --- --- --- --- --- ---09-10 --- --- --- --- 6.14 5.99 5.99 5.99 5.99 5.99 --- --- ---10-11 --- --- --- 6.18 6.18 6.13 6.58 6.93 6.78 --- --- --- ---11-12 --- --- --- 7.95 7.55 6.75 6.35 7.50 7.30 --- --- --- ---
Processing 02-03 --- 0.17 0.17 0.17 0.17 0.17 0.17 0.17 0.17 --- --- --- 0.1703-04 --- 0.16 0.16 0.16 0.16 0.16 0.16 --- --- --- --- --- 0.1604-05 --- 0.15 0.15 0.15 0.15 0.15 0.15 0.15 0.15 --- --- --- 0.1505-06 --- --- 0.71 0.71 0.71 0.71 0.71 0.71 0.71 --- --- --- 0.7106-07 0.82 0.82 0.82 0.82 0.82 0.82 0.82 0.82 0.82 0.82 --- --- 0.8207-08 --- 0.81 0.81 0.81 0.81 0.81 0.81 0.81 0.81 0.81 --- --- 0.8108-09 --- --- --- --- --- --- --- --- --- --- --- --- ---09-10 --- --- --- --- --- --- --- --- --- --- --- --- ---10-11 --- --- --- --- --- --- --- --- --- --- --- --- ---11-12 --- --- --- --- --- --- --- --- --- --- --- --- ---
All Sales 02-03 5.04 4.33 4.88 4.15 3.35 2.99 3.08 2.72 2.14 --- --- --- 3.2703-04 4.77 5.30 4.85 5.35 5.71 5.37 6.33 8.92 11.47 --- --- --- 6.2404-05 6.39 6.44 6.39 5.99 5.64 4.84 4.64 5.29 5.14 --- --- --- 4.1905-06 5.87 5.52 5.76 5.34 5.48 5.71 7.08 10.23 8.76 --- --- --- 6.4706-07 7.18 5.51 7.07 6.24 6.08 5.55 5.76 5.19 3.83 2.76 --- --- 5.5207-08 --- 4.35 4.58 4.63 3.89 4.07 3.46 4.26 3.28 4.51 --- --- 4.0608-09 --- 5.99 5.22 5.08 4.46 5.36 5.67 --- --- --- --- --- 5.5709-10 --- --- --- --- 5.24 4.83 4.79 4.79 4.83 4.18 --- --- 5.0810-11 --- --- --- 4.94 4.97 5.03 5.28 5.03 5.46 --- --- --- ---11-12 --- --- --- 7.35 6.73 5.93 5.40 5.80 6.04 --- --- --- 6.30
Crop Crop Year$/Carton

Fruit and Nut Crops California Agricultural Statistics Review 2013-2014 64 Fruit and Nut Crops
Nov. Dec. Jan. Feb. Mar. Apr. May June July Aug. Sept. Oct.Season
Average
Citrus Monthly and Season Average Prices Received, 2002-2012 1
Crop$/Carton
Crop Year
Mandarine &Mandarin Hybrids 3
Fresh Sales 02-03 14.94 11.89 9.69 8.99 7.74 7.89 9.24 8.69 --- --- --- --- 8.9903-04 17.05 12.55 10.60 9.15 7.60 8.05 8.50 -1.76 --- --- --- --- 8.5504-05 17.31 14.11 12.11 9.66 9.66 9.66 11.31 9.56 --- --- --- --- 10.7605-06 15.92 15.47 12.62 9.02 9.07 9.17 8.97 5.67 --- --- --- --- 10.9206-07 22.13 17.68 14.58 11.88 12.38 14.88 16.18 --- --- --- --- --- 14.6807-08 18.54 16.44 14.19 13.54 14.14 15.14 --- --- --- --- --- --- 15.0408-09 19.40 19.40 12.10 14.05 --- --- --- --- --- --- --- --- ---09-10 --- --- --- --- --- --- --- --- --- --- --- --- ---10-11 --- --- --- --- --- --- --- --- --- --- --- --- ---11-12 --- --- --- --- --- --- --- --- --- --- --- --- ---
Processing 02-03 --- 0.36 0.36 0.36 0.17 0.17 0.17 0.17 --- --- --- --- 0.2203-04 --- 0.16 0.16 0.16 0.16 0.16 0.16 --- --- --- --- --- 0.1604-05 0.15 0.15 0.15 0.15 0.15 0.15 0.15 --- --- --- --- --- 0.1505-06 --- 0.14 0.14 0.14 0.14 0.14 0.14 0.14 --- --- --- --- 0.1406-07 0.13 0.13 0.13 0.13 0.13 0.13 0.13 --- --- --- --- --- 0.1307-08 --- 0.12 0.12 0.12 0.12 0.12 0.12 --- --- --- --- --- 0.1208-09 0.11 0.11 0.11 0.11 0.11 0.11 0.11 --- --- --- --- --- ---09-10 --- --- --- --- --- --- --- --- --- --- --- --- ---10-11 --- --- --- --- --- --- --- --- --- --- --- --- ---11-12 --- --- --- --- --- --- --- --- --- --- --- --- ---
All Sales 02-03 14.94 10.93 8.97 8.33 6.69 6.70 7.45 7.88 --- --- --- --- 7.9003-04 17.05 11.39 9.28 8.04 6.65 7.00 7.73 -1.76 --- --- --- --- 7.5504-05 16.71 12.21 11.30 7.98 8.05 8.08 10.79 9.56 --- --- --- --- 9.2105-06 15.92 12.63 11.23 6.89 7.25 6.25 3.96 2.35 --- --- --- --- 8.2206-07 17.73 14.17 12.31 8.83 9.01 8.25 8.69 --- --- --- --- --- 11.0207-08 --- 16.59 14.85 11.94 11.31 11.66 11.01 --- --- --- --- --- 12.5908-09 16.35 16.55 10.92 11.79 13.20 9.89 9.35 --- --- --- --- --- ---09-10 --- --- --- --- --- --- --- --- --- --- --- --- ---10-11 --- --- --- --- --- --- --- --- --- --- --- --- ---11-12 --- --- --- --- --- --- --- --- --- --- --- --- ---
1 Missing data not published to avoid disclosure of individual operations.2 Beginning in 2007-08 crop year, small quantities of processed grapefruit are included in fresh.3 Includes tangelos, tangerines and tangors.
Year Apricots Figs Grapes, Raisin Grapes, Table Peaches, Freestone Pears, Bartlett Plums, Dried
2003 7.56 3.00 4.54 4.52 9.49 6.56 3.192004 7.24 3.00 3.99 3.94 11.95 6.45 2.942005 8.46 3.00 4.60 4.61 10.95 6.75 3.052006 8.59 3.00 4.60 4.62 10.16 --- 3.202007 6.60 3.00 4.50 4.67 9.30 --- 2.902008 7.65 3.00 4.80 4.79 9.05 --- 2.852009 8.26 3.00 4.50 4.56 8.35 --- 2.992010 7.14 3.00 4.50 4.53 6.32 --- 3.002011 6.63 3.00 4.70 4.74 9.79 --- 3.242012 7.85 3.00 4.70 4.75 7.97 --- 3.16
Drying Ratio -- Tons of Green Fruit Required to Produce One Dried Ton

Fruit and Nut Crops California Agricultural Statistics Review 2013-2014 65 Fruit and Nut Crops
Bearing Non-Bearing 1 Yield Per Acre Production Value Per Unit 2 Total Value
Acres Acres Tons Tons $/Ton $1,000Apples 2003 28,000 --- 8.1 225,000 356.00 78,190
2004 26,000 --- 8.1 177,500 298.00 52,9752005 24,000 --- 7.4 177,500 420.00 74,7182006 21,000 --- 8.5 177,500 480.00 85,0682007 20,500 --- 8.4 172,500 526.00 90,7692008 19,500 --- 9.3 180,000 610.00 109,7082009 19,000 --- 7.0 132,500 470.00 62,2282010 18,000 --- 7.8 140,000 414.00 57,8202011 17,500 --- 8.0 140,000 430.00 57,9752012 17,500 --- 8.6 150,000 518.00 77,750
Apricots 2003 15,200 --- 6.1 92,500 316.00 29,2212004 13,500 --- 7.0 94,000 334.00 28,5752005 12,600 --- 6.0 75,500 481.00 33,9302006 11,700 --- 3.3 39,000 593.00 23,1282007 11,300 --- 7.2 81,000 431.00 34,8782008 11,100 --- 6.9 77,000 472.00 34,4042009 11,000 --- 5.4 59,500 621.00 36,9352010 10,800 --- 5.6 60,200 679.00 40,8602011 10,800 --- 5.8 62,550 539.00 33,7052012 10,800 --- 5.0 53,800 600.00 32,260
Avocados 02-03 59,500 --- 2.8 168,000 2,170.00 364,56003-04 60,500 --- 3.6 216,000 1,760.00 380,16004-05 62,000 --- 2.4 151,000 1,830.00 276,33005-06 62,100 --- 4.8 300,000 1,140.00 342,00006-07 65,000 --- 2.0 132,000 1,890.00 249,48007-08 66,000 --- 2.5 165,000 1,990.00 328,35008-09 65,000 --- 1.4 88,000 2,280.00 200,64009-10 58,500 --- 4.7 274,800 1,510.00 414,94810-11 52,200 --- 2.9 151,500 3,040.00 460,56011-12 52,200 --- 4.4 231,500 1,650.00 381,975
Cherries, Sweet 2003 25,000 --- 2.6 65,600 1,670.00 106,8832004 25,000 --- 2.9 73,000 1,750.00 123,1562005 25,000 --- 2.1 52,700 1,740.00 84,7512006 26,000 --- 1.6 42,100 3,090.00 124,3912007 26,000 --- 3.3 85,000 1,900.00 155,0162008 27,000 --- 3.2 86,000 2,350.00 194,5342009 28,000 --- 3.3 92,000 2,540.00 225,8652010 29,000 --- 3.3 97,000 2,750.00 258,7152011 30,000 --- 2.3 68,000 2,990.00 197,2502012 31,000 --- 3.0 92,300 2,890.00 257,772
Dates 2003 5,200 --- 3.5 18,000 1,380.00 24,8402004 5,500 --- 3.1 17,200 1,310.00 22,5322005 5,700 --- 3.0 17,200 1,430.00 24,5962006 5,500 --- 3.2 17,700 2,140.00 37,8782007 5,300 --- 3.1 16,300 2,290.00 37,3272008 5,700 --- 3.7 20,900 1,260.00 26,3342009 6,700 --- 3.5 23,700 1,180.00 27,9662010 7,700 --- 3.7 28,300 1,200.00 33,9602009 6,700 --- 3.5 23,700 1,180.00 27,9662010 7,700 --- 3.8 29,000 1,270.00 36,8302011 8,400 --- 4.0 33,300 1,320.00 43,9562012 8,400 --- 3.7 31,100 1,340.00 41,674
Non-Citrus Fruit Acreage, Production and Value, 2003-2012
CropCrop Year

Fruit and Nut Crops California Agricultural Statistics Review 2013-2014 66 Fruit and Nut Crops
Bearing Non-Bearing 1 Yield Per Acre Production Value Per Unit 2 Total Value
Acres Acres Tons Tons $/Ton $1,000
Non-Citrus Fruit Acreage, Production and Value, 2003-2012
Crop Crop Year
Figs 2003 13,000 --- 3.7 48,500 317.00 15,3732004 12,600 --- 4.1 51,100 396.00 20,2142005 12,000 --- 4.1 49,000 404.00 19,8072006 10,300 --- 4.2 42,800 426.00 18,2532007 9,100 --- 5.3 47,800 401.00 19,1452008 9,400 --- 4.6 43,300 599.00 25,9542009 9,300 --- 4.7 43,750 695.00 30,4222010 8,600 --- 4.8 40,910 542.00 22,1852011 8,600 --- 4.5 38,660 526.00 20,3362012 8,600 --- 4.5 38,660 --- ---
Grapes, Raisin 3,4 2003 255,000 5,000 8.7 2,220,000 170.00 374,1672004 244,000 4,000 8.4 2,038,000 306.00 624,6002005 240,000 6,000 9.5 2,285,000 261.00 597,4562006 234,000 6,000 7.8 1,833,000 277.00 507,8932007 227,000 6,000 9.5 2,151,000 278.00 597,6002008 221,000 4,000 11.4 2,520,000 265.00 668,5552009 216,000 3,000 9.0 1,938,000 290.00 561,0822010 210,000 3,000 10.2 2,133,000 343.00 731,6302011 205,000 4,000 11.0 2,263,000 382.00 863,7162012 200,000 3,000 9.6 1,912,000 --- ---
Grapes, Table 4 2003 85,000 8,000 8.6 732,000 601.00 407,6072004 83,000 9,000 9.3 770,000 695.00 535,0092005 83,000 10,000 10.5 872,000 442.00 385,1162006 83,000 10,000 8.6 717,000 898.00 643,7772007 82,000 10,000 9.7 791,000 787.00 622,8942008 83,000 10,000 11.7 973,000 405.00 394,5212009 84,000 9,000 10.4 876,000 463.00 405,9742010 85,000 9,000 11.9 1,011,000 382.00 386,5242011 85,000 11,000 12.1 1,032,000 809.00 834,9672012 85,000 13,000 11.6 986,000 1,202.00 1,185,458
Grapes, Wine 2003 479,000 50,000 6.1 2,909,000 530.00 1,542,8762004 473,000 40,000 6.0 2,815,000 570.00 1,604,9252005 477,000 45,000 8.0 3,806,000 582.00 2,215,2482006 480,000 47,000 6.6 3,176,000 582.00 1,848,2882007 480,000 43,000 6.9 3,288,000 564.00 1,855,1202008 482,000 44,000 6.3 3,055,000 609.00 1,859,1502009 489,000 42,000 7.7 3,743,000 613.00 2,293,1162010 497,000 38,000 7.3 3,629,000 576.00 2,090,8862011 506,000 37,000 6.7 3,387,000 638.00 2,160,5192012 508,000 38,000 8.0 4,058,000 --- ---
Grapes, All 3,5 2003 819,000 63,000 7.2 5,861,000 402.00 2,324,6502004 800,000 53,000 7.0 5,623,000 492.00 2,764,5342005 800,000 61,000 8.7 6,963,000 459.00 3,197,8202006 797,000 63,000 7.2 5,726,000 524.00 2,999,9582007 789,000 59,000 7.9 6,230,000 494.00 3,075,6142008 786,000 58,000 8.3 6,548,000 446.00 2,922,2262009 789,000 54,000 8.3 6,557,000 497.00 3,260,1722010 792,000 50,000 8.6 6,773,000 474.00 3,209,0402011 796,000 52,000 8.4 6,682,000 578.00 3,859,2022012 793,000 54,000 8.8 6,956,000 741.00 5,156,064
Bearing Non-Bearing 1 Yield Per Acre Production Value Per Unit 2 Total Value
Acres Acres Tons Tons $/Ton $1,000
Non-Citrus Fruit Acreage, Production and Value, 2003-2012
CropCrop Year
Figs 2003 13,000 --- 3.7 48,500 317.00 15,3732004 12,600 --- 4.1 51,100 396.00 20,2142005 12,000 --- 4.1 49,000 404.00 19,8072006 10,300 --- 4.2 42,800 426.00 18,2532007 9,100 --- 5.3 47,800 401.00 19,1452008 9,400 --- 4.6 43,300 599.00 25,9542009 9,300 --- 4.7 43,750 695.00 30,4222010 8,600 --- 4.8 40,910 542.00 22,1852011 8,600 --- 4.5 38,660 526.00 20,3362012 8,600 --- 4.5 38,660 --- ---
Grapes, Raisin 3,4 2003 255,000 5,000 8.7 2,220,000 170.00 374,1672004 244,000 4,000 8.4 2,038,000 306.00 624,6002005 240,000 6,000 9.5 2,285,000 261.00 597,4562006 234,000 6,000 7.8 1,833,000 277.00 507,8932007 227,000 6,000 9.5 2,151,000 278.00 597,6002008 221,000 4,000 11.4 2,520,000 265.00 668,5552009 216,000 3,000 9.0 1,938,000 290.00 561,0822010 210,000 3,000 10.2 2,133,000 343.00 731,6302011 205,000 4,000 11.0 2,263,000 382.00 863,7162012 200,000 3,000 9.6 1,912,000 --- ---
Grapes, Table 4 2003 85,000 8,000 8.6 732,000 601.00 407,6072004 83,000 9,000 9.3 770,000 695.00 535,0092005 83,000 10,000 10.5 872,000 442.00 385,1162006 83,000 10,000 8.6 717,000 898.00 643,7772007 82,000 10,000 9.7 791,000 787.00 622,8942008 83,000 10,000 11.7 973,000 405.00 394,5212009 84,000 9,000 10.4 876,000 463.00 405,9742010 85,000 9,000 11.9 1,011,000 382.00 386,5242011 85,000 11,000 12.1 1,032,000 809.00 834,9672012 85,000 13,000 11.6 986,000 1,202.00 1,185,458
Grapes, Wine 2003 479,000 50,000 6.1 2,909,000 530.00 1,542,8762004 473,000 40,000 6.0 2,815,000 570.00 1,604,9252005 477,000 45,000 8.0 3,806,000 582.00 2,215,2482006 480,000 47,000 6.6 3,176,000 582.00 1,848,2882007 480,000 43,000 6.9 3,288,000 564.00 1,855,1202008 482,000 44,000 6.3 3,055,000 609.00 1,859,1502009 489,000 42,000 7.7 3,743,000 613.00 2,293,1162010 497,000 38,000 7.3 3,629,000 576.00 2,090,8862011 506,000 37,000 6.7 3,387,000 638.00 2,160,5192012 508,000 38,000 8.0 4,058,000 --- ---
Grapes, All 3,5 2003 819,000 63,000 7.2 5,861,000 402.00 2,324,6502004 800,000 53,000 7.0 5,623,000 492.00 2,764,5342005 800,000 61,000 8.7 6,963,000 459.00 3,197,8202006 797,000 63,000 7.2 5,726,000 524.00 2,999,9582007 789,000 59,000 7.9 6,230,000 494.00 3,075,6142008 786,000 58,000 8.3 6,548,000 446.00 2,922,2262009 789,000 54,000 8.3 6,557,000 497.00 3,260,1722010 792,000 50,000 8.6 6,773,000 474.00 3,209,0402011 796,000 52,000 8.4 6,682,000 578.00 3,859,2022012 793,000 54,000 8.8 6,956,000 741.00 5,156,064

Fruit and Nut Crops California Agricultural Statistics Review 2013-2014 67 Fruit and Nut Crops
Bearing Non-Bearing 1 Yield Per Acre Production Value Per Unit 2 Total Value
Acres Acres Tons Tons $/Ton $1,000
Non-Citrus Fruit Acreage, Production and Value, 2003-2012
CropCrop Year
Kiwifruit 2003 4,500 --- 5.6 25,400 853.00 20,4722004 4,500 --- 5.9 26,700 809.00 19,9772005 4,500 --- 8.3 37,200 620.00 22,4612006 4,200 --- 6.2 26,100 911.00 23,1482007 4,200 --- 5.8 24,500 950.00 22,5172008 4,200 --- 5.5 23,000 888.00 19,5452009 4,200 --- 6.1 25,600 847.00 21,0842010 4,200 --- 7.8 32,700 768.00 24,9612011 4,200 --- 9.0 37,700 775.00 28,4392012 4,200 --- 7.1 29,600 --- ---
Nectarines 2003 35,500 --- 7.7 273,000 436.00 119,0282004 35,000 --- 7.7 269,000 342.00 86,1842005 34,000 --- 7.0 239,000 504.00 120,4562006 33,000 --- 6.6 218,000 517.00 112,7062007 31,000 --- 8.7 269,000 331.00 89,0392008 31,000 --- 9.5 295,000 365.00 107,6752009 29,000 --- 7.2 210,000 637.00 133,7702010 28,000 --- 8.0 225,000 560.00 126,0002011 26,500 --- 8.2 216,000 590.00 127,4402012 25,000 --- 7.2 180,000 777.00 139,860
Olives 2003 36,000 --- 3.3 118,000 409.00 48,2892004 32,000 --- 3.4 107,500 564.00 60,6432005 32,000 --- 4.4 142,000 564.00 80,0972006 31,000 --- 0.8 23,500 771.00 18,1192007 30,000 --- 4.4 132,500 654.00 86,6942008 30,000 --- 2.2 66,800 697.00 46,5872009 31,000 --- 1.5 46,300 696.00 32,2092010 36,000 --- 5.7 206,000 664.00 136,7962011 41,500 --- 1.7 71,200 733.00 52,1682012 44,000 --- 3.6 160,000 813.00 130,038
Peaches, Clingstone 2003 31,000 --- 17.3 536,000 215.00 108,4842004 32,000 --- 16.8 539,000 263.00 141,4942005 30,400 --- 15.9 484,000 254.00 122,9392006 27,000 --- 13.3 359,000 292.00 104,8462007 26,500 --- 19.0 503,000 304.00 152,6652008 25,000 --- 17.0 426,000 347.00 147,8572009 24,500 --- 19.1 469,000 338.00 158,4522010 23,000 --- 18.8 432,000 325.00 140,3682011 22,500 --- 17.5 393,000 303.00 119,1782012 23,000 --- 16.0 369,000 348.00 128,397
Peaches, Freestone 2003 36,000 --- 11.5 413,000 336.00 138,7462004 35,000 --- 12.5 436,000 281.00 109,7602005 33,000 --- 11.7 385,000 408.00 157,0482006 32,000 --- 11.0 353,000 469.00 165,5622007 31,000 --- 14.4 446,000 402.00 179,1752008 31,000 --- 14.0 433,000 339.00 146,6922009 28,000 --- 12.5 350,000 480.00 167,8792010 27,000 --- 14.3 385,000 386.00 148,7282011 25,000 --- 15.2 380,000 447.00 170,0192012 24,000 --- 14.3 344,000 588.00 202,297

Fruit and Nut Crops California Agricultural Statistics Review 2013-2014 68 Fruit and Nut Crops
Bearing Non-Bearing 1 Yield Per Acre Production Value Per Unit 2 Total Value
Acres Acres Tons Tons $/Ton $1,000
Non-Citrus Fruit Acreage, Production and Value, 2003-2012
CropCrop Year
Peaches, All 2003 67,000 --- 14.2 949,000 269.00 247,2302004 67,000 --- 14.6 975,000 270.00 251,2542005 63,400 --- 13.7 869,000 322.00 279,9872006 59,000 --- 12.1 712,000 380.00 270,4082007 57,500 --- 16.5 949,000 350.00 331,8402008 56,000 --- 15.3 859,000 343.00 294,5492009 52,500 --- 15.6 819,000 398.00 326,3312010 50,000 --- 16.3 817,000 354.00 289,0962011 47,500 --- 16.3 773,000 374.00 289,1972012 47,000 --- 15.2 713,000 464.00 330,694
Pears, Bartlett 2003 13,000 --- 16.7 217,000 216.00 46,8502004 13,000 --- 17.2 223,000 252.00 56,2882005 12,000 --- 13.8 166,000 297.00 49,3342006 12,000 --- 16.6 199,000 237.00 44,7092007 11,000 --- 18.3 201,000 289.00 58,0982008 11,000 --- 17.7 195,000 373.00 72,7482009 10,000 --- 20.0 200,000 351.00 70,1032010 10,000 --- 17.0 170,000 379.00 64,3802011 10,000 --- 19.5 195,000 311.00 60,7092012 10,000 --- 16.5 165,000 371.00 61,1822011 10,000 --- 19.5 195,000 311.00 60,709
Pears, Other 2003 4,300 --- 12.8 55,000 300.00 16,5262004 4,000 --- 12.0 48,000 503.00 24,1442005 4,000 --- 9.0 36,000 846.00 30,4562006 4,000 --- 10.0 40,000 589.00 23,5602007 4,000 --- 10.5 42,000 586.00 24,5932008 4,000 --- 12.0 48,000 689.00 33,0912009 4,000 --- 13.8 55,000 422.00 23,2262010 4,000 --- 12.5 50,000 626.00 31,3102011 4,000 --- 14.3 57,000 651.00 37,0962012 4,000 --- 12.5 50,000 656.00 32,795
Pears, All 2003 17,300 --- 15.7 272,000 233.00 63,3762004 17,000 --- 15.9 271,000 297.00 80,4322005 16,000 --- 12.6 202,000 395.00 79,7902006 16,000 --- 14.9 239,000 298.00 68,2692007 15,000 --- 16.2 243,000 340.00 82,6912008 15,000 --- 16.2 243,000 436.00 105,8392009 14,000 --- 18.2 255,000 366.00 93,3292010 14,000 --- 15.7 220,000 435.00 95,6902011 14,000 --- 18.0 252,000 388.00 97,8052012 14,000 --- 15.4 215,000 437.00 93,977
Plums 2003 35,000 --- 6.0 209,000 418.00 87,3622004 33,500 --- 4.7 156,000 516.00 74,3472005 32,000 --- 5.3 171,000 541.00 92,4632006 31,000 --- 5.1 158,000 688.00 108,6482007 29,500 --- 5.2 152,000 665.00 101,0772008 29,500 --- 5.4 160,000 356.00 56,9602009 26,600 --- 4.2 112,000 514.00 57,5682010 26,200 --- 5.4 141,300 555.00 78,4222011 25,500 --- 6.3 160,000 402.00 64,3202012 25,000 --- 4.6 115,000 695.00 79,940

Fruit and Nut Crops California Agricultural Statistics Review 2013-2014 69 Fruit and Nut Crops
Bearing Non-Bearing 1 Yield Per Acre Production Value Per Unit 2 Total Value
Acres Acres Tons Tons $/Ton $1,000
Non-Citrus Fruit Acreage, Production and Value, 2003-2012
CropCrop Year
Plums, Dried 5 2003 72,000 8,000 2.5 181,000 772.00 129,6962004 70,000 --- 0.7 49,000 1,500.00 72,0002005 67,000 7,500 1.5 97,000 1,470.00 138,1802006 65,000 7500 3.1 198,000 1,390.00 262,7102007 64,000 7,500 1.3 83,000 1,450.00 117,4502008 64,000 --- 2.0 129,000 1,500.00 193,5002009 64,000 --- 2.6 166,000 1,230.00 204,1802010 61,000 --- 2.1 130,000 1,350.00 175,5002011 58,000 --- 2.4 137,000 1,310.00 179,4702012 55,000 --- 2.5 138,000 1,330.00 183,540
Miscellaneous 2003 29,000 --- --- 169,000 --- 95,085Fruits and Nuts 6 2004 23,000 --- --- 125,000 --- 88,577
2005 29,000 --- --- 178,000 --- 127,0382006 34,000 --- --- 190,000 --- 146,3792007 35,000 --- --- 197,000 --- 156,3612008 42,000 --- --- 259,000 --- 188,8912009 45,000 --- --- 260,000 --- 204,9522010 63,000 --- --- 396,000 --- 329,3532011 45,000 --- --- 279,000 --- 262,9292012 39,000 --- --- 241,000 --- 266,780
1 Non-bearing shown only in year when acreage surveys were conducted.2 Return at processing plant door or packinghouse door.3 Acres of raisin type grapes enrolled in the California Raisin Industry Diversion (RID) program were; 1998-2000 - zero; 2001 - 41,000; 2002 - 27,000; 2003-2010 - zero. These acres were deducted from bearing acres before calculating yield.4 Production is the fresh equivalent of dried and not dried.5 Acreage by county, variety and year of planting for 2007 are available upon request.6 These crops are apricot-plum crosses (aprium, plumcot, pluots), black walnuts, chayotes, cherimoyas, chestnuts, feijoas, guavas, jojobas, jujubes, kumquats, limes, loquats, Macadamia nuts, persimmons, pomegranates, prickly pears, quince, citrus by-products, and orchard biomass.
Crop 2003 2004 2005 2006 2007 2008 2009 2010 2011 2012
Apples --- --- --- --- --- --- --- --- 5,000 ---Apricots --- 8,500 5,000 --- --- 4,100 --- --- --- ---Grapes 75,000 --- --- --- --- --- --- --- --- ---Nectarines --- 2,000 --- --- --- --- --- --- --- ---Peaches, Freestone --- 2,000 --- --- --- --- --- --- --- ---Pears, Bartlett --- --- --- 10,000 --- --- --- --- --- ---Plums --- 1,000 --- --- --- --- --- --- --- ---Plums, Dried --- --- --- 3,000 500 --- --- --- --- ---
Apples 5,000 --- --- --- --- --- --- --- --- ---Cherries, Sweet 1,700 2,700 4,100 1,900 3,200 3,200 3,000 3,000 2,000 3,000Kiwifruit 1,400 2,000 1,000 700 800 1,000 700 200 1,000 2,500Nectarines --- 15,000 --- --- --- --- --- --- --- ---Peaches, Clingstone --- 44,000 --- --- --- --- --- --- --- ---Peaches, Freestone 30,500 --- --- --- --- --- --- --- --- ---Plums --- 11,000 --- --- --- --- --- --- --- ---Plums, Dried 13,000 1,000 3,000 6,000 1,500 --- --- --- --- ---
Non-Citrus Fruit Unutilized Production, 2003-2012
Harvested Tons Not Sold
Unharvested Tons
Fruit and Nut Crops California Agricultural Statistics Review 2013-2014 70 Fruit and Nut Crops
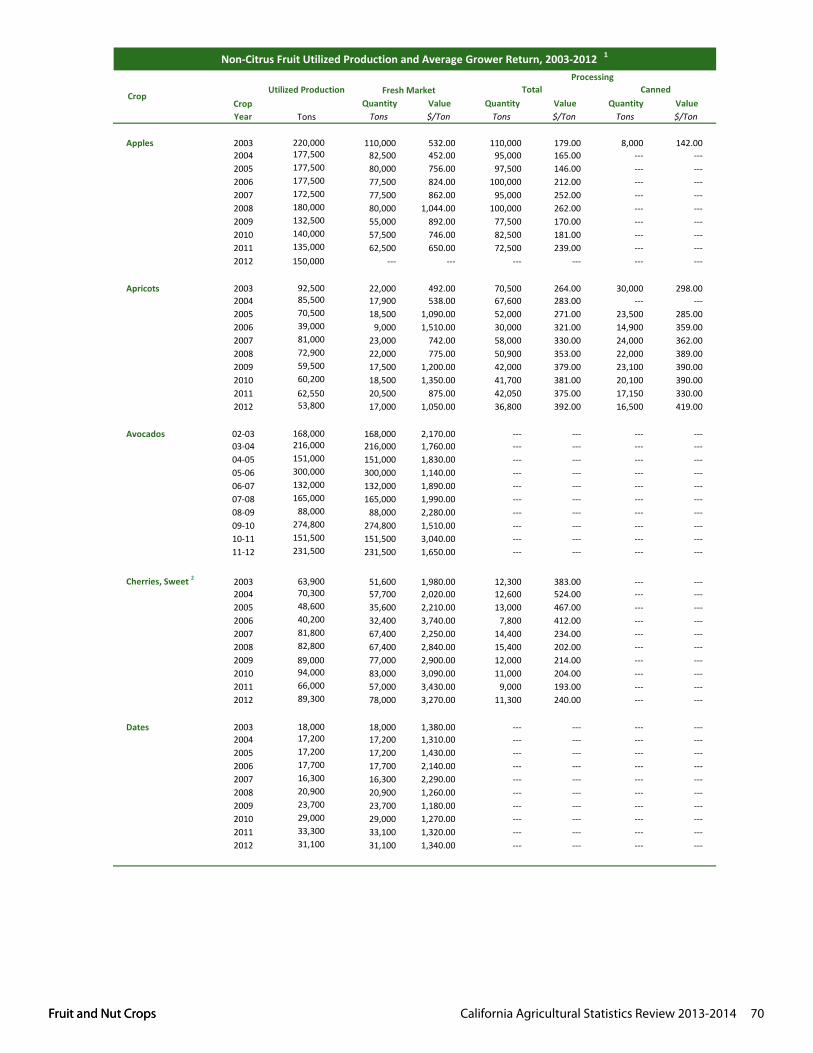
Quantity Value Quantity Value Quantity ValueTons Tons $/Ton Tons $/Ton Tons $/Ton
Apples 2003 220,000 110,000 532.00 110,000 179.00 8,000 142.002004 177,500 82,500 452.00 95,000 165.00 --- ---2005 177,500 80,000 756.00 97,500 146.00 --- ---2006 177,500 77,500 824.00 100,000 212.00 --- ---2007 172,500 77,500 862.00 95,000 252.00 --- ---2008 180,000 80,000 1,044.00 100,000 262.00 --- ---2009 132,500 55,000 892.00 77,500 170.00 --- ---2010 140,000 57,500 746.00 82,500 181.00 --- ---2011 135,000 62,500 650.00 72,500 239.00 --- ---2012 150,000 --- --- --- --- --- ---
Apricots 2003 92,500 22,000 492.00 70,500 264.00 30,000 298.002004 85,500 17,900 538.00 67,600 283.00 --- ---2005 70,500 18,500 1,090.00 52,000 271.00 23,500 285.002006 39,000 9,000 1,510.00 30,000 321.00 14,900 359.002007 81,000 23,000 742.00 58,000 330.00 24,000 362.002008 72,900 22,000 775.00 50,900 353.00 22,000 389.002009 59,500 17,500 1,200.00 42,000 379.00 23,100 390.002010 60,200 18,500 1,350.00 41,700 381.00 20,100 390.002011 62,550 20,500 875.00 42,050 375.00 17,150 330.002012 53,800 17,000 1,050.00 36,800 392.00 16,500 419.00
Avocados 02-03 168,000 168,000 2,170.00 --- --- --- ---03-04 216,000 216,000 1,760.00 --- --- --- ---04-05 151,000 151,000 1,830.00 --- --- --- ---05-06 300,000 300,000 1,140.00 --- --- --- ---06-07 132,000 132,000 1,890.00 --- --- --- ---07-08 165,000 165,000 1,990.00 --- --- --- ---08-09 88,000 88,000 2,280.00 --- --- --- ---09-10 274,800 274,800 1,510.00 --- --- --- ---10-11 151,500 151,500 3,040.00 --- --- --- ---11-12 231,500 231,500 1,650.00 --- --- --- ---
Cherries, Sweet 2 2003 63,900 51,600 1,980.00 12,300 383.00 --- ---2004 70,300 57,700 2,020.00 12,600 524.00 --- ---2005 48,600 35,600 2,210.00 13,000 467.00 --- ---2006 40,200 32,400 3,740.00 7,800 412.00 --- ---2007 81,800 67,400 2,250.00 14,400 234.00 --- ---2008 82,800 67,400 2,840.00 15,400 202.00 --- ---2009 89,000 77,000 2,900.00 12,000 214.00 --- ---2010 94,000 83,000 3,090.00 11,000 204.00 --- ---2011 66,000 57,000 3,430.00 9,000 193.00 --- ---2012 89,300 78,000 3,270.00 11,300 240.00 --- ---
Dates 2003 18,000 18,000 1,380.00 --- --- --- ---2004 17,200 17,200 1,310.00 --- --- --- ---2005 17,200 17,200 1,430.00 --- --- --- ---2006 17,700 17,700 2,140.00 --- --- --- ---2007 16,300 16,300 2,290.00 --- --- --- ---2008 20,900 20,900 1,260.00 --- --- --- ---2009 23,700 23,700 1,180.00 --- --- --- ---2010 29,000 29,000 1,270.00 --- --- --- ---2011 33,300 33,100 1,320.00 --- --- --- ---2012 31,100 31,100 1,340.00 --- --- --- ---
Crop Year
Crop
Non-Citrus Fruit Utilized Production and Average Grower Return, 2003-2012 1
CannedUtilized Production Fresh Market TotalProcessing

Fruit and Nut Crops California Agricultural Statistics Review 2013-2014 71 Fruit and Nut Crops
Quantity Value Quantity Value Quantity Value Quantity ValueTons $/Ton Tons $/Ton Tons $/Ton Tons $/Ton
Apples 2003 95,000 178.00 --- --- --- --- --- ---2004 85,000 164.00 --- --- --- --- --- ---2005 90,000 149.00 --- --- --- --- --- ---2006 87,500 222.00 --- --- --- --- --- ---2007 --- --- --- --- --- --- --- ---2008 --- --- --- --- --- --- --- ---2009 --- --- --- --- --- --- --- ---2010 --- --- --- --- --- --- --- ---2011 --- --- --- --- --- --- --- ---2012 --- --- --- --- --- --- --- ---
Apricots 2003 9,200 210.00 11,000 313.00 6,800 233.00 900 1,760.002004 --- --- 9,700 308.00 11,800 269.00 1,630 1,950.002005 --- --- --- --- 11,500 244.00 1,360 2,060.002006 --- --- --- --- 5,500 303.00 640 2,600.002007 --- --- --- --- 13,000 229.00 1,970 1,510.002008 --- --- --- --- 14,000 309.00 1,830 2,364.002009 --- --- --- --- 9,000 360.00 1,090 2,970.002010 --- --- --- --- 10,000 400.00 1,400 2,860.002011 --- --- --- --- 12,000 410.00 1,810 2,720.002012 --- --- --- --- 9,500 315.00 1,210 2,470.00
Avocados 02-03 --- --- --- --- --- --- --- ---03-04 --- --- --- --- --- --- --- ---04-05 --- --- --- --- --- --- --- ---05-06 --- --- --- --- --- --- --- ---06-07 --- --- --- --- --- --- --- ---07-08 --- --- --- --- --- --- --- ---08-09 --- --- --- --- --- --- --- ---09-10 --- --- --- --- --- --- --- ---10-11 --- --- --- --- --- --- --- ---11-12 --- --- --- --- --- --- --- ---
Cherries, Sweet 2 2003 --- --- --- --- --- --- --- ---2004 --- --- --- --- --- --- --- ---2005 --- --- --- --- --- --- --- ---2006 --- --- --- --- --- --- --- ---2007 --- --- --- --- --- --- --- ---2008 --- --- --- --- --- --- --- ---2009 --- --- --- --- --- --- --- ---2010 --- --- --- --- --- --- --- ---2011 --- --- --- --- --- --- --- ---2012 --- --- --- --- --- --- --- ---
Dates 2003 --- --- --- --- --- --- --- ---2004 --- --- --- --- --- --- --- ---2005 --- --- --- --- --- --- --- ---2006 --- --- --- --- --- --- --- ---2007 --- --- --- --- --- --- --- ---2008 --- --- --- --- --- --- --- ---2009 --- --- --- --- --- --- --- ---2010 --- --- --- --- --- --- --- ---2011 --- --- --- --- --- --- --- ---2012 --- --- --- --- --- --- --- ---
Dried (Fresh Basis)
Non-Citrus Fruit Utilized Production and Average Grower Return, 2003-2012 1
CropCrop Year
Juice or Crushed Dried BasisProcessing
Frozen

Fruit and Nut Crops California Agricultural Statistics Review 2013-2014 72 Fruit and Nut Crops
Quantity Value Quantity Value Quantity ValueTons Tons $/Ton Tons $/Ton Tons $/Ton
Crop Year
Crop
Non-Citrus Fruit Utilized Production and Average Grower Return, 2003-2012 1
CannedUtilized Production Fresh Market TotalProcessing
Figs 3 2003 48,500 2,900 --- 45,600 --- --- ---2004 51,100 4,300 --- 46,800 --- --- ---2005 49,000 3,700 --- 45,300 --- --- ---2006 42,800 3,800 --- 39,000 --- --- ---2007 47,800 4,300 --- 43,500 --- --- ---2008 43,300 4,000 --- 39,300 --- --- ---2009 43,750 3,850 --- 39,900 --- --- ---2010 40,910 3,960 --- 36,950 --- --- ---2011 38,660 3,960 --- 34,700 --- --- ---2012 38,660 3,960 --- 34,700 --- --- ---
Grapes, Raisin 4 2003 2,220,000 172,000 760.00 2,027,000 120.00 27,000 280.002004 2,038,000 192,000 730.00 1,846,000 262.00 25,000 300.002005 2,285,000 213,000 808.00 2,072,000 205.00 --- ---2006 1,833,000 151,000 902.00 1,682,000 221.00 21,000 303.002007 2,151,000 173,000 962.00 1,978,000 218.00 21000 314.002008 2,520,000 163,000 718.00 2,357,000 234.00 25,000 323.002009 1,938,000 137,000 961.00 1,801,000 238.00 20,000 337.002010 2,133,000 115,000 760.00 2,018,000 319.00 25,000 340.002011 2,263,000 104,000 1,290.00 2,159,000 338.00 25,000 355.002012 1,912,000 84,000 --- 1,828,000 399.00 20,000 400.00
Grapes, Table 2003 732,000 575,000 690.00 103,000 105.00 --- ---2004 770,000 644,000 790.00 126,000 208.00 --- ---2005 872,000 725,000 500.00 147,000 154.00 --- ---2006 717,000 601,000 1,040.00 116,000 162.00 --- ---2007 791,000 700,000 868.00 91,000 168.00 --- ---2008 973,000 773,000 461.00 200,000 191.00 --- ---2009 876,000 755,000 510.00 121,000 173.00 --- ---2010 1,011,000 829,000 420.00 182,000 211.00 --- ---2011 1,032,000 831,000 947.00 201,000 239.00 --- ---2012 986,000 831,000 1,370.00 155,000 303.00 --- ---
Grapes, Wine 9 2003 2,909,000 45,000 300.00 2,864,000 534.00 --- ---2004 2,815,000 40,000 510.00 2,775,000 571.00 --- ---2005 3,806,000 50,000 510.00 3,756,000 583.00 --- ---2006 3,176,000 40,000 500.00 3,136,000 583.00 --- ---2007 3,288,000 40,000 500.00 3,248,000 565.00 --- ---2008 3,055,000 40,000 500.00 3,015,000 610.00 --- ---2009 3,743,000 40,000 672.00 3,703,000 612.00 --- ---2010 3,629,000 40,000 770.00 3,589,000 574.00 --- ---2011 3,387,000 40,000 712.00 3,347,000 637.00 --- ---2012 4,058,000 40,000 --- 4,018,000 773.00 --- ---
Grapes, All 4,9 2003 5,861,000 792,000 683.00 4,994,000 357.00 27,000 280.002004 5,623,000 876,000 764.00 4,747,000 441.00 25,000 300.002005 6,963,000 988,000 567.00 5,975,000 441.00 --- ---2006 5,726,000 792,000 986.00 4,934,000 450.00 21,000 303.002007 6,230,000 913,000 870.00 5,317,000 429.00 21,000 314.002008 6,548,000 976,000 506.00 5,572,000 436.00 25,000 323.002009 6,557,000 932,000 583.00 5,625,000 483.00 20,000 337.002010 6,773,000 984,000 474.00 5,789,000 474.00 25,000 340.002011 6,682,000 975,000 974.00 5,707,000 510.00 25,000 355.002012 6,956,000 955,000 1,330.00 6,001,000 647.00 20,000 400.00

Fruit and Nut Crops California Agricultural Statistics Review 2013-2014 73 Fruit and Nut Crops
Quantity Value Quantity Value Quantity Value Quantity ValueTons $/Ton Tons $/Ton Tons $/Ton Tons $/Ton
Dried (Fresh Basis)
Non-Citrus Fruit Utilized Production and Average Grower Return, 2003-2012 1
CropCrop Year
Juice or Crushed Dried BasisProcessing
Frozen
Figs 3 2003 --- --- --- --- 45,600 276.00 15,200 828.002004 --- --- --- --- 46,800 299.00 15,600 897.002005 --- --- --- --- 45,300 282.00 15,100 847.002006 --- --- --- --- 39,000 276.00 13,000 829.002007 --- --- --- --- 43,500 291.00 14,500 873.002008 --- --- --- --- 39,300 401.00 13,100 1,200.002009 --- --- --- --- 39,900 515.00 13,300 1,540.002010 --- --- --- --- 36,950 406.00 12,320 1,220.002011 --- --- --- --- 34,700 411.00 11,560 1,230.002012 --- --- --- --- 34,700 --- 11,560 ---
Grapes, Raisin 4,9,10 2003 422,000 95.10 --- --- 1,578,000 124.00 347,700 563.002004 727,000 200.00 --- --- 1,094,000 303.00 274,000 1,210.002005 468,000 164.00 --- --- 1,604,000 217.00 348,600 1,000.002006 267,000 154.00 --- --- 1,394,000 233.00 303,000 1,070.002007 364,000 155.00 --- --- 1,593,000 231.00 354,000 1,040.002008 494,000 224.00 --- --- 1,838,000 235.00 383,000 1,130.002009 307,000 171.00 --- --- 1,474,000 251.00 327,600 1,130.002010 274,000 215.00 --- --- 1,719,000 336.00 382,000 1,510.002011 373,000 265.00 --- --- 1,761,000 353.00 374,600 1,660.002012 270,000 319.00 --- --- 1,538,000 413.00 327,300 1,940.00
Grapes, Table 9 2003 84,000 91.40 --- --- 19,000 167.00 4,200 757.002004 113,000 199.00 --- --- 13,000 289.00 3,300 1,140.002005 106,000 121.00 --- --- 41,000 239.00 8,900 1,100.002006 86,000 137.00 --- --- 30,000 232.00 6,500 1,070.002007 63,000 138.00 --- --- 28,000 236.00 6,000 1,100.002008 165,000 180.00 --- --- 35,000 242.00 7,300 1,160.002009 85,000 143.00 --- --- 36,000 244.00 7,900 1,110.002010 124,000 174.00 --- --- 58,000 289.00 12,800 1,310.002011 155,000 219.00 --- --- 46,000 306.00 9,700 1,450.002012 99,000 272.00 --- --- 56,000 358.00 11,800 1,700.00
Grapes, Wine 9 2003 2,864,000 534.00 --- --- --- --- --- ---2004 2,775,000 571.00 --- --- --- --- --- ---2005 3,756,000 583.00 --- --- --- --- --- ---2006 3,136,000 583.00 --- --- --- --- --- ---2007 3,248,000 565.00 --- --- --- --- --- ---2008 3,015,000 610.00 --- --- --- --- --- ---2009 3,703,000 612.00 --- --- --- --- --- ---2010 3,589,000 574.00 --- --- --- --- --- ---2011 3,347,000 637.00 --- --- --- --- --- ---2012 4,018,000 773.00 --- --- --- --- --- ---
Grapes, All 4,9 2003 3,370,000 468.00 --- --- 1,597,000 125.00 351,900 565.002004 3,615,000 485.00 --- --- 1,107,000 303.00 277,300 1,209.002005 4,330,000 526.00 --- --- 1,645,000 218.00 357,500 1,002.002006 3,489,000 539.00 --- --- 1,424,000 233.00 309,500 1,070.002007 3,675,000 517.00 --- --- 1,621,000 231.00 360,000 1,040.002008 3,674,000 539.00 --- --- 1,873,000 235.00 390,300 1,130.002009 4,095,000 569.00 --- --- 1,510,000 251.00 335,500 1,130.002010 3,987,000 537.00 --- --- 1,777,000 334.00 394,800 1,500.002011 3,875,000 584.00 --- --- 1,807,000 352.00 384,300 1,650.002012 4,387,000 734.00 --- --- 1,594,000 411.00 339,100 1,930.00

Fruit and Nut Crops California Agricultural Statistics Review 2013-2014 74 Fruit and Nut Crops
Quantity Value Quantity Value Quantity Value Quantity ValueTons $/Ton Tons $/Ton Tons $/Ton Tons $/Ton
Dried (Fresh Basis)
Non-Citrus Fruit Utilized Production and Average Grower Return, 2003-2012 1
Crop Crop Year
Juice or Crushed Dried BasisProcessingFrozen
Kiwifruit 5 2003 --- --- --- --- --- --- --- ---2004 --- --- --- --- --- --- --- ---2005 --- --- --- --- --- --- --- ---2006 --- --- --- --- --- --- --- ---2007 --- --- --- --- --- --- --- ---2008 --- --- --- --- --- --- --- ---2009 --- --- --- --- --- --- --- ---2010 --- --- --- --- --- --- --- ---2011 --- --- --- --- --- --- --- ---2012 --- --- --- --- --- --- --- ---
Nectarines 3 2003 --- --- --- --- --- --- --- ---2004 --- --- --- --- --- --- --- ---2005 --- --- --- --- --- --- --- ---2006 --- --- --- --- --- --- --- ---2007 --- --- --- --- --- --- --- ---2008 --- --- --- --- --- --- --- ---2009 --- --- --- --- --- --- --- ---2010 --- --- --- --- --- --- --- ---2011 --- --- --- --- --- --- --- ---2012 --- --- --- --- --- --- --- ---
Olives 2003 7,500 238.00 --- --- 10,500 215.00 3,500 8.002004 11,500 361.00 --- --- 16,100 252.00 5,000 6.002005 14,000 526.00 --- --- 21,200 271.00 6,300 6.002006 4,000 405.00 --- --- 1,500 335.00 500 7.002007 12,000 775.00 --- --- 20,000 496.00 4,000 6.002008 14,000 670.00 --- --- 6,000 382.00 1,300 12.002009 20,000 540.00 --- --- 1,500 306.00 300 8.002010 36,000 532.00 --- --- 37,000 270.00 8,000 -12.002011 42,000 556.00 --- --- 2,200 333.00 500 -13.002012 74,000 550.00 --- --- 6,400 346.00 1,100 -10.00
Peaches, Clingstone 2003 --- --- --- --- --- --- --- ---2004 --- --- --- --- --- --- --- ---2005 --- --- --- --- --- --- --- ---2006 --- --- --- --- --- --- --- ---2007 --- --- --- --- --- --- --- ---2008 --- --- --- --- --- --- --- ---2009 --- --- --- --- --- --- --- ---2010 --- --- --- --- --- --- --- ---2011 --- --- --- --- --- --- --- ---2012 --- --- --- --- --- --- --- ---
Peaches, Freestone 6 2003 --- --- 95,950 211.00 10,150 47.00 1,070 446.002004 --- --- 86,600 211.00 10,400 32.00 870 382.002005 --- --- 82,800 202.00 12,700 46.00 1,160 504.002006 --- --- 84,100 209.00 13,100 79.00 1,290 802.002007 --- --- 107,900 249.00 12,700 57.00 1,365 530.002008 --- --- 95,100 251.00 9,500 50.00 1,050 452.002009 --- --- 70,300 255.00 7,100 43.00 850 359.002010 --- --- 87,600 252.00 12,700 44.00 2,010 278.002011 --- --- 84,600 240.00 4,600 42.00 470 411.002012 --- --- 75,200 245.00 9,800 41.00 1,230 327.00
UndersizeLimited
Quantity Value Quantity Value Quantity ValueTons Tons $/Ton Tons $/Ton Tons $/Ton
Crop Year
Crop
Non-Citrus Fruit Utilized Production and Average Grower Return, 2003-2012 1
CannedUtilized Production Fresh Market TotalProcessing
Kiwifruit 5 2003 24,000 22,000 --- 2,000 --- --- ---2004 24,700 22,500 --- 2,200 --- --- ---2005 36,200 34,200 --- 2,000 --- --- ---2006 25,400 23,400 --- 2,000 --- --- ---2007 23,700 21,700 --- 2,000 --- --- ---2008 22,000 20,100 --- 1,900 --- --- ---2009 24,900 22,600 --- 2,300 --- --- ---2010 32,500 29,800 --- 2,700 --- --- ---2011 36,700 33,300 --- 3,400 --- --- ---2012 27,100 26,600 --- 500 --- --- ---
Nectarines 3 2003 273,000 273,000 436.00 --- --- --- ---2004 252,000 252,000 342.00 --- --- --- ---2005 239,000 239,000 504.00 --- --- --- ---2006 218,000 218,000 517.00 --- --- --- ---2007 269,000 269,000 331.00 --- --- --- ---2008 295,000 295,000 365.00 --- --- --- ---2009 210,000 210,000 637.00 --- --- --- ---2010 225,000 225,000 560.00 --- --- --- ---2011 216,000 216,000 590.00 --- --- --- ---2012 180,000 180,000 777.00 --- --- --- ---
Olives 2003 118,000 500 500.00 117,500 409.00 96,000 458.002004 107,500 500 500.00 107,000 564.00 74,400 701.002005 142,000 500 500.00 141,500 564.00 100,000 667.002006 23,500 500 500.00 23,000 777.00 17,000 926.002007 132,500 500 500.00 132,000 655.00 96,000 700.002008 66,800 --- --- 66,800 697.00 45,500 767.002009 46,300 --- --- 46,300 696.00 24,500 855.002010 206,000 --- --- 206,000 664.00 125,000 862.002011 71,200 --- --- 71,200 733.00 26,500 1,060.002012 160,000 --- --- 160,000 813.00 78,500 1,110.00
Peaches, Clingstone 2003 505,500 --- --- 505,500 215.00 478,500 217.002004 539,000 --- --- 539,000 263.00 505,000 270.002005 484,000 --- --- 484,000 254.00 459,000 256.002006 359,000 --- --- 359,000 292.00 344,000 295.002007 503,000 --- --- 503,000 304.00 466,000 308.002008 426,000 --- --- 426,000 347.00 407,000 351.002009 469,000 --- --- 469,000 338.00 449,000 340.002010 432,000 --- --- 432,000 325.00 414,000 327.002011 393,000 --- --- 393,000 303.00 377,000 307.002012 369,000 --- --- 369,000 348.00 352,000 347.00
Peaches, Freestone 6 2003 413,000 282,300 406.00 130,700 196.00 --- ---2004 390,000 259,000 341.00 131,000 175.00 --- ---2005 385,000 252,000 540.00 133,000 169.00 --- ---2006 353,000 242,000 597.00 111,000 205.00 --- ---2007 446,000 297,000 498.00 149,000 224.00 --- ---2008 433,000 299,000 395.00 134,000 226.00 --- ---2009 350,000 261,000 563.00 89,000 252.00 --- ---2010 385,000 272,000 454.00 113,000 246.00 --- ---2011 380,000 282,000 525.00 98,000 233.00 --- ---2012 344,000 250,000 726.00 94,000 242.00 --- ---

Fruit and Nut Crops California Agricultural Statistics Review 2013-2014 75 Fruit and Nut Crops
Quantity Value Quantity Value Quantity Value Quantity ValueTons $/Ton Tons $/Ton Tons $/Ton Tons $/Ton
Dried (Fresh Basis)
Non-Citrus Fruit Utilized Production and Average Grower Return, 2003-2012 1
CropCrop Year
Juice or Crushed Dried BasisProcessing
Frozen
Kiwifruit 5 2003 --- --- --- --- --- --- --- ---2004 --- --- --- --- --- --- --- ---2005 --- --- --- --- --- --- --- ---2006 --- --- --- --- --- --- --- ---2007 --- --- --- --- --- --- --- ---2008 --- --- --- --- --- --- --- ---2009 --- --- --- --- --- --- --- ---2010 --- --- --- --- --- --- --- ---2011 --- --- --- --- --- --- --- ---2012 --- --- --- --- --- --- --- ---
Nectarines 3 2003 --- --- --- --- --- --- --- ---2004 --- --- --- --- --- --- --- ---2005 --- --- --- --- --- --- --- ---2006 --- --- --- --- --- --- --- ---2007 --- --- --- --- --- --- --- ---2008 --- --- --- --- --- --- --- ---2009 --- --- --- --- --- --- --- ---2010 --- --- --- --- --- --- --- ---2011 --- --- --- --- --- --- --- ---2012 --- --- --- --- --- --- --- ---
Olives 2003 7,500 238.00 --- --- 10,500 215.00 3,500 8.002004 11,500 361.00 --- --- 16,100 252.00 5,000 6.002005 14,000 526.00 --- --- 21,200 271.00 6,300 6.002006 4,000 405.00 --- --- 1,500 335.00 500 7.002007 12,000 775.00 --- --- 20,000 496.00 4,000 6.002008 14,000 670.00 --- --- 6,000 382.00 1,300 12.002009 20,000 540.00 --- --- 1,500 306.00 300 8.002010 36,000 532.00 --- --- 37,000 270.00 8,000 -12.002011 42,000 556.00 --- --- 2,200 333.00 500 -13.002012 74,000 550.00 --- --- 6,400 346.00 1,100 -10.00
Peaches, Clingstone 2003 --- --- --- --- --- --- --- ---2004 --- --- --- --- --- --- --- ---2005 --- --- --- --- --- --- --- ---2006 --- --- --- --- --- --- --- ---2007 --- --- --- --- --- --- --- ---2008 --- --- --- --- --- --- --- ---2009 --- --- --- --- --- --- --- ---2010 --- --- --- --- --- --- --- ---2011 --- --- --- --- --- --- --- ---2012 --- --- --- --- --- --- --- ---
Peaches, Freestone 6 2003 --- --- 95,950 211.00 10,150 47.00 1,070 446.002004 --- --- 86,600 211.00 10,400 32.00 870 382.002005 --- --- 82,800 202.00 12,700 46.00 1,160 504.002006 --- --- 84,100 209.00 13,100 79.00 1,290 802.002007 --- --- 107,900 249.00 12,700 57.00 1,365 530.002008 --- --- 95,100 251.00 9,500 50.00 1,050 452.002009 --- --- 70,300 255.00 7,100 43.00 850 359.002010 --- --- 87,600 252.00 12,700 44.00 2,010 278.002011 --- --- 84,600 240.00 4,600 42.00 470 411.002012 --- --- 75,200 245.00 9,800 41.00 1,230 327.00
UndersizeLimited
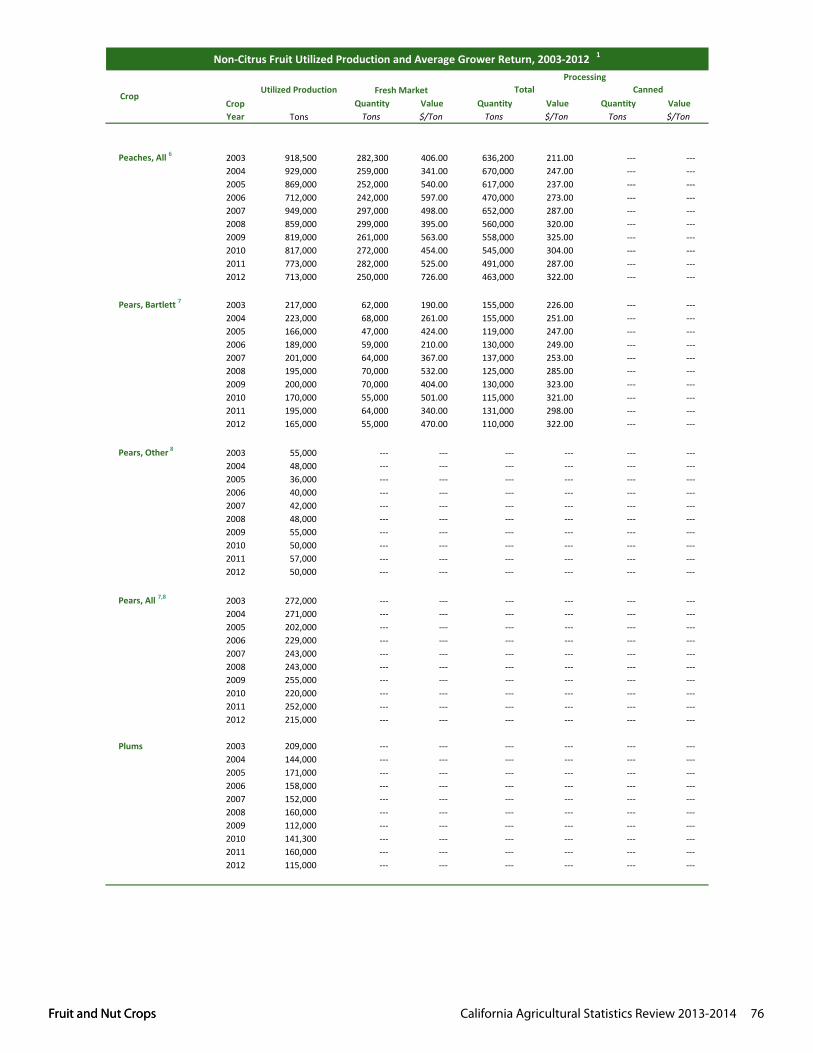
Fruit and Nut Crops California Agricultural Statistics Review 2013-2014 76 Fruit and Nut Crops
Quantity Value Quantity Value Quantity ValueTons Tons $/Ton Tons $/Ton Tons $/Ton
Crop Year
Crop
Non-Citrus Fruit Utilized Production and Average Grower Return, 2003-2012 1
CannedUtilized Production Fresh Market TotalProcessing
Peaches, All 6 2003 918,500 282,300 406.00 636,200 211.00 --- ---2004 929,000 259,000 341.00 670,000 247.00 --- ---2005 869,000 252,000 540.00 617,000 237.00 --- ---2006 712,000 242,000 597.00 470,000 273.00 --- ---2007 949,000 297,000 498.00 652,000 287.00 --- ---2008 859,000 299,000 395.00 560,000 320.00 --- ---2009 819,000 261,000 563.00 558,000 325.00 --- ---2010 817,000 272,000 454.00 545,000 304.00 --- ---2011 773,000 282,000 525.00 491,000 287.00 --- ---2012 713,000 250,000 726.00 463,000 322.00 --- ---
Pears, Bartlett 7 2003 217,000 62,000 190.00 155,000 226.00 --- ---2004 223,000 68,000 261.00 155,000 251.00 --- ---2005 166,000 47,000 424.00 119,000 247.00 --- ---2006 189,000 59,000 210.00 130,000 249.00 --- ---2007 201,000 64,000 367.00 137,000 253.00 --- ---2008 195,000 70,000 532.00 125,000 285.00 --- ---2009 200,000 70,000 404.00 130,000 323.00 --- ---2010 170,000 55,000 501.00 115,000 321.00 --- ---2011 195,000 64,000 340.00 131,000 298.00 --- ---2012 165,000 55,000 470.00 110,000 322.00 --- ---
Pears, Other 8 2003 55,000 --- --- --- --- --- ---2004 48,000 --- --- --- --- --- ---2005 36,000 --- --- --- --- --- ---2006 40,000 --- --- --- --- --- ---2007 42,000 --- --- --- --- --- ---2008 48,000 --- --- --- --- --- ---2009 55,000 --- --- --- --- --- ---2010 50,000 --- --- --- --- --- ---2011 57,000 --- --- --- --- --- ---2012 50,000 --- --- --- --- --- ---
Pears, All 7,8 2003 272,000 --- --- --- --- --- ---2004 271,000 --- --- --- --- --- ---2005 202,000 --- --- --- --- --- ---2006 229,000 --- --- --- --- --- ---2007 243,000 --- --- --- --- --- ---2008 243,000 --- --- --- --- --- ---2009 255,000 --- --- --- --- --- ---2010 220,000 --- --- --- --- --- ---2011 252,000 --- --- --- --- --- ---2012 215,000 --- --- --- --- --- ---
Plums 2003 209,000 --- --- --- --- --- ---2004 144,000 --- --- --- --- --- ---2005 171,000 --- --- --- --- --- ---2006 158,000 --- --- --- --- --- ---2007 152,000 --- --- --- --- --- ---2008 160,000 --- --- --- --- --- ---2009 112,000 --- --- --- --- --- ---2010 141,300 --- --- --- --- --- ---2011 160,000 --- --- --- --- --- ---2012 115,000 --- --- --- --- --- ---

Fruit and Nut Crops California Agricultural Statistics Review 2013-2014 77 Fruit and Nut Crops
Quantity Value Quantity Value Quantity Value Quantity ValueTons $/Ton Tons $/Ton Tons $/Ton Tons $/Ton
Dried (Fresh Basis)
Non-Citrus Fruit Utilized Production and Average Grower Return, 2003-2012 1
CropCrop Year
Juice or Crushed Dried BasisProcessing
Frozen
Peaches, All 6 2003 --- --- 95,950 211.00 10,150 47.00 1,070 446.002004 --- --- 86,600 211.00 10,400 32.00 870 382.002005 --- --- 82,800 202.00 12,700 46.00 1,160 504.002006 --- --- 84,100 209.00 13,100 79.00 1,290 802.002007 --- --- 107,900 249.00 12,700 57.00 1,365 530.002008 --- --- 95,100 251.00 9,500 50.00 1,050 452.002009 --- --- 70,300 255.00 7,100 43.00 850 359.002010 --- --- 87,600 252.00 12,700 44.00 2,010 278.002011 --- --- 84,600 240.00 4,600 42.00 470 411.002012 --- --- 75,200 245.00 9,800 41.00 1,230 327.00
Pears, Bartlett 7 2003 --- --- --- --- 4,000 206.00 610 1,350.002004 --- --- --- --- 4,000 160.00 620 1,030.002005 --- --- --- --- 2,700 240.00 400 1,620.002006 --- --- --- --- --- --- --- ---2007 --- --- --- --- --- --- --- ---2008 --- --- --- --- --- --- --- ---2009 --- --- --- --- --- --- --- ---2010 --- --- --- --- --- --- --- ---2011 --- --- --- --- --- --- --- ---2012 --- --- --- --- --- --- --- ---
Pears, Other 8 2003 --- --- --- --- --- --- --- ---2004 --- --- --- --- --- --- --- ---2005 --- --- --- --- --- --- --- ---2006 --- --- --- --- --- --- --- ---2007 --- --- --- --- --- --- --- ---2008 --- --- --- --- --- --- --- ---2009 --- --- --- --- --- --- --- ---2010 --- --- --- --- --- --- --- ---2011 --- --- --- --- --- --- --- ---2012 --- --- --- --- --- --- --- ---
Pears, All 7,8 2003 --- --- --- --- 4,000 206.00 610 1,350.002004 --- --- --- --- 4,000 160.00 620 1,030.002005 --- --- --- --- 2,700 240.00 400 1,620.002006 --- --- --- --- --- --- --- ---2007 --- --- --- --- --- --- --- ---2008 --- --- --- --- --- --- --- ---2009 --- --- --- --- --- --- --- ---2010 --- --- --- --- --- --- --- ---2011 --- --- --- --- --- --- --- ---2012 --- --- --- --- --- --- --- ---
Plums 2003 --- --- --- --- --- --- --- ---2004 --- --- --- --- --- --- --- ---2005 --- --- --- --- --- --- --- ---2006 --- --- --- --- --- --- --- ---2007 --- --- --- --- --- --- --- ---2008 --- --- --- --- --- --- --- ---2009 --- --- --- --- --- --- --- ---2010 --- --- --- --- --- --- --- ---2011 --- --- --- --- --- --- --- ---2012 --- --- --- --- --- --- --- ---

Fruit and Nut Crops California Agricultural Statistics Review 2013-2014 78 Fruit and Nut Crops
Quantity Value Quantity Value Quantity ValueTons Tons $/Ton Tons $/Ton Tons $/Ton
Crop Year
Crop
Non-Citrus Fruit Utilized Production and Average Grower Return, 2003-2012 1
CannedUtilized Production Fresh Market TotalProcessing
Plums, Dried 2003 168,000 --- --- 168,000 772.00 --- ---2004 48,000 --- --- 48,000 1,500.00 --- ---2005 94,000 --- --- 94,000 1,470.00 --- ---2006 189,000 --- --- 189,000 1,390.00 --- ---2007 81,000 --- --- 81,000 1,450.00 --- ---2008 129,000 --- --- 129,000 1,500.00 --- ---2009 166,000 --- --- 166,000 1,230.00 --- ---2010 130,000 --- --- 130,000 1,350.00 --- ---2011 137,000 --- --- 137,000 1,310.00 --- ---2012 138,000 --- --- 138,000 1,330.00 --- ---
1 Missing data not published to avoid possible disclosure of individual operations.2 Total processed includes canned, frozen, juice, and brined.3 Small quantities processed included in fresh to avoid possible disclosure.4 Includes substandard raisins diverted to other uses.5 Processed and fresh fruit price not published to avoid possible disclosure, but included in total utilized.6 Quantity and value include dried, but price excludes dried.7 Processed mostly canned, but includes small quantities dried and other uses not published separately to avoid possible disclosure. Data for
2006 and 2007 not published to avoid possible disclosure.8 Processed mostly juice, but includes small quantities canned and other uses not published separately to avoid possible disclosure.
Quantity Value Quantity Value Quantity Value Quantity ValueTons $/Ton Tons $/Ton Tons $/Ton Tons $/Ton
Dried (Fresh Basis)
Non-Citrus Fruit Utilized Production and Average Grower Return, 2003-2012 1
CropCrop Year
Juice or Crushed Dried BasisProcessing
Frozen
Plums, Dried 2003 --- --- --- --- 536,000 242.00 168,000 772.002004 --- --- --- --- 141,000 511.00 48,000 1,500.002005 --- --- --- --- 286,700 482.00 94,000 1,470.002006 --- --- --- --- 604,800 434.00 189,000 1,390.002007 --- --- --- --- 234,900 500.00 81,000 1,450.002008 --- --- --- --- 368,000 526.00 129,000 1,500.002009 --- --- --- --- 496,000 412.00 166,000 1,230.002010 --- --- --- --- 390,000 450.00 130,000 1,350.002011 --- --- --- --- 444,000 404.00 137,000 1,310.002012 --- --- --- --- 436,000 421.00 138,000 1,330.00

Fruit and Nut Crops California Agricultural Statistics Review 2013-2014 79 Fruit and Nut Crops
Marketable In-Shell
Shelling Stock
Total
Acres Acres Pounds $/Pound $1,000
Almonds 2 2003 550,000 60,000 1,890 --- --- 1,040,000 1.57 1,600,144(Shelled Basis) 2004 570,000 70,000 1,760 --- --- 1,005,000 2.21 2,189,005
2005 590,000 110,000 1,550 --- --- 915,000 2.81 2,525,9092006 610,000 145,000 1,840 --- --- 1,120,000 2.06 2,258,7902007 640,000 125,000 2,170 --- --- 1,390,000 1.75 2,401,8752008 680,000 115,000 2,400 --- --- 1,630,000 1.45 2,343,2002009 720,000 90,000 1,960 --- --- 1,410,000 1.65 2,293,5002010 740,000 85,000 2,220 --- --- 1,640,000 1.79 2,903,3802011 760,000 75,000 2,670 --- --- 2,030,000 1.99 4,007,860
2012 3 790,000 80,000 2,390 --- --- 1,890,000 2.58 4,816,860
Pecans 2003 2,600 --- 1,420 --- --- 3,700 1.42 5,254(In-Shell Basis) 2004 2,700 --- 1,300 --- --- 3,500 2.21 7,735
2005 2,800 --- 1,410 --- --- 3,950 1.80 7,1102006 2,900 --- 1,170 --- --- 3,400 1.72 5,8482007 2,500 --- 1,760 --- --- 4,400 1.78 7,8322008 3,100 --- 1,210 --- --- 3,750 1.31 4,9132009 3,200 --- 1,230 --- --- 3,920 1.51 5,9192010 3,600 --- 1,580 --- --- 5,700 2.54 14,4782011 3,600 --- 1,030 --- --- 3,700 2.67 9,8792012 3,600 --- 1,330 --- --- 4,800 1.58 7,584
Pistachios 2003 88,000 23,000 1,350 90,000 29,000 119,000 1.22 145,1802004 93,000 15,000 3,730 254,000 93,000 347,000 1.34 464,9802005 105,000 --- 2,700 215,000 68,000 283,000 2.05 580,1502006 112,000 --- 2,130 201,000 37,000 238,000 1.89 449,8202007 115,000 --- 3,620 333,000 83,000 416,000 1.41 586,5602008 118,000 --- 2,360 231,000 47,000 278,000 2.05 569,9002009 126,000 --- 2,820 290,000 65,000 355,000 1.67 592,8502010 137,000 --- 3,810 378,000 144,000 522,000 2.22 1,158,8402011 153,000 --- 2,900 341,000 103,000 444,000 1.98 879,1202012 178,000 --- 3,100 464,000 87,000 551,000 2.02 1,113,020
Sold In-Shell Sold ShelledAcres Acres Tons Tons Tons Tons $/Ton $1,000
Walnuts 2003 213,000 27,000 1.53 81,000 245,000 326,000 1,160.00 378,160(In-Shell Basis) 2004 214,000 --- 1.52 75,000 250,000 325,000 1,390.00 451,750
2005 215,000 26,000 1.65 82,000 273,000 355,000 1,570.00 557,3502006 216,000 --- 1.60 71,000 275,000 346,000 1,630.00 563,9802007 218,000 25,000 1.50 66,000 262,000 328,000 2,290.00 751,1202008 223,000 --- 1.96 95,000 341,000 436,000 1,280.00 558,0802009 227,000 28,000 1.93 99,000 338,000 437,000 1,710.00 747,2702010 237,000 --- 2.13 141,000 363,000 504,000 2,040.00 1,028,1602011 245,000 35,000 1.88 125,000 336,000 461,000 2,900.00 1,336,900
2012 4 245,000 --- 2.03 --- --- 497,000 3,030.00 1,505,910
4 For 2012, Production based on California Walnut Board receipts from handlers. Price is based on the Walnut Raisin Prune Report released November 2013. Value was calculated based on production and price.
3 For 2012, Production and value of production are based on Almond Board of California receipts from handlers.
Tree Nut Acreage, Production and Value, 2003-2012
Crop Crop YearBearing Non-Bearing 1 Yield Per
AcreValue Per
UnitTotal Value
Production
1,000 Pounds
1 Non-bearing shown only in year when acreage survey conducted.2 Values are based on the edible portion of the crop only. Included in production are inedible quantities of no value: 2002 - 8.30 million lbs, 2003 - 20.8 million lbs, 2004 - 14.5 million lbs, 2005 - 16.1 million lbs, 2006 - 23.5 million lbs, 2007 - 17.5 million lbs, 2008 - 14.0 million lbs, 2009 - 20.0 million lbs, 2010 - 18.0 million lbs, 2011 - 16.0 million lbs, 2012 - 23.0 million lbs.

Fruit and Nut Crops California Agricultural Statistics Review 2013-2014 80 Fruit and Nut Crops
Muscats Oleate 2 Sultanas Zante Currant
Production
2003 20 --- 80 3,030 27,5802004 --- --- 30 3,500 25,1902005 --- --- 75 3,800 23,5302006 10 --- 215 2,970 16,2902007 5 --- 95 3,350 20,8502008 5 --- 70 2,910 24,6302009 10 --- 65 2,710 20,8402010 5 --- 65 3,490 26,3302011 5 --- 75 3,170 24,3102012 --- --- --- --- ---
2003 515.00 --- 495.00 992.00 887.002004 --- --- 880.00 1,420.00 1,430.002005 --- --- 1,040.00 1,390.00 1,410.002006 1,000.00 --- 890.00 1,110.00 1,350.002007 900.00 --- 930.00 990.00 1,530.002008 990.00 --- 1,030.00 1,230.00 1,570.002009 1,000.00 --- 950.00 1,620.00 1,720.002010 1,100.00 --- 1,280.00 2,000.00 1,870.002011 1,500.00 --- 1,440.00 2,200.00 2,160.002012 --- --- --- --- ---
Dehydrated All Types
Raisin Production and Average Grower Return, 2003-2012
Raisins 1 Crop Year All VarietiesNaturally Dried
Thompson Seedless
1,210.001,000.001,090.00
1 Excludes raisins produced from table-type grapes.2 Miscellaneous seedless grapes with Oleate applied.
1,040.001,130.001,130.00
1,270.001,280.00
Average Grower Return $/Ton
304,000
Tons
327,600
---
352,100347,000
---
297,020245,300321,140283,100329,300355,100
347,700274,000348,600303,000354,000383,000
382,000374,600
563.00
1,480.001,620.00
---
1,510.001,660.00
---
528.001,190.001,160.001,200.001,190.00