frost & sullivan asia pacific mega trends
TRANSCRIPT
1 <0000-00>
Global and Asia Pacific Mega Trends
Mega Trends to 2020
2 <0000-00>
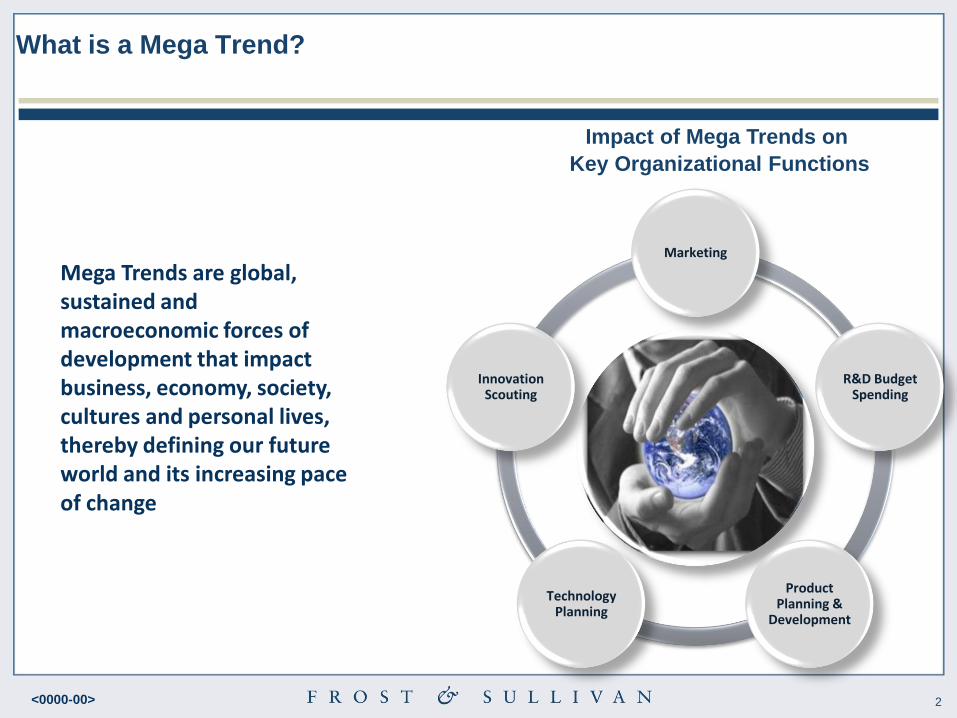
What is a Mega Trend?
Impact of Mega Trends on
Key Organizational Functions
Marketing
R&D Budget Spending
Product Planning &
Development
Technology Planning
Innovation Scouting
Mega Trends are global, sustained and macroeconomic forces of development that impact business, economy, society, cultures and personal lives, thereby defining our future world and its increasing pace of change
3 <0000-00>
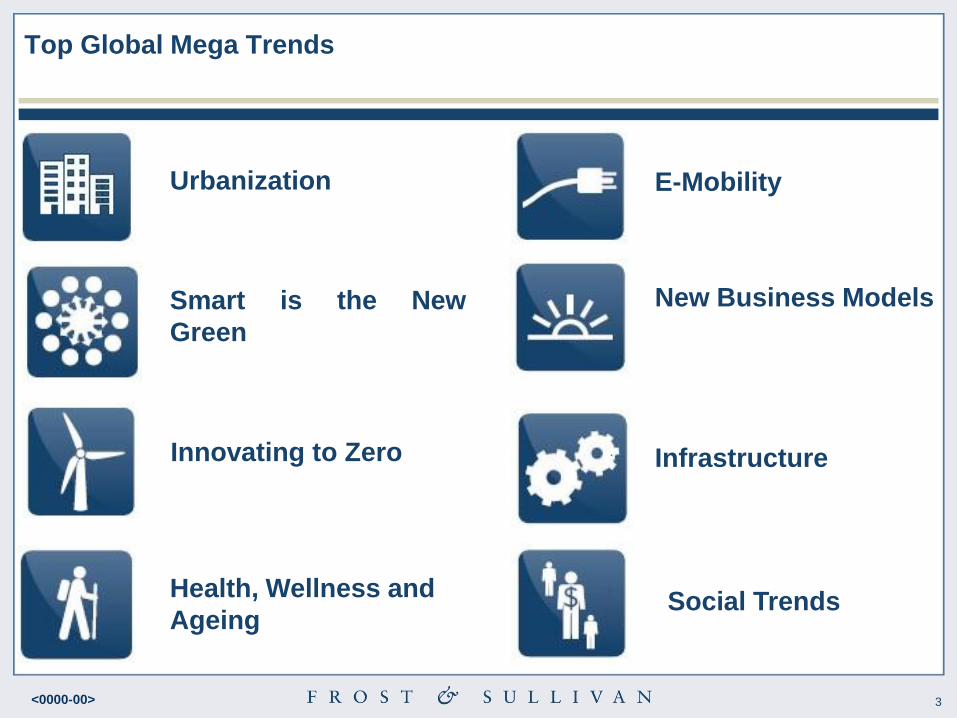
Top Global Mega Trends
Urbanization
Smart is the New
Green
Innovating to Zero
Health, Wellness and
Ageing
E-Mobility
New Business Models
Infrastructure
Social Trends
4 <0000-00>
Rise of the “new” super economies in Asia
- Indonesia, Vietnam, The Philippines & Bangladesh
Indonesia, Vietnam, The Philippines and
Bangladesh are expected to be the ―new super
economies‖ driving the Asian growth story in 2020
5 <0000-00>
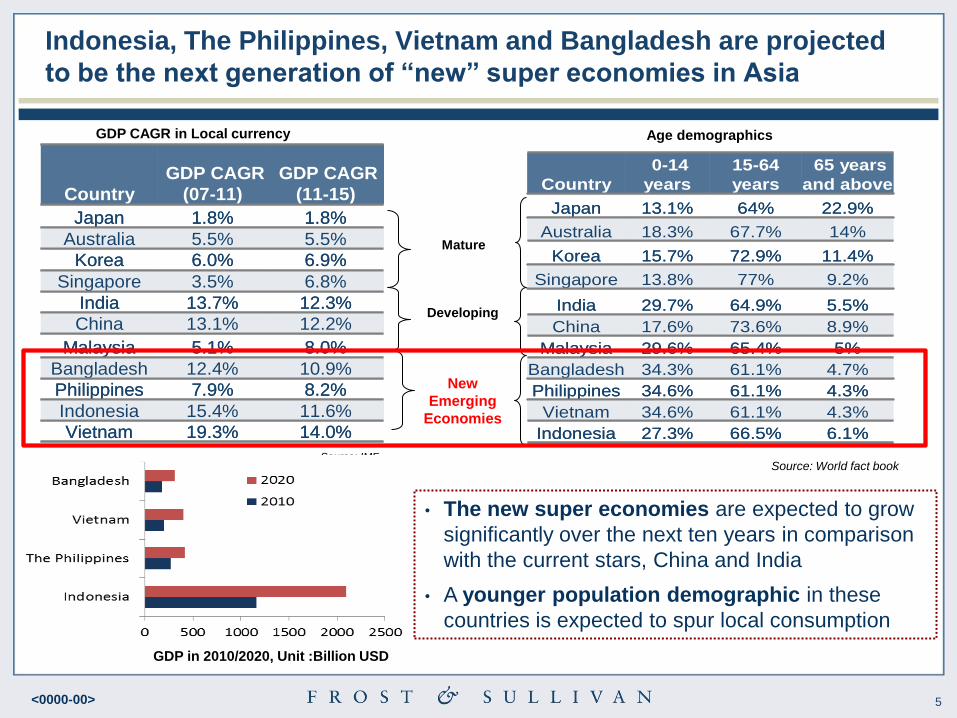
Indonesia, The Philippines, Vietnam and Bangladesh are projected
to be the next generation of “new” super economies in Asia
• The new super economies are expected to grow
significantly over the next ten years in comparison
with the current stars, China and India
• A younger population demographic in these
countries is expected to spur local consumption
Source: IMF
11.6%15.4%Indonesia
14.0%19.3%Vietnam
8.2%7.9%Philippines
10.9%12.4%Bangladesh
Country
GDP CAGR
(07-11)
GDP CAGR
(11-15)
Japan 1.8% 1.8%
Australia 5.5% 5.5%
Korea 6.0% 6.9%
Singapore 3.5% 6.8%
India 13.7% 12.3%
China 13.1% 12.2%
Malaysia 5.1% 8.0%
11.6%15.4%Indonesia
14.0%19.3%Vietnam
8.2%7.9%Philippines
10.9%12.4%Bangladesh
Country
GDP CAGR
(07-11)
GDP CAGR
(11-15)
Japan 1.8% 1.8%
Australia 5.5% 5.5%
Korea 6.0% 6.9%
Singapore 3.5% 6.8%
India 13.7% 12.3%
China 13.1% 12.2%
Malaysia 5.1% 8.0%
Mature
GDP CAGR in Local currency
Developing
4.7%61.1%34.3%Bangladesh
4.3%61.1%34.6%Philippines
5%65.4%29.6%Malaysia
14%67.7%18.3%Australia
11.4%72.9%15.7%Korea
22.9% 64%13.1% Japan
66.5%
61.1%
73.6%
64.9%
77%
15-64
years
4.3%34.6%Vietnam
6.1%27.3%Indonesia
Country
0-14
years
65 years
and above
Singapore 13.8% 9.2%
India 29.7% 5.5%
China 17.6% 8.9%
Source: World fact book
Age demographics
New
Emerging
Economies
GDP in 2010/2020, Unit :Billion USD
6 <0000-00>
What are the implications of these new super
economies?
• These “new” super economies need significant investments in Infrastructure to support
their growth especially in Indonesia, Vietnam and Bangladesh
• Investments expected in advanced technologies especially within local / homegrown
companies to improve productivity and efficiency in these countries
• New emerging economies could be more attractive destinations for labor-intensive
and resource based industries over the next decade.
• These „new” emerging countries need to be on the radar of organizations seeking the
next growth engines in Asia for their businesses.
7 <0000-00>
The Aging of Asia
Asian populations will age significantly over the next decade
8 <0000-00>
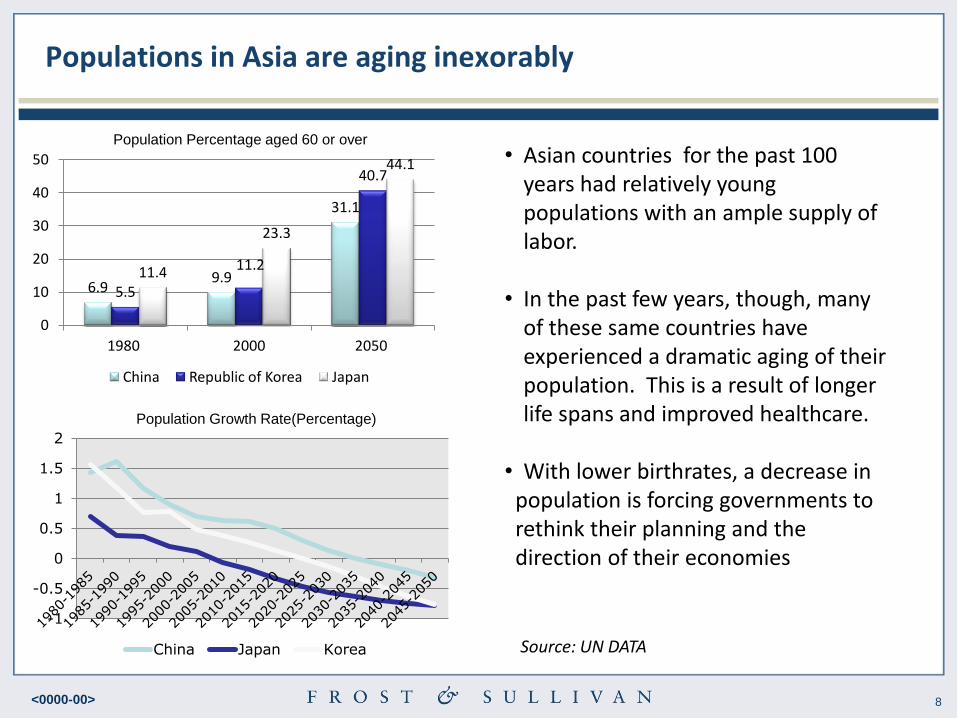
Populations in Asia are aging inexorably
6.9 9.9
31.1
5.5
11.2
40.7
11.4
23.3
44.1
0
10
20
30
40
50
1980 2000 2050
China Republic of Korea Japan
Population Percentage aged 60 or over
-1
-0.5
0
0.5
1
1.5
2
China Japan Korea
Population Growth Rate(Percentage)
• Asian countries for the past 100 years had relatively young populations with an ample supply of labor.
• In the past few years, though, many
of these same countries have experienced a dramatic aging of their population. This is a result of longer life spans and improved healthcare.
• With lower birthrates, a decrease in population is forcing governments to rethink their planning and the direction of their economies
Source: UN DATA
9 <0000-00>
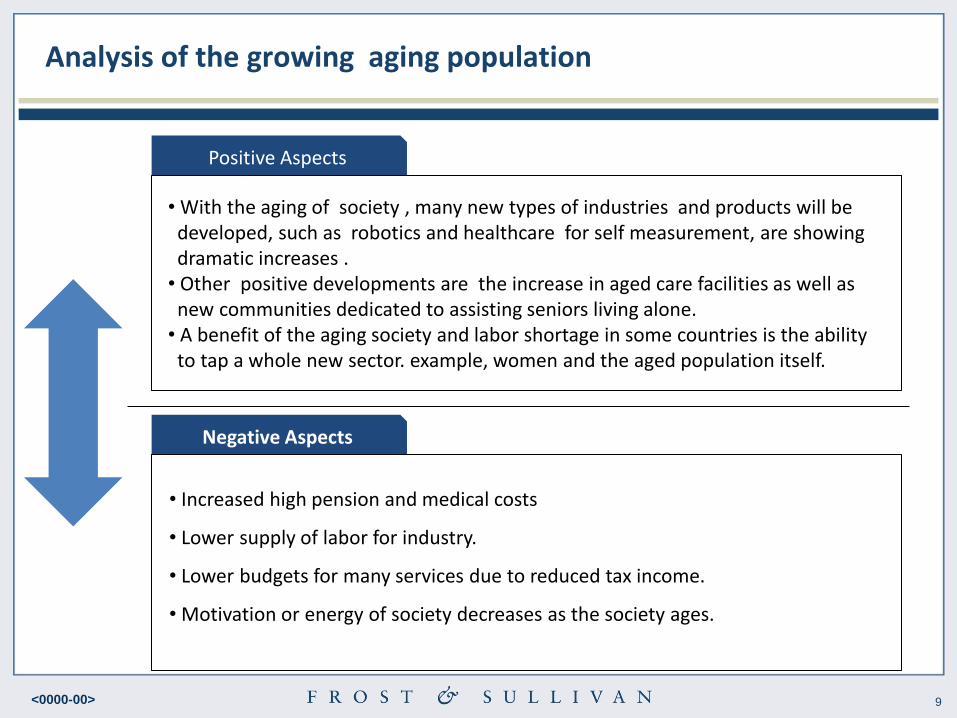
Analysis of the growing aging population
Positive Aspects
• With the aging of society , many new types of industries and products will be developed, such as robotics and healthcare for self measurement, are showing dramatic increases . • Other positive developments are the increase in aged care facilities as well as new communities dedicated to assisting seniors living alone. • A benefit of the aging society and labor shortage in some countries is the ability to tap a whole new sector. example, women and the aged population itself.
Negative Aspects
• Increased high pension and medical costs
• Lower supply of labor for industry.
• Lower budgets for many services due to reduced tax income.
• Motivation or energy of society decreases as the society ages.
10 <0000-00>
Investments in infrastructure to dominate
government spending in Asia
Government spending on infrastructure is expected to provide
significant growth opportunities for private sector participation
through PPP during the next ten years till 2020
11 <0000-00> USD billion
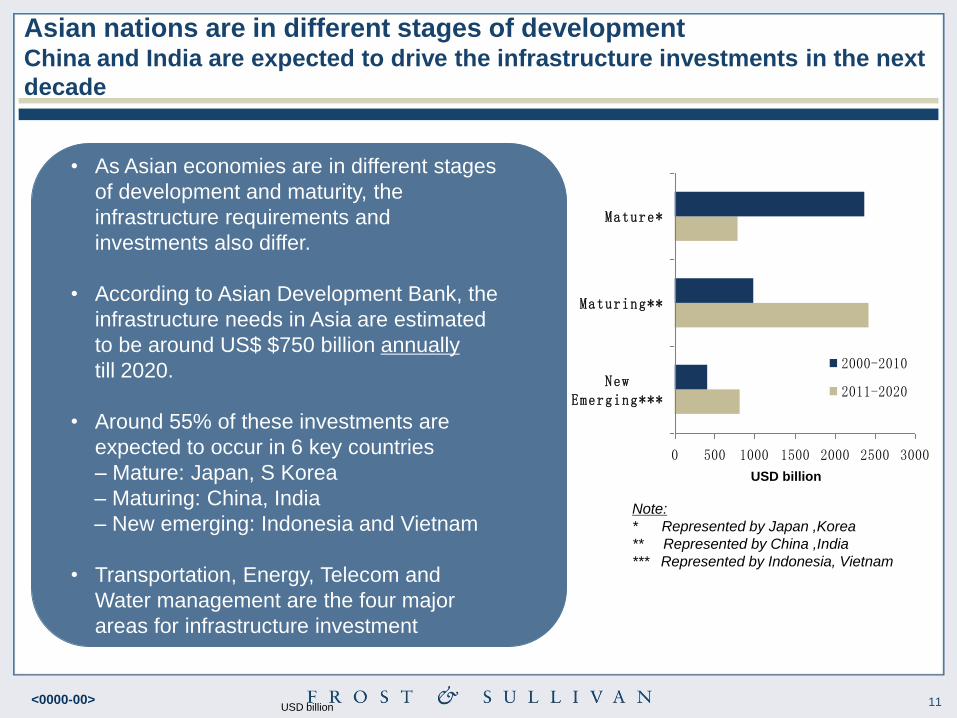
Asian nations are in different stages of development China and India are expected to drive the infrastructure investments in the next
decade
0 500 1000 1500 2000 2500 3000
NewEmerging***
Maturing**
Mature*
2000-2010
2011-2020
Note:
* Represented by Japan ,Korea
** Represented by China ,India
*** Represented by Indonesia, Vietnam
• As Asian economies are in different stages
of development and maturity, the
infrastructure requirements and
investments also differ.
• According to Asian Development Bank, the
infrastructure needs in Asia are estimated
to be around US$ $750 billion annually
till 2020.
• Around 55% of these investments are
expected to occur in 6 key countries
– Mature: Japan, S Korea
– Maturing: China, India
– New emerging: Indonesia and Vietnam
• Transportation, Energy, Telecom and
Water management are the four major
areas for infrastructure investment
USD billion
12 <0000-00>
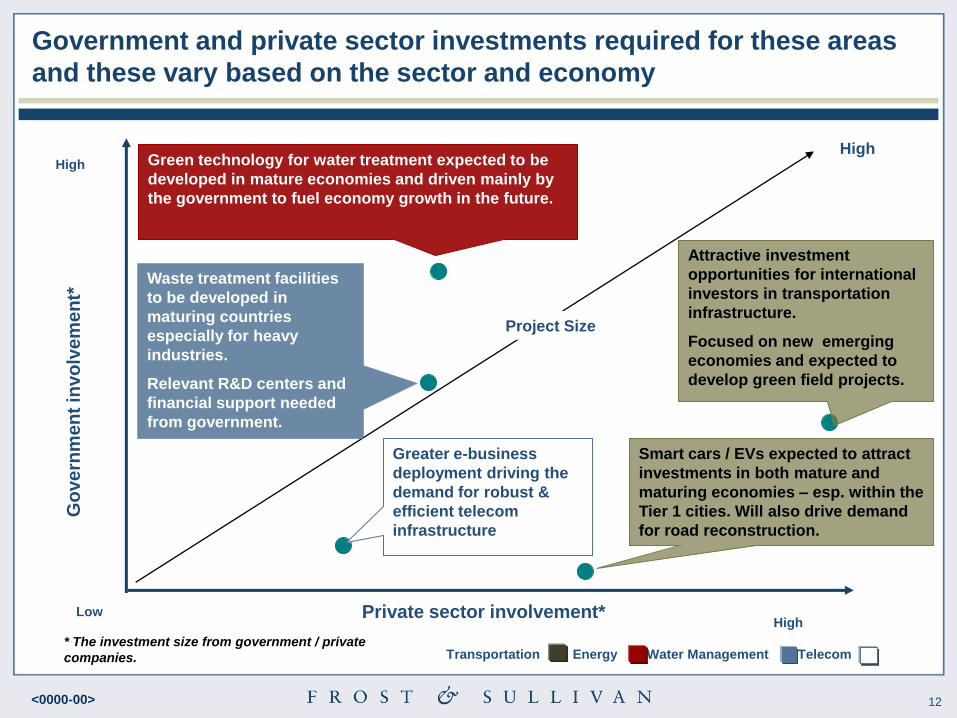
Government and private sector investments required for these areas
and these vary based on the sector and economy G
ove
rnm
en
t in
vo
lve
me
nt*
Private sector involvement*
High
Low High
Project Size
High
Transportation Energy Water Management Telecom
Greater e-business
deployment driving the
demand for robust &
efficient telecom
infrastructure
Waste treatment facilities
to be developed in
maturing countries
especially for heavy
industries.
Relevant R&D centers and
financial support needed
from government.
Smart cars / EVs expected to attract
investments in both mature and
maturing economies – esp. within the
Tier 1 cities. Will also drive demand
for road reconstruction.
Green technology for water treatment expected to be
developed in mature economies and driven mainly by
the government to fuel economy growth in the future.
* The investment size from government / private
companies.
Attractive investment
opportunities for international
investors in transportation
infrastructure.
Focused on new emerging
economies and expected to
develop green field projects.
13 <0000-00>
Growth in Intra Asia Trade
Intra Asian Trade will grow exponentially over the next decade
14 <0000-00>
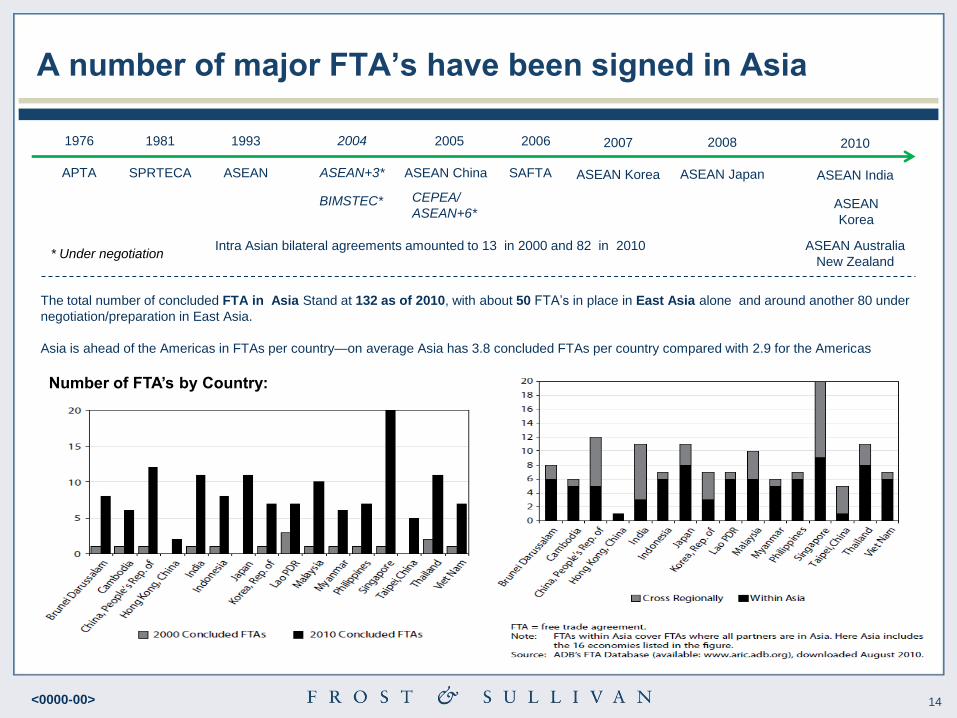
A number of major FTA‟s have been signed in Asia
1976
APTA
1993
ASEAN
2006
SAFTA
1981
SPRTECA
2010
ASEAN India
2008
ASEAN Japan
2007
ASEAN Korea
2005
ASEAN China
ASEAN Australia
New Zealand
BIMSTEC* CEPEA/
ASEAN+6*
2004
ASEAN+3*
ASEAN
Korea
Intra Asian bilateral agreements amounted to 13 in 2000 and 82 in 2010
The total number of concluded FTA in Asia Stand at 132 as of 2010, with about 50 FTA’s in place in East Asia alone and around another 80 under
negotiation/preparation in East Asia.
Asia is ahead of the Americas in FTAs per country—on average Asia has 3.8 concluded FTAs per country compared with 2.9 for the Americas
Number of FTA‟s by Country:
* Under negotiation
15 <0000-00>
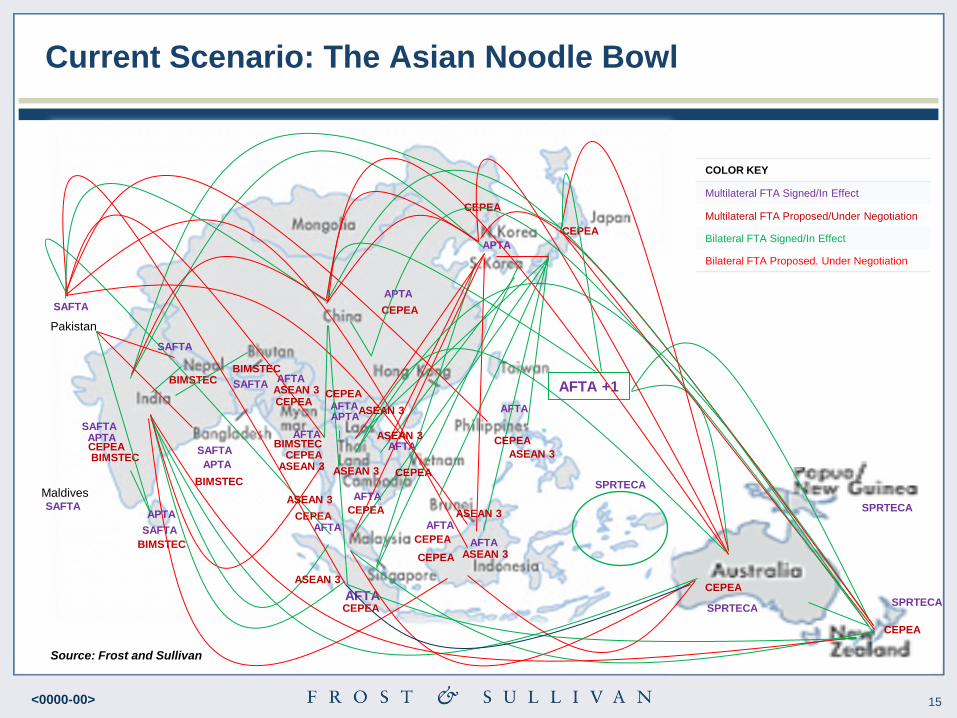
Current Scenario: The Asian Noodle Bowl
SPRTECA
APTA
AFTA
Pakistan
Maldives
SAFTA
SPRTECA SPRTECA
SPRTECA SAFTA
SAFTA
SAFTA
SAFTA
SAFTA
SAFTA
APTA
APTA
APTA
APTA
APTA
AFTA
AFTA
AFTA
AFTA
AFTA
AFTA
AFTA
AFTA
AFTA
BIMSTEC
BIMSTEC
BIMSTEC
BIMSTEC
BIMSTEC BIMSTEC
AFTA +1
Source: Frost and Sullivan
CEPEA
CEPEA
CEPEA
CEPEA
CEPEA
CEPEA
CEPEA
CEPEA
CEPEA
CEPEA
CEPEA
CEPEA
CEPEA
CEPEA
CEPEA
CEPEA
ASEAN 3
ASEAN 3
ASEAN 3
ASEAN 3
ASEAN 3
ASEAN 3
ASEAN 3
ASEAN 3 ASEAN 3
ASEAN 3
COLOR KEY
Multilateral FTA Signed/In Effect
Multilateral FTA Proposed/Under Negotiation
Bilateral FTA Signed/In Effect
Bilateral FTA Proposed. Under Negotiation
16 <0000-00>
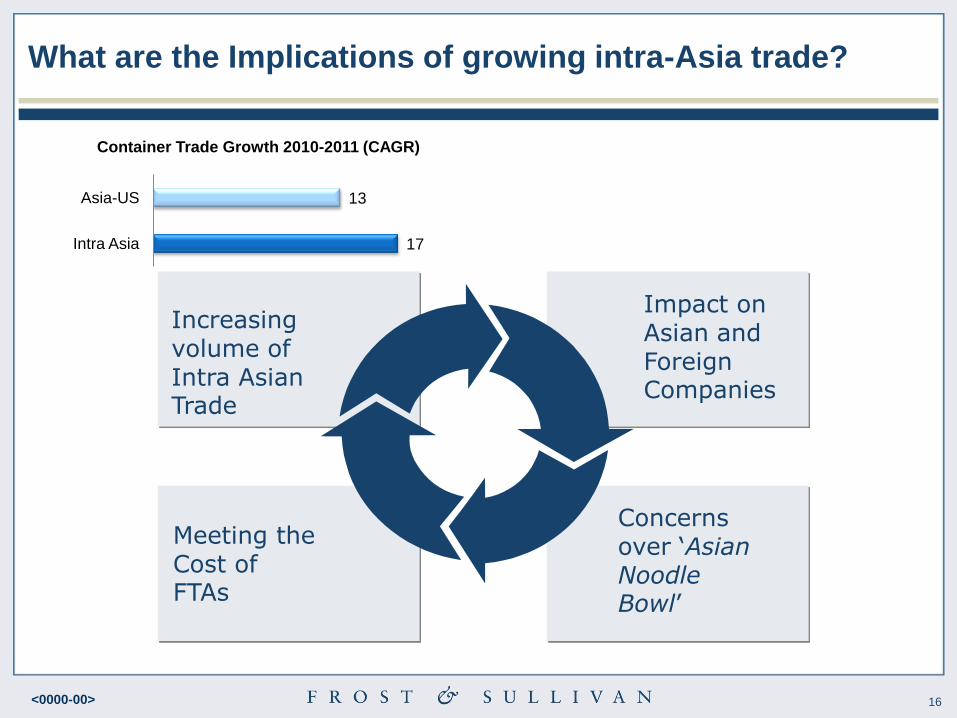
What are the Implications of growing intra-Asia trade?
17
13
Intra Asia
Asia-US
Container Trade Growth 2010-2011 (CAGR)
Increasing volume of Intra Asian Trade
Impact on Asian and Foreign Companies
Meeting the Cost of FTAs
Concerns over ‘Asian Noodle Bowl’
17 <0000-00>
Increased Urbanization and Emergence of Super
Cities
Asia will continue to urbanize with the emergence of more and
more ―super cities‖
18 <0000-00>
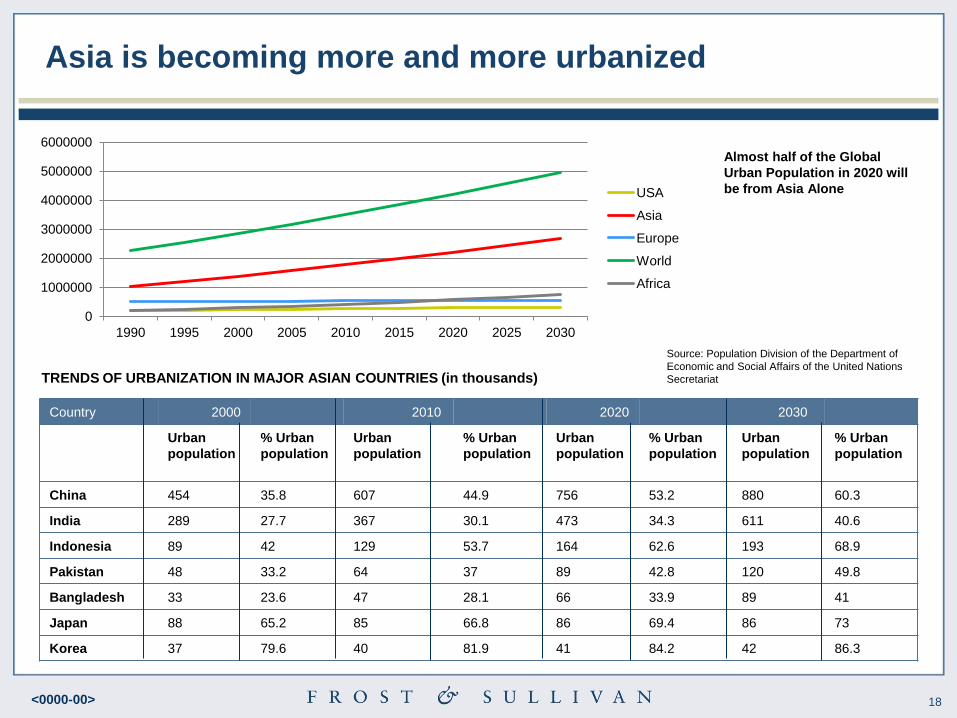
Asia is becoming more and more urbanized
0
1000000
2000000
3000000
4000000
5000000
6000000
1990 1995 2000 2005 2010 2015 2020 2025 2030
USA
Asia
Europe
World
Africa
Almost half of the Global
Urban Population in 2020 will
be from Asia Alone
Country 2000 2010 2020 2030
Urban
population
% Urban
population
Urban
population
% Urban
population
Urban
population
% Urban
population
Urban
population
% Urban
population
China 454 35.8 607 44.9 756 53.2 880 60.3
India 289 27.7 367 30.1 473 34.3 611 40.6
Indonesia 89 42 129 53.7 164 62.6 193 68.9
Pakistan 48 33.2 64 37 89 42.8 120 49.8
Bangladesh 33 23.6 47 28.1 66 33.9 89 41
Japan 88 65.2 85 66.8 86 69.4 86 73
Korea 37 79.6 40 81.9 41 84.2 42 86.3
Source: Population Division of the Department of
Economic and Social Affairs of the United Nations
Secretariat TRENDS OF URBANIZATION IN MAJOR ASIAN COUNTRIES (in thousands)
19 <0000-00>
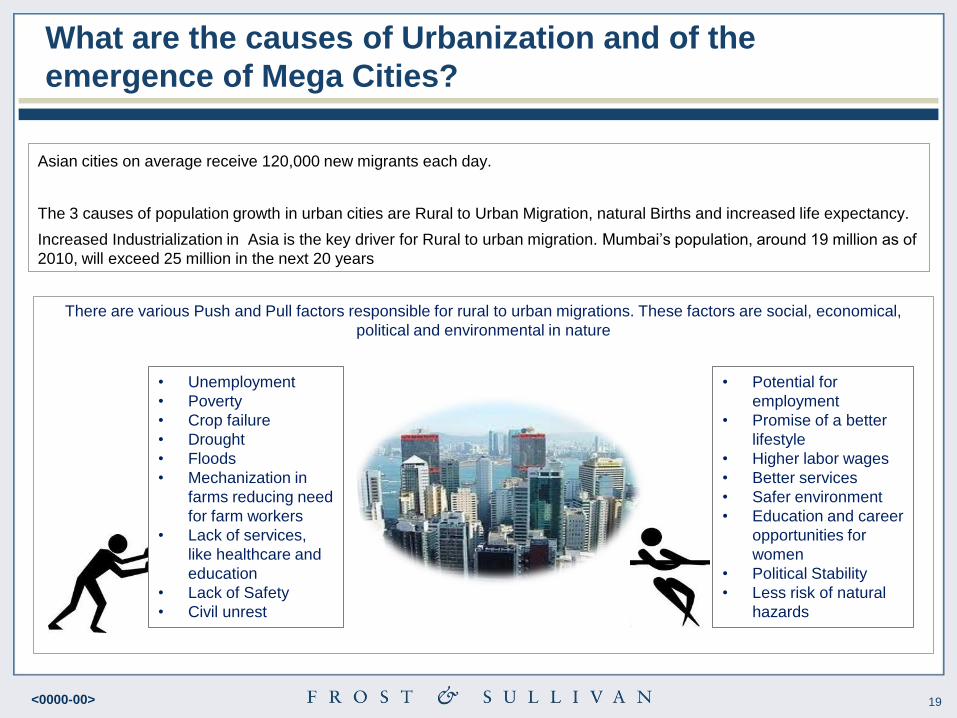
What are the causes of Urbanization and of the
emergence of Mega Cities?
Asian cities on average receive 120,000 new migrants each day.
The 3 causes of population growth in urban cities are Rural to Urban Migration, natural Births and increased life expectancy.
Increased Industrialization in Asia is the key driver for Rural to urban migration. Mumbai’s population, around 19 million as of
2010, will exceed 25 million in the next 20 years
There are various Push and Pull factors responsible for rural to urban migrations. These factors are social, economical,
political and environmental in nature
• Unemployment
• Poverty
• Crop failure
• Drought
• Floods
• Mechanization in
farms reducing need
for farm workers
• Lack of services,
like healthcare and
education
• Lack of Safety
• Civil unrest
• Potential for
employment
• Promise of a better
lifestyle
• Higher labor wages
• Better services
• Safer environment
• Education and career
opportunities for
women
• Political Stability
• Less risk of natural
hazards
20 <0000-00>
Huge Increase In Education Within Asia Pacific As
Governments and Businesses Are Moving Towards
Becoming Knowledge Based Economies
Huge Increase in Education
21 <0000-00>
APAC Real GDP Growth (source IMF)
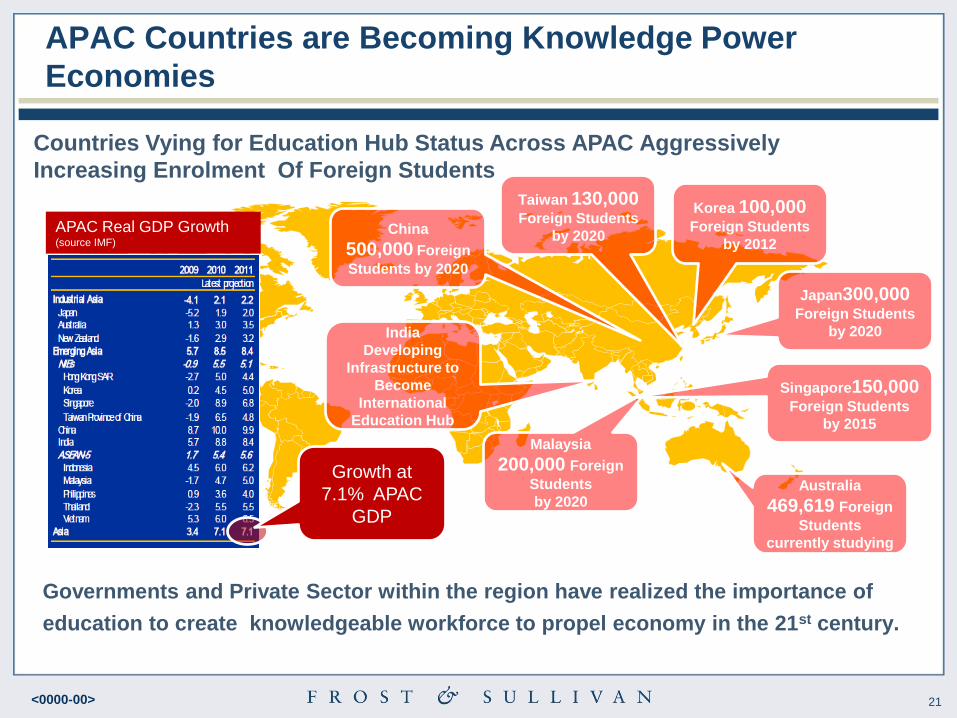
APAC Countries are Becoming Knowledge Power
Economies
Governments and Private Sector within the region have realized the importance of
education to create knowledgeable workforce to propel economy in the 21st century.
Countries Vying for Education Hub Status Across APAC Aggressively
Increasing Enrolment Of Foreign Students
Malaysia
200,000 Foreign
Students
by 2020
Singapore150,000 Foreign Students
by 2015
Australia
469,619 Foreign
Students
currently studying
Korea 100,000 Foreign Students
by 2012
India
Developing
Infrastructure to
Become
International
Education Hub
China
500,000 Foreign
Students by 2020
Japan300,000
Foreign Students
by 2020
Taiwan 130,000
Foreign Students
by 2020
Growth at
7.1% APAC
GDP
22 <0000-00>
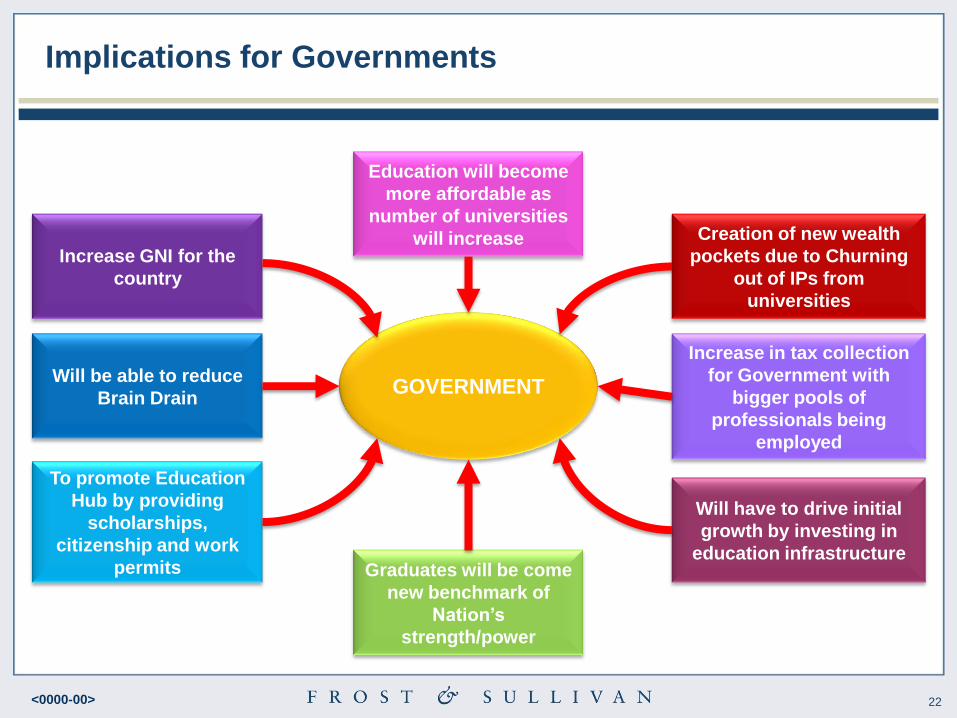
Implications for Governments
GOVERNMENT
Graduates will be come
new benchmark of
Nation‟s
strength/power
Creation of new wealth
pockets due to Churning
out of IPs from
universities
Increase in tax collection
for Government with
bigger pools of
professionals being
employed
To promote Education
Hub by providing
scholarships,
citizenship and work
permits
Will have to drive initial
growth by investing in
education infrastructure
Education will become
more affordable as
number of universities
will increase
Will be able to reduce
Brain Drain
Increase GNI for the
country
23 <0000-00>
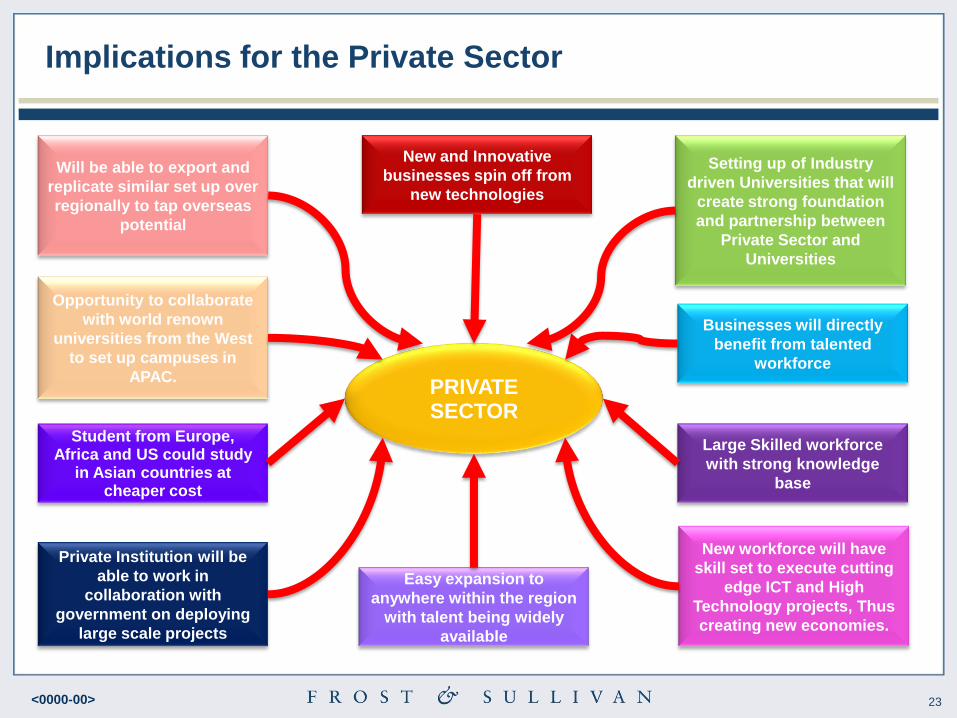
Implications for the Private Sector
PRIVATE SECTOR
Easy expansion to
anywhere within the region
with talent being widely
available
Businesses will directly
benefit from talented
workforce
Large Skilled workforce
with strong knowledge
base
Private Institution will be
able to work in
collaboration with
government on deploying
large scale projects
New workforce will have
skill set to execute cutting
edge ICT and High
Technology projects, Thus
creating new economies.
New and Innovative
businesses spin off from
new technologies
Student from Europe, Africa and US could study
in Asian countries at cheaper cost
Opportunity to collaborate
with world renown
universities from the West
to set up campuses in
APAC.
Setting up of Industry
driven Universities that will
create strong foundation
and partnership between
Private Sector and
Universities
Will be able to export and
replicate similar set up over
regionally to tap overseas
potential
24 <0000-00>
The Asia Pacific Mobile Broadband Revolution
Broadband internet connections will become
ubiquitous in Asia
25 <0000-00>
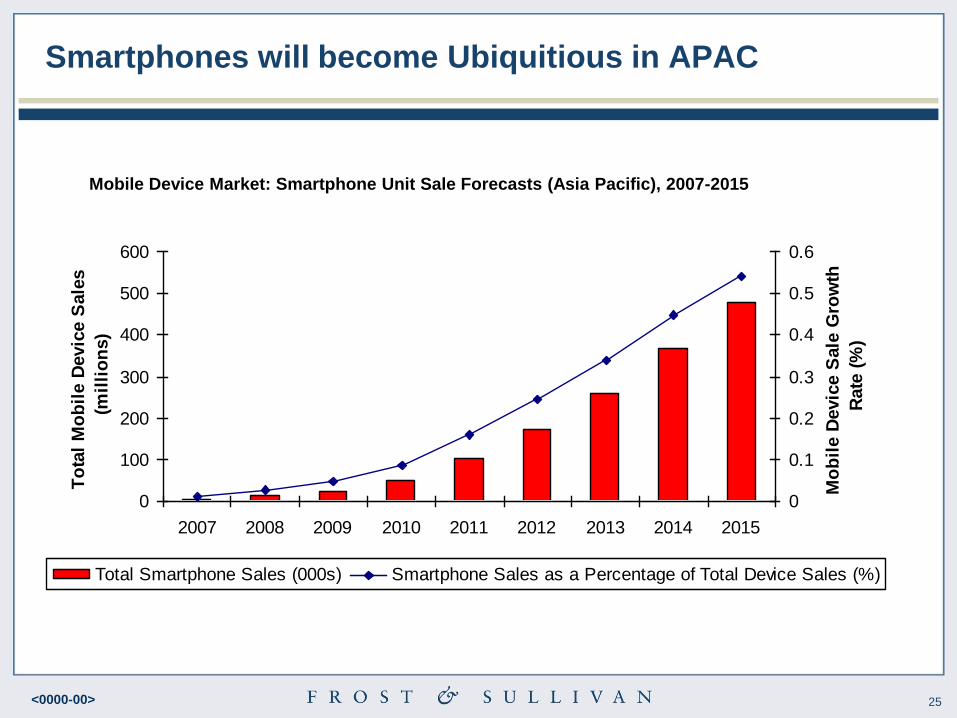
Smartphones will become Ubiquitious in APAC
0
100
200
300
400
500
600
2007 2008 2009 2010 2011 2012 2013 2014 2015
To
tal
Mo
bil
e D
evic
e S
ale
s
(mil
lio
ns)
0
0.1
0.2
0.3
0.4
0.5
0.6
Mo
bil
e D
evic
e S
ale
Gro
wth
Rate
(%
)
Total Smartphone Sales (000s) Smartphone Sales as a Percentage of Total Device Sales (%)
Mobile Device Market: Smartphone Unit Sale Forecasts (Asia Pacific), 2007-2015
26 <0000-00>
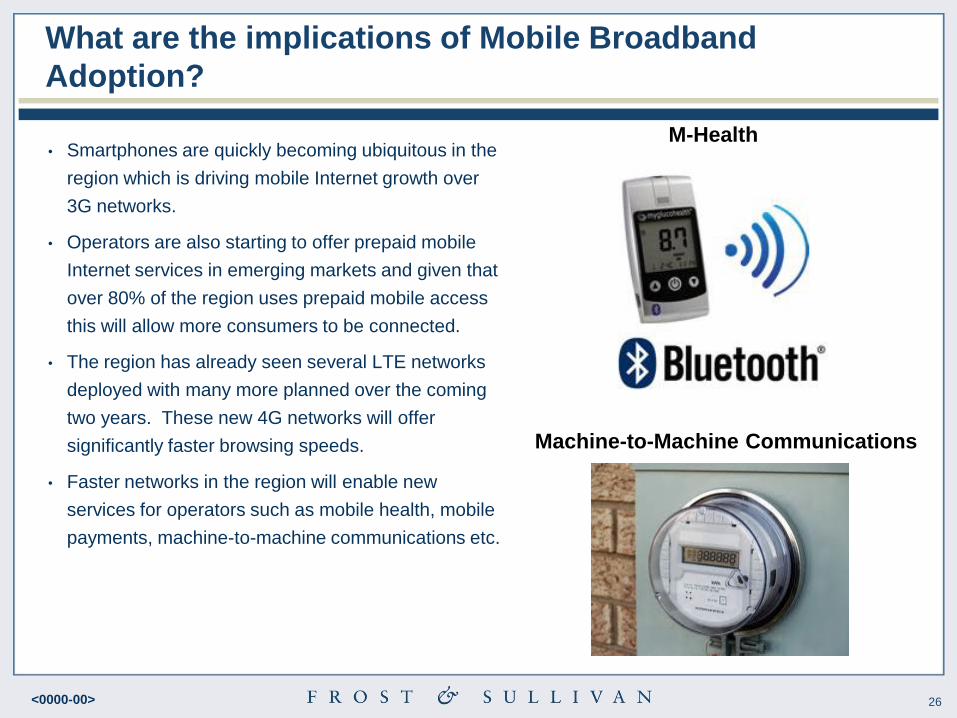
What are the implications of Mobile Broadband
Adoption?
• Smartphones are quickly becoming ubiquitous in the
region which is driving mobile Internet growth over
3G networks.
• Operators are also starting to offer prepaid mobile
Internet services in emerging markets and given that
over 80% of the region uses prepaid mobile access
this will allow more consumers to be connected.
• The region has already seen several LTE networks
deployed with many more planned over the coming
two years. These new 4G networks will offer
significantly faster browsing speeds.
• Faster networks in the region will enable new
services for operators such as mobile health, mobile
payments, machine-to-machine communications etc.
M-Health
Machine-to-Machine Communications
27 <0000-00>
Ageing and growing populations will drive a huge
increase in health expenditure in Asia
Huge Increase in Health Expenditure
28 <0000-00>
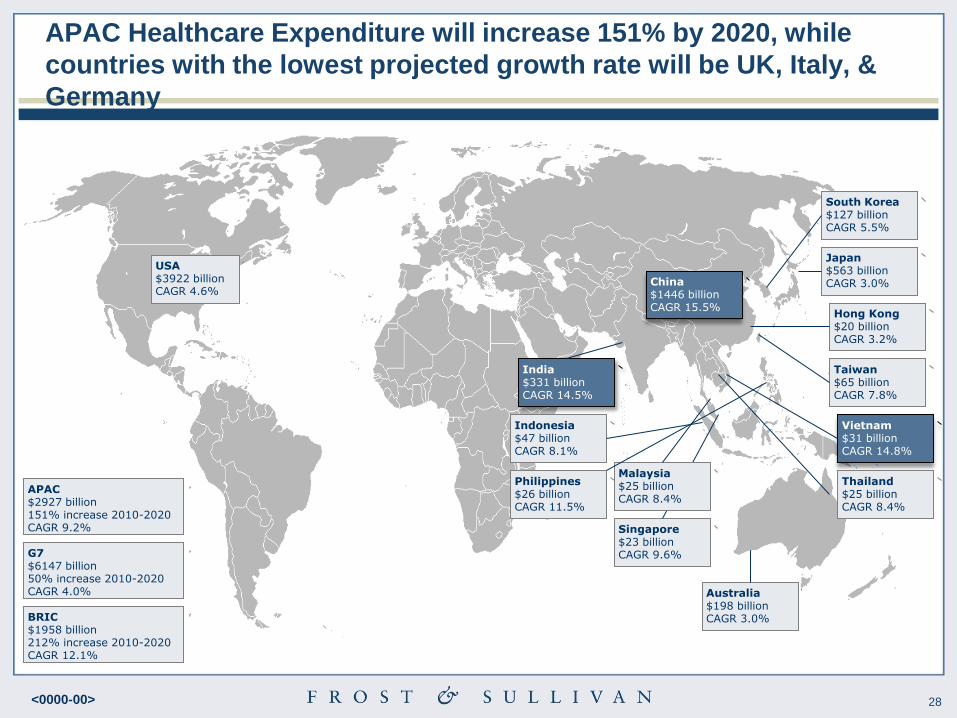
APAC Healthcare Expenditure will increase 151% by 2020, while
countries with the lowest projected growth rate will be UK, Italy, &
Germany
G7 $6147 billion 50% increase 2010-2020 CAGR 4.0%
APAC $2927 billion 151% increase 2010-2020 CAGR 9.2%
Australia $198 billion CAGR 3.0%
Japan $563 billion CAGR 3.0%
Hong Kong $20 billion CAGR 3.2%
South Korea $127 billion CAGR 5.5%
Singapore $23 billion CAGR 9.6%
Malaysia $25 billion CAGR 8.4%
Taiwan $65 billion CAGR 7.8%
India $331 billion CAGR 14.5%
China $1446 billion CAGR 15.5%
Indonesia $47 billion CAGR 8.1%
Vietnam $31 billion CAGR 14.8%
Philippines $26 billion CAGR 11.5%
Thailand $25 billion CAGR 8.4%
BRIC $1958 billion 212% increase 2010-2020 CAGR 12.1%
USA $3922 billion CAGR 4.6%
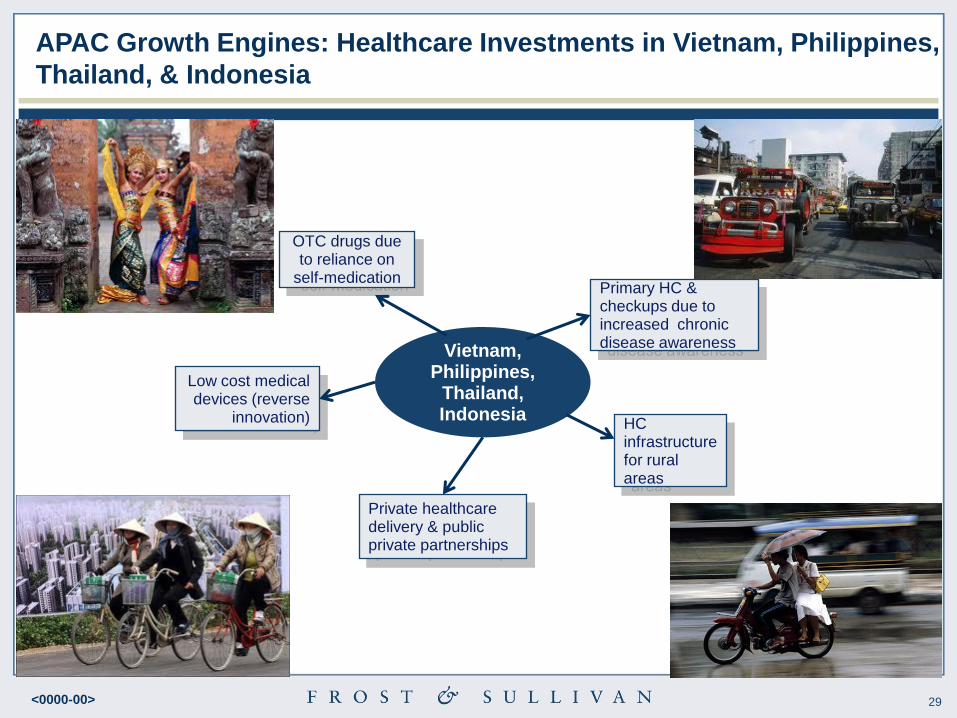
29 <0000-00>
Vietnam, Philippines,
Thailand, Indonesia
Primary HC & checkups due to increased chronic disease awareness
OTC drugs due to reliance on
self-medication
HC infrastructure for rural areas
Low cost medical devices (reverse
innovation)
Private healthcare delivery & public private partnerships
APAC Growth Engines: Healthcare Investments in Vietnam, Philippines,
Thailand, & Indonesia
30 <0000-00>
Control Over Strategic Assets by China
The Chinese Government, either directly or through
SOEs, will increasingly seek to gain control over
strategic assets throughout Asia Pacific
31 <0000-00>
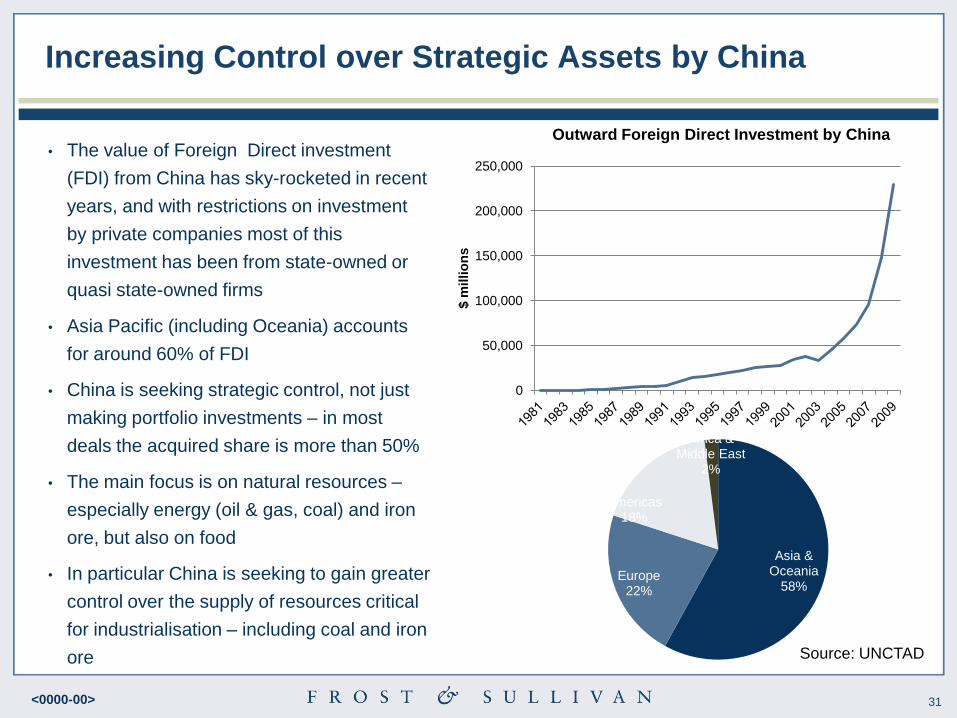
Increasing Control over Strategic Assets by China
• The value of Foreign Direct investment
(FDI) from China has sky-rocketed in recent
years, and with restrictions on investment
by private companies most of this
investment has been from state-owned or
quasi state-owned firms
• Asia Pacific (including Oceania) accounts
for around 60% of FDI
• China is seeking strategic control, not just
making portfolio investments – in most
deals the acquired share is more than 50%
• The main focus is on natural resources –
especially energy (oil & gas, coal) and iron
ore, but also on food
• In particular China is seeking to gain greater
control over the supply of resources critical
for industrialisation – including coal and iron
ore
0
50,000
100,000
150,000
200,000
250,000
$ m
illio
ns
Outward Foreign Direct Investment by China
Asia & Oceania
58% Europe
22%
Americas 18%
Africa & Middle East
2%
Source: UNCTAD
32 <0000-00>
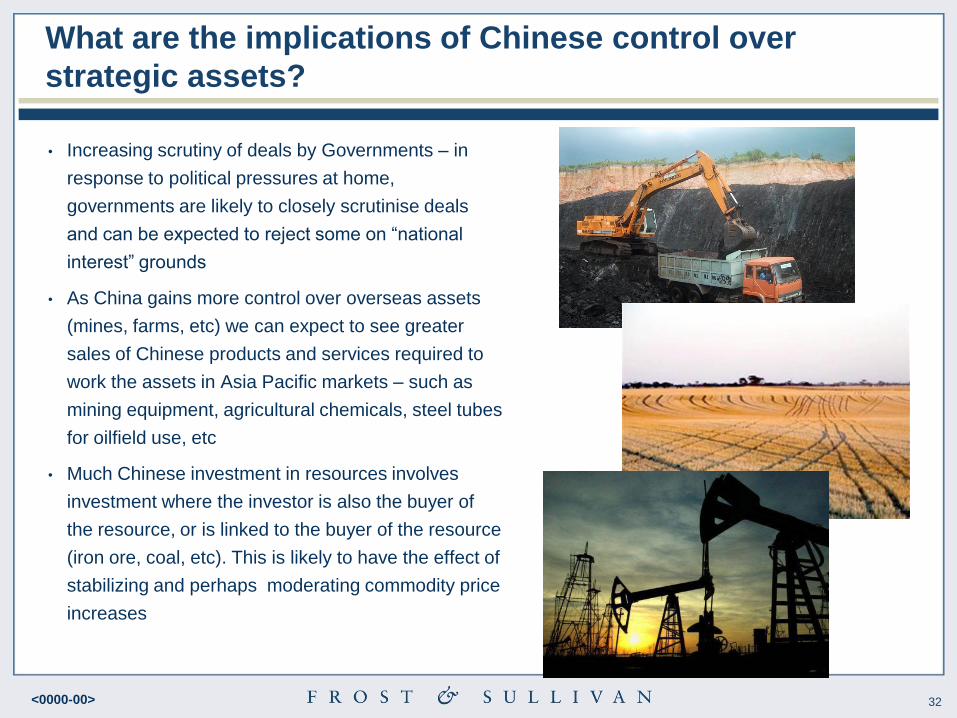
What are the implications of Chinese control over
strategic assets?
• Increasing scrutiny of deals by Governments – in
response to political pressures at home,
governments are likely to closely scrutinise deals
and can be expected to reject some on ―national
interest‖ grounds
• As China gains more control over overseas assets
(mines, farms, etc) we can expect to see greater
sales of Chinese products and services required to
work the assets in Asia Pacific markets – such as
mining equipment, agricultural chemicals, steel tubes
for oilfield use, etc
• Much Chinese investment in resources involves
investment where the investor is also the buyer of
the resource, or is linked to the buyer of the resource
(iron ore, coal, etc). This is likely to have the effect of
stabilizing and perhaps moderating commodity price
increases
33 <0000-00>
Asia Pacific Leads Growth by Tapping New Wealth
Pockets In Renewables Energy Sectors Across
The Region
Huge Growth in Renewable Energy
34 <0000-00>
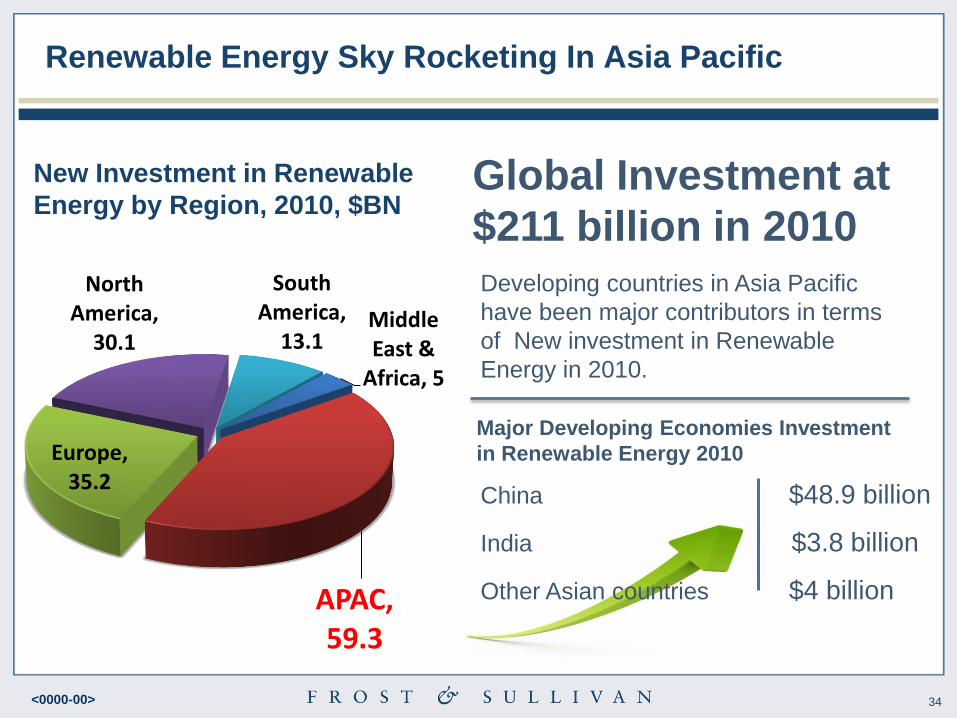
Middle East &
Africa, 5
APAC, 59.3
Europe, 35.2
North America,
30.1
South America,
13.1
Renewable Energy Sky Rocketing In Asia Pacific
Developing countries in Asia Pacific
have been major contributors in terms
of New investment in Renewable
Energy in 2010.
Global Investment at
$211 billion in 2010
Major Developing Economies Investment
in Renewable Energy 2010
China $48.9 billion
India $3.8 billion
Other Asian countries $4 billion
New Investment in Renewable
Energy by Region, 2010, $BN
35 <0000-00>
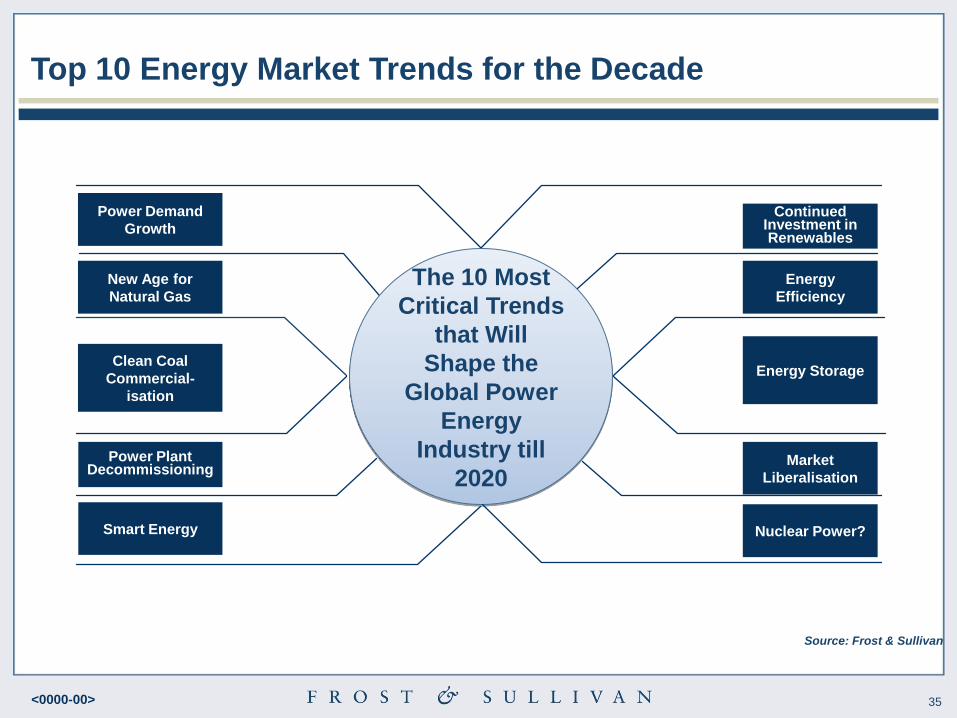
The 10 Most
Critical Trends
that Will
Shape the
Global Power
Energy
Industry till
2020
Source: Frost & Sullivan
Power Demand
Growth
New Age for
Natural Gas
Clean Coal
Commercial-
isation
Power Plant Decommissioning
Smart Energy Nuclear Power?
Energy
Efficiency
Energy Storage
Continued Investment in Renewables
Market
Liberalisation
Annual Power and Energy Outlook
Top 10 Energy Market Trends for the Decade
36 <0000-00>
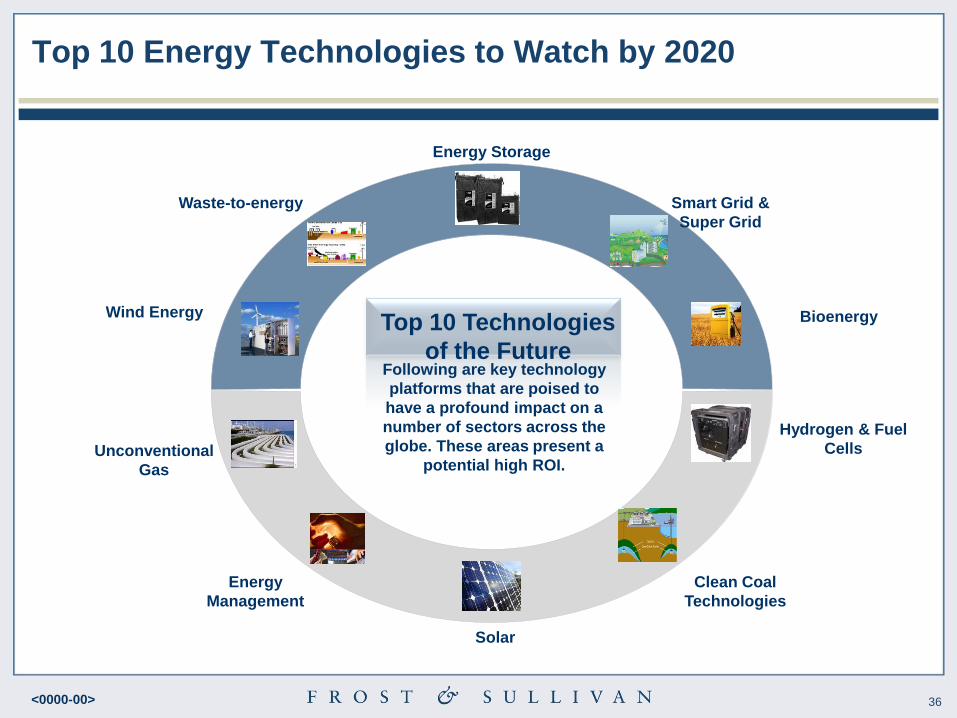
Top 10 Energy Technologies to Watch by 2020
Wind Energy
Waste-to-energy
Energy Storage
Smart Grid &
Super Grid
Bioenergy
Hydrogen & Fuel
Cells Unconventional
Gas
Energy
Management
Solar
Clean Coal
Technologies
Top 10 Technologies
of the Future Following are key technology
platforms that are poised to
have a profound impact on a
number of sectors across the
globe. These areas present a
potential high ROI.
37 <0000-00>
Key Strategic Conclusions
1. Mega trends are connected and inter-wined which suggests ―synergetic‖
opportunities between them
2. It is important to understand the eco-system of the mega-trend and the
elements of the value chain which have most profitability
3. All these trends are global and have global ramifications thereby offering
scalable opportunities
4. These forces are changing rapidly and bringing new competencies into play
at half the life-cycle speed of the past decade
5. Organisations’ need ―Mega Trend‖ champions and teams within their
organisation structure to best exploit the opportunity