from transition to transformation sustainable and ... transition to transformation sustainable and...
TRANSCRIPT

1
UNITED NATIONS SYSTEM REPORT
From Transition to Transformation Sustainable and Inclusive Development
in Europe and Central Asia
UNEDITED DRAFT
I. Overview........................................................................................................... pp. 5‐17
II. The cross‐sectoral policy mix for sustainable development.........................pp. 18‐34
III. Changing production and investment patterns .......................................... pp. 35‐51
IV. Changing consumption patterns ................................................................... pp. 52‐62
V. The social dimension of the green economy ................................................. pp. 63‐88
VI. Institutional arrangements supporting the shift towards sustainable development .................................................................................... pp. 89‐103
Statistical annex .................................................................................................. pp. 104‐108
References .......................................................................................................... pp. 109‐118
The report has been jointly prepared by the following agencies:
UNECE, UNDP, UNEP, UNIDO, WHO, FAO, ILO, UNICEF, UNESCO, UN WOMEN
In addition, UNFPA, ITC and ITU have provided inputs to the report.

2
Abbreviations
Subregions of the UNECE region
South-Eastern Europe (SEE)
Albania Montenegro
Bosnia and Herzegovina Serbia
Croatia Turkey
The former Yugoslav Republic
of Macedonia
Eastern Europe, Caucasus, and Central Asia (EECCA)
Armenia Moldova
Azerbaijan Russia
Belarus Tajikistan
Georgia Turkmenistan
Kazakhstan Ukraine
Kyrgyz Republic Uzbekistan
New EU post-transition member States (NMS)
Bulgaria Lithuania
Czech Republic Poland
Estonia Romania
Hungary Slovakia
Latvia Slovenia
Emerging Europe and Central Asia (ECA) = EECCA + SEE + NMS

3
Advanced ECE Economies
Andorra Liechtenstein
Austria Luxembourg
Belgium Malta
Canada Monaco
Cyprus Netherlands
Denmark Norway
Finland Portugal
France San Marino
Germany Spain
Greece Sweden
Iceland Switzerland
Ireland United Kingdom
Israel United States
Italy

4
INTRODUCTION The 2012 United Nations Conference on Sustainable Development provides the Pan- European region the opportunity to assess its progress towards sustainable development and plan for the actions needed in order to place this part of the world more firmly on a sustainable development path. While many countries in this region are taking action towards environmental, social and economic sustainability, these efforts are not yet sufficient to significantly accelerate the pace towards a development model with a strong sustainability dimension. Therefore, this report aims to present the challenges linked to sustainable development in the pan-European region and to make concrete policy proposals for managing the green transition with greatest benefit for the people of the region.
The human centered dimensions are at the core of the development paradigm advocated in the report. Such an integrated approach has been made possible due to the wide range of expertise and experience of UN entities active in the region. It is also a demonstration of the UN’s commitment to work with countries on policies and strategies to advance green economies and sustainable development in Europe and Central Asia.
Three concepts underpin this report:
Resource depletion and environmental degradation: While there is some good news in terms of energy efficiency in fossil fuel consumption and use of renewable energy, the region is still one of the most energy intensive regions in the world; similarly progress has been made in preserving natural resources with an overall increase of forest areas and the establishment of protected areas but ecosystem services and biodiversity continue to be depleted and degraded, and the value of natural capital is not recognised yet in national accounting systems.
Poverty: This report emphasizes the synergies between the goals of poverty eradication and sustainable development. In the long run, transformation to inclusive and sustainable development will reduce the vulnerability of the poor to environmental degradation and create the necessary basis for their development. However, during the transition specific prevention and protection measures are necessary. A social protection floor is a critical investment. Fiscal space can be created from government revenues associated with raising the price of carbon-heavy energy, the reduction of waste and better targeting of social protection measures.
Inequality: During the past two decades, inequality has increased rapidly in both Eastern and Western parts of the ECE region. This trend has aggravated living conditions in some areas due to lack of employment, inadequate housing, education, health and social services, and degradation of natural resources - in particular soil and water. The report reviews the policy initiatives aimed at reducing social and geographical inequalities and proposes directions for further interventions linking new technology and climate change related investments directly to the reduction of inequality.

5
Box 1.1: Sustainable Development: Incremental Change as part of Transformation
This report argues that changes at the margins will not yield the necessary turnaround to avoid growth and demographic patterns that outpace the earth’s available resources. While a paradigm shift is needed, not all countries, economies, economic sectors and localities are immediately ready for a full paradigm shift. Incremental changes that can lead to positive results include:
Sustainable energy access for all: A particular sustainability challenge will be ensuring stable, secure, safe and affordable energy access and availability in low income countries as well as remote areas of middle income countries of the UNECE region. Well‐targeted subsidies for the poor will be needed to ensure access to energy to support human development in remote areas.
Green economy transition: In a green economy, increasing income and employment should be driven by public and private investments that reduce carbon emissions and pollution, enhance energy and resource efficiency, and prevent the loss of biodiversity and ecosystem services. One quick productivity win for Europe and Central Asia is to upgrade production with state of the art technology to make current industry and residences more energy efficient. A green economy is not a luxury for wealthy countries. There are growing examples of green transitions in developing countries. A social protection floor is needed to help vulnerable groups cope with possible changes in labour markets, building and updating skills and addressing price changes.
Sustainable development paradigm: This transformation is akin to a revamped industrial revolution, one that seeks a better use of natural resources for a more equal and healthy society. Economically, this means changing the composition of an economy towards an increasing range of green and resource efficient sectors. For every economic policy or investment, decision makers must ask themselves: on balance, is this negatively affecting our people or depleting our natural resources? This transformation does not necessarily imply increased government deficits: Elimination of harmful subsidies, Fossil fuel tax revenues and budgetary incentives can provide funds for promoting a business friendly environment. Governments will also see reduced costs by preventing respiratory and cardiovascular disease owing to healthier environments.
Chapter I. Overview
A. The UN calls for a sustainable development paradigm
Since the 1992 Rio Sustainable Development Summit, the world has seen progress in economic growth. But this progress came at the expense of natural resources, social equity and, for parts of society, human welfare. Many countries’ economic growth brought with it widening income gaps between rich and the poor, deteriorating social cohesion and increased rates of disease. As a result of this growth path, the world is facing concurrent crises cutting across the environmental, economic and social spheres: global warming, depletion or degradation of natural capital, persistent high levels of pollution, high unemployment, pervasive poverty, inequality and social exclusion. These crises are clearly inter-related: when the natural resource base is destroyed, ensuring economic development and social equity becomes ever more difficult.
Rather than working at the margins, this diagnosis calls for completely revisiting the conventional model of economic progress. As the UN Secretary General states: “We all aspire to reach better living conditions. Yet, this will not be possible by following the current growth model…We need a practical twenty-first century development model that connects the dots between the key issues of our time: poverty reduction; job generation; inequality; climate change; environmental stress; water, energy and food security.”
What is needed is a dramatic shift from the growth model of the past whereby industrial revolution fuelled rapid growth that hinged on the exploitation of natural resources and generated large but unequally distributed wealth. This model has led to unsustainable patterns of consumption and production. It is time for a profound questioning of the prevailing economic approach to development, not only for the planet, but more importantly for the sake of its women and men, especially the most marginalized and vulnerable.
What is Sustainable Development? Meeting the needs of the present generation without compromising the ability of future generations to meet their needs. It involves three interdependent and mutually reinforcing pillars: The economic, social and environmental pillars of sustainability. The three pillars cannot work if they are seen as competing agendas. A sustainable development paradigm changes how investments and public policies are made: take for example energy policy, it must be reviewed for its implications on health, equity and employment.
In the medium and long run, this kind of transformation will imply a radical change in how economies produce goods and services, how growth is composed, and the lifestyles we lead. Looking forward, behavior of both producers and consumers will evolve, both by necessity (depletion of natural resources, increased extreme weather events and high

6
Box 1.2: Strong or Weak? Two visions of Sustainability
Wea k Sustainability: Proponents of weak sustainability believe that technology can substitute the loss of natural capital. As a natural resource becomes scarcer, its rising relative price encourages innovators and owners of assets that can be substituted for the diminished scarce resource.
Strong Sustainability: Advocates of strong sustainability believe that the accumulation of physical or other kinds of capital cannot compensate for Earth’s warming, the ozone layer’s depletion and major biodiversity losses. Societies should strive to sustain the flow of services from natural capital because natural materials and services cannot be duplicated.
2011 UNDP Human Development Report
levels of pollution) and under the impulse of policies stimulating the move towards sustainable production and consumption patterns. While change is imminent, we need to move beyond the perception that sustainable development will decrease our quality of life. It is already proven to be possible to have a high quality of life without, for instance, high carbon emissions : While Costa Rica, for example, has a high life expectancy with carbon emissions levels below the world average, Croatia is also noteworthy for its relatively high life expectancy while emissions are hovering just above the world average.1
This report holds that some forms of environmental degradation are irreversible, and therefore espouses a “strong sustainability model”. In this vein, a core operational objective of the green economy is to place a higher value on natural capital. It implies an ever more flexible and dynamic economy, strong shift towards less carbon intensive structures and a sound management of biodiversity and ecosystem services. According to a study conducted by the Global Footprint Network in 2011, demand for ecological assets is growing unabated as global population grows, consumption rises, and the size of the global economy increases. As citizens of the world, we are in overdraft: living off of borrowed resources that we don’t have.
The good news is that sustainability can drive economic competitiveness. In the future, the demand for brown products will decrease as production processes making extensive use of dwindling resources become increasingly costly. Some countries, for example Germany, have started to position their economic development strategies for the eventual greener market. The sooner countries take a position on sustainability consistent with global constraints, the better placed they will be to harness an eventual shift in market incentives.
The development of greener markets must also decisively benefit the poor whose livelihoods depend far more on natural capital assets than richer households. If the green economy is approached with the right policy framework, it can reduce inequalities. A more inclusive society is more likely to be sustainable: first because better access to quality education, health services, housing and clean water means the poor and vulnerable people are better equipped to contribute to economic growth, care for their children and embrace the new low-carbon approach to production and consumption. Secondly, greater equity and better chances of social mobility help reduce social bads, such as criminality, mental illness, and drug abuse, which in turn also fosters productivity and sustainable development.
For this complex web of changes to take hold, the incentives that underpin and influence the behaviour of women, men and all economic actors must change. This starts at the individual and household level. Responsible for buying 80% of household goods, women are critical to advancing a shift to sustainable consumption.2 Public authorities have a decisive responsibility to advance a change in incentives; resistance to pressure from lobbies - particularly the energy intensive industrial sectors – is key to enforcing the policies necessary to shift towards sustainable development. The private sector must also be a driving force of change through sustainable business models, technology innovation, greener products and services. Civil society organizations have also a key role to mobilize public opinion and advocate for a more environmentally sound, inclusive and just society, which is the ultimate goal of the new sustainability paradigm.
1 Richard Wilkinson and Kate Pickett, The Spirit Level, Why Greater Equality Makes Societies Stronger, 2009 2 http://www.unpac.ca/economy/consumers.html
7
0
2
4
6
8
10
12
14
0.6 0.7 0.8 0.9 1
Human Development Index (value)
Ecological footprint (Global Hectares per capita)
USA
DNK
MDA
AZE
SVK
TUR
NOR
RUS BLR
FRA
ALB
ARM
MKD
SWE
KGZ
UZB
BIH
UKR KAZ
TJK
CAN
DEU
SVN
HRV
CZE
HUN
FIN
LTU
EST
NLD
IRL
BGR
ISR
PRT
ISLBEL
ESP
CHE
GRC
LVA
POL
ITA
ROU
AUT
GBR
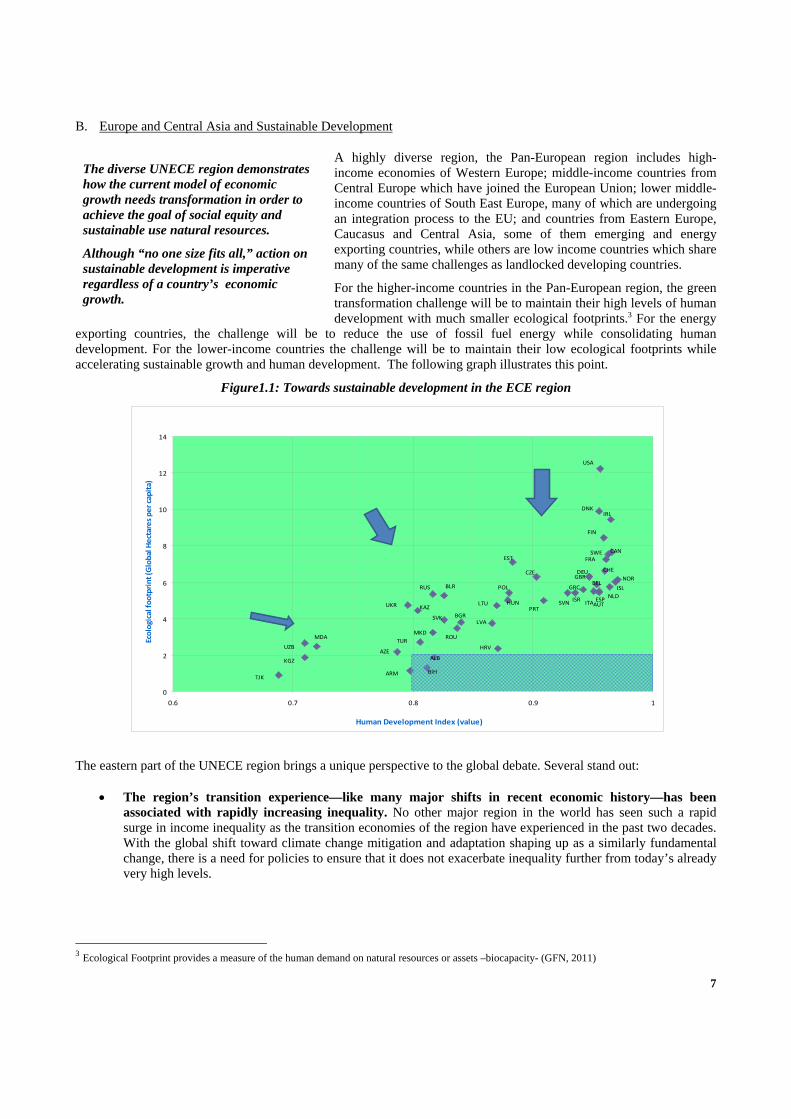
The diverse UNECE region demonstrates how the current model of economic growth needs transformation in order to achieve the goal of social equity and sustainable use natural resources.
Although “no one size fits all,” action on sustainable development is imperative regardless of a country’s economic growth.
B. Europe and Central Asia and Sustainable Development
A highly diverse region, the Pan-European region includes high-income economies of Western Europe; middle-income countries from Central Europe which have joined the European Union; lower middle-income countries of South East Europe, many of which are undergoing an integration process to the EU; and countries from Eastern Europe, Caucasus and Central Asia, some of them emerging and energy exporting countries, while others are low income countries which share many of the same challenges as landlocked developing countries.
For the higher-income countries in the Pan-European region, the green transformation challenge will be to maintain their high levels of human development with much smaller ecological footprints.3 For the energy
exporting countries, the challenge will be to reduce the use of fossil fuel energy while consolidating human development. For the lower-income countries the challenge will be to maintain their low ecological footprints while accelerating sustainable growth and human development. The following graph illustrates this point.
Figure1.1: Towards sustainable development in the ECE region
The eastern part of the UNECE region brings a unique perspective to the global debate. Several stand out:
The region’s transition experience—like many major shifts in recent economic history—has been associated with rapidly increasing inequality. No other major region in the world has seen such a rapid surge in income inequality as the transition economies of the region have experienced in the past two decades. With the global shift toward climate change mitigation and adaptation shaping up as a similarly fundamental change, there is a need for policies to ensure that it does not exacerbate inequality further from today’s already very high levels.
3 Ecological Footprint provides a measure of the human demand on natural resources or assets –biocapacity- (GFN, 2011)

8
The Eastern Europe Caucuses and Central Asia region has been the only part of the in the world that has seen a large absolute decline in carbon emissions in the past two decades. The European Bank for Reconstruction and Development’s special report on climate change highlights the 28 percent fall in carbon emissions in this region even as GDP rose by 22 percent during 1990-2008. The extremely wasteful starting position has certainly been a factor explaining this. But the predominant role was played by the huge shift in energy prices and relative prices, coupled with a sharp reduction in non-price energy subsidies. These have provided economic incentives to change the structure of economic activity including consumption patterns, and invest in more energy-efficient production. That said, the region still includes several countries with comparatively high energy intensity of output, notably Uzbekistan, Kazakhstan, and Russia. Given the continued predominant role of fossil fuels, this translates directly into very high per capita outputs of carbon.4
Sustainability issues are already at the forefront in Central Asian countries. The devastation of the Aral Sea is a visual reminder of the consequences of unsustainable practices. Discussions about UN-regulated, safe, trans-boundary transit of energy supplies and problems in water supply and agriculture have highlighted binding constraints. This region is thus a “laboratory” where the main elements necessary for real-life solutions could emerge as an integral part of a regional green economic vision.
Finally, Eastern Europe can provide a good return on green investments: a) There is significant room for improvement of environmental indicators, b) The region’s relatively skilled labour force can be ‘repackaged’ in a green economy and c) An increasingly vibrant private sector can leverage funds to multiply the impact of investment in a green economy. There is solid potential in this region to create decent jobs in green or newly greened activities, such as renewable energy, waste recycling, or energy-efficiency retrofits. Green market products could be a source of wealth creation which, combined with anti-poverty measures, would result in improved quality of life for many people, in under-developed areas and among vulnerable groups. If targeted well, the green economy could mitigate the gender gap in employment and create opportunities for greater gender equity in this part of the region.
For the Pan-European region, catalyzing a transformation towards sustainable development would have many clear cut benefits: a reduction of the ecological footprint, more resilient ecosystems and ecosystem services, increased natural capital, carbon materials and eco-efficiency, and new areas for growth and innovation. In a sustainable development paradigm, the Pan-European region would be healthier due to reduced non communicable and communicable diseases, lower pollution and noise, improved diet and physically activity. Sustainable lifestyles would allow for many new goods and services to be produced, consumed and traded among countries of the region. Finally, moving towards
4 Climate change is about more than CO2. A full analysis would need to cover all human-related net greenhouse gas emissions (CFCs, methane, nitrogen oxides, perfluoronated carbon compounds, ozone, burning of rainforests, etc.), plus those from non-anthropogenic sources, as well as connections among them and the feedback loops.
Box 1.3: Europe and Central Asia’s Commitment to Move forward on Sustainable Consumption and Production
At the Seventh “Environment for Europe” Ministerial Conference, Astana, 21–23 September 2011, governments of the UNECE region agreed to take further steps to pursue implementation of 10-Year Framework of Programmes on Sustainable Consumption and Production. This has been a core component of the international sustainable development agenda since the adoption of Agenda 21 at the Earth Summit in 1992. Ten years later, in the Johannesburg Plan of Implementation the international community recognized Sustainable Consumption and Production as one of the overarching objectives of and an essential requirement for sustainable development, and called for the development of the 10 year framework. Since then, important progress has been achieved with support from governments and all major groups, through numerous initiatives and partnerships, including the Marrakech Process on Sustainable Consumption and Production, jointly coordinated by UNEP and the UN Department of Social and Economic Affairs. The governments of the UNECE region have played a key role in the development of the framework, and the recent reactivation of commitment in Astana is a signal that they are ready to move forward on this critical component of sustainable development.
9
sustainable development can enhance the livability of the region, by retrofitting and building greener cities visible in environmentally-friendly transport, and improved waste and water management.
C. Situation of the region
The pan-European region has seen huge progress both in social and economic development, reflected by the increase in the Human Development Index. Since 1999, nearly 90 million of the 480 million people in Eastern Europe and Central Asia – about 18% of the population – have moved out of poverty. Yet poverty is not yet a part of history: almost 30% of the people in Eastern Europe and Central Asia are considered poor or vulnerable, and this is expected to increase by about 5 million people for every 1% decline in GDP.5 The recent financial crisis sets the region back considerably. Even in the European Union countries poverty has been on the rise again in recent years. Attention needs to be paid to the risk of further impoverishment resulting from unemployment, increased food price, health expenditure and energy costs which affect in particular the low income households in Eastern Europe and Central Asia..Women have been particularly hard hit by the crisis--not only because of increased unemployment and declining incomes, but also because of an increasing burden of unpaid work.
The region has also taken important steps to reduce environmental degradation with impressive results: improved urban air quality, the phase-out of ozone-depleting substances, a larger use of renewable sources of energy, improved water management and increased coverage of protected areas. Most governments of the region are signatories or parties to the major global and regional environmental and climate change conventions and protocols. Overall, tangible progress has been made in reaching the Millennium Development Goal 7 targets, particularly in integrating the environmental dimension into policy-making in key sectors such as agriculture, transport, and housing, reducing CO2 emissions, increasing energy efficiency and strengthening the sustainable management of forests.
However, Europe and Central Asia is still far from achieving sustainability. Growth in income has been associated with deterioration in key environmental indicators, so much so that the Pan-European region has the highest ecological footprint6, compared to the rest of the world. Most countries are running on a biocapacity deficit,7 i.e., they use more resources than they have in their territories.8
Depletion of natural resources is not only disastrous for the environment, it is a problem for the women and men of the Pan-European region. It is often the poorest of the poor who are affected by environmental degradation, as they are heavily dependent on natural resources (almost three quarters of their income) and thus more vulnerable to environmental shocks. Particularly in Eastern Europe, many families depend on non-network energy such as solid fossil fuels for heating and cooking. This has drastic human consequences: in 2004, more than 14000 people lost their lives due to reliance on these kinds of dangerous heating and cooking sources.9
GHG emission trends
The pan-European region has historically been a large emitter of greenhouse gases that contribute to global warming – it currently accounts for around half of global GHG emissions. According to the European Environment Agency (2010), annual emissions of GHG in the European Union in 2008 – the year of latest available data – amounted to roughly 10 tonnes of CO2-equivalent per head, well above the sustainable per capita target of 2 tonnes that would limit a rise in global temperatures to 2 degrees Celsius by 2050.10
Despite progress, a number of countries in Eastern Europe Caucuses and Central Asia remain among the least energy efficient and most carbon intensive economies in the world. Triggered by enterprise restricting, significant energy efficiency improvements have taken hold in the formerly centrally planned – and resource intensive economies of the Soviet Union. Energy intensity of production declined on average by 40 per cent between 1990 and 2007 in the transition economies and by more than 60 per cent in the New Member States of the EU. While initial improvements
5 World Bank 2009.
6 Essentially an attempt to quantify and produce a measure of human demand on biocapacity 7 These deficits are made possible by liquidation of ecological assets, net importing biocapacity, or using global commons. 8 Global Footprint Network, 2011
9 WHO Regional Office for Europe
10 For details see D. King et al (2011), International climate change negotiations: Key lessons and next steps. Oxford.

10
were due to the transition recession, in the second half of the 1990s, ‘decoupling’ started to occur whereby output levels increased while the energy use continued to decline. Since the early 2000s, energy use has grown at a slower pace than production, but this tendency has been overwhelmed by robust output growth.
Most of the economies in the region have achieved sizable reductions in energy intensity and GHG emissions per $1 of GDP. The energy intensity of GDP in Western Europe is approximately a third lower than in North America and less than half than in the eastern part of the pan-European region (annex table 1). There is considerable potential for reducing emissions in Eastern Europe and Central Asia by increasing their efficiency to the levels of Western Europe. The challenge is to deliver the mix of appropriate policy instruments, technological innovation and financing which can lead to such significant energy efficiency gains. This policy mix is described in Chapter 2 of this report.
Despite the failure to reach an agreement at COP-15 in Copenhagen in December 2009, most of the economies of the pan-European region are making commitments to further reduce their GHG emissions and many have implemented programs and regulations to achieve these objectives. For example, the EU has committed to a 20 % reduction in GHG emissions from 1990 levels by 2020. However the pledges made at Copenhagen and other proposed national policies – even if fully implemented – are not yet enough. These policies may stabilize GHG emissions by 2020, but world emissions must decline by at least 50 % in order to limit global temperature increases to a manageable level (i.e. about 2 degrees centigrade). None of the economies of the region have put forth a national agenda that will be sufficient to reduce emissions to a level that is sustainable over the long-run. In order to achieve the necessary large reductions in GHG emissions, a major restructuring is needed in many industries, including agriculture, energy production, transportation, housing/building design and urban planning. In order to offset potential job loss and support sectors directly affected by climate change, governments of the region will need to put in place incentives for green enterprise, and establish social protection and retraining schemes for women and men currently employed in carbon intensive or environmentally hazardous sectors.
Biodiversity trends
Natural capital, including biodiversity and ecosystem services, is an important economic asset, especially for the livelihoods and security of poor people. In spite of the introduction of biodiversity legislation and nature directives across the region, biodiversity is being lost at an unparalleled pace. The capacity of ecosystems to sustain the delivery of goods and services is being undermined. Further land-cover conversion and intensification of land use may negatively affect the region’s biodiversity, for example, through habitat destruction, fragmentation and natural resource depletion, or indirectly through pollution (for example eutrophication and acidification).
One quarter of the world’s forests are situated in the pan-European region, of which approximately four fifths are in the Russian Federation. In the Caucasus and Central Asia, forest area has been expanding mainly due to major afforestation and reforestation programmes, however forest cover remains low in most of these countries and must compete with other land-uses. The overall area of protected forests is now about 40 million hectares, 17.5 million of which are in Russia. Forests provide watershed services such as storage, purification and release of water to surface water bodies and subsurface aquifers, while they also contribute to the slowing down of erosion and desertification phenomena. The regions’ forest ecosystems are key to sustainable development, contributing to climate-change mitigation through carbon storage in trees, litter and soil and harvested wood products, and providing a renewable construction material and source of energy. While overall forest area is increasing in the region, forest fragmentation is also increasing and is having a detrimental effect on important European habitats.
The region’s diverse marine and coastal ecosystems, ranging from the Mediterranean to Arctic habitats are under threat due in large part to overexploitation of fisheries. About 45 per cent of assessed European fish stocks are endangered as a result of unsustainable fishing. At the same time, the impact of climate change has become more obvious in recent years. In the Arctic seas, the impact of climate instability on biodiversity is under way already and much larger impacts expected (with significant regional variation) over this century. There are places in the Arctic that are warming 5–10 times faster than the rest of the planet.
The temperate mountainous grasslands are valuable ecosystems in the agricultural landscapes of the Balkan and Carpathian countries. They are the result of many centuries of stable agricultural management using the grasslands for grazing animals (pastures) or making hay (meadows) or combinations of both uses. As a result of this sound management over the long-term, the ecosystems in these areas are well developed, rich in species and characteristic of their bio-geographical region. In some areas of Europe, land abandonment as a result of policy and economic changes can threaten habitats and agricultural biodiversity. For example, the decline of agriculture in countries of the Caucasus and Central Asia has reduced the degradation pressure on the foothills of their mountains, while land abandonment

11
through withdrawal of extensive agricultural activities such as traditional livestock grazing has altered the biodiversity composition of these areas and the landscape. Areas of high nature value farmland have been identified across Europe and there are concerns that without appropriate incentives for the farmers, these areas with high biodiversity may be lost.
Areas of high nature value farmland have been identified across Europe and there are concerns that without appropriate incentives for the farmers, these areas with high biodiversity may be lost. Agri-environment measures and other incentive mechanisms under the EU Common Agricultural Policy, the Canadian Agricultural Policy Framework and the USA Natural Resources Conservation Service Programs provide incentives to promote conservation of biodiversity and sustainable farming practices but these are rare in Eastern Europe and Central Asia.
Reversing the loss of biodiversity has been an explicit part of the MDG agenda since 2006 when the countries of the pan-European region agreed “to halt the loss of biodiversity by 2010”. Despite this ambitious goal, the 2010 biodiversity target was not reached. Depending on the issues and the subregions, progress so far shows mixed results. Natural habitats, for example, are increasingly protected in the EU through the Natura 2000 framework (as much as 17 per cent of the land area). Yet 40 to 85 per cent of habitats and 40 to 70 per cent of species of European interest have an unfavourable conservation status. New targets and a 2020 vision on biodiversity have been agreed globally by the Parties to the Convention on Biological Diversity in 2010, and these are being integrated in national and EU policy in the region.
Water management trends
The sustainable management of water resources is an important part of sustainable development: it can promote water efficiency and channel water resources where they create most value, as well as reduce the spread of disease. Improvements in water management can also contribute to climate change mitigation (less energy is used to pump water, treat it and treat effluents), and adaptation (as competing demands for water are reduced). Further, wastewater can also be a source of energy (through heat and sludge).
In most parts of Europe water quality has improved over the past 20 years, due to better regulations, enforcement and investments in wastewater treatment plants, mainly in Western Europe, including new EU member states. Throughout the region production has become cleaner, resulting in a decrease of pollution from industrial facilities. However, there are numerous remaining pressures from agriculture (which, as a non-point source is difficult to tackle), untreated or insufficiently treated industrial and domestic wastewater, mining, old chemical burdens, unsafe landfills and unsafe tailing ponds. Some growing pressure is expected due to increased economic activity, especially in the eastern part of the region. River hydromorphology and river continuity has improved in many European basins through the reconnection of wetlands and flood-plains. However, hydromorphological alterations are still a major challenge. The EU’s Water Framework Directive has helped improve water use and efficiency, which has been uneven across sectors and subregions. In the agricultural sector, some progress has been achieved in alternative technologies (e.g., drip irrigation), crops and farming practices which have resulted in reduced water losses, more crop per drop and reduced run-offs. National economic instruments (e.g., water pricing, pollution charges) have contributed to this process, together with education and awareness raising activities.
Outside the EU, various factors impede progress, including inadequate regulatory and incentives frameworks (low tariffs and collection rates), low awareness across a wide range of stakeholders and lack of financial resources to extend or maintain the infrastructure. Coherent financial and investment policies to address water supply and sanitation are often lacking, as are resources to sustain infrastructure at the local level and maintain existing centralized systems. In many countries, more than 30 per cent of water is lost in transfers from supply sources to consumers such as in open water canals. Special problems relate to the quality and affordability of water services for parts of the population. An increasing number of persons are not able to afford the price of water at full cost recovery, especially if costs charged include collection and treatment of wastewater. Social measures often are ineffective and poorly targeted.
Water quality in most of the region has improved over the past 20 years, due to better regulations, enforcement and investments in wastewater treatment plants, though these improvements are seen mainly in Western Europe, including new EU member states. Still 4 million people living in urban areas and 15 million people in rural areas still use unimproved water sources, and the 35 million women and men have substandard sanitation facilities, increasing their vulnerability to water-related diseases. Although infant mortality and morbidity from water-related diseases have been on the decline, significant subregional inequalities remain. Approximately 13,000 deaths in this region occur each year

12
due to diarrhoeal disease from unsafe drinking water.11 This is primarily a problem in the low-income economies in Central Asia. Approximately a third of the region’s population live in countries suffering from water stress. This percentage is expected to rise significantly due to climate change and other pressures on water resources. Such stress is particularly apparent with respect to freshwater resources in arid or semi-arid areas. One of the most important hot spots for environmental stress is Central Asia.12
D. Risks for the region of not accelerating the pace towards sustainable development
Failure to take sufficient action will now only affect the region, it can reduce human development as a whole. UNDP’s 2011 Human Development Report projects that by 2050 the global Human Development Index would be 8 percent lower than in the baseline in an “environmental challenge” scenario that captures the adverse effects of global warming on agricultural production, on access to clean water and improved sanitation and on pollution. An even more adverse “environmental disaster” scenario, which envisions vast deforestation and land degradation, dramatic declines in biodiversity and accelerated extreme weather events, the global HDI would be some 15 percent below the projected baseline.
The risks of delaying the transition towards sustainable development are considerable, given the irreversible nature of biodiversity loss, global warming and the increasing frequency of extreme weather events and other harmful effects of climate change. The ecosystem services that make a direct contribution to human wellbeing – such as provision of freshwater, pollination and the regulation of meso-climates are being degraded in most parts of the region. These services are economically invisible with their contributions neither fully recognized nor valued in markets. Changes in the availability and quality of ecosystem services reduce resources for the poor and vulnerable, while also threatening ecological infrastructure that can protect the most vulnerable from natural disasters. Natural flood defences once provided by forests and wetlands have been lost and this is a direct threat to the region’s poorest women and men. Unlike the rich, the poor are unable to replace these services with flood control infrastructure.
Floods and heat waves increase the likelihood of water-related diseases and other damaging impacts to human health. The impacts of climate change, increasing the frequency of floods and droughts and giving raise to heat and cold waves are common across the region. Water scarcity is increasing and has a direct impact on citizens and economic sectors, affecting large areas of the entire region. Water scarcity and droughts affect large populations and have consequences for many sectors, particularly agriculture. The availability of cooling water is a particular concern for thermal and nuclear power plants, as plant cooling accounts for about a third of European water abstraction. The increasing frequency of unpredictable extreme weather events poses considerable risks to economic activity in key sectors that are most exposed to climate change, including agriculture and transport. Extreme weather events in the region in recent years have resulted in lower production and higher prices of food as well as serious damage to transport infrastructure, all of which affects poor households most. Moreover, temperatures and more arid climatic conditions could further aggravate problems of desertification, land degradation, and falling crop yields already experienced by parts of the region. Droughts, depending on their severity and duration could undermine economic growth and human development.
Changes in the sea level will affect the region’s four basins (the Baltic Sea, the East Adriatic and Mediterranean coast of Turkey, the Black Sea, and the Caspian) and the Russian Arctic Ocean. By 2100, the Arctic is expected to warm by 3-5° C over land and 7° C over the oceans, contributing to dramatic changes in its ecosystems. Predicted impacts include a more than 50% decline in the extent of summer sea ice and the displacement of existing Arctic species and ecosystems (e.g. polar deserts and tundra) as southern species and ecosystems expand northward and all species distributions shift
11 (WHO Regional Office for Europe 2011)
12 Coping With International Water Conflict in Central Asia: Implications of Climate Change and Melting Ice in the Syr Darya Catchment, T. Siegfried et al., 16th June 2010
Box 1.4: Food Insecurity and Malnutrition remain a threat despite the region’s economic progress
Several consecutive years of poor harvests and the rising cost of food have weakened the buying power of families and in Central Asia and the Caucasus. This makes it likely that this part of the region will not reach the MDG target to reduce malnutrition by 2015. Even in some European Union countries, nutrition may be at risk: in the last 12 months alone, the use of public food banks by people increased by 20%.
World Health Organization

13
with unforeseen consequences. The other imminent threats to Arctic biodiversity stem from alien species, and impact of hydrocarbon and hazardous material pollution. Along the Adriatic and the Mediterranean, storm surge and saltwater intrusion into aquifers threaten parts of south-eastern European coasts. Sea level rise has been highest in the Black Sea, where it is threatening numerous ports and towns along the Russian, Ukrainian, and Georgian coasts. In the Caspian Sea, water levels are projected to drop by approximately six meters by the end of the twenty‐first century, due to increased surface evaporation. This will imperil fish stocks and affect coastal infrastructure. Coastal landfills around the Black Sea, notably in Georgia, have been identified as pollution hotspots, and coastal erosion could increase the amount of pollutants flushed to sea, threatening a fishing industry already struggling with the consequences of overfishing and excessive pollution.
Migration
The anticipated adverse impact of climate change on agriculture in transition economies, if not addressed, could cause people living off farming to fall into poverty. Decreased opportunities in rural areas would increase internal and external migration flows, which have been steadily growing in recent years. Urbanization trends, internal migration, are already on rise in the region (see Figure 1.2) and will continue in upcoming decades. Climate change’s potential impact is especially acute for Central Asian countries where agriculture is an important sector of the economy, and where the proportion of young population in need of jobs in relatively high.
Figure1.2: Growing urban populations (percentage shares)
Source: UN Population Division Database.
Natural Disasters
The frequency and costs of natural disasters have risen dramatically in the region over the last two decades. During this period, there has also been a marked increase in drought conditions, even in the sub-regions experiencing increased mean annual precipitation. Over the past 30 years, natural disasters have cost the countries of Europe and Central Asia about $70 billion in economic losses. Most of the damage had occurred in Armenia, Romania, Poland, Russia, and Turkey. Meanwhile, climate change scenarios project even more frequent weather extremes, including increased flooding, heat waves, and drought, which will cause even greater losses and may displace people from their homes.
In 2010,the most deadly year in two decades, this region saw the second highest number of deaths in the world, with the heat wave in Russia accounting for nearly one fifth (56,000) of 2010’s total fatalities. Other extreme climate events in Europe included Storm Xynthia in February 2010, floods in France in June 2010, and the extreme winter conditions all over Europe in December of the same year.
As the climate is changing, special efforts will have to be made to adaptation measures in water use, agriculture and introduce climate proofing in large investments. Modernized disaster risk reduction strategies are needed to protect the population against heightened volatility and extreme events in the weather and to ensure that vulnerable groups can recover as fast as possible.

14
E. Main policy messages
The main policy messages contained in the subsequent chapters of the report are outlined below.
Cross-sectoral policies (Chapter II)
1. Sustainable development that reconciles economic growth with equity and natural environment remains an elusive goal for policy makers in all countries of the region. A number of UNECE member States have achieved high levels of human development at the expense of environmental sustainability while others have maintained light ecological footprints with persistent poverty. Given the multidimensional task at hand, a balanced policy mix is needed for a successful transition to an equitable society with a high standard of human development and environmental sustainability.
2. Neither the governments nor markets alone can achieve sustainable development. The best course of action is to discontinue environmentally harmful policies and correct market outcomes that are environmentally unsustainable or socially unacceptable. Forward-looking policies should address specific sustainability issues by combining economic instruments with laws and regulations. The challenge is to find the right policy mix for each country.
3. The elimination of environmentally harmful subsidies, excise taxes and other forms of carbon pricing would correct misleading market signals and reduce the wasteful use of energy and greenhouse gas emissions. Adverse impacts of such pricing and tax reforms on poor households through higher energy, housing and public transportation prices should be offset by the establishment of a social protection floor. The latter would be financed by the savings associated with cuts of harmful subsidies and the extra revenue generated by environmental taxes and charges. Increasing the fiscal space would thus generate a social space reaching the double objective of mitigating the adverse impact of the financial crisis and absorbing the social cost of the transition towards a strong sustainable development model.
4. Major behavioural changes are essential for effectively transforming production and consumption patterns. Awareness raising, combined with different forms of incentives plays a decisive role in this process and must address all actors in society: producers, consumers, political parties, scientific community, the media and public opinion at large. Such changes in behaviour call for a mix of general sensitisation campaigns and well targeted information and education programmes. In particular, education for sustainable development at school and university should be actively promoted, covering all youth categories.
5. Women are key agents of change in view of their influence on education and household consumption choices. More broadly, when women participate in all forms of policy and decision making processes and have equal access to resources and opportunities, they become drivers as well as beneficiaries of equitable economic growth, environmental sustainability and poverty eradication.
Changing production patterns (Chapter III)
1. The region as a whole is still one of the most energy intensive in the world. However, significant progress has been made towards more sustainable production patterns through the transformation of the structure of production and increased energy efficiency from environmentally-friendly technology improvements. There is huge potential for further reductions in CO2 emissions through the use of renewable energy, eco-technologies, and investment in energy efficiency, carbon capture and storage, but barriers to the uptake of these new green technologies and practices still persist in the region.
2. Overcoming residual institutional, market and behavioural barriers to sustainable production requires a comprehensive approach: a national energy strategy, action plans by sub sectors, long term goals and quantifiable energy efficiency targets. This approach must be translated into policy action through a mix of policies and processes such as regulatory standards, fiscal, financial, information and absorptive capacity building measures, with each country adopting a mix that corresponds to its national competitive and natural advantage.
3. These policies and tools, specifically targeted to the private sector, should include agreements negotiated between government and industry on targets, various information and technical assistance programmes promoting energy management practices, recognition programmes that reward firms for implementing energy efficiency solutions,

15
differentiated corporate taxes according to compliance of firms with energy standards, strategic retargeting of subsidies from high to low carbon energy supply and consumption, and guarantees for credit lines and venture capital financing green investment and technologies.
4. Boosting the uptake of new environmentally friendly technologies and practices is crucial for shifting towards sustainable production patterns in the region. This requires a political commitment to adopt a consistent set of policies and measures aimed at supporting R&D and innovation efforts, and providing the necessary infrastructure for the use and dissemination of green technologies. The policy mix should combine science and technology action plans, increased government-funded public research and research within the framework of public-private investment, compliance with intellectual property rights and support with the leap from R&D to commercialization. Green procurement and infrastructure investment by the public sector, through the introduction of green criteria in tender processes, is also a powerful tool for generating demand for new green technologies and encourages related investment by the industry.
5. Conventional agricultural methods continue to dominate farming throughout the region, generating high levels of greenhouse gas emissions and other environmental pressures. In addition to phasing out environmentally harmful agricultural subsidies, governments should dismantle barriers for the development of conservation agriculture that enhances the functioning of the ecosystem while reducing the ecological footprint of farming. Innovative institutional arrangements are needed to reward long term conservation and biodiversity. Some voluntary mechanisms such as payments for ecosystem services and ratings, labelling and certification of products have been used successfully in some UNECE countries and could be easily replicated in others.
Changing consumption patterns (Chapter IV)
1. Across the region, the technology-driven energy and material efficiency gains achieved since the Earth Summit in Rio 1992 are being more than offset by growing consumption and changing consumption patterns. This is happening in all the three key areas of household consumption: housing, transport and food.
2. Policy progress is taking place, although unevenly across policy areas and sub-regions. Energy performance standards for housing, economic instruments in transport, or provision of food information are all making important contributions though they need to be implemented more broadly. There are also major opportunities to empower consumers to adopt more sustainable lifestyles through wider and more integrated use of investments in public infrastructure, regulations, economic instruments and information but most of them remain untapped.
3. The next decade requires a more ambitious and sophisticated policy agenda. Policy solutions in the UNECE region need to place a greater focus on sustainable consumption and sustainable lifestyles – rather than just on sustainable production; adopt an integrated and balanced approach to changing consumption patterns, with greater use of economic instruments; tailor action to specific circumstances, taking into account the different consumption levels but also the social and gender dimensions; and focus first on the “low hanging fruit” - such as refurbishment of highly energy inefficient housing.
4. The public sector can set an example and influence the market place by procuring greener goods and services, particularly when public purchasers command a large share of the market (e.g. computers, energy efficient buildings, and public transport).
Fostering the social dimension (chapter V)
1. Sustainable development is about people - their income, employment and equal access to health and other social services - but the transition to greener economy will not automatically benefit all segments of society, and long-standing inequities will not disappear without deliberate action. The establishment of a social protection floor, with coverage for all segments of the population, including poor and vulnerable groups as well as those socially excluded is therefore critical to the success of equitable sustainable development. Additional measures can include employment guarantees, minimum wage legislation and the protection of workers’ rights as well as provision for affordable childcare and social services to reduce women’s unpaid work.

16
The labour dimension
1. Due to the economic crisis, the region is confronted by increased poverty, precarious jobs and unemployment, as well as by insufficient social security coverage and the limited capacity of trade unions and employers’ organizations. Shifting towards a green economy, if policies and measures to achieve it are appropriately designed and implemented, offers new opportunities for employment in the green sectors but it also raises new challenges related to the distribution of social and economic costs of such transformation. 2. In order to offset the potential job losses in high emitting and energy intensive industries and support sectors particularly affected by climate change (agriculture, fisheries), policies to anticipate and manage the structural change should be consistent with the five principles of the ILO’s Just Transition Framework: i) assessing the social and employment impact; ii) promoting green jobs and sustainable enterprises; iii) providing training and skills development for green jobs; iv) strengthening social protection systems to cushion impact on workers; and v) engaging with social partners in all policy steps. 3. Adequate policies targeting the unemployed and the most vulnerable (youth, women, working poor, rural workers, ethnic minorities and migrant workers) should be developed in order to ensure that the green transition is also a socially fair transition. 4. Greening the workplace is a key area for improvement and safeguarding both the natural environment and workers’ safety and health. Manager-worker joint initiatives should be encouraged in this respect as they prove to be effective in promoting safety at work, reducing the use of energy, water and other materials in the work process as well as in limiting waste generation and increasing recycling.
The health dimension
1. Demographic shifts, rising levels of inequity, global environmental changes, the growing epidemics of non-communicable diseases and persisting communicable disease threats provide new challenges to sustainable development in the region. 2. Addressing the root determinants of these conditions requires reducing socio-economic inequalities and the exposure of people to environmental, biological and behavioral risks to health. Investment in prevention, health services, and the access to basic needs and social welfare are essential. 3. Great opportunities for progress lie in fostering healthy and reduced consumption and healthy and green developments in energy, transport, housing, urban management and agriculture, as well as in the health sector. This however requires the development of a better understanding of the implications of green developments on health and its societal co-benefits, thereby preventing undesired effects. 4. Sustainable development calls for a new health governance approach, introducing the health dimension in decision making processes cutting across all public policy areas. The development of this approach requires political leadership, creation and dissemination of know-how across sectors, provision of incentives that promote cross-sectoral work, allocation of resources and clarification of responsibilities. Strengthening the sustainable development governance (Chapter VI)
1. A significant number of countries in the region have established a national sustainable development body and adopted a strategy for sustainable development, but they remain weak in practice. These bodies lack political power, expertise and financing. Being under such constraints, they are not able to ensure deep integration of the three pillars of sustainable development in policy-making. 2. Governments at the Rio+20 Conference should commit to strengthening their national institutional frameworks for sustainable development across multiple levels of governance. This requires a “whole of government approach”, fostering inter-ministerial and local-national level cooperation. Such an approach would lead to the integration of sustainability considerations into all levels and sectors of government planning and decision-making.

17
3. Inter-ministerial coordinating bodies should strengthen national strategies for sustainable development, and monitor their implementation as well as the enforcement of the related legislation and administrative measures. They should also monitor progress towards fixed targets through appropriate indicators, identify win-win solutions for their scaling up, and define relevant trade-offs for decision makers at the highest level (Prime Minister’s Office or Presidential Administration). 4. Regional and inter-regional cooperation in sustainable development should be further developed to address issues of a transboundary nature, exchange and disseminate national good practices and promote effective implementation of international legal instruments of the United Nations. More broadly, the United Nations system remains strongly committed to support countries and regions in their own policy efforts and cooperation initiatives. It does so by pursuing, and strengthening as far as possible, its advisory services and capacity-building activities corresponding to its mandated areas of expertise in the various dimensions of sustainable development.
18
Chapter II. The cross-sectoral policy mix for sustainable development
This chapter defines a road map for sustainable development, highlighting the key policies cutting across sectors and aiming at achieving this goal. It rests on the observation that the current outcome of existing government policies and incentives for private sector investment is not consistent with long-term sustainability in several aspects. Failures of governments and markets, and weaknesses in civil society all contribute to this outcome. Recognizing the dynamic nature of development, building on the availability of individual remedies for many of these failures and weaknesses, this chapter argues for a critical mass of changes in policies, institutions, regulation, and incentives in the short, medium and long term. Using instruments such as taxes, incentives and tradable permits to promote green investment and innovation is essential for a transition to a green economy, but so is investing in eco-innovation, technology, capacity building, training and education for sustainable development.
A key message of this chapter is that if enough of the elements for effectively addressing substantial components of the overall challenge are available, a “wedge-by-wedge” approach, in aggregate adding up to the necessary critical mass of policies, can be successful. Such changes need to be consistent and feasible, and take as building blocks what we know about the individual components of what is going wrong. Governments need to create enabling conditions for the transition to a green economy and reverse dysfunctional policies currently pursued (such as massive fossil fuel subsidies), put in place improved institutions and better regulation where markets fail, but also to retreat from areas where markets or civil society work best. At the macro level, they need to build or reverse the depletion of physical, social, and natural capital, while adhering to current as well as future budget and social constraints. This needs to be complemented by micro-level sectoral policies to provide local traction—where civil society actors also have an important role to play— and address social and environmental tensions. Together, these can reset incentives for all to live and invest in line with economic, social and environmental sustainability.
The chapter also provides an overview of relevant policy actions taken so far, the role of UN Conventions and EU directives and regulations. As the Rio + 20 Sustainable Development Conference will explore the application of MDG-like targets and indicators for sustainable development, the chapter gives an overview of methods used in the region to measure sustainable development. Finally, education for sustainable development is a cross-cutting approach necessary to inspire consumers, constituents and a skilled labour force able to take the green transition forward.
A. Overview
Because sustainable development involves economic, environmental and social dimensions, there is no single policy decision that can ensure sustainable development. Rather, a balanced policy mix is needed, as individual policy elements will be individually insufficient. Such a policy mix would revamp existing policies, reflecting the need for cost-effectiveness and a view of the complementary roles of government, the market, the private sector and civil society. While countries can set the tone, sustainable development is ultimately a global issue. As such, policy formulation needs to consider the increasingly porous borders between government and private, domestic and international domains; and the emergence of global public goods as a key concern—many of which are discussed in this chapter.13 Another key aspect is resilience of the policy mix, enhanced by favouring strategies that work over a larger set of contingencies, building in redundancy, and assigning a larger weight to stocks of human, natural and physical capital.
Often referred to as the “world’s greatest market failure,” sustainable development and climate change require reconsideration of the role of market forces and that of government. This chapter takes the view that both governments and markets can fail to serve the long term needs of citizens who rely on the planet’s finite resources. The best course of action is to discontinue distorting interventions, to ensure a smooth functioning of the market where it works best, to ensure the participation of civil society actors, and enforce laws and regulations that value natural capital, strengthen social inclusion, and help “keep all players honest”. The challenge lies in attaining such a policy mix.
The first step is to identify areas where the market works best and where it fails, the extent of these failures and the costs of government intervention. Policymakers should sharply reduce government actions in some areas such as fossil fuel subsidies and rules that facilitate government corruption. Conversely, they should scale up their actions where net benefits can be large: regulating monopolies, addressing externalities, providing public goods, reforming policies and
13 See I. Kaul and P. Conceicao, eds. (2006).

19
providing new incentives, strengthening market infrastructure and market-based mechanisms, redirecting public investment, greening public procurement and alleviating information asymmetries or incomplete markets.
As an integral part of the institutional framework for sustainable development, governments need to involve civil society by facilitating local collective action, contributing to the provision of public services, providing local-level traction for national and global policies, and by acting as a monitoring agent to enhance transparency and lengthen political horizons to ensure sustainable decisions. Women are important drivers as well as beneficiaries of equitable economic growth, environmental sustainability and poverty eradication. For women to become active agents of change and catalysts for sustainable development, their economic, social and political rights need to strengthened to ensure their ability to own land, control rights to natural resources, obtain necessary education and training, access information, raise financing and acquire relevant technology. Civil society organizations, including community-level groups for youth, women and indigenous people, together with environmental organizations and networks and think-tanks focusing on sustainable development represent an invaluable source of innovation and expertise. Civil society can support government policies towards a green transition by raising awareness about the need for change, thereby adding to momentum towards sustainable development.
Once energy prices and regulatory signals are broadly correct, market forces can provide much of the momentum for sustainable development—green growth will become a matter of economic competiveness given the need to drastically lower humankind’s aggregate GHG footprint over the coming decades. Countries and enterprises that can position themselves to benefit from the future rapid decline in carbon-heavy technologies and consumption and from the surge in green technologies and sectors will be increasingly competitive.14 The private sector should be prepared to react and respond by providing increased financing and investment in greener sectors and technologies.
A green and sustainable transformation, like any transition, will involve winners and losers. It is critical that part of the policy mix includes measures to ensure that groups who stand to lose from a green transition are compensated and protected-- i.e., women and men engaged in “brown” jobs, or the rural poor who rely on natural resources for their basic needs. Fortunately, some of the necessary policy changes, for example, revenues from taxes on fossil fuel or those generated from the allocation of permits in a cap-and-trade system, can create the fiscal space to finance the costs of social transfers to ensure that the benefits of a greener economy are shared widely across groups in society.
Two important global considerations form the background to the policy discussion of this chapter. First, a change is necessary: the current fossil fuel based path is no longer viable because the result would be a global carbon footprint exceeding the limits of one Earth by many multiples. To this end, it needs to be backed by stable coalitions, able to withstand shocks or changes in circumstances. Second, change is inevitable: humanity will have a small global GHG footprint 100 years from now. The only choice we face is whether we get there through a relatively smooth transition, or an abrupt, risk-riddled, and ultimately highly destructive path. The smoother, path would be more conducive to large-scale investment and technology transfer. While it requires upfront investment, planned transition would be less costly than sudden shifts in the long run. This would greatly contribute to lowering global costs, shifting the composition of growth toward green activities, while raising—and if done right, more equitably allocating—global benefits.
14 Sir Richard Branson is quoted in Scientific American (Volume 304, number 5, May 2011, page 35) saying that “Climate change is one of the greatest wealth generating opportunities of our generation”. Also see www.creatingclimatewealth.com.

20
B. Economic Policy Instruments
Economies of the region have considerable first-hand experience balancing the positive results of free market forces with the potential for market failures. A sustainable development transition will require continuation of this ‘balancing act’ between harnessing the power of the free market, and achieving just the right (and right kind) of government role. Governments throughout the region have taken steps to improve social, economic, and environmental outcomes by clearly defining property rights,15 making the law accessible for the poor,16 and by acting directly, e.g., protecting certain areas as national parks.
Just as markets can fail to serve the aims of sustainability, so too can government policies. Thus, there is a need to markedly curtail some government activities while expanding and improving others. The main sources of government failures—when it worsens, rather than improves the chances for sustainable development—are massive, highly distortive fossil fuel subsidies (including tax advantages and rules that reduce effective energy prices paid by final users);17 a short horizon unsuitable for resolving slowly emerging but potentially devastating long-term problems (Box 1);18 and weak (or weakly enforced) legislation and regulation with insufficient or uncertain reach (including unequal access to the law). Finally, many governments would greatly benefit from enhancing their ability to govern and regulate, and to ensure transparency and broad participation, especially at the local level.
15 Such Coasian policies were reported by the Economist (September 25-October 1, 2010 issue, p. 14 of the Special Report on Forests) as having been a highly effective and substantive contribution to drastically slowing down the rate of habitat losses stemming from the burning of rainforests in Brazil. Nevertheless, effective Coasian-type solutions require an effective legal and enforcement system—lacking in many countries of the region. In addition, the issues are different in countries where land and natural resources are state-owned, and where there was significant privatization of these and well-regulated secondary markets have emerged. In many countries of Europe and Central Asia that face binding sustainability challenges, the key issue is not whether the government can clearly define property rights, rather, the extent to which the government is willing and able to prioritize sustainable management of the resources that it owns. 16 See M. Albright and H. de Soto (2008). 17 A 2009 OECD-World Bank study using the price-gap method estimates that total direct fossil fuel subsidies in 37 surveyed economies (covering an estimated 95% of the world’s subsidized fossil fuel consumption) amounted to US$312 billion, with a weighted-average fossil fuel subsidy for final consumers of 22%; meanwhile, the Global Subsidies Initiative (GSI), a program of the International Institute for Sustainable Development (IISD), estimated worldwide fossil-fuel production subsidies at around US$100 billion per year (GSI, 2010). 18 The poor management of trans-boundary waters in Central Asia during past decades, which contributed to the desiccation of the Aral Sea is an apt example.
Box 2.1: The political economy of climate change policies
Climate change costs and benefits typically must be weighed over a period of several decades. This clashes with politicians’ short time horizons, and often leads to the rejection of actions that would offer obvious benefits, but only over a longer time horizon. The inherent under‐representation in these decisions of the interests of generations below voting age or those unborn exacerbates this bias further. The policy mix proposed in this chapter imply a complicated incidence of costs and benefits within society, across countries, and over time. This could imply a massive redistribution from high‐ to low‐carbon producers and consumers; from those not able to adjust to those with a cushion that facilitates adjustment, such as wealth, or ready access to low‐cost financing; and from net energy importers to net exporters. This makes it imperative to engage in meaningful, reasonably targeted social transfers within countries, as well as facilitating international transfers to bring all countries on board. Private international transfers, including remittances also play an important role. The move to a low‐carbon path could involve a significant income loss to poor households. They most likely have less scope to relocate to less affected areas or to move to jobs that open up or pay more as a result of relative price changes; cannot invest in new technologies for their consumption and housing needs that would afford them large savings; and have to pay a significantly higher share of their total income for energy. It is thus critical for the social pillar of sustainability that there is adequate compensation for the higher costs, and adequate access to training and education, as well as to grants and financing for the necessary investments to adjust to the new reality (e.g., basic insulation of housing, replacement of highly inefficient appliances).

21
Box 2.2: Fossil Fuel Pricing
Current fossil fuel prices fail to reflect (i) the full direct costs of provision owing to government subsidies; and (ii) the externalities stemming from their use. As a result, they transmit hugely biased economic signals. The effect of carbon‐heavy production and consumption patterns arising from these two sources is massive. It leads to a global trajectory with unsustainably high and rising global emissions owing to: wasteful energy use with distorted consumer choices (Large vehicles chosen over hybrid cars, incandescent light bulbs over fluorescent ones); and investment decisions (CO2–heavy sources of energy and industrial processes prevail over cleaner alternatives, e.g., renewable energy, recycling); and grossly inequitable outcomes disproportionately hurting the poorest as well as unborn generations.
The single most effective instrument to fundamentally alter day‐to‐day consumption, production and investment decisions of billions of people and businesses is to provide them appropriate price signals. This can happen through the elimination of subsidies plus either (i) a "sin tax" directly imposed on CO2 emission to equalize energy prices at a higher level in all countries; or (ii) if a trading platform with global reach is available, charging for a restricted amount of global carbon credits that would be traded. Setting the tax rate would best be done iteratively, starting with a sizable initial step. If carbon trading is used, total emissions must be effectively capped, and all governments should charge for the permits issued (allocating permits below market price is just another distorting subsidy).19 Eliminating all subsidies and reflecting the externality needs to be phased in to avoid a sudden shock, but on a relatively steep path (over less than a decade) to ensure early impact. That path needs to be pre‐announced, to provide predictability over the investment horizon—critical for shaping the mix of energy supply and demand.
In the long term, higher prices for fossil fuels may not work unless the change is globally coordinated, monitored, and reliably enforced to lend the new regime credibility. Producers and users should agree on their relative shares of fossil fuel rents, which re‐pricing would massively affect (freezing the existing shares for some time would be a feasible way to start).
Also in the long term, effective global regulation and enforcement should complement higher energy prices. This can work best for concentrated, already regulated, or immobile sources, i.e., steel, cement industry; road, sea, and air transport; and buildings. But enforcement for billions of other sources—individually small, but adding up to a significant share of total emissions—is next to impossible. Hence the need for setting price incentives right for actors whose emissions are not tracked individually—they would otherwise tend to free‐ride.
Rapid diffusion of the best available technology for lowering net CO2 emissions is critical for success. The improved relative competitive position of renewables and of energy‐saving technologies induced by higher fossil fuel prices for final users will act in this direction. Importantly, this could also go some way toward helping developing countries “leapfrog” over the carbon‐heavy development path that developed countries had travelled.
Fiscal policy must play a critical role, especially its tax, subsidy, and social protection components. It needs to complement market signals for fostering innovation and redirecting investment and consumption toward a resource efficient economic and environmental model. To this end, the revenue from fossil fuel taxes or cap-and-trade quota allocations should be redistributed to (i) provide targeted support for the poorest to offset the income effect of higher energy costs;20 (ii) provide temporary and declining subsidies for adjustment for producers, and help environmentally friendly technologies more rapidly reach sufficient scale; (e.g., with a preannounced rapid decline of subsidies to zero after, say, 5 years); (iii) reduce the most distortive taxes, generally on labour, to bolster green growth and employment; (iv) cover additional costs of enhancing regulation and regulatory capacity; and (v) transfer resources across regions, sectors, and even countries to stabilize coalitions in support of sustainability.21
19 Cap and trade schemes for CO2 emission exist in several countries. But total emissions allowed; monitoring and enforcement; and payment for allocated permits are unresolved issues, so these do not yet effectively reduce global emissions. Most permits in Europe are given away for free; and the scheme in the US, Canada, and Australia is not yet operational. In Japan, there is only a voluntary trading system with no explicit overall cap. 20 Higher energy prices disproportionately hurt the poorest in society, for whom the additional costs often exceed discretionary income left after sustenance needs. Thus, addressing climate change and poverty need to go hand-in-hand, via a coordinated and sustainable redistribution of incomes and technologies. 21 Such transfers already exist (in the form of ODA, and in the form of newly established climate funds).
22
The government will be able to substantially influence consumption and investment decisions by creating a predictable business environment that is conducive to inclusive, environmentally friendly markets and effective partnerships involving the public and private sectors as well as civil society. It can also enhance sustainability through transparent and stable rules for procurement and for allocating public investment funds that use sustainability as an additional criterion.
22 Aboriginal peoples in Canada who are neither Inuit nor Métis
Box 2.3: Canada (Ontario) – Green Energy and Economy Act (FIT Programme) In 2009, the Canadian province of Ontario launched the first North American Feed‐In Tariff (FIT) Programme for renewable energies. FITs guarantee specific payments for each kilowatt‐hour (kWh) of electricity produced by a renewable energy source during a determined timeframe. The aim is to increase Ontario’s share of renewable energies to 37% by 2025, and thereby make renewable energies the largest component of its total energy mix. The overall goal of the GEA is to foster a clean energy economy in Ontario by helping Ontario phase out coal‐fired electricity generation by 2014; attracting new and redirecting existing investments to boost economic activity and the development of renewable energy technologies; and creating green industries and jobs.
Through the FIT Programme, more than 2.000 Megawatts (MW) from sustainable, renewable sources have been connected to the grid so far. Coal‐fired generation is the single largest source of air pollution in Ontario and eliminating all 19 coal units from the supply mix will be the largest climate change initiative in Canada. Coal plants produce carcinogens, smog, greenhouse gases, acid rain and pollution, which causes 120.000 illnesses a year in Ontario alone and amounts to health costs of about CAD$3 billion. The removal of coal plants by 2014 is also expected to reduce CO2 emissions in Ontario’s electricity system from 33 to 7 million tons of CO2 per year, which would be a 79 percent reduction. So far, Ontario's Green Energy Act has lead to the creation of over 20.000 new jobs and the province aims to have a total of 50.000 jobs created by the end of 2012.
Ontario signed or offered more than 21.000 contracts to small, medium and large clean energy projects and about $16 billion (Canadian Dollars) in private sector investment, as well as investment in manufacturing. The GEA targets local municipalities, First Nations22 and Métis communities to build, own and operate their own renewable energy projects. As a result, nearly 16 percent of all contracts awarded in the first year went to community groups, representing almost 400 MW of renewable energy capacity. Many of these are owned by First Nations peoples and act today as a stimulus for Aboriginal economies across the province.
Box 2.4: Ukraine – Energy Sector Development through Co‐Generation Technologies Co‐generation technologies are considered one of the means to reduce greenhouse (СО2) and harmful (NOx, SO2) gas emissions in the energy sector and Ukraine has a significant potential for the implementation of co‐generation technologies in in the fuel and energy, machine‐building and chemical industry sectors. Since 2005, owing to government policy reforms, co‐generation technologies have become an integral part of the modern energy sector development in Ukraine. A new law created incentives to modernize the energy sector by regulating heat supply systems based on the implementation of co‐generation technologies (e.g. renewable heat technologies), state‐of‐the‐art energy‐saving technologies, and applying devices of metering and regulation of consumed heating power. Further legislation regulates issues of implementation and operation of combined heat and power plants (CHP) and creates incentives for economic entities to use co‐generation technologies.
Owners of co‐generation plants have been entitled to free access to electric networks and sale of generated energy as well as granted a right to sell generated energy. Moreover, tariffs on power and heating power generated by co‐generation plants will not include taxes until 2015. It is foreseen that the replacement of every 1.000 МW of exhaust capacities of heat electric power plants with co‐generation plants would allow for savings of up to 1,5 million tonnes of conditional fuel per year. It would also lead to a reduction of 4 million tonnes of СО2; 2.500‐3.000 tonnes of NOХ; 50.000 tonnes of SO2; and about 25.000 tonnes of solid waste a year. Co‐generation technologies in Ukraine have led to: increased fuel usage efficiency, which is the highest in the heating power sector running over 90% and, subsequently, low prime cost of generated energy; significant reduction of harmful emissions, including greenhouse gas emissions; and lower costs of generated energy transportation.
23
Local and Regional Policies for Sustainable Development
Transitioning to a sustainable development pathway requires not only macroeconomic interventions. Importantly, to gain traction, they need to go hand-in-hand with micro-level sectoral and regional policies. These typically focus on the supply side of economic activity, while cross-sectoral policies also include policies acting on the demand side: consumption, investment, net exports. This is an area where economic and environmental policies overlap; and through the impact on the level and mix of employment and other channels, powerful social implications also occur.
Another critical micro-level contribution to sustainability can come from local community-based collective action rules for common property resources without substantial elements of monopoly or externalities across large areas (Elinor Ostrom, 1990). For this distinct subset of resources, the optimal solution thus comes from coordinated local action organized by civil society. These situations are very important in aggregate, and civil society’s role is critical, since neither the market, nor government has been able to formulate operationally useful rules to ensure sustainable use for these resources to date.
To achieve success, broad ownership of policies related to sustainable development is crucial. This is where CSOs, acting as a link between the government and civil society can play an important role. Civil society actors come from all layers of society (urban and rural; national, local and grass-roots; formal and informal). They contribute by setting the agenda (the issue of environmental degradation was first tackled in our region through civic action); by raising awareness and advocating for the rights of the poor in sustainable development.
Box 2.5 Austria – National Framework Programme for Climate Protection: klima:aktiv The klima:aktiv initiative supports the implementation of the Austrian federal climate strategy and Austria’s market transformation towards a competitive low‐carbon economy based on efficient and sustainable use of resources, the protection of the environment, and the establishment of innovative green technologies and production practices. The initiative was launched by the Federal Ministry of Agriculture, Forestry, Environment and Water Management in 2004. The overall objective of klima:aktiv is to decrease energy consumption and to reduce GHG emissions and climate change. To date, the initiative contributes to 1,46 million tonnes of CO2 emission savings yearly. The programme has provided support for 43.000 projects in the following sectors:
Mobility: Klima:aktiv mobil promotes climate‐friendly mobility. The programme motivates and provides financial support to cities, municipalities and regions, companies, tourism and leisure operations, schools and youth groups to develop and implement ways of reducing carbon dioxide emissions from transport. Measures implemented to date include the promotion of public transport, mobility management, car sharing, fleet changes to alternative‐fuel vehicles, and improving facilities for cycling and walking. By July 2011, klima:aktiv mobil had launched more than 1.800 joint projects with companies, regions and cities, while municipalities had received technical assistance and financial support of €42,5 million which leveraged €271 million in additional funding and created or saved 3.000 green jobs. Awareness and information campaigns inform the media as well as the citizens about the benefits of climate‐friendly mobility as well as motivate to environmentally friendlier and healthier mobility. Overall, klima:aktiv mobil partners have saved more than 450.000 tonnes of CO2 each year.
Buildings: Through financing energy audits and information campaigns, klima:aktiv has enabled 1.600 assessments so far to identify potential energy savings in service and residential buildings. Refurbishment projects have been initiated for 400 large residential buildings with over 13.000 flats. The initiative has developed a building standard as a benchmark for ecologically sound buildings, which serves as an orientation for all stakeholders and as a basis for training. The initiative contributes to a total savings of 400.000 tonnes of CO2 emissions per year.
Renewable Energy: By conveying quality standards and technical know‐how as well as providing information campaigns, klima:aktiv contributed to the doubling of solar thermal collector surface with 360.000 m2 new installations per year since 2004. Due to quality management in heating plants, the efficiency of new wood heating plants was increased by 10%. The initiative contributes to over 500.000 tonnes of CO2 emission savings annually.
Energy Efficiency: 200 public and 120 private companies have been given advice free of charge since 2004 on how to change over to energy efficient appliances and IT systems. Energy advisers have been trained to better support companies to make their production processes energy efficient or renovate their facilities. The initiative contributes to a total saving of 160.000 tonnes of CO2 emissions per year.
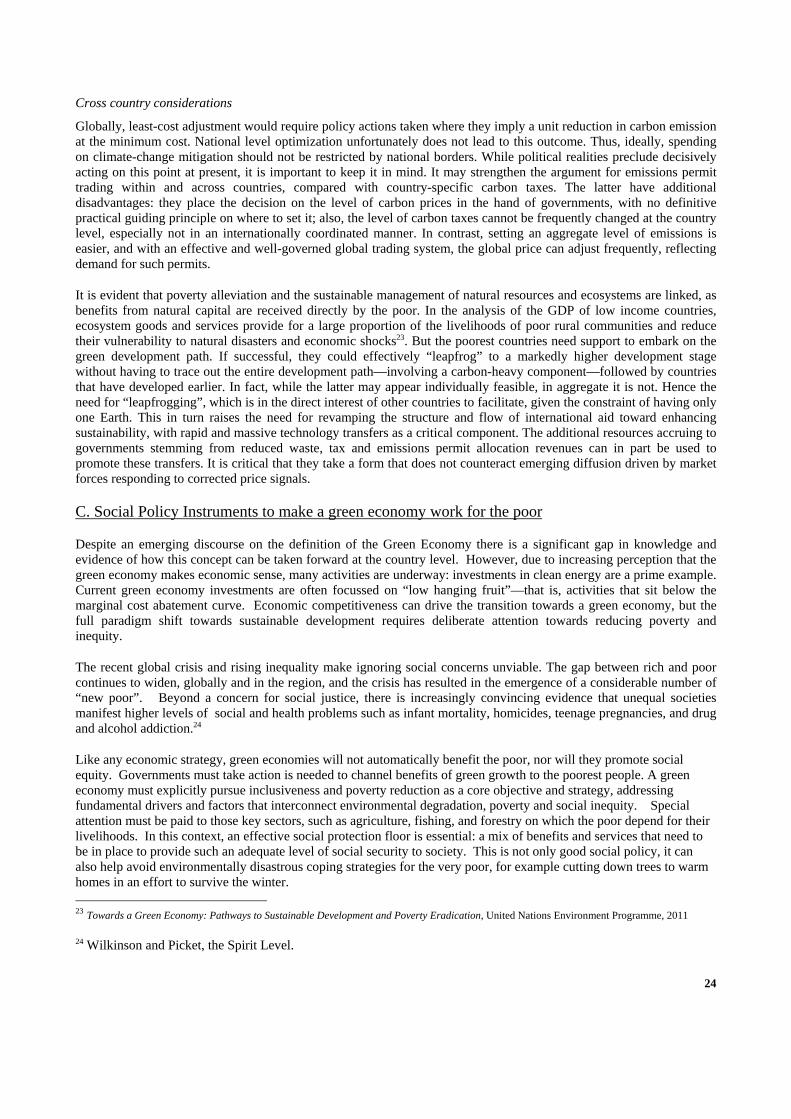
24
Cross country considerations
Globally, least-cost adjustment would require policy actions taken where they imply a unit reduction in carbon emission at the minimum cost. National level optimization unfortunately does not lead to this outcome. Thus, ideally, spending on climate-change mitigation should not be restricted by national borders. While political realities preclude decisively acting on this point at present, it is important to keep it in mind. It may strengthen the argument for emissions permit trading within and across countries, compared with country-specific carbon taxes. The latter have additional disadvantages: they place the decision on the level of carbon prices in the hand of governments, with no definitive practical guiding principle on where to set it; also, the level of carbon taxes cannot be frequently changed at the country level, especially not in an internationally coordinated manner. In contrast, setting an aggregate level of emissions is easier, and with an effective and well-governed global trading system, the global price can adjust frequently, reflecting demand for such permits.
It is evident that poverty alleviation and the sustainable management of natural resources and ecosystems are linked, as benefits from natural capital are received directly by the poor. In the analysis of the GDP of low income countries, ecosystem goods and services provide for a large proportion of the livelihoods of poor rural communities and reduce their vulnerability to natural disasters and economic shocks23. But the poorest countries need support to embark on the green development path. If successful, they could effectively “leapfrog” to a markedly higher development stage without having to trace out the entire development path—involving a carbon-heavy component—followed by countries that have developed earlier. In fact, while the latter may appear individually feasible, in aggregate it is not. Hence the need for “leapfrogging”, which is in the direct interest of other countries to facilitate, given the constraint of having only one Earth. This in turn raises the need for revamping the structure and flow of international aid toward enhancing sustainability, with rapid and massive technology transfers as a critical component. The additional resources accruing to governments stemming from reduced waste, tax and emissions permit allocation revenues can in part be used to promote these transfers. It is critical that they take a form that does not counteract emerging diffusion driven by market forces responding to corrected price signals.
C. Social Policy Instruments to make a green economy work for the poor
Despite an emerging discourse on the definition of the Green Economy there is a significant gap in knowledge and evidence of how this concept can be taken forward at the country level. However, due to increasing perception that the green economy makes economic sense, many activities are underway: investments in clean energy are a prime example. Current green economy investments are often focussed on “low hanging fruit”—that is, activities that sit below the marginal cost abatement curve. Economic competitiveness can drive the transition towards a green economy, but the full paradigm shift towards sustainable development requires deliberate attention towards reducing poverty and inequity.
The recent global crisis and rising inequality make ignoring social concerns unviable. The gap between rich and poor continues to widen, globally and in the region, and the crisis has resulted in the emergence of a considerable number of “new poor”. Beyond a concern for social justice, there is increasingly convincing evidence that unequal societies manifest higher levels of social and health problems such as infant mortality, homicides, teenage pregnancies, and drug and alcohol addiction.24
Like any economic strategy, green economies will not automatically benefit the poor, nor will they promote social equity. Governments must take action is needed to channel benefits of green growth to the poorest people. A green economy must explicitly pursue inclusiveness and poverty reduction as a core objective and strategy, addressing fundamental drivers and factors that interconnect environmental degradation, poverty and social inequity. Special attention must be paid to those key sectors, such as agriculture, fishing, and forestry on which the poor depend for their livelihoods. In this context, an effective social protection floor is essential: a mix of benefits and services that need to be in place to provide such an adequate level of social security to society. This is not only good social policy, it can also help avoid environmentally disastrous coping strategies for the very poor, for example cutting down trees to warm homes in an effort to survive the winter. 23 Towards a Green Economy: Pathways to Sustainable Development and Poverty Eradication, United Nations Environment Programme, 2011
24 Wilkinson and Picket, the Spirit Level.
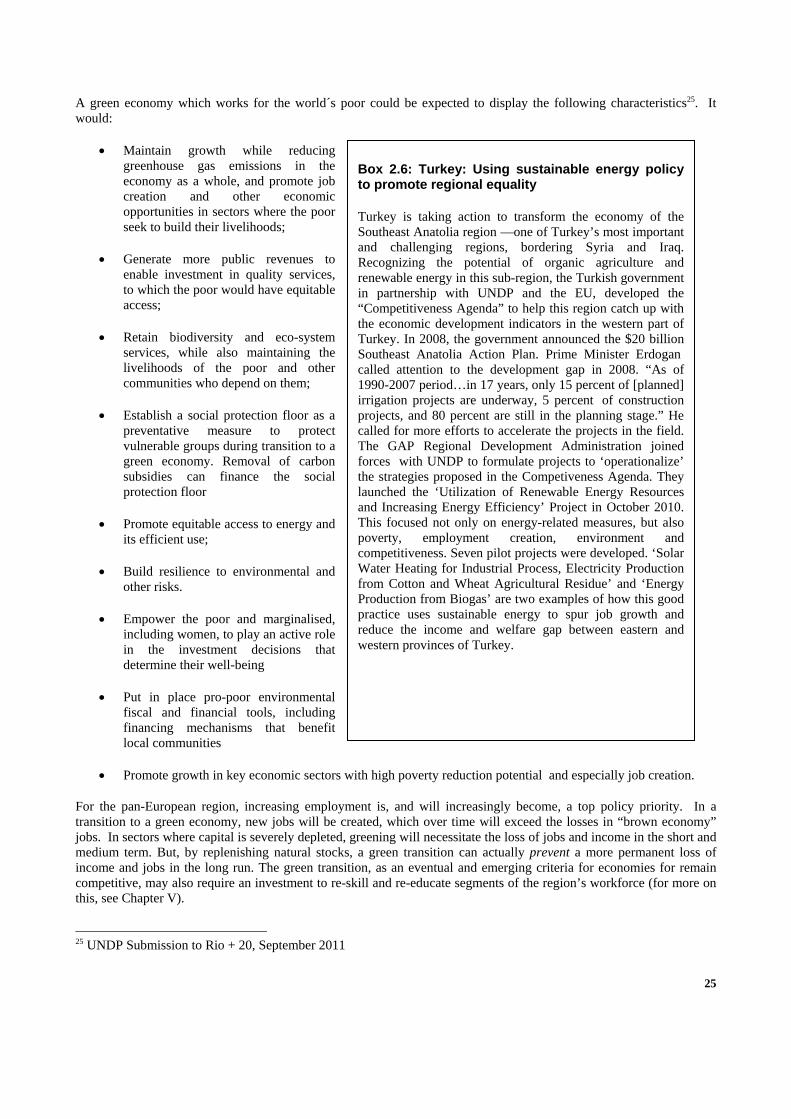
25
A green economy which works for the world´s poor could be expected to display the following characteristics25. It would:
Maintain growth while reducing greenhouse gas emissions in the economy as a whole, and promote job creation and other economic opportunities in sectors where the poor seek to build their livelihoods;
Generate more public revenues to enable investment in quality services, to which the poor would have equitable access;
Retain biodiversity and eco-system services, while also maintaining the livelihoods of the poor and other communities who depend on them;
Establish a social protection floor as a preventative measure to protect vulnerable groups during transition to a green economy. Removal of carbon subsidies can finance the social protection floor
Promote equitable access to energy and its efficient use;
Build resilience to environmental and other risks.
Empower the poor and marginalised, including women, to play an active role in the investment decisions that determine their well-being
Put in place pro-poor environmental fiscal and financial tools, including financing mechanisms that benefit local communities
Promote growth in key economic sectors with high poverty reduction potential and especially job creation.
For the pan-European region, increasing employment is, and will increasingly become, a top policy priority. In a transition to a green economy, new jobs will be created, which over time will exceed the losses in “brown economy” jobs. In sectors where capital is severely depleted, greening will necessitate the loss of jobs and income in the short and medium term. But, by replenishing natural stocks, a green transition can actually prevent a more permanent loss of income and jobs in the long run. The green transition, as an eventual and emerging criteria for economies for remain competitive, may also require an investment to re-skill and re-educate segments of the region’s workforce (for more on this, see Chapter V).
25 UNDP Submission to Rio + 20, September 2011
Box 2.6: Turkey: Using sustainable energy policy to promote regional equality Turkey is taking action to transform the economy of the Southeast Anatolia region —one of Turkey’s most important and challenging regions, bordering Syria and Iraq. Recognizing the potential of organic agriculture and renewable energy in this sub-region, the Turkish government in partnership with UNDP and the EU, developed the “Competitiveness Agenda” to help this region catch up with the economic development indicators in the western part of Turkey. In 2008, the government announced the $20 billion Southeast Anatolia Action Plan. Prime Minister Erdogan called attention to the development gap in 2008. “As of 1990-2007 period…in 17 years, only 15 percent of [planned] irrigation projects are underway, 5 percent of construction projects, and 80 percent are still in the planning stage.” He called for more efforts to accelerate the projects in the field. The GAP Regional Development Administration joined forces with UNDP to formulate projects to ‘operationalize’ the strategies proposed in the Competiveness Agenda. They launched the ‘Utilization of Renewable Energy Resources and Increasing Energy Efficiency’ Project in October 2010. This focused not only on energy-related measures, but also poverty, employment creation, environment and competitiveness. Seven pilot projects were developed. ‘Solar Water Heating for Industrial Process, Electricity Production from Cotton and Wheat Agricultural Residue’ and ‘Energy Production from Biogas’ are two examples of how this good practice uses sustainable energy to spur job growth and reduce the income and welfare gap between eastern and western provinces of Turkey.

26
Box 2.7: Belarus: Ecological restoration of peat lands
Leading scientists warn that carbon sinks will not be able to keep absorbing CO2 emissions at the current rate. Peat lands are among the most fragile sites‐a sobering fact considering that peat‐lands store about one‐third of global soil carbon. In Belarus, the 28,200 hectares of peat‐land (6.4 % of the country’s surface) were rescued through a nation‐wide rewetting of the degraded sites and a development and enforcement of a set of by laws that prevent further peat land degradation.
A UNDP supported four year restoration project, focused on 17 peat land areas that have been drained during1950‐1990s due to large‐scale extraction or agriculture works. The peat land was exploited and biomass used as fuel and insulation material. Draining of the peat land sites has consequently damaged the soil and vegetation cover and increased the area’s vulnerability to long‐burning fires, which in turn have released approximately 235,000 tons of CO2 annually.
By investing US$ 50‐100 per hectare for peat‐land restoration, this initiative has filled the drainage ditches and built dams that further increased the groundwater level, managed fire and led to a cut down of public spending on firefighting by an estimated US$ 1.5 million annually. More importantly, the ecological restoration of peat‐lands, which cost an average of US$50 toUS$100 per hectare, has stopped the CO2 emissions, diversified the local community livelihoods (cranberry picking, fishing, hunting and tourism) and ensured the habitat for endangered species of flora and fauna, including endangered birds such as the Curlew and the Greater spotted Eagle. The Belarusian government adopted a policy dealing with economically exploited peat lands, where mining activity has taken place. According to the policy, disturbed areas are to be restored at the end of their “economic life”.
D. Environmental Policies: Regulatory and Legislative Instruments, Institutions, and Technology
In addition to the market based instruments discussed earlier, such as taxes, charges and fees, tradable permits and “green” subsidies, there are a number of government interventions, including regulatory and voluntary non-market based instruments that should be part of the recommended policy mix for a transition to a green economy. Governments also have at their disposal regulatory measures including technology- or performance-oriented regulations, licensing requirements and bans on certain products or practices.
Reforms to regulations, subsidies and taxes are necessary in order to reflect the true value of natural capital.26 New mechanisms and markets to reward long term conservation of ecosystem services and biodiversity are also viable options. There are a range of voluntary mechanisms that are being currently used with good results such as payments for ecosystem services (PES), ratings, labelling and certification.
These voluntary initiatives complement other instruments but in many cases still require a legal/regulatory framework to function properly. PES schemes make the value of ecosystem services more obvious and attempt to modify or reverse existing incentives for users to over-exploit or convert them. Local PES schemes can be scaled up to the national level for cost-effectiveness. A key aspect of PES schemes is the potential for involving the private sector and to raise additional finance and complement public funds. But governments need to keep in mind that they may have to provide extra incentives or alternative solutions to cover initial or operating costs.
Providing improved information on the environmental impact of production and consumption should be highlighted as a way to raise awareness for consumers, producers and policymakers to make environmentally sound decisions. Tools that provide product information can be applied to both voluntary schemes and market-based instruments. This is because labelling products with information on their environmental impact enables consumers to make decisions that take into account environmental consequences while at the same time providing an incentive to manufacturers to design eco-friendly, more efficient products.
26 The Economics of Ecosystems and Biodiversity Report for Policy Makers 2009

27
Unfortunately, the regulatory burden that comes with sustainable development would—all other factors remaining unchanged—raise the incentives for informal activities (to evade the regulations). This is no small matter for the pan-European region: Schneider (2010) estimates the share of informal activities to be at 20% of measured GDP on average in the EU-27, with ECIS countries generally closer to 30%. There are already sound social policy and economic reasons to reduce the share of informal production and employment; to these benefits of reducing informality, we can now add the effectiveness of sustainable development policies.
United Nations and European Union Agreements that support Sustainable Development
The UN is contributing in a number of ways toward sustainable development in and beyond regulatory and legislative area, notably through implementing and monitoring multidisciplinary regional, local programmes and projects aimed at sustainable development; promoting the achievement of the MDGs and building related capacities; peacemaking, conflict resolution and disaster risk reduction; compiling policy-relevant global developmental statistics, providing related analytical and technical advisory services, research, publications and awareness raising; the enforcement of the UN Charter and international law; and preparing and enforcing relevant global, regional conventions.
As mentioned before, for some countries outside the EU (most notably for those in the EU Neighbourhood) legislative, regulatory, and policy convergence with the EU could serve as inspiration as they develop environmental policies. EU regulations and legislation may also help countries meet their obligations under UN conventions on the environment and jointly they catalyze progress toward sustainable development (table 1). Regardless of the framework used, enhanced coordination and additional dedicated financial and human resources will be necessary in order for countries to realize their objectives and meet their obligations. It will also be critical to build capacities in governments and civil society to enable them to use the potential of these frameworks to bolster sustainable development.
The Aarhus Convention (UNECE Convention on Access to Information, Public Participation in Decision-making and Access to Justice in Environmental Matters) in force since 2001, grants rights to the public regarding access to information; public participation and access to justice; and in governmental decision-making processes on matters concerning the local, national and transboundary environment. The European Union has begun applying Aarhus-type principles in its legislation, notably the Water Framework Directive (Directive 2000/60/EC).
Table 2.1. Overlapping Content of UN Conventions and EU Chapters in the Acquis Communitaire
Ozone UNFCCC Kyoto Protocol
Convention on Biological Diversity CCD
Persistent Organi Pollutants (POP) Aarhus
Chapter in the EU acquis communautaire
Vienna Convention for the Protection of the Ozone Layer. Vienna, 22 March 1985
UN Framework Convention on Climate Change. New York, 9 May 1992
Kyoto Protocol to the UN Framework Convention on Climate Change. Kyoto, 11 December 1997
Convention on biological diversity. Rio de Janeiro, 5 June 1992
UN Convention to Combat Desertification in Countries Experiencing
Serious Drought and/or
Desertification, Particularly in
Africa . Paris, 14 October 1994
Stockholm Convention on Persistent Organic Pollutants. Stockholm, 22 May 2001
Convention on Access to Information, Public Participation in Decision-Making and Access to Justice in Environmental Matters. Aarhus, Denmark, 25 June 1998
Chapter 11: Agriculture and rural development Chapter 12: Food safety, veterinary and phytosanitary policy Chapter 14: Transport policy Chapter 15: Energy Chapter 16: Taxation Chapter 17: Economic and monetary policy Chapter 18: Statistics Chapter 20: Enterprise and industrial policy
Chapter 21: Trans-European networks Chapter 22: Regional policy and coordination of structural instruments Chapter 25: Science and research
Chapter 26: Education and culture Chapter 27: Environment Chapter 28: Consumer and health protection Chapter 30: External relations
Source: UNDP Bratislava Regional Center, Energy and Environment Practice
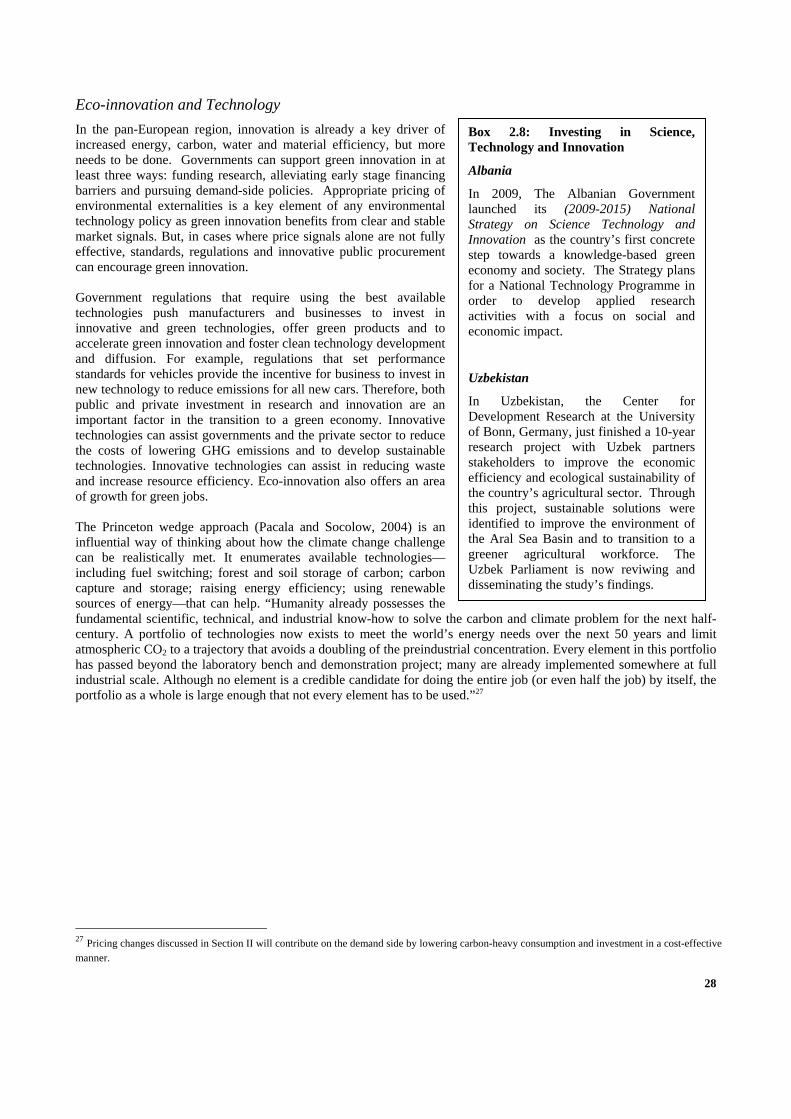
28
Box 2.8: Investing in Science, Technology and Innovation
Albania
In 2009, The Albanian Government launched its (2009-2015) National Strategy on Science Technology and Innovation as the country’s first concrete step towards a knowledge-based green economy and society. The Strategy plans for a National Technology Programme in order to develop applied research activities with a focus on social and economic impact.
Uzbekistan
In Uzbekistan, the Center for Development Research at the University of Bonn, Germany, just finished a 10-year research project with Uzbek partners stakeholders to improve the economic efficiency and ecological sustainability of the country’s agricultural sector. Through this project, sustainable solutions were identified to improve the environment of the Aral Sea Basin and to transition to a greener agricultural workforce. The Uzbek Parliament is now reviwing and disseminating the study’s findings.
Eco-innovation and Technology
In the pan-European region, innovation is already a key driver of increased energy, carbon, water and material efficiency, but more needs to be done. Governments can support green innovation in at least three ways: funding research, alleviating early stage financing barriers and pursuing demand-side policies. Appropriate pricing of environmental externalities is a key element of any environmental technology policy as green innovation benefits from clear and stable market signals. But, in cases where price signals alone are not fully effective, standards, regulations and innovative public procurement can encourage green innovation. Government regulations that require using the best available technologies push manufacturers and businesses to invest in innovative and green technologies, offer green products and to accelerate green innovation and foster clean technology development and diffusion. For example, regulations that set performance standards for vehicles provide the incentive for business to invest in new technology to reduce emissions for all new cars. Therefore, both public and private investment in research and innovation are an important factor in the transition to a green economy. Innovative technologies can assist governments and the private sector to reduce the costs of lowering GHG emissions and to develop sustainable technologies. Innovative technologies can assist in reducing waste and increase resource efficiency. Eco-innovation also offers an area of growth for green jobs. The Princeton wedge approach (Pacala and Socolow, 2004) is an influential way of thinking about how the climate change challenge can be realistically met. It enumerates available technologies—including fuel switching; forest and soil storage of carbon; carbon capture and storage; raising energy efficiency; using renewable sources of energy—that can help. “Humanity already possesses the fundamental scientific, technical, and industrial know-how to solve the carbon and climate problem for the next half-century. A portfolio of technologies now exists to meet the world’s energy needs over the next 50 years and limit atmospheric CO2 to a trajectory that avoids a doubling of the preindustrial concentration. Every element in this portfolio has passed beyond the laboratory bench and demonstration project; many are already implemented somewhere at full industrial scale. Although no element is a credible candidate for doing the entire job (or even half the job) by itself, the portfolio as a whole is large enough that not every element has to be used.”27
27 Pricing changes discussed in Section II will contribute on the demand side by lowering carbon-heavy consumption and investment in a cost-effective manner.

29
Table 2.2. Enabling cross sectoral policies to set the region on a sustainable development path
CROSS SECTORAL POLICY INSTRUMENTS
ECONOMIC
INSTRUMENTS Reform of greenhouse gas emission pricing and elimination of economically costly and
environmentally harmful subsidies, such as fossil fuel subsidies (Box 2), taking into account impacts on the poor, to rectify market signals in a globally consistent manner;28
Elimination of practices exacerbating the spillover from fuel to food prices (e.g., subsidy on ethanol from corn coupled with high tariffs on cheaper imported ethanol).
A fixed-total carbon permit trading system encompassing a critical mass of emitters (notably US, EU, Japan and BRIICs) that is scalable as others sign up, with rules to reign in free-riding behaviour (e.g., smaller allocated quotas for those signing up later).
Effective use of public expenditure and (time-bound) investment incentives to trigger a transition to a green economy, such as public investments in infrastructure and public services to enable green markets as well as investment in research and development of environmentally sound technologies and innovation.
Enhancing relevant WTO rules and regulations, which are an effective defence against monopoly power and abuse of market rules, but are weaker in delivering the externalities-driven regulation needed to effectively combat climate change and biodiversity loss.
LEGAL AND
REGULATORY
INSTRUMENTS
Direct public role at national level (e.g., retaining control over electricity grid, nuclear power generation, national parks), and at regional and global level (e.g., through EU Directives and UN conventions).
Coasian laws delineating property rights to allow private bargaining to effectively complement government regulation.
A robust regulatory framework at the national level, as well as the effective enforcement of legislation as a means to drive green investment.
Effective regulatory monitoring and enforcement to address key externalities, provide public goods at the necessary level, and limit the market power of monopolies.
Establishing sustainable public procurement practices that create high-volume and long-term demand for green goods and services; public investments in infrastructure and public services to enable green markets.
Technology or performance oriented regulations, bans on certain products or practices and licensing requirements; compliance with global and regional conventions, and internationally legally binding directives and rules
Tax exemption for green products
VOLUNTARY
INSTRUMENTS Promoting voluntary schemes establishing payments for providing ecosystem services, such as
carbon sequestration, watershed protection, biodiversity benefits and landscape beauty, to influence land use decisions.
Voluntary standards for labelling and certification schemes.
INFORMATION
BASED
INSTRUMENTS
Improved institutions to deliver effective collective action, to reduce corruption, to lengthen the decision-making horizon, and to alleviate information asymmetries.
Sensitization of firms, consumers and media to support sustainable behavior
Environmental Impact Assessments, Environmental Audits of firms
Preparing the workforce for a green economy transition with skill enhancement programmes.
Investing in and build capacity for research, data collection and data management.
28 The 2010 EBRD Report, Chapter 3, states that the effective introduction of a system-wide price on carbon would result in (i) substantial emission reductions; (ii) a major redirection of investment away from carbon-heavy activities (implying a massive cumulative shift over time toward greater energy efficiency in the overall stock of equipment used in production and by households); and (iii) additional recurrent government revenue (which they estimate for Russia and Turkey at 1-2 percent of GDP).
30
SUPPORTING
ACTIONS Tax exemption for green products
Strengthening of government capacity to analyse challenges, identify opportunities, prioritize interventions, mobilize resources, implement policies and evaluate progress.
Ensuring an enabling environment for civil society action and the inclusion of civil society in formulating, monitoring and implementing policies for sustainable development (as outlined in the Rio Declaration on Environment and Development and Agenda 21) to help gain local-level traction for national and global policies.
Promoting integrated planning at the national level.
Legal empowerment of the poor, combined with an effective social welfare system.
D. Sustainable development indicators as a tool for evidence-based policy formulation, monitoring and evaluation
Measuring progress in achieving sustainable development
In the context of the Rio + 20 debate, there is growing interest among UN member states in the prospect of an international framework to measure progress on sustainable development. Both the Brundtland Commission29, and subsequently, the 1992 Earth Summit called for practical ways to measure and assess progress toward sustainable development. But, how can the balance between the welfare of current and future generations be measured?
Measuring development sustainably means moving beyond Gross Domestic Product. Green accounting is a technique for assessing and better recognizing the contribution of ecosystems and other natural resources to GDP. If GDP growth is achieved by depleting natural capital, then GDP figures should be adjusted downward by the estimated value of depleted natural resources or the degraded ability of ecosystems to deliver economic benefits or cultural services. Measuring natural capital is of vital importance for the transition to a green economy. Accounting for natural capital and valuing ecosystem services and biodiversity is necessary for sound government policy making and re-allocating investments. Changes in stocks can be evaluated in monetary terms and incorporated into the national accounts, as in the System of Environmental and Economic Accounting (SEEA), developed by the UN Statistical Division, and in the adjusted net national savings methods of the World Bank.30 Progress had already been made on accounting for marketed resources, such as minerals; efforts are underway for valuing non-marketed resources, e.g. flood protection. The wider use of such complementary measures, including net domestic product and genuine savings rates would provide a more accurate and realistic indication of the level of economic output and total inclusive wealth, including stocks of physical, human and natural capital.31
Since 1992, sustainable development indicators have been an area for innovation and advancement. The United Nations Commission on Sustainable Development (UNCSD) developed a set of sustainable development indicators, tested by 22 countries32 along with Eurostat. The OECD focused on integrated economic, environmental and social frameworks to measure sustainable development in order to develop statistical indicators for sustainability (OECD 2004). A Eurostat task force of national experts established in 2001 set out to develop indicators to support the EU’s sustainable development strategy, and published sets of indicators in 2005 and in 2007. In addition, many countries have developed their own sustainable development indicator sets to assess progress towards goals in national plans or strategies for sustainable development.
29 World Commission on Environment and Development, headed by Ms. Brundtland, Norway’s Prime Minister in 1987. 30 Where is the Wealth of Nations? Measuring Capital for 21st Century, World Bank, 2006. 31 Towards a Green Economy: Pathways to Sustainable Development and Poverty Eradication A Synthesis for Policy Makers, United Nations Environment Programme, 2011, p. 26. 32 Ghana, Kenya, Morocco, South Africa, Tunisia, China, the Maldives, Pakistan, Philippines, Austria, Belgium, Czech Republic, Finland, France, Germany, UK, Barbados, Bolivia, Brazil, Costa Rica, Mexico and Venezuela.

31
The policy-based approach to measuring sustainable development
In many cases the policy framework in effect determines the indicators of progress. While closely aligning indicators with policy imposes a bias towards particular policy priorities, it establishes their direct relevance for policymakers and can make communication more effective. On the other hand, changes in the policy framework can mean that the indicators have to follow suit, as in the UK, where there have been three sustainable development strategies and three associated indicator sets since 1996.
Unfortunately, only minor consideration has been given to international comparability in the development of national sustainable development indicator sets, reflecting differing priorities and data availability among countries. But there is broad consistency among countries on some sustainable development issues of global or regional importance, with some two dozen indicators common to 10 or more sets in a sample of 20 European countries, Australia, Canada and the EU and the UN (Eurostat, 2007b; Kulig, Kolfort and Hoekstra, 2007).33
The European Union—whose indicator set was developed through engagement with older member states and those with well-established national indicator sets—has seen considerable convergence among national indicators. New member states also look to indicators adopted at the EU level when developing their indicator systems.
The capital approach to measuring sustainable development
Extending the traditional national accounts to better reflect the importance of the environment was a key objective of the London Group on Environmental Accounting.34 One result of their efforts is the United Nations handbook System for Environmental and Economic Accounts (United Nations et al., 2003).35 Three different concepts of sustainable development are described in the handbook, including the capital approach:
“Sustainable development ensures non-declining per capita national wealth by replacing or conserving the sources of that wealth: stocks of produced, human, social and natural capital.”
This definition explicitly connects wealth or well-being and capital stocks (which are necessary to produce all goods and services. Since sustainable development requires taking a very broad view of consumption, it is necessary to take an equally broad view of capital.
Society’s capital base thus comprises five36 sorts of stocks: produced capital (machinery, buildings, telecoms and other infrastructure); financial capital (stocks, bonds, bank deposits); human capital (an educated and healthy workforce); natural capital (natural resources, land and ecosystems providing services like waste absorption); and social capital (functioning social networks and institutions).
The capital-based approach clarifies that development can be managed through investments in specific stocks; and that spending income on investments rather than current consumption is necessary to enhance well-being in the future. While stable or growing total wealth per capita is no guarantee of sustainable development, it is a necessary condition: declining per capita capital stocks imply that well-being will in the long run deteriorate and sustainable development will not be possible (Hamilton and Ruta, 2006).
Several developments facilitate movement toward a common conceptual framework. The Joint UNECE/ Eurostat/OECD Task Force for Measuring Sustainable Development highlighted the importance of the “integrated view” of sustainable development: ensuring the well-being of both the current and future generations, while taking into
33 Greenhouse gas emissions, education attainment, GDP per capita, collection and disposal of waste, biodiversity, ODA, employment and unemployment rate, life expectancy (or healthy life years), share of energy from renewable sources, risk of poverty, air pollution, energy use and intensity, water quality, general government net debt, research & development expenditure, organic farming, area of protected land, mortality due to selected key illnesses, energy consumption, emission of ozone precursors, fishing stock within safe biological limits, use of fertilizers and pesticides, freight and passenger transport by mode, intensity of water use, forest area and its utilization. 34 See: http://millenniumindicators.un.org/unsd/envaccounting/londongroup/default.asp 35 The SEEA is currently being revised, the new version is planned to become a statistical standard in 2012, see http://unstats.un.org/unsd/envaccounting/seea.asp 36 For simplicity, a small but important, category (referred to by national accounts as intangible non-produced non-financial capital) was left out. It includes patents, leases and other transferable contacts; and the rights to extract natural resources. The complete asset classification of the 1993 System of National Accounts can be found at: http://unstats.un.org/unsd/sna1993/tables/table_Annex_13_.pdf.

32
account distributional aspects. This led to the proposal to include together with the capital indicators on quality of life. In addition, progress is evident vis-à-vis the measurement of human and social capital.
The post‐2015 Agenda As UN member states prepare for the Rio + 20 Conference, proposals are circulating for how the international system can better target and measure progress on sustainable development. A proposal has been put forward to development “Sustainable Development Goals” building on the relative success of the Millennium Development Goal model. The MDGs have demonstrated how a set of globally agreed goals can form a clear and feasible agenda for action. While MDGs do not fully cover the entire spectrum of development, they focus on critical aspects of people’s life and the most acute forms of deprivation, embracing both income and other human development dimensions.
In our region, MDGs have proven most effective when nationally adapted and incorporated into national development strategies. The UN has successfully supported the design of Poverty Reduction Strategies and national and sub-national strategies in Tajikistan, Kyrgyzstan, Uzbekistan, Kazakhstan, Georgia, Ukraine, Serbia, Bosnia-Herzegovina, and The former Yugoslav Republic of Macedonia.
While progress in this region has been formidable, emerging new challenges on global development, including the global economic and financial crisis of 2008-11 have raised the risk of reversing the gains made so far on MDGs. But this region knows well that even in ‘good times’, the achievement of MDGs does not fully resolve development problems. Poverty reduced by half still leaves hundreds of millions of people critically poor and undernourished, many of them in the ECIS region. Child and maternal mortality will remain high in lower income regions of the CIS, compared to high- and middle-income regions. Progress towards gender equality and empowerment of women has so far been less than desired, amid prevailing inequality. Targets on water supply and sanitation will not to be reached in several CIS countries. Finally, international coordination in human development was needed in all fields, and not only in international aid (MDG 8). Thus, ample scope remains for developing an improved post-2015 agenda to rally for further action covering both existing MDGs and introducing emerging challenges, such as inequality, climate change and the loss of environmental resources.
Box 2.9: Switzerland’s Approach to Measuring Sustainable Development
In 2000, the Swiss Federal Statistical Office, the Swiss Agency for the Environment, Forests and Landscape and the Swiss Federal Office for Spatial Development launched the Monitoring System for Sustainable Development (MONET) project with the aim of setting up a sustainable development indicator system. Using a participative and iterative procedure involving 25 stakeholders and more than 80 specialists of the federal administration, a system of 135 feasible indicators (and 28 to‐be‐developed ones) was established and published in an indicator report from 2003 (FSO/FOEN/ARE 2004b). In 2009, the system was revised and now contains 80 indicators.
Thanks to the frame of reference and the systematic framework (see below), subsets can be outlined systematically. For example, sixteen key indicators2 are outlined as a subset of the system to focus on four key questions:
(a) Meeting needs – how well do we live? Health: Healthy life years Income: Household income Physical safety: Violent crime Unemployment: Unemployment rate;
(b) Fairness – how well are resources distributed? Assistance to other countries: Official Development Assistance Equality: Wage gap between men and women;
(c) Preservation of resources – what are we leaving behind for our children Teenage reading skills: Reading skills of 15‐year olds Public debt: Level of public debt Investment: Investment to GDP ratio
The 2002 Sustainable Development Strategy's plan of action called for a general monitoring system based on indicators to be defined and updated on a regular basis. The 2008 strategy is set to expand the monitoring system's scope, making use of around 55 indicators from the MONET‐system to evaluate the strategy's key challenges.
33
Post-2015 human development goals, or Sustainable Development Goals will need to have a universal reach, allowing the world community to take on the sustainability challenge. All three pillars will need to be covered: economic (convincingly addressing market and government failures—notably through pricing—demographic challenges, and fostering green growth); social (equality, access to public services, social inclusion, nutrition); and environmental (increased energy efficiency, access to energy supplied increasingly from renewable sources, maintaining ecosystems).
Given the emerging and persistent challenge of income and other inequalities, sustainable development goals will need to include measures of social inequality (e.g., Gini coefficients), and of social exclusion.37 Efforts to enhance composite indices like the Human Development Index (HDI) e.g., by incorporating inequality measures are already underway. The HDI captures educational outcomes but welfare measurements need to capture people’s health and environmental conditions in which they live, as well access to water and sanitation. Once the post-2015 agenda is agreed, development indicators will need to reflect new targets of inclusive economic policies, such as support to youth employment and to the active and healthy life of the older generation.
E. Education for Sustainable Development
Education is one of the best weapons to fight poverty and inequality. Each year of additional schooling increases individual earnings by 10 percent. Fundamentally, education is about values. Education must foster the attitudes and behaviors necessary for a new culture of sustainability. It must be the channel for developing and transmitting new skills and knowledge. Technical and vocational education and training must provide the competences and tools necessary for green economies.
Education at all levels is key to encourage the region’s populations towards a greener economic decision making. Shifting people’s attitudes towards sustainable development will facilitate the region’s transition to a green economy by raising awareness, increasing public participation in environmental public policy and influencing consumer and voter choices. On a more technical level, education creates a cadre of skilled professionals necessary for the transition to a sustainable development paradigm.
Since the Rio Summit in 1992, a series of universities in the pan European region have established University Chairs in fields relating to sustainable development The 40 Chairs in Europe and Central Asia are included in a UNESCO supported Network, facilitating the twinning of Universities in specific research and higher education fields worldwide. 16 Chairs have been established in Central and Northern Europe, 16 in Mediterranean countries and 8 in East - South East Europe and Central Asia.
The chairs can focus on Social and Human Sciences (Habitat and Cities, social and human dimension of sustainable development, sustainable tourism), natural sciences (e.g. biodiversity, energy, environment, engineering, oceanography, water), education (value education, education for sustainable development and higher education ) or cultural heritage and sustainable development. An increasing number of universities are applying to become members of the Network thus widening research cooperation, exchange of knowledge as well as the mobility of students and researchers.
Building awareness for green policy priorities through the media
Green jobs are not self-evident; they are a subject of intense political and policy contestation, requiring a constant flow of information and analyses, to facilitate dialogue and informed decision-
37 For operational measurement of social exclusion, see UNDP’s latest Regional Human Development Report (UNDP, 2011).
Box 2.10: The Growth of Education for Sustainable Development in Armenia
Following achievements of the Rio World Summit of 1992, Yerevan State University (YSU) began organizing a series of lectures on Theory and Practice of Sustainable Development. In 1996, based on the existing course in collaboration with UNDP and the Association for Sustainable Human Development, Yerevan State University developed and published a text-book in Russian language which has been also used by a range of higher education entities in CIS countries. In 2006, the text-book, which reviews national, regional and global elements of sustainable development, was translated and published in Armenian language.
As part of the UN Decade on Education for Sustainable Development, sustainable development has been included in the curricula at other universities in Armenia including the State Pedagogical University, Armenian-Russian University, European Regional Academy among other institutes and universities.
Degrees and dissertation works on Sustainable Development are gradually becoming common practice. At the Yerevan State University, for example, a Doctoral thesis on “Research of Environmental pillar of Sustainable Development on global and national levels” was developed and defended in 2009; as was a dissertation on “Regional Environmental policy of the Republic of Armenia in the context of sustainable development”.
Since 2007, as part of a non-formal educational cycle with support of UNDP and OSCE the Association for Sustainable Human Development together with Yerevan State University have conducted training sessions on Sustainable Development. Particular attention is given to members and experts of Parliament, Constitutional Court, local government and self-government representatives.

34
making. There should be vigorous public debate to lay bare the underlying assumptions of all policy choices available. The media plays a major supporting role in making informed policy choices for green economies.
Given the inherent behavior change factor, sustained public support is critical to moving forward on sustainable development. Actions to increase perceptions are essential: people need to understand the dramatic consequences of “doing business as usual” as well as the benefits resulting from speeding up the transition process: improving health, avoiding the emergence of new forms of vulnerability, higher employment, keeping fossil energy for a longer period, reducing resource dependence and increasing competitiveness in the medium and long run.
Both formal education and information campaigns to promote climate change awareness are critical for ensuring a shift in public opinion continues. An educated public can exert effective pressure on politicians to look beyond short horizons—a key stumbling block for sustainability to date.
Leveraging Culture for Sustainable Development
Sustainable tourism, cultural as well as creative industries, and heritage based urban revitalization are powerful economic sub-sectors that can generate green employment, stimulate local development, and foster creativity. The culture sector, encompassing cultural heritage, creative and cultural industries, cultural tourism and cultural infrastructure, generates substantial socio-economic benefits including green jobs and strategic outlets for creativity. Cultural industries represent one of the most rapidly expanding sectors in the global economy. Sustainable tourism, as well as culture and creative industries, are strategic outlets for income generation and poverty reduction. Culture is a powerful economic engine generating jobs and income with a value of USD 1.3 trillion in 2005 (globally). In Europe, arts, cultural heritage, film, music, publishing, design and new media are part of a growing industry which accounts for 2.6% of Europe's GDP, a high growth potential, and providing quality jobs to around 5 million people across EU-27 (European Union, 2010). In the non-EU member states in Europe and Central Asia, it is estimated to be growing at even faster rates.

35
Chapter III. Changing production and investment patterns
In Europe and Central Asia, due to the divergence in the levels of economic development, many countries are still witnessing dramatic shifts in their structure of production. The main producing sectors, i.e. industry, agriculture and transport, remain relatively energy inefficient in most transition economies while the EU member states have developed dynamic high-tech sectors, increasing their capabilities to innovate and to transfer their technologies to other countries through foreign direct investments and regional cooperation. Low-carbon transition thus presents a window of opportunity for the entire region: targeted investments in new environmental technologies and projects will boost a qualitatively different structural transformation with new green technologies leading to the emergence of new innovative industries and new jobs. In other words, the region has a great potential for energy efficiency savings and for renewable energy production which can be integrated into a diversified pan-European energy market. Such potential can drastically change production and consumption patterns which are at the core of the transition towards a green economy.
While it is important to link the production side with the consumption side through a life cycle approach, it is also important to consider production and consumption patterns distinctly. This chapter focuses on production patterns: it analyses their evolving structure over time in the region and its subregions as well as the impact of such changes in terms of energy use and CO2 emissions, it then reviews progress made in moving toward more sustainable production patterns; finally it delineates policies and measures aimed at accelerating this shift towards greater sustainability.
A. Sustainable production: regional trends
Energy intensity
As outlined in Chapter I, despite downward trends, the energy intensity (defined in Box 3.1, together with carbon intensity and energy efficiency) remain well above the European Union levels in emerging economies of the region (Figure 3.1). Levels remain particularly high in countries of the EECCA region because of the dominant role of energy intensive industries, outdated production technology and low energy prices. However most of these countries have made impressive progress since the 1990s. Such progress can be attributed to a structural change towards less energy intensive economic activities and the increased use of less carbon-intensive energy sources, such as gas and nuclear.
Furthermore economic activity in the pan-European region increased faster than energy consumption over the last two decades, due to significant energy efficiency improvements. Technical progress and energy efficient investments are the principal sources of such improvements.
Box 3.1: Energy intensity and energy efficiency
Energy intensity is the amount of final energy (or end‐use energy) used to produce a certain amount of physical output. Similarly, CO2 intensity is a rough measure of a country’s potential to switch from high carbon fuels to low carbon fuels such as gas or renewable energy (World Bank, 2010). Energy efficiency refers to an output that can be produced with a given amount of energy. It is measured as the ratio of useful outputs to energy inputs for a system, where the latter may be an individual energy conversion device, a boiler, or a building, an industrial process, a firm, a sector or an entire economy (Sorrell, 2010); for example, the number of tons of steel that can be melted with a megawatt hour of electricity.
The notion of energy efficiency is closely related to energy productivity, or “the level of output achieved from the energy consumed.”1 Whereas energy efficiency is the overarching idea of doing more or the same with less energy, energy productivity refers to increasing the cost effectiveness of the use of fuel or electricity either through raising the technical efficiency of fuel conversion, or lowering the cost of energy input (Brookes, 2000). Energy productivity combines energy efficiency and the curbing of energy demand (or energy conservation).
At the level of a specific technology, the difference between energy efficiency and intensity is insignificant — one is simply the inverse of the other. High levels of energy efficiency are associated with low levels of energy intensity (Stern, 2009). The level of energy intensity can be influenced by the “economic structure” (i.e. the contribution of various sectors to GDP), the primary energy mix (i.e. the shares of coal, oil, gas, biomass, other renewables and nuclear), climate conditions, the level of economic development and lifestyles, the transport and logistics sector performance and the technical energy efficiency.

36
Figure 3.1: Energy intensity of GDP: units of energy use per GDP, 1990-2008
(kg of oil equivalent per US$ of GDP)
0.00
0.05
0.10
0.15
0.20
0.25
0.30
0.35
1990
1991
1992
1993
1994
1995
1996
1997
1998
1999
2000
2001
2002
2003
2004
2005
2006
2007
2008
Emerging Europe and Central Asia* European Union World
Source: World Bank database, UNIDO calculations Note: GDP at PPP exchange rates and 2005 prices. Note: *Excludes Montenegro and includes Cyprus and Malta.
Figure 3.2 shows sectoral trends in energy intensity in the EU-27 area. Agriculture and industry are the producing sectors with greatest energy intensity improvements, amounting to about 25 per between 1995 and 2008. Over the same time period, energy intensity in the service sector and transport declined by 15 and 8 per cent respectively. By contrast, the household sector has increased energy intensity by 2 per cent due to the larger and more numerous dwellings as well as the growing use of electrical appliances (EEA, 2011).
Figure 3.2: Energy intensity by sector, EU 27 (1995-2008)
Source: European Environment Agency, 2011.
60
70
80
90
100
110
120
1995 1996 1997 1998 1999 2000 2001 2002 2003 2004 2005 2006 2007 2008
Index 1990=100
Households
Transport
Final energy intensity
Services
Agriculture
Industry

37
At the global level, the amount of primary energy used per unit of GDP is decreasing. This is the result of the combined effect of higher energy prices, energy efficiency and CO2 abatement policies and programmes, and the structural change towards services. While there is a convergence among regions over time, countries of the EECCA region have the highest primary energy intensity after China and they use 2.7 times more primary energy per unit of GDP than Europe, the world region with the lowest energy intensity.
C02 intensity
Since the mid-1990s, the EU-15’s CO2 intensity of energy use has been well below the global average and has decreased significantly over the period, diverging from the global trend since 1999 (figure 3.3). The carbon intensity in Emerging Europe and Central Asia remained well above that of the EU as a whole, although with a declining trend and convergence towards world levels, as of 2005. Between 1990 and 2008, carbon emissions in Emerging Europe and Central Asia fell by around 28 per cent. However, despite this trend it is predicted that CO2 emissions in the region will exceed the 1990s levels by 2015 (World Bank, 2010).
Figure 3.3: CO2 intensity of the economy (energy related CO2 emissions), 1990-2007 kg per kg of oil equivalent energy use
2.00
2.10
2.20
2.30
2.40
2.50
2.60
2.70
2.80
1990
1991
1992
1993
1994
1995
1996
1997
1998
1999
2000
2001
2002
2003
2004
2005
2006
2007
Emerging Europe and Central Asia* European Union World
Source: World Bank database, UNIDO calculations.
Note: *Excludes Montenegro and includes Cyprus and Malta.
The reduction in the carbon intensity of energy use has been driven by a shift from coal and oil towards natural gas, nuclear power and renewable sources (EBRD, 2011). The key factor has been changing demand of industry and power generation for carbon-intensive fuels, namely coal-based power and heat generation.
Within the region there is a considerable divergence between countries in terms of carbon intensity. In 2008, the carbon intensity of Uzbekistan, Kazakhstan and Turkmenistan was the highest in the region
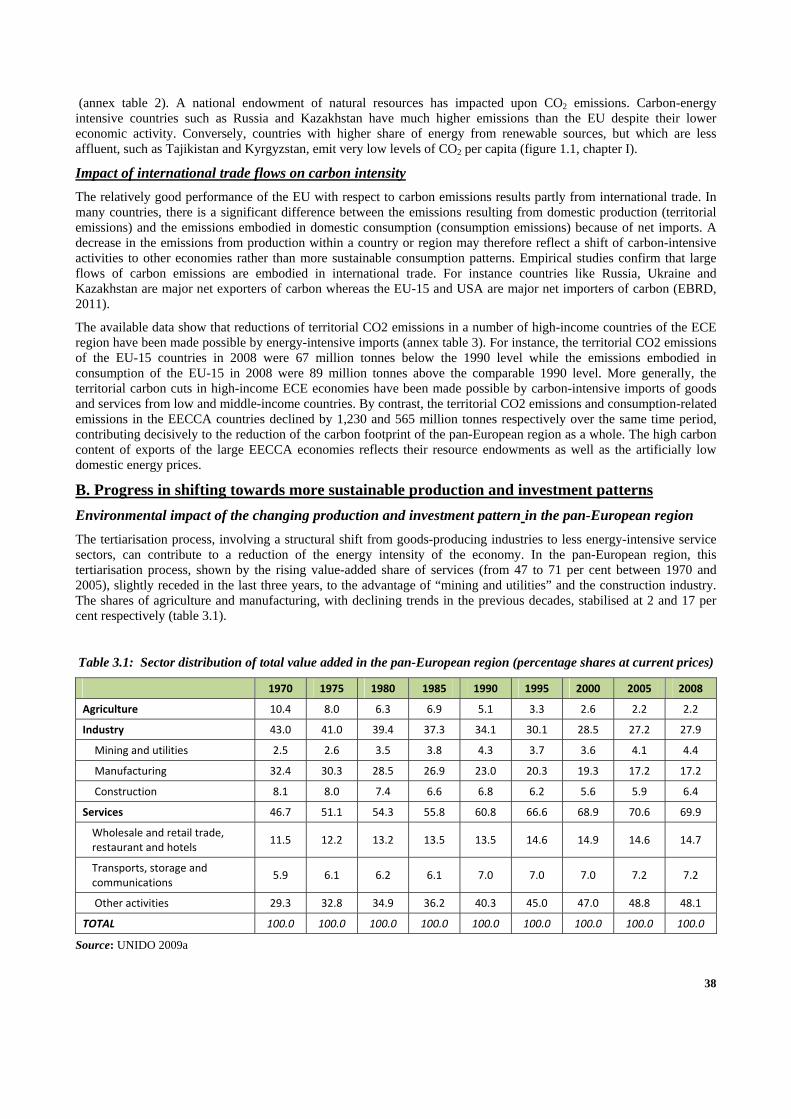
38
(annex table 2). A national endowment of natural resources has impacted upon CO2 emissions. Carbon-energy intensive countries such as Russia and Kazakhstan have much higher emissions than the EU despite their lower economic activity. Conversely, countries with higher share of energy from renewable sources, but which are less affluent, such as Tajikistan and Kyrgyzstan, emit very low levels of CO2 per capita (figure 1.1, chapter I).
Impact of international trade flows on carbon intensity
The relatively good performance of the EU with respect to carbon emissions results partly from international trade. In many countries, there is a significant difference between the emissions resulting from domestic production (territorial emissions) and the emissions embodied in domestic consumption (consumption emissions) because of net imports. A decrease in the emissions from production within a country or region may therefore reflect a shift of carbon-intensive activities to other economies rather than more sustainable consumption patterns. Empirical studies confirm that large flows of carbon emissions are embodied in international trade. For instance countries like Russia, Ukraine and Kazakhstan are major net exporters of carbon whereas the EU-15 and USA are major net importers of carbon (EBRD, 2011).
The available data show that reductions of territorial CO2 emissions in a number of high-income countries of the ECE region have been made possible by energy-intensive imports (annex table 3). For instance, the territorial CO2 emissions of the EU-15 countries in 2008 were 67 million tonnes below the 1990 level while the emissions embodied in consumption of the EU-15 in 2008 were 89 million tonnes above the comparable 1990 level. More generally, the territorial carbon cuts in high-income ECE economies have been made possible by carbon-intensive imports of goods and services from low and middle-income countries. By contrast, the territorial CO2 emissions and consumption-related emissions in the EECCA countries declined by 1,230 and 565 million tonnes respectively over the same time period, contributing decisively to the reduction of the carbon footprint of the pan-European region as a whole. The high carbon content of exports of the large EECCA economies reflects their resource endowments as well as the artificially low domestic energy prices.
B. Progress in shifting towards more sustainable production and investment patterns
Environmental impact of the changing production and investment pattern in the pan-European region
The tertiarisation process, involving a structural shift from goods-producing industries to less energy-intensive service sectors, can contribute to a reduction of the energy intensity of the economy. In the pan-European region, this tertiarisation process, shown by the rising value-added share of services (from 47 to 71 per cent between 1970 and 2005), slightly receded in the last three years, to the advantage of “mining and utilities” and the construction industry. The shares of agriculture and manufacturing, with declining trends in the previous decades, stabilised at 2 and 17 per cent respectively (table 3.1).
Table 3.1: Sector distribution of total value added in the pan-European region (percentage shares at current prices)
1970 1975 1980 1985 1990 1995 2000 2005 2008
Agriculture 10.4 8.0 6.3 6.9 5.1 3.3 2.6 2.2 2.2
Industry 43.0 41.0 39.4 37.3 34.1 30.1 28.5 27.2 27.9
Mining and utilities 2.5 2.6 3.5 3.8 4.3 3.7 3.6 4.1 4.4
Manufacturing 32.4 30.3 28.5 26.9 23.0 20.3 19.3 17.2 17.2
Construction 8.1 8.0 7.4 6.6 6.8 6.2 5.6 5.9 6.4
Services 46.7 51.1 54.3 55.8 60.8 66.6 68.9 70.6 69.9
Wholesale and retail trade, restaurant and hotels
11.5 12.2 13.2 13.5 13.5 14.6 14.9 14.6 14.7
Transports, storage and communications
5.9 6.1 6.2 6.1 7.0 7.0 7.0 7.2 7.2
Other activities 29.3 32.8 34.9 36.2 40.3 45.0 47.0 48.8 48.1
TOTAL 100.0 100.0 100.0 100.0 100.0 100.0 100.0 100.0 100.0
Source: UNIDO 2009a

39
Trends in Emerging Europe and Central Asia also show the growing importance of services, the rising shares of mining and utilities and, conversely, the decreasing share of agriculture and manufacturing. As illustrated in figure 3.5, the share of services significantly increased from 41.9 per cent in 1990 to 57.9 per cent in 2000 and stabilised during the 2000s, reaching 60.3 per cent in 2008.
In the 1990s and 2000s, the most important drivers of structural change were transport and communications, followed by ‘other activities’, which include research and development, computer activities, financial intermediation and public administration. The share of non-tradable services (wholesale and retail trade, restaurants and hotels) decreased in the early period of transition (in the early 1990s) but later became a major element in the displacement of industry and agriculture in the overall economic structure.
Figure 3.4: Value added by agriculture, industry and services
in Emerging Europe and Central Asia, 1970 – 2008
Source: UNIDO database (Indstat2 2011), UNIDO calculations
In terms of international competitiveness, economic diversification and growth based on high value added sectors in manufacturing still remain elusive development goals. Several countries, particularly in Central Asia, are mainly oriented towards low value added agriculture and extractive industries such as oil, gas and metals, which are vulnerable to global price shocks.
The changing investment pattern is a key driver of this structure of production. As shown in table 3.2 below, the most attractive sector for foreign investors is raw material extraction ( mainly gas and petroleum) which reached 12% of world inward FDI flows in the EECCA and SEE regions, as compared to 4,1% for the services sector and 2,8 for manufacturing. This reveals that foreign investors are more interested in short-term returns than longer-term projects, which is a symptom of ongoing political instability, lack of proper governance and shortages of skilled labour in some countries.
Table 3.2: Estimated world inward FDI flows, by sector, 1990-1992 and 2007-2009 (shares)
1990-1992 2007-2009
Sector/Industry Developed countries
Developing countries
EECCA & SEE
World Developed countries
Developing countries
EECCA & SEE
World
Primary 65.8 28.3 5.9 100.0 47.7 40.1 12.2 100.0
Agriculture, hunting forestry
and fishing 1.8 98.2 0.0 100.0 6.9 84.3 8.8 100.0

40
Mining, quarrying and petroleum 68.9 24.9 6.2 100.0 49.3 38.3 12.3 100.0
Manufacturing 65.6 33.9 0.5 100.0 61.3 35.9 2.8 100.0
Services 79.9 19.9 0.2 100.0 69.5 26.4 4.1 100.0
Total share 72.7 26.5 0.8 100.0 65.5 30.0 4.5 100.0
Source: UNECE calculations based on UNCTAD/WEF 2011.
Greening the energy sector
From the production perspective the generation of electricity and heat is the largest source of global GHG emissions, followed by transport, manufacturing and construction, and agriculture. In Europe and Central Asia, these sectors generate about four-fifths of GHG emissions. Energy industries alone account for one third of GHG emissions in the EU (31 per cent in the EU-15 countries and 47 per cent in the NMS), more than one-third in Turkey and the United States, and almost three-fifths in Russia (table 3.3).
Table 3.3: Distribution of GHG emissions by sector, 1990-2009 (percentage shares)
EU-15 NMS Russia Turkey United States1990Agriculture 10.9 14.0 9.3 20.9 7.2Energy industries 28.9 43.1 34.3 24.0 34.5Manufacturing and construction 15.8 16.0 6.3 26.5 16.0Transport 17.2 6.4 10.0 18.5 27.9Other sectors 27.2 20.5 40.1 10.0 14.32009Agriculture 11.0 13.0 9.5 8.9 7.5Energy industries 30.9 46.6 57.7 35.8 38.7Manufacturing and construction 13.2 11.2 8.8 19.3 13.1Transport 23.6 16.2 13.2 16.5 30.7Other sectors 21.2 12.9 10.8 19.4 10.0
Source: UNECE calculations based on the UNFCCC GHG emission data.
Current data on national energy mixes show that development of alternative energy sources is still nascent in most countries, despite vast potential. The energy mix varies widely among the countries of the region. Half the countries are net energy exporters, some countries are highly dependent on high carbon fuels such as oil and coal, and several countries are heavily reliant on energy imports. The share of renewables in the energy mix varies considerably among countries of the region, ranging from close to 100 per cent in Albania and Tajikistan to a negligible contribution in Poland. Estonia, Poland and The former Yugoslav Republic of Macedonia are heavily reliant on coal. Others have a more diverse energy mix. For instance, Hungary gets a quarter of its electricity from coal, a quarter from natural gas, nearly 40 per cent from nuclear power and 10 per cent from oil. Hydroelectric power represents only one per cent of the country’s electricity supply. Turkey relies on imports for more than half its energy and has been trying to diversify its energy sources, for instance by recently introducing natural gas. Its energy demand is predicted to grow substantially, as it has for several decades, due to a fast growing population, urbanization and economic growth. There are also plentiful renewable sources of energy, including hydro, solar, wind, geothermal and biomass, and these represent the second largest domestic source after coal. Both Western and Eastern Europe (including Armenia, Bulgaria, France, Hungary, Lithuania, Slovakia, Slovenia and Ukraine) remain heavily dependent on nuclear power.
The energy sector in many countries in the region relies on imports of natural gas, oil and electricity. Growing populations, urbanization and economic growth in some countries will raise energy demand further, putting additional pressure on energy security in the region. How to meet ambitious targets for cutting GHG emission set out by the EU
41
for its members and potential members and how to deal with the issue of energy security have hence become major policy concerns for economies in the region.
If countries are to gain the maximum potential from renewable energy, they will require investment in new technologies. Already, electricity systems in many countries are under stress from ageing infrastructure and growing demand. The vision of an era of clean energy, as described by proponents of the ‘third industrial revolution’ involves the transformation of millions of buildings into power stations, linked to ‘smart grid’ networks that regulate the flow and supply of energy. Smart grids are an essential element of the transition to a carbon free economy, enabling efficient and reliable energy delivery. At present, however, there is little evidence of public investment in renewable energy in emerging economies of the region and there are insufficient positive incentives for private sector investments (WEF/Accenture 2009).
In the Russian Federation, despite its vast potential of renewable energy (thanks to a geography that is suitable for wind, geothermal and solar energy generation), mineral resources continue to dominate the energy sector. In 2009, around 1 per cent of power was generated from renewables. The Russian leadership has, however, shown interest in high-value and high-technology sectors, such as the manufacture of wind turbines. The latest government energy strategy aims for 4.5 per cent of energy from renewables by 2020.
Renewable energy sources and new technologies allow countries to meet EU targets without sacrificing geopolitical and economic security in the region. There are calls for the diversification and localization of energy supply linked to pan-European energy networks, involving millions of local micro producers sharing energy from renewable sources, such as wind and solar, in the same way that information is produced and shared on the internet through open source (Rifkin 2011). A decentralized network of micro producers will require intelligent approaches to distribution and storage, such as the use of ‘smart grids’ (see Box 3.3) involving microprocessor technology, whereby energy that is generated locally can be fed into an ‘inter-grid’ and consumed where and when it is needed, increasing the efficiency and flexibility of supply. Advanced energy storage can also be used to reduce the variability of generation associated with renewable energy sources.
=======================================================================
Box 3.2: Smart grids
Renewable energy and smart grids go hand in hand. As more and more countries diversify their energy sources to include solar, hydro, biomass and wind, grids must adapt to manage variability issues (e.g. wind speed is not constant). Smart grids are becoming more sophisticated and intelligent, and many foresee an expansion towards energy storage facilities in electric vehicles, which will help to accelerate the expansion of renewables (REN21 2011: 58). The market in Europe in smart grids is expected to reach almost $10 billion in 2015.
Smart grids represent a solution to two critical challenges: they encourage renewable power while helping to prevent blackouts and revolutionize energy production, distribution and use, enabling developing countries without conventional grids to fast track development. They promise to increase the supply of energy and provide an opportunity to invest in ageing infrastructure. Investment can also be used to boost innovation, jobs and green growth, increasing the reliability, security and diversification of energy sources.
The following factors are contributing to the development of smart grids (EC-DGR 2006: 11): - Targets at European and national levels on reducing carbon emissions and expanding renewable energy sources - The need to tackle technical challenges and limitations of existing grid networks - Existing grids are nearing the end of their operational and functional lifespans - Grids are becoming ‘congested’ due to rising demand - Desire to bring benefits to customers at the earliest possible point - To reduce the risk associated with investment decisions - Technological improvements are lowering costs
Smart grids also have an important role to play in sustainable development, and in connecting regions. The European Commission predicts that smart grids will connect different but complementary energy sources from regions, allowing for trading opportunities and exchange between EU states, countries in Eastern and South-Eastern Europe and even Africa (EC-DGR 2006: 22). The development of smart grids is likely to be incremental with OECD economies leading the way (WEF/Accenture 2009), but the massive potential for renewable energy production is likely to lead to a rapid expansion into the region.
=======================================================================

42
Most of the new technologies and smart solutions for greening the power sector will come with high initial price tags, as economies in the region are technologically weak and hence dependent on Western European countries’ supply of these new green technologies. The OECD data on patents and government expenditure shows that from a relatively low starting point, investment in green technologies is expanding rapidly, although in emerging economies of the region for which there is data, there is substantially less innovative activity than in market leaders. Russia for instance spent around 2 per cent of its budget on energy and environment priorities, compared to 14 per cent in New Zealand (OECD 2011b).
Greening the manufacturing sector
The manufacturing sector in advanced economies of the region experienced a rapid growth of energy efficiency and declining carbon intensity over the last two decades. These improvements have resulted from a combined effect of cost-reducing technical progress and the changing composition of manufacturing output that has increased the share of technologically-advanced subsectors. These trends have also materialized to some extent in emerging economies of the region. Generally the progressive transformation of the manufacturing sector has taken place more rapidly in new EU member states than in other transition economies. The relatively carbon-intensive manufacturing sector in the EECCA and SEE economies continues to be characterized by outdated production technology and high output shares of heavy industry. The low prices of domestic energy in EECCA economies reduce the incentives for adopting more energy efficient production techniques in the iron and steel industry where the Russian and Ukrainian firms are already price competitive on the world market (EBRD, 2011).
Manufacturing energy-intensity classifications developed by UNIDO show that in Emerging Europe and Central Asia high-energy intensive sectors continue to represent more than 30 per cent of manufacturing value-added. Around 30 per cent of manufacturing value-added is produced in moderate energy-intensive sectors. During the 1970s and 1980s the share of high and medium energy-intensive sectors gradually increased but fell after 1990, following the collapse of central planning that led to a reduction in heavy industrial activity. The maximum share (nearly 80 per cent) of high and moderate energy-intensive sectors was achieved in 1995, as regional economies started to recover. Subsequently, the share of those sectors started to decline, caused by changes in the structure of manufacturing. However, low energy-intensive sectors still account for less than 35 per cent of total manufacturing value-added. This manufacturing structure affects the overall standing of the region by energy intensity, contributing to its poor performance in comparison with other regions of the world and the global average. Nevertheless, a convergence process of energy intensity between Western Europe, new EU members and the EECCA and SEE transition economies can be observed (UNIDO, 2009a).
Policies for sustainable industry
A number of countries of Emerging Europe and Central Asia adopted energy efficiency programmes with ambitious targets (annex table 4). Moving away from fossil fuels to renewable energy sources, such as nuclear, carbon capture and storage, and developing of energy networks, will therefore require the promotion of low energy demand lifestyles and investment in new energy technologies and supporting systems, including new infrastructure to transmit, store and produce energy, which can raise energy efficiency, diversify production and cut energy demand. But this will require substantial external financial and technical assistance.
Table 3.4: Policies for sustainable industrial production
National action plans European Union. National Energy Efficiency Action Plans (NEEAPS) adopted by EU member states combine a range of tools including, financial incentives, technical assistance tools, information provision, recognition programmes, mandatory auditing and R&D support.
EECCA and SEE. Most EECCA countries adopted legislation or national programmes for the rational use of energy.
Regulatory instruments
Western and Central Europe and North America. Integrated environmental permitting for large industry specifies major pollutant emission limits and on-site monitoring procedures.
Western and Central Europe and North America. Construction companies have to comply with minimum energy efficiency standards for new buildings.
EECCA. Environmental permitting based on detailed pollution limits for

43
numerous individual substances. Economic instruments
Western and Central Europe and North America. Cost-reflective energy prices stimulate producers to introduce energy-saving innovations.
European Union. Cap and trade system puts a price on carbon emissions of major producers.
Western and Central Europe. Subsidies for low-carbon producers. Voluntary agreements
Western and Central Europe. Many firms adopted voluntarily ISO environmental management standard and product standards.
Information instruments
European Union. The European Commission has established an eco-innovation initiative to bridge the gap between R&D and commercial application. The initiative is based on the idea that the best eco-innovation products or processes are those which can be replicated across the whole EU.
EECCA and SEE. Some EEECCA and SEE countries adopted eco-innovation initiatives similar to the EU initiative.
.Greening the transport sector
Transport is an increasingly important source of GHG emissions in all parts of the ECE region. This reflects the rapid expansion of transport activity that has overwhelmed considerable improvements in energy efficiency of all transport modes. Despite the comparatively strong growth of civil aviation and navigation subsectors, road transport continues to produce more environmental pressures than any other mode, accounting for about three-quarters of CO2 emissions from transport.
Technological progress has strongly reduced the energy and carbon intensity of transport over the last two decades. Road vehicles have become more energy efficient, less polluting and less noisy. Transport infrastructure materials are more sustainable and environmental impact assessment studies have become sounder. Nevertheless, technological advance by itself is unlikely to achieve sustainable transport. In average, vehicles have increased in size, weight and power but even more important, they have increased in quantity as have the distances driven. As a result, the overall impact of road transport on the environment has worsened over the last two decades.
The supply of transport services has become greener, mainly through the technological development. Governments have at their disposal a number of policy instruments to “green” transport sector. These policies are on both supply and demand side. Providing greener road infrastructure and services is becoming reality in many UNECE countries (e.g. in Austria, Sweden and the UK) and their best practices could be studied for wider implementation. On the demand side many governments experiment with demand management policies to curb excessive motor vehicle traffic, promote non-motorized transport modes (cycling and walking) and public transport in urban areas (for more details, see chapter IV).
Although controversial, taxation of fuels is used as a policy instrument in a number of countries. The fuel tax increases to some extent the internalization of externalities linked to road transport. The increased operational costs of vehicles could result in a shift to more environmentally transport modes such as rail or inland waterways, providing that such alternatives are available and can compete with road in terms of cost and quality of service (e.g. timelines, reliability).
A relatively new policy instrument aims to change the modal split of freight transport from road to rail with the aid of tolling charges on trucks. In 2001, Switzerland introduced a performance‐related heavy vehicle fee levied on all trucks of more than 3.5 tons. They are charged on the whole Swiss road network, according to the kilometres driven, the total weight and the vehicle’s emission levels. Germany introduced the tolling charges for trucks in 2005, followed by the Czech Republic and Slovakia within a few years. In the new system trucks are charged according to the distance travelled and emission levels.
The financial instruments can be combined with a number of regulations pertaining to technical performance of new vehicles. For example, the UNECE regulations on vehicle emission limits are shown in figure 3.6. These limits combined with the EURO standards introduced by the European Union have had a great impact on reducing the emission of especially local pollutants.

44
These regulatory instruments usually target only new vehicles. Combined with increasing taxes on vehicles, such regulations make new vehicles more expensive and as a result national vehicle fleets are not getting renewed rapidly. This is a major issue in many countries of the region. However, the so-called bonus-malus system has therefore been introduced in some jurisdictions. This system provides financial incentives for buyers of new vehicles when they replace an old car with a more environmentally efficient model. This example also shows that there is not one single instrument to improve sustainability; instead a mix of measures must be used to achieve the best results.
Greening the agricultural sector
In average, agriculture accounts for about one-tenth of GHG emissions in the ECE region (see table 3.7 above). Europe and Central Asia is characterized by diverse social, economic and environmental problems resulting from agricultural policies and practices. In parts of the region, the unsustainable use of natural resources and adverse consequences of global changes have significant effects on everyday life. Such impacts hit hardest the poorest and most vulnerable communities in the region (e.g. in Central Asia) that have limited natural resources and opportunities for growth. There are significant differences in agro-ecological conditions among the farming systems in the region. The agro-ecologies vary from one of the world’s most fertile regions in South-Eastern Europe, to poor, water-scarce regions of Central Asia. This agro-ecological diversity, plus the heterogeneity of political, economic and social conditions in the region, has resulted in the development of a wide variety of farming systems as shown in table 3.5 below.38
Table 3.5: Major Farming Systems in Eastern Europe and Central Asia39 Farming Systems
Land Area (% of
region)
Agricultural Population
(% of region)
Principal Livelihoods
Prevalence of Poverty
Irrigated 1 4 Cotton, rice, other cereals, tobacco, fruit, vegetables, off-farm
Moderate - extensive
Mixed 4 18 Wheat, maize, oilcrops, barley, livestock
Low - moderate
Forest Based Livestock
3 5 Fodder, hay, cereals, industrial crops,
potatoes
Moderate
Horticulture Mixed
3 11 Wheat, maize, oilcrops, fruit, intensive
vegetables, livestock, off-farm income
Moderate - extensive
Large-scale Cereal Vegetable
4 16 Wheat, barley, maize, sunflower, sugarbeet,
vegetables
Moderate - extensive
Small-scale Cereal Livestock
1 4 Wheat, barley, sheep and goats Moderate
Extensive Cereal-Livestock
18 15 Wheat, hay, fodder, cattle, sheep Moderate - extensive
Pastoral 3 10 Sheep, cattle, cereals, fodder crops,
potatoes
Moderate - extensive
Sparse 52 2 Rye, oats, reindeer, potatoes, pigs, Extensive
38 http://www.fao.org/farmingsystems/EU_leg_en.htm;
ftp://ftp.fao.org/docrep/fao/003/y1860e/y1860e00.pdf
39 http://www.fao.org/DOCREP/003/Y1860E/y1860e06.htm#P3_34
45
(Cold) forestry Sparse (Arid)
6 8 Barley, sheep Extensive
Urban Based
<1 7 Vegetables, poultry, pigs Moderate
Source: FAO data and expert knowledge. Note: Prevalence of poverty refers to number in poverty, not depth of poverty, and is a relative assessment for this region. Water bodies account for 5 percent of the total regional land area.
The pan-European region is characterized by a stagnating population of about 900 million people. This is the result of divergent national developments, with the countries of Eastern and Western Europe experiencing stagnant or declining populations while Turkey, Azerbaijan and Central Asian republics are still experiencing a considerable growth in their populations. Food security is not a problem in most countries of the region, with the exception of some countries of Central Asia with a relatively high incidence of chronic under-nourishment. In these countries, women play an important role in food security (box 3.3). Most European countries have eliminated hunger; however, over-nourishment (obesity) has been increasing in both Eastern and Western Europe.
Box 3.3: Women and food security in Central Asia
Women’s role in local food security is profound in Central Asia. As the predominant part of the agricultural workforce in rural areas, women are exposed to adverse impacts related to climate change. Being primarily responsible for managing household food consumption, women have to deal with rising food prices. Securing water for rural households is also a task largely performed by women. This reality raises two issues – firstly, the value of the knowledge and insights being acquired by female farmers through their engagement in agricultural production to an effective design of climate change coping strategies and mechanisms, is lost. Secondly, the importance of women’s access to, and control over, economic assets including land and land use related decisions is neglected. Without economic means, women cannot apply their choices in controlling their own consumption and production patterns, especially when making ‘greener’ choices may be a costly affair. Furthermore, women in those countries are excluded from policy-making. Their insights are not fully utilized in policy decisions related to more sustainable agricultural activities. Thus, the following issues need to be urgently acted on, particularly in the context of rural Central Asia:
- De facto equality between men and women in control over their property and land rights;
- Improvements in the gender balance in decision-making processes at household, communities, and local government level;
- Provision of inexpensive social services to facilitate women’s equal access and rights to the labour market;
- Changes in the social perception of gender norms and stereotypes.
Production trends in Europe and Central Asia reflect the adaptation of agriculture to a demand-constrained environment, reflecting subdued population growth and the fairly high per capita level of food consumption, beyond which the scope for further increases is rather limited. Agricultural production has been supported by demand for biomass to be used as feedstock in biofuel production and exports to other regions. Nevertheless, Europe as a whole is expected to remain a net importer of agricultural products. Given the uncertainties surrounding future developments and the economic viability of biofuels, most projections assume a modest expansion of biofuel demand over the next decade.
Conventional production methods predominate in the region. In addition to high levels of CO2 emissions, conventional agriculture increases environmental pressures through soil erosion; eutrophication; pollution of drinking water with nitrates; water-logging and salinity; pesticide contamination; biodiversity degradation; and rangeland degradation.40 Even in the EU, where approximately half of the land is farmed and contributes to the maintenance of a unique
40 UNEP (2010c).

46
countryside and ecosystems, environmental problems such as pollution of surface waters and seas by nutrients, loss of biodiversity and pesticide residues in groundwater persist.41
Many key ecosystem services provided by biodiversity, such as nutrient cycling, carbon sequestration, pest regulation and pollination, sustain agricultural productivity. Promoting the healthy functioning of ecosystems ensures the resilience of agriculture as it intensifies to meet growing demands for food production. Climate change and other stresses have the potential to make major impacts on key functions, such as pollination and pest regulation services. Learning to strengthen the ecosystem linkages that promote resilience and to mitigate the forces that impede the ability of agro-ecosystems to deliver goods and services remains an important challenge.
Farming systems for sustainable crop production intensification offer a range of productivity, socio-economic and environmental benefits to producers and to society at large, including high and stable production and profitability; adaptation and reduced vulnerability to climate change; enhanced ecosystem functioning and services; and reductions in agriculture’s greenhouse gas emissions and carbon footprint.
Conservation agriculture is now practised on about 117 million ha worldwide, or about 8 percent of total crop land. However, in order to achieve the sustainable intensification necessary for increased food production, the conservation practices need to be supported by four additional management practices:
the use of well adapted, high-yielding varieties with resistance to biotic and abiotic stresses and improved nutritional quality;
enhanced crop nutrition based on healthy soils, through crop rotations and judicious use of organic and inorganic fertilizer;
integrated management of pests, diseases and weeds using appropriate practices, biodiversity and selective, low risk pesticides when needed;
efficient water management, by obtaining “more crops from fewer drops” while maintaining soil health and minimizing off-farm externalities.
Organic agriculture systems have a strong potential for building resilient food systems in the face of uncertainties, through farm diversification and building soil fertility with organic matter, especially in Europe and Central Asia (box 3.4). Additionally, organic agriculture offers alternatives to energy-intensive production inputs such as synthetic fertilizers. Certified organic products provide higher income options for farmers and, therefore, encourage climate-friendly farming practices.42 Worldwide sales of organic produce reached nearly $5 billion in 2009, with Western Europe and North America accounting for 96 per cent of the market (48 per cent each). There are about 260,000 organic producers, 35,000 processors and 2,500 importers of organic produce in Western Europe. In the EECCA, organic agriculture is still at a rather early stage of development except for Moldova and Ukraine, covering 2% and 1% of farmland respectively (see also chapter V, box on Moldova).
=======================================================================
Box 3.4: Organic farming in Romania
Organic farming in Romania is a dynamic sector with more than 3,000 producers and over 100 processing operators in 2010. The Romanian Ministry of Agriculture expects the number of producers to triple by the end of 2011. Renewable energy and smart grids go hand in hand. Romanian exports of organic produce to Western Europe amounted to €150 million (150,000 tonnes) in 2010. The domestic market for organic products has been experiencing annual growth rates of 20 per cent in recent years. Domestic production has been unable to satisfy domestic demand, resulting in a rise in organic imports to €35 million by 2010. Converting conventional farms to organic producers is a high priority for the Romanian government. Since 2010 the government has been allocating small subsidies for farms in the process of conversion, amounting to €400 per hectare.
============================================================================
41 European Environment Agency (2009).
42 http://www.fao.org/docs/eims/upload/275960/al185e.pdf; http://www.fao.org/organicag/oa-home/en/

47
Continuous progress in the development and implementation of sustainable agriculture policies has been made in the pan-European region, especially in Western Europe. The strategic approach for the promotion of sustainable form of agriculture that addresses the interlinked problems of rural poverty and environmental degradation is under preparation in a number of the EECCA and SEE countries. The lack of institutional capacity still hampers effective implementation of targeted agricultural and rural development policies and support programmes in the region.
Table 3.5: Sustainable agricultural policies: Examples of good practice
Regulatory instruments
Western and Central Europe. Good Agricultural Practices (GAP) codes, standards and regulations address environmental, economic and social sustainability for on-farm processes, resulting in safe and quality food and non-food agricultural products.
EECCA and SEE. Legal basis for the development of organic agriculture established by Croatia, Macedonia, Bosnia and Herzegovina, Serbia, and Montenegro, Kazakhstan.
Organic market regulation in Moldova. Regulations on pesticides and agricultural chemicals in Ukraine, Albania, Armenia, Bosnia & Herzegovina, Croatia
Economic instruments
Western and Central Europe. Direct payments to farmers are to be linked to sustainable land management from 2013 onward..,
EECCA and SEE. Most EECCA and SEE countries have implemented agricultural and trade policies that employ government market intervention in agriculture to alleviate the pressures for structural adjustment and to assure some self-sufficiency in food production.43 In Moldova, organic operators receive financial support from government programmes.
Information-based instruments
Western and Central Europe. The European Action Plan for Organic Food and Farming sets out 21 initiatives, such as improving information about organic farming. Many countries have organised public events, fairs and information campaigns for the promotion of organic foods.
EECCA and SEE. In Moldova advisory and training facilities as well as education programmes in organic farming are available. Croatia, Bosnia and Herzegovina, FYR Macedonia, Montenegro and Serbia have introduced systems for the certification of organic farms and the labelling of products from organic production.
North America. In the United States, the National Organic Program oversees the implementation and development of organic agricultural production, labelling, and inspection.
C. Moving forward
Key objectives for sustainable production
In order to accelerate the transition towards sustainable production, countries of the region need to develop their policies with a view to reach the following key objectives:
Diversify the energy mix and increase the share of renewables
Boost green investment in the energy consuming industrial sectors (mining/extraction, manufacturing, construction)
43 http://www.un.org/esa/sustdev/csd/csd16/rim/ece_bg1_en.pdf page 5

48
Use modern services such as telecommunication and new green technologies to modernize other services and manufacturing
Shift the industrial production towards energy saving sectors
Promote organic farming and agricultural conservation practices for sustainable crop production intensification
Strengthen ecosystem services provided by biodiversity
Develop sustainable transport systems
A huge potential for greening production patterns in the pan-European region
While significant progress has been made in the pan-European region towards reducing energy intensity and increasing energy efficiency, this has occurred from a low starting level in EECCA and SEE countries. Additional advance requires strong proactive approaches and there is a potential for moving ahead along this line. Studies on industrial energy efficiency and conservation in the region highlight that it will be possible for countries in the region to realise high levels of growth without concomitant increases in GHG emissions. The emerging part of the region can use new technologies to reduce emissions, and not simply by moving up production chains and consuming increasingly products manufactured elsewhere (‘exporting’ CO2 emissions) as many countries in Western Europe. These studies often present a variety of scenarios towards cutting CO2 emissions that countries can follow by using low-carbon energy supplies, improved energy efficiency, or carbon capture and storage. Poland, for instance, could realise a 31 per cent reduction in CO2 emissions of 2005 levels by 2030 (McKinsey 2009a). Similarly Russia, with its huge natural resources and potential for raising energy efficiency in industry and buildings could double its GDP by 2030 while keeping its GHG emissions close to 1990 levels (ibid).
Thus the prospect of energy and resource efficiency and the application of eco-technologies are huge in the region, given its population and demand for new technologies. There is evidence that these technologies are diffusing into the region (for instance in the steel industry) but there is great variance among countries.
Developed countries are currently leading the way in green technological advancements, but with focused strategy development, targeted knowledge transfer, and improved access to finance, other countries in the region could leap frog the transitional stage by leveraging high-tech eco-innovation and ICT to achieve greater industrial diversification and productivity.
Overcoming institutional, market and behavioural barriers
Numerous case studies carried by UNIDO and other international organizations point to the existence of various barriers and failures that are inhibiting firms from investing in profitable energy efficiency projects. How can transition economies overcome these barriers? A useful lesson from newly industrializing economies to keep in mind is that all obstacles to energy and resource efficiency result from transaction costs, information asymmetries, behavioural failures and lack of modern collective actions to deal with interdependencies among segments and actors involved in the product value chain. These barriers exist in developed countries as well but are more pronounced in transition economies because of weak institutions, budgetary constraints and lack of skills in government administration. A comprehensive institutional framework as well as specific sets of policies need to be designed for overcoming these barriers.
The need for a comprehensive institutional framework
Countries that have succeeded in improving their energy and environmental performance have done so through creating an enabling governance framework for the uptake of new environmentally-friendly technologies and practices in industry such as energy efficiency, waste management and recycling services, renewable energy technologies, environmental analytical and advisory services. The structure of such framework can be outlined as follows:
At the national level, the central responsibility for the public management of energy and environmental strategy and policy is often with a dedicated government body, such as a national energy or environmental

49
agency. This government body requires strong technical skills and dedication to implement national energy policies;
At the sub-national level, many countries have also set up local or regional government bodies to provide more targeted measures and to collaborate closely with local industry players, academia, and local intermediary institutions (such as energy and information centres);
An array of intermediary organizations and institutions can also help firms implement green projects and meet nationally established targets. Support institutions—such as industry associations, energy conservation centres, cleaner production centres, energy research and development laboratories, energy technology and information centres, cluster development institutions, as well as metrology, standards, testing, and quality control centres—that can create a business environment conducive to the development of energy efficiency projects and the uptake of existing green technologies.
The above mentioned institutions should play a key role in:
Adopting national energy strategies, programmes and sectoral action plans with the purpose of integrating energy and environmental goals with developmental goals;
Within the framework of these strategies, establishing long term goals and quantifiable and achievable efficiency targets, both for the economy as a whole and for different sectors with a view to create incentives for investment in green technologies and practices;
Transforming the strategy and its related goals and targets into policy action through a mix of policies and processes, such as regulatory, fiscal, financial and information measures; each country needs to adopt an appropriate policy mix that reflects specificities of its national competitive and natural advantages;
Ensuring the effective implementation of these policy tools through legal enforcement provisions, economic incentives and various encouragement and rewarding measures; education, training and outreach are also an important feature of compliance regimes; in other words, effective compliance regimes should include a combination of enforcement, promotion and assistance tools, which are mutually supportive
Benchmarking the performance of a given sector or country and establishing monitoring and reporting
systems to identify violations and to assess whether policies have been effective over the long-term; Indicators should form part of all monitoring and enforcement regimes, as a tool to simplify, quantify, and communicate environmental data.
Designing specific policies targeted to the private sector
Within a given sector, targets can be negotiated between government and the industry, based on assessments of energy efficiency and energy conservation potentials at the firm level. These agreements can be used to raise awareness of industrial energy efficiency and engagement of all relevant stakeholders - firms, industry associations, financial institutions and governments,
Governments and support institutions should develop information programmes for entrepreneurs to present the advantages and opportunities arising from investments in efficient technologies, as well as an information on estimated costs, benefits, risks and duration of industrial energy efficiency investment project, together with the financing schemes available for such investments;
Concerned institutions should promote energy management practices in industry through establishing and supporting various technical assistance programmes
Governments can introduce Minimum Efficiency Performance Standards (MEPS) for industry in order to increase demand for energy efficient equipment and can also encourage companies to establish Energy Management Standards (EMS) to improve energy performance through changes in how energy is managed in an industrial facility;

50
Recognition programmes should reward firms who make an effort to implement energy efficiency solutions. These programmes, which consist of a contest and awards ceremony, a media event and exposure, and a recognition certificate, have been proven to be effective to promote a more positive perception of energy efficiency by highlighting the potential benefits and publicising successful outcomes. Using energy efficiency rewards to garner a competitive advantage can assist in embedding the pursuit of energy efficiency into an organizational culture. And, at the company level, energy awards provide a platform for companies to audit their energy usage, identify possible energy savings projects, and ultimately increase company profitability and productivity.
Corporate taxes could be differentiated according to the compliance of firms with energy standards and well
targeted subsidies could be provided for investment leading to high energy efficiency; Direct and indirect (e.g. reduced VAT rates) subsidies on carbon-intensive energy (fuel and electricity) should
be progressively removed in order to stimulate firms to invest in energy efficiency equipment;.
Soft loans, credit lines, publicly-backed guarantees and revolving funds, as well as venture capital funds are key for financing green investment and decrease perceived risk. Such financing schemes by public and commercial institutions are particularly needed for SMEs which presently lack access to funds.
Boosting eco-innovation and green investment For industrial eco-innovations to take-off in the region, there needs to be a political commitment through
designing a coherent policy framework to support R&D and innovation efforts, provision of infrastructure, and public funding.
In this respect, many countries of the region have established dedicated bodies that are charged with
developing strategies and policies to boost eco-innovation, or have produced action plans on science and technology. Eco-innovation is thus increasingly incorporated into national strategies for economic competitiveness and growth (for example in the Russian Federation and Serbia)
Green procurement and investment by the public sector (still lacking in low and middle income countries) can
be a tool for generating demand for new green technologies among local firms, and encourage investment by industry in such energy efficiency technologies This can also form the basis for increasing productivity and boosting innovation in state owned firms. Incorporating a green growth agenda into government procurement and green criteria in all tender processes is particularly important in emerging economies where the state has a greater role in boosting demand in order to make up for weaknesses in the private sector;
On the supply side (technology push), there is a need to develop a policy mix combining increased
government-funded research, subsidized research in the private sector within the framework of partnership agreements, and compliance with intellectual property rights (IPR).
Eco-entrepreneurs face a particular problem in convincing potential funders of the attractiveness of the
growing market in eco-technologies. SME surveys have found that critical barriers include a lack of finance tailored to SMEs’ investment needs, and inadequate synergies between the technology and commercial aspects. Particular needs of SMEs can be met through participation in global and regional value chains and these practices are becoming more pronounced in the ECE emerging economies. Lead firms in the value chain can be important agents providing access to new knowledge, skills and technology and can also ensure compliance with standards;
Initiatives should be taken to learn from and incorporate foreign knowledge and technology upgrading. This
would complement indigenous areas of scientific expertise. An emerging trend is for clean-tech FDI to target emerging markets but for taking full advantage of this trend, the leap from R&D to commercialization calls for an innovation-conducive environment.

51
Raising awareness within firms
As a legacy of previous energy regimes in the Eastern part of the region, there is an underdeveloped culture of energy efficiency in societies and economic sectors. Developing and encouraging concepts of responsible behaviour are therefore important. Embedding climate change, energy and resource efficiency concerns in national and regional policy-making can play an important role in changing how industry, business and government work together to better manage resources (McKinsey 2009b). Along this line the following measures should be promoted:
Organise campaigns to disseminate energy efficiency information, offering possibilities to choose among all possible technical options and make the costs of available technologies transparent. Such campaigns have no direct impact on GHG emissions or production costs, but they do have the potential to change stakeholders’ perceptions. Though relatively easy to implement, they do require an organising structure and public funding – which again, may constitute an obstacle for a number of countries with transition economies.
Complement such information on energy efficiency opportunities through a variety of technical information sources including fact sheets, brochures, guidebooks, technical publications, energy efficiency database, energy efficiency assessment and self-auditing tools, case studies and industry- and technology specific energy efficiency reports and benchmarking tools.
Design institutional arrangements for raising awareness of potential savings and efficiency benefits to be gained from energy efficiency investments with a view to boost industries’ capability and willingness to adopt what had previously been seen as high cost and risk technologies.
Regional cooperation
Although established in many countries of the region, the government bodies charged with the implementation of industrial energy-saving programmes still lack the necessary capacity and technical skills to design, implement, and evaluate energy efficiency programmes, to interact with concerned stakeholders at the national level (such as firms and local governmental authorities) and to ensure coordination with other government bodies, foreign donors, and international financial institutions. In most countries with economies in transition, including those that are resource rich, such international technical assistance is still critical to support the design and implementation of national energy strategies and policies as well as of regional energy programmes and networks. The EU should therefore consider developing portfolios of activities to assist SEE and EECCA countries in these areas with a view to extend energy efficiency and conservation throughout the region.
52
Chapter IV. Changing consumption patterns
A. Sustainable consumption
The sustainable consumption challenge
In most countries, household consumption determines 60% or more of the life-cycle impacts of final consumption (UNEP, 2010). The most important household consumption activities in terms of direct impacts are food consumption, mobility/transport, and housing (including energy use for heating and electrical appliances). Environmental impacts or pressures of each of these consumption clusters are responsible for 20-30% of the problem (UNEP, 2010). In addition, household consumption causes indirect impacts due to the changes induced on the production of goods and services -- such as changes in agricultural production or changes in the delivery of consumption goods.
Although the direct environmental impact of each household is relatively small compared to that of production activities, millions of households all over the world are major contributors to problems such as climate change, air pollution, water pollution, land use and waste. As incomes rise so does consumption and demand for more food and beverages, for larger, warmer and more convenient living spaces, for appliances, furniture and cleaning materials, for clothes, transport and energy. In Europe, the affluence of the majority of the population has moved them beyond consumption patterns dictated by need alone, and even, for some products and services, beyond convenience and in many cases beyond environmental sustainability (EEA, 2007).
Policies aimed at promoting sustainable consumption should look at both the environmental impacts of consumption and social dimension. For example, making sure that families are lodged in decent housing (including enough heating and at least basic water and sanitation services), that all members of society have access to adequate transport options (such as making sure that public transport is available for those people living in rural areas that cannot make use for financial or other reasons of private transport, or ensuring that public transport is accessible to the handicapped), and that households have enough access to healthy and nutritious food. Sustainable consumption policies need to also adopt a gender perspective – women and men often have different consumption needs (for instance in terms of time of day availability and safety requirements of public transport) and women and men often control different shares and parts of a family’s budget.
Household consumption in the pan-European region
In the pan-European region, household consumption and public consumption represent 55-75% and 15-20% of GDP respectively while the remaining share corresponds to investments and net exports. Consumption levels and patterns vary widely across the region. Household consumption expenditure in Western Europe is three to four times that of EECCA (EEA, 2007). This has an important impact on the structure of household spending. Take the example of food. Across the EU-25, expenditure on food has remained constant even with increasing incomes, and thus presents an ever
Box 4.1: The global and region-specific policy framework for sustainable (production and) consumption
Sustainable consumption was put on the global policy agenda at the 1992 United Nations Conference on Environment and Development in Rio de Janeiro. Agenda 21 called for ‘new concepts of sustainable economic growth and prosperity which allow higher standards of living through changed lifestyles and are less dependent on the Earth's finite resources’ (Agenda 21). In 2002, the World Summit on Sustainable Development (WSSD) Plan of Implementation called for the development of a 10-year framework of programmes (10 YFP) in support of regional and national initiatives to accelerate the shift towards Sustainable Consumption and Production (SCP) patterns and launched the “Marrakech process” to develop and promote the framework. In the pan-European region, the 2003 Kiev and 2007 Belgrade Declaration of the Environment for Europe process stressed the importance of the shift towards sustainable consumption (and production) patterns and encouraged the adoption of programmes to accelerate this shift. In the European Union (EU), the EU Sustainable Development Strategy, revised in 2006, identified sustainable consumption (and production) among its seven key challenges.

53
decreasing proportion of overall expenditure, approaching 10%. Meanwhile, in the less developed countries of Central Asia and the Caucasus, food still dominates household expenditure, particularly in rural areas where there is little or no surplus income for non-essentials (EEA, 2007).
In the last decade, household consumption has been growing in all sub-regions in pan-Europe. While this trend is to be expected across the world, it is a stark contrast with the situation in the decade of the 1990s, when many countries in Central and Eastern Europe and Central Asia experienced reductions as result of the economic transition.
At the same time, patterns of consumption are changing rapidly. The food component is decreasing, and the shares for transport, communication, housing, recreation and health are on the rise. In the eastern part of the region, a small but growing urban middle class is increasingly adopting the consumption patterns of western and central Europe. Changing consumption patterns are causing increased impacts as spending shifts to more impact-intensive categories (transport and household energy use) within which growth in physical consumption (not just spending) has more than offset benefits from improved technological efficiency (EEA, 2007). Overall, while consumption in the transition countries in EECCA and parts of SEE remains low by OECD standards, transition countries are following similar development patterns to the richer economies of the UNECE region with the growing middle class in urban areas mirroring unsustainable western trends in consumption (UNEP and EEA, 2007). Since unsustainable consumption patterns in EECCA and SEE countries are still restricted to a relatively small middle class in urban areas, effective sustainable consumption policies can release the potential for ‘leapfrogging’ to sustainable patterns without the need to follow the intermediate path of unsustainable consumption being experienced by OECD countries.
Many variables drive changes in the patterns of household consumption. In Europe, in addition to increasing incomes and growing wealth, other significant drivers include the globalization of the world economy with the opening of markets, increasing individualism, new technologies, targeting of marketing and advertising, smaller households and ageing populations in some sub-regions (EEA, 2005).
To date, SCP efforts have been more focused on the production side than the consumption side. There are two major reasons why a more balanced approach is needed:
Sustainable consumption is a driver for sustainable production. The consumer makes the final choice about which goods and services to consume. Providers of final goods and services will move more decisively towards sustainable production patterns if consumer purchasing decisions show a preference for sustainable products and producers. This can impact all producers through the life-cycle chain.
Sustainable production is not enough. The sustainability challenge cannot be solved only by better product
design and more efficient production processes, as the gains generated may be simple more than compensated by the absolute increase in consumption. Indeed, in the developed countries of Western Europe (EU and

54
EFTA) and North America, increases in consumption of material goods and services have outpaced efficiency improvements (UNESCO, 2009).
Policy instruments to promote sustainable consumption There are two strategies for reducing the environmental impacts of consumption: reducing the environment and social impacts of 'business as usual' consumption (by reducing impacts at the production, use and disposal stages of common consumer goods and services) and promoting changes in consumption patterns (transferring demand from goods and services of higher to lower material and energy-use categories). A strong sustainability approach asks for pursuing both strategies.
A large number of policy measures can be adopted to promote sustainable consumption. They can be classified in the following “families”:
Direct provision. Direct provision of infrastructure and services affects consumer behavior by widening the choice set. Examples include the provision of public transport services or city bike systems.
Regulatory instruments. Regulatory instruments affect consumer behavior by redefining the choice set. Traditional examples include bans (such as the phase-out of leaded petrol or incandescent lighting) and product standards (such as energy performance standards for washing machines or emission standards for cars), but there are many others, such as building codes, speed limits, restrictions for cars with certain plate numbers to drive into the city centre, norms for the separation of household waste, or spatial planning rules to direct housing away from certain areas.
Economic instruments. Economic instruments alter relative prices and thus change the incentives faced by
consumers when making consumption decisions. Example of economic instruments include user charges (such as water and electricity tariffs and parking fees), taxes (such as fuel taxes), subsidies (such as public transport subsidies or subsidies for undertaking insulation works in private dwellings) and deposit-refund systems (such as for bottles). Economic instruments combine an economic incentive and an informational component. Just metering and introducing a price on the use of environment-related resources has an effect on people’s decision
Figure 4.2 Consumption in the life-cycle chain

55
making, even if the price is very low, because it provides a signal to households about consumption levels (OECD, 2011).
Information-based instruments. Information-based instruments work on two different ways. They empower
consumers to act on their preferences -- examples include eco-labels on organic food or energy-efficient appliances, campaigns to inform car drivers of the savings of driving at reduced speed. But these instruments can also alter behavior by modifying the preferences of consumers – such as awareness-raising campaigns to reduce household water consumption or to reduce beef consumption. Recent research shows that the role of soft policy measures is more significant than earlier thought (OECD, 2011). Eco-labels need to be clear and comprehensible as well as trustworthy, and are most effective when the environmental benefits co-exist with more direct personal benefits for the consumer – such as reduced energy bills resulting from energy-saving behavior or personal health benefits associated with the consumption of organic food (OECD, 2011).
Voluntary approaches. Voluntary approaches include agreements on environmental performance negotiated with industry and public programmes in which firms can volunteer to participate. While voluntary approaches are increasingly popular in environmental policy, they are not yet very common in the consumption area – one exception is public-private collaboration to promote choice editing (such as the French convention on the withdrawal of incandescent bulbs from the market and promotion of low consumption lamps). Voluntary approaches have been criticized (see OECD, 2003) because even though the environmental targets are usually met, there don’t usually contribute to environmental improvements beyond what would have happened in the first place. On the other hand, voluntary approaches can offer higher economic efficiency than regulatory instruments by providing firms increased flexibility in how they achieve environmental improvements and there are cases where voluntary approaches represent the only policy option available – for example when there is no authority in place that could adopt and enforce a “compulsory policy” (OECD, 2003).
Policy measures can be combined in policy packages to increase their effectiveness. For example, higher fuel taxes can be combined with the provision of public transport, or increases in electricity tariffs can be combined with the obligation to provide information about the energy efficiency of electric appliances.
Key consumption sectors This chapter will look more in depth at three key sectors of household consumption: housing (including utilities), food and beverages, and transport. They are the dominant consumption sectors, although their importance varies across the pan-European region (see Table 4.1). Those key sectors represent the majority of household spending and environmental impact – in the European Union they represent about 60% of consumption expenditure and 70-80% of environmental impacts (EEA, 2007). At the same time, increasing attention needs to be paid to other consumption sectors as consumption patterns change – for example, recreation has climbed to number two among consumption sectors in Western European countries.
Table 4.1: Ranking of household expenditure items in selected sub-regions
EU-15 EU-10 EECCA SEE
Food and non-alcoholic beverages 4 2 1 1
Housing (including utilities) 1 1 3 2
Transport 3 3 6 3
Recreation 2 4 8 n.a.
Source: Elaborated based on information provided in EEA (2007)
B. Progress in the pan-European region
Progress with overarching SCP policies
56
Western and Central Europe. The EU has made significant advances since the Johannesburg Summit. The 2006 EU Sustainable Development Strategy identifies SCP as one of seven key challenges to be tackled in the EU and an EU Sustainable Consumption and Production and Sustainable Industrial Policy Action Plan was approved in 2008. Moreover, an increasing number of EU member states are addressing SCP explicitly and comprehensively in their National Strategies for Sustainable Development (NSSD). Examples of countries that have prepared dedicated SCP action plans include the UK (2003), Poland (2003), the Czech Republic (2005) and Finland (2005). Examples of countries addressing SCP explicitly and relatively comprehensively in their NSSDs include Belgium, Czech Republic, Denmark, Greece, Italy, Hungary, Malta, the Netherlands, Norway and Romania.
SEE and EECCA. In SEE countries there has been a rapid emergence of SCP strategy since 2007 as part of the development of NSSDs – in particular in Croatia, Serbian, FYR Macedonia and Montenegro. The NSSD’s of Croatia and Serbia include indicators for SCP. In EECCA countries SCP is yet to emerge on the political agenda, but some progress is taking place. Kazakhstan’s Strategy on Sustainable Development of 2007-2024 has some elements of SCP. Belarus has adopted a NSSD which includes some SCP concepts. Moldova’s National Strategy of Social and Economic Development from 2005 refers directly to SCP and includes a number of SCP relevant concepts. Ukraine’s Concept of National Environmental Policy to 2020 includes SCP-related issues such as the need for reduced resource intensity and introduction of environmental priorities into industry. The Russian Federation includes resource use decreases and energy efficiency improvements among environmental policy priorities.
North America. Canada and the United States have implemented and are still actively developing a wide spectrum of policies and programmes at the national, state/provincial and local levels which have SCP relevance. The United States and Canada’s first ever meeting concerning SCP occurred at the North American Workshop on Sustainable Consumption and Production (NAWSCP) in 2008, which lent support to the Marrakech Process by suggesting complementary policy initiatives for promoting SCP patterns in the region.
Greening public sector consumption
While this chapter focuses on household consumption, the public sector is also an important consumer – consumption by the public sector represents 15-20% of GDP in most countries of the pan-European region (EEA, 2007). As a consumer, the public sector can do much to green its own behavior. For example, in the U.S., the Federal government is providing USD 4.5 billion for greening federal buildings by increasing energy efficiency. Western European countries are progressing in the strengthening of the Green Public Procurement (GPP). In Sweden, government agencies are only allowed to buy vehicles that are environmentally friendly. Many other examples include; the construction of energy efficiency schools in Malta; purchasing energy efficient lightings in Portugal; and purchasing energy efficient IT equipment in Gipuzkoa, Spain44
Green Public Procurement (GPP) is not practiced to a great extent either in SEE or EECCA, but some countries are making steps in creating legal and policy frameworks for GPP – for example, Uzbekistan’s Decree on Procurement of Chemical Substances for Agriculture demands that ecological and social factors are taken into account in procurement decisions. Bosnia and Herzegovina and Montenegro’s Public Procurement Laws also include environmental provisions though no target (UNEP, 2009).
Greening housing
Impacts. The most important environmental impacts of housing are related to energy consumption for space and water heating. Typically, 80-90% of total energy used during the whole life of a building is consumed during the use phase (EEA and UNEP, 2007). In the European Union space heating accounts for some 70% of household energy consumption and water heating for some 14% (Eurostat data in EEA, 2007), with similar proportions estimated for EECCA and SEE. For many smaller electric and electronic goods, the most critical environmental impacts arise from disposal rather than usage because of their high content of heavy metals and other hazardous substances. Other environmental impacts relate to water consumption.
Trends. Energy efficiency of interior heating and electric devices has been increasing, but those gains have been more than offset by rising demand from behavioral changes. Growth in number of dwellings, floor area per dwelling and increased average room temperatures are increasing total energy demand for space heating in most EU-15 countries, and while in some EU-10 countries the total energy demand for space heating has decreased, in per capita terms it is
44 See ‘GPP in practice’. Each case include description of criteria set for procurement procedure.
http://ec.europa.eu/environment/gpp/case_en.htm

57
still significantly higher than in EU-15. In most Central and Eastern European countries there is still a major potential for energy savings by replacing the large stock of poorly insulated apartment blocks with improved insulation and introducing greater levels of control over heat input (as well as by rationalizing and upgrading district heating systems and insulating distributions networks). The electric and electronic goods waste category now represents one of the fastest-growing waste fractions in the EU (EEA, 2007). The quantity of electric and electronic goods for disposal is dependent both on ownership levels in the population and their replacement rates. Today, replacement is more often driven by changing fashion and small technical advances than by the useful lifespan of an appliance (in particular for mobile phones and computers). Replacement rates of electronics are lower in SEE and EECCA countries, but ownership is rapidly increasing (EEA, 2007).
Consumers’ options. To reduce the environmental impacts of housing, households can invest in home insulation, buy water-saving devices (power showers, dishwashers, washing machines) and energy-saving appliances (dryers, TVs, light bulbs), buy electricity from low polluting sources (when available), and change their behavior (reduce the number of rooms to be heated and the target temperature, take showers instead of baths, use dishwashers and washing machines at full charge, avoid leaving appliances in stand-by mode).
Policy progress. In the last decade there has been considerable progress in terms of policy awareness and action, in particular in the area of space heating (see table 4.2). For example, a wave of new national and regional building standards and energy labels for buildings in the Albania, Armenia, Croatia, Kazakhstan, Tajikistan and Ukraine among others have led to new buildings with thermal efficiencies 35–40 % greater than buildings constructed in the 1990s (UNEP/EEA, 2007).
Table 4.2: Sustainable Housing: Examples of Policy Progress
Source: Adapted from UNEP and CRI (forthcoming)
45 http://europa.eu/rapid/pressReleasesAction.do?reference=MEMO/06/218
Regulatory instruments
Western and Central Europe. Since 2006 EU member states must apply minimum requirements regarding the energy performance of new and existing buildings and must ensure the certification of their energy performance.
EECCA and SEE. Updates of old building standards for insulation and heating envelopes (e.g. Albania, Russian Federation, Tajikistan)
North America. In Canada, the Vice‐President’s 2009 “Recovery through Retrofit Report” recommended establishing standards for national retrofitting training and measuring home energy efficiency.
Economic instruments
.Western and Central Europe. Financial support in building construction, rehabilitation and heating (Austria, France, Greece). Eco‐loans at zero rates (France).
EECCA and SEE. Gradual introduction of water meters and increases of tariffs for water and other communal services in several countries.
North America. In the U.S., the Federal government has set aside USD 5 billion set aside for subsidizing low‐income home weatherization projects.
Information‐based instruments
Western and Central Europe. At the EU level, introduction of carbon calculators (e.g. Mycarbonfootprint.eu) and awareness raising campaigns (e.g. The Control Climate Change campaign45). At national level, development of guidelines and information portals (e.g. Czech Republic’s ToptenCZ website and database on the energy efficiency characteristics of household appliances) and introduction of labels for low‐energy buildings (e.g. the French High Energy Performance label).
EECCA and SEE. Several countries have introduced mandatory energy labeling for household appliances (such as Albania, Armenia, Croatia or Turkey) and buildings such as Croatia, Kazakhstan, the Russian Federation, Kazakhstan or Turkey). Information campaigns about energy use in buildings have taken place in Moscow (Plus 20 pamphlet) and Serbia (‘Use energy rationally’ campaign).
North America. The U.S. and Canadian Green Building Councils oversee the certification of green buildings and setting of rating systems and guidelines. In the U.S., the Energy Star labeling program provides reliable information regarding the energy efficiency performance of appliances for consumers.
Voluntary agreements
Western and Central Europe. Public‐private collaboration to promote choice editing (e.g. the French convention on the withdrawal of incandescent bulbs from the market and promotion of low consumption lamps).

58
Greening transport
Impacts. The most important environmental impacts of transport are GHG emissions and local air pollution. Serious health impacts are caused by traffic accidents and noise, in addition to air pollution. While private cars offer benefits in rural areas where public transport is sparse, in urban areas the private car is the most polluting and least energy efficient method of transportation per passenger. And after a certain threshold, private cars also generate additional social costs in terms of congestion. . The cost of traffic congestion, pollution and accidents in the European Union well exceeds EUR 500 billion per year, and overall road traffic death and disability cost up to 3% of Europe’s GDP (UNEP 2011b).
Trends. The environmental impact of private transport is growing. Technological improvements are making all transport modes more environmentally friendly – for instance car fuel efficiency increased by 15% in 1990-2006 in the EU27 countries (see Figure 4.3) – but energy consumption and emissions from road transport keep increasing. Growing incomes are driving an increase in private motorization (shifting away from public transport and non-motorized transport such as walking and cycling) because it provides increased flexibility but also because it indicates wealth. Car ownership in EU-15 and the number of kilometres travelled have increased at the same rate as GDP growth since 1990, and in many countries consumers have shown a strong preference for larger and less fuel-efficient cars despite unfavourable differential road taxes (EEA, 2007). These trends more than offset voluntary efforts by manufacturers to improve average fuel efficiency. Private car ownership, albeit starting from a much lower base, is increasing even more rapidly in Central and Eastern European countries. Capacity utilization is decreasing as incomes rise -- average car occupancy in many developed countries is around 1.5. The growth in private car use has resulted in some rural areas in the discontinuation of public transport services, thus reducing the access to mobility of people that cannot drive or afford to drive.
Consumers’ options. Individual choices can reduce the environmental impact of a given “quantity” of transport use. They can do it through choice of mode (choosing the most environmentally friendly transport mode), capacity utilization (exploiting the capacity of vehicles) and choice of car and driver behavior (choosing an environmentally friendly car and driving it in an environmentally friendly way).
Box 4.2: Case study on Sustainable Housing: Promoting Energy Efficiency in Buildings in Croatia
As in other transition countries, there is a great potential for increasing energy efficiency in buildings in Croatia. Croatia’s housing stock exceeds two million apartments, of which 45% were built before 1970, and it increases at a rate of 1% per year. Energy consumption in the building sector represents around 25% of the total primary energy supply or around 40% of the final energy demand in Croatia.
As part of its energy efficiency efforts, Croatia established back in 2003 the Environmental Protection and Energy Efficiency Fund, which provides loans and grants to reduce energy consumption and increase the competitiveness of green technologies. In 2004‐2010, EUR 3.2 million were disbursed for 78 projects in the building sector that aimed to improve energy efficiency through lighting and heating systems, building envelopes, substitution of the primary energy source in boiler plants, and optimization of combustion systems.
More recently, as part of the EU accession process, Croatia introduced in 2008 a framework for compulsory energy certification of buildings. Currently, this includes the 2008 Act on Energy Efficiency in Final Consumption (which regulates energy efficiency programming on national and local level, obligates the public sector to introduce energy management practices and sets limits for the direct consumption of energy by each sector), the National Energy Efficiency Programme 2008‐2016 and the First National Action Plan on Energy Efficiency. As a result, minimum energy performance requirements for minimum energy performance have been set for new buildings and for major renovations, and energy performance certificates are required for all buildings when constructed, sold or rented. Energy certification of buildings started in April 2010 with new residential and nonresidential buildings. The Ministry in charge launched in 2009 a programme to train energy certifiers (more than 650 engineers had completed it by the end of 2010) and between April and November authorized more than 150 experts for the implementation of the energy certification.
Next steps include revisiting the legislation on energy efficiency in buildings legislation to accommodate the EU EPBD Directive and make improvements based on the experiences so far. In addition, it is planned to launch new national information and communication campaigns to raise awareness of building owners and users.
Source: UNEP (2011b) – original information submitted by UNECE and the Croatian Energy Agency

59
Policy progress. In the last decade, there have been an important number of new initiatives to reduce the environmental impacts of transport, spanning all policy instrument categories but in particular through the expanded use of economic instruments (see table 4.3).
Figure 4.3: Fuel efficiency of cars in EU-27 countries
80
90
100
110
120
130
140
150
1990 1992 1994 1996 1998 2000 2002 2004 2006
1990
= 1
00
Total distance travelled in cars
Total fuel consumption of private cars (l)
Fuel consumption of average car (km/l)
Source: EEA
Table 4.3: Sustainable Transport: Examples of Policy Progress
Source: UNEP and CRI (forthcoming, OECD (2007) and UNECE staff, UNEP (2011b)
Direct provision
Western and Central Europe. Strategies to promote cycling and walking in cities are becoming common in many countries (e.g. improved cycling lanes and storage facilities in cities such as Krakow, Amsterdam, Copenhagen, Freiburg, London, Paris, Venice and Vienna) Dedicated lanes to encourage carpooling (e.g. Belgium).
EECCA and SEE. The need for sustainable transport investment is being increasingly recognized and government expenditure in Belarus, Albania, Croatia and Armenia has been growing in recent years
North America. In the US, the Federal government is allocating USD 13 billion in funds to sustainable transportation infrastructure projects.
Regulatory instruments
Western and Central Europe. Dynamic and flexible speed limits (e.g. Austria, Belgium).
EECCA and SEE. Tighter standards for fuels in Belarus and the Russian Federation. Bans on imports of used vehicles older than a certain age or without catalytic converters (e.g. Armenia). Since 2003, leaded petrol banned in additional countries (e.g. Kazakhstan, Kyrgyz Republic, Moldova and Uzbekistan).
North America. In the US, new regulation allows various states to increase fuel efficiency standards for 2011 model automobiles.
Economic instruments
Western and Central Europe. Differentiated vehicle taxes (e.g. Austria, Denmark, France, UK). Bonus systems for replacing vehicles (e.g. Belgium). Scrappage schemes (e.g. France, Germany). Tax exemptions for electric cars (e.g. Denmark). Road tolling (e.g. Austria, Bulgaria, Czech Republic, Hungary, Romania, Slovakia, Slovenia and Switzerland). Congestion charging (e.g. London, Stockholm).
EECCA and SEE. In some countries fuel taxes have increased rapidly in recent years (e.g. Belarus). Croatia has introduced motorway tolls. Kazakhstan has differentiated annual vehicle taxes based on engine capacity. Several countries use fuel tax differentials between leaded and unleaded fuels. is a further used in some countries aimed specifically at environmental improvement.
North America. In the US the “cash for Clunkers” program subsidized the substitution of older cars for newer, more efficient cars.
Information‐based instruments
Western and Central Europe. Car‐labeling (e.g. Israel, Switzerland). Eco‐driver training (e.g. Austria).
North America. Provision of environmental information to motorist (e.g. Canada).
UNECE region. UNECE/WHO Transport, Health and Environment Pan European Programme is the platform to support sustainable mobility through tools, information, knowledge and capacity building

60
Greening food and beverages
Figure 4.4: Meat consumption trends
Impacts. The most significant environmental impacts of food consumption are indirect, and relate to agricultural production and industrial processing. Direct impacts of food consumption are lower in magnitude and relate to travel for shopping trips, energy use for cooking and cold storage, and the production of organic and packaging waste (EEA, 2005). The dietary options of consumers, such as increasing consumption of organic fruit and vegetables and decreasing consumption of meat, can have significant health impacts (in particular as regards the prevention of non-communicable diseases) in addition to the narrow environmental impacts.
Trends. Agriculture has been undergoing efficiency improvements over recent decades. But several trends in food consumption are partially offsetting those efficiency improvements, in particular a shift in demand from local and seasonal towards imported, non-seasonal fruit and vegetables, and a general globalisation of the food market, as well as the increased use of processed foods and pre-prepared meals (EEA, 2007). A small but growing group of consumers in western and central European countries are switching to organic and/or locally produced foods. While the environmental consequences of food production and food safety have gained considerable attention in the EU, providing food that fulfils elementary nutritional needs remains a challenge in a number of countries in Central Asia and the Caucasus -- which is related to the fulfilment of the human right to food, as in some countries chronic malnutrition (stunting) still affects from one fifth to one third of children.
Consumers’ options. In comparison with, for example, space heating, consumers have a relatively large control over their food and beverage purchases. They can usually opt for diets with lower environmental impacts, although this often faces economic and cultural barriers (organic food tends to be more expensive, healthy foods are not always available in all neighbourhoods, and as income grows, so does meat consumption). They could also change their habits in terms of optimising grocery shopping trips and opting for low packaging food. In many cases, given the multiplicity of products in the market, consumers face a constraint in terms of the time they can devote to acquire and process information about the environmental and health consequences of their food and beverage purchases, while they are at the receiving end of intense marketing efforts. However, the fair trade and similar initiatives provide consumers with the opportunity to support sustainable development (box 4.3).
Box 4.3 Fair trade
Fair trade is a market approach that aims at paying fair prices to producers and promoting sustainable production methods. The Fairtrade International Labeling Organization (FLO) is the biggest fair trade labeling organization, although numerous other certification programmes also exist. Global market shares in fairtrade products remain very small; nevertheless certain commodities such as bananas and coffee represent large shares of sales in specific countries. For example, in Switzerland 55% of bananas sold in 2005 were fairtrade certified. In the UK, the estimated retail value of fairtrade products was £1.17bn in 2009. Fair trade offers several opportunities from a sustainable development perspective, helping small producers access international markets for commodities that are largely dominated by large corporations and empowers people to enhance their opportunities and to support broad-based, sustainable development. Fairtrade requires meeting minimum criteria for environmentally friendly soil and water resource management. The label has rules on the use of chemical fertilizer and does not allow the use of genetically modified plants, in addition to other environmental rules and regulations. The inclusion of environmental concerns is to ensure a profitable yet sustainable use of natural resources.
Policy progress. Unsurprisingly, given the nature of the problem, most public policy efforts have focused in the provision of information to consumers, but it is unclear to what extent this has resulted in more sustainable options and actual consumer empowerment (see table 4.4).

61
Table 4.4: Sustainable Food: Examples of Policy Progress
Source: Adapted from UNEP and CRI (forthcoming)
C. Moving forward
The previous sections have outlined the state of policy and action in the various sub-regions of the pan-European region. Progress to date and the future agenda varies widely not only between sub-regions (see table 4.5), but also within sub-regions.
Table 4.5: Regional Overview
Sub‐region Recent progress Moving forward
Western and Central Europe
General progress on the production of sustainable products and encouraging consumers to purchase them through information‐based instruments. However, the progress did not achieve the absolute reduction of materials and energy consumptions.
Need to promote changes towards sustainable lifestyles. A stronger integration of SC into foreign policies including development aid.
EECCA and SEE
Some progress in sustainable housing policies, less in other areas.
Need for increased attention to develop a policy agenda for sustainable consumption, but with continued focus on housing and transport.
North America Policies relevant to sustainable consumption are being implemented in various areas, in particular housing.
Need for increased coordination of initiatives and for increased attention to transport. Need to promote changes towards sustainable lifestyle. A stronger integration of SC into foreign policies including development aid.
Source: Elaborated based on information provided in UNEP and Ministry of Environment of Sweden (2009)
Nevertheless, a regional agenda for the next 10 years could be articulated around the following points: 1. Place a greater focus on sustainable consumption and sustainable lifestyles. Although at different levels of
progress, all sub-regions focus most efforts on production, fewer on products, and very few on changing consumption patterns. Even in the most advanced sub-region, Western and Central Europe, SCP quantitative targets reflect a predominantly production-oriented approach (UNEP and CRI forthcoming). Yet, experience show that production and product efficiency gains are often more than offset by consumer behavior – whether in terms of space heating, private car use or demand for non-traditional foodstuffs. Thus, more efforts need to be made to develop and implement policies to promote sustainable lifestyles, particularly in affluent countries, as to transfer demandfrom goods and services of higher to lower material and energy-use categories.
2. Adopt an integrated and balanced approach to changing consumption patterns. Many different measures are being used across the pan-European region, spanning different sectors and categories of policy instruments. Those measures could be better articulated around policy packages and aiming to exploit synergies between actions in different consumption sectors. Attention should be paid to ensure that policy packages are well balanced –more
Economic instruments
North America. In the U.S. and Canada, several states and provinces are implementing Deposit‐Refund Systems. Several cities (such as Toronto and New York) have introduced a tax on plastic bags.
Information‐based instruments
Western and Central Europe National campaigns aimed at sustainable food and diets in several countries (e.g. Austria, Czech Republic, Germany, UK). Eco‐labelling systems for organic food (e.g. Denmark, Germany, Sweden).
EECCA and SEE. Croatia has implemented much of the EU legislation on environmental certification and labelling of organic food, with a policy package that includes the creation of a certification scheme for organic food and information campaigns promoting organic products to consumers (as well as economic incentives to farmers to take up organic). Kazakhstan has engaged in the process of environmental labelling of food products.
North America. In Canada, the Extended Producer Responsibility Task Group informs the public about the amount of waste created by packaging.
62
attention to economic instruments is probably needed in some sectors and sub-regions. For example, to eliminate fossil fuel subsidies and increase in taxation of use of individual cars, to increase water and energy charges together install individual metering for households to provide financial incentives to reduce the use of energy and water. Such measures need to be implemented with policies to mitigate financial burdens to the low income and other vulnerable groups in the society not to increase inequalities. While governments keep playing a traditional role of control (regulation and standards), they need to take a wider role of governance or ‘change management’, recognizing that collective action and engagement by producers, consumers and civil society are key in achieving sustainable consumption (UNEP and CRI, forthcoming).
3. Tailor action to specific circumstances. The countries of the pan-European region vary widely in terms of per
capita income and cultural norms. Moreover, evidence shows that consumption-oriented policies can be effective only if they are differentiated according to the particularities of the different social segments in terms of values, attitudes and behavior (UNEP and CRI, forthcoming). Particularly in the eastern European and central Asian countries, attention needs to be paid to managing the trade-offs between environmental and social aspects -- for example in terms of the potential impact of tariff increases for communal services on the utility bills of the poorest segments of the population. At the same time, those countries are the most likely to offer opportunities for leap-frogging. In all cases, policies aimed at promoting sustainable consumption need to look not just at the environmental impacts of consumption but also at the social dimension, and adopt a gender perspective.
4. Focus first on the low hanging fruit. Particularly in EECCA and SEE countries, there seems to be a growing implementation gap as new strategies are in many cases not backed up by financial resources, institutional capacity and political will. Yet, there are huge opportunities for advancing towards sustainable consumption while achieving economic savings (win-wins), most clearly by reducing energy use through refurbishment of inefficient housing (and of district heating networks), and creating new employment opportunities. While there are many examples of such projects these represent only a very small part of the potential and have been initiated by foreign donors. National government could consolidate progress in those areas and use such progress (for instance in terms of consumer education) as a basis for launching initiatives in more difficult sectors.
63
Chapter V. The social dimension of the green economy
This chapter advances the idea that sustainable development is about people: their health, equity and employment. While a greener economy is needed, the required adjustments will not automatically benefit all segments of society. Likewise, long-standing inequities will not necessarily disappear during the green transition. High unemployment rates, rising levels of inequity, the growing epidemics of non-communicable diseases and persisting communicable disease are all existing challenges in the region. Therefore it is even more necessary to ensure the benefits of transition reach the social groups most affected by the specific social, economic and environmental challenges.
Social protection mechanisms, deliberate investments in preventive health measures, access to basic needs and policies targeted to the most vulnerable workers, communities, regions and industries are all necessary components for taking advantage of the economic and social opportunities presented by sustainable practices in labour and health in the region. A key policy direction in this regard is the establishment of a social protection floor, with coverage for all segments of the population, including poor and vulnerable groups as well as those socially excluded. Additional measures can include employment guarantees, minimum wage legislation and the protection of workers’ rights as well as provision for affordable childcare and social services to reduce women’s unpaid work Opportunities for further progress lie in fostering healthier and reduced consumption. They also lie in healthy and job-creating green developments in energy, transport, housing, urban management and agriculture, as well as in the health sector. This however requires the development of a better understanding of the implications of green developments on employment and health and their societal co-benefits, thereby preventing undesired effects.
A. Introduction
Over the past twenty years, the world has witnessed strong economic growth and significant progress towards attaining a number of the Millennium Development Goals (MDGs), including improvement in health. It is of grave concern, however, that these positive trends have been accompanied by increasing disparities, persistent gender inequality, unemployment, social inequity, a growing deterioration of the environment, and recurrent economic, financial, energy and food crises, all negatively affecting people. It is the young people in the region that are facing the biggest consequences: difficulties to find decent work due to their lack of work experience and appropriate skills, exposure to unsustainable consumption patterns, environmental consequences of decades of pollution, climate change and other global environmental changes and a more rapid spatial distribution and patterns of movement of plants, animals and diseases. However, they are also born in a world of wide-ranging technological progress, from renewable energy and energy efficiency, to innovative measures for adapting to climate change impacts, and new and efficient means for social networking, dialogue and participatory engagement, providing opportunities that were not available twenty years ago. The creation of green jobs could represent new opportunities for youth employment. The Social Protection Floor and a more sustainable management of natural resources could help to create greater equity between men and women and ensure food, electricity, water, education and healthcare to the working poor, rural workers, ethnic minorities and migrant workers. The chapter looks in particular at enhancing equity, employment and health, while protecting the planet and its ecosystems that support us so that all people, women, men and children, can live in dignity. The chapter provides examples of both the challenges for employment and health, and on how development in these and other sectors and settings can contribute to equity in health and employment. The shift to sustainable development presents challenges, but also offers opportunity for substantial returns on investments, both public and private, in productive infrastructure, technological transformation, science, education and human capital development.

64
B. The labour dimension of the transition to a green economy
In this section emphasis will initially be placed on the concept of green jobs in a just transition to a green economy, and what must be considered in order to achieve sustainable development and economic growth. Subsequently, consideration will be given to the main challenges and opportunities of green job creation in the region and then actual achievements and future prospects. Finally, a set of practical policy recommendations will be advanced with a view to ensuring an economically smooth and socially just green transition.
Green and Decent Jobs
Moving towards a green economy is a strategic goal in countering the challenge of global warming and achieving sustainable development. The social, environmental and economic pillars of sustainable development are closely interlinked and should be pursued in unison as part of a coherent package of green economy policies and measures. In terms of labour, this means that all efforts to reduce the environmental impacts of economic activities should be linked with the determination to improve the working conditions of workers newly employed in green sectors and those whose jobs should be adapted to this new development paradigm. The aim of a green economy is therefore twofold, on the one hand it creates new green jobs for all, including the most vulnerable, and on the other hand it greens the labour market. Inclusive and green jobs policies lead to increased employment rates and become self-sustaining, providing additional financing for public health and all other social security systems.
Jobs are green when they help reduce the negative environmental impact of economic activities and lead to environmentally, economically and socially sustainable enterprises and economies. They reduce consumption of energy and raw materials, limit greenhouse gas emissions, minimise waste and pollution and protect and restore ecosystems. Green jobs should be decent jobs, with regard to the four strategic pillars of the ILO’s decent work agenda. The transition to a green economy should therefore respect workers’ rights as defined by International Labour Standards by providing equal employment opportunities for all; by strengthening the social protection system and protecting those negatively affected by a green transition; by engaging workers and employers’ associations in decision making and the implementation of green economy policies and programmes; and by implementing coherent labour market policies. Green jobs therefore provide a double social and environmental benefit. First, they improve working conditions, provide incomes and thus reduce poverty. Second, they improve the environmental situation through the reduction of water and air pollution, erosion and desertification, and biodiversity loss. Both of these gains are mutually reinforcing. Part of the process of greening the economy is also greening workplaces. Workplaces consume energy, use resources and generate waste and travel and are thus an obvious place where greening can be achieved. More broadly, the greening of workplaces can also encompass environmental considerations in relation to finance and investment, as well as procurement and supply chain policies.
It should be noted that there are different shades of green; this refers to the evolving nature of the positive effect of any job in terms of environmental impact reduction. In this sense, all jobs in all sectors and all countries have the potential to be greener, by for example reducing energy, water and raw material consumption, decreasing waste generation or increasing recycling. Consequently, the final objective would be to enhance decent work conditions together with the environmental performance of all jobs.
Green and Just Transition
In the low emission world that the green economy promotes, polluting sectors will face reduction and eventually might disappear, therefore it can be assumed that only environmentally sound jobs will be sustainable in the long-term. According to the ILO report ‘Skills for Green Jobs: a global view’, the transition to a green economy will bring both job opportunities in sectors that will be promoted (renewable energies, energy efficiency, etc) and job losses in declining sectors (coal mining, unsustainable forest harvesting, etc), as well as in economic sectors particularly affected by climate change such as agriculture or fisheries. The different mechanisms impacting the labour market can be summarized as follows:

65
Table 5.1: Employment impacts of the green economy
Direct jobs New positions in promoted sectors such as renewable energy, energy‐saving industries, waste and recycling
Indirect jobs New positions in sectors being part of the value chain of the promoted green sectors
Jobs Creation
Induced jobs New positions resulting from the income expenditure increase in communities
Jobs Loss Old positions suppressed in declining sectors such as energy‐intensive industries, energy extraction, the power sector, auto industry, etc.
Job Substitution Existing positions shifted from declining sectors to promoted sectors such as automobiles to public transport, waste disposal to recycling, fossil fuels to R&D.
Jobs Redefinition Existing positions redefined according to new performance and skills requirements
In some sectors, such as clean energy, the number of jobs created in the second and third categories would outnumber those created in the first one. Moreover, the impact on changes in the labour market is likely to be positive in the long-term (UNEP, 2008). Socio-economic impact assessments of investment in policies promoting a green economy show that if social benefits are considered in addition to narrow economic benefits in terms of growth, these investments add significant gains to the returns in the short term. The social benefits derive from additional income from direct, indirect and income-induced jobs, savings resulting from reduction of energy and raw material consumption, social benefits in terms of health improvements, etc. A broad cost-benefit analysis is therefore more helpful than a narrow cost-benefit analysis and demonstrates that green jobs are feasible and cost effective. This point is made for example in an assessment by the World Bank in 2003 called ‘The Extractive Industries Review’, which argues that the Bank’s lending on mining projects should be directed towards projects with potential to alleviate poverty and limit environmental damage. The economic analysis should therefore also include social and environmental concerns (WB, 2003).
As detailed in the table above, the dynamics in the labour market of a green transition will have different outcomes depending on the economic sectors under consideration. Those changes, though beneficial in the long-term, can have unfavourable effects on workers and their families in the short-term. The numerous uncertainties raised during the shift, such as risks of job losses or risks of economic downturn are addressed in the ILO’s Just Transition framework policy proposals. A Just Transition needs to take into account several policies (ILO, 2010b): - Early assessment of social and employment impacts should be developed to better prepare for change. - Green jobs promotion and sustainable enterprises creation programmes should be linked to economic diversification
programmes and green economy investments. - Labour policies in coherence with green economy objectives: active labour market policies; training and skills
development is crucial to prepare workers for new jobs and provide opportunities for acquiring new skills to those who are at risk of losing jobs; A labour intensive approach can be applied in some relevant sectors such as water and sanitation infrastructure, reforestation, or adaptation to climate change-related infrastructures.
- Social security policies and other social protection policies to cushion impacts on both workers and companies, of climate change and policies to address it.
- Social dialogue and democratic consultation of social partners and stakeholders should be fostered to promote consensus-building in policy-making and implementation.
Sustainable Development
There is a close link between a green economy, green jobs and poverty reduction due to different factors: i) low-income households depend to a large extent on natural resources which is why environmental degradation represents a greater risk to them (e.g the Russian Federation and Central Asia), ii) poverty is often a driver for environmental degradation and the reason for unsustainable management of natural resources (e.g. deforestation in the Russian Federation, land degradation in Central Asia and the Caucasus), iii) waste management and recycling processes are frequently carried out by the poorest in society, usually in dangerous working conditions and particularly by women and children.

66
However if working conditions are improved, jobs in these sectors could become increasingly decent and green. This would reduce poverty by providing additional incomes and improving the environment overall.
In order for green economy policies to contribute to poverty reduction, social cohesion and empowerment of marginalized people should be promoted. The measures developed should clearly target the social groups most affected by the specific social, economic and environmental problems at the country as well as regional and community levels. The vulnerable social groups include the following:
(i) Young people face additional difficulties to find decent work due to their lack of both work experience and appropriate skills. In CIS countries, Central and South-Eastern Europe the youth unemployment rate was of 20.8% in 2009 (ILO, 2010). The creation of green jobs could represent new opportunities for youth employment. The green economy requires new skills that could be promoted throughout the educational system and developed through training programmes and this is one way to link the needs of young people entering the labour market and the needs of employers. It is therefore important to factor youth into green employment strategies and launch green entrepreneurial initiatives as well as education and skills initiatives to support this. (ii) Women frequently face inequalities compared to men in terms of job opportunities and equal incomes. Specific measures to address gender issues and promote greater equity should be implemented, otherwise inequalities will persist in a green economy as well. The energy industry has so far been male dominated, and the involvement of women in science and technology-related jobs is still marginal. Gender stereotypes and lack of skills for newly created jobs in the energy sector are barriers to the participation of women in the green transition (Rustico and Sperotti, 2011). (iii) Un- and underemployed46, the working poor, rural workers, ethnic minorities and migrant workers, as far as their incomes are largely dependent on natural resources, are strongly impacted by environmental problems such as deforestation, forest degradation, erosion and water scarcity. A more sustainable management of natural resources (water, soil, forestry) will therefore not only be beneficial in environmental terms but also in social and economic terms. Europe and Central Asia and Green Jobs: challenges and opportunities
All countries in this region are confronted with the challenges arising from climate change and the unfolding economic crisis. Despite their heterogeneity, a number of priorities are clearly apparent in the region regarding energy efficiency and CO2 intensity. Countries in South-East Europe (SEE) and in Eastern Europe, the Caucasus and Central Asia (EECCA) are still some of the most energy-intensive in the world. Taken together, the use of primary energy by these sub-regions, per unit of GDP, is 2.7 times higher than the EU and can be explained by the central role of energy intensive industries and, in the CIS countries, energy prices still being below world prices. The region has great potential for energy efficiency savings in construction, industry and transport that could be realized at relatively little cost as we will see below. Moreover there are important opportunities in renewable energy production for both net energy exporters and importers. If wind, solar, hydro, and geothermic production potential is exploited, the net importers could reduce their reliance on external supplies and therefore increase their energy security, while the net exporters could meet current or future emissions reduction targets in an advantageous way, in comparison to nuclear electricity production which is more capital consuming. The transition to a green economy therefore has the potential to expand innovative industries, increase economic diversification, improve the resource efficiency of the economy and create new jobs.
Another challenge for countries in Central and Eastern Europe, as well as in Central Asia, is the unfavourable labour market and social situation with high unemployment and underemployment, widespread informal employment, low employment security, low wages, insufficient social security coverage and high poverty. Their economies and labour markets conceal vast structural imbalances and institutional weaknesses (e.g. reliance on hydrocarbons, minerals and steel production as the principal drivers of growth, remittance-dependency). The global financial and economic crisis has further deteriorated the situation since these shortcomings contributed to deepening the negative impacts on labour markets and the population (Nesporova and Nero, 2009). The economic downturn has deprived many workers of their jobs, impedes the creation of new jobs and aggravates the social situation of workers who have lost their jobs and their families, as well as the poor in general. While unemployment declined considerably in the 2000s, in all countries except for Georgia and Serbia, this positive trend has been interrupted by the crisis. In 2009 the unemployment rates increased in 10 of the 18 countries of the region, on average by 2 percentage points and remained elevated or even further increased in 2010. The level of unemployment is very high, in double digits, in the Western Balkan region as well as in Armenia and Georgia. It even exceeds 30 per cent in Armenia and FYR Macedonia and is close to this level in Bosnia and Herzegovina. In Eastern Europe and Central Asia the level of unemployment is lower, below 10 per cent, but these 46 Note that the share of the informal economy in Eastern Europe, Caucasus and Central Asia is high (22.3% in Ukraine in 2007, 17% in the Russian Federation in 2006, 33.2% in Moldova in 2007), and underemployment is an important feature (8.7% in the Russian Federation in 2004, 8% in Moldova between 2005 and 2008) especially in the rural areas (Nesporova and Nero, 2009).

67
countries are typically characterized by considerable underemployment in particular in the rural sector. Green packages, including investments in reducing the demand for energy through the promotion of energy efficient buildings, public transport, electrical appliances and cars, as well as diversifying the supply of clean and renewable energy, could efficiently revive the economy and lead to the relatively fast creation of a large number of jobs (e.g. Germany created more than 200,000 new jobs from 2004 to 2008 in the renewable energy sector). If invested wisely, the resources to overcome the economic crisis could leave a legacy of energy efficient infrastructure, renewable energy sources, and workplaces that are more resilient to climate change. In order to maximize the benefits of a green transition, green jobs must be decent jobs. Skills development, labour market policies, social protection, social dialogue, the strengthening of labour market governance, and workers’ rights protection are all important essential components of the move to a sustainable, economically sound, socially fair path to development.
Effects of climate change on employment
Climate change will have significant and irreversible consequences across the pan-European region. Although the effects will be very diverse among the countries, it is likely to alter the fundamental components of production, such as the use of land, fish stocks, food and water, as well as disrupt production processes through droughts or floods (IPCC, 2007). This in turn will lead to a rearrangement of labour and capital across and within sectors and sub-regions. The impact of climate change will affect the developing countries foremost, however the absolute damages are projected to be more important on developed economies in Western Europe and the former USSR (ETUC, 2007). The potential effects of climate change on economic activity and employment in the agricultural, forestry and fisheries sectors are as follows (ETUC, 2007; WB, 2009):
Table 5.2: Potential effects of climate change on economic activity and employment
Geographical location Main climatic drivers Expected potential effects on economic activity and employment
General Increase in frequency and intensity of extreme weather events
Negative impact on forestry productivity
Negative impact on employment
Northern Europe –
mid‐ and high latitude regions
Rising temperature, high atmospheric CO2 concentration
Positive impact on agricultural productivity
Positive impact on employment overall
Southern Europe, Mediterranean region, Caucasus, Central Asia
Rising temperatures, droughts
Negative impact on agricultural productivity
Negative impact on employment at local level
Southern Europe, Caucasus, Central Asia
Rising temperatures Negative impact on livestock productivity
Negative impact on employment at local level
Mediterranean regions Higher fire risk due to rising temperature, drought
Negative impact on forestry productivity
Negative impact on employment at local level
Fisheries communities (Iceland, Baltic Sea, Spanish and Portuguese coast, Caspian Sea, Black Sea)
Changes in sea surface temperature, wind regime, water runoff, ice melt, or marine currents
Negative impact on fisheries productivity
Negative impact on employment, possibly significant at local level
Although information about the impact of climate change on the world of work is still insufficient, there is a common consensus throughout the region that preventative actions including both climate mitigation and adaptation measures must be taken and that the cost of taking action now will be much less than if taken later.
Transition towards a green economy
The opportunities in terms of green jobs in the pan-European region vary according to several factors: i) the socio-economic situation, ii) natural resources and environmental regulation, and iii) socio-economic and environmental priorities of the different sub-regions. There are no coherent and comparable statistical databases in terms of green jobs (common definition, study by sector, future forecasts, impact on current labour, etc.) in Europe. Despite this, core environmental activities including pollution control management, natural resource-based activities such as organic farming and sustainable forestry, environment related tourism, renewable energy and water supply in the European
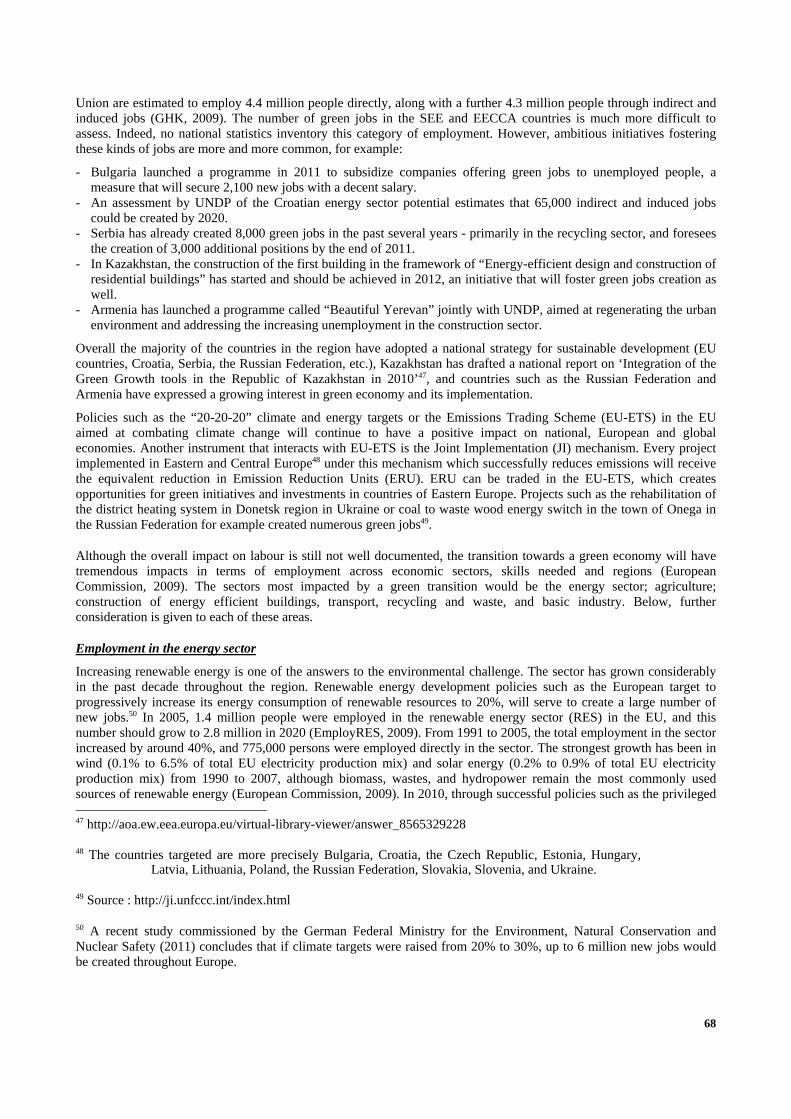
68
Union are estimated to employ 4.4 million people directly, along with a further 4.3 million people through indirect and induced jobs (GHK, 2009). The number of green jobs in the SEE and EECCA countries is much more difficult to assess. Indeed, no national statistics inventory this category of employment. However, ambitious initiatives fostering these kinds of jobs are more and more common, for example:
- Bulgaria launched a programme in 2011 to subsidize companies offering green jobs to unemployed people, a measure that will secure 2,100 new jobs with a decent salary.
- An assessment by UNDP of the Croatian energy sector potential estimates that 65,000 indirect and induced jobs could be created by 2020.
- Serbia has already created 8,000 green jobs in the past several years - primarily in the recycling sector, and foresees the creation of 3,000 additional positions by the end of 2011.
- In Kazakhstan, the construction of the first building in the framework of “Energy-efficient design and construction of residential buildings” has started and should be achieved in 2012, an initiative that will foster green jobs creation as well.
- Armenia has launched a programme called “Beautiful Yerevan” jointly with UNDP, aimed at regenerating the urban environment and addressing the increasing unemployment in the construction sector.
Overall the majority of the countries in the region have adopted a national strategy for sustainable development (EU countries, Croatia, Serbia, the Russian Federation, etc.), Kazakhstan has drafted a national report on ‘Integration of the Green Growth tools in the Republic of Kazakhstan in 2010’47, and countries such as the Russian Federation and Armenia have expressed a growing interest in green economy and its implementation.
Policies such as the “20-20-20” climate and energy targets or the Emissions Trading Scheme (EU-ETS) in the EU aimed at combating climate change will continue to have a positive impact on national, European and global economies. Another instrument that interacts with EU-ETS is the Joint Implementation (JI) mechanism. Every project implemented in Eastern and Central Europe48 under this mechanism which successfully reduces emissions will receive the equivalent reduction in Emission Reduction Units (ERU). ERU can be traded in the EU-ETS, which creates opportunities for green initiatives and investments in countries of Eastern Europe. Projects such as the rehabilitation of the district heating system in Donetsk region in Ukraine or coal to waste wood energy switch in the town of Onega in the Russian Federation for example created numerous green jobs49.
Although the overall impact on labour is still not well documented, the transition towards a green economy will have tremendous impacts in terms of employment across economic sectors, skills needed and regions (European Commission, 2009). The sectors most impacted by a green transition would be the energy sector; agriculture; construction of energy efficient buildings, transport, recycling and waste, and basic industry. Below, further consideration is given to each of these areas.
Employment in the energy sector
Increasing renewable energy is one of the answers to the environmental challenge. The sector has grown considerably in the past decade throughout the region. Renewable energy development policies such as the European target to progressively increase its energy consumption of renewable resources to 20%, will serve to create a large number of new jobs.50 In 2005, 1.4 million people were employed in the renewable energy sector (RES) in the EU, and this number should grow to 2.8 million in 2020 (EmployRES, 2009). From 1991 to 2005, the total employment in the sector increased by around 40%, and 775,000 persons were employed directly in the sector. The strongest growth has been in wind (0.1% to 6.5% of total EU electricity production mix) and solar energy (0.2% to 0.9% of total EU electricity production mix) from 1990 to 2007, although biomass, wastes, and hydropower remain the most commonly used sources of renewable energy (European Commission, 2009). In 2010, through successful policies such as the privileged 47 http://aoa.ew.eea.europa.eu/virtual-library-viewer/answer_8565329228
48 The countries targeted are more precisely Bulgaria, Croatia, the Czech Republic, Estonia, Hungary, Latvia, Lithuania, Poland, the Russian Federation, Slovakia, Slovenia, and Ukraine.
49 Source : http://ji.unfccc.int/index.html
50 A recent study commissioned by the German Federal Ministry for the Environment, Natural Conservation and Nuclear Safety (2011) concludes that if climate targets were raised from 20% to 30%, up to 6 million new jobs would be created throughout Europe.

69
grid access for renewables, attractive remunerations and feed-in tariffs, the share of the renewable energy sector in the Spanish electricity production mix (including hydro energy) grew to 32.6% (from 20.7% in 2008) and the sector employs 109,368 people today. In Germany this sector grew from 11.6% in 2005 to 18.8% in 2010 of the total electricity produced and employed 367,400 people.
The pace of green jobs creation in Germany is promising for employment in RES throughout the region: 160,000 people were working in the sector in 2004 and this number increased to 370,000 in 2010. Making an estimate of a linear relation between employment and installed capacity (23.7 GW in 2004 and 55.2 GW in 2010), we can assume a rate of 6660 jobs per GW installed.
Although the shares of renewables in the energy mix are quite high in Romania, Turkey and Uzbekistan, Eastern European and CIS countries have not yet fully explored their renewable potential, as we can see in the following table (Enerdata, 2010):
Table 5.3: Renewables in electricity consumption mix
Renewables in electricity consumption mix in% 1990 2000 2005 2010
Renewables in electricity consumption mix in % 1990 2000 2005 2010
Czech Republic 2.3 4.1 4.6 7.6
Kazakhstan 8.4 14.7 11.6 11.4
Poland 2.6 3.2 3.7 7.6
Romania 17.7 28.5 34 34.1
The Russian Federation 15.3 19.1 18.6 15.1
Turkey 40.4 25 24.6 26.2
Ukraine 3.6 6.7 6.7 6
Uzbekistan 11.8 12.5 17.5 22.4
The opportunity for employment is high if we consider estimates for technical potential for the development of renewable energy. Following the EBRD report on renewable energy resource assessment of the region of 2003, the countries with transition economies could cumulate a total potential of 315 GW of renewable (excluding PV) installed capacity by 2020 (Hydro: 172 GW, Wind: 108 GW, Biomass: 34 GW, Geothermal: 1 GW). Using the German example, there is a potential for the creation of 2.1 million green jobs.
However, the feed-in-tariff policies explored in Western Europe, in particular in Spain and Germany typically entail a rise in electricity taxes. In the case of Germany, the Renewable Energy Sources Act (Erneuerbare-Energien-Gesetz, EEG), caused an increase to 35€/MWh in 2011, accounting for nearly 30% of an average SME manufacturing site electricity invoice. These high taxes clearly represent challenges for energy intensive economies with rapid growth targets such as EECCA countries. Good results in the wind sector - largely unexploited so far, should be emphasized: the Czech Republic increased the wind power sector by 150% in 2008, Poland’s wind capacity augmented by 71% in 2008, and Bulgaria foresees an increase in wind capacity from 16.5 MW in 2009 to 220MW in 2012 (European Commission, 2009).
The example in the box below from the Navarre region in Spain also demonstrates the potential job creation, even during a severe economic downturn, of the renewable energy sector, particularly when it is adapted to the local context and is implemented using an integrated policy mix approach.
Box 5.1: Green restructuring in Navarre: A successful shift to renewable energies
In the 1980s and 1990s, the Spanish region of Navarre suffered from a severe economic downturn when high oil prices impaired the competitiveness of its single large industrial employer, a Volkswagen car plant. Unemployment soared to a peak of 13 per cent in 1993. The regional government responded with active industrial policy measures, including worker retraining, to expand the renewable energy sector. A rapid and successful development of the wind power industry followed, facilitated by the favourable geographical and climatic conditions of the region alongside a clear corporate and public strategy. The region expanded the share of its electricity production derived from renewable sources to 65 per cent, with an eventual target of 100 per cent. This small region of Spain, with a population of just 620,000, is now Europe’s sixth largest producer of wind power.
From 2002 onwards Navarre has been implementing its Environmental Training Plan. In cooperation

70
with the Confederation of Entrepreneurs of Navarre and the Navarre Industry Association, the regional government identified the main skills shortages in the region through a project entitled “Strategic talent in the renewable energy sector”, and on the basis of its findings set up CENIFER, a public training centre for renewable energies, which became a major training provider for the sector. In 2006, the country’s first graduate programme for electrical engineers in wind and solar electricity was launched at the Public University of Navarre.
Between 2002 and 2006, employment in renewable energies across Navarre increased by 183 per cent. In 2007 alone, 100 companies and over 6,000 jobs in renewable energies were created. Unemployment dropped to 4.76 per cent. Even in the economic and employment downturn of 2009 Navarre maintained the lowest unemployment levels in Spain. This achievement bears witness to the success of a policy mix which incorporated environmental and skills measures in a proactive response to an economic crisis with a view to long-term dynamic development (ILO, 2011).
Employment in agriculture
Agriculture, forestry and fisheries are very climate-sensitive production activities. Around 2 million people were full time, and 4 million temporarily employed in agriculture and forestry in rural areas in the European Union in 200751. If we consider the SEE and EECCA countries the number of employees in the agricultural sector reaches 25 million (UNECE statistics). Conventional agriculture produces high level of CO2 emissions, degrades land and depletes natural capital. In the process of climate change, water shortages and extreme weather events will have tremendous impacts on the labour market in those countries. Organic agriculture could play an important role in the green economy transition by improving the farm sector and creating employment that provides better returns on per unit of labour input all along the value chain (UNEP, 2011). To this end many countries have adopted growth targets for the sector (e.g. in Austria by 20% by 2010, in Bulgaria by 8% by 2013), have set organic certifications (Organic Standard Ltd in Ukraine) and started regional initiatives and standards (Green Caucasus). As detailed in the box below, organic farming in Moldova is a growing sector with huge potential to contribute to greening the economy and promoting sustainable development more generally.
Box 5.2: Organic agriculture in Moldova
Soils are the main natural resource of Moldova. Half of the people live in rural areas, and employment in the agricultural sector reaches 40% in the country. Moldova is the country in the EECCA region with the most developed organic sector, both commercially and in terms of policy and government involvement. Developing organic farming could create numerous green jobs in the sector, as the employment opportunities can increase between 10% and 30% as a result of conversion from traditional to organic agriculture, depending on farm size and crop (UNEP/UNCTAD, 2010).
The regulatory framework for organic farming was set in 2005 with the approval of the Law on Organic Agri-food Production and a series of government regulations and action plans on organic food production, marketing methods, inspection and certification systems, and import and export rules. The Agricultural and Food Sector Development Strategy (2006-2015) set the ambitious target of doubling Moldovan organic production and tripling certified farmed areas by 2015. Since 2005, approximately 11,000 ha (including 5,000 ha of vineyards) have been certified as organic nationwide. Moldova exported around 32,000 tons of organic produce, from 211 producers, at a value of US$48 million in 2009, representing 11 per cent of its total agricultural exports. (WB, 2007; UNEP, 2011b)
Employment in the construction of energy efficient buildings
While conventional buildings are responsible for around 30% of CO2 emissions, waste generation and use of all primary energy (40-50% of all energy in the EU, 33% in EECA), energy-efficient buildings would significantly reduce emissions and have positive a effect on both economic growth and employment (UNEP, 2008). Studies linking employment and energy efficiency estimate that between 40 and 100 new jobs could be created per petajoule of primary energy saved (OECD, 2003). Moreover the jobs created would encompass positions such as green building architects and designers, auditors, engineers, estimators, project managers, pipe fitters, sheet metal workers, HVAC (heating, ventilating and air-conditioning) technicians, electricians, and general construction workers. Measures encompassing green buildings, retrofitting or energy-efficient building components lead to direct, indirect and induced jobs. Many initiatives towards better efficiency in buildings at the country level have been implemented, such as the formation of
51 Source : www.agri-info.eu/english/t_employment.php

71
green building councils (Germany, Romania), energy-efficiency standards (e.g. Passivhaus in Germany and UK, “Haute Qualité Environnementale” in France, Minergie in Switzerland), and retrofitting programmes (e.g. German Alliance for Work and the Environment’s Initiative to Retrofit German Homes). The German Alliance for Work and the Environment’s retrofitting programme launched in 2001 has created around 140,000 new jobs and reduced annual CO2 emissions from buildings by about 2%. It is one of the important strategies adopted by Germany in order to reduce emissions by 40% in the period from 1990 to 2020.
An interesting initiative by the Global Environment Facility (GEF) and UNDP called “Projects on Promoting Energy Efficiency in the Construction Sectors of Armenia, Kazakhstan, Kyrgyzstan, Turkmenistan and Uzbekistan” was launched in 2008-09, with an overall objective to reduce energy consumption and GHG emissions in construction sectors by 30-40% against the present level. Despite numerous ambitious initiatives, the implementation of the energy-efficiency measures mentioned above remains limited because their costs are often overestimated. As we can see in the example in the box below from Hungary though, the number of green jobs created, along with the associated social and environmental benefits, outweighs initial costs.
Box 5.3: Employment Impacts of a Large-Scale Deep Building Energy Retrofit Programme in Hungary
In Hungary buildings are key in the response to the climate challenge since they are responsible for approximately half of energy-related CO2 emissions and have the highest cost-effective climate change mitigation potentials in Hungary. If their efficiency was improved, it would reduce up to 85% of the Hungarian heating energy use and the corresponding CO2 emissions, but also advance energy security, social welfare, reduce fuel poverty, create new business opportunities, as well as improve air and life quality, and health.
The annual net employment benefit would reach 131,000 jobs by 2020, including the losses in the energy supply sector. Up to 38% of the employment gains are due to the indirect effects on other sectors that supply the construction industry and the induced effects from the increased spending power of higher employment levels. In addition, the length of the programme would ensure that the jobs created are long-term, and the fact that the whole building stock is considered for renovation implies that the new jobs are likely to be distributed throughout the country as renovations are usually carried out by local small and medium enterprises.
(Centre for Climate Change and Sustainable Energy Policy, 2010)
Employment in transport
Transportation is responsible for around 20% of GHG emissions, and the reliance on cars, trucks and airplanes for private and freight movement is growing in the pan-European region. Direct and indirect employment in transport sector in the EU, mainly in road transport, accounts for around 15 million jobs (including 900,000 public transport jobs), which represent more than 7% of total employment (ETUC, 2007). There are significant differences between EECCA countries and Western Europe: i) freight transport is in major part performed by rail (80% in EECCA countries versus less than 15% in the EU), ii) the use and ownership of private cars has increased but it still remains small compared to Western Europe (below 180 cars per thousand of the population versus 400-600 in Western Europe), iii) although public transport developed considerably between 1970-1990 in EECCA countries, the lack of funding limited the recovery from the decline experienced between 1990-2000 (EEA/UNEP, 2007).
Despite differences, a broad range of measures can be implemented throughout the region in order to improve energy efficiency. Alternative fuels, a shift in transportation models, car-sharing programs, development of hybrids car, development of fuel-efficient engines, or materials incorporated in today’s vehicles are part of a broad array of measures that will have different employment outcomes. In Spain, direct and indirect jobs in sustainable transport (public transport in all its modalities and car-sharing, bicycle users, pedestrians) were estimated to amount to 297,109 in 2008. The projections for 2020 according to different scenarios will lead to the creation of between 307,114 (basic scenario, no additional measures from 2008 adopted) and 429,370 jobs (energy efficiency scenario). The second scenario supported by public policies (promotion, fiscal measures, taxes, etc.) would thus create 39% more green jobs and decrease energy consumption in transport by 13% (ISTAS, 2011).
72
Shifts in transportation modes will result in fewer jobs in car manufacturing yet represent a great potential for job creation in the manufacturing of public transport and required infrastructure, as well as the planning and maintaining of this infrastructure. The multiplier effect of public transportation investments ranges from 2 to 2.5 (ETUC, 2007).
Employment in the recycling and waste sector
Waste has a real impact on the environment and recycling proves to be an efficient tool in energy consumption reduction, as well as for the improvement of the overall quality of life (cleaner air, water etc). Recycling modes differ considerably between countries. Regulations, sorting mechanisms, material recovery, processing or separation are differences that make it difficult to assess the number of employees in the pan-European region. According to a study performed by Ernst and Young in 2006, current employment in the waste management and recycling sector amounts to 1.8 million in the EU27. It is however difficult to estimate the number of employees for the whole region because informal employment is widespread in this sector in EECCA and SEE countries. Total per capita waste generation in these sub-regions was higher than in the EU (14 tonnes and 4 tonnes respectively in 2007 according to an EEA/UNEP report). Hazardous waste represents an important part of total waste generated (12-18%). Moreover, only a small part of the landfills are equipped with gas collection system (EEA/UNEP, 2007). The informal waste sector is a global phenomenon and in Central and Eastern Europe there is a growing informal recycling sector. These workers are often found amongst minorities and especially in the Roma communities. The TransWaste programme (2009-2012), co-financed by the European Regional Development Fund, is being implemented throughout the Danube region. The project seeks to formalize the informal waste collection in the region and evaluate the real amount and the environmental effects of waste within the informal waste collection sector.
In cases where waste pickers were organized, and were able to transfer from the informal to the formal economy, contributing to the waste management system of both cities and enterprises, they were able to (i) improve their working conditions, including health and safety at work, (ii) triple their incomes (or more) (iii) promote gender equity, empowering both women and men and giving them a voice in the decision making and policy implementation, and (iv) reduce the risk of child labour and promote sustainable livelihoods for adults.
The example from Serbia below also demonstrates that focusing on social concerns, particularly in line with the ILO’s decent work agenda, has a positive effect on the labour market, particularly through improved working conditions, quite apart from the obvious environmental gains.
Box 5.4: Waste pickers in Serbia
During the past few years Serbia accelerated the pace of reforms in addressing its environmental issues. In 2009 modern environmental laws introduced obligations, for the first time, for major waste producers and companies in different sectors to dispose of waste through a system of collection and recycling. Recyclable waste (aluminium cans, PET, cooking oil, paper, etc.) has to be disposed by certified collection and recycling companies, which in turn issue the certificates confirming that the waste was properly collected and recycled. In the past 18 months the process of mapping and certification of recyclers of various kinds of waste has been carried out by the Ministry of Environment, resulting in certification of a number of recyclers and collectors and creating the basic preconditions for the implementation of the 2009 environmental legislation.
Another positive development has been the creation of the first trade union of collectors of secondary raw materials, almost entirely composed of the members of the Roma ethnic community, which represents the basic step in the transformation of what used to be an informal sector into a sector that generates decent employment. This trade union has some 6,000 members who still work as unregistered or “invisible” labour, but its determination to build up its capacities and actively engage in social dialogue in this branch is beyond doubt.
In parallel, a number of newly established recycling companies albeit still at the stage of “infant industry”, represent a considerable potential for decent employment, as well as for establishment of an entire sector of new employers with potential to join the existing employers’ organizations and thus reinforce their relevance and their overall position in tripartite social dialogue.
Source of information: Serbia ILO office

73
Employment in industry
The industry sector is very energy-intensive, and accounts for 37% of energy use throughout the world. The pan-European region has been an important actor in industries producing basic materials (iron, steel, chemicals, cement, aluminium, pulp and paper). In EECCA and SEE countries, the industry sector and more specifically extractive industry, metallurgy and food production accounted for 20% to 45% of GDP in 2007 (UNEP, 2007). The serious environmental impact of such industries can lead towards their reduction that will imply job losses. Making those industries greener can limit this tendency and create a number of jobs in R&D.
The high coal consumption used in steel processing is very polluting. The top steel producers in the region are the Russian Federation (72 million tons of output in 2007) and Germany (49 million tons in 2007). Employment in the sector decreased significantly over the last 30 years. In the EU has it shrunk by around 70% from 1974 (996,000 employees) to 2000 (278,000 employees), and it is predicted to further decrease by 80,000-120,000 jobs in the coming 20 years because of gains in labour productivity, international competition and rising input costs that reduce the industry’s profitability. Additional climate targets could accelerate this trend. Greening the steelmaking process, modernizing technologies (especially in CIS countries), and developing R&D are all strategies that could save jobs in the industry (EEA/UNEP, 2007).
Extractive industries (coal, oil, natural gas, etc.) are of great importance in the CIS countries. In terms of coal, major deposits in the pan-European region can be found in the Russian Federation, Germany, Poland, Czech Republic, Ukraine and Kazakhstan. All of them - except Ukraine - are ranked among the top ten coal producers (brown and/or hard coal) by the World Coal Association (2011). The level of employment in mining and quarrying in 2008 was 56,000 in the Czech Republic, 109,000 in Germany, 200,000 in Kazakhstan, 248,000 in Poland (2007 statistics), 1,350,000 in the Russian Federation, and 618,000 in Ukraine (2000 statistics). The trend in employment in the sector is declining in Germany and Czech Republic, increasing in the Russian Federation and Kazakhstan and stagnating in Poland (Laborsta). In the long-term however the decreasing tendency will probably be more widespread because of the adoption of regional emission targets. In CIS countries attention should be drawn to modernizing current infrastructures, developing environmental management policies and improving working conditions. The example below from Poland demonstrates how social policies can minimise the adverse effects of a transition to a green economy.
Box 5.5: Restructuring Poland’s coal mining industry: the role of social protection measures
Poland is one of only a few countries in the world with a coal-based energy economy. Hard coal and lignite provide more than 55 per cent of Poland’s primary energy supply, and 95 per cent of its electricity is generated from coal. During the early 1990s, the coal sector started to experience the challenges of Poland’s economic transition. Starting from a situation of over-employment, low productivity and poor economic conditions, the industry required immediate restructuring. A programme endorsed by the Solidarity trade union and backed by substantial public funds was implemented. While the main objectives were to close inefficient mines and reduce employment, a number of social measures were undertaken to mitigate the impact of the reduction in employment on dismissed workers’ income or welfare. There were two groups of programs. The first was intended to redeploy younger coal workers elsewhere in the economy. The second provided welfare benefits to dismissed workers while they looked for a new job. Under the social program of 1998–2002, more than 53 000 workers left coal mining, of which 33’000 received some form of support.
(Suwala, 2010)
Policy Recommendations
The transition to a green economy should be implemented without further delay, and the underlying economic, environmental and social components of such a shift should be carefully considered. It will involve new policies, innovative investment, different business schemes, as well as technical innovations, and result in the creation of new green jobs, the greening of existing jobs, but also job losses. As we have seen, sectors such as energy-intensive industries, extractive industries and transport will be particularly exposed to the decrease in employment. Therefore a green transition should be a fair and just transition. The most vulnerable workers, communities, regions and industries in the process should be assisted, while the costs and benefits should be shared widely across all levels of society. There

74
are a number of concrete steps that need to be considered in order to insure a economically smooth and socially just transition.
1) Research and information
There is only limited information about the impact of a green transition on employment. Governments must assess such a transition pragmatically and disregard the myths that there is an ‘either/or’ choice between economic growth and environmental protection - and that green jobs are always costly. As there is no one-size-fits-all solution, an in-depth analysis of regional opportunities, identification of leverage points and an assessment of impacts on the labour market (conditions and levels of employment, skills required, job equity and regional impact) is a prerequisite for an effective move towards a green economy (Seed Initiative, 2011). Good examples of outcomes of such research are the “Employment in Europe 2009” report of the European Commission, and the “Renewably employed, Short and long-term impacts of the expansion of renewable energy of the German labour market” report (2011) of the Federal Ministry for the Environment, Nature Conservation and Nuclear Safety of Germany.
2) Strengthening labour market governance
In order to maximize the social benefits of a transition to a green economy and ensure that green economy policies promote poverty reduction, social cohesion and inclusive development, employment and labour policies should be designed and implemented in a coherent way with green economy policies. Workers’ and employers’ associations should be actively engaged in these policies. A number of measures are fundamental to strengthening labour market governance within the local, national and supranational arenas. First, at a societal level, social partners should be actively involved in the design and implementation of green job policies (see Policy Recommendation 4). This can also be done in partnership with civil society organisations active in the area environmental policy. Second, at a government level, tripartite inter-ministerial committees and consultative multipartite bodies constitute valuable forums whose use should be promoted within the region. For instance, the Social Dialogue Tables Initiative conducted in Spain since 2006 constitutes a valuable mechanism for trade unions and employers' organizations, together with industry, environment and labour institutions to collectively assess the effects on the competitiveness, employment and social cohesion of the Kyoto Protocol in Spain. Finally, at a more structural level, greater emphasis should be placed on streamlining green job considerations throughout national labour institutions (public employment services, vocational training institutes, programmes to promote and enable a business environment for green jobs).
3) Ensuring a Just Transition
The road to a green economy will have a significant impact on the labour market. This change will impose an unequal burden on countries, economic sectors, as well as workers and employers. This fact must be recognized and planned in order to provide opportunities for the most affected. A green economy should place the social component at its very core, and the five principles (impact assessments, social dialogue, green jobs and sustainable enterprises promotion, training and skills development, social protection) of a just transition should be carefully considered. On a practical level, this could be done through the creation of a body (or bodies), which would plan the transition and advise on its implementation, or the realization of mechanisms for regular consultation of regional groups or companies involved (ETUC, 2008). Good initiatives in this respect are demonstrated in Spain, where trade unions (CC.OO, UGT) have signed an agreement with the government to promote a sustainable industrial structure. This step enables trade unions to engage in environmental participative bodies and grants workers the possibility to take part in the implementation process of environmental regulations (TUC, 2008b).
4) Fostering social dialogue and industrial relations
Social dialogue has a key role to play in creating consensus and establishing coordinated strategies that will be crucial to seize the opportunities and minimize the potential social costs of a transition towards a green economy. Three functions are of particular significance in this regard (European Commission, 2009b). First, trade unions and employers’ organizations can contribute to national debates by pressing for a just transition that includes the respect of workers’ rights, dialogue, skills adaptation and investment in green job creation and infrastructure. Another promising avenue for social partners’ involvement relates to their participation in multipartite bodies (i.e. Sustainable Development Councils, Environmental Councils, or advisory bodies of governments or parliaments), which have been put in place in half of all EU Member States. Second, social partners may push for better regulation of employment relations through binding agreements and softer guidelines. Third, trade unions and employers have a key role to play in the implementation of green policies and practices. Three types of activity are notable in this regard, i) training and counselling on issues such as energy and resource efficiency, pollution prevention, new green technologies and green skills, ii) awareness raising, including conferences and workshops, publishing brochures and leaflets or creating

75
websites, and iii) other promotional activities, where social partners promote research on environmental issues. A good example is the Climate Change Task Force established by the Confederation of British Industry (CBI) involved in making concrete recommendations on how to improve the supply of STEM (science, technology, engineering and mathematics) skills (Brougton, 2009). More broadly, in order to ensure a strong role of social partners in this transition process, emphasis should be placed on establishing representative trade unions and employers’ organizations and improving national legal frameworks and procedures in line with the ILO’s fundamental conventions on freedom of association and the right to collective bargaining.
5) Developing the necessary skills
The transition to a green economy will be successful only if appropriate structural change and the transformation of existing jobs is achieved. Skills development is one of the keys to unlocking this job potential. The timely supply of relevant and quality skills is indispensable for successful transformations that boost productivity, employment growth and development.
The transformation brought by greening economies (jobs creation, losses, transformation or substitution) affects skill needs in several ways. Preparation for new occupations, or for growth in demand for some occupations at the expense of others, is particularly important in preparing young men and women for entering the labour market. Workers already in the labour market, midway through their careers or older, will need access to retraining to enable them, and enterprises, not only to move from declining industries and occupations into growing ones, but also to keep their skills up to date with, for example, new technologies (ILO, 2011).
6) Establishing social protection
Adequate policies targeting the unemployed and the most vulnerable should be developed in order to guarantee that the green transition is also a fair transition. Strategies aimed at minimizing job losses and establishing flexible transition packages for workers who have lost their jobs should be elaborated. A range of measures to this end are available: social insurance, public employment guarantee schemes, job placement services and job-creating public programmes for the un- or underemployed. Moreover, specific programmes should be elaborated in communities or regions at risk (ILO, 2010b). The EU project “From Restructuring to Employment” in Romania developed by local companies and supported by the European Social Fund supports people who have been laid-off from the energy sector serves as a good example of such policies.
7) Greening of workplaces
The environmental impact of workplaces is also an area where improvements can be made. Workplaces consume energy, use resources, generate travel and waste, and are thus an obvious place where greening can be achieved. The list of issues that need to be considered is long and includes savings in workplace heating, cooling, ventilation and insulation, lighting and electrical equipment, increased use of renewable energy, carbon offsetting, reduced work-related transport, reduction and recycling of waste and materials, and saving of water. More broadly, the greening of workplaces can also encompass environmental considerations in relation to finance and investment, as well as procurement and supply chain policies. The Eco-Management and Audit Scheme (EMAS) set up in the EU in 1995 with a view to reducing companies’ environmental impact, and as a management tool for business and institutions to evaluate, report and improve their environmental performance is a good example in this area.
C. The health dimension of the transition to a green economy
Health is recognized as a key goal of sustainable development by the Rio Declaration on Environment and Development (United Nations 1992b): “Human beings are at the centre of concerns for sustainable development. They are entitled to a healthy and productive life in harmony with nature”. Understood in a broader sense – as “a state of complete physical, mental, and social well-being and not merely the absence of disease or infirmity” (WHO, 1948) – however, health is an essential result of as well as an essential pillar of sustainable development. Health is both a global and national public good.
The WHO European Region has witnessed strong economic growth and significant progress in health, including reduced child mortality, increased life expectancy and progress towards attaining a number of the Millennium Development Goals (MDGs). Nevertheless, these positive trends have been accompanied by increasing disparities and inequalities, health inequity, deterioration of the environment, climate change and recurrent economic, financial, energy and food crises (World Economic Forum, 2011). Sustainability thus requires a stronger balance between health, financial, economic and environmental development to ensure that future generations do not suffer because of the way people live today (NHS, 2010). In terms of health, this means seeking further investment, greater equity and a
76
responsible use of resources, to protect the next generation from, for example, obesity, noncommunicable diseases or reduced life expectancy.
Chapter 6, on protecting and promoting human health, of Agenda 21, the global plan of action agreed at the United Nations Conference on Environment and Development in 1992 (United Nations, 1992a), supported an intersectoral approach and identified five programme areas: meeting primary health care needs, control of communicable diseases, protection of vulnerable groups, meeting the urban health challenge and reducing health risks from environmental pollution and hazards. While these areas remain relevant today, a reinvigorated focus on public health and health equity is required. At the United Nations Conference on Sustainable Development (Rio+20), renewed commitment and urgent action are therefore needed to lay a firm foundation for a longer-term process of redressing imbalances, agreeing on priorities and reforming institutional arrangements at all levels, to bring about coherent and integrated policies across the economic, environmental and social pillars, with human beings and their well-being at the centre. The Conference must also address the means of implementing outcomes through the provision of resources, including for technological transformation and capacity building.
A healthy, green economy could present an opportunity to increase the quality of life, well-being and health equity. Taking advantage of this opportunity requires a full understanding of the possible implications of developments in different economic sectors for health and health equity, and support for green developments that maximize the benefits for health. This in turn requires a whole-of-government approach to health and equity, to change the norms of societies, strengthen their relationship to the natural environment and increase their commitment to health and well-being. Tools such as regulations, incentives, accountability, participation and knowledge sharing across all strata of society need to be enabled, promoted or developed at different levels in the European Region
Progress, threats and opportunities in the transition to green prosperity
The significant improvements in population health over the last 20 years – particularly increased life expectancy at birth and reduced child mortality – have contributed to economic, social and environmental development (WHO, 2001, 2002a) and thus to greater prosperity (Fig. 5.1).
.

77
Figure 5.1: Life expectancy at birth in the European Region, including countries in the European Union (EU) and Commonwealth of Independent States (CIS)
Source: WHO Regional Office for Europe (2011b).
A number of factors, however, will influence the way people will live, work, grow and age in future years. This includes demographic shifts, noncommunicable diseases and emerging or re-emerging communicable diseases, inequities, environmental changes, persistent environment pollution , urbanization and external health costs of productive sectors.
Demographic shifts The unprecedented longevity of people in the European Region represents not only a success in advancing human health but also large health and economic challenges, due to the high costs of health, social care and welfare systems and the societal loss due to increased disability and morbidity. Today, the percentage of the population aged over 65 years is around 18% in EU countries and 12% in the rest of the Region, and is expected to reach around 25% in the EU by 2030. The share of the Region’s population aged over 80 years is expected to more than double by 2050, leading to significantly increased demand for long-term care.
This demographic shift is accompanied by changing social patterns – such as smaller families, different housing patterns and increased labour-force participation by women – that help to increase the need for paid care and different spatial, social, health and environmental conditions and services. Thus, accurate projections of population ageing and morbidity are needed to determine future planning challenges. Nevertheless, increased longevity should not be seen as a threat to growth or an increased burden on societies and economies. Healthy ageing enables people to live longer productive lives and contribute economically to society much longer than before.
The ageing of the population in Europe, combined with decreasing fertility rate, is resulting in significant reductions in the population size of many European countries. At the same time, the global growth of the population, driven by growth in the poorest and developing countries, increases the pressure for greater mobility and the overall pressure on resources (food, water, minerals, and energy), which are unequally distributed. In this respect, sustainable development has to include the fulfilment of people’s sexual and reproductive rights, which were formulated on the global level in the late 20th century, and address other dimensions of social, gender and economic inequalities in the Region and globally.
It is important to note, that demographically, Eastern Europe and Central Asia are facing the combination of population decrease but also significant emigration. For instance, most countries in South East Europe (including

78
Albania, the Former Yugoslav Republic of Macedonia, and Serbia) had positive natural demographic increase between 2000-2005, which later on was lost through emigration. Eastern European countries (e.g. Bulgaria, Romania, Ukraine, and Moldova) are facing both, decreasing fertility rates and emigration. In other countries, e.g. Russia, the natural decrease in population is partially offset by net immigration.
Disease
Noncommunicable diseases (NCDs) produce the largest share of the health burden (overall morbidity, disability, mortality and premature death) in the Region, as a result of demographic factors, the difficulty of addressing the most important risk factors (such as tobacco, alcohol, diet and physical activity) and their social determinants (such as poverty, social exclusion and inequity) and environmental factors (such as urbanization, pollution, insufficient availability of and access to safe food and water, inappropriate use and management of natural resources and unhealthy living and work environments). Mortality from cardiovascular diseases (CVD) accounts for nearly 50% of all deaths; cancer, for 20% and injuries and violence, for 8%; all show a sharp gradient between western and eastern countries, and between social classes. The annual costs of CVD are estimated to be €168 billion per annum in the 25 countries belonging to the EU before 2007 (EU-25) (WHO Regional Office for Europe, 2011a). Reducing the burden of NCDs is key to further improving health and the quality of life.
Emerging and re-emerging communicable diseases also remain a priority in many countries in the Region. Socioeconomic, environmental and behavioural factors, as well as climate change and international travel and migration, increase their spread. They may sometimes threaten international health security. An increase in climate-related extreme events, slow-onset events (such as droughts) and acute disease outbreaks threatens travel, trade and economic growth.
Inequities The social determinants of health arise from the conditions in which people are born, grow, live, work and age. These circumstances are shaped by the distribution of income, power and resources at global, national and local levels. Health outcomes vary both between and within countries in the WHO European Region, according to such social factors as income, education, social position, social networks and employment (Commission on Social Determinants of Health, 2008). For example, male life expectancy is 20 years less in the Russian Federation than in Iceland; maternal mortality ranges from 70 per 100 000 live births in Kyrgyzstan to less than 5 per 100 000 in other countries in the Region. There are health inequities within all countries in the region; for example, life expectancy at age 30 in Norway in 2001, was around 5 years greater for men with university education than for those with lower secondary education (Jakab & Marmot, 2011). Mackenbach. Meerding & Kunst (2007) estimated that, in EU countries alone, the persistence of existing health inequities has annual costs equivalent to15% of social security expenditure, 20% of health systems costs and costs from lost health (considered as a capital good’ equivalent to €141 billion. Reducing these inequities52 is therefore key, given the ample evidence that it both contributes to sustainability and improves human development overall.
Many European countries have achieved universal health coverage, providing reasonable levels of financial protection and access to services for the whole population, but out-of-pocket health expenditures place a catastrophic burden on the household budgets of 18.6 million people and have impoverished 6.5 million. Medicines account for a substantial part of health care costs: 10–20% in EU countries and up to 40% in eastern European countries. Health financing arrangements contribute directly to social solidarity and equity, and indirectly to health outcomes (WHO Regional Office for Europe, 2011c).
Environmental changes Anthropogenic climate change has probably accounted for more than 200 000 premature deaths globally per annum since 2005. In Europe, it helps to increase deaths, disease and injuries from extreme weather events, change the spatial distribution and spread of communicable diseases (particularly water-, food- and vector-borne diseases), increase the frequency of cardio-respiratory diseases due to changes in air pollution, reduce food security and increase malnutrition (Confalonieri et al., 2007; Menne et al, 2009). Populations directly depending on agriculture productivity, children and elderly people in cities are particularly at risk. A changing climate not only increases the frequency and intensity of
52 Health inequities are defined as avoidable and unjust systematic differences in health status between
different groups (Whitehead M, Dahlgren G. (2007))

79
natural disasters but in the longer term threatens the fundamental requirements for health: clean air, safe drinking-water, a secure food supply and adequate nutrition and shelter.
Urbanization More than 70% of the population in the EU and over 60% of that in eastern Europe live in urban areas. Particular attention is needed to this type of human habitat, which is characterized by high levels of air pollution and environmental noise. For example, environmental noise causes the loss of 2–3 million (DALYs), through risks for ischemic heart diseases, cognitive impairment of children, sleep disturbance, tinnitus and annoyance (WHO Regional Office for Europe, 2010b).
Persistent environmental pollution The environmental burden of disease from persisting environmental risk factors and pollutants has been estimated to be 15–20% of total deaths and 10–20% of disability-adjusted life-years lost (DALYs) lost, with a relatively higher burden in the eastern part of the Region. Norms, regulations, standards and guidance are available on pollutants of water and air, but they are not necessarily implemented across and within all countries: For example, air pollution with particulate matter (PM) causes cardiovascular and respiratory morbidity, resulting in a reduction of almost nine months in life expectancy in Europe. PM exposure is estimated to account for 348 000 premature deaths in the EU-25 annually. In most cities in Europe, exposure to fine PM constitutes more than 70% of all PM exposure. The implementation of new EU legislation on the emission of air pollutants is expected to reduce adverse health effects of PM exposure by a third. Implementing all currently feasible emission-reduction measures would reduce health effects of PM by about 50% (WHO Regional Office for Europe, 2011d).
External health costs of productive sectors Some of productive sectors have substantial external health costs. For example, transport provides employment for more than 16 million people in the EU alone and directly contributes 11% of its GDP, but its external costs are estimated at about 8% of GDP. Most of these external costs are health related, through road traffic injuries, air pollution, noise and reduced opportunities for physical activity. For example, road traffic crashes cause about 120 000 deaths, and 2 500 000 injuries per year in the European Region; tens of thousands of premature deaths are attributable to transport-related air pollutants, and more than 1 million DALYs are lost every year from traffic-related noise in the western part of Europe. In addition, reduced opportunities for cycling and walking contribute to the high level of physical inactivity in the European Region, which is associated with 1 million deaths per year (WHO Regional Office for Europe, 2011f, 2011g).
While energy is essential for health, continued use of fossil fuels contributes to the overall burden of disease, particularly through air pollution and accidents affecting workers and communities. Further, the health burden from fossil-fuel use in energy systems is expected to rise under current projections of greenhouse-gas (GHG) emissions. The transition towards green energy systems will therefore be very important to protect health and the security of energy systems (Haines et al., 2009).
Seeking health, equity and well-being in the transition towards green prosperity
Joint action on health, equity and well-being needs to be promoted in other sectors and systems and among different groups: supranational, national and local governments, civil-society organizations, the private sector and citizens. This section builds on priorities in earlier chapters and gives examples from the European Region illustrating how focusing on health and equity in a variety of productive sectors and settings is a win–win situation for society. A lack of available data, research and information impedes comparison of action across countries or subregions.
Healthy sustainable consumption The United Nations (2010) argued that, without real action to address levels of consumerism and resource use, systemic changes are hardly possible. Reducing overconsumption of energy and the consumption of some hazardous substances and promoting changes in consumption patterns would help to reduce both NCDs (such as diabetes type II and CVD) and GHG emissions in the Region.
Healthy nutrition WHO and the Food and Agriculture Organization of the United Nations (FAO) recommend the daily consumption of about 2200 kcal for women and 3000 kcal for men. In 2007, the availability of energy for human consumption was
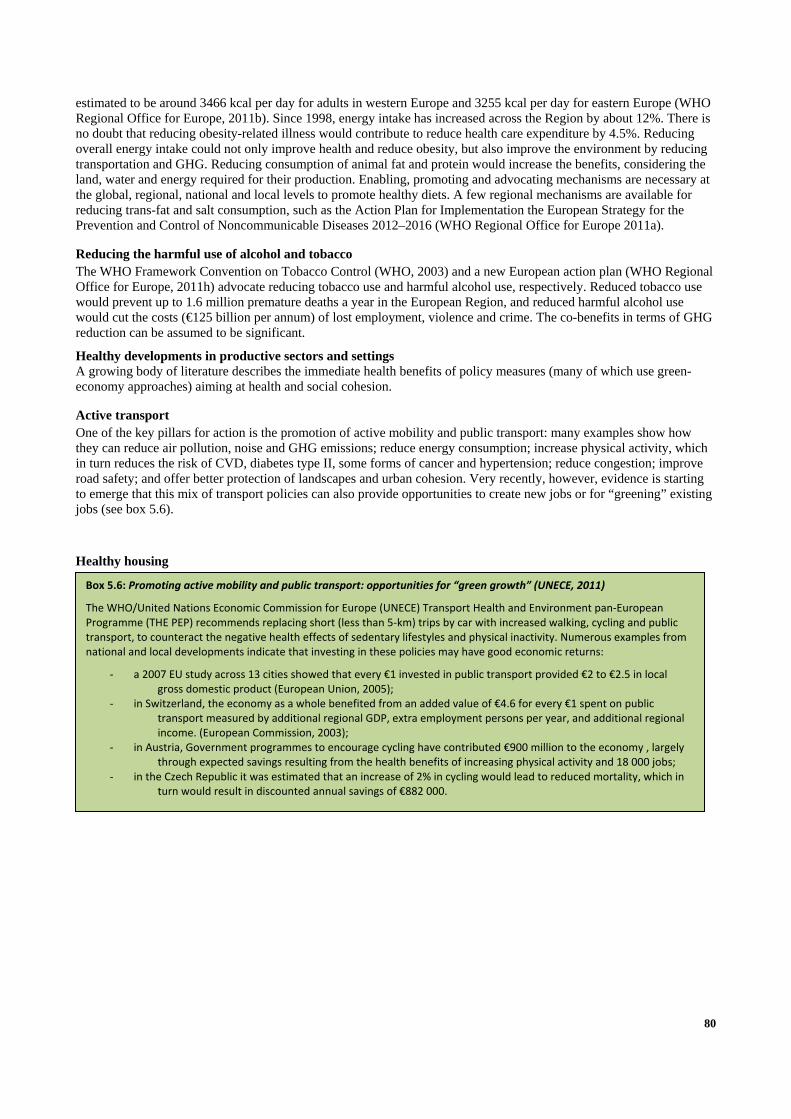
80
Box 5.6: Promoting active mobility and public transport: opportunities for “green growth” (UNECE, 2011)
The WHO/United Nations Economic Commission for Europe (UNECE) Transport Health and Environment pan‐European Programme (THE PEP) recommends replacing short (less than 5‐km) trips by car with increased walking, cycling and public transport, to counteract the negative health effects of sedentary lifestyles and physical inactivity. Numerous examples from national and local developments indicate that investing in these policies may have good economic returns:
‐ a 2007 EU study across 13 cities showed that every €1 invested in public transport provided €2 to €2.5 in local gross domestic product (European Union, 2005);
‐ in Switzerland, the economy as a whole benefited from an added value of €4.6 for every €1 spent on public transport measured by additional regional GDP, extra employment persons per year, and additional regional income. (European Commission, 2003);
‐ in Austria, Government programmes to encourage cycling have contributed €900 million to the economy , largely through expected savings resulting from the health benefits of increasing physical activity and 18 000 jobs;
‐ in the Czech Republic it was estimated that an increase of 2% in cycling would lead to reduced mortality, which in turn would result in discounted annual savings of €882 000.
estimated to be around 3466 kcal per day for adults in western Europe and 3255 kcal per day for eastern Europe (WHO Regional Office for Europe, 2011b). Since 1998, energy intake has increased across the Region by about 12%. There is no doubt that reducing obesity-related illness would contribute to reduce health care expenditure by 4.5%. Reducing overall energy intake could not only improve health and reduce obesity, but also improve the environment by reducing transportation and GHG. Reducing consumption of animal fat and protein would increase the benefits, considering the land, water and energy required for their production. Enabling, promoting and advocating mechanisms are necessary at the global, regional, national and local levels to promote healthy diets. A few regional mechanisms are available for reducing trans-fat and salt consumption, such as the Action Plan for Implementation the European Strategy for the Prevention and Control of Noncommunicable Diseases 2012–2016 (WHO Regional Office for Europe 2011a).
Reducing the harmful use of alcohol and tobacco The WHO Framework Convention on Tobacco Control (WHO, 2003) and a new European action plan (WHO Regional Office for Europe, 2011h) advocate reducing tobacco use and harmful alcohol use, respectively. Reduced tobacco use would prevent up to 1.6 million premature deaths a year in the European Region, and reduced harmful alcohol use would cut the costs (€125 billion per annum) of lost employment, violence and crime. The co-benefits in terms of GHG reduction can be assumed to be significant.
Healthy developments in productive sectors and settings A growing body of literature describes the immediate health benefits of policy measures (many of which use green-economy approaches) aiming at health and social cohesion.
Active transport One of the key pillars for action is the promotion of active mobility and public transport: many examples show how they can reduce air pollution, noise and GHG emissions; reduce energy consumption; increase physical activity, which in turn reduces the risk of CVD, diabetes type II, some forms of cancer and hypertension; reduce congestion; improve road safety; and offer better protection of landscapes and urban cohesion. Very recently, however, evidence is starting to emerge that this mix of transport policies can also provide opportunities to create new jobs or for “greening” existing jobs (see box 5.6).
Healthy housing

81
It is essential to promote measures in the housing and constructing sector that create highest health benefits. For example, when housing programmes only attempted to improve the energy efficiency of buildings, without considering indoor air quality, the health benefits were much lower than in cases where a mix of measures was used. This mix included more effective use of active and passive natural ventilation for cooling; measures to reduce mould and damp; energy-efficient home heating, appliances and cooking; provision of safe drinking-water and improved sanitation; as well as stronger building. This combination is recognized to reduce CVD, injuries, and respiratory and infectious diseases. Many countries, regions and cities are experimenting with cost-effective, healthy strategies for climate-change mitigation for housing; these should be systematically studied and evaluated for their health benefits (WHO, 2011).
Green spaces in urban areas Many measures taken at the local level produce only benefits. For example, public green spaces and forests enhance physical activity patterns, reduce the risk of injuries and the urban heat-island effect, contribute to flood management, reduce stress levels and noise pollution, and increase social interaction. Tailored approaches are required for specific groups of citizens to benefit fully from public places and networks in which to be physically active, and to be protected from threats to their safety in the urban, transport, home and leisure environments. (WHO Regional Office for Europe, 2010c)
Reducing GHG emissions in multiple sectors To prevent catastrophic climate change, global temperatures will need to rise by less than 2°oC above pre-industrial levels by 2100. Business as usual will raise temperatures by 5°oC. Even if all current pledges on carbon emissions are met, the increase will be 4.3°oC. The consequences of such global temperatures would be catastrophic (Godlee, 2011).
Action now can also achieve immediate and local health benefits. GHG reduction in housing, energy, transport, agriculture and health care can have significant health gains (such as reducing NCDs), while the benefits to health and development can be at least partly offset the varying costs of implementing such measures (see box 5.7) (IPCC, 2007). Health should be considered in international negotiations and action at the national and local levels to benefit both today’s and future generations (WHO, 2011).
On average across the WHO European Region the health sector accounts for about 5.68% of GDP in the east and 9.56% in the EU. Health care is often technologically and resource intensive, so some advances in health and population well-being can be assumed to have come at the expense of the environment. As outlined in the report of the Secretary
Box 5.7: Examples of immediate and local benefits for health of reducing GHG emissions in different sectors
Energy
In the EU, the impact assessment accompanying the European Commission Climate and Energy Package indicated that by reducing GHG emissions by 20% in 2020, sulfur dioxide, nitrogen oxides and PM2.5 emissions would be reduced by 10–15% compared to baseline emissions in 1990. It was indicated that this would improve life expectancy by 3.3 months and reduce between the health damage costs by €12–29 billion (Commission of the European Communities, 2008).
Transport
In London, United Kingdom, reducing carbon dioxide emissions by at least partly replacing trips undertaken using motor vehicles with active travel (walking and cycling) was estimated to have larger health benefits per million population than the increased use of lower‐emission motor vehicles. A combination of active travel and lower‐emission motor vehicles would deliver the largest benefits, however, notably an estimated reduction of 541 premature deaths per year (Woodcock et al., 2009).
Agriculture
In the United Kingdom, the reduction of meat consumption has been proposed as one of the measures to reduce the greenhouse‐gas emissions from livestock production. Although livestock products are a source of some essential nutrients, they provide large amounts of saturated fat. Friel at al. (2009) calculated that the potential benefits of a 30% reduction of livestock production would include a decrease by about 15% of ischaemic heart disease in the United Kingdom.
Housing
In London, United Kingdom, using a strategy of combined fabric, ventilation, fuel‐switching and behavioural changes could save 0.6 megatonnes of carbon dioxide per million population in one year and 850 DALYs (Wilkinson et al., 2009).
82
Box 5.8: The health and environmental benefits of reducing GHG in the health sector
For the WHO European Region as a whole, it is estimated that the health sector produces 287 Mt of carbon dioxide, equivalent to 4.2% of European GHG emissions. 30% arise in countries outside the EU. Appropriate measures could save 28–68 Mt each year, equivalent to about 0.6% of European GHG emissions in 49 European countries. Associated annual health benefits are estimated to include savings of 15 000–36 000 DALYS lost to air pollution, 16 000–38 000 fewer consultations for asthma and upper respiratory disease, and 1.4–3.3 million fewer days of restricted activity. In addition, money saved by many of these measures can be reinvested to improve health care (Holland & Menne, unpublished).
General (UN, 2010), “economic sectors often mentioned as candidates for their “greenness” include health, education, cultural activity [ …]. To the extent that there is scope for growth concentrated in those sectors, with a concomitant decline of growth in energy and resource intensive activities, this would introduce a fundamental change in the nature of growth”. Growing evidence indicates that becoming greener would lead to further growth in the health sector with a concomitant decline in energy- and resource-intensive activities. For example, a sustainable-development approach focusing on changes through innovation, standards and behavioural measures has been proposed for the National Health Service of the United Kingdom (NHS, 2010). Applying the same approach in 49 European countries would lead to significant reductions in GHG emissions and improvements in health (see box 5.8). Investment in low-carbon technologies will help to drive and deliver some of the transformations required for more sustainable health systems. Nevertheless, the potential and capacity for greening health service varies very much between countries, with a west–east gradient. Proper legislation, incentives to increase the institutional capacity of initial investments, provision of renewable and energy-efficient technology and raising of awareness can help to overcome the obstacles to implementation in the east.
Preparing the health sector for global environmental changes As a result of climate change, health systems and services will need to prepare for gradual changes in health outcomes, sudden extreme events (e.g. heat-waves, infectious disease outbreaks), an extra burden of disease and potential new conditions. Many of the most important actions such as controlling vector-borne disease, providing clean water and sanitation, climate proofed infrastructure require strengthening. Rapid and accurate disease notification, in compliance with the International Health Regulations (WHO, 2005) is the essential basis for planning disease control. In some countries, concerns persist about the ability of publicly funded institutions to provide even basic health services to most of the population. Their public health services will require substantial investments to address the added burden posed by climate related threats. Acute shocks such as natural disasters and disease epidemics can overload the capacities of health systems in even the most developed nations. Reinforcing disaster risk reduction, giving early warnings, and taking health action in emergencies can help to ensure that people are better protected from the increasing hazards of extreme weather and help communities recover faster following a disaster. Improving access to basic health care ensures faster treatment for patients, alleviating suffering and containing the risks of spread of disease. Greater emphasis will need to be placed on protecting the health of particularly vulnerable groups, in order to ensure that this emerging risk does not further widen the gaps in health outcomes between the most and the least privileged. (WHO Regional Office for Europe, 2010e)
Social welfare spending: pro-poor, pro-health measures Maintaining social peace, enhancing human and social capital, and raising the employment rate are important for social, health and economic sustainability. The health and social sectors are particularly vulnerable to budget cuts during times of economic downturn. The recent global financial/banking crisis illustrated the wide ranging consequences for health and social systems. Countries with sufficient reserves or the willingness to increase borrowing (deficit financing) have been able to deal with the resulting fiscal imbalance without having to take drastic measures. In those European Member States where the commitment to equity, solidarity and health was strong, governments have taken careful steps to maintain a balanced budget and avoid adverse effects on these objectives. (WHO Regional Office for Europe, 2011b) This is confirmed through research that showed how a modest increase in social welfare spending can exert a substantial protective effect. Notably, a rise in social welfare spending was associated with a sevenfold greater reduction in mortality than a rise of similar magnitude in GDP (Stuckler, Basu & McKee, 2010) (Fig. 5.2).

83
Figure 5.2: Social welfare spending has major health impact
Source: Stuckler, Basu & McKee (2010).

84
Green growth and prosperity will not necessarily be inclusive or catalyse poverty reduction unless accompanied by pro-poor and pro-health approaches integrated into a green development approach. Economic affordability is but one component of inclusive growth and equitable access. A number of economic support measures have been proposed, across a variety of sectors, to deal with access to water, food, sanitation and household energy. These range from direct financial support and technological improvements to ensuring minimum service provision for those most in need (see box 5.9).
In addition, a gender-focused and lifelong approach is very important. For example, early child development has a critical impact on overall well-being throughout life, particularly on obesity, stunting, mental health, CVD, literacy and numeracy, criminality and economic participation. The WHO Commission on Social Determinants of Health (2008) recognized investment in early childhood as having the one of the greatest potentials to reduce inequities in health. The brain development of young children is highly sensitive to the external environment and requires good nutrition, a continuum of care though pregnancy, child birth and the early days and years of life, as well as a safe, healthy, nurturing, stimulating and responsive living environment. Ensuring high-quality early-childhood programmes and services for mothers and children, regardless of ability to pay, is of paramount importance for ensuring sustainable development and improving equity in health and development.
Research, technology and knowledge sharing: understanding the health opportunities of green and inclusive growth There is relatively little information on how green development can benefit health and equity. Four areas of research are of particular importance to achieve sustainable development and to further improve health and equity:
(1) the health effects of new technologies and innovation;
(2) the health and equity benefits of green and inclusive growths policies in other sectors;
(3) the benefits for social, environment and economic development of health sector action; and
(4) small- and large-scale opportunities of green growth for health development.
The introduction of new technologies raises concerns about their health and equity benefits. For example, the risk of climate change to water management in southern and some eastern European countries will require alternative approaches to water management, such as reusing treated wastewater, using grey water, harvesting rainwater and desalinization where economically viable. In addition, concerns have emerged about the potential of nanomaterials, engineered nanoparticles in particular, to have unwanted or unexpected interactions with biological systems, resulting in potentially adverse consequences to human and ecosystem health (box 5.10).
Box 5.9: Case study United Kingdom: Warm Front
The United Kingdom has a large burden of excess winter mortality, which in part appears to be related to low indoor temperatures. In part motivated by health considerations, in 2000 the Government launched a home energy efficiency scheme in England, now known as Warm Front. This grant‐funded programme for tackling domestic fuel poverty provides packages of insulation and heating system upgrades to low‐income households.
The scheme was carried out over the 2001/2002 and 2002/2003winters. Energy‐efficiency improvements were associated with:
‐ increased living room and bedroom temperatures, often above the level that poses a risk to health; ‐ reduction in relative humidity, condensation and visible mould growth; ‐ indirect evidence of reduction in vulnerability to winter‐ and cold‐related mortality from CVD; and ‐ reduced prevalence of anxiety and depression.
Paradoxically, however, little evidence indicated that Warm Front improvements reduced fuel consumption, even though theoretical considerations suggest that there should be significant savings (Green & Gilbertson 2008; Wilkinson et al., 2007).
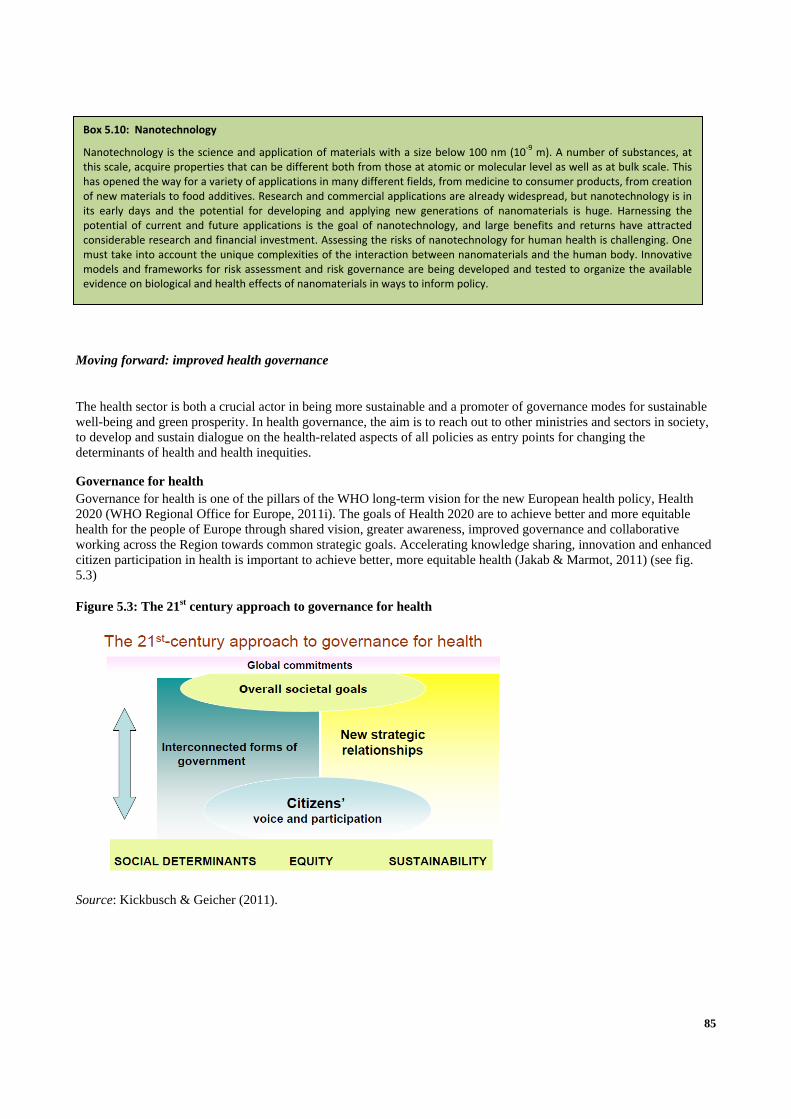
85
Moving forward: improved health governance
The health sector is both a crucial actor in being more sustainable and a promoter of governance modes for sustainable well-being and green prosperity. In health governance, the aim is to reach out to other ministries and sectors in society, to develop and sustain dialogue on the health-related aspects of all policies as entry points for changing the determinants of health and health inequities.
Governance for health Governance for health is one of the pillars of the WHO long-term vision for the new European health policy, Health 2020 (WHO Regional Office for Europe, 2011i). The goals of Health 2020 are to achieve better and more equitable health for the people of Europe through shared vision, greater awareness, improved governance and collaborative working across the Region towards common strategic goals. Accelerating knowledge sharing, innovation and enhanced citizen participation in health is important to achieve better, more equitable health (Jakab & Marmot, 2011) (see fig. 5.3)
Figure 5.3: The 21st century approach to governance for health
Source: Kickbusch & Geicher (2011).
Box 5.10: Nanotechnology
Nanotechnology is the science and application of materials with a size below 100 nm (10‐9 m). A number of substances, at
this scale, acquire properties that can be different both from those at atomic or molecular level as well as at bulk scale. This has opened the way for a variety of applications in many different fields, from medicine to consumer products, from creation of new materials to food additives. Research and commercial applications are already widespread, but nanotechnology is in its early days and the potential for developing and applying new generations of nanomaterials is huge. Harnessing the potential of current and future applications is the goal of nanotechnology, and large benefits and returns have attracted considerable research and financial investment. Assessing the risks of nanotechnology for human health is challenging. One must take into account the unique complexities of the interaction between nanomaterials and the human body. Innovative models and frameworks for risk assessment and risk governance are being developed and tested to organize the available evidence on biological and health effects of nanomaterials in ways to inform policy.

86
Box 5.11: Examples of government driven HiAP approaches (WHO Regional Office for Europe, 2011c)
Norway’s programme promotes follow‐up by incorporating a common reporting system for all ministries/sectors involved, with overall management responsibility assigned to the Directorate of Health. The Directorate published the first Norwegian public health policy report for 2009 and will be reporting annually, incorporating information from multiple sectors.
In Estonia, the national health plan (NHP) 2009–2020 gives the Ministry of Social Affairs a leading role in the coordination of inter‐sectoral collaboration. All ministries provide annual plans of health‐related actions, report on their implementation and impact and belong to the steering panel of the NHP, where overall priorities for all ministries in regard to health are set.
In Kyrgyzstan, the Ministry of Health in 2006 elaborated an intersectoral action plan for promoting population health within the framework of the national health care reform process, “Manas Taalimi”. The aim was to better coordinate actions and resources for health with other government sectors, in order to improve daily living conditions such as water supply and housing, improved health behaviours and access to primary health care services; and also to coordinate the support of United Nations agencies and international donors around common objectives for improving health at the community level.
In Slovakia, regional governments have increased autonomy in relation to social and economic decisions and investments, many of which affect health and health equity and their determinants. Regional parliaments formally adopted a health chapter into regional development plans and related investment objectives and funding flows. Cross‐sectoral and interdisciplinary planning teams were established, using regional planning cycles and mechanisms to include health equity considerations in priorities and investment plans. Goals related to the health of the most vulnerable groups (e.g. elderly persons, the Roma, rural communities, homeless or migrant populations, and the unemployed) were integrated into regional cross‐sectoral priorities and actions, backed up by resources and financial investments.
As outlined above, many policies relevant to health lie outside the remit of the health ministry, and most social, environment and economic determinants are found in other sectors. Yet ministries of health have a role in averting the (often unintentional) consequences for health of other sectors’ activities. The need for partnership with other sectors and stakeholders and new strategic relationships in society is also born from resource- and cost-efficiency measures linked to the social and economic costs of health inequities.
High-level ministerial support is important to the success of intersectoral planning for health and equity in any development, but progress towards shared goals requires technical and scientific know-how and the engagement of civil society. This requires that political, technical and scientific leadership is coordinated in a mutually reinforcing manner, seeking achievable goals, evaluating interventions, assigning clear roles and responsibilities, and putting processes in place that are designed for appropriate capacity building across societies. Further, institutional structures and accountability mechanisms need to be built or strengthened to create incentives for joint work, and ensure that public-sector action has shared targets that address priority issues.
A variety of governance tools, such as the health-in-all-policies (HiAP) approach, fosters coherence and evaluates and sustains policy coherence, collaboration and partnership. HiAP approaches are needed to support policy-makers in including the consideration of health, well-being and equity in the development, implementation and evaluation of policies, programmes and services.
WHO recently reviewed HiAP approaches, grouped into four different categories:
(1) structural: whole-of-government forms such as cabinet committees that demonstrate the high level political commitment that can be identified as a key requirement for success;
(2) process: shared planning and priority setting;
(3) financial: collaboration and alignment of financial flows in investment planning, with flows linked to statutory objectives; and
(4) decentralized systems.
Box 5.11 illustrates some of the national examples of HiAP (WHO Regional Office for Europe, 2011c).

87
Priority areas for action
There are four mutually reinforcing priority areas for action:
1. strengthen HiAP for shared governance for health and health equity, through:
clear vision, leadership and new strategic alliances at the highest government level;
strong leadership and understanding from the health sector;
a well articulated policy that includes objectives and targets for health and well-being;
a supra-departmental authority/organization to become in charge for the health and well-being aspects of HiAP;
2. regulation, incentives and enforcement mechanisms, education and awareness raising:
to reduce consumption known to create a heavy burden of disease, such as overconsumption of calories, trans fats and salt as well as promote healthy diets and reduce the harmful use of alcohol and tobacco;
to increase the use of those policies that do have a triple or quadruple gain, including health and equity benefits, in other sectors such as the transport, energy, agriculture, water and education;
to implement those environmental policies that have not been implemented across the European Region or at the local level but provide significant health benefits;
to ensure regular environment impact assessments into health programmes; These assessments are very important for those countries in the Eastern part of the region that seek donor funding for health projects;
3. funding, resource flows, investment, and innovation, aligned with priority objectives to promote health and health equities, and including investment in:
social welfare and protection of the poor and marginalized populations; developing mechanisms for innovation, standard setting and behavioural change to promote the health and
health equity benefits of GHG reduction; an environmentally friendly and “green” health sector; adaptation to climate change in the health sector; guidance, tools and standardized methodologies for health impact assessment in other sectors and
environmental impact assessment in the health sector (including protocols, standards and evidence); small-scale demonstration projects, as they are useful for testing what works in practice but their impact is
limited unless they are part of a broader commitment to scale up capacity across the system that promotes and protects public health;
4. research and knowledge sharing to support the value of and need for joint policy action/coherence, including:
understanding the effects of green developments on health, to reap the full societal benefits of green economies while preventing undesired effects,
significant and well trained human resources, information exchange and learning support are available to enable action of the size and scale necessary for the desired impact;
communication of opportunities for innovation to the health sector and across sectors; specific research and demonstration projects to improve understanding of the benefits of sustainability in the
health sector.
As outlined across the variety of chapters, diversified approaches are required depending on the development levels and institutional arrangements at the subregional level and in countries.
Measuring progress Demonstrating the relationship between sustainable development and health is a powerful argument to support climate change-mitigation and adaptation in particular and sustainable development in general. Health outcomes can be measured and can generate public and political interest. Health indicators alone cannot show progress in development but, as both contributor to and beneficiary of sustainable development, health will be a critical component in how the

88
progress and impact of sustainable development are tracked after Rio+20. For example, at the Fifth Ministerial Conference on Environment and Health, health and environment ministries agreed to a number of non- legally binding targets (WHO Regional Office for Europe, 2010d). Rio+20 provides an opportunity to agree on a new approach to development based on the integration of economic, environmental and social-policy concerns. For any new approach to have real traction, however, new measures will be needed to assess progress. These may take the form of sustainable development goals or a new MDG framework. The following initiatives are suggested to be further developed and implemented:
opinion surveys of the general public and climate negotiators, as well as economic valuation of health effects of climate change mitigation and adaptation measures, arguing for a much stronger role for health in climate and related development processes;
indicators to measure progress on environment and health in the European Region (WHO Regional Office for Europe, 2010), such as
o improving access to safe water and sanitation; o reduce obesity and injuries through ensuring safe environments, physical activity and healthy diets; o prevent disease through improved outdoor and indoor air quality and greater chemical, biological and
physical safety; o and action to protect health and the environment from climate change.
WHO tools and indicators to assess the impact of policies in different sectors and their potential impact on people’s health; and
health measurements in the new MDG framework

89
Chapter VI: Institutional arrangements supporting the shift towards sustainable development
I. Introduction The purpose of this chapter is to deepen understanding of governance approaches, notably the instruments, tools, approaches and institutional arrangements, at the national, sub-regional and pan-European levels, and which have assisted in the integration of sustainable development in all spheres of decision-making. The chapter is divided into three substantive sections, each pertaining to a different scale of governance (i.e. national, sub-regional and pan-European). Each section describes the primary governance approaches that have been developed and assesses their overall effectiveness. Recommendations are also included. It should be emphasized that the overall starting point for this chapter is the national level. Tremendous advances have been made on the part of all member States in the development of sustainable development governance. However, as reflected in the first section on national governance, there are significant challenges remaining in all of the sub-regions in Europe. The subsequent sub-sections on sub-regional and pan-European governance highlight only those approaches that address all three pillars of sustainable development as opposed to those that are strictly focused on environment concerns. The examples have also been chosen in terms of the extent to which they support national governments in their concrete efforts to transition to sustainable development.
Institutional framework for sustainable development and Rio+20
Strengthening the institutional framework for sustainable development is one of the two main themes of the forthcoming UN Conference on Sustainable Development. At the second Preparatory Committee, which was convened in New York in March 2011, member States agreed that:
“ the achievement of an effective and efficient institutional framework for sustainable development at all levels is key to the full implementation of Agenda 21, the follow-up to the outcomes of the World Summit on Sustainable Development and meeting emerging sustainable development challenges”. 53
At this point in the preparatory process, the focus of the governance deliberations has been directed primarily to the global level of the institutional framework for sustainable development. This chapter does not cover this level: it focuses on the national, subregional and regional levels of sustainable governance which are also expected to be addressed at a later stage in the Rio+20 preparatory process.
I. Sustainable development governance at the national level In this section, national-level sustainable development governance approaches are examined in terms of new institutions, policies and strategies and legislation, as called for by Chapter XI of the Johannesburg Plan of Implementation. In view of the geographical scope and diversity of the region, this section evaluates the effectiveness of these approaches in the context of sub-regional groupings as delineated previously in the report.
53 “Rio+20 United Nations Conference on Sustainable Development.” United Nations 2011. Last Accessed October 11, 2011. http://www.uncsd2012.org/rio20/index.php?page=view&nr=217&type=12&menu=23&template=435.
90
The overarching challenges of sustainability policy integration
There have been considerable governance innovations over the last decade, and these are highlighted throughout this chapter. However, it is equally clear that the horizontal and vertical policy integration of sustainable development continues to be problematic throughout the region for several concrete reasons.
First and foremost, despite efforts to “green” stimulus spending, in many cases, the global economic downturn has exacerbated the tensions between short-term considerations about GDP growth and economic stabilisation and the long-term imperative of sustainable development. 54
Second, in many cases, the difficulties and obstacles in integrating the three pillars of sustainable development and mainstreaming them into key policy domains often result from the inability of policy makers to understand and realise the mutual benefits that can accrue from harmonizing environment, social, and economic considerations. 55
A third underlying factor that has impeded the integration of sustainability into key spheres of decision-making relates to the lack of effective coordination between sectors and across various levels of government. 56 Of course, where member States have functioning national commissions for sustainable development, the problem is less acute. But for those countries where institutional development has been slow, efforts at deepening inter-ministerial coordination continue to be under-developed (see box 6.1).
Box 6.1: “Ministries of the impossible:” Inter-ministerial coordination is at the heart of sustainable development
Despite growing awareness of sustainable development, responsibility for this area still often remains under the purview of ministries of environment. Famously called “Ministries of the Impossible” by former French Prime Minister Lionel Jospin, Environmental Ministries often have limited influence in economic decision making. UNDP recently commissioned a survey to assess institutional capacities for low carbon and climate resilient development in a number of EECCA and SEE economies (Albania, Armenia, Azerbaijan, Bosnia and Herzegovina, Georgia, Kazakhstan, Moldova, Montenegro, Serbia, The former Yugoslav Republic of Macedonia, and Turkey). The survey demonstrates that weak inter-ministerial coordination and the pitfall of thinking in silos stands in the way of the integrated policy making necessary to advance sustainable development (full results are available online). The study shows that several integrative bodies responsible for sustainable development do exist, but in many countries these bodies are hosted by ministries of environment and enjoy limited ownership among essential partner ministries such as finance and economy, energy, transport, social protection and health. In addition to the coordination problem, the study shows that most countries also have a capacity gap: they often lack the appropriate institutional and human capacities to develop and implement cross-sectoral climate change policies, rely on coordinating committees which are not systematically supported, and are insufficiently prepared for climate change negotiations. Progress is underway to address these gaps. A number of countries are developing Low Emissions Climate Resilient Development Strategies in partnership with UNDP, which provide a mix of integrative policies and adequate financing mechanisms to pave the way towards sustainable development. As an added incentive, countries with such strategies are also eligible to access the much awaited Green Climate Fund after the 2011 Durban Climate Change Conference of Parties to the UNFCCC.
Achieving greater policy coherence demands sustained efforts to improve the integration of sustainable development into sectoral policies, to ensure policy integration across levels of government, and to ensure consistency in the choices made by various stakeholders, especially the private sector. However, the success of these efforts depend on the existence of fundamental framework conditions as well as the right mix of institutional arrangements, policy and legislative frameworks. All of these are summarized in the box below.
54 “Improving Policy Coherence and Integration for Sustainable Development A Checklist.” OECD Policy Brief (2002): 2. http://www.oecd.org/dataoecd/61/19/2763153.pdf. 55 William M. Lafferty. “Adapting Government Practice to the Goals of Sustainable Development.” OECD (2002): 11. http://www.oecd.org/dataoecd/30/54/1939762.pdf. 56 “Improving Policy Coherence and Integration for Sustainable Development A Checklist.” OECD Policy Brief (2002): 3.
91
Box 6.2: The “tool box” for sustainability integration
Constitutional mandates for sustainable development.
Clearly articulated strategic sustainability frameworks with time-bound goals andspecific, results-oriented indicators and benchmarks.
Political leadership is necessary in order to demonstrate the importance and value of integrating sustainable development into all spheres of decision-making and to mobilise the political support from other government departments.
Structural incentives to encourage government departments to integrate sustainability considerations into decision-making. These include results-based reporting, budgeting and accountability processes.
On-going process of review of laws and regulations to ensure conformity with sustainable development.
Tools to ensure that sustainability priorities are duly reflected into long-term budgeting.
Inter-ministerial body to coordinate sustainable development policy between all relevant ministries.
Mechanisms for monitoring, assessment, feedback and revision of national sustainability strategies.
Clear frameworks for assessing performance of government bodies.
Support for stakeholder involvement in sustainability decision-making.
1. Sustainable development governance challenges in Western Europe
At the 2009 European Sustainable Development Network Conference on the future of the EU Sustainable Development Strategy, a number of important lessons were highlighted regarding the implementation of national strategies for sustainable development (which are required by the EU Sustainable Development Strategy). 57
These include the following:
Inter-ministerial committees and national sustainable development councils are important institutional structures to foster horizontal integration which is one of the most decisive issues for SD implementation.
Each ministry should be aware of the SD strategy and should contribute to its effective implementation. The inclusion of the capacities of stakeholders (particularly in the strategy development) and the cooperation
with societal actors in the strategy implementation are important factors in the SD strategy process. Cooperation among the different political levels is essential for successful implementation of strategy
objectives. SD Action Plans are important to define concrete actions and measures for the strategy’s objectives across
ministries and sub-national authorities.
Concrete mid-term targets of the NSDSs helped to better communicate sustainable development and increase the understanding of sustainability in the society at large.
A strong political commitment for sustainability on all political levels would enhance the chance to implement the objectives of the future EU SDS and the NSDSs.
Better coordination and coherence on key challenges and objectives (with related targets and actions) between the future EU SDS and the NSDSs of the Member States is necessary.
Strong monitoring mechanisms and indicators are needed to ensure implementation and coordination of the EU SDS and NSDSs processes.
57 European Sustainability Development. “Coordinating SCP and CSR policies with Sustainable Development: Discussion Paper.” Prague, Czech Republic, 17‐19 June 2009. http://www.sdnetwork.eu/pdf/doc_prague/Discussion%20Paper_ESDN%202009_FINAL.pdf.

92
The following box provides an overview of important horizontal integration mechanisms that have been implemented by countries of Western Europe and Canada
Box 6.3: Overview of horizontal integration mechanisms
AUSTRIA1 Horizontal coordination on the Federal level is fostered by the Committee for a Sustainable Austria that consists of representatives of all Federal Ministries, social partners and the chairs of the ‘Expert Conference of National and Regional SD Coordinators’. Moreover, a ‘Sustainable Development Steering Group’ was established on the national level to coordinate SD activities among the different ministries. As of 2010 the Committee is co‐chaired by the Federal Chancellery and the Federal Ministry of Agriculture, Forestry, Environment and Water Management.
NORWAY1
According to the NSDS, a ‘Green Cabinet’, chaired by the State Secretary of the Ministry of Finance and composed of state secretaries from other ministries and the Office of the Prime Minister, is responsible for ensuring policy coherence. Following increased need for coordination of the climate change issue, the mandate of ‘the Cabinet on SD’ was expanded in 2008 to cover more specifically policies related to climate change.
SWEDEN1 Between 2003 and 2007 Sweden had a Coordination Unit for SD. Its task was to coordinate SD within the Government Offices, function as a think‐tank and promote the further development of the NSDS. The revised NSDS was prepared by the Coordination Unit for SD in cooperation with a cross‐departmental working group. Generally, all ministries are involved in the implementation of the NSDS. Within the Swedish Government Offices the coordinative responsibilities of the SDS are shared between several ministries. The EU SDS is coordinated by the Prime Ministers Office while the Ministry of Foreign Affairs is responsible for coordination of the global SD work.
SWITZERLAND58
The coordination function for SD within the Swiss Government is undertaken by the Interdepartmental
Sustainable Development Committee (ISDC). More than 30 federal agencies are involved in ISDC. It is headed by the Federal Office for Spatial Development (ARE).
The tasks of the ISDC include:
Coordination of Confederation policy as it relates to sustainable development
Inter‐departmental and inter‐agency coordination of Confederation activities which are of significance to sustainable development
Joint development of strategies and action plans for Switzerland's implementation of Agenda 21
Coordination of the position taken by Switzerland in international processes, and reporting to international bodies such as the United Nations
Fostering relationships within the federal administration as well as with the private sector and civil society.
FINLAND59 The aim of the FNSCD is to promote strategic SD goals in national and administrative policies, and also to enhance the dialogue between different societal actors. The promotion and concretizing of implementation processes fosters cohesion between sectoral policies and administration. The Prime Minister chairs the meetings of the FNSCD, which has ensured a much higher level of political visibility.
CANADA60 Since 1995, designated departments and agencies have been required by law to prepare sustainable development strategies, then update them and present them to Parliament every three years. The Commissioner of the
58 European Sustainable Development Network. “Mechanisms of Horizontal Integration: Switzerland.” ESDN Office Team. Last accessed October 11, 2011. http://www.sd-network.eu/?k=country%20profiles&s=horizontal%20integration&country=Switzerland.
59 European Sustainable Development Network. “Mechanisms for Horizontal Integration.” ESDN Office Team. Last accessed October 11, 2011. <http://www.sdnetwork.eu/?k=country%20profiles&s=horizontal%20integration> 60 Ibid.
93
Environment and Sustainable Development assesses the quality of departmental sustainable development strategies and whether the plans set out in the strategies have been implemented. The results are presented in various reports of the Office of the Auditor General of Canada, including the Commissioner’s reports to the House of Commons.
UNITED KINGDOM61 There are several coordination mechanisms that facilitate horizontal integration in the UK: First, a new Cabinet Committee structure was announced in July 2007. In this committee structure, the main committee relevant to SD
is the Environment and Energy sub-committee of the Economic Development Committee. Its remit is to consider international and domestic policy on environment and energy issues; and report as necessary to the Committee on Economic Development and the Committee on National Security, International Relations and
Development. The second coordination mechanism is the SD Task Forces, established by the State Secretary for Environment in 2002. Government Task Forces are set up in order to bring together officials, and often ministers from across Government, in order to generate action on a particular issue of SD.
GERMANY62 The Committee of State Secretaries for Sustainable Development is predominantly responsible for developing and implementing the German National Strategy for Sustainable Development. All government ministries are represented on the Committee. The Head of the Federal Chancellery chairs the committee on which all ministries are represented. Moreover, the Committee’s importance in sustainability policy-making is guaranteed by its institutional position right below the Cabinet of Ministers and the fact that only the State Secretaries can participate.
2. Sustainable development governance challenges in South‐Eastern Europe
The institutional challenge
Many countries in this sub-region have made considerable efforts in developing the new institutions that will be needed to implement EU and international commitments.
As well, following on the recommendations of the 2002 World Summit for Sustainable Development, several countries have established National Councils for Sustainable Development to provide for forums for inter-ministerial coordination and stakeholder consultation on issues related to the environment and sustainable development. The national councils are usually entrusted with the preparation of the national strategy for sustainable development and the coordination of government ministries in their respective sustainability policy-making.
As with other sub-regions throughout the UNECE region, despite good intentions, the national councils have not been properly equipped with the resources to effectively carry out their mandates. In many cases, they lack permanent secretariats and are not sufficiently elevated in the political hierarchy to have any real effect.
Some countries have made efforts to redress these problems by elevating the profile of the councils by placing the chairmanship within the Deputy Prime Minister’s office.
Sustainability policy integration
Throughout the sub-region, the integration of sustainability considerations into other sectoral policies is still at an early stage. This stems in part from the afore-mentioned weaknesses with the national councils for sustainable development, the lack of structures in place to ensure coordination and cooperation between the environment ministries and other line ministries, and the fact that some ministries continue to include simultaneous competencies for resource protection and exploitation.
61 Ibid. 62 “Structures of Sustainable Development.” Die Bundesregierung. Last accessed October 11, 2011. http://www.bundesregierung.de/nn_208962/Content/EN/StatischeSeiten/Schwerpunkte/Nachhaltigkeit/nachhaltigkeit-2007-04-13-strukturen-der-nachhaltigkeitspolitik.html.
Box 6.4: Examples of sustainable development governance
The Serbian National Council for Sustainable Development (NCSD) was established in 2003 to ensure horizontal coordination and to prepare the National Strategy for Sustainable Development. At first, in 2003 the NCSD was placed under the responsibility of the Ministry of Natural Resources and Environmental Protection, which undermined its overall effectiveness. Following a restructuring in 2005, it is now chaired by the Deputy Prime Minister and includes six ministers and serviced by a permanent secretariat.
In Croatia1, the Sustainable Development and Environmental Protection Council was established by the Government for the purpose of achieving coordinated and harmonised economical development in the context of environmental protection and ensuring conditions for sustainable development.
94
The challenges with national strategies for sustainable development
Over the years, the most important contribution to the policy framework has been the establishment of national strategies for sustainable development. Called for by the World Summit for Sustainable Development, they enshrine fundamental sustainability principles, define priorities for legislation and the integration of environmental policy into economic and other sectoral policies and define priorities for strengthening institutional capacities. However, not all countries in the sub-region have been able to mobilize the political will needed to establish national strategies. And where they are indeed missing, policy integration is being addressed in a fragmented manner with limited progress in developing concrete initiatives for sectoral integration.
Box 6.5: Montenegro’s National Strategy for Sustainable Development (NSSD)
The National Council for Sustainable Development (NCSD) is composed of key ministries and scientific institutions, and brings together the business sector and NGOs. The NCSD is responsible for the implementation of NSSD, the main aims of which are to develop sustainable tourism, a programme of forestry policy and a programme on organic agriculture.
The positive impact of EU approximation
Many countries in the sub-region have advanced considerably in the development of their national legal frameworks for sustainable development. In many cases, the elaboration of new environmental legislation has resulted from efforts to approximate the EU environmental acquis, especially in the areas of environmental impact assessment, strategic impact assessment, integrated pollution prevention and control. However, there are significant challenges remaining such as the slow pace in enacting necessary secondary implementing legislation, the degree of complication and fragmentation, as well as weak monitoring and enforcement.
The role of public participation
One important trend in the development of environmental legislation has been the improvement of public participation in environmental law making. Many countries now regularly hold public hearings concerning draft laws and NGOs often participate in the preparation of draft laws. Indeed the Aarhus Convention has been an important catalyst in stimulating the democratic process of public participation in environmental decision-making throughout the sub-region
3. Sustainable development governance challenges in Eastern Europe
The institutional challenges
One of the central institutional challenges has been the lack of robust national commissions for sustainable development. Where they have been created, in the case of Ukraine for example, they have been weak in both form and function. The participation of key stakeholders has been limited and the bodies have lacked the resources and tools needed to develop innovative sustainability policies, to support implementation and to evaluate on progress.
Integration efforts
The most significant contribution to the policy framework for sustainable development has been the efforts to integrate the environment into other sectoral issues such as transportation, agriculture and industry, although this has not been very successful in energy and land-use planning. Many national governments have begun to use economic instruments, often employing the ‘polluter pays’ principle, in order to achieve environmental goals. These instruments nevertheless have only been used to a very limited extent and even where they are used, environmental enforcement and monitoring mechanisms are underdeveloped and significant exemptions exist which, combined, undermine the effectiveness of these instruments.
Low level of political support
While several countries have developed national environmental policies, notably related to sustainable development, they have not been fully implemented or integrated throughout the national and sub-national environmental institutions. National governments do not place a high priority on environmental issues and funding for this sector is minimal.
Box 6.6: Right to a healthy environment in Serbia
In 2006, Serbia adopted its Constitution, which proclaims that every citizen has the right to a healthy environment and the right to timely and full information about the state of the environment.

95
Box 6.7: Environmental authorities in Azerbaijan
In Azerbaijan environmental authorities have been considerably strengthened since the first EPR, both institutionally and in terms of funding. As a result, since its establishment in 2001, the Ministry of Ecology and Natural Resources (MENR) has succeeded in promoting sectoral integration by developing environmental programmes and action plans, and by contributing to the development of programmes on sustainable development in cooperation with other ministries and State agencies.
Furthermore, long-term environmental strategies are still lacking in many member States. These factors severely limit the effectiveness of national environmental policies.
Box 6.7: Belarus’ National Strategy for Sustainable Development (NSSD)
The Ministry of Natural Resources and Environmental Protection introduced the NSSD as a policy and legal framework. The NSSD sets the transition towards sustainable development in two stages: first, to further improve living standards based on more efficient use of resources and a competitive economy, and second, to lay the groundwork for a new post-industrial information age, with an emphasis on technology designed to bring about a smooth transition to resource-saving production.
Progress with the development of environmental law
Despite some degree of legislative progress, however, environmental concerns continue to rank low on the political hierarchy in Eastern European national governments. Furthermore, the impact of environmental legislation is often minimal because monitoring and enforcement mechanisms are underdeveloped. Efforts to implement legislation are often poorly coordinated and rarely integrated into the overall environmental policy framework.
4. Sustainable development governance challenges in the Caucasus and Central Asia
The influence of the EPRs and political transition processes
There have been significant changes in the institutional framework of countries in this sub-region over the past ten years. In large part, these changes have been influenced by political independence processes and recommendations of the first Environmental Performance Reviews. However, in other cases, political transition processes have impeded the development of sustainability institutions because of the predominant focus on economic growth.
The institutional challenges
As with other sub-regions throughout the pan-European region, despite good intentions, few national sustainable development councils have been put in place. Where they do exist, they have not been properly equipped with the resources and capacity to ensure implementation of national sustainable development strategies.
Challenges also remain in terms of ensuring coherence in the division of responsibilities among the relevant institutions and strengthening coordination and cooperation in order to avoid gaps, overlaps and inefficiencies that continue to undermine the realization of sustainability goals. Many countries have now created environment ministries, however drastic cuts and frequent restructuring impede continuity and capacity.
Box 6.8: Kazakhstan’s National Council for Sustainable Development The National Council for Sustainable Development is responsible for the implementation of the national sustainability strategy. It endeavours to balance economic and environmental objectives, without endangering the competitiveness and future growth of the country. The strategy harmonizes resource efficiency and human development along side economic competitiveness.

96
National strategies for sustainable development
National strategies for sustainable development (NSSD) have only been implemented in a few countries. For those countries that have implemented NSSDs, few have been properly reviewed or assessed as with National Environmental Action Plans. In some cases, the NSSDs have been discontinued or replaced by even less effective approaches that have led to further policy fragmentation.
The integration gap
Throughout the sub-region, the integration of environmental policy with economic and other sectoral policies is still undeveloped. This stems in part from the afore-mentioned weaknesses with the national councils for sustainable development, the lack of structures in place to ensure coordination and cooperation between the environment ministries and other line ministries, and the fact that some ministries continue to include simultaneous contesting competencies for resource protection and exploitation.
Challenges in the development of environmental law
Many environmental laws and regulations were adopted following the first cycle of EPRs throughout this sub-region. This has contributed to number of legislative advances. However, democratic deficits, lack of internal consistencies, and unclear division of responsibilities that created deeper gaps and duplication, in turn, have undermined implementation and compliance of these laws.
5. Conclusions and recommendations for strengthening sustainable development governance at the national level in the UNECE region
Institutional challenges
In terms of institutional arrangements, the challenges vary widely of course between sub-regions. However the common challenge that all sub-regions face is the continuing low profile of most environment ministries relative to other sectoral ministries such as energy, industry, trade and agriculture. The first way to rectify this problem is to address the misperception of environmental protection as a significant cost burden for those countries who have been particularly affected by the global downturn.
The second institutional challenge that is faced by most countries relates to the difficulties in ensuring coordination and coherence between the environment ministries and the key sectoral ministries. Where governments have implemented sustainability impact assessments for new policies and programmes, there has certainly been progress in ensuring the integration and mainstreaming of environmental considerations into other line ministry decision-making. However, in most of the sub-regions, the institutional mechanisms for deepening inter-ministerial coordination must either be strengthened or established in the first instance.
The third institutional challenge relates to the overall weakness of environment ministries. Resources must
mobilize capacity for technical support, assessment and monitoring, enforcement, policy-making, approximation of EU legislation, coordination and cooperation with other ministries.
The fourth institutional challenge relates to the limited effectiveness of national councils for sustainable development. Called for by the 2002 World Summit for Sustainable Development, few countries have succeeded in developing strong and robust national councils. This stems in part from lack of political support
Box 6.11: Draft law on environmental security in Uzbekistan
In Uzbekistan a draft law on environmental security is currently at the early stages of consideration. The purpose of the law is to identify and prevent the development of environmental threats, rehabilitate emergency environmental situations and environmental disaster zones, and establish the legal basis for protection against hazardous environmental impact.
Box 6.10: The legislative framework in Azerbaijan
In Azerbaijan the legislative framework has been strengthened in certain areas with new laws and the elaboration of more detailed bylaws. There is, however, considerable room for improvement, especially with regard to secondary legislation. Implementation and compliance are also issues of concern.
Box 6.9: Uzbekistan’s 1997 National Sustainable Development Strategy (NSDS) NSD continues to serve as the overarching framework for sustainable development and functions as the basic reference document for all strategies and legislation. It requires that all policies and laws must be consistent with the NSDS.

97
for the sustainability agenda, but it also relates to a deeper problem in terms of limited capacity for integrated decision-making and the lack of a culture of inter-ministerial cooperation.
Challenges related to the policy framework
In terms of the overarching policy framework challenges faced by member States, the common factor relates once again to lack of political support for the development of national strategies for sustainable development. EU Member States have benefitted enormously from the EU Sustainable Development Strategy, which provides clear guidance for the development of national sustainability strategies. Of course political will to actually implement the strategies varies from sub-region.
What is clear however is that where political will is lacking, environmental policy integration continues to be problematic because of lack of support for the implementation and operationalization of national strategies for sustainable development. In order to elevate political will, it is necessary to establish office within Prime Minister’s office to undertake overall responsibility for the development of national sustainability strategies. As well, ensuring an oversight of national strategies by Parliamentary Committee is needed to send clear messages to bureaucracies that their performance in achieving sustainability goals will be monitored at the highest level.
More explicit environmental policy integration is needed at the policy, institutional and sectoral levels.
Governments must be supported in developing the necessary institutional and regulatory frameworks for environmental policy integration into policymaking. Greater efforts must be directed towards developing market-based instruments that reinforce integration through market mechanisms. 63
Governments should also establish sustainability audits with baseline measures against which progress could be measured. Ensure that key stakeholders are involved in the sustainability audit by supporting them with the resources needed to conduct a shadow audit.
Equally important is the need for related instruments to support effective integration of sustainable development considerations into sectoral policies, and specific tools and mechanisms (i.e. sustainability impact assessment, environmental impact assessments, environmental management systems, national environment and health action plans, market-based tools, comprehensive labour market information, etc.) integrating environmental requirements into transport, energy, agriculture and other key sectors.
The legislative challenges
Despite the positive impact of EU approximation, there are significant challenges which remains concerning the slow pace in enacting necessary secondary implementing legislation, the degree of complication and fragmentation, as well as weak monitoring and enforcement. Therefore governments should strengthen the legal capacity and expertise of key ministries to accelerate the approximation process.
The ineffectiveness of compliance and enforcement mechanisms is generally connected with an incomplete legal basis and insufficient institutional capacity. Governments must therefore continue to address democratic deficits, lack of consistency within and between Ministries, capacity issues as well as unclear division of responsibilities that underpin monitoring and enforcement.
The ratification and implementation of the Aarhus Convention significantly stimulated the democratic process
of public participation in environmental decision-making and sustainable development throughout the region. Aarhus principles should be extended to other policy domains.
63 “Critical Issues in Implementation of Environmental Policy: Country Fiche, Uzbekistan.” Last
accessed October 11, 2011. http://www.unece.org/fileadmin/DAM/env/epr/publications/Critical%20issues%20implementation%20EPR.pdf.

98
II. Sustainable development governance at sub-regional level
Introduction
Against the backdrop of national-level sustainable development governance challenges, it is clear that sub-regional and pan-European organisations have a key role to play to support member States in improving their integration efforts.
This chapter reveals that considerable advances are indeed being made in this regard.
Normative instruments, including both legally binding conventions and soft law approaches have been developed for almost all of the sub-regions. The Carpathian Convention, the Alpine Convention, and Barcelona Convention, have all addressed the three pillars of sustainability in an integrated manner in their efforts to balance environmental protection with economic and human development.64 Another important development in this regard is the ongoing process for a possible convention on the sustainable development of the Dinaric Arc.
Soft law approaches such as the Mediterranean Strategy for Sustainable Development, Baltic Sea States Strategy on Sustainable Development 2010-2015, the Barents 2010 Strategy on Natural Resources, also demonstrate that governance approaches at the sub-regional scale are proving effective at addressing the integrated sustainability challenges. In many cases, there is a more distinct “community of interest” from which robust and innovative solutions can be developed with greater ease than at the international level.
Particular attention is focused in this section on the EU Sustainable Development Strategy (EUSDS). The EU SDS has gone through several rigorous review processes. The most recent revision, although far from perfect, ensures a greater recognition of the need for integrated approaches to policy making to ensure policy synergies and to reduce trade-offs between economic, social and environmental challenges.
1. Breakthroughs and accomplishments
Legally binding instruments
Administered by UNEP Vienna, the Carpathian Convention promotes the protection and sustainable economic development of the Carpathian mountain region. Its cross-sectoral and integrated approach has been an important source of policy guidance for member States in the Carpathian region – especially in terms of the challenges of balancing environmental protection with economic development in the region.65
The Convention has also motivated the EU to ensure better coordination of existing EU programmes in the region. In terms of implementation, member States continue to have difficulties especially in terms of their continuing need for financial, technical, and personnel assistance. On the transnational level, greater efforts are needed to strengthen the institutional arrangements under the Convention, to develop the “Carpathian Space” under the convention, and to enhance transnational coordination.66
One of the key sources of inspiration for the Carpathian Convention was the 1991 Alpine Convention, which was the first regional agreement for sustainable development of mountains. Like the Carpathian Convention, the Alpine Convention has been instrumental in helping the Parties to promote jointly the integration of the ecological, economic and social dimensions of this common ec-osystem. The Convention commits State Parties to pursue conservation policies and to intensify cooperation on key thematic areas such as population and culture, land use, air quality, soil protection, water, nature protection and landscape tending, mountain farming, mountain forests, tourism, transport, energy, and waste.
Mention should also be made of the ongoing efforts to launch a legally binding convention on the sustainable development of the Dinaric Arc. At the 2011 Conference for the Protection and Sustainable Development of the Dinaric Arc region, member states agreed on the need for an integrated approach to ensure sustainable development and 64 Juliet Fall. “Designing framework conventions to promote and support transboundary protected areas:
theory and practice from the Carpathian Convention.” The Open University (2006). Last accessed October 11, 2011. http://www.unige.ch/ses/geo/collaborateurs/publicationsJF/Carpathian_convention.pdf.
65 Ibid. 66 “Successes, Challenges, and Future priorities of the Carpathian Convention.” Third Meeting of the Conference of the Parties 25-27 May, 2011, Bratislava. Last accessed October 11, 2011. http://www.carpathianconvention.org/NR/rdonlyres/15053CA0-5C5F-4ED2-BD77-F6A272FE1BB9/0/ISCC_presentationfinal.pdf.

99
for a balanced relationship between people and nature. The integrated approach will address the linkages between spatial planning, nature conservation, environmental protection, water management, agriculture and rural development, cultural identity, energy, mountain forestry, tourism, sports and transport. 67
Soft law approaches
At the sub-regional level there are a number of important strategic frameworks that have addressed the integrated challenges of sustainable development.
One of the earliest examples is the Baltic Agenda 21. The Baltic Sea Region was the first region in the world to develop a regional sustainability strategy. In fact, no other region in the world has such a strong track record when it comes to sustainable development in both principle and practice. 68
Initiated in 1996 by the Prime Ministers of the countries around the Baltic Sea, the objective of the Strategy was to contribute actively towards advancing sustainable development in the Baltic Sea Region by addressing the linkages between environmental, including health, and spatial planning aspects of sustainable development in the region.
In the ten years since the Prime Ministers of the Baltic Sea States initiated the Baltic 21 process, the Baltic Sea Region’s commitment to sustainable development has been intensified through numerous high-level political declarations and agreements. For the 2010-2015 period, the Baltic 21 Strategy will focus on climate change, sustainable urban and rural development, sustainable consumption and production and innovations and education for sustainable development. 69
Despite the Baltic Sea Region’s clear commitment to sustainable development, it has been difficult to mobilise the financing and the resources needed for implementation. More focused efforts are needed both to halt and reverse regional unsustainable trends, such as the excessive use of and demand for energy, as well as the immoderate depletion of natural resources. 70
Adopted in 2005, the Mediterranean Strategy for Sustainable Development (MSSD) was a result of an extensive consultation process. The MSSD framework provides guidance for national sustainable development strategies and implements international agreements in the regional context. 71 Because the environment provides the basis for economic development in the Mediterranean, the MSSD addresses the challenges in redirecting development to meet economic and social needs, without exacerbating environmental degradation. The Strategy focuses on integrating environmental concerns into key economic development sectors. 72
More recently, the Barents 2010 Sustainability Strategy is an excellent example of the balancing of economic growth and social development, alongside the sustainable use and management of the region´s natural resources. Key achievements of the Strategy include its impact in forging collaboration between stakeholders and ensuring the participation of indigenous peoples. Further, it has been designed to provide guidance and support to countries in the development of their own sustainability strategies.
EU Sustainable Development Strategy
With the EU Sustainable Development Strategy (EUSDS),73 the EU has been increasingly proactive in building political support among member states and key constituencies. The Strategy was first adopted in 2001 to provide the EU with an 67 Pier Carlo Sandei. “UNEP’s current activities in south Eastern Europe.” UNEP Vienna. Last accessed October 11, 2011. http://webcache.googleusercontent.com/search?q=cache:4oLqeU_U2gQJ:mri.scnatweb.ch/download-document%3Fgid%3D813+legally+binding+convention+for+sustainable+development+of+the+Dinaric+Arc&cd=4&hl=en&ct=clnk&gl=ch. 68 “Item 4: Revised Baltic 21Triennial Report 2003-2005.” Senior Officials Group Twenty Fourth Meeting, Silja Line Ferry, May 22-23, 2006. SOG 24/4/1 Rev. 1. Last accessed October 11, 2011. s3.amazonaws.com/zanran_storage/www.baltic21.../50234476.pdf. 69 “We are Baltic 21.” Council of the Baltic Sea States. CBSS Secretariat, Stockholm. Last accessed
October 11, 2011. http://www.cbss.org/Environment/creating-a-sustainable-baltic-sea-region
70 “Item 4: Revised Baltic 21Triennial Report 2003-2005.” Senior Officials Group Twenty Fourth Meeting, Silja Line Ferry, May 22-23, 2006. SOG 24/4/1 Rev. 1. Last accessed October 11, 2011. s3.amazonaws.com/zanran_storage/www.baltic21.../50234476.pdf. 71 “The Mediterranean Strategy of Sustainable Development (MSSD)” UNEP Mediterranean Strategy of Sustainable Development. Last accessed October 11, 2011. http://www.unepmap.org/index.php?module=content2&catid=001017002001. 72 “The Mediterranean Strategy of Sustainable Development (MSSD)” UNEP Mediterranean Strategy of Sustainable Development. Last accessed October 11, 2011. http://www.planbleu.org/publications/smdd_uk.pdf. 73 “Review of EU Sustainable Development Strategy- Renewed Strategy.” The Council of the European Union (2006). DOC 10917/06. Last accessed October 11, 2011. http://register.consilium.europa.eu/pdf/en/06/st10/st10917.en06.pdf.
European Council conclusions 14 December 2007 (§ 56)
100
overarching sustainability policy framework. The framework provided policy guidance for member States in the development of their national strategies for sustainable development.74
Five years later in 2006, the European Council adopted an ambitious, comprehensive and renewed SDS in order to respond to the new sustainability challenges that were generated by an important wave of expansion in recent years. As a result, the SDS was revised to ensure greater recognition of the need for integrated approaches to policy making to facilitate policy synergies and to reduce trade-offs between economic, social and environmental challenges.75
Other equally important additions to the revised EU SDS included: consideration of the challenges of integrating sustainable development considerations into the EU’s external policies; mechanisms for improving the coordination with other stakeholders and levels of governments; the launch of a new process for voluntary peer review of national sustainable development strategies; and increased emphasis on unsustainable consumption and production.
The most recent review of the EU SDS carried out in 2009 concluded that despite considerable progress with the SDS in mainstreaming sustainable development in other EU policies, unsustainable trends persist, “ranging from climate change to the ageing of societies in developed countries and a widening gap between the rich and the poor in the world.”76
The most important challenge now is to ensure that the EU SDS can influence EU short and medium-term policies, such as the EU 2020 strategy, which is the EU’s new green growth strategy. EU 2020 has three mutually reinforcing priorities, namely to help the EU become a smart, sustainable and inclusive economy.77 Important lessons must be learned from the EU’s difficulties in harmonizing the EU SDS with the EU 2020 precursor – the so-called Lisbon Strategy. For years, there has been a divide between the two policy domains, notwithstanding the clear linkages between economic growth and competitiveness, job creation and environmental sustainability and social cohesion78
2. Policy recommendations
Ensure continued engagement of civil society in all phases of policy formulation especially in terms of strengthening their capacity to participate meaningfully.
2009 Review of the EU Sustainable Development Strategy COM (2009) 400 First Progress Report (October 2007) + Staff Working Paper Eurostat 2007 monitoring report Publication of a Handbook for the Peer Review of National Sustainable development Strategies Commission Communication "On the review of the Sustainable Development Strategy - A platform for action"
COM(2005) 658 final Commission Communication "Draft Declaration on Guiding Principles for Sustainable Development" COM(2005) 218
final, 25.5.2005 Commission Communication "The 2005 Review of the EU Sustainable Development Strategy: Initial Stocktaking and
Future Orientations" COM(2005) 37, 9.2.2005 The European Commission sets a positive agenda for the 2005 review of the Sustainable Development Strategy (press
release IP/05/156 of 09/02/2005) Commission Communication "The World Summit on Sustainable Development one year on: implementing our
commitments" COM(2003) 829 final Commission Communication "Towards a global partnership for Sustainable Development" COM(2002) 82 final, adding a
global dimension to the EU Sustainable Development Strategy Commission Communication "A sustainable Europe for a better world: A European strategy for Sustainable Development"
COM(2001) 264 final
Commission proposes bold EU strategy for sustainable development (press release IP/01/710 of 16/05/2001) 74 Europa: Summaries of EU legislation. “Strategy for Sustainable Development.” Last accessed October 11, 2011. http://europa.eu/legislation_summaries/environment/sustainable_development/l28117_en.htm. 75 Ibid. 76 ECPR: European Consortium of Political Research. Last accessed October 11, 2011. http://www.essex.ac.uk/ecpr/events/generalconference/marburg/papers/8/5/hey.pdf. 77 Ibid. 78 Candice Stevens. “Europe leads the world on sustainable development, but it could do better.” Europe’s World. Last Accessed October 11, 2011. http://webcache.googleusercontent.com/search?q=cache:Ijw9o-AaKJwJ:www.europesworld.org/NewEnglish/Home_old/Article/tabid/191/ArticleType/articleview/ArticleID/21354/language/en-US/Default.aspx+Lisbon+Strategy+trumps+EU+Sustainable+Development+Strategy&cd=4&hl=en&ct=clnk&gl=ch&source=www.google.ch.
101
Direct greater efforts to engaging the private sector since they are increasingly important partners in the promotion of sustainability at the sub-regional level. Public- private partnerships are especially needed in the development of sustainability strategies.
When developing legally binding instruments or soft law approaches, ensure that they provide for the
necessary tools for implementation since the lack thereof is a common factor that has impeded success. To engage the political engagement of member States it is important to promote trans-boundary agreements as
instruments for political cooperation and peace building.
Where ratification or compliance has been a problem, it is important to involve a substantial public education component to explain the relevance of sustainability governance mechanisms. Once convinced of their utility, NGOs and other stakeholders can play a critical role in mobilising political will and public support for securing ratification.
In those cases where compliance is a function of lack of capacity, efforts must of course be accelerated to
ensure the systematic flow of financial, technical and policy support assistance. Wherever possible, instead of developing new governance mechanisms, strengthen existing mechanisms where
they are clearly playing important roles in contributing to wider sustainability goals. This will require efforts are needed to coordinate initiatives and strengthen and link them together in order to create much-needed synergies.
However, wherever new policy initiatives will in fact be needed at the sub-regional level, experience has
shown clearly that there is a greater chance of compliance if governments can be convinced of their potential for securing political stability, stabilizing economies and improving living conditions. These overarching goals must always provide the context for policy-making.
At the same time, new policy initiatives should be embedded in a true sustainability framework, which ensures
that all three pillars are properly integrated.
III. Sustainable development governance at the pan-European level
1. Breakthroughs and achievements
Many important breakthroughs have been made at the pan-European level in terms of new governance approaches that integrate the three pillars of sustainable development. These have not only enhanced regional coordination and cooperation but have also supported deeper integration of sustainability into decision-making at all levels.
Indeed, to a very large extent, UN bodies as well as some non UN pan-European organisations (e.g. the Council of Europe, OSCE) have played an important role in shaping regional strategies, policy frameworks and legal instruments under which national governments have succeeded in developing their own policy and legal framework. Furthermore, these organisations provide advisory services and concrete capacity building support in order to enhance the ability of governments to translate these regional processes and tools into national governance mechanisms.
Pan-European strategies and policy frameworks
The Pan-European Biodiversity and Landscape Strategy (PEBLS), which is jointly administered by UNEP and the Council of Europe, is a particularly innovative approach to biodiversity conservation. It integrates biological and landscape diversity considerations into social and economic sectors. It also provides a framework to ensure coherence between national and regional actions to implement the Convention on Biological Diversity.
The Transport, Health and Environment Pan-European Programme is another important sustainability strategic framework. Established in 2002 under the joint auspices of UNECE and WHO-EURO, it provides a framework for integrating transport, health and environment policies at the national and local levels. Furthermore, it has facilitated

102
cooperation between Ministries of transport and environment throughout the region as well as exchange of good practices in promoting sustainable transport systems79 .
The Strategy for Education for Sustainable Development, managed by UNECE, was adopted on the basis of a participatory process involving governments, UNESCO, NGOs and other stakeholders. The Strategy aims to incorporate key themes of sustainable development in all education systems in the region. These themes include a wide range of issues: poverty alleviation, peace, ethics, democracy, justice, security, human rights, health, social equity, cultural diversity, economy, environmental protection, natural resource management.
Political processes
The 'Environment for Europe' process (EfE) is regarded as an essential high-level political process which provides for a coordinated approach in environmental policy for the entire region. It involves all countries of Europe, Central Asia and North America as well as a large number of civil society organizations from the region. Serviced by UNECE, this process benefits also from the active involvement of UN organisations, in particular UNEP, and other regional organisations such as the European Environmental Agency, OECD, OSCE and the Council of Europe. Not only has the EfE been critical to the development of regional conventions and harmonized norms but it has served to bridge important gaps and facilitate the exchange of experience between state and non-state actors, which has in turn, proved essential to policy, law making and institution building at the domestic level.80 The seventh Ministerial Conference (Astana, Kazakhstan, September 2011) focussed on two main themes: Sustainable management of water and water-related ecosystems; and Greening the economy: mainstreaming the environment into economic development. The Ministerial Declaration that was adopted at the Conference reaffirmed the value of the EfE process and, through the themes addressed, created the opportunity to expand its scope from environmental protection to sustainable development81.
The Ministerial Conference on Environment and Health is another high level political process. Managed by WHO/Europe in close cooperation with UNEP and UNECE, it aims at eliminating the most significant environmental threats to human health. The Fifth Ministerial Conference on Environment and Health (Parma, Italy, March 2010) is the latest milestone in this process, now in its twentieth year. Focused on protecting children’s health in a changing environment, the Conference set Europe’s agenda on emerging environmental health challenges for the years to come. The Parma Declaration is the first time-bound outcome of process. The 53 Member States of the WHO-EURO region set clear targets to reduce the harm to health from environmental threats in the next decade, particularly those related to climate change. 82
Environmental performance reviews
Among the principal pan-European operational tools, the Environmental Performance Reviews (EPRs) have helped enormously to improve the evaluation of environmental performance relative to the national goals and the international obligations of the reviewed countries. The reviews are led by OECD for countries of Western Europe and by UNECE for countries of Eastern Europe, with the support of UNDP and UNEP. Member States that have been reviewed under the first and second cycle of EPRs regard the process as essential in the following ways: identifying their environmental problems; defining further policy and legislative actions; improving their environmental governance; sharing experience; monitoring progress; assessing their involvement in regional and global processes; and identifying the next
79 “The Pan-European Programme on Transport, Health and Environment: Assessment and Progress Made.” United Nations Economic Commission for Europe. January 2008. http://www.unece.org/index.php?id=2527. 80 “Save Water, Grow Green: Environment for Europe 7th Ministerial Conference, eNewsletter, United Nations Economic Commission for Europe. http://www.unece.org/env/efe/Astana/InformalDocuments/AstanaNewsletter1.e.pdf.
81 “Summary of the seventh “Environment for Europe” Ministerial Conference.” Earth Negotiations Bulletin. IISD Reporting Services. Vol. 147, N. 04, 26 September 2011. http://www.iisd.ca/ymb/unece/efe7/html/ymbvol147num4e.html. Declaration “Save water, grow green!”http://www.unece.org/fileadmin/DAM/env/documents/2011/ece/ece.astana.conf.2011.2.add.1.e.pdf
82 “Protecting children’s health in a changing environment.” World Health Organization. Fifth Ministerial Conference on Environment and Health. Parma, Italy, 10-12 March 2010. http://www.euro.who.int/en/what-we-do/event/fifth-ministerial-conference-on-environment-and-health.

103
steps for further progress.83 The third cycle of EPRs will address broader sustainability challenges in the countries under review.
Advisory services and capacity building activities
UNDP’s regional office for Europe and Central Asia (RBEC) undertakes a wide range of advisory and capacity building activities to support the own efforts of governments and other national stakeholders in promoting human development in its three inter-related environmental economic and social dimensions.84 UNDP’s capacity to foster human development governance in countries of Eastern Europe, Caucasus and Central Asia is reflected by a portfolio of over 250 active projects under the auspices of a $68 million budget for 2010.85
UNEP’s Regional Office for Europe (ROE) provides policy advice to national governments in the area of environment, assisting in particular with the development of ecosystem based approaches to biodiversity conservation. Mention should also be made of UNEP’s Green Economy Initiative (GEI), which constitutes a solid basis for providing advisory services to governments in support of their green economy transition efforts.
The ILO’s Green Jobs programme provides country assessments of the potential of green jobs as well as training for ILO constituents in the region on green jobs and climate change. With demand for ILO assistance and interest in these issues growing in the region, the ILO stands ready to support countries through technical cooperation, policy advice and capacity building, the objective being to promote best practice and raise the interest of decision-makers in this area.
2. Policy recommendations
The key policy recommendations that apply across the board to all of the above-mentioned soft law norms, strategies and policy frameworks include the following:
Continue to engage member States and other key stakeholders in the norm-creation/policy making processes engaged at the regional level.
Provide necessary capacity building support to ensure the full engagement of member States in these processes.
Prioritise the development of policy frameworks that help to deepen and strengthen the integration of the three sustainability pillars.
Ensure that the priorities of the regional policy frameworks are reflected in the formulation of national strategies.
Provide support to member States in order to deepen their understanding of the cross-sectoral linkages and the tools for integrated policy-making.
For this purpose, encourage continued inter-ministerial cooperation and collaboration Direct greater efforts in distilling lessons learned throughout the region and feeding best practices into
policymaking.
83 “Introducing Environmental Performance Reviews.” United Nations Economic Commision for Europe. http://www.unece.org/env/epr/welcome.html. 84 John Drexhage and Deborah Murphy. “Sustainable Development: From Brundtland to Rio 2012: Background Paper.” International Institute of Sustainable Development (September 2010). Last accessed October 11, 2011. http://www.un.org/wcm/webdav/site/climatechange/shared/gsp/docs/GSP1-6_Background%20on%20Sustainable%20Devt.pdf. 85 Alexey Kuzmin. “Evaluation of the Regional Programme of Europe and Commonwealth of Independent States 2006-2010.” UNDP (December 2009). Last accessed October 11, 2011. http://europeandcis.undp.org/home/show/EE2AEDA1-F203-1EE9-BFF87665EC7E5DAB.

104
Statistical annex
Country 1990 1995 2000 2005 2009 a
Armenia 740 297 284 199 174Azerbaijan 759 895 571 354 190Belarus 684 570 418 322 250Georgia 411 447 259 180 151Kazakhstan 628 730 501 426 432Kyrgyzstan 676 424 325 299 265Republic of Moldova 582 646 472 416 319Russian Federation 470 547 491 384 328Tajikistan 327 360 347 243 207Turkmenistan 1427 1621 1388 731 605Ukraine 602 816 736 543 438Uzbekistan 1129 1278 1261 897 753
Albania 207 117 120 121 91Bosnia and Herzegovina .. 281 235 214 213Croatia 141 152 142 131 118Serbia 218 308 270 237 213The former Yugoslav Republic of Macedonia 156 199 184 186 173Turkey 120 120 122 108 112
Austria 125 122 112 124 112Belgium 193 199 188 174 160Bulgaria 435 402 321 262 216Cyprus 130 133 135 120 124Czech Republic 288 254 232 215 187Denmark 133 132 110 105 100Estonia 605 451 315 232 214Finland 246 259 227 212 201France 158 158 146 145 133Germany 172 148 134 131 121Greece 121 120 121 111 97Hungary 225 229 180 161 147Ireland 161 137 111 90 87Italy 109 111 109 111 102Latvia 292 299 184 147 127Lithuania 349 326 214 178 156Luxembourg 209 159 125 135 114Malta 143 112 84 102 88Netherlands 167 161 136 138 128Poland 331 286 197 176 147Portugal 104 115 114 118 105Romania 342 283 236 189 155Slovakia 324 314 259 216 164Slovenia 174 191 163 155 141Spain 117 122 121 119 103Sweden 224 231 184 175 145United Kingdom 152 147 128 113 99
Canada 279 283 252 241 214Iceland 320 340 369 336 509Israel 138 136 125 125 117Norway 154 143 132 122 115Switzerland 107 106 99 97 94United States 240 229 204 184 169
Source: MDG Database of the UN Statsitics Division
Annex Table 1
Energy use (kg oil equivalent) per $1,000 GDP (Constant 2005 PPP $)
EU 27
Other high income countries
South-Eastern Europe
Eastern Europe, Caucasus and Central Asia
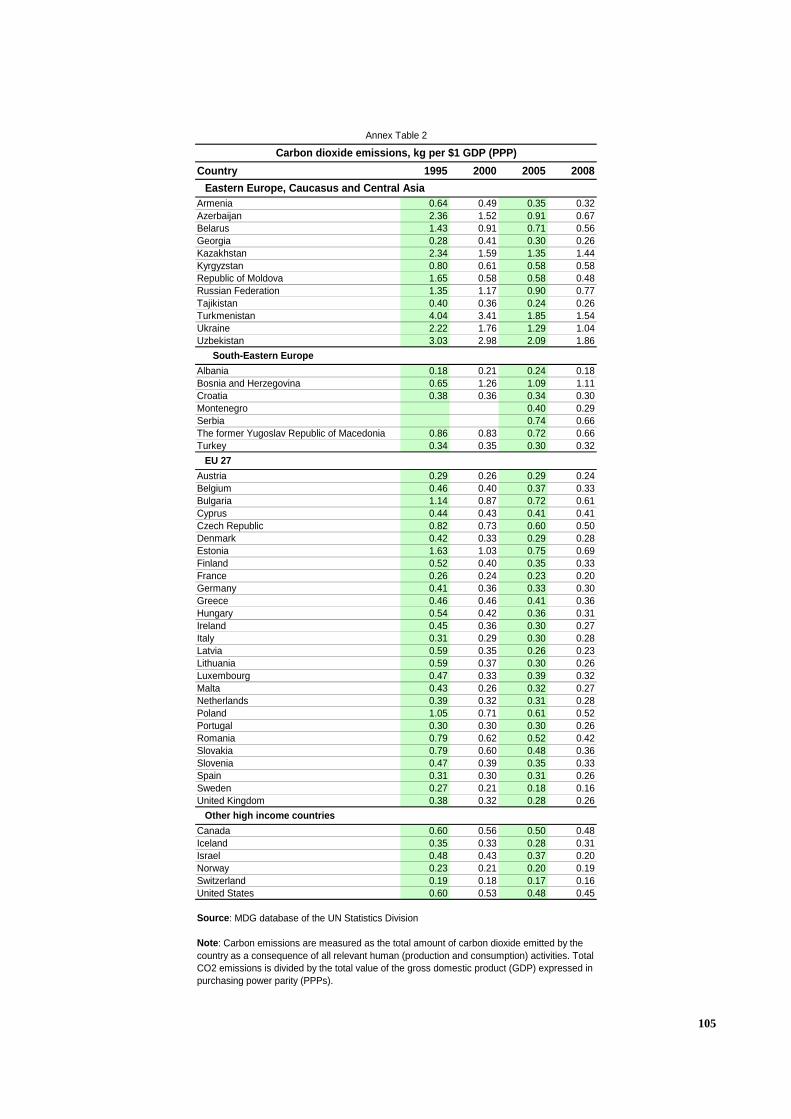
105
Country 1995 2000 2005 2008
Armenia 0.64 0.49 0.35 0.32Azerbaijan 2.36 1.52 0.91 0.67Belarus 1.43 0.91 0.71 0.56Georgia 0.28 0.41 0.30 0.26Kazakhstan 2.34 1.59 1.35 1.44Kyrgyzstan 0.80 0.61 0.58 0.58Republic of Moldova 1.65 0.58 0.58 0.48Russian Federation 1.35 1.17 0.90 0.77Tajikistan 0.40 0.36 0.24 0.26Turkmenistan 4.04 3.41 1.85 1.54Ukraine 2.22 1.76 1.29 1.04Uzbekistan 3.03 2.98 2.09 1.86
Albania 0.18 0.21 0.24 0.18Bosnia and Herzegovina 0.65 1.26 1.09 1.11Croatia 0.38 0.36 0.34 0.30Montenegro 0.40 0.29Serbia 0.74 0.66The former Yugoslav Republic of Macedonia 0.86 0.83 0.72 0.66Turkey 0.34 0.35 0.30 0.32
Austria 0.29 0.26 0.29 0.24Belgium 0.46 0.40 0.37 0.33Bulgaria 1.14 0.87 0.72 0.61Cyprus 0.44 0.43 0.41 0.41Czech Republic 0.82 0.73 0.60 0.50Denmark 0.42 0.33 0.29 0.28Estonia 1.63 1.03 0.75 0.69Finland 0.52 0.40 0.35 0.33France 0.26 0.24 0.23 0.20Germany 0.41 0.36 0.33 0.30Greece 0.46 0.46 0.41 0.36Hungary 0.54 0.42 0.36 0.31Ireland 0.45 0.36 0.30 0.27Italy 0.31 0.29 0.30 0.28Latvia 0.59 0.35 0.26 0.23Lithuania 0.59 0.37 0.30 0.26Luxembourg 0.47 0.33 0.39 0.32Malta 0.43 0.26 0.32 0.27Netherlands 0.39 0.32 0.31 0.28Poland 1.05 0.71 0.61 0.52Portugal 0.30 0.30 0.30 0.26Romania 0.79 0.62 0.52 0.42Slovakia 0.79 0.60 0.48 0.36Slovenia 0.47 0.39 0.35 0.33Spain 0.31 0.30 0.31 0.26Sweden 0.27 0.21 0.18 0.16United Kingdom 0.38 0.32 0.28 0.26
Canada 0.60 0.56 0.50 0.48Iceland 0.35 0.33 0.28 0.31Israel 0.48 0.43 0.37 0.20Norway 0.23 0.21 0.20 0.19Switzerland 0.19 0.18 0.17 0.16United States 0.60 0.53 0.48 0.45
Source: MDG database of the UN Statistics Division
Annex Table 2
South-Eastern Europe
EU 27
Note: Carbon emissions are measured as the total amount of carbon dioxide emitted by the country as a consequence of all relevant human (production and consumption) activities. Total CO2 emissions is divided by the total value of the gross domestic product (GDP) expressed in purchasing power parity (PPPs).
Other high income countries
Carbon dioxide emissions, kg per $1 GDP (PPP)
Eastern Europe, Caucasus and Central Asia

106
Annex Table 3 Change in CO2 emissions, 1990-2008Territorial emissions Consumption emissions
million tonnes per cent million tonnes per cent
Armenia -1 -20.4% 2 63.5%
Azerbaijan -21 -40.3% 1 3.6%
Belarus -38 -35.9% 5 8.2%
Georgia -3 -34.7% 4 74.3%
Kazakhstan -51 -19.1% -73 -29.4%
Kyrgyzstan -4 -38.7% 3 46.5%
Russian Federation -850 -34.8% -361 -21.5%
Ukraine -262 -45.8% -146 -36.4%
Albania -3 -42.3% -1 -20.7%
Croatia -2 -6.0% 4 16.7%
Turkey 147 100.6% 117 55.6%
Austria 11 18.3% -4 -4.0%
Belgium 7 6.8% 65 38.6%
Bulgaria -27 -35.0% -43 -45.0%
Cyprus 3 68.0% 1 13.7%
Czech Republic -51 -30.9% -62 -37.7%
Denmark -4 -7.9% 2 2.8%
Estonia -11 -38.7% 4 24.8%
Finland 5 10.6% -15 -15.4%
France -17 -4.4% -29 -5.1%
Germany -242 -23.9% -257 -20.5%
Greece 27 36.5% 37 43.0%
Hungary -6 -9.1% 4 5.6%
Ireland 12 37.8% 31 75.0%
Italy 33 7.8% 5 0.8%
Latvia -5 -41.9% 7 100.8%
Lithuania -9 -37.2% -18 -48.3%
Luxembourg 1 14.6% 7 66.9%
Malta 0 13.2% 4 126.9%
Netherlands 2 1.2% 12 5.7%
Poland -18 -5.1% -64 -18.4%
Portugal 13 28.8% 54 94.0%
Romania -69 -43.7% -75 -43.0%
Slovakia -16 -29.9% -10 -18.6%
Slovenia -2 -12.0% 1 5.5%
Spain 117 51.2% 160 57.1%
Sweden -4 -7.2% -12 -12.7%
United Kingdom -28 -4.9% 102 16.8%
Canada 113 25.2% 145 31.9%
Norway 9 27.7% 3 3.7%
Switzerland -2 -5.0% 8 8.0%
United States 809 16.6% 1215 24.6%
https://spreadsheets.google.com/spreadsheet/pub?hl=en&hl=en&key=0AonYZs4MzlZbdEFUSFhxTWFMTEV2Rmk1Z3d3dFJmOEE&output=html
Source: Global Trade Analysis Trade Project, Purdue University.
Eastern Europe, Caucasus and Central Asia
South-Eastern Europe
EU 27
Other high income countries

107
Annex Table 4 National targets on energy efficiency
Country Name of the program/law Nature of target Target value
Bulgaria
National Long Term Energy Efficiency Program, 2005-2015
Energy intensity reduction
-8%
Bulgaria
National Long Term Energy Efficiency Program, 2005-2016
Energy intensity reduction
-17%
Bulgaria National Energy Efficiency Action Plan Energy savings (rate)
9%
Croatia
National Energy Efficiency Action Plan Energy savings (rate) 14%
Czech Rep State Energy Policy Energy intensity reduction 3.22% Czech Rep
National Energy Efficiency Action Plan Energy savings (rate) 9%
Estonia
National Energy Efficiency Action Plan Energy savings (rate) 9%
Hungary
Energy Saving and Energy Efficiency Action Programme 1999- 2010
Energy intensity reduction
3.5% year
Hungary
National Energy Efficiency Action Plan Energy savings (rate) 9%
Latvia
National Energy Efficiency Action Plan Energy savings (rate) 9%
Lithuania
National Energy Efficiency Action Plan Energy savings (rate) 9%
Lithuania National Energy Strategy Energy intensity reduction EU average intensity
Poland
National Energy Efficiency Action Plan Energy savings (rate) 9%
Poland
Obligation of energy savings for energy companies (white certificates)
Energy savings (value)
Romania
National Strategy for Energy Efficiency (2004-2015)
Energy intensity reduction
40%
Romania National Energy Efficiency Action Plan Energy savings (rate) 14%
Russia
Energy Strategy of the Russian Federation (2009)
Energy intensity reduction -40%
Russia
Federal Law on Energy saving and energy efficiency improvement (2009)
Energy savings (rate)
Russia
Federal program Energy Efficient Economy (project)
Energy savings (rate)
Serbia Energy Strategy Implementation Programme
Energy savings (rate)
15%

108
Slovakia National Energy Efficiency Action Plan Energy savings (rate)
9%
Slovenia
National Energy Efficiency Action Plan Energy savings (rate) 9%
Slovenia National Energy Efficiency Action Plan Energy savings (rate) 18%
Slovenia Energy Act Turkey
Energy Efficiency Law 2007 Draft Energy Efficiency Strategy
na Energy intensity reduction
20% between 2011 -2023
Source: Adapted from WEC: Energy Efficiency: A recipe for Success, Annex 2, Overview of energy efficiency policies measures, Synthesis of the 2009 survey draft.

109
References
Chapter II
Madelaine Albright, Hernado de Soto, et al: Making the Law Work for Everyone—Report of the Legal Commission on Legal Empowerment of the Poor, UNDP, 2008.
Nancy Birdsall and Arvind Subramanian: Energy Needs and Efficiency, Not Emissions: Re-framing the Climate Change Narrative - Working Paper 187, Washington: Center for Global Development available at: http://www.cgdev.org/content/publications/detail/1423191
Gary Becker and Richard A. Posner: Uncommon Sense—Economic Insights from Marriage to Terrorism, The Chicago University Press, 2009
John Cassidy: How Markets Fail—The Logic of Economic Calamities, London: Penguin Books, 2009
William R. Cline: Carbon Abatement Costs and Climate Change Finance, Peterson Institute for International Economics, Policy Analyses in International Economics 96, July 2011
EBRD: The Low Carbon Transition; EBRD Special Report on Climate Change, London, 2010, available at: http://www.ebrd.com/downloads/research/transition/trsp.pdf
GSI (Global Subsidies Initiative): Defining Fossil-Fuel Subsidies for the G-20: Which
Approach is Best, Global Subsidies Initiative of the International Institute for Sustainable Development, Geneva, 2010.
Trevor Houser, Rob Bradley, Britt Childs, Jacob Werksman, Robert Heilmayr: Leveling The Carbon Playing Field—International Competition and US Climate Policy Design, Peterson Institute for International Economics and World Resources Institute, 2008
Inge Kaul and Pedro Conceicao, editors: The New Public Finance—Responding to Global Challenges, UNDP, 2006.
Mark Maslin: Global Warming—A Very Short Introduction, Oxford University Press
Mancur Olson: The Logic of Collective Action: Public Goods and the Theory of Groups, Cambridge: Harvard University Press, 1971
Elinor Ostrom: Governing the Commons: The Evolution of Institutions for Collective Action (Political Economy of Institutions and Decisions), Cambridge University Press, 1990
Steve Pacala, Robert Socolow: Stabilization Wedges: Solving the Climate Problem for the Next 50 Years with Current Technologies; Science, 13 August 2004: Vol. 305 #5686 pp. 968-972.
Friedrich Schneider: The Shadow Economy in Europe, 2010, published by A.T. Kearney, available at: http://media.hotnews.ro/media_server1/document-2011-05-8-8602544-0-shadow.pdf
TEEB – The Economics and Biodiversity Report for Policy Makers, 2009.
Michael P. Todaro and Stephen C. Smith: Economic Development, Essex, England: Pearson Education Ltd, 2009
UNDP Regional Bureau for Europe and CIS: Beyond Transition—Towards Inclusive Societies UNDP RBEC, 2011
UNECE and UNEP, Greening the economy: mainstreaming the environment into economic development, ECE/ASTANA.CONF/2011/4
UNEP and IEA: Reforming Energy Subsidies: An Explanatory Summary of the Issues and Challenges in Removing or Modifying Subsidies on Energy That Undermine the Pursuit of Sustainable Development, UNEP, Nairobi, 2002.
UNEP: Towards a Green Economy: Pathways to Sustainable Development and Poverty Eradication, United Nations Environment Programme, 2011.
UNEP: Towards a Green Economy: Pathways to Sustainable Development and Poverty Eradication—A Synthesis for Policy Makers, United Nations Environment Programme, 2011.
UNEP, Green Economy Success Stories from the UNECE Region, ECE/ASTANA.CONF/2011/INF/25
David Wheeler: Fair Shares: Crediting Poor Countries for Carbon Mitigation, CGD Working Paper 259, July 2011, Washington: Center for Global Development
WHO and the World Bank: World Report on Disability, 2011.

110
World Bank: Where is the Wealth of Nations? Measuring Capital for the 21st Century, 2006.
Michael P. Todaro and Stephen C. Smith: Economic Development, Essex, England: Pearson Education Ltd, 2009
UNDP Regional Bureau for Europe and CIS: Beyond Transition—Towards Inclusive Societies UNDP RBEC, 2011
UNECE and UNEP, Greening the economy: mainstreaming the environment into economic development, ECE/ASTANA.CONF/2011/4
UNEP and IEA: Reforming Energy Subsidies: An Explanatory Summary of the Issues and Challenges in Removing or Modifying Subsidies on Energy That Undermine the Pursuit of Sustainable Development, UNEP, Nairobi, 2002.
UNEP: Towards a Green Economy: Pathways to Sustainable Development and Poverty Eradication, United Nations Environment Programme, 2011.
UNEP: Towards a Green Economy: Pathways to Sustainable Development and Poverty Eradication—A Synthesis for Policy Makers, United Nations Environment Programme, 2011.
UNEP, Green Economy Success Stories from the UNECE Region, ECE/ASTANA.CONF/2011/INF/25
David Wheeler: Fair Shares: Crediting Poor Countries for Carbon Mitigation, CGD Working Paper 259, July 2011, Washington: Center for Global Development
WHO and the World Bank: World Report on Disability, 2011.
World Bank: Where is the Wealth of Nations? Measuring Capital for the 21st Century, 2006.
Chapter III
Brookes, L. (2000). Energy efficiency fallacies revisited. Energy Policy , 28, 355-366. Buchan David, 2010, Eastern Europe’s energy challenge: meeting its EU climate commitments EV 55, The Oxford
Institute for Energy Studies. Cantore, N., te Velde, D. W. (2011). ”Promoting energy efficiency in developing countries – new evidence based on
firm analysis”, Paper for UNIDO. Chenery H., S. Robinson and M. Syrquin, (1986). “Industrialization and growth, A Comparative Study,” Published for
the World Bank, Oxfrod University Press. EBRD. (2011). The Low Carbon Transition. 2011. EIA. (2003, June 02). Energy Efficiency Measurement Discussion. Retrieved July 9, 2009 from EIA:
http://www.ei.doe.gov/emeu/efficiency/measure_discussion.htm European Commission (2006) Directive 2006/32/EC of the European Parliament and of the Council on energy end-use
efficiency and energy services Retrieved ‘5 October 2011’ from (http://eur-law.eu/EN/Directive-2006-32-EC-European-Parliament-Council-5,289772,d)
European Bank for Reconstruction and Development, 2011, The Low Carbon Transition, London: EBRD European Environment Agency, Greenhouse gas emission trends and projections in Europe 2009, Annex 6, page 110 (See NEW Report From EEA PUBLISHED 7 October. European Environment Agency (2011), Final Energy Consumption Intensity (ENER 021), August 2011. IEA 2010 database <http://iea.uoregon.edu/page.php?file=home.htm&query=static (Accessed 10.June 2011)>. IEA. (2009). Boosting the economy with energy efficiency financing. Paris: International Energy Agency. IEA. (2007). Tracking Industrial Energy Efficiency and CO2 Emissions. Paris, France: IEA. IEA. (2008). World Energy Outlook 2008: Executive Summary. Paris: International Energy Agency. IEA. (2008). Worldwide Trends in Energy Use and Efficiency. Paris, France: IEA/OECD. IEA. (2007). Tracking Industrial Energy Efficiency and CO2 emissions. International Energy Agency: Paris, France. IEA. (2009). Boosting the economy with energy efficiency financing. Paris: International Energy Agency. Madlener, R., & Alcott, B. (2009). Energy Rebound and Economic Growth: A review of the main issues and research
needs. Energy , 34 (4), 370-76. McKane, A., Price, L., & de la Rue du Can, S. (2007). Policies for Promoting Industrial Energy Efficiency in
Developing Countries and Transition Economies. Vienna: UNIDO. Machlup, F. 1991. Economic Semantics, 2nd ed. Transaction Pub. Madlener, R., & Alcott, B. (2009). Energy Rebound and Economic Growth: A review of the main issues and research
needs. Energy, 34 (4), 370-76. Rifkin, J. 2011. The Third Industrial Revolution: How lateral power is transforming energy, the economy and the world. Basingstoke: Palgrave Macmillan

111
Sorrell, S. (2010). Jevons' Paradox revisited: The evidence for backfire from improved energy efficiency. Energy Policy , 37, 2310-2317.
Stern, N. (2007). The Economics of Climate Chnage: The Stern Review. Cambridge: Cambridge University Press. Silva E. G. and A.C. Teixeira, 2008, “Surveying structural change: Seminal contributions and a bibliometric account,”
Structural Change and Economic Dynamics 19. Syrquin, M. 2007. “Kuznets and Pasinetti on the study of structural transformation: Never the Twain shall meet?”
ICER, Working Paper No. 46. UNCTAD/WEF (2011). UNCTAD-World Investment Reports. From http://www.unctad.org/templates/Page.asp?intItemID=5545&lang=1, (Accessed 18. August 2011). UNECE (2010). The MDGs in Europe and Central Asia: Achievements, challenges and the way forward. New York
and Geneva: United Nations. UNECE. (2011). Greening the economy: mainstreaming the environment into economic development. Seventh
“Environment for Europe” Ministerial Conference, Astana, Kazakhstan, 21-23 September UNEP. (2002). Industry and environment (July-Dec), UN Commission on Sustainable Development, UNCSD UNEP. (2011b). Decoupling natural resource use and environmental impacts from economic growth, A Report of the
Working Group on Decoupling to the International Resource Panel. Fischer-Kowalski, M., Swilling, M., von Weizsäcker, E.U., Ren, Y., Moriguchi, Y., Crane, W., Krausmann, F., Eisenmenger, N., Giljum, S., Hennicke, P., Romero Lankao, P., Siriban.
UNEP/EEA (2007). Sustainable consumption and production in South East Europe, Caucasus and Central Asia- Joint UNEP-EEA report on the opportunities and lessons learned. No 3/2007, Copenhagen.
UNIDO (2009a). Industrial Development Report, UNIDO, Vienna. UNIDO (2009b). Structural Change in the World Economy: Main features and trends. Working paper 24/2009. Vienna. UNIDO (2011). Green Industry: A Key Pillar of a Green Economy’, Policy Brief UNIDO (2011).INDASTA database, 2-digit ISIC , Rev.3 WEC (2010). Energy Efficiency: A Recipe for Success -World Energy Council- For sustainable energy. London: World
Energy Council. WEF/Accenture (2009). Accelerating Smart Grid Investments. World Economic Forum in partnership with Accenture. Geneva. World Bank database. World Bank Data- Environment. From
http://databank.worldbank.org/ddp/editReport?REQUEST_SOURCE=search&CNO=2&&country=&series=EN.ATM.CO2E.EG.ZS&period=, (Accessed 18. July 2011).
World Energy Council. (2010). Energy Efficiency Policies around the World: Review and Evlauation. London: World Energy Council.
World Bank. (2010). Lights out: the outlook for Energy in Eastern Europe and the Former Soviet Union., Washington DC: The World Bank Group.
Chapter IV
EEA (2005) Household consumption and the environment. EEA Report No 11/2005. European Environment Agency, Copenhagen.
EEA (2007) Europe’s Environment: the Fourth Assessment. European Environment Agency, Copenhagen.
EEA and UNEP (2007) Sustainable consumption and production in South East Europe and Eastern Europe, Caucasus and Central Asia. Joint UNEP-EEA report on the opportunities and lessons learned.
MTFSBC (undated). Buildings for a Better Future. Marrakech Task Force on Sustainable Buildings and Construction.
OECD (2003) Voluntary Approaches for Environmental Policy – Effectiveness, Efficiency and Usage in Policy Mixes. Organisation for Economic Cooperation and Develoment, Paris.
OECD (2007) Policies for a Better Environment – Progress in Eastern Europe Caucasus and Central Asia. Organisation for Economic Cooperation and Develoment, Paris.
OECD (2011) Greening Household Behaviour – The Role of Public Policy. Organisation for Economic Cooperation and Develoment, Paris.

112
UNEP (2010) Assessing the Environmental Impacts of Consumption and Production: Priority Products and Materials.
UNEP (2011a) Green Economy Success Stories from the UNECE Region. Document submitted to the 7th Environment for Europe Ministerial Conference.
UNEP (2011b) Transport, Health and Environment: Boosting quality of life for children and youth, joint publication with WHO, UNECE, UITP, Austrian Federal Ministry of Agriculture, Forestry, Environment and Water management
UNEP (forthcoming) The Global Outlook on SCP Policies – Taking Action Together.
UNEP-CRI (forthcoming). Policies and Instruments Promoting Sustainable Consumption and Production in the UNECE region.
UNESCO (2009) Transport, Mining, Chemicals and Waste Management, and Sustainable Consumption and Production Patterns, Achievements, Trends and Challenges Paper for RIM Meeting 1-2 December, Geneva.
Chapter V, part B
Centre for Climate Change and Sustainable Energy Policy (2010). “Employment Impacts of a large-scale deep Building Energy Retrofit Programme in Hungary.
Broughton, Andrea (2009). “United Kingdom – Greening the European economy: Responses and Initiatives by Member States and social partners”. EURonline, available at http://www.eurofound.europa.eu/eiro/studies/tn0908019s/uk0908019q.htm (accessed on 24.10.2011).
EBRD (2003). Renewable Energy Resource Assessment: Stage1”.
EEA/UNEP (2007). “Sustainable consumption and production in South East Europe and Eastern Europe, Caucasus and Central Asia”.
Enerdata (2010). “Global Energy Statistic Yearbook 2010”.
EmployRES (2009). “The impact of renewable energy policy on economic growth and employment in the European Union”.
Ernst and Young (2006). “Eco Industry, Its Size, Employment, Perspectives and Barriers to Growth in an Enlarged EU”. DG Environment of the European Commission.
European Commission (2009). “Employment in Europe 2009”.
European Commission (2009b). “Industrial relations in Europe 2008”.
European Commission (2011). “Industrial relations in Europe 2010”.
European Trade Union Cooperation (2007). “Climate Change and employment, Impact on employment in the European Union-25 of climate change and CO2 emission reduction measures by 2030”.
Federal Ministry for the Environment, Nature Conservation and Nuclear Safety (2011). “Renewably employed, Short and long-term impacts of the expansion of renewable energy on the German labour market”.
GHK (2009). “Thematic Expert Work on Green Jobs for DG EMPL/D1”.
ILO (2010). “Global Employment Trends for Youth”.
ILO (2010b). “Climate change and labour: The need for a “just transition”.
ILO (2011). “Skills for Green Jobs: A Global View”.
IPCC (2007). “IPCC Fourth Assessment Report “.
ISTAS (2011). “Study on job creation in the sector of collective transport and within the scope of sustainable mobility”, available online at http://www.istas.net/web/index_imprimir.asp?idpagina=3835 (accessed on 24.10.2011).
Nesporova, Alena and Nero, V. William (2009). “Promoting decent employment in Eastern Europe, central Asia and Turkey”, ILO..

113
OECD (2003). Eberhard Jochem and Reinhard Madlener, The Forgotten Benefits of Climate Change Mitigation: Innovation, Technological Leapfrogging, Employment and Sustainable Development.
Rustico, Lisa and Francesca Sperotti (2011). Working Conditions in “Green Jobs”. Results from WiRES - Women in Renewable Energy Sector, available online at http://www.ituc-csi.org/a-green-economy-that-works-for.html?lang=en (accessed on 25.10.2011).
Seed Initiative (2011). “Seed Symposium: The Green Economy, Accelerating the Transition, Pretoria, South Africa – 15th April 2011”.
Suwala, Wojciech (2010). “Lessons learned from the restructuring of Poland’s coal-mining industry”. Global Studies Initiative. Switzerland.
Trades Union Congress (2008). “Go green at work: a handbook for union green representatives”.
Trade Union Congress (2008b). “A Green and Fair Future, For a Just Transition to a Low Carbon Economy”.
UNEP (2008). “Green Jobs: Towards decent work in a sustainable, low-carbon world”.
UNEP (2011a). “Towards a Green Economy: Pathways to Sustainable Development and Poverty Eradication”.
UNEP (2011b). “Organic Agriculture – A step towards the Green Economy in the Eastern Europe, Caucasus and Central Asia region”.
UNEP/UNCTAD (2010). “Organic Agriculture: Opportunities for Promoting Trade, Protecting the Environment and Reducing Poverty”.
World Bank (2003). “Final Report of the Extractive Industries Review”.
World Bank (2007). “Integrating Environment into Agriculture and Forestry Progress and Prospects in Eastern Europe and Central Asia”
World Coal Association (2011). “Coal Facts 2011”.
WWF (2009). “Low carbon Jobs for Europe: Current Opportunities and Future Prospects”.
Chapter V, part C
Beaglehole R et al., Lancet NCD Action Group, NCD Alliance (2011). Priority actions for the non-communicable disease crisis. Lancet, 377:1438–1447.
Confalonieri M et al. (2007). Human Health. In M.L. Parry, O.F. Canziani, J.P. Palutikof, P.J. van der Linden and C.E. Hanson (eds). Contribution of Working Group II to the Fourth Assessment Report of the Intergovernmental Panel on Climate Change, 2007. Cambridge University Press, Cambridge, United Kingdom and New York, NY, USA.
Commission on Social Determinants of Health (CSD) (2008) Closing the gap in a generation: health equity through action on the social determinants of health. Final report of the Commission on Social Determinants of Health. Geneva, World Health Organization.
Commission of the European Communities (2008). Commission Staff working doucment. Impact assessment. Document accompanying the Package of implementation measures for the EU’s objectives on climate change and renewable energy for 2020. European Commission, Brussels. (SEC (2008) 85/3).
European Commission (2003). Urban port and local socioeconomic development Trans S Econ Deliverable 7 Final Report status. Vienna,.2003 http://www.transport-research.info/Upload/Documents/200608/20060821_164149_75349_TRANSECON%20Final%20Report.pdf. Accessed 7 November 2011
European Union (2005). Public transport, the Lisbon Strategy and sustainable development. Brussels, European Union.
Friel S et al. (2009). Public health benefits of strategies to reduce greenhouse-gas emissions: food and agriculture. Lancet, 374:2016–2025.
Green G, Gilbertson J (2008). Health impact evaluation of the warm front scheme. Sheffield, Centre for Regional Social and Economic Research, Sheffield Hallam University.

114
Godlee F (2011). How on earth do we combat climate change? BMJ (Clinical Research Ed.), 343:d6789. 10.1136/bmj.d6789.
Haines A et al. (2009). Public health benefits of strategies to reduce greenhouse-gas emissions: overview and implications for policy makers. Lancet, 374(9707):2104.
Holland M, Menne B (unpublished). The health benefits of reducing greenhouse gas emissions in health care in 49 European countries. Copenhagen, WHO Regional Office for Europe.
IPCC (2007). Summary for Policy Makers. Synthesis Report. Cambridge, Cambridge University Press.
Jakab Z, Marmot M (2011). Social determinants of health in Europe. Lancet, S0140. 2011 Oct 18
Kickbusch I, Gleicher D (2011). Governance for health in the 21st century: a study conducted for the Copenhagen, WHO Regional Office for Europe , WHO Regional Office for Europe. http://www.euro.who.int/__data/assets/pdf_file/0010/148951/RC61_InfDoc6.pdf. Accessed 7 November 2011
Kumanyika S et al.; Public Health Approaches to the Prevention of Obesity (PHAPO) Working Group of the International Obesity Task Force (IOTF) (2002). Obesity prevention: the case for action. International journal of obesity and related metabolic disorders : journal of the International Association for the Study of Obesity, 26:425–436
Mackenbach JP, Meerding WJ, Kunst A (2007). Economic implications of socioeconomic inequalities in health in the European Union. Luxembourg, European Commission http://ec.europa.eu/health/archive/ph_determinants/socio_economics/documents/socioeco_inequalities_en.pdf . Accessed 7 November, 2011
Menne B et al. (2009). Protecting health in Europe from climate change. Copenhagen, WHO Regional Office for Europe. http://www.euro.who.int/__data/assets/pdf_file/0016/74401/E91865.pdf. Accessed 7 November, 2011
NHS Sustainable Development Unit (2011). Route map for sustainable health. Cambridge, NHS Sustainable Development Unit. http://www.sdu.nhs.uk/documents/routemap/Route_Map_FinalScreen.pdf Accessed 7 November, 2011. Accessed 7 November, 2011
Stuckler D, Basu S, McKee M (2010). Budget crises, health, and social welfare programmes. BMJ (Clinical Research Ed.), 340:c3311.
United Nations (1992). Earth Summit. Agenda 21. The United Nations Programme for Action from Rio. United Nations, Rio de Janeiro, Brazil. http://www.un.org/esa/dsd/agenda21/. Accessed 7 November 2011
United Nations (1992). Rio Declaration on Environment and Sustainable Development. United Nations publication, Sales No. E.73.II.A.14 and corrigendum. http://www.unep.org/Documents.Multilingual/Default.asp?documentid=78&articleid=1163. Accessed 7 November, 2011
United Nations (2010a). Sustainable development: from Brundtland to Rio 2012. United Nations Headquarters, New York. http://www.un.org/wcm/webdav/site/climatechange/shared/gsp/docs/GSP1-6_Background%20on%20Sustainable%20Devt.pdf. Accessed 7 November 2011
United Nations (2010b). Objective and themes of the United Nations Conference on Sustainable Development. Report of the Secretary-General at the Preparatory Committee for the United Nations Conference on Sustainable Development. Second session. A/CONF.216/PC/7
UNECE and WHO Regional Office for Europe (1999) Protocol on water and health. London, 1999. http://www.euro.who.int/__data/assets/pdf_file/0007/88603/E89602.pdf. Accessed 7 November, 2011
UNECE (2011). Greening the economy: mainstreaming the environment into economic development (ECE/ASTANA.CONF/2011/4). http://www.unece.org/fileadmin/DAM/env/efe/Astana/Tabs/fifth/ece.astana.conf.2011.inf.32.e.pdf UNECE, Astana.
World Bank (2009). Europe and Central Asia: overview [web site]. Washington, DC, World Bank.
World Economic Forum (2011). Global Risks 2011, 6th ed. Geneva, World Economic Forum.
WHO (1948). Constitution of the World Health Organization, Geneva, World Health Organization. http://apps.who.int/gb/bd/PDF/bd47/EN/constitution-en.pdf. Accessed 7th November 2011
115
WHO (2001). Health in the context of sustainable development: background document for the WHO Meeting “Making Health Central to Sustainable Development”, Oslo, Norway, 29 November-1 December 2001. Geneva, World Health Organization (WHO/HDE/HID/02.6).
WHO (2002). Health and Sustainable Development: Meeting of Senior Officials and Ministers of Health. Summary Report Johannesburg, South Africa 19-22 January 2002. Geneva, World Health Organization (WHO/SDE/HDE/02.7).
WHO (2002). The world health report 2002 – Reducing risks, promoting healthy life. Geneva, World Health Organization. http://www.who.int/whr/2002/en/. Accessed on 7 November 2011
WHO (2003). Framework Convention on Tobacco Control. Geneva, World Health Organization. http://www.who.int/tobacco/framework/WHO_FCTC_english.pdf. Accessed 7 November, 2011
WHO (2005). International Health Regulation. Geneva, World Health Organization. http://whqlibdoc.who.int/publications/2008/9789241580410_eng.pdf. Accessed 7 November, 2011.
WHO (2011). Health in the green economy: health co-benefits of climate change mitigation – housing sector. Geneva, World Health Organization. http://www.who.int/hia/hgehousing.pdf. Accessed 7 November 2011
WHO Regional Office for Europe (2008) WHO European Action Plan for Food and Nutrition Policy 2007-2012. Copenhagen, WHO Regional Office for Europe. http://www.euro.who.int/__data/assets/pdf_file/0017/74402/E91153.pdf. Accessed 7 November 2011
WHO Regional Office for Europe (2009) Handbook for action to reduce alcohol-related harm. Copenhagen, WHO Regional Office for Europe. www.euro.who.int/__data/assets/pdf_file/0012/43320/E92820.pdf. Accessed 7 November, 2011
WHO Regional Office for Europe (2010a). Millennium Development Goals in the WHO European Region. A situational analysis at the eve of the five-year countdown. Copenhagen, WHO Regional Office for Europe http://www.euro.who.int/__data/assets/pdf_file/0003/87438/E93723.pdf. Accessed 7 November 2011
WHO Regional Office for Europe (2010b). Burden of disease from environmental noise. Copenhagen, WHO Regional Office for Europe http://www.euro.who.int/__data/assets/pdf_file/0008/136466/e94888.pdf. Accessed 7 November 2011.
WHO Regional Office for Europe (2010c). Health and environment in Europe: progress assessment. Copenhagen, WHO Regional Office for Europe. http://www.euro.who.int/__data/assets/pdf_file/0010/96463/E93556.pdf. Accessed 7 November 2011
WHO Regional Office for Europe (2010d) Parma Declaration for Environment and Health. Copenhagen, WHO Regional Office for Europe. http://www.euro.who.int/__data/assets/pdf_file/0011/78608/E93618.pdf . Accessed 7 November 2011
WHO Regional Office for Europe (2010e) Protecting health in an environment challenged by climate change: European Regional Framework for Action. Parma, Italy. http://www.euro.who.int/__data/assets/pdf_file/0005/95882/Parma_EH_Conf_edoc06rev1.pdf. Accessed 7 November 2011
WHO Regional Office for Europe (2011a). Action Plan for Implementation of the European Strategy for the Prevention and Control of Noncommunicable Diseases 2012–2016. Copenhagen, WHO Regional Office for Europe. http://www.euro.who.int/__data/assets/pdf_file/0003/147729/wd12E_NCDs_111360_revision.pdf. Accessed 7 November 2011
WHO Regional Office for Europe (2011b) Interim report on implementation of the Tallinn Charter. Copenhagen, WHO Regional Office for Europe. http://www.euro.who.int/__data/assets/pdf_file/0019/134470/08E_InterimTallinn_110515-V2.pdf. Accessed 7 November 2011
WHO Regional Office for Europe (2011c). Exposure to air pollution (particulate matter) in outdoor air. Copenhagen, WHO Regional Office for Europe (ENHIS Fact Sheet 3.3 RPG3_Air_Ex2) http://www.euro.who.int/__data/assets/pdf_file/0018/97002/ENHIS_Factsheet_3.3_July_2011.pdf. Accessed 7 November 2011
WHO Regional Office for Europe (2011d). Challenges and opportunities in achieving the targets on water supply and sanitation and health. Copenhagen, WHO Regional Office for Europe.
116
WHO Regional Office for Europe (2011e). European strategic action plan on antibiotic resistance. Copenhagen, WHO Regional Office for Europe. http://www.euro.who.int/__data/assets/pdf_file/0008/147734/wd14E_AntibioticResistance_111380.pdf. Accessed 7 November 2011
WHO Regional Office for Europe (2011f). Examples of applications of the health economic assessment tool (HEAT) for cycling. Copenhagen, WHO Regional Office for Europe (http://www.euro.who.int/en/what-we-do/health-topics/environment-and-health/Transport-and-health/activities/promotion-of-safe-walking-and-cycling-in-urban-areas/quantifying-the-positive-health-effects-of-cycling-and-walking/health-economic-assessment-tool-heat-for-cycling-and-walking/examples-of-applications-of-heat-for-cycling, accessed 4 November 2011).
WHO Regional Office for Europe (2011g) European action plan to reduce the harmful use of alcohol 2012–2020. Copenhagen, WHO Regional Office for Europe (http://www.euro.who.int/en/who-we-are/governance/regional-committee-for-europe/sixty-first-session/documentation/working-documents/wd13-european-action-plan-to-reduce-the-harmful-use-of-alcohol-20122020, accessed 4 November 2011).
WHO Regional Office for Europe (2011h). The new European policy for health – Health 2020. Copenhagen, WHO Regional Office for Europe (EUR/RC61/Inf.Doc./4).
Whitehead M, Dahlgren G. (2007). Levelling up (part 1): a discussion paper on concepts and principles for tackling social inequities in health. Studies on social and economic determinants of population health, No.2, WHO Regional Office for Europe. http://www.euro.who.int/__data/assets/pdf_file/0010/74737/E89383.pdf
Wilkinson P et al. (2007). Energy, energy efficiency, and the built environment. Lancet, 370:1175–1187.
Wilkinson P et al. (2009). Public health benefits of strategies to reduce greenhouse-gas emissions: household energy. Lancet, 374:1917–1929.
Woodcock J et al. (2009). Public health benefits of strategies to reduce greenhouse-gas emissions: urban land transport. Lancet, 374:1930–1943.
Chapter VI
“Critical Issues in Implementation of Environmental Policy: Country Fiche, Uzbekistan.” Last accessed October 11, 2011. http://www.unece.org/fileadmin/DAM/env/epr/publications/Critical%20issues%20implementation%20EPR.pdf.
“Green Jobs.” International Labour Organization. www.ilo.org/greenjobs.
“Introducing Environmental Performance Reviews.” United Nations Economic Commision for Europe. http://www.unece.org/env/epr/welcome.htm.
“Item 4: Revised Baltic 21Triennial Report 2003-2005.” Senior Officials Group Twenty Fourth Meeting, Silja Line Ferry, May 22-23, 2006. SOG 24/4/1 Rev. 1. Last accessed October 11, 2011. s3.amazonaws.com/zanran_storage/www.baltic21.../50234476.pdf.
“Protecting children’s health in a changing environment.” World Health Organization. Fifth Ministerial Conference on Environment and Health. Parma, Italy, 10-12 March 2010. http://www.euro.who.int/en/what-we-do/event/fifth-ministerial-conference-on-environment-and-health.
“Review of EU Sustainable Development Strategy- Renewed Strategy.” The Council of the European Union (2006). DOC 10917/06. Last accessed October 11, 2011. http://register.consilium.europa.eu/pdf/en/06/st10/st10917.en06.pdf.
“Save Water Grow Green: Environement for Europe 7th Ministerial Conference, Astana Kazakhstan 21-23 September 2011.” eNewsletter. United Nations Economic Commission for Europe. http://www.unece.org/env/efe/Astana/InformalDocuments/AstanaNewsletter1.e.pdf.
“Structures of Sustainable Development.” Die Bundesregierung. Last accessed October 11, 2011. http://www.bundesregierung.de/nn_208962/Content/EN/StatischeSeiten/Schwerpunkte/Nachhaltigkeit/nachhaltigkeit-2007-04-13-strukturen-der-nachhaltigkeitspolitik.html.
“Summary of the seventh “Environment for Europe” Ministerial Conference.” Earth Negotiations Bulletin. IISD Reporting Services. Vol. 147, N. 04, 26 September 2011. http://www.iisd.ca/ymb/unece/efe7/html/ymbvol147num4e.html.

117
“The Mediterranean Strategy of Sustainable Development (MSSD)” UNEP Mediterranean Strategy of Sustainable Development. Last accessed October 11, 2011. http://www.unepmap.org/index.php?module=content2&catid=001017002001.
“The Mediterranean Strategy of Sustainable Development (MSSD)” UNEP Mediterranean Strategy of Sustainable Development. Last accessed October 11, 2011. http://www.planbleu.org/publications/smdd_uk.pdf.
“The Pan-European Programme on Transport, Health and Environment: Assessment and Progress Made.” United Nations Economic Commission for Europe. January 2008. http://www.unece.org/index.php?id=2527.
“We are Baltic 21.” Council of the Baltic Sea States. CBSS Secretariat, Stockholm. Last accessed October 11, 2011. http://www.cbss.org/Environment/creating-a-sustainable-baltic-sea-region.
Drexhage, John and Deborah Murphy. “Sustainable Development: From Brundtland to Rio 2012: Background Paper.” International Institute of Sustainable Development (September 2010). Last accessed October 11, 2011. http://www.un.org/wcm/webdav/site/climatechange/shared/gsp/docs/GSP1-6_Background%20on%20Sustainable%20Devt.pdf.
ECPR: European Consortium of Political Research. Last accessed October 11, 2011. http://www.essex.ac.uk/ecpr/events/generalconference/marburg/papers/8/5/hey.pdf.
Europa: Summaries of EU legislation. “Strategy for Sustainable Development.” Last accessed October 11, 2011. http://europa.eu/legislation_summaries/environment/sustainable_development/l28117_en.htm.
European Sustainability Development. “Coordinating SCP and CSR policies with Sustainable Development: Discussion Paper.” Prague, Czech Republic, 17‐19 June 2009. http://www.sdnetwork.eu/pdf/doc_prague/Discussion%20Paper_ESDN%202009_FINAL.pdf.
European Sustainable Development Network. “Mechanisms for Horizontal Integration.” ESDN Office Team. Last accessed October 11, 2011. http://www.sd-network.eu/?k=country%20profiles&s=horizontal%20integration.
European Sustainable Development Network. “Mechanisms of Horizontal Integration: Switzerland.” ESDN Office Team. Last accessed October 11, 2011. http://www.sd-network.eu/?k=country%20profiles&s=horizontal%20integration&country=Switzerland.
European Sustainable Development Network. “Mechanisms of Horizontal Integration: Sweden.” ESDN Office Team. Last accessed October 11, 2011. http://www.sd-network.eu/?k=country%20profiles&s=horizontal%20integration&country=Sweden.
European Sustainable Development Network. “Mechanisms of Horizontal Integration: Norway.” ESDN Office Team. Last accessed October 11, 2011. http://www.sd-network.eu/?k=country%20profiles&s=horizontal%20integration&country=Norway.
European Sustainable Development Network. “Mechanisms of Horizontal Integration: Austria.” ESDN Office Team. Last accessed October 11, 2011. http://www.sd-network.eu/?k=country%20profiles&s=horizontal%20integration&country=Austria.
Fall, Juliet. “Designing framework conventions to promote and support transboundary protected areas: theory and practice from the Carpathian Convention.” The Open University (2006). Last accessed October 11, 2011. http://www.unige.ch/ses/geo/collaborateurs/publicationsJF/Carpathian_convention.pdf.
Kuzmin. Alexey. “Evaluation of the Regional Programme of Europe and Commonwealth of Independent States 2006-2010.” UNDP (December 2009). Last accessed October 11, 2011. http://europeandcis.undp.org/home/show/EE2AEDA1-F203-1EE9-BFF87665EC7E5DAB.
Lafferty, William M. “Adapting Government Practice to the Goals of Sustainable Development.” OECD (2002): 1-34. http://www.oecd.org/dataoecd/30/54/1939762.pdf.
OECD Policy Brief. “Improving Policy Coherence and Integration for Sustainable Development A Checklist.” October 2002: 1-8. http://www.oecd.org/dataoecd/61/19/2763153.pdf.
Sandei, Pier Carlo. “UNEP’s current activities in south Eastern Europe.” UNEP Vienna. Last accessed October 11, 2011. http://webcache.googleusercontent.com/search?q=cache:4oLqeU_U2gQJ:mri.scnatweb.ch/download-document%3Fgid%3D813+legally+binding+convention+for+sustainable+development+of+the+Dinaric+Arc&cd=4&hl=en&ct=clnk&gl=ch.
Stevens, Candice. “Europe leads the world on sustainable development, but it could do better.” Europe’s World. Last Accessed October 11, 2011. http://webcache.googleusercontent.com/search?q=cache:Ijw9o-

118
AaKJwJ:www.europesworld.org/NewEnglish/Home_old/Article/tabid/191/ArticleType/articleview/ArticleID/21354/language/en-US/Default.aspx+Lisbon+Strategy+trumps+EU+Sustainable+Development+Strategy&cd=4&hl=en&ct=clnk&gl=ch&source=www.google.ch.
UNEP. “Successes, Challenges, and Future priorities of the Carpathian Convention.” Third Meeting of the Conference of the Parties 25-27 May, 2011, Bratislava. Last accessed October 11, 2011. http://www.carpathianconvention.org/NR/rdonlyres/15053CA0-5C5F-4ED2-BD77-F6A272FE1BB9/0/ISCC_presentationfinal.pdf.
United Nations 2011. “Rio+20 United Nations Conference on Sustainable Development.” Last Modified October 11, 2011. http://www.uncsd2012.org/rio20/index.php?page=view&nr=217&type=12&menu=23&template=435.