from the gr ve - californiaavocadogrowers.com · and improving grower sustainability. ... one of...
TRANSCRIPT

Gr veThe Latest News from the California Avocado Industry
From the
2 0 1 7 A N N U A L R E P O R T S P E C I A L E D I T I O N

VISION STATEMENTTo be recognized as the most-desired avocado
in the world by fostering a vibrant industry.
MISSION STATEMENTTo maximize grower returns
by enhancing premium brand positioning
for California avocados
and improving grower sustainability.

TABLE OF CONTENTSVISION STATEMENT � � � � � � � � � � � � 2
MISSION STATEMENT � � � � � � � � � � � 2
CHAIRMAN’S MESSAGE � � � � � � � � � � 4
PRESIDENT’S MESSAGE � � � � � � � � � � 5
THE YEAR IN REVIEW � � � � � � � � � � � 7Tactical Creativity and Industry Firsts � � � � � � � � � � � � � 8Trusted Messengers � � � � � � � � � � � � 9Not Your Parents’ Marketing Program � � � � � � � � � � � � � 10Online & Social Media Results � � � � � 12Expanding the Reach of Consumer Events � � � � � � � � � � � � 12Cross-platform Consumer and Retail Programs � � � � � � � � � � � � 13The “Where” and “Why” of Avocados � � � � � � � � � � � � � � � � � � 14
Preference for California Avocados Maintained � � � � 15Hands-on Learning Opportunities Take Shape at Pine Tree Ranch � � � � 16CAC-funded Research Provides Critical Tools and Answers � � � � � � � 16Congressional Efforts Intensify � � � � 17Communication Key to Navigating Food Safety and Water Issues � � � � � 18Future Forward � � � � � � � � � � � � � � � 18
FINANCIALS � � � � � � � � � � � � � � � � 19Independent Auditor’s Report � � � � � 21Management’s Discussion and Analysis � � � � � � � � � � � � � � � � � 24Basic Financial Statements � � � � � � � 29Supplementary Information � � � � � � � 44
INDUSTRY STATISTICS � � � � � � � � � � 51
3
CALIFORNIA AVOCADO COMMISSION ANN UAL REPORT 2017

CHAIRMAN’S MESSAGE
I do believe 2017 is a year that will be in the minds of growers and in the record books for quite some time. Now, as I write this message a few short days before Christmas, I don’t believe there has been a year that I will have been so happy to have over.
Going into the year the board and staff knew that we were facing a light crop. Programs were reviewed and trimmed where possible. Belts were tightened. As harvest in California started, though, very positive things began to happen as our California avocados hit the market. The consumers with educated palates, the buyers who know a good thing and those restaurants who want to put a quality avocado on the plate, all continued to demand California avocados. In the face of lower priced fruit from other sources, and ever higher prices for our crop, the buyers of quality paid for our fruit. In the end, we have booked the highest ever average price per pound for our fruit.
If we take a moment to review this past year, we have a few takeaways. We have known for years that California’s place in the market was going to continue to be a smaller percentage of the overall market. Our staff has planned and strategized, building programs to not only maintain, but build value for our crop. Over the years the board has overseen the
strategies and supported the staff in their direction. Has it always been easy? No. We have debated and pondered, fiddled, pushed and prodded but the plans and strategies have worked. In a year where we brought to market the smallest crop in a non-disaster year in decades, we not only held our own, but we gained. As growers, we can and should be proud of bringing some of the best avocados in the world to market. As California growers, we can and should be proud of having a marketing organization with foresight enough to bring us record returns in the face of smaller percentages in the marketplace.
I cannot end this column without a thought about the upcoming year. In this week before Christmas, I have spent the better part of too many days hiking the hills and surveying the damage from the record setting Thomas fire. Far too many friends, colleagues and fellow growers have been terribly touched by this fire and the Lilac fire as well. As I hike the hills, I can already see plants trying to regrow and get past the damage of the fire. As farmers we are inextricably linked to the natural cycles of nature. I can take comfort in the words of Canadian author Brian Brett: “Farming is a profession of hope.” Indeed it is.
“Farming is a profession
of hope�”
Rick ShadeChairman California Avocado Commission
— Canadian Author, BRIAN BRETT
FROM TH E GROVE SPECIAL EDITION
4

$75
$70
$65
$60
$55
$50
$45
$40
$35
$303/5 3/12 3/19 3/26 4/2 4/9 4/16 4/23 4/30 5/7 5/14 5/21 5/28 6/4 6/11 6/18 6/25 7/2 7/9 7/16 7/23 7/30 8/6 8/13 8/20 8/27
PRESIDENT’S MESSAGE
Farming, like life, is a balancing act. You take the good with the bad, prepare for variables you can and cannot control, learn from your mistakes and move slowly, but steadily, along the tightrope path of the growing season.
As we walked our drought-stressed groves in November 2016, the prospect before us seemed grim — how would our short crop fare in an increasingly global market churning out avocados to meet demand in the United States? With furrowed brow, we faced the 2016-17 season.
And then the winter rains came. Our soils were leached of the salts they’d accumulated during five years of drought and our fruit began to size beyond our expectations. With a sizeable portion of our water cares alleviated, we took a step forward.
As the season progressed, however, avocado import volume stumbled due to a poor season in the southern hemisphere and late sizing. With average weekly
U.S. avocado consumption at 42 million pounds, demand consistently outpaced supply throughout the 2016-17 season. Surprisingly, what could have been a stumbling block was instead a launching pad. Price surges caused by the metrics of supply and demand lasted for an unprecedented five months and the season closed out with California avocados securing the highest average price per pound on record.
Our ability to secure a premium price isn’t merely an accident. During the past few years, as social media and digital platforms began to revolutionize marketing, we adapted accordingly integrating traditional and non-traditional marketing strategies. The timing of this evolution has been fortuitous for the California Avocado Commission (CAC), as it has allowed us to shift the balance in favor of highly targetable, resource-efficient, nimble marketing strategies that reach our targeted consumers no matter where they are.
Tom BellamorePresident California Avocado Commission
FOB of avocados shipped within California by week 2017 California Season (March - August)
CALIFORNIA IMPORT
California avocados delivered higher FOB prices, when compared to imports, for every week of the 2017 California season.
Source: AMRIC Hass #1 Conventional (pounds) Mar-Aug 2017
5
CALIFORNIA AVOCADO COMMISSION ANN UAL REPORT 2017

But fortuitous timing is only part of it. The Commission’s marketing team has — with undaunted reserves of ingenuity — sought and mastered every opportunity these new platforms present. Thanks to years of hard work we have an arsenal of precious tools at hand: a robust social media presence, highly recognizable marketing assets, a reputation as a trusted industry leader and long-established partnerships.
Through our tiered marketing programs we’ve firmly demonstrated to our partners that the California Avocados brand and our customized marketing strategies deliver reliable quality and value. What we lack in volume, we make up for in impact. And thus, in a short crop season plagued by supply issues, we remained relevant to our targeted retailers, foodservice operators and consumers while securing a premium price for our product.
Turns out, we’re pretty good at balancing along that tightrope thanks to years of preparation and plenty of trial and error. This year, the scales tipped in our favor; another year, they may not. But we have demonstrated we are here to stay. As small as we may be, we can utilize social media, digital and outreach opportunities to magnify our presence, make our voice heard and connect one-on-one with those who matter the most: premium California avocado fans.
“� � � we can magnify our presence, make our voice heard
and connect one-on-one with those who matter the most:
premium California avocado fans�”
CALIFORNIA AVOCADO COMMISSION BOARD OF DIRECTORS FISCAL YEAR 2016–17
AFFILIATION POSITION NAME
PRODUCER, DISTRICT 1 MEMBER JOHN BURR
PRODUCER, DISTRICT 1 MEMBER JESSICA HUNTER
PRODUCER, DISTRICT 1 ALTERNATE RYAN ROCHEFORT
PRODUCER, DISTRICT 2 MEMBER KELLEN NEWHOUSE
PRODUCER, DISTRICT 2 MEMBER LEO MCGUIRE
PRODUCER, DISTRICT 2 ALTERNATE OHANNES KARAOGHLANIAN
PRODUCER, DISTRICT 3 MEMBER ART BLISS
PRODUCER, DISTRICT 3 MEMBER JOHN LAMB
PRODUCER, DISTRICT 3 ALTERNATE ROBERT GRETHER
PRODUCER, DISTRICT 4 MEMBER JASON COLE
PRODUCER, DISTRICT 4 MEMBER ED MCFADDEN
PRODUCER, DISTRICT 4 ALTERNATE BRYCE BANNATYNE, JR.
PRODUCER, DISTRICT 5 MEMBER TYLER COBB
PRODUCER, DISTRICT 5 MEMBER RICK SHADE
PRODUCER, DISTRICT 5 ALTERNATE BRADLEY MILES
HANDLER MEMBER GARY CALOROSO
HANDLER MEMBER STEVE TAFT
HANDLER MEMBER ROBB BERTELS
HANDLER MEMBER EGIDIO “GENE” CARBONE
HANDLER ALTERNATE GARY CLEVENGER
HANDLER ALTERNATE DONNY LUCY
PUBLIC MEMBER NINA AMES
FROM TH E GROVE SPECIAL EDITION
6

THE YEAR IN REVIEW
The 2017 season will go down in the record books
as a remarkable success. Though there were
challenges, the year was characterized primarily
by good fortune and hard-earned victories. Robust
winter rainfall alleviated the stresses inflicted on our groves
by five years of drought. California avocado FOB prices for
fruit shipped within California were, on average, 14 percent
higher — and as much as 25 percent higher — than
imports every week of the season, reaching an average
price of $1.60 per pound, nearly 25 percent higher than the
previous season’s average and an all-time record.
Over the years, as California’s share of the U.S. avocado
market has declined due to increased global imports, some
have speculated whether the California avocado industry
would still “be around.” It was a legitimate question.
But as California’s percentage in the market declined,
the California Avocado Commission’s responsiveness,
resourcefulness, adaptability and progressive strategic
initiatives continued to evolve. Fortuitously, new digital and
social media marketing tools that allowed CAC to efficiently
target audiences for the greatest impact emerged during
the same period of time.
7
CALIFORNIA AVOCADO COMMISSION ANN UAL REPORT 2017
7

Tactical Creativity and Industry FirstsWith a smaller budget due to projected crop size, the Commission’s marketing team launched a California-focused marketing campaign leveraging reprised assets from the “Made of California” consumer and trade ad campaigns. The CAC campaign also added engaging new creative for targeted social media and digital marketing strategies. With limited supplies of California avocados in the market, the Commission launched geo-targeted social media campaigns and geo-fenced ads to ensure consumers knew when and where California avocados were available.
The Commission’s strategic approach showcased its creativity and resulted in a positive impact on the industry. CAC was the first advertiser to run a Pin to Pinterest activation on Pandora (audio) that allowed listeners to “pin” a California avocado recipe to their personal digital scrapbooking board. Another innovative industry first was the Commission’s partnership with renowned chocolatier Compartés to develop the first chocolate bar to incorporate California avocados. The one-of-a-kind White Chocolate and California Avocado Bars were noted as one of the best bridal shower favors by Good Housekeeping magazine and received coverage by influential media such as Food & Wine. And for the sixth year in a row, the Commission secured the Produce Business Marketing Excellence award.
ADVERTISING RESULTS
CONSUMER IMPRESSIONSPrint: 900,000 (April - July) Outdoor: 25.9 Million Pandora: 19.5 Million Digital: 61.7 Million (and 3 Million Video Views) Social: 33.1 Million In-store radio: 206 Million Retail Social on CAC Platforms: 30.6 Million Retail Social on Retail Platforms: 28.1 Million
RETAIL TRADE IMPRESSIONSPrint and Digital: 8.7 Million
FOODSERVICE IMPRESSIONS870,000
FROM TH E GROVE SPECIAL EDITION
8

Trusted MessengersThe Commission reinforced its position as a trusted avocado expert, established and renewed relationships with industry leaders and partners, and advanced California avocados’ brand messaging by participating in respected industry coalitions and events.
The Commission’s visibility and trusted leadership serves CAC well in the Public Relations (PR) arena. Besides sharing content positioning California avocados as part of the quintessential California lifestyle, various consumer and trade media outlets turned to the Commission for expert insights concerning avocado varieties, nutritional information, recipes and the history of the Hass avocado. When faced with unfavorable coverage
in the media — high avocado prices or unreliable supplies — the Commission was able to offer a balanced and informed perspective through interviews.
In addition, CAC’s new community management tool — which aggregates all Instagram, Twitter and Facebook avocado conversations and allows CAC to monitor relevant “avocado” threads — helped CAC respond promptly to social media discussions and improve social media customer service drastically. For example, when “avocado hand” injury articles became a trending topic on social media and digital platforms, CAC seized the opportunity to promote its safer “nick and peel” method and drive traffic to CaliforniaAvocado.com.
CAC Retail Marketing Director Connie Stukenberg was installed as chair of the Fresh Produce and Floral Council (FPFC), Jan DeLyser was a featured FPFC speaker and California avocado grower Ed McFadden served as an FPFC panelist.
Jan DeLyser, CAC vice president marketing, was a panelist on a United FreshMKT Expo education session for women in produce at the United Fresh produce convention.
CONSUMER5 Artisan Chefs3 Press Releases40 Blogger Posts30 The Scoop Blog Posts745.7 Million Print, Broadcast, Online and Social Media Impressions
RETAIL8 Press Releases8.6 Million Impressions
FOODSERVICE50 PR and Editorial Placements2.9 Million Impressions
PUBLIC RELATIONS RESULTS
9
CALIFORNIA AVOCADO COMMISSION ANN UAL REPORT 2017

Not Your Parents’ Marketing ProgramIncreasingly, consumers rely on digital and social media platforms as their go-to news, recipe, event and information sources. They also utilize those same platforms to share their interests, experiences and lifestyle choices with friends. As consumers’ use of social media has changed, so too have CAC’s marketing tactics. Today CAC’s traditional marketing platforms — outdoor ads, radio, in-store events,
Content partners distributed California avocado messaging that was authentically woven into popular editorial streams.
Digital ads on social media channels and digital content providers were used to build awareness of the California avocado season and drove traffic to the CaliforniaAvocado.com website.
Grand Central Market chef partners showcased unique California avocado dishes on their menus, digital and social media channels.
California avocado fans (and avocado industry stakeholders, like Gene Carbone, pictured here) shared selfies on social media.
CAC shared a podcast on Twitter noting how parents can incorporate avocados into a baby’s diet.
CAC encouraged its social media fans to find California avocados at their local stores with the Commission’s Store Locator Tool.
Blogger partner Kirbie’s Cravings celebrated California Avocado Month by posting her Avocado Coconut Smoothie Bowls recipe on her blog and social media channels.
Dietitian Katie Ferraro’s guest blog post on The Scoop netted 70,000 impressions and gathered another 120,000 impressions after she promoted the blog on Instagram.
Merging traditional marketing programs with innovative digital and social media platforms has allowed CAC to reach consumers in unprecedented ways. Each digital and social media platform has a unique character and attracts different audiences, providing CAC with an opportunity
FROM TH E GROVE SPECIAL EDITION
10

California avocado fans pinned their favorite California avocado recipes to their boards on Pinterest, a virtual scrapbooking platform.
CAC shared the Fallbrook Avocado Festival experience with “fans” _ those at the event and those unable to attend _ with Instagram photo and video stories that garnered 30,000 organic (unpaid) impressions.
CAC hosted a Facebook Live video event where Bonnie Taub-Dix (MA, RD, CDN) shared nutritional information and California avocado recipe tips while answering fans’ questions. The video received 92,000 views.
Instagram influencer Lee Tilghman crafted and shared beautiful food images featuring California avocados.
Keeping with the United Plates of America summer road trip theme, CAC engaged California avocado fans with polls about regional cuisines they sampled while vacationing.
Manuel Villacorta (MS, RD) featured California avocado recipes on YouTube while discussing ways to reboot gut health with California avocados, and his social media posts reached more than 15,000 users.
Dietitian Michelle Dudash prepared Asian Brown Rice Noodle Salad with California Avocados on TV, garnering 10,000 impressions. She also shared her recipe on her blog and Facebook page.
to emotionally connect with California avocado fans on the platforms of their choice and encouraging brand preference by providing them with engaging, trusted, trend-setting, easy-to-share content. Examples of various programs are showcased here.
limited-time menu offers and avocado festivals — are seamlessly integrated with relevant, interesting and entertaining content that is easily shareable by California avocado fans, thus deepening emotional engagement with targeted audiences.
11
CALIFORNIA AVOCADO COMMISSION ANN UAL REPORT 2017

Online & Social Media Results
Expanding the Reach of Consumer EventsThe Commission has sponsored and attended California avocado-branded events and festivals for many years because they provide CAC staff, handlers and growers with a unique opportunity to meet consumers face-to-face. But now, CAC’s use of social media has transformed events from “must be there to experience it” moments, to digital experiences that can be enjoyed and shared by all fans at any time.
The Commission shared event-relevant content leading up to, during and after each event they participated in so that fans could like, comment on and share it. For those in attendance, the Commission offered trend-setting, creative social media tools — like California avocado-branded Snapchat filters — allowing fans to “dress up” their event photos and posts with California Avocados’ brand messaging. Because of CAC’s robust social media campaigns, California
avocado fans could “participate” in the event whether they attended or not.
One prime example of this was CAC’s participation in the dineLA Summer Road Trip — a dining event showcasing diverse California avocado menu items at some of the best eateries in the area. Through a combination of media and influencer preview dinners, chef spokesperson recipe promotions, email blasts and social media posts, the dineLA pre-event promotions secured 506 million social media impressions; Instagram influencer and coverage of the event generated another 326 million social media impressions.
CAC also joined Grammy-award winner — and California avocado grower — Jason Mraz, food writers, media, community members and growers for the O’side Feast hosted at Mraz Family Farms to celebrate sustainable farming and California avocados.
CONSUMER WEBSITE 2.6 Million Visits 3.4 Million Total Page Views
SOCIAL MEDIAFacebook Fans: 330,500 (5% increase over 2016)
Facebook Impressions: 14.4 Million (-13% decrease over 2016)
Twitter Followers: 18,500 (21% increase over 2016)
Twitter Retweets: 9,100 (1,010% increase over 2016)
YouTube Subscribers: 674 (37% increase over 2016)
YouTube Views: 797,400 (1,903% increase over 2016)
Instagram Followers: 38,500 (13% increase over 2016)
Instagram Impressions: 13 Million (250% increase over 2016)
THE SCOOP BLOG 659,000 Visits
EMAIL 18 Emails sent to an average of 350,000 successful deliveries
FROM TH E GROVE SPECIAL EDITION
12

Cross-platform Consumer and Retail ProgramsBy expanding and integrating its use of digital and social media platforms, the Commission has crafted powerful cross-platform consumer and trade marketing programs that effectively reach consumers no matter where they are — in the store, at home or on the move.
As part of its American Summer Holidays promotion, CAC developed the
United Plates of America program — a road-trip themed campaign featuring recipes that blended regional culinary favorites from across the United States with California avocados. The Commission engaged with fans via social media posts and polls. At retail locations the campaign used POS materials, recipe booklets and in-store radio ads. Additional support from
Pandora audio banners and digital ads directed consumers to CAC’s store locator tool. Overall, more than 23.5 million in-store, audio, digital and social media impressions were generated during the American Summer Holidays period.
CALIFORNIA AVOCADO MONTH — INTEGRATED CONSUMER & RETAIL PROMOTIONS
In total, California Avocado Month garnered more than 41 million PR impressions, with social media content reaching more than 232,000 users. Media coverage of the Grand Central Market sponsorship exceeded 82 million impressions. California avocado dishes with an international flare were available throughout the month of June at participating vendors at Los Angeles’ Grand Central Market. CAC’s blogger spokespersons, Registered Dietitian partners and Instagram influencers incorporated the international food hall trend with their own blog and social media posts.
Vons marketing team members and blogger influencers toured a California avocado grove and shared photos and insights on their blogs and social media channels.
CAC kicked off the campaign with a Grand Central Market media event. Attendees visited each venue tasting, photographing and sharing social media posts of the avocado-centric dishes. CAC’s hashtag and Snapchat filter provided California avocado brand identification.
Targeted retailers hosted display and sales contests, events, demo programs, sweepstakes and giveaways while celebrating the fruit on their social media channels.
13
CALIFORNIA AVOCADO COMMISSION ANN UAL REPORT 2017

The “Where” and “Why” of AvocadosNow in its third year, CAC’s tiered marketing program is a blend of science and artistry; timing, procurement, demographic, behavioral, location and performance data are used to target when and where advertising and promotional support are delivered. As part of online marketing partnerships with retail and foodservice partners, California Avocados brand messaging and each specific retailer’s or foodservice operator’s objectives and branding standards are melded to create appealing marketing communication. CAC’s season-long monitoring ensures the customized programs are adjusted accordingly to deliver the highest value and impact.
To create awareness of California
avocado availability and drive sales at retail partner locations in season, both the Commission and its retail partners incorporated messaging into their marketing programs that directed consumers to CAC’s Store Locator Tool, housed on the CaliforniaAvocado.com website. Geo-targeted social media posts and ads also alerted fans of the fruit’s availability when they were within a three-mile radius of select retail locations. Overall, store locator posts reached more than 523,000 fans on Instagram, Twitter and Facebook.
In light of the FDA change to the official avocado serving size (from 1/5 to 1/3), as well as FDA approval of the use of the word “healthy” in reference to
avocados, the Commission enhanced its efforts to share California avocado nutritional information. CAC’s participation in the Produce for Better Health Foundation (PBH) played a beneficial role in disseminating information. CAC met with Supermarket Dietitians (SDs) at the PBH Annual meeting to provide input concerning California avocado messaging on a wide range of promotional activities tailored specifically to each retailer. At the Produce Marketing Association’s Fresh Summit, CAC hosted an SD educational session with nationally recognized, award-winning registered dietitian-nutritionist and author Manuel Villacorta entitled, “Healthy Gut Reboot with California Avocados.”
CAC’s Big Game Day promotions resulted in sales increases for participating accounts. CAC’s customer-specific Big Game Day social media posts garnered more than 95,000 impressions.
Partner social media posts shared recipes from CaliforniaAvocado.com while promoting Memorial Day demos at local stores. Nearly 190,000 California avocados were sold during the promotion and social media impressions exceeded 71,000.
FROM TH E GROVE SPECIAL EDITION
14

On the foodservice side, the Commission hosted collaborative menu ideation sessions, solidified handler commitments to ensure optimal
promotional timing and worked one-on-one with the operators to create customized promotional plans that incorporated limited-time-offer menus
with point-of-sale materials featuring the California Avocados brand logo, free standing inserts, coupons, eblasts and social media posts.
Preference for California Avocados MaintainedCalifornia is the brand of avocados that most avocado shoppers prefer, according to the 2017 California Avocado Tracking Study. This preference was maintained despite declining percent of market share and a reduced marketing budget based on smaller crop volume in 2017.
Survey respondents indicated they strongly associate California avocados with summer and American summer holidays, showing that CAC’s efforts to link California avocados with seasonal availability are bearing fruit. Another positive finding from the tracking study is that consumers increasingly opt to serve avocados in new ways.
According to the study, social media channels are popular with respondents. The most popular platforms were Facebook and YouTube — with 72 percent using
Facebook on a weekly basis (58 percent noted they visit it daily) and 56 percent visiting YouTube on a weekly basis.
Morrison’s Healthcare celebrated Avocado Super Food Month with an avocado-centric menu including Avocado Hummus and Avocado Chocolate Pudding.
Fresh, produce- rich Power Bowls showcasing globally-inspired flavors paired with California avocados were available at 194 California Pizza Kitchen locations.
Awareness of California avocados occurs across all of CAC’s social
media channels, with Facebook the most common source.
PERCENT WHO SAW REFERENCE TO CALIFORNIA AVOCADOS (AMONG SITE USERS)
Facebook 23%
Instagram 19%
Pinterest 16% YouTube
15%
Twitter 17%
Snapchat
9%
15
CALIFORNIA AVOCADO COMMISSION ANN UAL REPORT 2017

CAC-funded Research Provides Critical Tools and AnswersThis year, two CAC-funded research projects came to conclusion, providing California avocado growers with critical information that will help them address grove management issues in the future.
After five years gathering data from hundreds of trees across major avocado production areas, Dr. David Crowley’s team released the Decision Support Tools for Management of Avocado Nutrition and
Chloride Toxicity: Final Report. Findings from the CAC-funded project have been utilized in the development of an online Decision Support Tool that can be used by California avocado growers to optimize nutrient and salinity management in a cost-effective manner.
Dr. Gary Bender and his team also completed a five-year high-density grove research project designed to produce the maximum amount of fruit per acre on a sustained basis. The researchers compared pruning methods and tracked labor and irrigation costs associated with 10’ x 10’ groves. Findings showed that the test groves produced an increase in dollars earned per acre, indicating that high-density production is a viable means of increasing per-acre income to help offset rising water costs.
CAC’s online Decision Support Tool website will provide growers the ability to create a personalized account to input information unique to their grove and receive suggestions for nutrient optimization.
Hands-on Learning Opportunities Take Shape at Pine Tree RanchSince 2014, the Commission has hosted a series of California avocado field day sessions at Pine Tree Ranch to provide growers with access to the latest CAC-funded research and cultural management best practices. This year, new on-site
trials were established to investigate the concerns that most consistently plague California avocado growers.
To research grove rehabilitation, a two-acre block of mature trees was parsed into quadrants that will be rehabbed using
four different methods, with data collected concerning input costs and production records.
Utilizing funds from a California Department of Food and Agriculture specialty crop block grant, CAC installed an irrigation trial on the premises. A one-acre block was divided into four different irrigation zones, one traditional irrigation zone and three automated zones that will utilize different soil moisture sensors for testing purposes.
Another test plot was planted with University of California-Riverside and South African rootstocks, while yet another section of the grove is being monitored to test the pros and cons of berm planting.
Pine Tree Ranch field day sessions covered topics including winter grove preparation, irrigation management and cost-sharing programs, crop estimating, reading avocado trees, rehabbing groves, high- density plantings, soil moisture sensors and shot hole borer.
FROM TH E GROVE SPECIAL EDITION
16

Congressional Efforts IntensifyThe Commission is well positioned with all levels of government and has consistently engaged with members of Congress to advocate on behalf of California avocado growers, but this year those efforts intensified in response to the new administration’s actions concerning immigration and NAFTA. Labor shortages — a perennial concern for growers — came to the fore this year as reports of Immigration and Customs Enforcement (ICE) raids on undocumented workers created anxiety in laborers’ communities, making them unwilling to move around for fear of possible enforcement action. The Commission met with many congressional
members — including Representatives Jimmy Panetta, Salud Carbajal, David Valadao, Devin Nunes, Julia Brownley and Senator Diane Feinstein — to discuss the dire agricultural labor situation and the need for a solution that includes a modernized visa program, a means of allowing current law-abiding workers to remain in a guest worker capacity and a less onerous H2A system.
CAC’s Vice President of Industry Affairs Ken Melban, voiced California avocado growers’ concerns regarding NAFTA renegotiations as a member of the Agricultural Technical Advisory Committee (ATAC) for Fruits and Vegetables. CAC, like
ATAC, adopted a “Do No Harm” position noting that overall U.S. agriculture has benefitted from NAFTA and that changes to the agreement — such as tariffs — could have adverse effects on market stability, the price of California avocados, and export opportunities.
The Commission also partnered with the California Citrus Quality Council (CCQC) on a four-day citrus and avocado grove tour designed to encourage farmers and members of numerous regulatory agencies to discuss the challenges of production agriculture and regulatory issues.
As part of the CCQC tour, CAC and California avocado growers joined staff from the Environmental Protection Agency, the U.S. Department of Agriculture’s Animal and Plant Health Inspection Service, Foreign Agriculture Service and the California Department of Food and Agriculture on a grove tour.
CAC hosted two grower seminars concerning immigration and the H2A Temporary Agricultural Workers program.
Congressional members, like Representative Salud Carbajal, toured groves with growers and discussed the crucial role migrant workers play in harvesting the fruit and the challeng-es of the current H2A Program.
17
CALIFORNIA AVOCADO COMMISSION ANN UAL REPORT 2017

Communication Key to Navigating Food Safety and Water IssuesThe large turnout at CAC’s food safety workshops was a clear indicator that California avocado growers are committed to strengthening our premium brand by certifying our practices are safe. The workshops covered changes made to the Food Safety Modernization Act and CAC’s
implementation of the Global Food Safety Initiative audit process.
CAC staff and local growers also attended a meeting hosted by Supervisor Peter Foy and successfully argued that agricultural customers’ interruptible water deliveries should secure them a different
cost of service rate and should exempt them from storage costs. As a result, the Ventura County Waterworks District 1 approved a 25 percent reduction in water rates for agricultural use.
Future ForwardBecause the Commission has immersed itself — at many levels — in the broad fabric of the agricultural industry, we have become adept at sensing large-scale change and proactively shaping the horizons of the avocado industry with precision and efficiency.
This year, CAC operated with a newly streamlined 22-member board and oriented our governance and budgeting structure for two organizational changes took place on November 1, 2017: implementation of a 19-member board and a modified “producer” definition that
exempted growers who produce less than 10,000 pounds annually (based on a three-year rolling average) from payment of CAC assessments.
Both the grower website and From the Grove were redesigned to align with the new corporate and marketing brand platforms. Because of the increased use of mobile devices, the refreshed grower website was also made more mobile friendly and responsive, to ensure easy access to content.
April Aymami, CAC industry affairs director, was honored by Produce Business
for her trend-setting leadership as one of the 40 under Forty winners.
And as is our wont, the Commission looked forward. Ultimately, our industry will not survive if we do not look to our younger generation of growers and talent. To that end, the Commission put into place contingency plans, secured leadership opportunities for up-and-coming staff and made renewed efforts to engage the next generation in the business of growing the “most-desired avocado in the world.”
In a nod to the importance of CAC’s social media campaigns, the redesigned grower website showcases the Commission’s live digital feeds.
CAC’s Online Marketing Director Zac Benedict shared his expertise with a new generation of industry leaders as an FPFC Apprentice Program Commission/Association panel member.
FROM TH E GROVE SPECIAL EDITION
18

CALIFORNIA AVOCADO COMMISSION
Annual Financial Report and Independent Auditor’s Report
For the years ended October 31, 2017 and 2016
19

CALIFORNIA AVOCADO COMMISSION
Table of Contents
Page
Independent Auditor’s Report ....................................................................................................................... 1
Management’s Discussion and Analysis (Required Supplementary Information - Unaudited) ................... 4
Basic Financial Statements
Statements of Net Position ................................................................................................................... 11
Statements of Revenues, Expenses and Changes in Net Position ........................................................ 12
Statements of Cash Flows .................................................................................................................... 13
Notes to Basic Financial Statements .................................................................................................... 15
Supplementary Information Budgetary Comparison Schedule ......................................................................................................... 29
Note to Supplementary Information .................................................................................................... 30
Combining Statement of Revenues, Expenses and Changes in Net Position ...................................... 31
Schedule of Program Expenses ............................................................................................................ 32
Other Reports
Independent Auditor’s Report on Internal Control Over Financial Reporting and on Compliance and Other Matters Based on an Audit of Financial Statements Performed in Accordance With Government Auditing Standards ....................................................................... 33
20
21
24
30
31
32
33
45
46
47
48
49

www.mgocpa.com Macias Gini & O’Connell LLP 4675 MacArthur Court, Suite 600 Newport Beach, CA 92660
1
Independent Auditor’s Report
Board of Directors California Avocado Commission Irvine, California
Report on the Financial Statements
We have audited the accompanying financial statements of the California Avocado Commission (Commission), as of and for the years ended October 31, 2017 and 2016, and the related notes to the financial statements, which collectively comprise the Commission’s basic financial statements as listed in the table of contents.
Management’s Responsibility for the Financial Statements
Management is responsible for the preparation and fair presentation of these financial statements in accordance with accounting principles generally accepted in the United States of America; this includes the design, implementation, and maintenance of internal control relevant to the preparation and fair presentation of financial statements that are free from material misstatement, whether due to fraud or error.
Auditor’s Responsibility
Our responsibility is to express an opinion on these financial statements based on our audits. We conducted our audits in accordance with auditing standards generally accepted in the United States of America and the standards applicable to financial audits contained in Government Auditing Standards,issued by the Comptroller General of the United States. Those standards require that we plan and perform the audit to obtain reasonable assurance about whether the financial statements are free from material misstatement.
An audit involves performing procedures to obtain audit evidence about the amounts and disclosures in the financial statements. The procedures selected depend on the auditor’s judgment, including the assessment of the risks of material misstatement of the financial statements, whether due to fraud or error. In making those risk assessments, the auditor considers internal control relevant to the Commission’s preparation and fair presentation of the financial statements in order to design audit procedures that are appropriate in the circumstances, but not for the purpose of expressing an opinion on the effectiveness of the Commission’s internal control. Accordingly, we express no such opinion. An audit also includes evaluating the appropriateness of accounting policies used and the reasonableness of significant accounting estimates made by management, as well as evaluating the overall presentation of the financial statements.
We believe that the audit evidence we have obtained is sufficient and appropriate to provide a basis for our audit opinion.
21

2
Opinion
In our opinion, the financial statements referred to above present fairly, in all material respects, the financial position of the California Avocado Commission, as of October 31, 2017 and 2016, and the respective changes in its financial position and its cash flows for the years then ended in accordance with accounting principles generally accepted in the United States of America.
Other Matters
Required Supplementary Information
Accounting principles generally accepted in the United States of America require that the management’s discussion and analysis, as listed in the table of contents, be presented to supplement the basic financial statements. Such information, although not a part of the basic financial statements, is required by the Governmental Accounting Standards Board, who considers it to be an essential part of financial reporting for placing the basic financial statements in an appropriate operational, economic, or historical context. We have applied certain limited procedures to the required supplementary information in accordance with auditing standards generally accepted in the United States of America, which consisted of inquiries of management about the methods of preparing the information and comparing the information for consistency with management’s responses to our inquiries, the basic financial statements, and other knowledge we obtained during our audit of the basic financial statements. We do not express an opinion or provide any assurance on the information because the limited procedures do not provide us with sufficient evidence to express an opinion or provide any assurance.
Other Information
Our audits were conducted for the purpose of forming an opinion on the Commission’s basic financial statements. The budgetary comparison schedule, combining statement of revenues, expenses and changes in net position, and schedule of program expenses (Schedules), as listed in the table of contents, are presented for purposes of additional analysis and are not a required part of the basic financial statements.
The Schedules are the responsibility of management and were derived from and relate directly to the underlying accounting and other records used to prepare the basic financial statements. The information has been subjected to the auditing procedures applied in the audit of the basic financial statements and certain additional procedures, including comparing and reconciling such information directly to the underlying accounting and other records used to prepare the basic financial statements or to the basic financial statements themselves, and other additional procedures in accordance with auditing standards generally accepted in the United States of America. In our opinion, the Schedules are fairly stated, in all material respects, in relation to the basic financial statements as a whole.
22

3
Other Reporting Required by Government Auditing Standards
In accordance with Government Auditing Standards, we have also issued our report dated January 29, 2018, on our consideration of the Commission’s internal control over financial reporting and on our tests of its compliance with certain provisions of laws, regulations, contracts, and grant agreements and other matters. The purpose of that report is solely to describe the scope of our testing of internal control over financial reporting and compliance and the results of that testing, and not to provide an opinion on the effectiveness of the Commission’s internal control over financial reporting or on compliance. That report is an integral part of an audit performed in accordance with Government Auditing Standards in considering the Commission’s internal control over financial reporting and compliance.
Newport Beach, California January 29, 2018
23

CALIFORNIA AVOCADO COMMISSION Management’s Discussion and Analysis
For the Years Ended October 31, 2017 and 2016 (Unaudited)
4
INTRODUCTION
Management’s Discussion and Analysis (MD&A) provides an overview and analysis of the financial activities of the California Avocado Commission (Commission) for the years ended October 31, 2017 and 2016. It has been prepared by management and is required supplementary information to the financial statements. Please read it in conjunction with the financial statements identified in the accompanying table of contents.
FINANCIAL HIGHLIGHTS
The Commission’s 2017 assets exceeded its liabilities as of October 31, 2017 by $11,116,774 (total net position). This amount increased $482,442 or 5% from the prior year amount of $10,634,332.
Of the total net position at the end of fiscal year 2017, net investment in capital assets increased $25,616 to $80,019 or 47% from the prior year amount of $54,403.
Net position restricted for marketing at the end of fiscal year 2017 increased $417,430 to $3,307,657 or 14% from the prior year amount of $2,890,227.
Unrestricted net position at the end of fiscal year 2017 increased $39,396 to $7,729,098 or .5% from the prior year amount of $7,689,702. This amount made up 70% of total net position.
The Commission’s 2016 assets exceeded its liabilities as of October 31, 2016 by $10,634,332 (total net position). This amount increased $4,492,172 or 73% from the prior year amount of $6,142,160.
Of the total net position at the end of fiscal year 2016, net investment in capital assets decreased $7,143 to $54,403 or 12% from the prior year amount of $61,546.
Net position restricted for marketing at the end of fiscal year 2016 increased $1,843,076 to $2,890,227 or 176% from the prior year amount of $1,047,151.
Unrestricted net position at the end of fiscal year 2016 increased $2,656,239 to $7,689,702 or 53% from the prior year amount of $5,033,463. This amount made up 72% of total net position.
OVERVIEW OF THE BASIC FINANCIAL STATEMENTS
This MD&A is intended to serve as an introduction to the Commission’s financial report. The Commission’s financial report includes three basic financial statements: Statements of Net Position; Statements of Revenues, Expenses and Changes in Net Position; and Statements of Cash Flows. The Commission’s basic financial statements also include notes to the financial statements. Financial statements are designed to present a broad overview of the financial data for the Commission, in a manner similar to a private-sector business.
The Statements of Net Position present information on all assets and liabilities of the Commission, using the accrual basis of accounting, with the difference reported as net position. Over time, increases or decreases in net position may serve as a useful indicator of the current financial condition of the Commission.
24

CALIFORNIA AVOCADO COMMISSION Management’s Discussion and Analysis
For the Years Ended October 31, 2017 and 2016 (Unaudited)
5
The Statements of Revenues, Expenses and Changes in Net Position present information showing how the Commission’s net position varied during the most recent fiscal year. All changes in net position are reported as soon as the underlying event giving rise to the change occurs, regardless of the timing of related cash flows.
The Statements of Cash Flows present changes in cash and cash equivalents resulting from operating, non-capital financing, capital financing and investing activities.
The notes to the basic financial statements provide additional information that is essential to a full understanding of the information provided in the financial statements.
Other Information:
In addition to the MD&A, the financial statements also present the following supplementary information: Budgetary Comparison Schedule; Combining Statement of Revenues, Expenses and Changes in Net Position (broken down by Restricted and Unrestricted); Schedule of Program Expenses (Restricted) and the Independent Auditor’s Report on Compliance.
FINANCIAL ANALYSIS
Comparative data for the prior year ended October 31, 2016, has been presented in the accompanying financial statements (including MD&A) to facilitate financial analysis for the current year ended October 31, 2017. A comparative analysis of fiscal year 2016 with fiscal year 2015 is also presented in the MD&A.
STATEMENTS OF NET POSITION:
2017 2016 2015 Current assets Capital assets, net
$13,155,432 80,019
$13,052,257 54,403
$8,486,636 61,546
Total assets 13,235,451 13,106,660 8,548,182
Current liabilities Noncurrent liabilities
2,047,856 70,821
2,425,146 47,182
2,359,255 46,767
Total liabilities 2,118,677 2,472,328 2,406,022
Net position: Net investment in capital assets Restricted for marketing Unrestricted
80,019 3,307,657 7,729,098
54,403 2,890,227 7,689,702
61,546 1,047,151 5,033,463
Total net position $11,116,774 $10,634,332 $6,142,160
25

CALIFORNIA AVOCADO COMMISSION Management’s Discussion and Analysis
For the Years Ended October 31, 2017 and 2016 (Unaudited)
6
As noted earlier, net position may serve over time as a useful indicator of the Commission’s financial position. The largest portion (99%) of the Commission’s assets are current assets consisting primarily of cash and cash equivalents, receivables and fiduciary cash amounts held for the Avocado Inspection Program (AIP). Current assets at the end of fiscal year 2017 totaled $13,155,432, increasing $103,175 from the prior year amount of $13,052,257. Total current assets cover current liabilities 6.4 times, indicating good liquidity.
At the end of fiscal year 2016, the largest portion (99.6%) of the Commission’s assets are current assets consisting primarily of cash and cash equivalents, receivables and fiduciary cash amounts held for Avocado Inspection Program (AIP). Current assets at the end of fiscal year 2016 totaled $13,052,257, increasing $4,565,621 from the prior year amount of $8,486,636. This increase is primarily due to higher total production volume which is reflected in the increased cash and assessments receivable balance. Total current assets cover current liabilities 5.4 times, indicating good liquidity.
The Commission’s liabilities primarily consist of current liabilities including accounts payable, accrued liabilities, deposits due and fiduciary liability amounts held for AIP. Liabilities at the end of fiscal year 2017 totaled $2,118,677 decreasing from a balance of $2,472,328 in 2016. This decrease was due to lower marketing and non-marketing obligations owed to vendors. Liabilities at the end of fiscal year 2016 totaled $2,472,328 increasing from a balance of $2,406,022 in 2015. This increase was due to higher non-marketing obligations owed to vendors.
Net position consists of three categories: Net investment in capital assets, restricted for marketing and unrestricted.
Net investment in capital assets represents the Commission’s capital assets net of accumulated depreciation and outstanding principal balances of debt attributable to the acquisition, construction, or improvement of those assets. Net position invested in capital assets totaled $80,019 at the end of fiscal year 2017, increasing $25,616 from the prior year amount of $54,403. This increase is due to the acquisition of capital assets. Net investment in capital assets represents 0.7% of total net position.
At the end of fiscal year 2016, net investment in capital assets totaled $54,403, decreasing $7,143 from the prior year amount of $61,546. This decrease is due to the accumulated depreciation of capital assets as a result of current year depreciation expense. Net investment in capital assets represents 0.5% of total net position.
Restricted net position for marketing activities is subject to imposed restrictions by federal statute governing their use. Restricted net position totaled $3,307,657 at the end of 2017, increasing $417,430 from the prior year amount of $2,890,227, and increasing $1,843,076 from 2015. Restricted net position represents 30% of total net position.
Unrestricted net position available for future activities at the end of fiscal year 2017 totaled $7,729,098, increasing $39,396 from the prior year amount of $7,689,702. Unrestricted net position available for future activities at the end of fiscal year 2016 totaled $7,689,702, increasing $2,656,239 from the prior year amount of $5,033,463.
26

CALIFORNIA AVOCADO COMMISSION Management’s Discussion and Analysis
For the Years Ended October 31, 2017 and 2016 (Unaudited)
7
STATEMENTS OF REVENUES, EXPENSES AND CHANGES IN NET POSITION:
2017 2016 2015 Operating revenues Operating expenses
$12,161,600 12,193,171
$17,348,241 13,144,755
$12,628,419 14,717,545
Operating income (loss) (31,571) 4,203,486 (2,089,126)
Nonoperating revenues 514,013 288,686 164,915 Change in net position 482,442 4,492,172 (1,924,211)
Net position – beginning of year 10,634,332 6,142,160 8,066,371 Net position – end of year $11,116,774 $10,634,332 $6,142,160
Operating revenues totaled $12,161,600 in 2017, decreasing $5,186,641 or 30% from $17,348,241 earned in 2016. This decrease is due to a decrease in assessment revenue received due to smaller total crop volume; 216 million pounds were reported in 2017 as compared to 401 million pounds in 2016. The majority of operating revenue consisted of assessment revenue, totaling $12,100,603 (99.5%). The remaining portion of $60,997 (0.5%) was from administrative fees generated from AIP.
Operating revenues totaled $17,348,241 in 2016, increasing $4,719,822 or 37% from $12,628,419 earned in 2015. This increase is due to an increase in assessment revenue received due to larger total crop volume; 401 million pounds were reported in 2016 as compared to 279 million pounds in 2015. The majority of operating revenue consisted of assessment revenue, totaling $17,262,241 (99.5%). The remaining portion of $86,000 (0.5%) was from administrative fees generated from AIP.
Operating expenses totaled $12,193,171 in 2017, decreasing $951,584 or 7% from $13,144,755 in 2016. This decrease is primarily due to decreased activities in marketing programs in 2017. Operating expenses totaled $13,144,755 in 2016, decreasing $1,572,790 or 11% from $14,717,545 in 2015. This decrease is primarily due to decreased activities in both marketing and non-marketing programs in 2016.
At the end of the fiscal year 2017, the Commission reported an ending net position of $11,116,774, an increase of $482,442 from the prior year amount of $10,634,332. This is primarily due to a greater decrease in expenditures for marketing programs than the decrease in assessment revenue received.
At the end of the fiscal year 2016, the Commission reported an ending net position of $10,634,332, an increase of $4,492,172 from the prior year amount of $6,142,160. This is primarily due to an increase in assessment revenue received, resulting from increased total volume production, as aforementioned.
CAPITAL ASSET AND DEBT ADMINISTRATION
Capital Assets - The Commission’s net investment in capital assets totaled $80,019 as of October 31, 2017, increasing $25,616 from the prior year amount of $54,403, and $18,473 from $61,546 in 2015 (net of accumulated depreciation). This increase represents the acquisition of capital assets during the fiscal year.
27

CALIFORNIA AVOCADO COMMISSION Management’s Discussion and Analysis
For the Years Ended October 31, 2017 and 2016 (Unaudited)
8
Compensated Absences - At the end of fiscal year 2017, the Commission accumulated an accrued compensated absences balance of $180,775; an increase of $17,301 from the prior year balance of $163,474. This increase is due to unused vacation time by employees. At the end of fiscal year 2016, the Commission accumulated an accrued compensated absences balance of $163,474; an increase of $13,502 from the prior year balance of $149,972. This increase is due to unused vacation time by employees.
CONTACTING THE COMMISSION’S FINANCIAL MANAGEMENT
This financial report is designed to provide a general overview of the Commission’s finances and to show the Commission’s accountability for the money it receives. Questions concerning any of the information provided in this report or requests for additional financial information should be addressed to California Avocado Commission, 12 Mauchly, Suite L, Irvine, California 92618; phone number 949-341-1955.
28

9
BASIC FINANCIAL STATEMENTS
29

CALIFORNIA AVOCADO COMMISSIONStatements of Net PositionOctober 31, 2017 and 2016
2017 2016Current assets:
Cash and cash equivalents 8,527,091$ 8,380,161$ Assessments receivable 1,574 81,584 Other receivables 158,767 65,591 Prepaid expenses 59,753 365,622 Fiduciary cash and cash equivalents,
amounts held for AIP 816,486 914,493 Restricted:
Cash and cash equivalents 3,544,216 2,986,481 Assessments receivable 47,545 258,325
Total current assets 13,155,432 13,052,257
Noncurrent assets:Capital assets being depreciated, net 80,019 54,403
Total assets 13,235,451 13,106,660
Current liabilities:Accounts payable and accrued liabilities 819,312 1,021,782 Accounts payable and accrued liabilities,
payable from restricted assets 284,104 354,579 Fiduciary liabilities, amounts held for AIP 816,486 914,493 Deposits 18,000 18,000 Compensated absences, due within one year 109,954 116,292
Total current liabilities 2,047,856 2,425,146
Noncurrent liabilities:Compensated absences, due in more than one year 70,821 47,182
Total liabilities 2,118,677 2,472,328
Net position:Net investment in capital assets 80,019 54,403 Restricted for marketing 3,307,657 2,890,227 Unrestricted 7,729,098 7,689,702
Net position 11,116,774$ 10,634,332$
See accompanying notes to the basic financial statements.
11 30

CALIFORNIA AVOCADO COMMISSIONStatements of Revenues, Expenses and Changes in Net Position
For the Years Ended October 31, 2017 and 2016
2017 2016Operating revenues:
Assessment revenue 7,951,777$ 9,493,670$ HAB rebate assessment revenue (restricted) 4,148,826 7,768,571 Administrative and marketing fees 60,997 86,000
Total operating revenues 12,161,600 17,348,241
Operating expenses:Marketing 7,028,805 8,192,468 Nonmarketing programs 1,579,060 1,806,463 Administration 3,585,306 3,145,824
Total operating expenses 12,193,171 13,144,755
Operating income (loss) (31,571) 4,203,486
Nonoperating revenues:Interest income 28,320 14,661 Grant Income 323,618 270,214 Other income 162,075 3,811
Total nonoperating revenues 514,013 288,686
Change in net position 482,442 4,492,172
Net position, beginning of year 10,634,332 6,142,160
Net position, end of year 11,116,774$ 10,634,332$
See accompanying notes to the basic financial statements.
12 31

CALIFORNIA AVOCADO COMMISSIONStatements of Cash Flows
For the Years Ended October 31, 2017 and 2016
2017 2016Cash flows from operating activities:
Cash received from customers 12,261,206$ 17,064,551$ Cash payments to suppliers for goods and services (9,333,067) (10,841,430) Cash payments to employees for services (2,799,818) (2,451,288)
Net cash provided by operating activities 128,321 3,771,833
Cash flows from non-capital financing activities:Proceeds from grants 323,618 270,214 Other Income 161,835 3,811
Net cash provided by non-capital financing activities 485,453 274,025
Cash flows from capital and related financing activities:Purchases of capital assets (35,676) (886) Proceeds from sale of assets 240 -
Net cash used by capital and relatedfinancing activities (35,436) (886)
Cash flows from investing activities:Interest on investments 28,320 14,661
Net increase in cash and cash equivalents 606,658 4,059,633
Cash and cash equivalents, beginning of year 12,281,135 8,221,502
Cash and cash equivalents, end of year 12,887,793$ 12,281,135$
Reconciliation of operating income (loss) to net cash provided by operating activities:
Operating income (loss) (31,571)$ 4,203,486$
Adjustments to reconcile operating income (loss) tonet cash provided by (used in) operating activities:Depreciation expense 10,060 8,029 Changes in assets and liabilities:
(Increase) decrease in assessments receivable 290,790 (205,290) (Increase) decrease in other receivables (93,176) 10,883 (Increase) decrease in prepaid expenses 305,869 (311,581) Increase (decrease) in accounts payable and accrued liabilities (272,945) 142,087 Increase (decrease) in fiduciary liabilities (98,007) (89,283) Increase (decrease) in compensated absences 17,301 13,502
Net cash provided by operating activities 128,321$ 3,771,833$
See accompanying notes to the basic financial statements.
13
32

CALIFORNIA AVOCADO COMMISSION Notes to Basic Financial Statements
October 31, 2017 and 2016
15
(1) SUMMARY OF SIGNIFICANT ACCOUNTING POLICIES
The following is a summary of the significant accounting policies followed by the California Avocado Commission (Commission):
(a) Activities of the Commission
The California Avocado Commission is authorized under California law to engage in programs of advertising, promotion, marketing research, and production research related to the sale of California avocados. The Commission is authorized to levy an assessment against producers of avocados for the purposes of carrying out its programs. The assessment for the years ended October 31, 2017 and 2016, was 2.30% of the gross revenues received by producers. The Commission also receives 85% of the assessments collected by the Federal Hass Avocado Board (HAB) on Hass avocados produced and sold in California, which is restricted for use on marketing activities.
(b) Measurement Focus, Basis of Accounting, and Financial Statement Presentation
The Commission operates as an enterprise activity. An enterprise fund accounts for operations that are financed and operated in a manner similar to private business enterprises, where the intent of the Board of Directors is that the costs (expenses, including depreciation) of providing services to the industry on a continuing basis be financed or recovered primarily through assessment revenues.
Enterprise funds distinguish operating revenues and expenses from nonoperating items. Operating revenues and expenses generally result from providing services and producing and delivering goods in connection with an enterprise fund’s principal ongoing operations. The principal operating revenues of the Commission are assessment revenues and administrative and marketing fees. Operating expenses for enterprise funds include the cost of marketing programs, production research, industry affairs and administrative expenses, including depreciation on capital assets. All revenues and expenses not meeting this definition are reported as nonoperating revenues and expenses.
Basis of accounting refers to when revenues and expenses are recognized in the accounts and reported in the financial statements. Enterprise funds are accounted for on the flow of economic resources measurement focus and use the accrual basis of accounting, whereby revenues are recognized when earned, and expenses are recognized when incurred, regardless of the timing of related cash flows.
When both restricted and unrestricted resources are available for use, it is the Commission’s policy to use restricted resources first, then unrestricted resources as they are needed.
33

CALIFORNIA AVOCADO COMMISSION Notes to Basic Financial Statements (Continued)
October 31, 2017 and 2016
16
(c) Assets, Liabilities, and Net Position
1. Cash Equivalents
For purposes of the statements of cash flows, the Commission considers cash and funds invested in the Local Agency Investment Fund (LAIF) of the State of California for both restricted and unrestricted funds to be cash equivalents. Additionally, investments with original maturities of three months or less at the time of purchase are considered cash equivalents.
2. Investments
The Commission values its investment in accordance with the provision of Governmental Accounting Standards Board (GASB) Statement No. 72, Fair Value Measurement and Application, which requires entities to use valuation techniques that are appropriate under the circumstances and for which sufficient data are available to measure fair value. Investments that are not traded on a market, such as investments in external pools, are valued based on the stated fair value as represented by the external pool. Restricted and unrestricted cash are pooled for investment purposes.
3. Receivables
No allowance for uncollectible accounts has been recorded for the years ended October 31, 2017 and 2016. Management has evaluated the accounts and believes they are all collectible. Management evaluates all accounts receivable, and if it is determined that they are uncollectible, they are written off directly as a bad debt expense.
4. Capital Assets
Capital assets consist of furniture, office equipment, leasehold improvements, software, and land improvements. The Commission capitalizes assets with values of $10,000 or more and useful lives of greater than one year. Capital assets are valued at cost, or estimated historical cost, if actual historical cost is not available. Contributed assets are recorded at acquisition value on the date donated. Capital assets acquired through lease obligations are valued at the present value of future lease payments at the date acquired. Capital assets are depreciated on the straight-line basis, using the following asset lives:
Asset CategoryFurniture 5 Office equipment 3 Leasehold improvements 5 (or term of lease, whichever is less)Software 3 Land Improvements Remaining term of the property lease
Years
34

CALIFORNIA AVOCADO COMMISSION Notes to Basic Financial Statements (Continued)
October 31, 2017 and 2016
17
(d) Reclassifications
Certain reclassifications have been made to the prior year financial statements to conform to the current year presentation. These reclassifications resulted in no impact to the prior year net position or the change in net position.
5. Compensated Absences
Commission employees receive from 10 to 20 days of vacation each year, depending upon length of service. An employee may accumulate earned vacation time to a maximum of 40 days. Once an employee accrues 40 days of unused vacation time, the Commission compensates the employee 10 days of accrued and unused vacation time at the employee’s current rate of pay. Upon termination, employees are paid for all accrued, but unused vacation at their current rate of pay.
Compensated absences include accrued vacation that is available to employees in future years, either as time off or in cash (upon leaving the employment of the Commission). All compensated absences are accrued when incurred.
6. Estimates
The preparation of financial statements in conformity with accounting principles generally accepted in the United States of America requires management to make estimates and assumptions that affect certain reported amounts and disclosures. Actual results may differ from such estimates.
7. Fiduciary and Restricted Assets
Fiduciary assets are held for the Avocado Inspection Program (AIP) and are off-set by fiduciary liabilities. Restricted assets are restricted for marketing-related activities and are subject to restrictions imposed by federal statute governing their use.
8. Net Position
Net position represents the difference between assets less liabilities. The net investment in capital assets component of net position consists of capital assets, net of accumulated depreciation, reduced by the outstanding balances of bonds, mortgages, notes, or other borrowings that are attributable to the acquisition, construction, or improvement of those assets, if any. Net investment in capital assets, excludes debt attributable to the unspent related debt proceeds amount. At October 31, 2017 and 2016, the Commission had net investment in capital assets in the amounts of $80,019 and $54,403, respectively. There was no outstanding debt related to capital assets at October 31, 2017 and 2016.
Net position is reported as restricted when there are limitations imposed on their use through external restrictions imposed by creditors, grantors or laws or regulations of other governments. At October 31, 2017 and 2016, the Commission had restricted net position in the amounts of $3,307,657 and $2,890,227, respectively, for marketing-related activities.
35

CALIFORNIA AVOCADO COMMISSION Notes to Basic Financial Statements (Continued)
October 31, 2017 and 2016
18
The unrestricted component of net position is the net amount of the assets and liabilities that are not included in the determination of net investment in capital assets or the restricted component of net position.
(2) DETAILED NOTES ON ASSETS AND LIABILITIES
(a) Cash and Cash Equivalents
Cash and cash equivalents consisted of the following at October 31:
2017 2016
Petty cash 200$ 200$ Demand deposits 12,877,854 12,271,270 Local Agency Investment Fund 9,739 9,665
Total cash and cash equivalents 12,887,793$ 12,281,135$
Investment in State Investment Pool
The Commission is a voluntary participant in LAIF, which is regulated by CGC Section 16429 under the oversight of the Treasurer of the State of California. The fair value of the Commission’s investment in this pool is reported in the accompanying financial statements at amounts based upon the Commission’s pro-rata share of the fair value provided by LAIF for the entire LAIF portfolio (in relation to the amortized cost of that portfolio). The balance available for withdrawal is based on the accounting records maintained by LAIF, which are recorded on an amortized cost basis. The Commission considers its investments in the LAIF pool to be a demand deposit account (cash and cash equivalent) where funds may be withdrawn and deposited at any time without prior notice or penalty.
The total amount invested by all public agencies in LAIF as of October 31, 2017, was $20.4 billion. LAIF is part of the California Pooled Money Investment Account (PMIA), which at October 31, 2017, had a balance of $72.0 billion. Of that amount, 3.64% was invested in medium-term and short-term structured notes and asset-backed securities. The average maturity of PMIA investments was 184 days as of October 31, 2017.
The total amount invested by all public agencies in LAIF as of October 31, 2016, was $20.9 billion. LAIF is part of the California Pooled Money Investment Account (PMIA), which at October 31, 2016, had a balance of $70.0 billion. Of that amount, 3.01% was invested in medium-term and short-term structured notes and asset-backed securities. The average maturity of PMIA investments was 163 days as of October 31, 2016.
Fair Value Measurement and Application
GASB Statement No. 72, Fair Value Measurement and Application, sets forth the framework for measuring fair value. That framework provides a fair value hierarchy that prioritizes the inputs to valuation techniques used to measure fair value. The hierarchy gives the highest priority to unadjusted quoted prices in active markets for identical assets or liabilities (level 1 measurements) and the lowest priority to unobservable inputs (level 3 measurements).
36
CALIFORNIA AVOCADO COMMISSION Notes to Basic Financial Statements (Continued)
October 31, 2017 and 2016
19
The three levels of the fair value hierarchy are described below:
Level 1 Inputs to the valuation methodology are unadjusted quoted prices for identical assets or liabilities in active markets that the Commission has the ability to access.
Level 2 Inputs to the valuation methodology include quoted prices for similar assets or liabilities in active markets; quoted prices for identical or similar assets in inactive markets; inputs other than quoted prices that are observable for the asset or liability; or inputs that are derived principally from or corroborated by observable market data by correlation or other means. If the asset or liability has a specified (contractual) term, the Level 2 input must be observable for substantially the full term of the asset or liability.
Level 3 Inputs to the valuation methodology are unobservable and significant to the fair value measurement.
Investments in an external government investment pool, such as LAIF, are not subject to reporting within the level hierarchy.
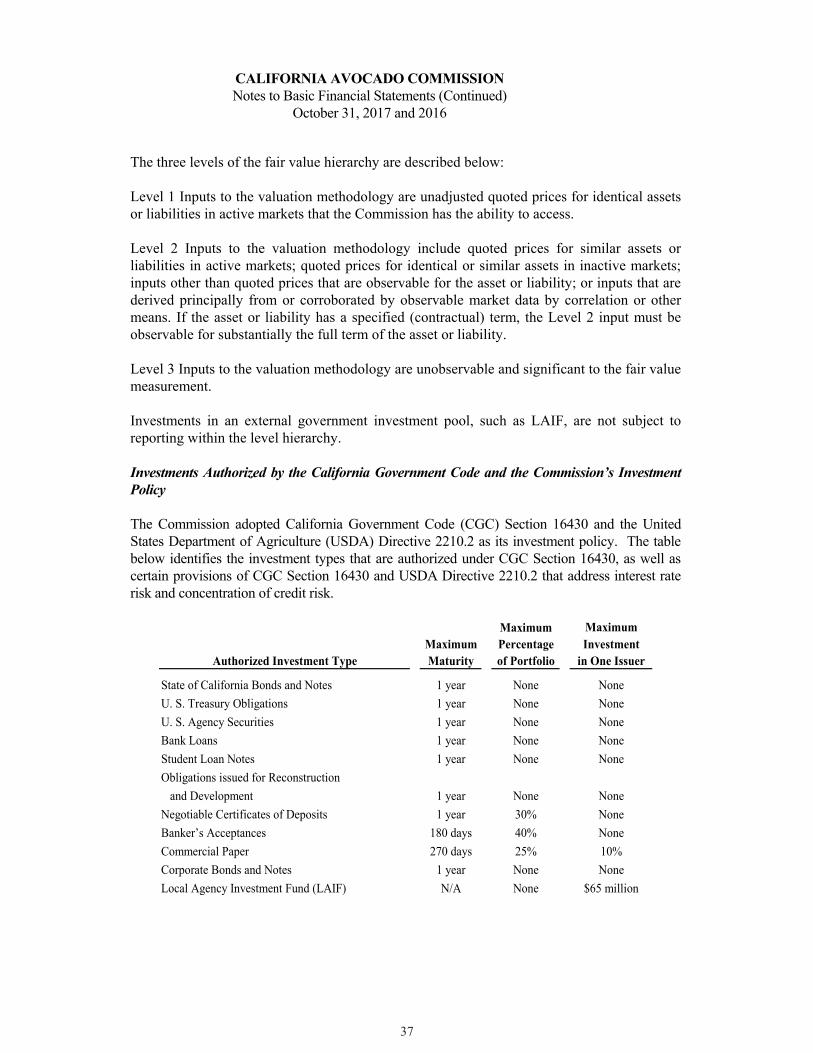
Investments Authorized by the California Government Code and the Commission’s Investment Policy
The Commission adopted California Government Code (CGC) Section 16430 and the United States Department of Agriculture (USDA) Directive 2210.2 as its investment policy. The table below identifies the investment types that are authorized under CGC Section 16430, as well as certain provisions of CGC Section 16430 and USDA Directive 2210.2 that address interest rate risk and concentration of credit risk.
Maximum MaximumMaximum Percentage Investment
Authorized Investment Type Maturity of Portfolio in One Issuer
State of California Bonds and Notes 1 year None NoneU. S. Treasury Obligations 1 year None NoneU. S. Agency Securities 1 year None NoneBank Loans 1 year None NoneStudent Loan Notes 1 year None NoneObligations issued for Reconstruction
and Development 1 year None NoneNegotiable Certificates of Deposits 1 year 30% NoneBanker’s Acceptances 180 days 40% NoneCommercial Paper 270 days 25% 10%Corporate Bonds and Notes 1 year None NoneLocal Agency Investment Fund (LAIF) N/A None $65 million
37

CALIFORNIA AVOCADO COMMISSION Notes to Basic Financial Statements (Continued)
October 31, 2017 and 2016
20
Disclosures Relating to Interest Rate Risk
Interest rate risk is the risk that changes in market interest rates will adversely affect the fair value of an investment. Generally, the longer the maturity of an investment, the greater the sensitivity of its fair value to changes in market interest rates. Information about the sensitivity of the fair values of the Commission’s investments to market interest rate fluctuations is provided by the following table that shows the Commission’s investments by maturity:
Disclosures Relating to Credit Risk
Generally, credit risk is the risk that an issuer of an investment will not fulfill its obligation to the holder of the investment. This is measured by the assignment of a rating by a nationally recognized statistical rating organization. LAIF does not have a rating provided by a nationally recognized statistical rating organization.
Concentration of Credit Risk
The investment policy of the Commission contains no limitations on the amount that can be invested in any one issuer beyond that stipulated by the CGC 16430. The Commission had no investments in any one issuer (other than external investment pools) that represented 5% or more of total Commission investments at October 31, 2017 and 2016.
Custodial Credit Risk
Custodial credit risk for deposits is the risk that, in the event of the failure of a depository financial institution, a government will not be able to recover its deposits or will not be able to recover collateral securities that are in the possession of an outside party. The custodial credit risk for investments is the risk that, in the event of the failure of the counterparty (e.g., broker-dealer) to a transaction, a government will not be able to recover the value of its investments or collateral securities that are in the possession of another party. The CGC and the Commission’s investment policy do not contain legal or policy requirements that would limit the exposure to custodial credit risk for deposits or investments, other than the following provision for deposits: the CGC requires that a financial institution secure deposits made by state or local governmental units by pledging securities in an undivided collateral pool held by a depository regulated under state law (unless so waived by the governmental unit). The market value of the pledged securities in the collateral pool must equal at least 110% of the total amount deposited by the public agencies. California law also allows financial institutions to secure Commission deposits by pledging first trust deed mortgage notes having a value of 150% of the secured public deposits.
2017 2016
Local Agency Investment Fund 9,739$ 9,665$
Investment Type
Remaining Maturity12 Months or Less
38

CALIFORNIA AVOCADO COMMISSION Notes to Basic Financial Statements (Continued)
October 31, 2017 and 2016
21
With respect to investments, custodial credit risk generally applies only to direct investments in marketable securities. Custodial credit risk does not apply to a local government’s indirect investment in securities through the use of mutual funds or government investment pools (such as LAIF).
(b) Capital Assets November 1, October 31,
2016 Additions Deletions 2017Capital assets, being depreciated:
Furniture 26,160$ -$ -$ 26,160$ Office equipment 61,002 - - 61,002Land Improvements 72,884 35,676 - 108,560
Total capital assets,being depreciated 160,046 35,676 - 195,722
Less accumulated depreciation for:Furniture 26,160 - - 26,160 Office equipment 61,002 - - 61,002 Land Improvements 18,481 10,060 - 28,541
Total accumulated depreciation 105,643 10,060 - 115,703
Capital assets, net of depreciation 54,403$ 25,616$ -$ 80,019$
November 1, October 31,2015 Additions Deletions 2016
Capital assets, being depreciated:Furniture 26,160$ -$ -$ 26,160$ Office equipment 61,002 - - 61,002Land Improvements 71,998 886 - 72,884
Total capital assets,being depreciated 159,160 886 - 160,046
Less accumulated depreciation for:Furniture 26,160 - - 26,160 Office equipment 61,002 - - 61,002 Land Improvements 10,452 8,029 - 18,481
Total accumulated depreciation 97,614 8,029 - 105,643
Capital assets, net of depreciation 61,546$ (7,143)$ -$ 54,403$
Depreciation expense was $10,060 and $8,029 for the years ended October 31, 2017 and 2016, respectively.
39
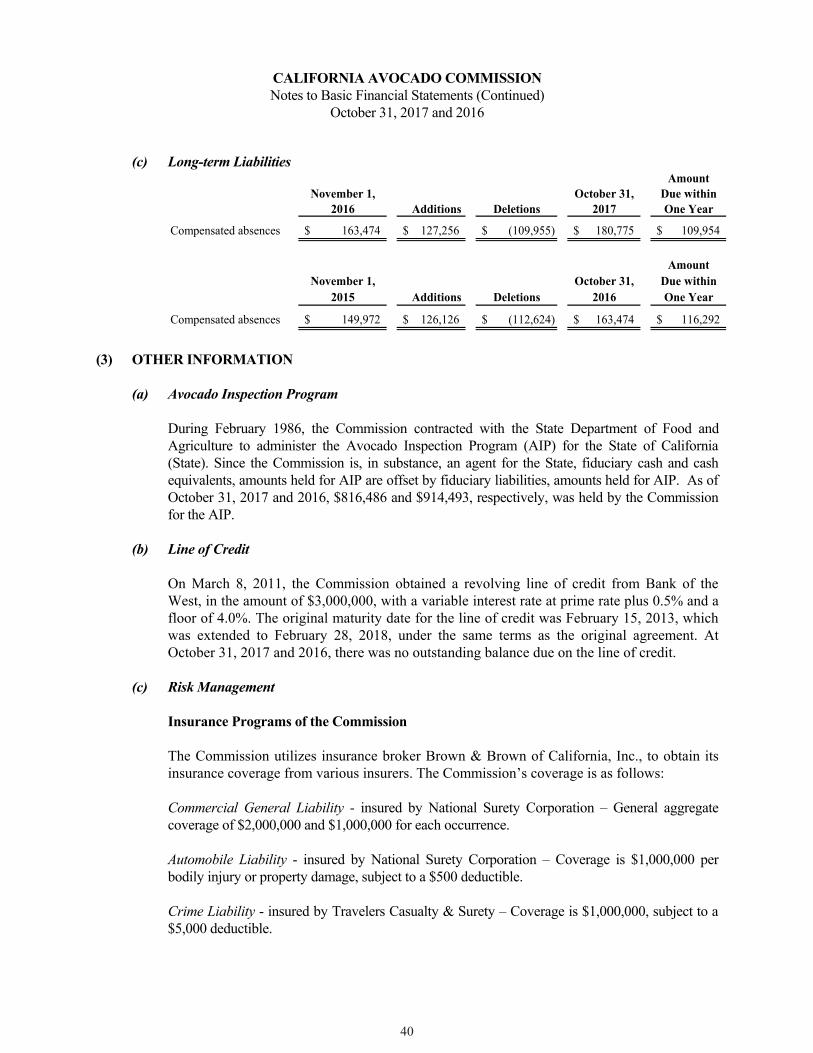
CALIFORNIA AVOCADO COMMISSION Notes to Basic Financial Statements (Continued)
October 31, 2017 and 2016
22
(c) Long-term LiabilitiesAmount
November 1, October 31, Due within2016 Additions Deletions 2017 One Year
Compensated absences 163,474$ 127,256$ (109,955)$ 180,775$ 109,954$
AmountNovember 1, October 31, Due within
2015 Additions Deletions 2016 One Year
Compensated absences 149,972$ 126,126$ (112,624)$ 163,474$ 116,292$
(3) OTHER INFORMATION
(a) Avocado Inspection Program
During February 1986, the Commission contracted with the State Department of Food and Agriculture to administer the Avocado Inspection Program (AIP) for the State of California (State). Since the Commission is, in substance, an agent for the State, fiduciary cash and cash equivalents, amounts held for AIP are offset by fiduciary liabilities, amounts held for AIP. As of October 31, 2017 and 2016, $816,486 and $914,493, respectively, was held by the Commission for the AIP.
(b) Line of Credit
On March 8, 2011, the Commission obtained a revolving line of credit from Bank of the West, in the amount of $3,000,000, with a variable interest rate at prime rate plus 0.5% and a floor of 4.0%. The original maturity date for the line of credit was February 15, 2013, which was extended to February 28, 2018, under the same terms as the original agreement. At October 31, 2017 and 2016, there was no outstanding balance due on the line of credit.
(c) Risk Management
Insurance Programs of the Commission
The Commission utilizes insurance broker Brown & Brown of California, Inc., to obtain its insurance coverage from various insurers. The Commission’s coverage is as follows:
Commercial General Liability - insured by National Surety Corporation – General aggregate coverage of $2,000,000 and $1,000,000 for each occurrence.
Automobile Liability - insured by National Surety Corporation – Coverage is $1,000,000 per bodily injury or property damage, subject to a $500 deductible.
Crime Liability - insured by Travelers Casualty & Surety – Coverage is $1,000,000, subject to a $5,000 deductible.
40

CALIFORNIA AVOCADO COMMISSION Notes to Basic Financial Statements (Continued)
October 31, 2017 and 2016
23
Umbrella Liability - insured by Fireman’s Fund Insurance Company – General aggregate coverage of $5,000,000 and $5,000,000 for each occurrence.
Travel Accident Liability - insured by Hartford Life Insurance Company – Coverage is $100,000 per person and $500,000 per accident.
Directors and Officers Liability and Employment Practices Liability - insured by Great American Insurance Company – Coverage is $5,000,000 aggregate limit, with a $25,000 retention.
Employed Lawyers Professional Liability - insured by Federal Insurance Company – Coverage is $1,000,000 aggregate limit.
Fiduciary Liability - insured by U.S. Specialty Insurance Company – Coverage is $1,000,000 each claim and in aggregate, subject to a $2,500 deductible.
Media Content/Network Security and Privacy - insured by Lloyds of London – Coverage is $1,000,000 each claim and in aggregate, with a $25,000 self insurance retention for each loss.
First Party Network Security and Privacy - insured by Lloyds of London – Privacy notification costs limit is $1,000,000, with a $25,000 self insurance retention for each loss.
Foreign Liability - insured by Fireman’s Fund Insurance Company – General aggregate coverage is $2,000,000 and $1,000,000 for each occurrence.
Workers’ Compensation Coverage – insured by Hartford Casualty Insurance Company – Coverage is $1,000,000 per occurrence
Adequacy of Protection
During the past three fiscal (claims) years, none of the above programs of protection have had settlements or judgments that exceeded insured coverage. There have been no significant changes in insurance coverage during fiscal year 2017.
(d) Employee Retirement Plans
The Board of Directors of the Commission implemented a defined contribution plan, California Avocado Commission Profit Sharing Plan (PSP), administered by “The Retirement Plan Company,” for eligible Commission employees effective November 1, 2000. The Commission’s payroll for the twelve employees eligible to participate in the PSP for the plan year ended October 31, 2017, was $2,100,815. Total payroll for the thirteen employees eligible to participate in the PSP for the plan year ended October 31, 2016, was $1,805,645. Total contributions for the years ended October 31, 2017 and 2016 were $222,581 and $229,423, respectively.
41

CALIFORNIA AVOCADO COMMISSION Notes to Basic Financial Statements (Continued)
October 31, 2017 and 2016
24
The Commission may make annual, discretionary contributions, as determined by the President, to the PSP. With a few exceptions, each eligible employee received an allocation of 10% of compensation, up to a maximum of $54,000, for each of the plan years ended October 31, 2017 and 2016. To receive an allocation, each employee must meet a minimum service requirement of one year and must be credited with at least 1,000 hours of service.
(e) Operating Leases
On November 5, 2009, the Commission entered into a lease agreement for the current office space, within the City of Irvine, California, under a five-year lease ending November 30, 2014, which was extended an additional five years ending November 30, 2019. During the years ended October 31, 2017 and 2016, the Commission paid $70,630 and $68,527, respectively, for office rent, exclusive of operating expenses.
On September 15, 2011, the Commission entered into an agreement to lease a postage machine under a three-year lease ending on October 1, 2014, which was extended to December 31, 2019, with quarterly payments due at the end of each quarter of $275. Quarterly payments began January 1, 2012. During the years ended October 31, 2017 and 2016, the Commission paid $1,544 and $1,343, respectively, including tax, for this lease.
On February 9, 2015, the Commission entered into an agreement to lease two printers under a three-year lease agreement ending on January 31, 2018, with monthly payments of $441 beginning February 1, 2015. The original lease was terminated as of August 31, 2017. On September 1, 2017, the Commission entered into an agreement to lease two new printers under a three-year lease agreement ending on August 31, 2020, with monthly payments of $575. During the year ended October 31, 2017 and 2016, the Commission paid $6,354 and $6,000, respectively, including tax, for this lease.
On October 19, 2016, the Commission entered into an agreement to lease a printer under a three-year lease agreement ending on September 30, 2019, with monthly payments of $499 beginning October 1, 2016. During the year ended October 31, 2017, the Commission paid $6,988 including tax, for this lease.
On May 22, 2013, the Commission entered into a lease agreement for the office space within the City of Santa Paula, California, under a three-year lease ending April 30, 2016, which was extended to April 30, 2018. During the year ended October 31, 2017 and 2016, the Commission paid $6,230 and $12,278, respectively, for office rent, exclusive of operating expenses. Beginning May 2017, office rent payments were taken over by AIP.
On July 1, 2013, the Commission entered into a lease agreement for the Pine Tree Ranch property within the City of Santa Paula, California, under a ten-year lease ending June 30, 2023. During the year ended October 31, 2017 and 2016, the Commission paid $20,720 and $20,056 for rent, respectively, including rent paid for a garage on the property for $100 a month.
42

CALIFORNIA AVOCADO COMMISSION Notes to Basic Financial Statements (Continued)
October 31, 2017 and 2016
25
The annual requirements to amortize the operating lease obligations as of October 31, 2017, are as follows:
Year Ending Postage Pine Tree October 31, Office Spaces Printers Machine Ranch Total
2018 72,733 12,888 1,101 21,400 108,122 2019 74,836 12,389 1,101 22,104 110,430 2020 6,251 5,750 183 22,836 35,020 2021 - - - 23,600 23,600 2022 - - - 24,384 24,384 2023 - - - 16,608 16,608 Total 153,820$ 31,027$ 2,385$ 130,932$ 318,164$
43

27
SUPPLEMENTARY INFORMATION
44

VarianceOriginal Final Positive 2016Budget Budget Actual (Negative) Actual
Revenues:Assessment revenue 5,060,000$ 5,060,000$ 7,951,777$ 2,891,777$ 9,493,670$ HAB rebate assessment
revenue (restricted) 3,952,500 3,952,500 4,148,826 196,326 7,768,571 Administrative and
marketing fees 61,000 61,000 60,997 (3) 86,000 Interest income 14,400 14,400 28,320 13,920 14,661 Grant revenue 236,438 396,016 323,618 (72,398) 270,214 Other income 65,000 65,000 162,075 97,075 3,811
Total revenues 9,389,338 9,548,916 12,675,613 3,126,697 17,636,927
Expenses:Marketing:
Consumer marketing 4,636,980 4,636,980 4,134,305 502,675 4,745,291 Merchandising promotions 1,516,270 1,516,270 1,360,270 156,000 1,640,864 Foodservice 684,000 684,000 665,418 18,582 854,319 Consumer public relations 524,500 524,500 573,445 (48,945) 869,556 Consumer registered dietitian
nutritionist program 88,750 88,750 93,127 (4,377) - Marketing activities support 259,500 259,500 202,240 57,260 82,438 Total marketing 7,710,000 7,710,000 7,028,805 681,195 8,192,468
Non-marketing programs:Industry affairs 760,650 760,650 652,601 108,049 648,587 Production research 646,864 646,864 602,839 44,025 887,662 Grant expenses 236,438 396,016 323,619 72,397 270,214
Total non-marketing programs 1,643,952 1,803,530 1,579,059 224,471 1,806,463
Administration:Administration 3,246,821 3,246,821 3,466,341 (219,520) 3,064,663 Information systems 118,930 118,930 108,906 10,024 73,132 Depreciation 8,400 8,400 10,060 (1,660) 8,029 Total administration 3,374,151 3,374,151 3,585,307 (211,156) 3,145,824
Total expenses 12,728,103 12,887,681 12,193,171 694,510 13,144,755
Change in net position (3,338,765) (3,338,765) 482,442 3,821,207 4,492,172
Net position, beginning of year 10,634,332 10,634,332 10,634,332 - 6,142,160 Net position, ending of year 7,295,567$ 7,295,567$ 11,116,774$ 3,821,207$ 10,634,332$
(with comparative actual totals for the year ended October 31, 2016)
CALIFORNIA AVOCADO COMMISSIONBudgetary Comparison Schedule
For the Year Ended October 31, 2017
2017
See accompanying note to supplementary information.
29
VarianceOriginal Final Positive 2016Budget Budget Actual (Negative) Actual
Revenues:Assessment revenue 5,060,000$ 5,060,000$ 7,951,777$ 2,891,777$ 9,493,670$ HAB rebate assessment
revenue (restricted) 3,952,500 3,952,500 4,148,826 196,326 7,768,571 Administrative and
marketing fees 61,000 61,000 60,997 (3) 86,000 Interest income 14,400 14,400 28,320 13,920 14,661 Grant revenue 236,438 396,016 323,618 (72,398) 270,214 Other income 65,000 65,000 162,075 97,075 3,811
Total revenues 9,389,338 9,548,916 12,675,613 3,126,697 17,636,927
Expenses:Marketing:
Consumer marketing 4,636,980 4,636,980 4,134,305 502,675 4,745,291 Merchandising promotions 1,516,270 1,516,270 1,360,270 156,000 1,640,864 Foodservice 684,000 684,000 665,418 18,582 854,319 Consumer public relations 524,500 524,500 573,445 (48,945) 869,556 Consumer registered dietitian
nutritionist program 88,750 88,750 93,127 (4,377) - Marketing activities support 259,500 259,500 202,240 57,260 82,438 Total marketing 7,710,000 7,710,000 7,028,805 681,195 8,192,468
Non-marketing programs:Industry affairs 760,650 760,650 652,601 108,049 648,587 Production research 646,864 646,864 602,839 44,025 887,662 Grant expenses 236,438 396,016 323,619 72,397 270,214
Total non-marketing programs 1,643,952 1,803,530 1,579,059 224,471 1,806,463
Administration:Administration 3,246,821 3,246,821 3,466,341 (219,520) 3,064,663 Information systems 118,930 118,930 108,906 10,024 73,132 Depreciation 8,400 8,400 10,060 (1,660) 8,029 Total administration 3,374,151 3,374,151 3,585,307 (211,156) 3,145,824
Total expenses 12,728,103 12,887,681 12,193,171 694,510 13,144,755
Change in net position (3,338,765) (3,338,765) 482,442 3,821,207 4,492,172
Net position, beginning of year 10,634,332 10,634,332 10,634,332 - 6,142,160 Net position, ending of year 7,295,567$ 7,295,567$ 11,116,774$ 3,821,207$ 10,634,332$
(with comparative actual totals for the year ended October 31, 2016)
CALIFORNIA AVOCADO COMMISSIONBudgetary Comparison Schedule
For the Year Ended October 31, 2017
2017
See accompanying note to supplementary information.
2945

CALIFORNIA AVOCADO COMMISSION Note to Supplementary Information
October 31, 2017 and 2016
30
(1) BUDGETARY INFORMATION:
(a) Budgets and Budgetary Accounting:
Each year, the California Avocado Commission (Commission) adopts a budget that provides for its general operations. Budgets are prepared on the accrual basis of accounting. Department Heads are responsible for preparing and presenting their departmental budgets. Each Department Head is required to meet with the President and Director of Finance and Administration of the Commission to review each line item. The overall combined budget is prepared by the President and Director of Finance and Administration of the Commission and presented to the Board of Directors. Line item transfers do not need Board of Directors approval, but require notification to the Finance Committee of the Board of Directors. Any increases or decreases in a department’s budget must be approved by the Board of Directors.
46

CALIFORNIA AVOCADO COMMISSIONCombining Statement of Revenues, Expenses and Changes in Net Position
For the Year Ended October 31, 2017
Restricted Unrestricted TotalOperating revenues:
Assessment revenue -$ 7,951,777$ 7,951,777$ HAB rebate assessment revenue (restricted) 4,148,826 - 4,148,826 Administrative and marketing fees - 60,997 60,997
Total operating revenues 4,148,826 8,012,774 12,161,600
Operating expenses:Marketing 3,739,167 3,289,638 7,028,805 Nonmarketing programs - 1,579,060 1,579,060 Administration - 3,585,306 3,585,306
Total operating expenses 3,739,167 8,454,004 12,193,171
Operating income 409,659 (441,230) (31,571)
Nonoperating revenues:Interest income (loss) 7,771 20,549 28,320 Grant revenue - 323,618 323,618 Other income - 162,075 162,075
Total nonoperating revenues 7,771 506,242 514,013
Change in net position 417,430 65,012 482,442
Net position, beginning of year 2,890,227 7,744,105 10,634,332
Net position, ending of year 3,307,657$ 7,809,117$ 11,116,774$
31
47

Restricted BudgetMarketing Programs:Media-85% Rebate-Mullen 1,219,794$ 1,541,000$ Program Administration Fees-85% Rebate-Mullen 1,107,510 930,000 Subtotal Consumer Advertising 2,327,304 2,471,000
Artisan Chef Program-85% Rebate-Golin 41,613 51,500 American Summer Holidays-85% Rebate-Golin 35,603 34,000 California Avocado Month-85% Rebate-Golin 88,763 96,000 News Bureau-85% Rebate-Golin 154,116 108,000 Media Tracking & Reporting-85% Rebate-Golin 69,629 70,000 Crisis Readiness-85% Rebate-Golin 17,105 10,000 Blog & Social Media Support-85% Rebate-Golin 40,728 40,000 Blogger Advocates-85% Rebate-Golin 37,219 35,000 Program Administration Fees-85% Rebate-Golin 69,410 73,000 Program Administration Expenses-85% Rebate-Golin 19,259 7,000
Subtotal Consumer Public Relations 573,445 524,500
Trade Advertising-Media-85% Rebate-Fusion 172,999 173,000 Subtotal Merchandising Promotions 172,999 173,000
Media-85% Rebate-MMM 22,662 17,000 Production-85% Rebate-MMM 22,334 2,000 Public Relations & Collateral Mat-85% Rebate-MMM 80,179 54,000 Public Relations & Collateral Mat-85% Rebate-KC 21 - Foodservice Events-85% Rebate-MMM 240,793 215,000 Foodservice Events-85% Rebate-CDCA 16,461 30,000 Chain Promotions-85% Rebate-MMM 199,235 285,000 Chain Promotions-85% Rebate-CDCA 19,316 25,000 Culinary Education Program-85% Rebate-MMM 2,200 2,000 Program Administration Fees-85% Rebate-MMM 60,250 49,000 Program Administration Expenses-85% Rebate-MMM 1,967 5,000
Subtotal Foodservice 665,418 684,000
Total Marketing 3,739,167 3,852,500
Total Program Expenses 3,739,167$ 3,852,500$
CALIFORNIA AVOCADO COMMISSIONSchedule of Program Expenses
For the Year Ended October 31, 2017
32
48

www.mgocpa.com Macias Gini & O’Connell LLP 4675 MacArthur Court, Suite 600 Newport Beach, CA 92660
33
Independent Auditor’s Report on Internal Control Over Financial Reporting and on Compliance and Other Matters Based on an Audit of Financial Statements
Performed in Accordance with Government Auditing Standards
Board of DirectorsCalifornia Avocado Commission Irvine, California
We have audited, in accordance with the auditing standards generally accepted in the United States of America and the standards applicable to financial audits contained in Government Auditing Standardsissued by the Comptroller General of the United States, the financial statements of the California Avocado Commission (Commission), as of and for the year ended October 31, 2017, and the related notes to the financial statements, which collectively comprise the Commission’s basic financial statements, and have issued our report thereon dated January 29, 2018.
Internal Control Over Financial Reporting
In planning and performing our audit of the financial statements, we considered the Commission’s internal control over financial reporting (internal control) to determine the audit procedures that are appropriate in the circumstances for the purpose of expressing our opinion on the financial statements, but not for the purpose of expressing an opinion on the effectiveness of the Commission’s internal control. Accordingly, we do not express an opinion on the effectiveness of the Commission’s internal control.
A deficiency in internal control exists when the design or operation of a control does not allow management or employees, in the normal course of performing their assigned functions, to prevent, or detect and correct, misstatements on a timely basis. A material weakness is a deficiency, or a combination of deficiencies, in internal control, such that there is a reasonable possibility that a material misstatement of the entity’s financial statements will not be prevented, or detected and corrected on a timely basis. A significant deficiency is a deficiency, or a combination of deficiencies, in internal control that is less severe than a material weakness, yet important enough to merit attention by those charged with governance.
Our consideration of internal control was for the limited purpose described in the first paragraph of this section and was not designed to identify all deficiencies in internal control that might be material weaknesses or significant deficiencies. Given these limitations, during our audit we did not identify any deficiencies in internal control that we consider to be material weaknesses. However, material weaknesses may exist that have not been identified.
49

34
Compliance and Other Matters
As part of obtaining reasonable assurance about whether the Commission’s financial statements are free from material misstatement, we performed tests of its compliance with certain provisions of laws, regulations, contracts, and grant agreements, noncompliance with which could have a direct and material effect on the determination of financial statement amounts. However, providing an opinion on compliance with those provisions was not an objective of our audit, and accordingly, we do not express such an opinion. The results of our tests disclosed no instances of noncompliance or other matters that are required to be reported under Government Auditing Standards.
Purpose of this Report
The purpose of this report is solely to describe the scope of our testing of internal control and compliance and the results of that testing, and not to provide an opinion on the effectiveness of the Commission’s internal control or on compliance. This report is an integral part of an audit performed in accordance with Government Auditing Standards in considering the Commission’s internal control and compliance. Accordingly, this report is not suitable for any other purpose.
Newport Beach, CaliforniaJanuary 29, 2018
50

YEARBEARING
ACRESVOLUME
(MM/LBS.)CROP
VALUE ($)
PRICE PER
POUND (¢)
DOLLARS PER
BEARING ACRE ($)
POUNDS PER
BEARING ACRE
07/08 65,497 328.8 $327,141,689 99.50 $4,995 5,020
08/09 64,555 174.5 $199,625,988 114.40 $3,092 2,703
09/10 58,268 534.5 $402,770,893 75.35 $6,912 9,173
10/11 57,532 302.5 $460,209,682 152.10 $7,999 5,258
11/12 59,629 462.3 $381,852,467 82.60 $6,404 7,753
12/13 57,838 500.2 $435,023,142 87.00 $7,521 8,648
13/14 57,219 297.5 $333,216,563 112.00 $5,823 5,199
14/15 51,478 279.0 $303,160,400 108.60 $5,889 5,420
15/16 51,902 401.4 $412,332,493 102.70 $7,944 7,733
16/17 50,856 215.9 $345,875,896 160.20 $6,801 4,245
10-YEAR INDUSTRY STATISTICAL DATA FROM 2007/08 THROUGH 2016/17
Industry Statistics
FOOTNOTES: Bearing acres based on CAC’s acreage inventory, attrition factors and other sources.Industry statistical data from 1971-72 through 2016-17 are available on CaliforniaAvocadoGrowers.com/industry/industry-statistical-data
MONTHHASS
POUNDSLAMB
POUNDSOTHERS POUNDS
TOTAL POUNDS
HASS DOLLARS
LAMB DOLLARS
OTHERS DOLLARS
TOTAL DOLLARS
AVG $/LB
1st QTR 3,481,321 0 426,895 3,908,216 3,666,955 0 299,196 3,966,151 1.015
2nd QTR 71,269,165 194 494,938 71,764,297 110,580,075 63 457,605 111,037,743 1.547
3rd QTR 122,532,122 4,420,498 342,502 127,295,122 199,256,464 5,942,320 430,551 205,629,335 1.615
4th QTR 10,059,103 2,768,391 145,794 12,973,288 20,210,497 4,826,768 205,402 25,242,667 1.946
TOTAL 207,341,711 7,189,083 1,410,129 215,940,923 333,713,991 10,769,151 1,392,754 345,875,896 1.602
GRAND TOTAL 345,875,896 1.602
Y-T-D (%) 96.02% 3.33% .65% 100.00% 96.48% 3.11% .40% 100.00%
Y-T-D AVG $/LB 1.609 1.498 0.988 1.602
CALIFORNIA AVOCADO COMMISSION POUNDS & DOLLARS BY VARIETY NOVEMBER 2016 THROUGH OCTOBER 2017
TOTAL U.S. VOLUME AND CALIFORNIA PRICE PER POUND 2007/08 to 2016/17
YEAR
CA VOLUME
(MM/LBS.)
TOTAL US VOLUME
(MM/LBS.)
CA AVERAGE
PRICE PER POUND (¢)
07/08 328.8 1,065 99.50
08/09 174.5 1,145 114.40
09/10 534.5 1,350 75.35
10/11 302.5 1,227 152.10
11/12 462.3 1,589 82.60
12/13 500.2 1,684 87.00
13/14 297.5 1,941 112.00
14/15 279.0 2,184 108.60
15/16 401.4 2,348 102.70
16/17 215.9 2,174 160.20
51
CALIFORNIA AVOCADO COMMISSION ANN UAL REPORT 2017

California Avocado Commission 12 Mauchly, Suite L Irvine, CA 92618 949.341.1955
CaliforniaAvocadoGrowers.com
CaliforniaAvocado.com
© 2018 California Avocado Commission
2 0 1 7 A N N U A L R E P O R TF R O M T H E G R O V E S P E C I A L E D I T I O N