from risk assessment to analyzing data - key fraud tools to use
TRANSCRIPT
From Risk Assessment to Analyzing Data – Key
Fraud Tools to UseSouthern AZ IIA/AGA Joint Meeting
February 8, 2017
Karin M. Smith, MBA, SFO, CFE

Refresher – The Fraud Triangle
2

Fraud Risk Assessments

Fraud Risk Assessment
Employee
Physical Controls
SkimmingCheck
Tampering
Purchasing and Billing
Payroll Expenses
Conflict of Interest
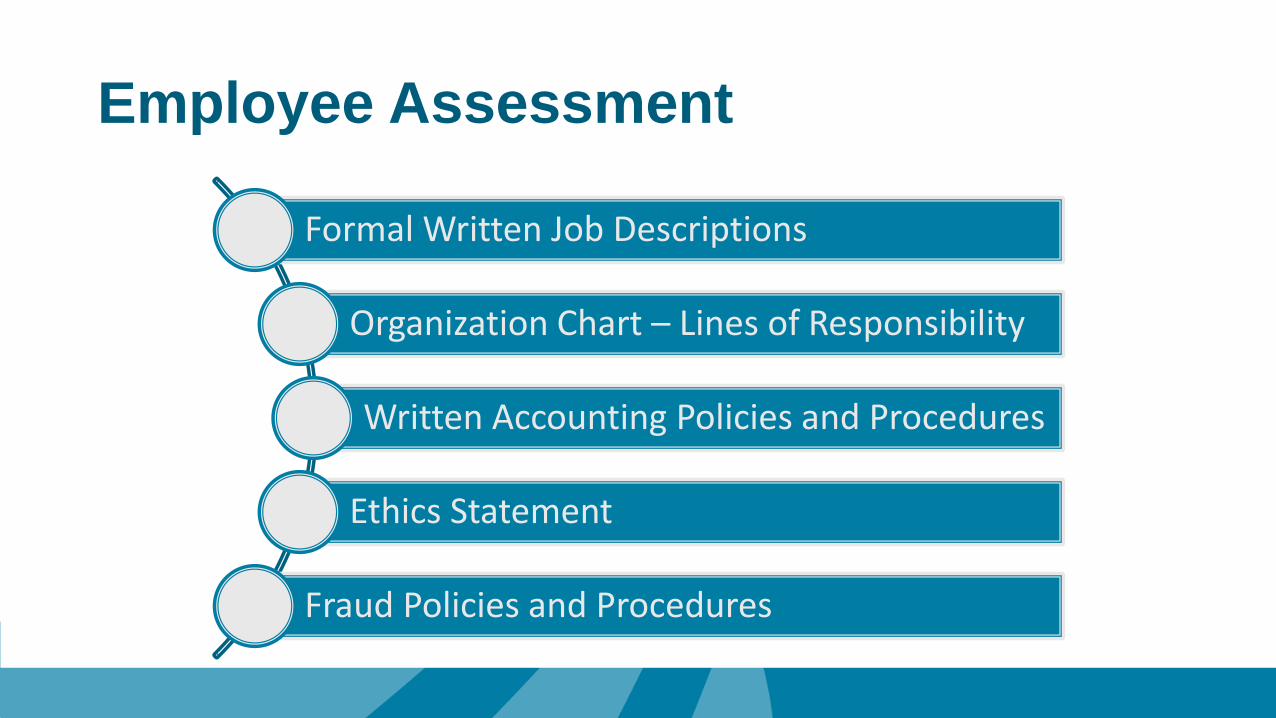
Employee Assessment
Formal Written Job Descriptions
Organization Chart – Lines of Responsibility
Written Accounting Policies and Procedures
Ethics Statement
Fraud Policies and Procedures

Physical Controls Assessment
Restrict Access
Video Recording
Random Audits
Background Checks
Investigate Accusations
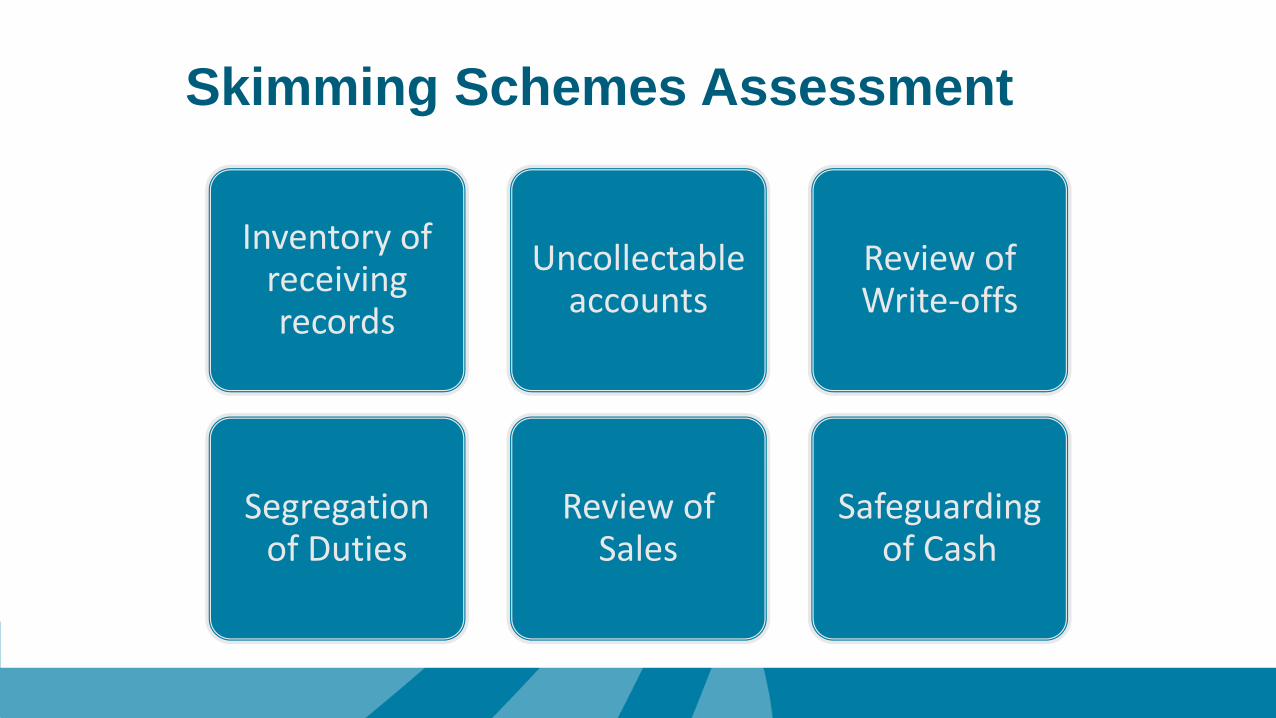
Skimming Schemes Assessment
Inventory of receiving records
Segregation of Duties
Uncollectable accounts
Review of Sales
Review of Write-offs
Safeguarding of Cash

Check Tampering Assessment
Unused Checks
Positive Pay
Check SignersBank
Reconciliations
Voided and Missing Checks

Purchasing and Billing Assessment
Organizational Structure
Vendor Information
ProcurementReceiving Reports
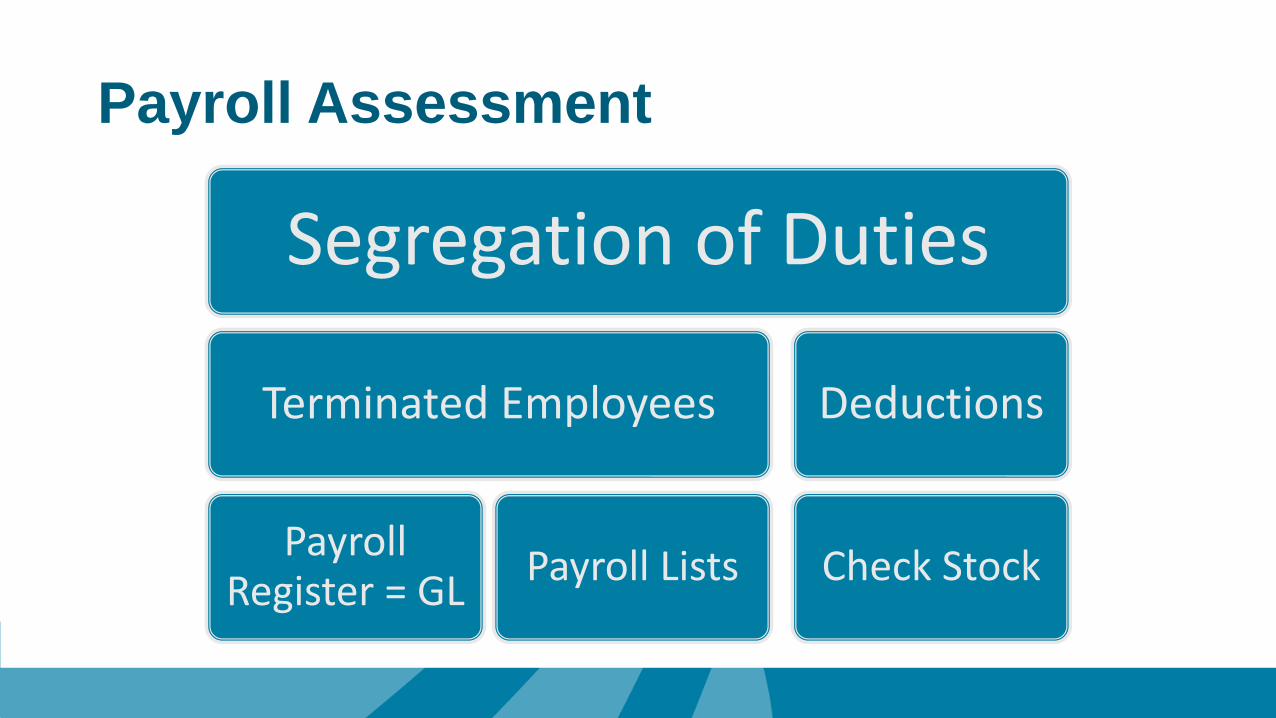
Payroll Assessment
Segregation of Duties
Terminated Employees
Payroll Register = GL
Payroll Lists
Deductions
Check Stock

Expenses Assessment
Expense Accounts
Employee Reimbursements
Receipts
Review
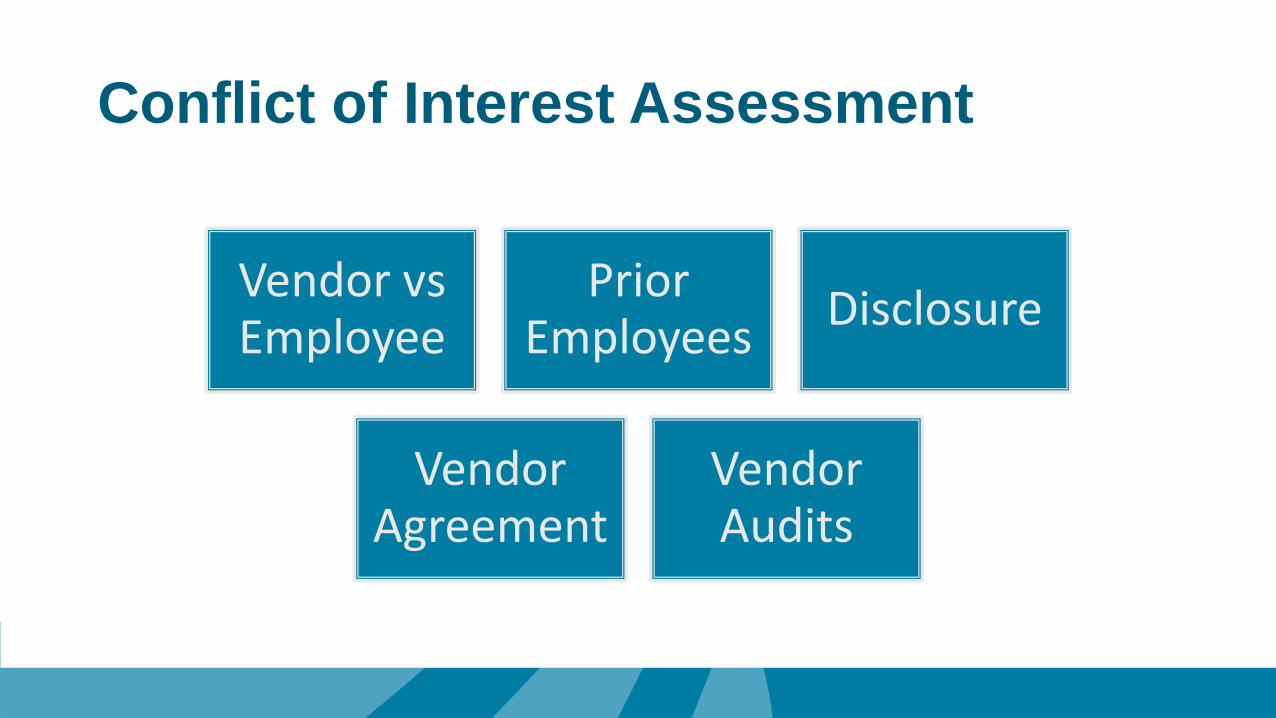
Conflict of Interest Assessment
Vendor vs Employee
Prior Employees
Disclosure
Vendor Agreement
Vendor Audits

Analyzing Data
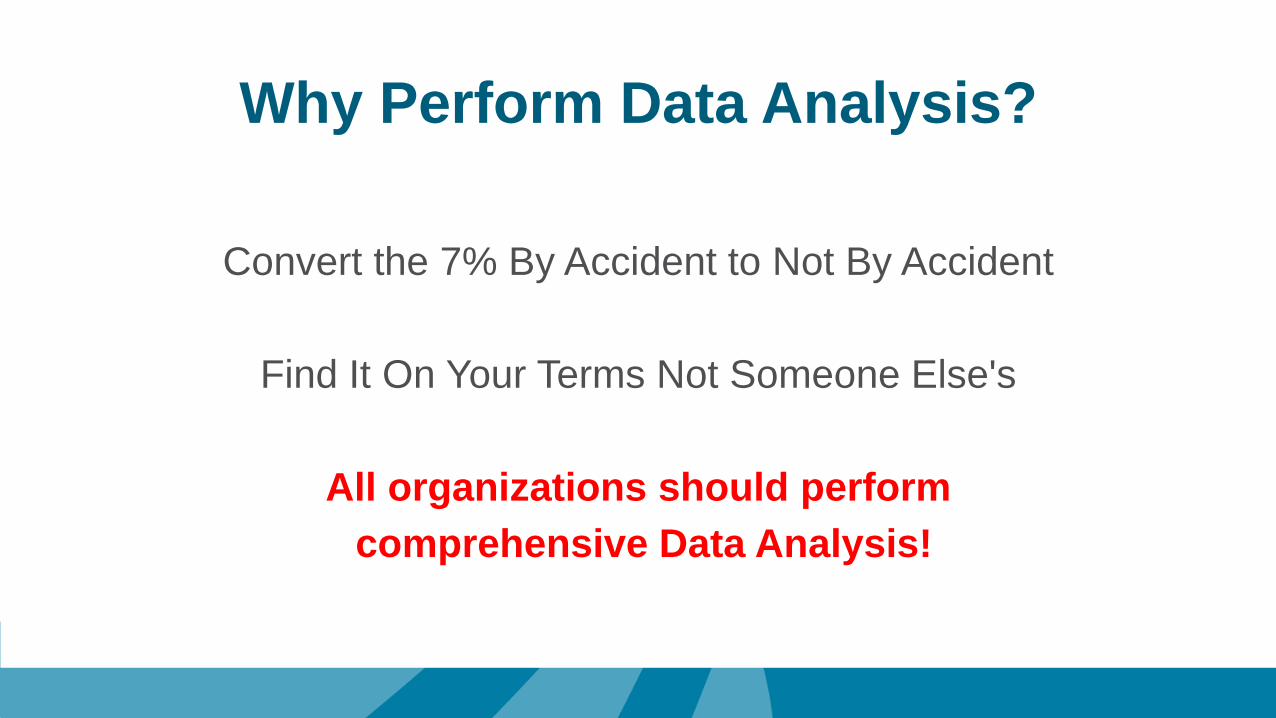
Why Perform Data Analysis?
Convert the 7% By Accident to Not By Accident
Find It On Your Terms Not Someone Else's
All organizations should perform
comprehensive Data Analysis!
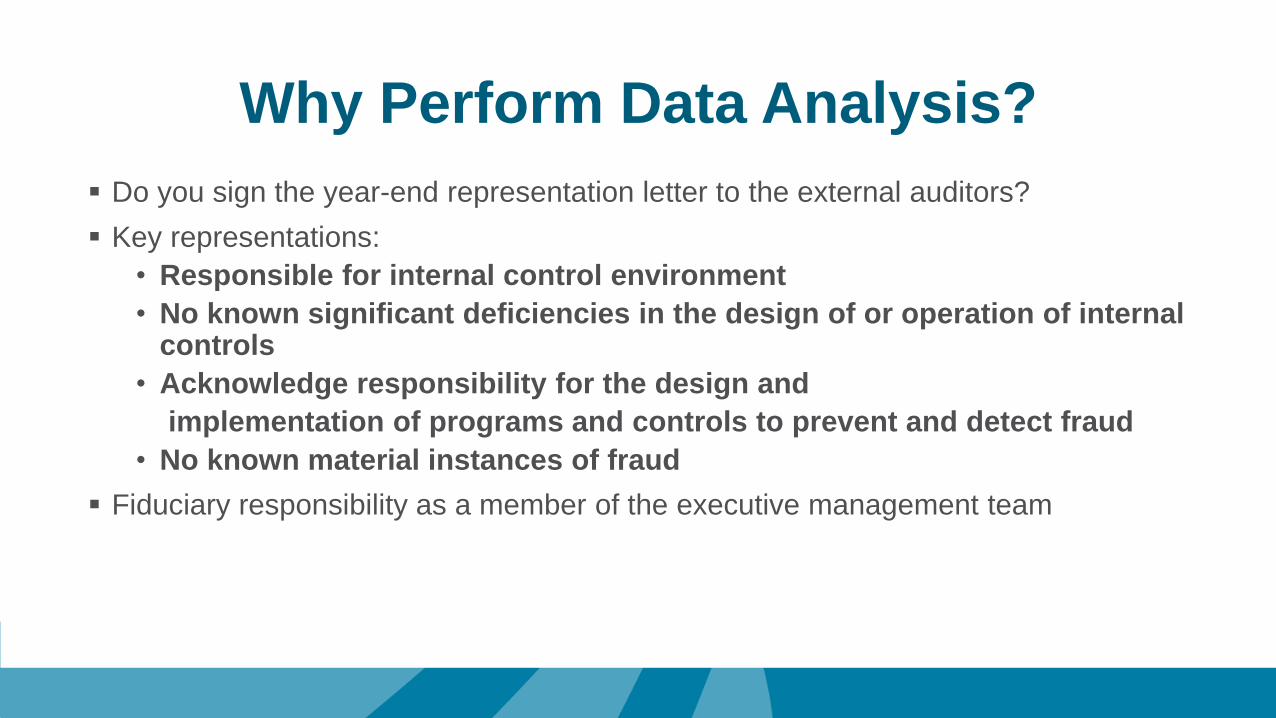
Why Perform Data Analysis?
Do you sign the year-end representation letter to the external auditors?
Key representations:
• Responsible for internal control environment
• No known significant deficiencies in the design of or operation of internal controls
• Acknowledge responsibility for the design and
implementation of programs and controls to prevent and detect fraud
• No known material instances of fraud
Fiduciary responsibility as a member of the executive management team
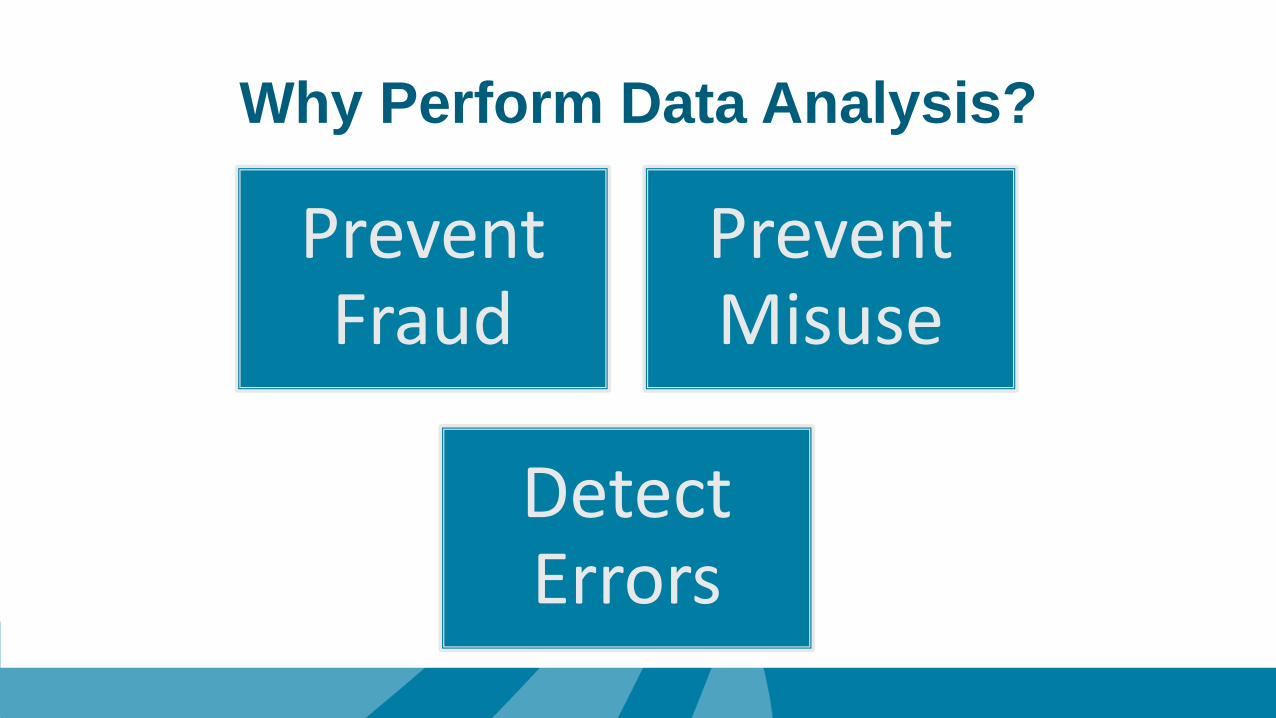
Why Perform Data Analysis?
Prevent Fraud
Prevent Misuse
Detect Errors
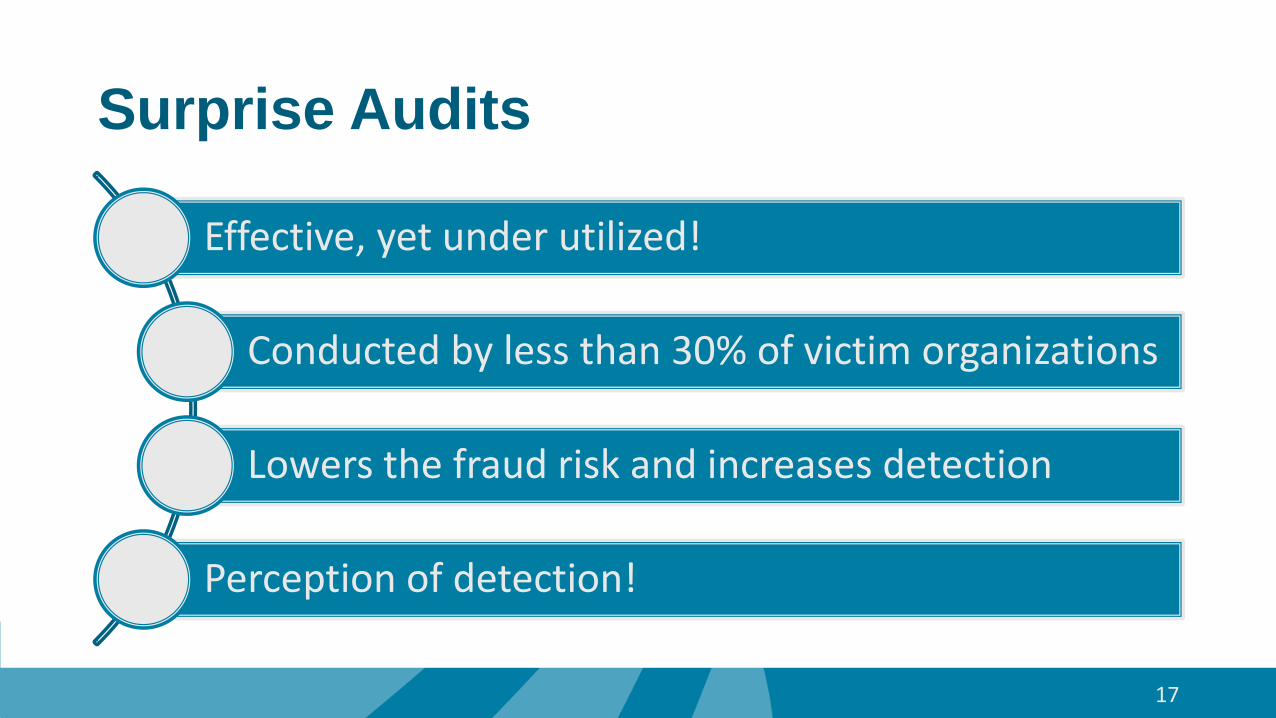
Surprise Audits
Effective, yet under utilized!
Conducted by less than 30% of victim organizations
Lowers the fraud risk and increases detection
Perception of detection!
17
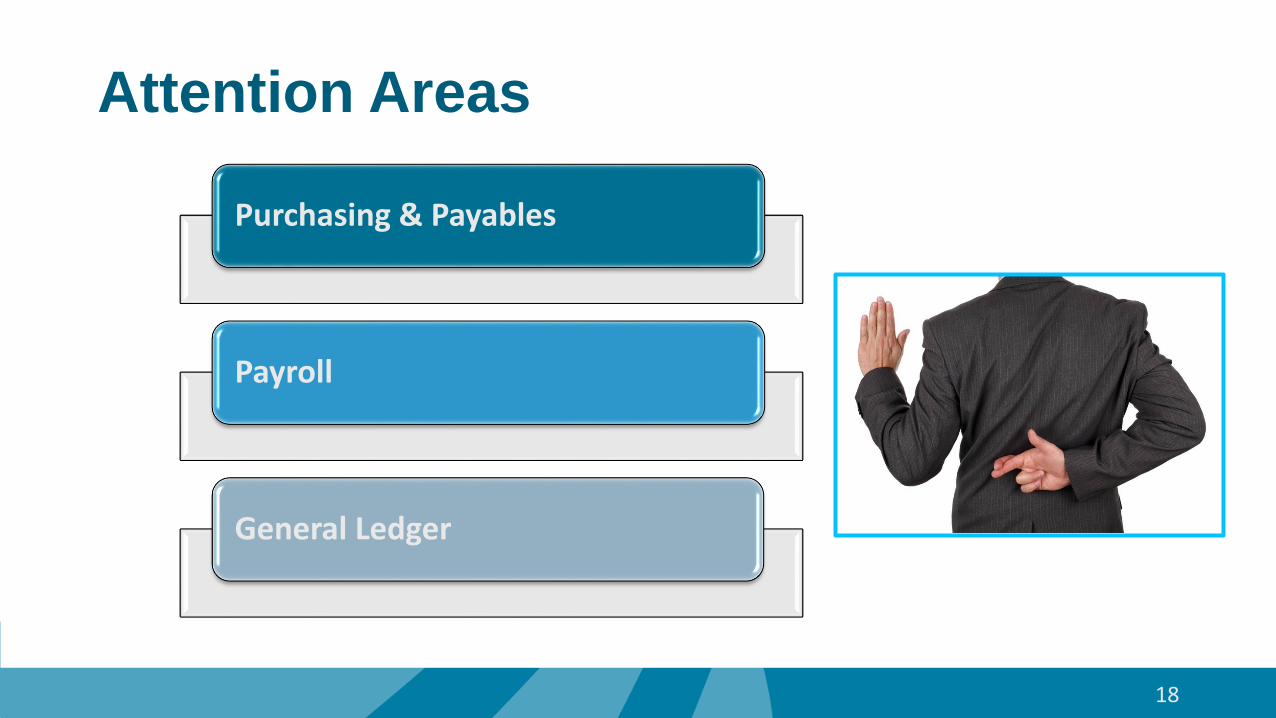
Purchasing & Payables
Payroll
General Ledger
18
Attention Areas
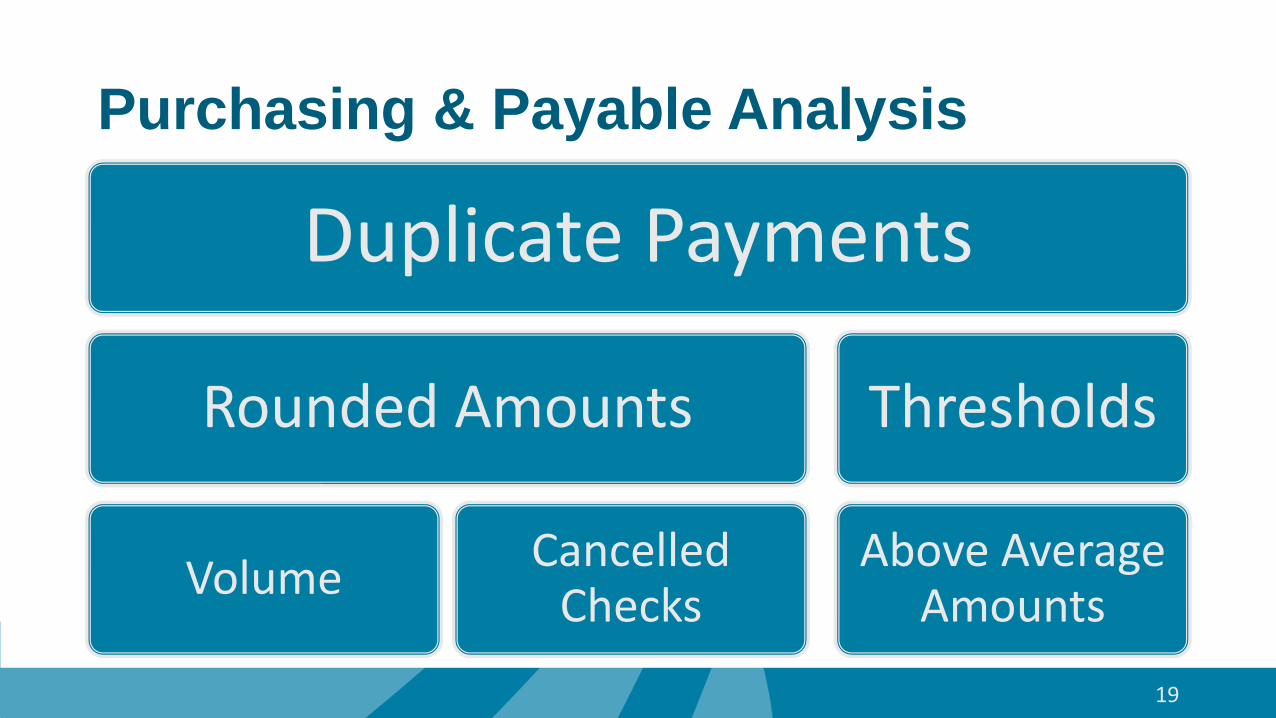
Purchasing & Payable Analysis
Duplicate Payments
Rounded Amounts
VolumeCancelled
Checks
Thresholds
Above Average Amounts
19
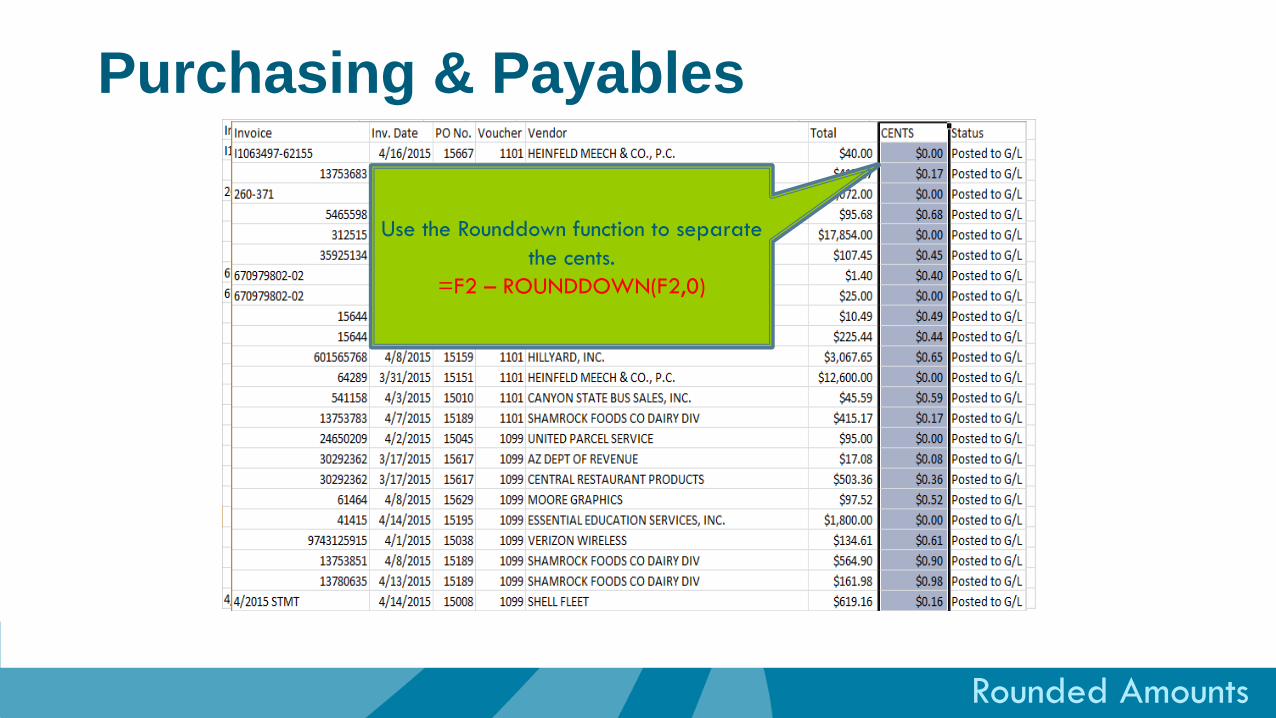
Rounded Amounts
Use the Rounddown function to separate
the cents.
=F2 – ROUNDDOWN(F2,0)
Purchasing & Payables
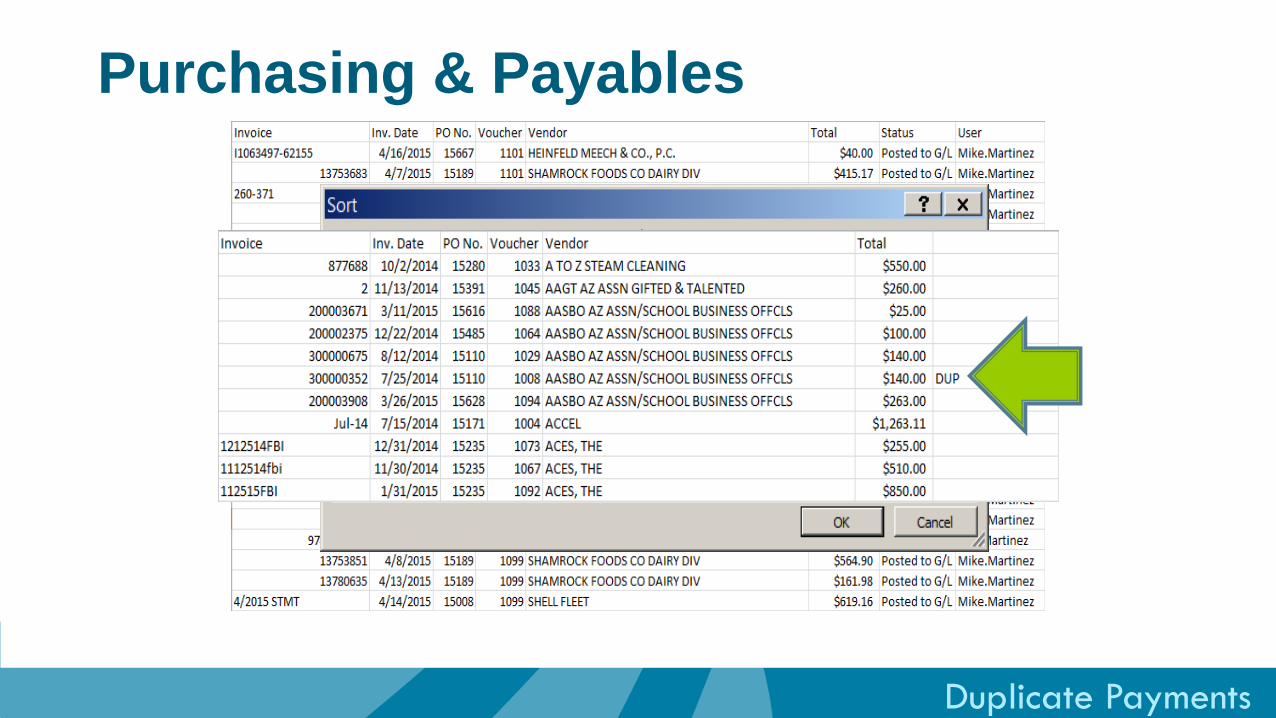
Duplicate Payments
Use the IF function to look for duplicates.
=IF(F2=F1,”DUP”,””)
Purchasing & Payables
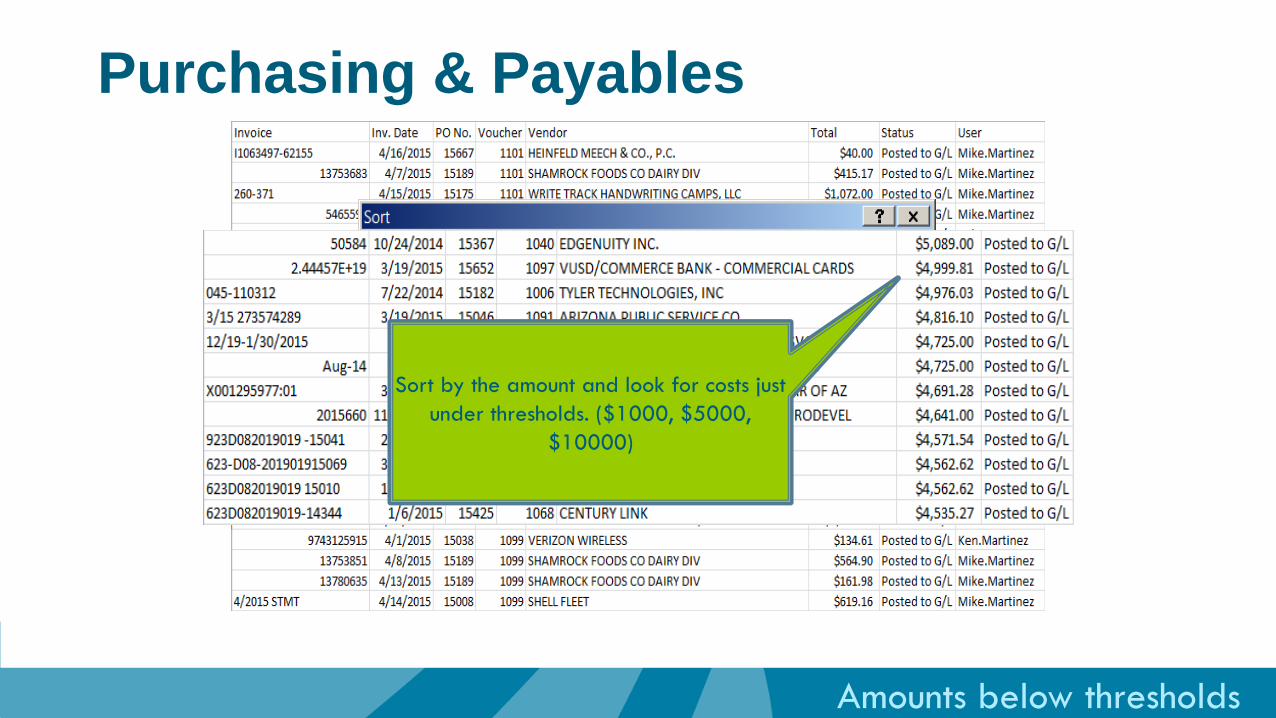
Amounts below thresholds
Sort by the amount and look for costs just
under thresholds. ($1000, $5000,
$10000)
Purchasing & Payables
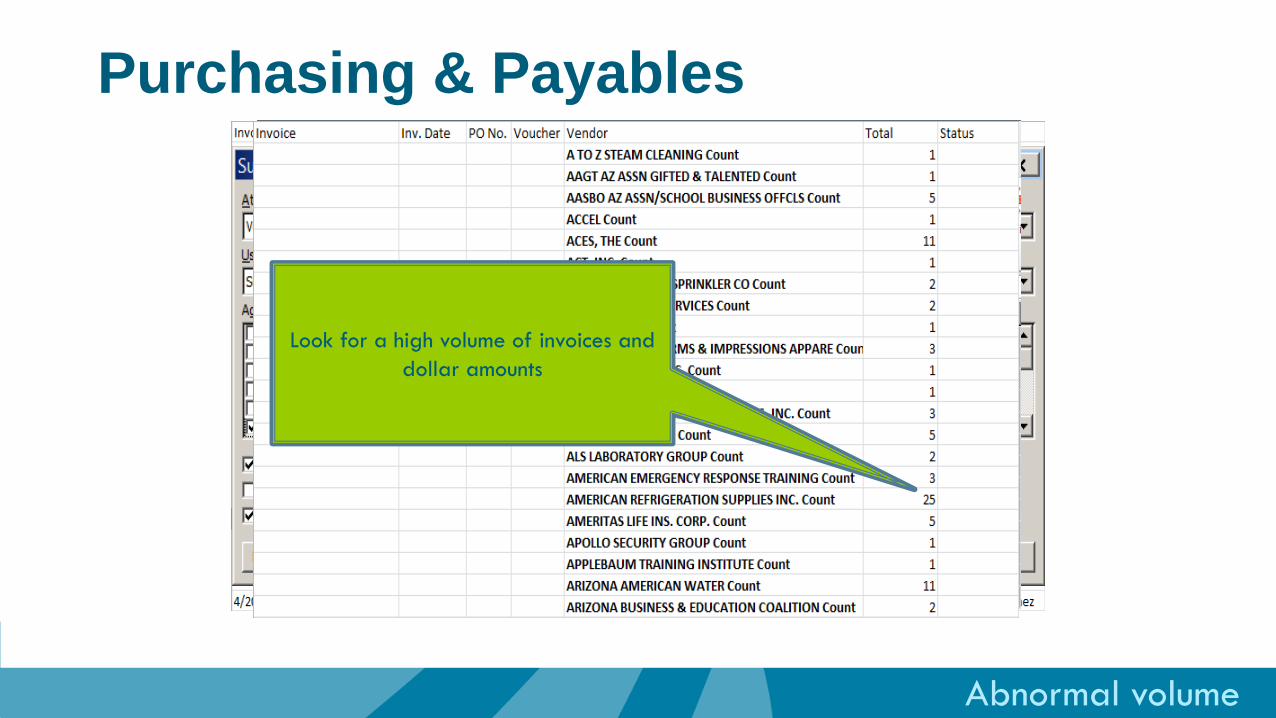
Abnormal volume
Use these options to roll up amounts
Look for a high volume of invoices and
dollar amounts
Purchasing & Payables
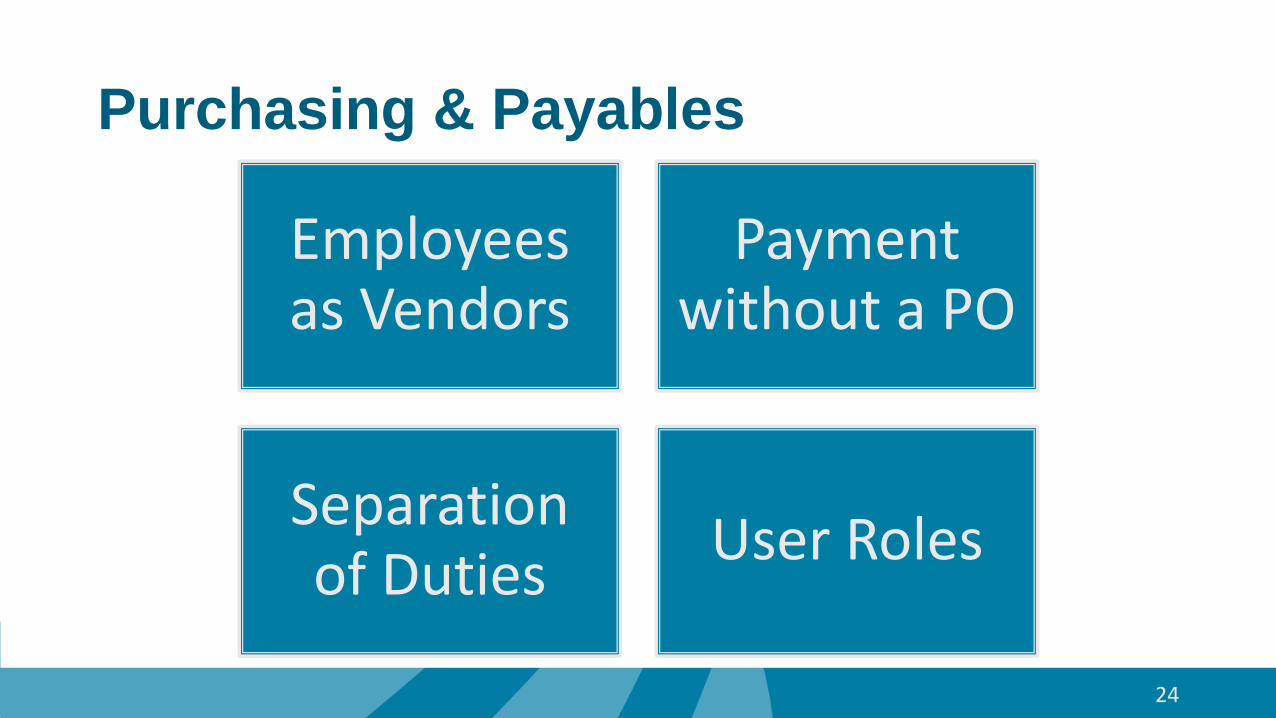
Purchasing & Payables
Employees as Vendors
Payment without a PO
Separation of Duties
User Roles
24
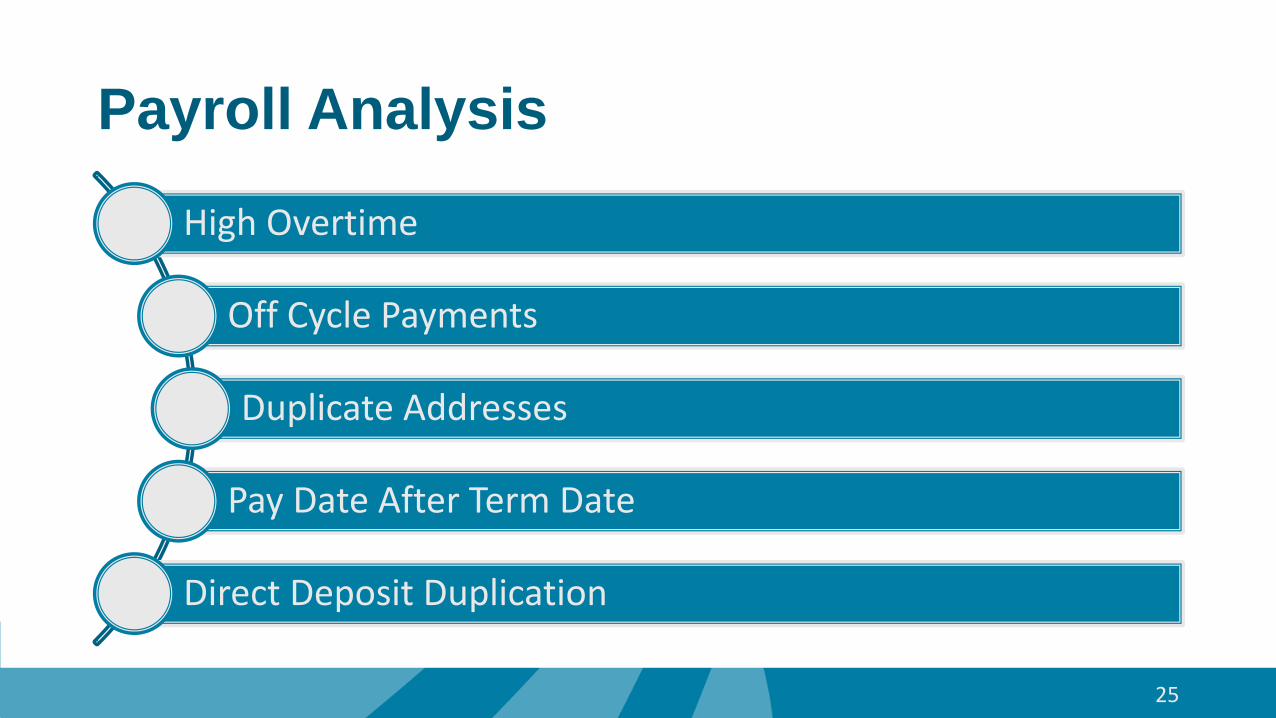
Payroll Analysis
High Overtime
Off Cycle Payments
Duplicate Addresses
Pay Date After Term Date
Direct Deposit Duplication
25
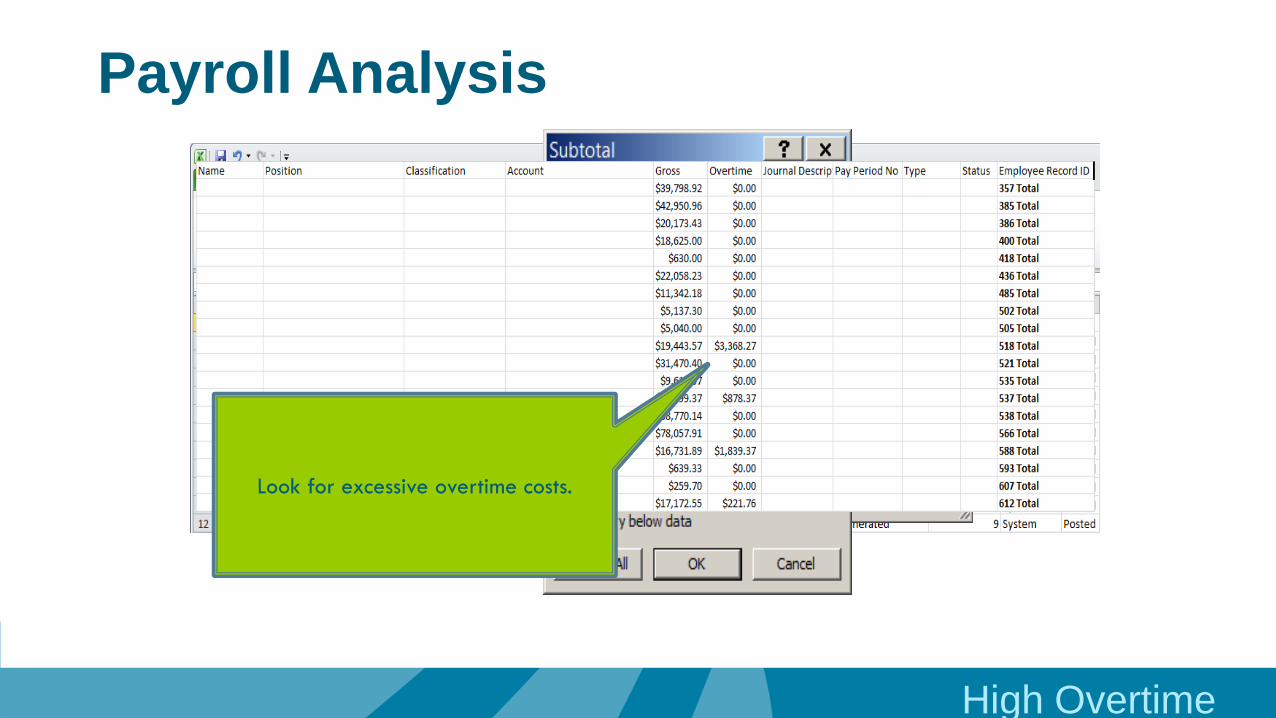
High Overtime
Look for excessive overtime costs.
Payroll Analysis
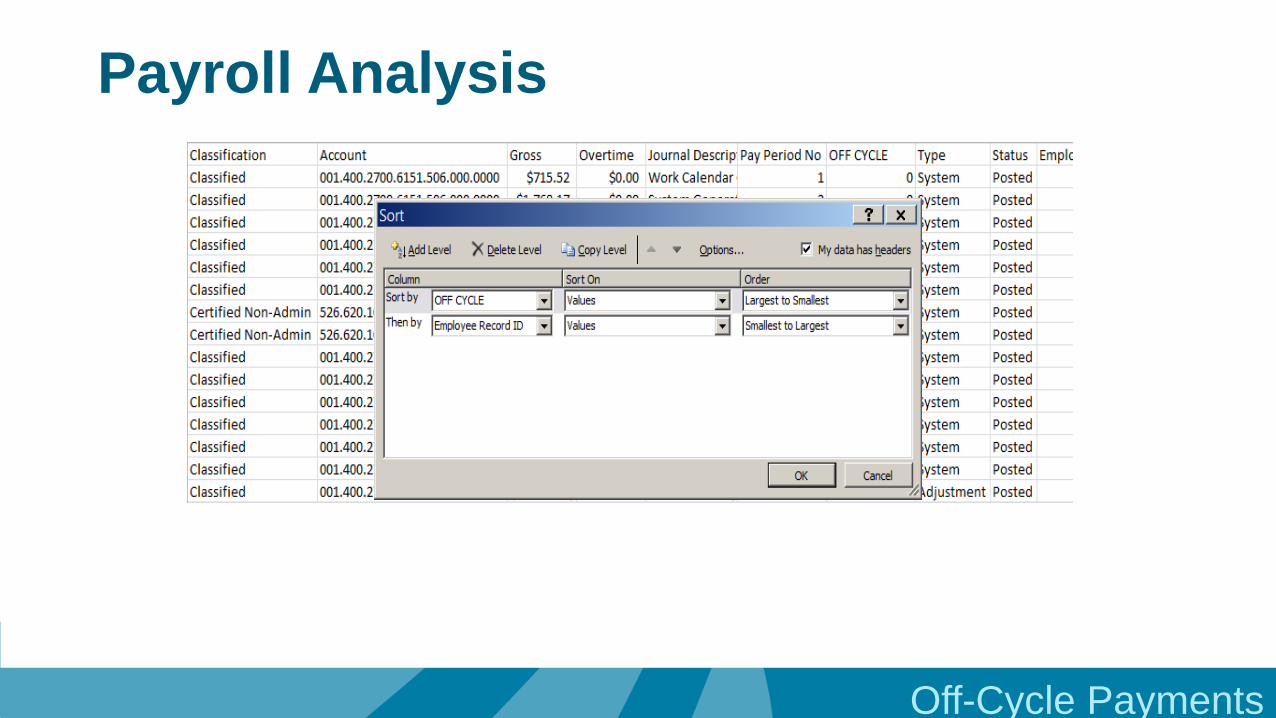
Off-Cycle Payments
Payroll Analysis
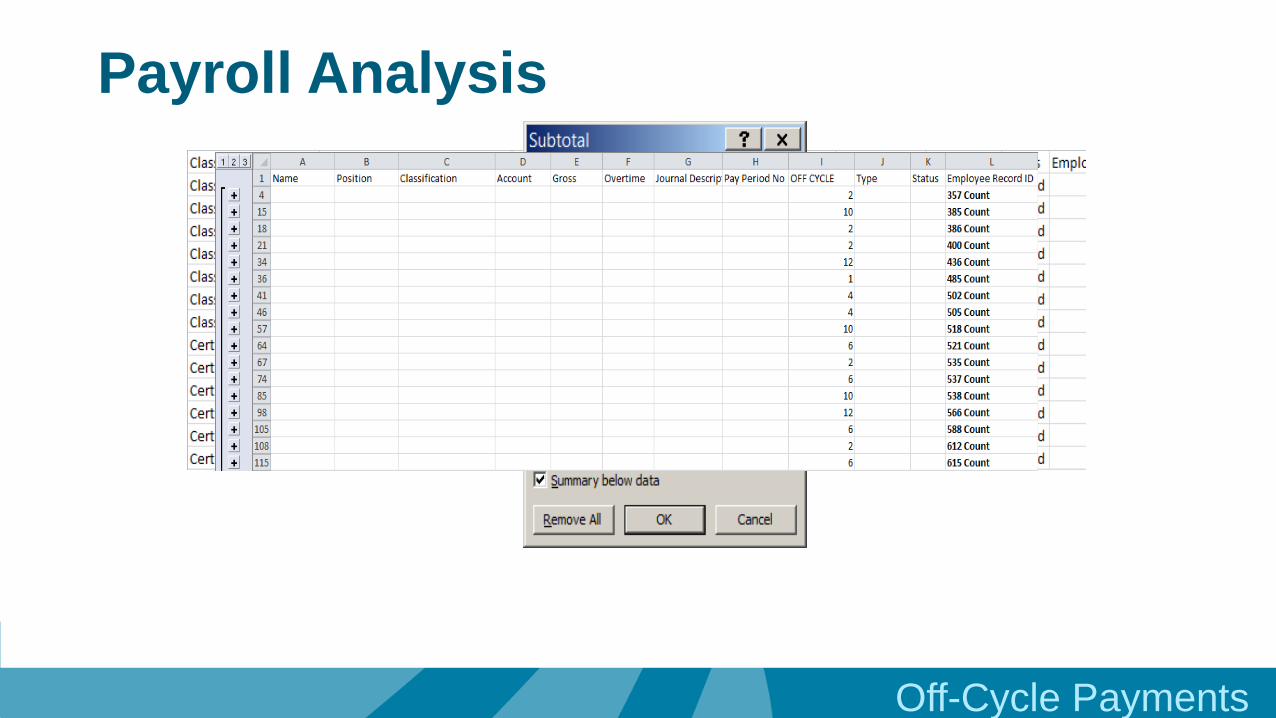
Off-Cycle Payments
Payroll Analysis
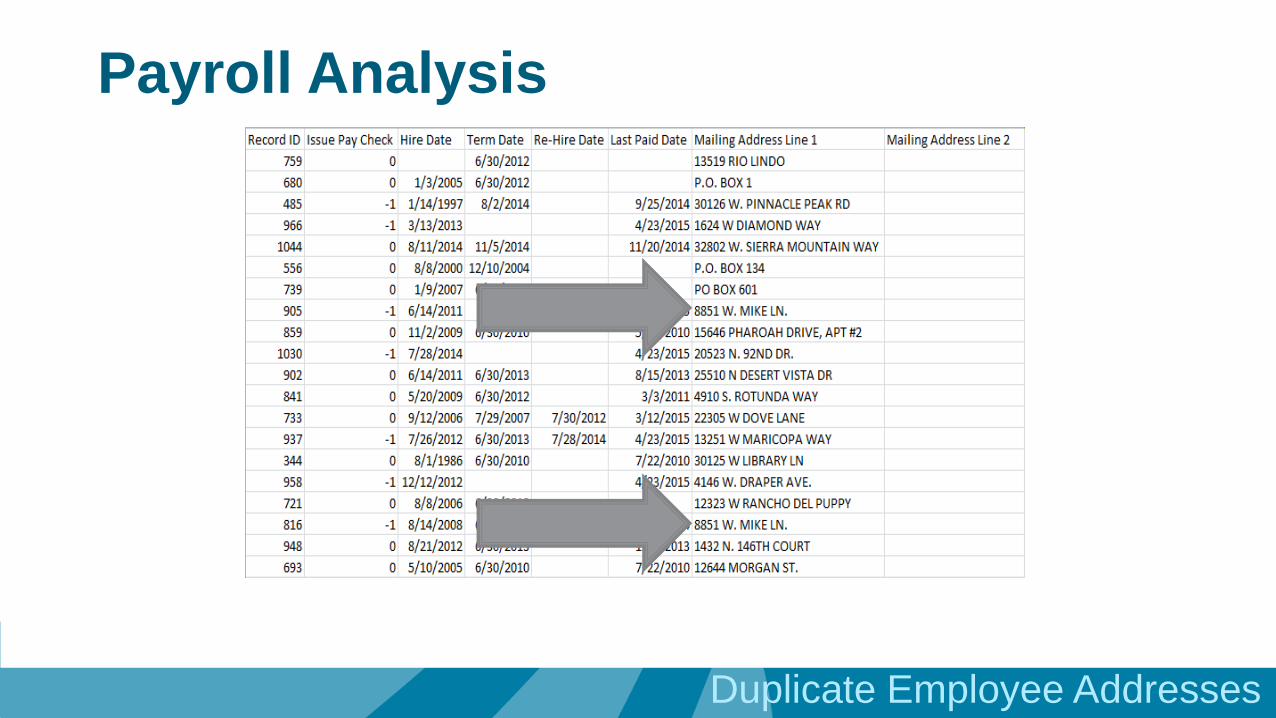
Duplicate Employee Addresses
Payroll Analysis
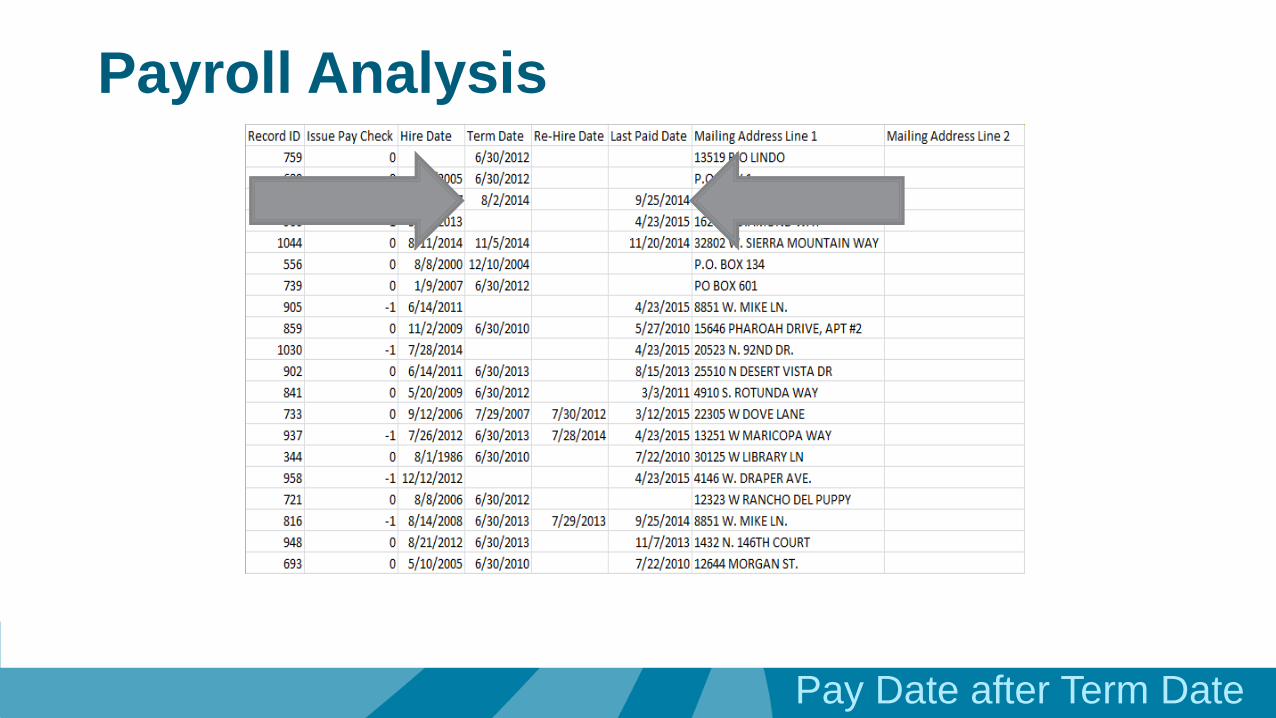
Pay Date after Term Date
Payroll Analysis
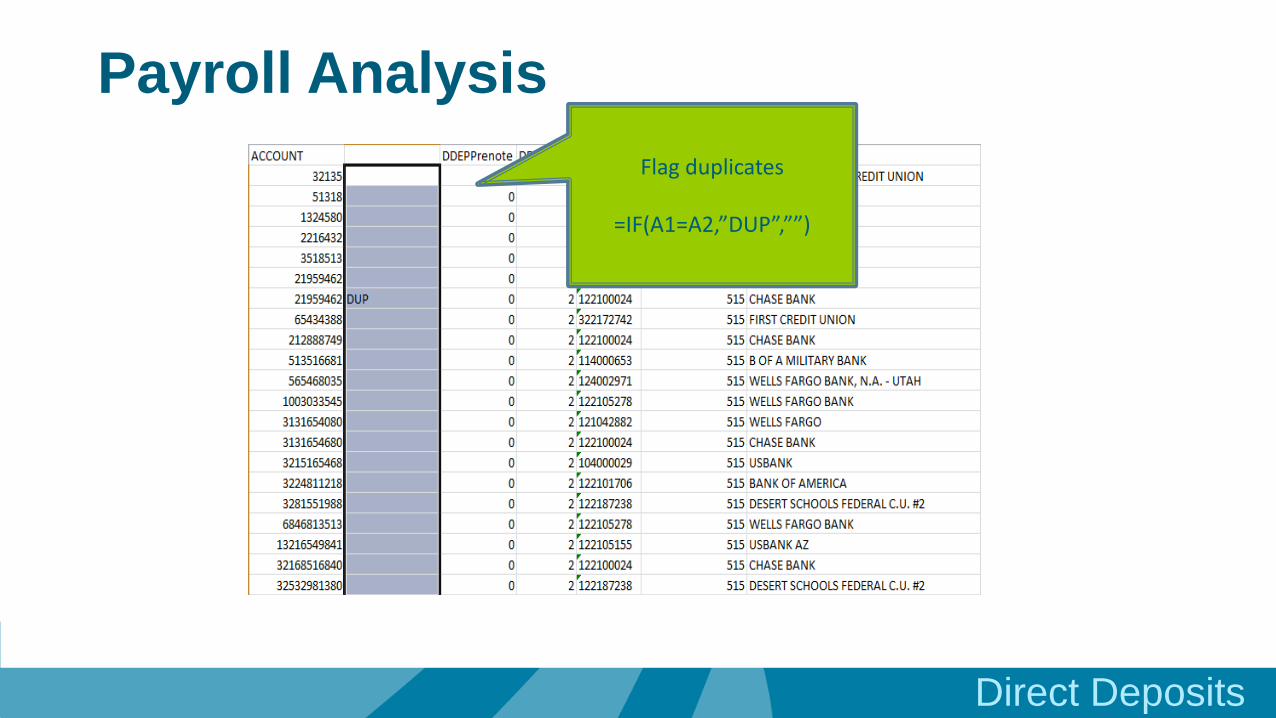
Direct Deposits
Flag duplicates
=IF(A1=A2,”DUP”,””)
Payroll Analysis
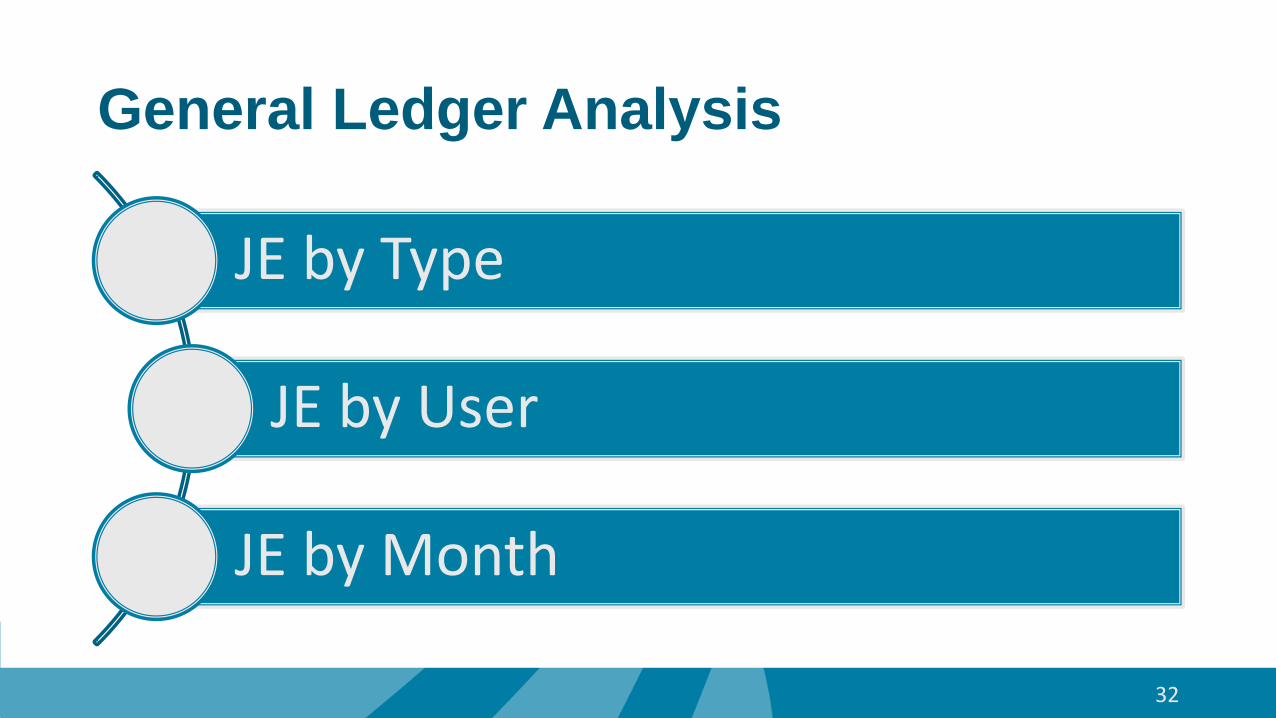
General Ledger Analysis
JE by Type
JE by User
JE by Month
32

JOURNAL USER Lines DEBIT_SUM CREDIT_SUM
Accounts Payable BWayne 10803 5,093,232.97 (5,086,485.10)Adjusting BWayne 14 4,079,311.89 (4,079,311.89)Deposits BWayne 1160 12,130,618.21 (12,130,618.21)Payroll BWayne 656 473,066.21 (473,066.21)Adjusting PParker 473 61,801.20 (61,801.20)Payroll PParker 3529 1,467,280.28 (1,467,280.28)Adjusting BBanner 40 11,851.86 (11,851.86)
Adjusting SRogers 7674 3,633,438.51 (3,633,438.51)Warehouse DLance 54 9,755.64 (9,755.64)
Adjusting MMurdock 218 488,395.54 (488,395.54)
Warehouse JHowlett 43 6,253.20 (6,253.20)
Adjusting DPrince 2370 16,652,036.65 (16,652,036.65)Adjusting JStorm 81 9,531.77 (9,531.77)Payroll JStorm 34760 17,550,658.85 (17,550,658.85)Accounts Payable CKent 3630 2,396,549.96 (2,396,549.96)
Adjusting BGrimm 24 3,321.76 (3,321.76)Adjusting TStark 6 2,092,940.91 (2,092,940.91)
Is it strange that TStark made so few adjusting entries totaling so much?
Journal Summary by Type & User
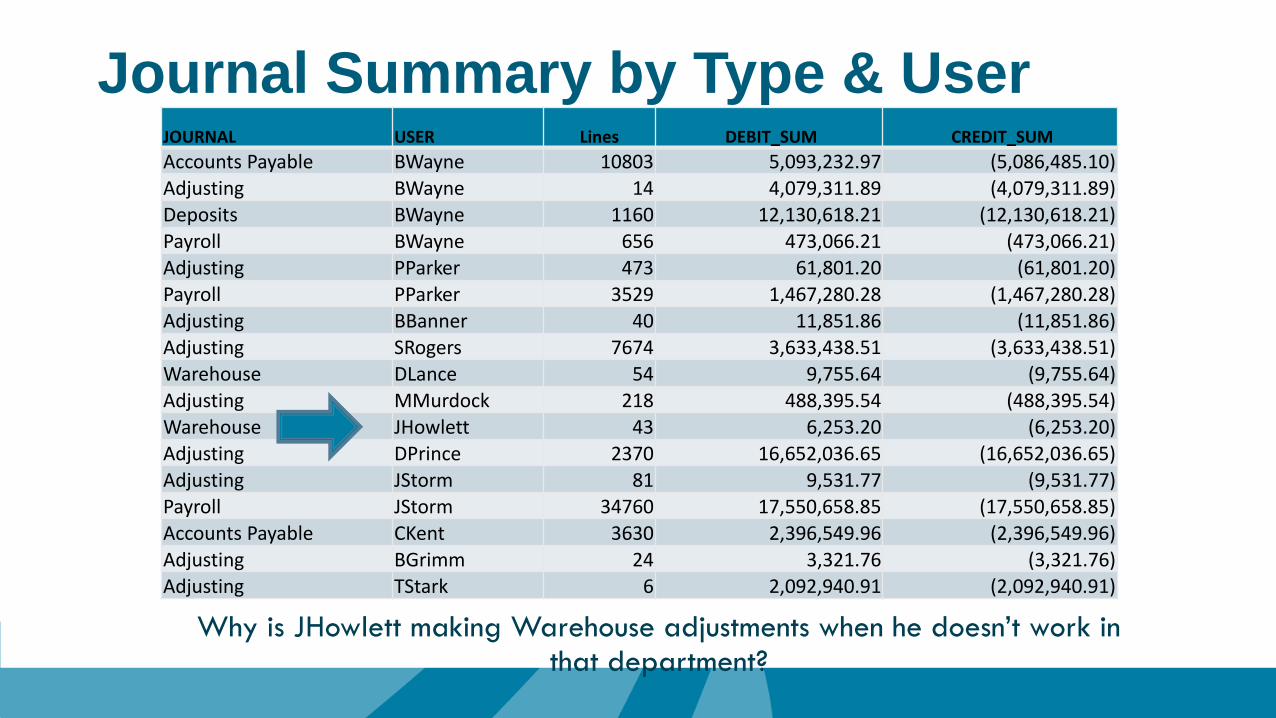
JOURNAL USER Lines DEBIT_SUM CREDIT_SUM
Accounts Payable BWayne 10803 5,093,232.97 (5,086,485.10)Adjusting BWayne 14 4,079,311.89 (4,079,311.89)Deposits BWayne 1160 12,130,618.21 (12,130,618.21)Payroll BWayne 656 473,066.21 (473,066.21)Adjusting PParker 473 61,801.20 (61,801.20)Payroll PParker 3529 1,467,280.28 (1,467,280.28)Adjusting BBanner 40 11,851.86 (11,851.86)
Adjusting SRogers 7674 3,633,438.51 (3,633,438.51)Warehouse DLance 54 9,755.64 (9,755.64)
Adjusting MMurdock 218 488,395.54 (488,395.54)
Warehouse JHowlett 43 6,253.20 (6,253.20)
Adjusting DPrince 2370 16,652,036.65 (16,652,036.65)Adjusting JStorm 81 9,531.77 (9,531.77)Payroll JStorm 34760 17,550,658.85 (17,550,658.85)Accounts Payable CKent 3630 2,396,549.96 (2,396,549.96)
Adjusting BGrimm 24 3,321.76 (3,321.76)Adjusting TStark 6 2,092,940.91 (2,092,940.91)
Why is JHowlett making Warehouse adjustments when he doesn’t work in that department?
Journal Summary by Type & User
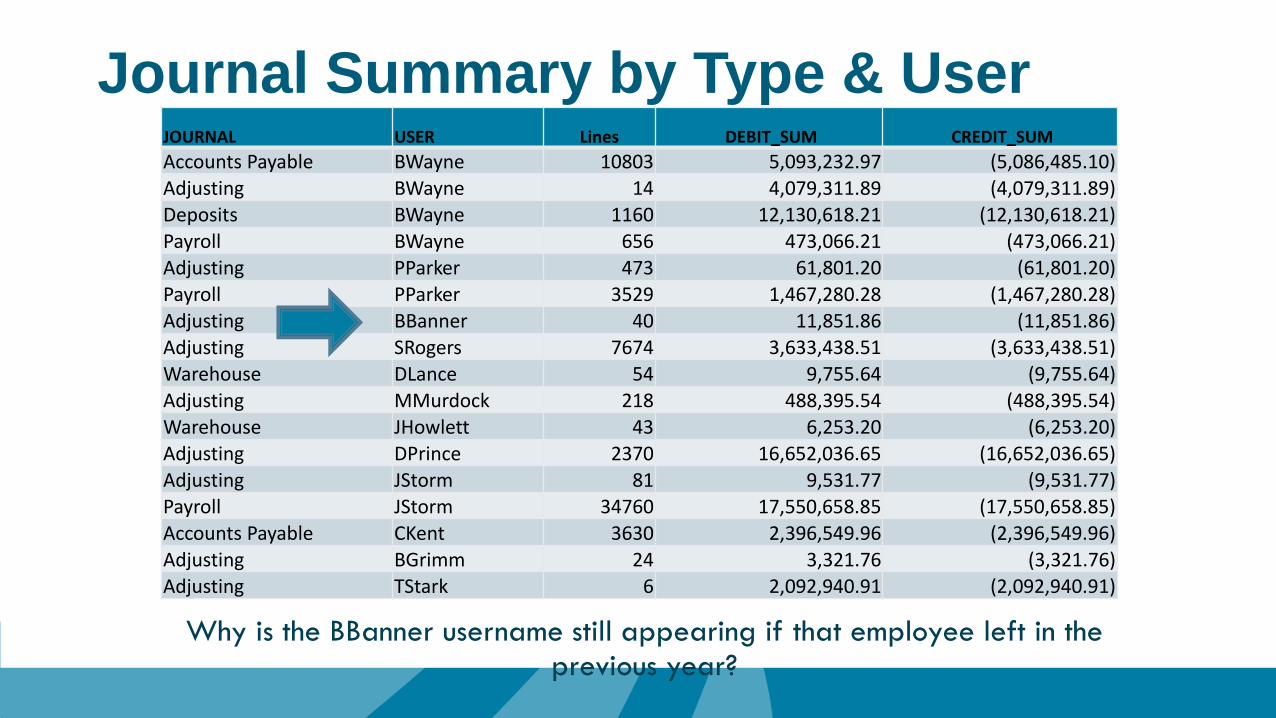
JOURNAL USER Lines DEBIT_SUM CREDIT_SUM
Accounts Payable BWayne 10803 5,093,232.97 (5,086,485.10)Adjusting BWayne 14 4,079,311.89 (4,079,311.89)Deposits BWayne 1160 12,130,618.21 (12,130,618.21)Payroll BWayne 656 473,066.21 (473,066.21)Adjusting PParker 473 61,801.20 (61,801.20)Payroll PParker 3529 1,467,280.28 (1,467,280.28)Adjusting BBanner 40 11,851.86 (11,851.86)
Adjusting SRogers 7674 3,633,438.51 (3,633,438.51)Warehouse DLance 54 9,755.64 (9,755.64)
Adjusting MMurdock 218 488,395.54 (488,395.54)
Warehouse JHowlett 43 6,253.20 (6,253.20)
Adjusting DPrince 2370 16,652,036.65 (16,652,036.65)Adjusting JStorm 81 9,531.77 (9,531.77)Payroll JStorm 34760 17,550,658.85 (17,550,658.85)Accounts Payable CKent 3630 2,396,549.96 (2,396,549.96)
Adjusting BGrimm 24 3,321.76 (3,321.76)Adjusting TStark 6 2,092,940.91 (2,092,940.91)
Why is the BBanner username still appearing if that employee left in the previous year?
Journal Summary by Type & User
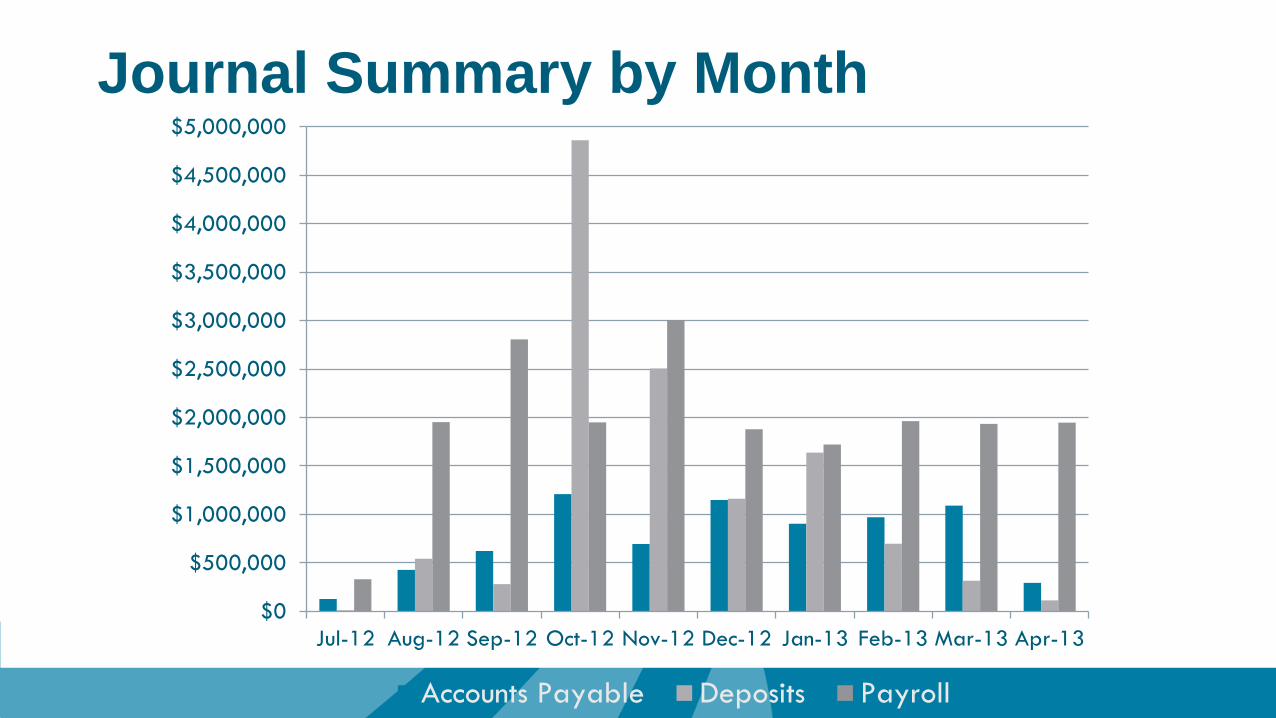
$0
$500,000
$1,000,000
$1,500,000
$2,000,000
$2,500,000
$3,000,000
$3,500,000
$4,000,000
$4,500,000
$5,000,000
Jul-12 Aug-12 Sep-12 Oct-12 Nov-12 Dec-12 Jan-13 Feb-13 Mar-13 Apr-13
Accounts Payable Deposits Payroll
Journal Summary by Month