from integrated to interconnected b2c e-commerce ... · 3.1 integrated b2c e-commerce distribution...
TRANSCRIPT
From Integrated to Interconnected B2C E-Commerce Distribution:
An agent-based simulation Assessment
Salma Naccache
1,2, Benoit Montreuil
1,2,3, Helia Sohrabi
1,2, François Barriault
1,2
and Edith Brotherton1,2
1. CIRRELT Interuniversity Research Center
2. Faculty of Business Administration, Université Laval, Québec, Canada
3. Canada Research Chair in Interconnected Business Engineering Corresponding author: [email protected]
Abstract: Current e-commerce logistics systems are based on the integration of the closed and
private distribution systems of different stakeholders including manufacturers, distributors and
Third Party Logistics (3PLs). The integrated e-commerce distribution systems suffer from
conventional distribution inefficiency and unsustainability symptoms such as underuse of
distribution center capacities and important physical flows resulting in important greenhouse
gas emissions and fuel consumption as well as operating underused capacity vehicles. In order
to overcome B2C e-commerce inefficiencies, Physical Internet (PI) enabled interconnected
distribution is a potent alternative to conventional logistics through its use of an open
Distribution Web supported by the exploitation of an open Mobility Web.
We present in this paper a multi-agent simulation based analysis of the implication of PI enabled
interconnected e-commerce distribution, where operational strategies are implemented through
the behavior of autonomous software agents, like optimization based dynamic inventory
balancing deployment planning. We report improvements in economic, social and environmental
performances of interconnected B2C distribution scenarios in comparison with performances of
integrated B2C distribution scenarios. We quantify the performances of a leading furniture
manufacturer through key performance indicators of simulated scenarios across different
distribution stages from the manufacturer factories until reaching the final E-Consumer.
Keywords: E-Commerce, Physical Internet, Interconnected Distribution, Performance,
Sustainability, Agent-Based Simulation.
1 Introduction
Business-to-Consumers (B2C) e-commerce distribution systems of leading players such as
Amazon.com and NewEgg.ca are currently typically operated through the integration of their
suppliers’ private distribution networks and the parcel delivery system of their preferred
contracted third party logistics (3PL) service provider (e.g. DHL, FedEx and UPS). The online
order placement and delivery can be summarized through the six following steps. (1) An e-
consumer orders online a product from the e-retailer website. (2) The online order information is
then transmitted from the e-retailer to the supplier’s information system. On its side, and
2
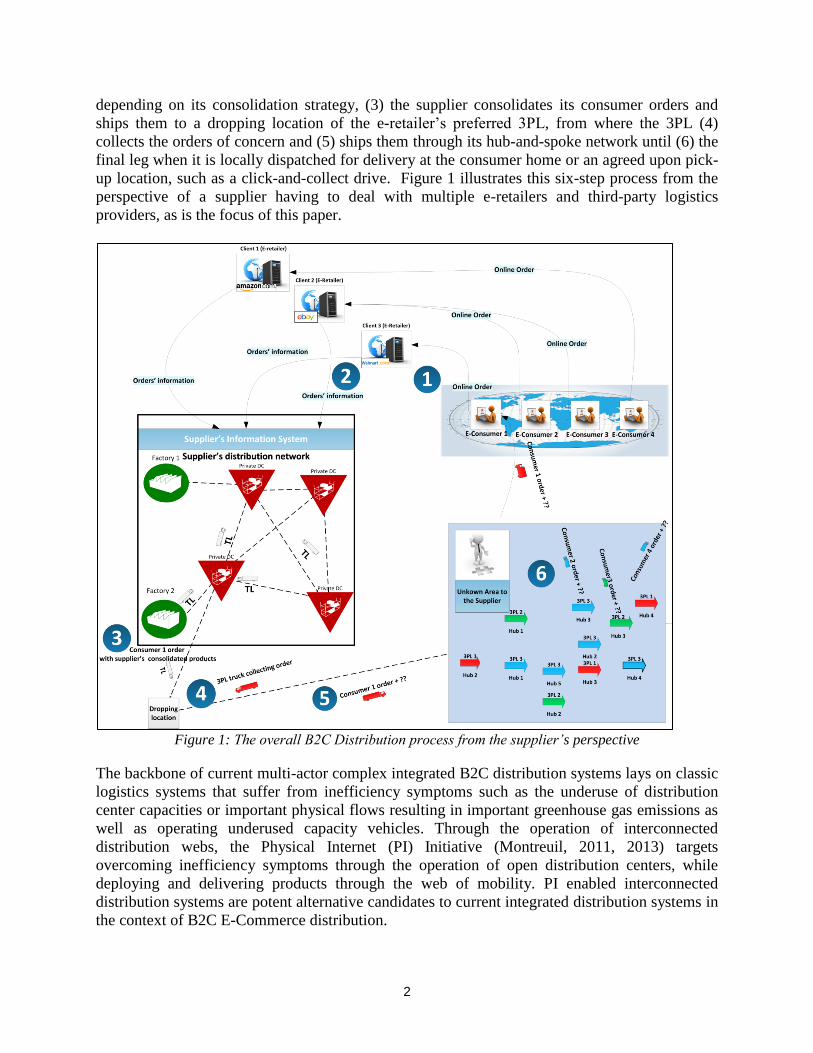
depending on its consolidation strategy, (3) the supplier consolidates its consumer orders and
ships them to a dropping location of the e-retailer’s preferred 3PL, from where the 3PL (4)
collects the orders of concern and (5) ships them through its hub-and-spoke network until (6) the
final leg when it is locally dispatched for delivery at the consumer home or an agreed upon pick-
up location, such as a click-and-collect drive. Figure 1 illustrates this six-step process from the
perspective of a supplier having to deal with multiple e-retailers and third-party logistics
providers, as is the focus of this paper.
Figure 1: The overall B2C Distribution process from the supplier’s perspective
The backbone of current multi-actor complex integrated B2C distribution systems lays on classic
logistics systems that suffer from inefficiency symptoms such as the underuse of distribution
center capacities or important physical flows resulting in important greenhouse gas emissions as
well as operating underused capacity vehicles. Through the operation of interconnected
distribution webs, the Physical Internet (PI) Initiative (Montreuil, 2011, 2013) targets
overcoming inefficiency symptoms through the operation of open distribution centers, while
deploying and delivering products through the web of mobility. PI enabled interconnected
distribution systems are potent alternative candidates to current integrated distribution systems in
the context of B2C E-Commerce distribution.
3
The aim of this paper is to validate the assertion that the exploitation of interconnected
distribution by an e-supplier improves the distribution system efficiency and sustainability from
economic, social and environmental perspectives. To this end, we adopt a multi-agent based
simulation approach which is suitable to model and mimic complex system dynamics such as
B2C distribution systems.
First, in section 2, we present a review actual integrated B2C E-Commerce distribution systems,
contrasting them with the arguments defending the PI interconnected distribution as a solution
for solving inefficiency and sustainability issues of these systems. In section 3, we present the
agent-based simulation models we developed to enable empirical comparative analysis of
integrated B2C distributions versus interconnected B2C distribution systems. Section 4 details
the simulation scenarios we used to investigate actual and alternative integrated B2C distribution
system as well as an alternative interconnected B2C distribution system of a leading e-commerce
furniture manufacturer that currently operating three distribution centers located nearby its
factories located near Québec City (Canada) and the city of Juarez (Mexico). Section 4 also
reports on the simulation results. Finally, we conclude in section 5 by highlighting the main
findings from our current research and presenting future research avenues for further
investigating interconnected B2C distribution systems.
2 Literature Review
The backbone of e-commerce logistics is notably based on the participation of suppliers and
parcel delivery service providers (Vergnion and Montreuil, 2001; Lim, H. and Shio, 2011).
Suppliers deploy physical goods and fulfill online demand while parcel delivery service
providers are responsible for delivering physical goods from the suppliers’ distribution centers to
drop points close to final consumer location (Yu and Xiu-yan, 2010). The overall resulting
distribution systems, from suppliers to the end consumers of their products, suffer from
inefficiency and unsustainability symptoms as underuse of distribution center capacities
(Kämäräinen and Punakivi, 2002) or important physical flows resulting in important greenhouse
gas emissions and fuel consumption as well as operating lowly filled vehicles (Taniguchi and
Kakimoto, 2003). In B2C e-commerce logistics, economies of scale are hard to achieve and
distribution costs may increase because of instable consumer demand (Lv and Zhang, 2010).
Distribution cost evolution depends not only on consumer demand profiles, but also on the
distribution sector (Zhu and Kraemer, 2002).
In order to overcome B2C e-commerce inefficiency aspects, PI enabled interconnected
distribution systems are an interesting alternative candidate to current integrated distribution
systems (Montreuil, 2011). With the Physical Internet, a Distribution Web is responsible for
storing physical objects encapsulated in modular containers while a Mobility Web is responsible
for moving these containers from source to destination in relay mode through open hubs (Hakimi
et al., 2012). The Distribution Web exploits the use of open distribution centers offering storage
spaces to heterogeneous suppliers, according to their storage capacity needs, without engaging
these suppliers in leasing or possessing distribution centers (Montreuil et al., 2012). The number
and location of open distribution centers in which a supplier stores its container-encapsulated
products are set so they are close to both suppliers and consumers. The “on-demand” storage
space in open distribution centers and their geographic location is an interesting solution to the
4
distribution center capacity underuse issue in e-commerce. Furthermore, the efficiency of the
Mobility Web can improve not only transportation costs incurred to the e-suppliers, but also
overall vehicle fuel consumption and induced greenhouse gas emission.
The conventional integrated B2C distribution and the alternative interconnected distribution
consist in complex systems where several processes from various actors interact in order to run
the operations of the deployment and delivery of online ordered products. Then there is a need
for a decision support tool in order to analyze and compute performances from both distribution
systems. Simulations are widely used in supply chain management as decision support tools
(Cimino et al. 2010). In particular, multi-agent simulation platforms are suitable to model and
mimic complex system dynamics (Jennings, 2000; Govindu and Chinnam, 2007). Thus we
choose to adopt a multi-agent simulation based analysis approach in order to contrast between
actual and alternative E-Commerce distribution systems.
3 The open distribution web simulation model
We propose two simulation models for modeling and analyzing integrated and interconnected
B2C e-commerce distribution systems. The first model considers the specificities of integrated
distribution where supplier private distribution systems interact with 3PL hub-and-spoke
networks to analyze resulting supplier performances in current e-commerce distribution
scenarios. The second model takes into consideration the exploitation of an open Logistics Web
with its Distribution and Mobility Web constituents (Montreuil et al. 2013) as enablers for an
interconnected B2C distribution, in order to analyze supplier’s resulting performances from
scenarios of PI-enabled distribution as a logistics alternative in the context of B2C e-commerce.
3.1 Integrated B2C e-commerce distribution simulation model
In order to contrast actual e-commerce distribution performances with potential performances
resulting from interconnected distribution scenarios, we use the agent-based simulation model
we proposed in Naccache et al. (2014). In our previous work, we presented the main components
from a B2C integrated distribution network simulation model, i.e., the agents, the agent
behaviors and the simulation parameters. The agents are the autonomous software components
that are responsible for reproducing a given distribution process, i.e. Shipment, Inventory,
Production, Product deployment and Consumer orders. Shipment agent is responsible for
executing product deployment orders communicated by the Distribution agent. Also, Shipment
agent is responsible for consumer order routing and shipments. It is associated with the factories,
distribution centers (DCs) and 3PL hubs. Inventory agent adjusts inventory levels according to
received and shipped products and is associated to (DCs). Production agent plans and executes
production calendars in factory nodes. Distribution agent is responsible for product deployment
decisions which are executed by the factory and DC Shipment agents. Finally, Consumer agents
order products from their respective locations.
Each agent implements a set of behaviors according to its responsibility and to the simulated
distribution scenario. An agent behavior object may notably reproduce the historic behavior of a
process (based on an operational log) or an operational logic. In addition to agent behavior, a
simulation scenario is set up through simulation parameter values. Simulation parameters that are
shared among all simulation scenarios can be assigned to one of four categories concerning,
5
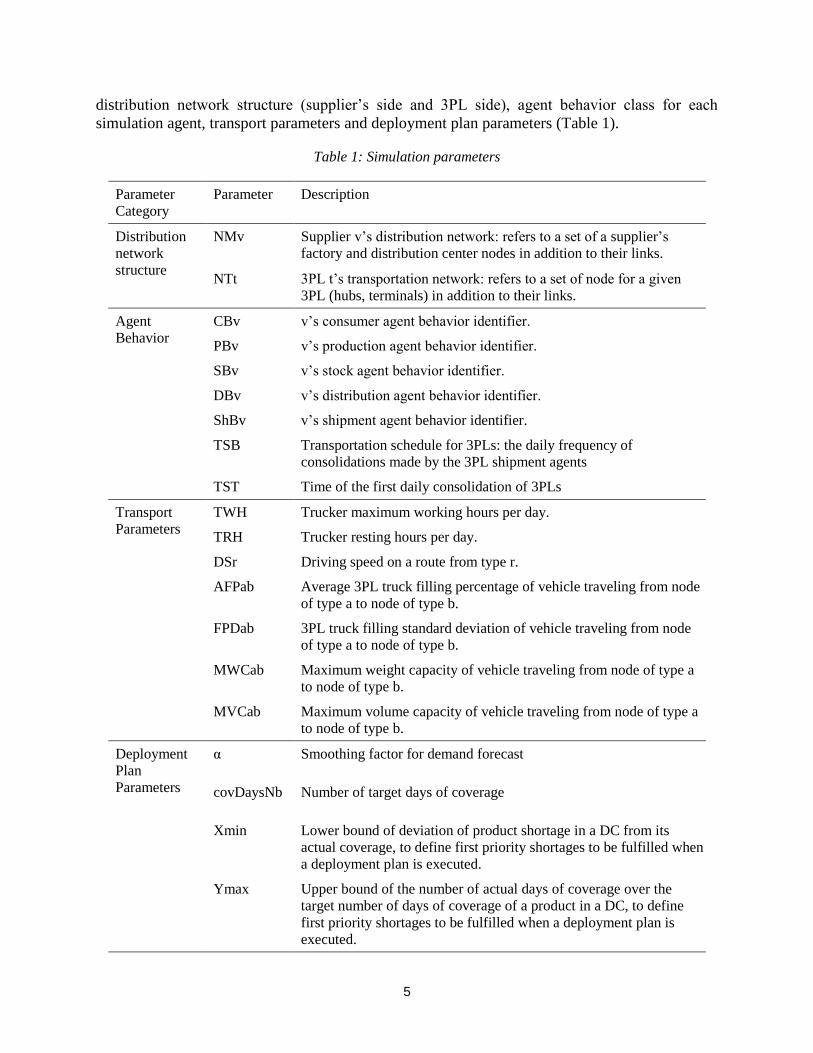
distribution network structure (supplier’s side and 3PL side), agent behavior class for each
simulation agent, transport parameters and deployment plan parameters (Table 1).
Table 1: Simulation parameters
Parameter
Category
Parameter Description
Distribution
network
structure
NMv Supplier v’s distribution network: refers to a set of a supplier’s
factory and distribution center nodes in addition to their links.
NTt 3PL t’s transportation network: refers to a set of node for a given
3PL (hubs, terminals) in addition to their links.
Agent
Behavior
CBv v’s consumer agent behavior identifier.
PBv v’s production agent behavior identifier.
SBv v’s stock agent behavior identifier.
DBv v’s distribution agent behavior identifier.
ShBv v’s shipment agent behavior identifier.
TSB Transportation schedule for 3PLs: the daily frequency of
consolidations made by the 3PL shipment agents
TST Time of the first daily consolidation of 3PLs
Transport
Parameters
TWH Trucker maximum working hours per day.
TRH Trucker resting hours per day.
DSr Driving speed on a route from type r.
AFPab Average 3PL truck filling percentage of vehicle traveling from node
of type a to node of type b.
FPDab 3PL truck filling standard deviation of vehicle traveling from node
of type a to node of type b.
MWCab Maximum weight capacity of vehicle traveling from node of type a
to node of type b.
MVCab Maximum volume capacity of vehicle traveling from node of type a
to node of type b.
Deployment
Plan
Parameters
α Smoothing factor for demand forecast
covDaysNb Number of target days of coverage
Xmin Lower bound of deviation of product shortage in a DC from its
actual coverage, to define first priority shortages to be fulfilled when
a deployment plan is executed.
Ymax Upper bound of the number of actual days of coverage over the
target number of days of coverage of a product in a DC, to define
first priority shortages to be fulfilled when a deployment plan is
executed.
6
The resulting integrated distribution simulation models current B2C e-commerce logistics
scenarios and can be adapted to model as well alternative B2C distribution scenarios. In order to
assess the potential of adopting PI enabled interconnected distribution in the B2C distribution
contexts, we extended the previous model to take into account the special characteristics of the
interconnected distribution to obtain the PI-Enabled interconnected distribution simulation
model.
3.2 PI-Enabled interconnected distribution simulation model
In order to highlight the e-supplier performance improvements when adopting an interconnected
distribution system in B2C versus a conventional integrated distribution, we developed a
simulation model inspired from the one presented in section 3.1. This second simulation model
takes into consideration the special features of interconnected distribution, namely the open
Distribution and Mobility Webs.
A supplier’s preferred interconnected distribution network is a set of open DCs selected from the
set of all available open DC operating the interconnected distribution system. During strategic
planning, the preferred open DCs of a supplier are located so as to minimize the total logistics
cost including DC exploitation cost, inventory holding and transportation costs, as well as
business-specific environmental and social goals. In comparison with an integrated e-commerce
distribution system, the number of open DCs in the resulting preferred interconnected network
exceeds DCs within a supplier’s private distribution network. Meanwhile, no leasing or
acquisition cost is incurred to suppliers while “virtually implementing” their preferred
interconnected distribution network. The preferred open DC network is generated previously to
simulation scenario instantiation thanks to a network design heuristic or exact optimization
model. The resulting preferred DC network is set as a simulation parameter input. Furthermore,
assuming the use of the Mobility Web, the Distribution agent behavior and the Shipment agent
behavior in an interconnected simulation model, differ from their equivalent in the integrated
distribution simulation model. We provide more details about the differences between these
agent behaviors in section 3.3.
In order to model the integration of the Mobility Web into the interconnected distribution
simulation model, we do no longer take into account the explicit participation of each 3PL in the
distribution system, rather assuming that all transportation services are provided by the Mobility
Web in which numerous 3PLs are to contribute. In the integrated distribution system, products
are usually transported in a truckload (TL) mode between private supplier DCs (Deployment
stage), where vehicles only contain this e-supplier’s products. In addition, consumer orders
shipped to their final consumers from their e-supplier’s closest private DCs (Order Delivery
stage) are transported by the parcel delivery service providers in a Less-Than-Truckload (LTL)
mode, where vehicles contain the consumer orders of the e-supplier mixed in with parcels from
other heterogeneous sources.
Assuming the use of a fully functional Mobility Web, product transportation across an
interconnected distribution system is made in a LTL-like service in both Deployment and Order
Delivery stages, where vehicles transporting an e-supplier’s products also contain products from
other sources. The transportation cost of a vehicle in a Mobility Web is modeled as being
proportional to the distance traveled and to the total weight of transported products over the total
weight load capacity of the truck. In the Deployment stage, the e-supplier’s product deployment
7
transportation cost is modeled as being proportional to the total weight of supplier’s products
over the total weight load of the vehicle (E-Supplier contribution to the vehicle cost), where we
assume that a vehicle in this stage is in average fully loaded at a predetermined level (such as
90% in this study). In the Order Delivery stage, the e-supplier’s consumer order transportation
cost is composed from the contribution of the e-supplier to the vehicle cost plus a handling cost
proportional to the weight of each consumer order. At the Order Delivery stage, we assume that
a vehicle is in average fully loaded at an average predetermined level (here 50%).
Finally, the simulation parameters in this simulation model are kept the same as presented in
Table 1, while discarding the ones attached to a specific 3PL’s activities (i.e: TSB, TST, AFPab
and FPDab).
3.3 Agent behaviors
Each software agent in our simulation models is responsible for one distribution process, while
their associated behaviors can be changed to model different distribution scenarios, i.e.
integrated and interconnected distribution scenarios. For the extent of the current research, we
used the same Consumer, Production and Inventory agent behaviors in both the integrated and
interconnected distribution simulation models, while we developed for each simulation model a
specific Distribution agent behavior and a Shipment agent behavior.
Shared agent behaviors
The Consumer agent behavior is implemented by the Consumer agent. It consists of a historic
behavior reproducing the log of consumer orders from our industrial partner, saved in the
HistoricConsumerOrder database table. The Production agent behavior is implemented by the
Production agent. It consists of a historic behavior playing back E-Supplier’s production orders
calendar saved in the HistoricProduction database Table. The Inventory agent behavior is
implemented by the Inventory agent. It adjusts the on hand inventory level of products at each
DC according to received and shipped products.
The Shipment agent behavior
The Shipment agent behavior that is implemented by the Shipment agent consists in shipping
product quantities between DCs, as ordered by the Distribution agent, at the Deployment stage.
At the Order Delivery stage, the Shipment agent behavior routes consumer orders from their
closest DC having the ordered product in inventory and located within a maximum distance
distance (MaxDistance) that allows it to fulfill the consumer order within the promised delay.
MaxDistance parameter is specific to the Shipment agent behaviors we developed within the
scope of this paper. In the integrated distribution simulation model the Shipment agent behavior
routes the consumer orders from their respective private DCs to their final consumer locations,
across the hubs of their client assigned 3PL, using a shortest path algorithm. In the
interconnected distribution simulation model, the Shipment agent behavior directly ships orders
from their respective open DCs directly to their final consumer locations, assuming the existence
of PI-hubs from the Mobility Web.
8
The Distribution agent behavior
The Distribution agent behavior implemented by the Distribution agent aims at dynamically
deploying product excesses in DCs to balance inventory levels all over the distribution network
in order to respond smartly to forecasted demand, according to the needs of each DC for each
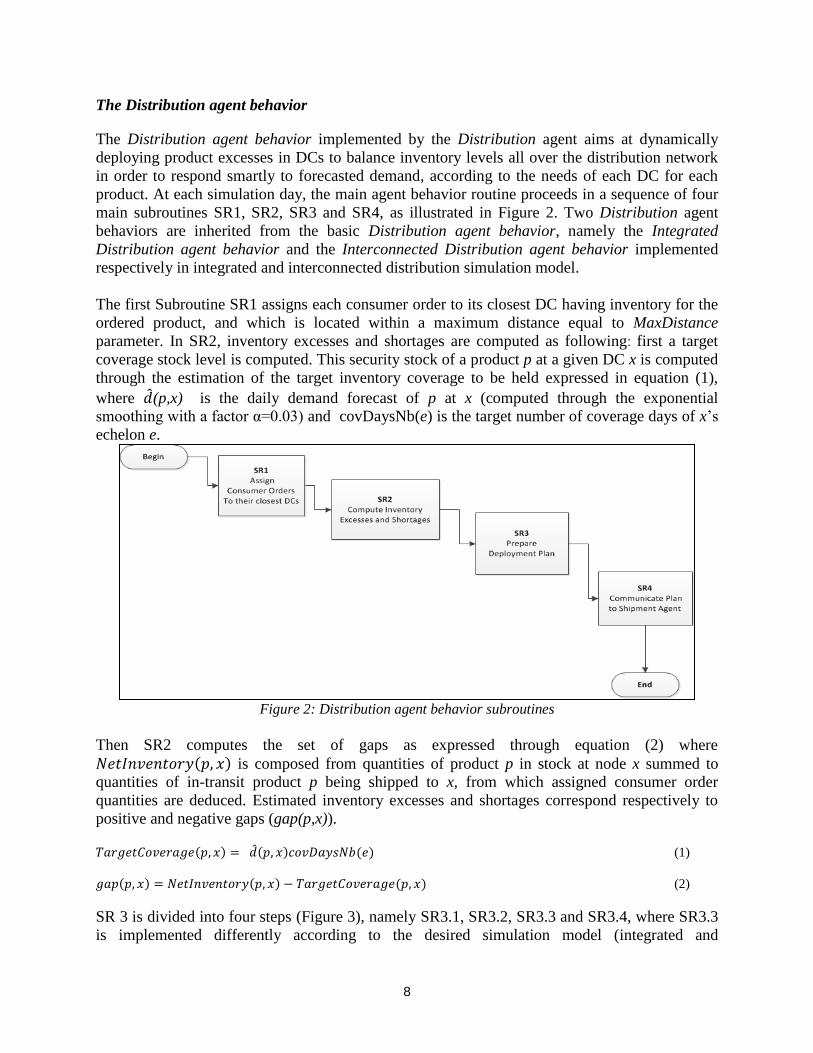
product. At each simulation day, the main agent behavior routine proceeds in a sequence of four
main subroutines SR1, SR2, SR3 and SR4, as illustrated in Figure 2. Two Distribution agent
behaviors are inherited from the basic Distribution agent behavior, namely the Integrated
Distribution agent behavior and the Interconnected Distribution agent behavior implemented
respectively in integrated and interconnected distribution simulation model.
The first Subroutine SR1 assigns each consumer order to its closest DC having inventory for the
ordered product, and which is located within a maximum distance equal to MaxDistance
parameter. In SR2, inventory excesses and shortages are computed as following: first a target
coverage stock level is computed. This security stock of a product p at a given DC x is computed
through the estimation of the target inventory coverage to be held expressed in equation (1),
where ̂(p,x) is the daily demand forecast of p at x (computed through the exponential
smoothing with a factor α=0.03) and covDaysNb(e) is the target number of coverage days of x’s
echelon e.
Figure 2: Distribution agent behavior subroutines
Then SR2 computes the set of gaps as expressed through equation (2) where
( ) is composed from quantities of product p in stock at node x summed to
quantities of in-transit product p being shipped to x, from which assigned consumer order
quantities are deduced. Estimated inventory excesses and shortages correspond respectively to
positive and negative gaps (gap(p,x)).
( ) ̂( ) ( ) (1)
( ) ( ) ( ) (2)
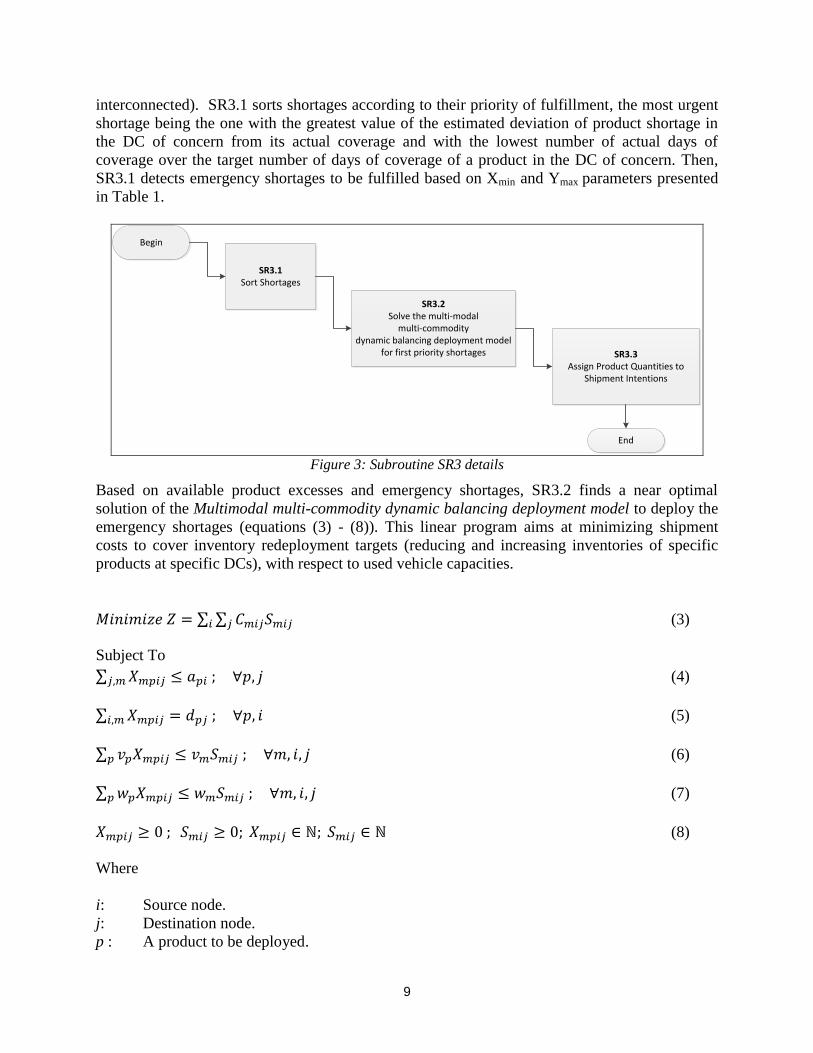
SR 3 is divided into four steps (Figure 3), namely SR3.1, SR3.2, SR3.3 and SR3.4, where SR3.3
is implemented differently according to the desired simulation model (integrated and
9
interconnected). SR3.1 sorts shortages according to their priority of fulfillment, the most urgent
shortage being the one with the greatest value of the estimated deviation of product shortage in
the DC of concern from its actual coverage and with the lowest number of actual days of
coverage over the target number of days of coverage of a product in the DC of concern. Then,
SR3.1 detects emergency shortages to be fulfilled based on Xmin and Ymax parameters presented
in Table 1.
Begin
End
SR3.1Sort Shortages
SR3.2Solve the multi-modal
multi-commodity dynamic balancing deployment model
for first priority shortages SR3.3Assign Product Quantities to
Shipment Intentions
Figure 3: Subroutine SR3 details
Based on available product excesses and emergency shortages, SR3.2 finds a near optimal
solution of the Multimodal multi-commodity dynamic balancing deployment model to deploy the
emergency shortages (equations (3) - (8)). This linear program aims at minimizing shipment
costs to cover inventory redeployment targets (reducing and increasing inventories of specific
products at specific DCs), with respect to used vehicle capacities.
∑ ∑ (3)
Subject To
∑ (4)
∑ (5)
∑ (6)
∑ (7)
(8)
Where
i: Source node.
j: Destination node.
p : A product to be deployed.
10
m : Vehicle type (Ex.: 53' truck, van).
: Quantity of product p available to be deployed from source node i.
: Quantity of product p to be fulfilled at destination node j.
: Weight of product p.
: Volume of product p.
: Weight capacity of vehicle of type m.
: Volume capacity of vehicle of type m.
: Cost of a vehicle of type m shipping from i to j.
: Decision variable of the quantities of p to be deployed from i to j using vehicles from type
m.
: Decision variable for the target number of vehicles of type m to be used to ship products
from i to j.
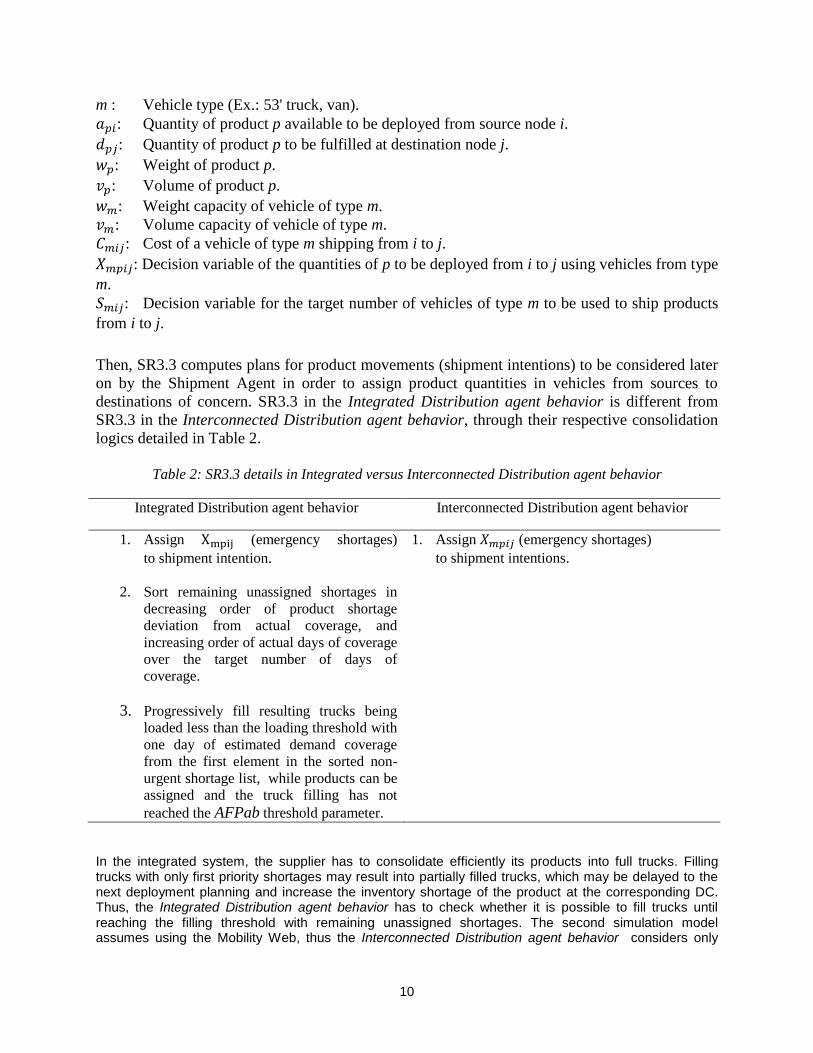
Then, SR3.3 computes plans for product movements (shipment intentions) to be considered later
on by the Shipment Agent in order to assign product quantities in vehicles from sources to
destinations of concern. SR3.3 in the Integrated Distribution agent behavior is different from
SR3.3 in the Interconnected Distribution agent behavior, through their respective consolidation
logics detailed in Table 2.
Table 2: SR3.3 details in Integrated versus Interconnected Distribution agent behavior
Integrated Distribution agent behavior Interconnected Distribution agent behavior
1. Assign (emergency shortages)
to shipment intention.
2. Sort remaining unassigned shortages in
decreasing order of product shortage
deviation from actual coverage, and
increasing order of actual days of coverage
over the target number of days of
coverage.
3. Progressively fill resulting trucks being
loaded less than the loading threshold with
one day of estimated demand coverage
from the first element in the sorted non-
urgent shortage list, while products can be
assigned and the truck filling has not
reached the AFPab threshold parameter.
1. Assign (emergency shortages)
to shipment intentions.
In the integrated system, the supplier has to consolidate efficiently its products into full trucks. Filling trucks with only first priority shortages may result into partially filled trucks, which may be delayed to the next deployment planning and increase the inventory shortage of the product at the corresponding DC. Thus, the Integrated Distribution agent behavior has to check whether it is possible to fill trucks until reaching the filling threshold with remaining unassigned shortages. The second simulation model assumes using the Mobility Web, thus the Interconnected Distribution agent behavior considers only
11
assigning first priority shortages, having the confidence that the Web of mobility system would achieve full trucks including not only the supplier’s product, but also other items of other organizations, stored in the source open DC and heading toward the same next destination.
Finally, in SR3.4, the Distribution agent communicates each shipment intention corresponds to
truck filled beyond AFPab threshold parameter, as shipment orders.
4 Experiment and results
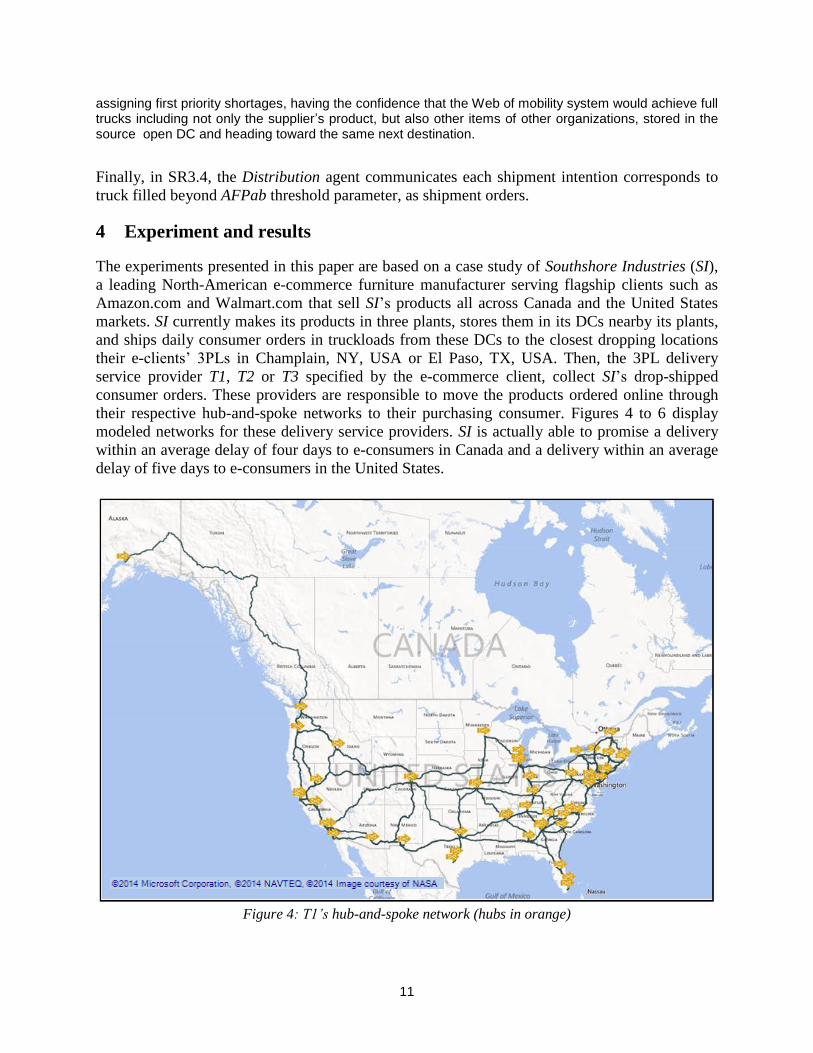
The experiments presented in this paper are based on a case study of Southshore Industries (SI),
a leading North-American e-commerce furniture manufacturer serving flagship clients such as
Amazon.com and Walmart.com that sell SI’s products all across Canada and the United States
markets. SI currently makes its products in three plants, stores them in its DCs nearby its plants,
and ships daily consumer orders in truckloads from these DCs to the closest dropping locations
their e-clients’ 3PLs in Champlain, NY, USA or El Paso, TX, USA. Then, the 3PL delivery
service provider T1, T2 or T3 specified by the e-commerce client, collect SI’s drop-shipped
consumer orders. These providers are responsible to move the products ordered online through
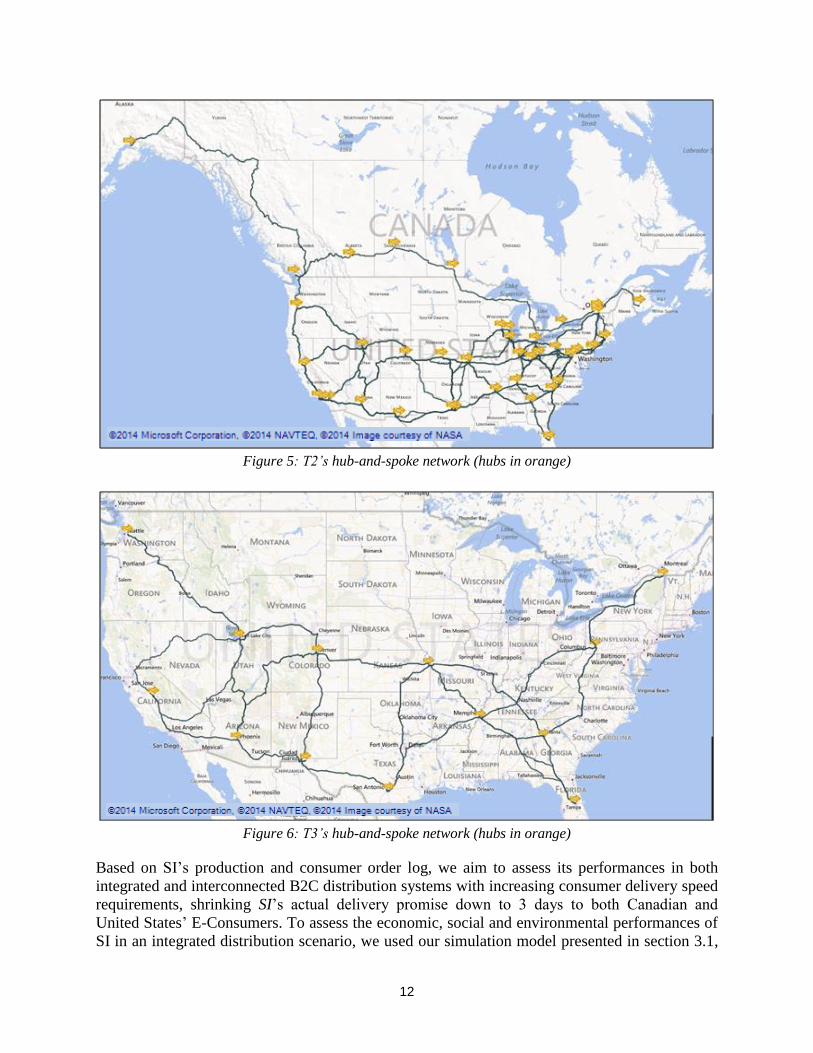
their respective hub-and-spoke networks to their purchasing consumer. Figures 4 to 6 display
modeled networks for these delivery service providers. SI is actually able to promise a delivery
within an average delay of four days to e-consumers in Canada and a delivery within an average
delay of five days to e-consumers in the United States.
Figure 4: T1’s hub-and-spoke network (hubs in orange)
12
Figure 5: T2’s hub-and-spoke network (hubs in orange)
Figure 6: T3’s hub-and-spoke network (hubs in orange)
Based on SI’s production and consumer order log, we aim to assess its performances in both
integrated and interconnected B2C distribution systems with increasing consumer delivery speed
requirements, shrinking SI’s actual delivery promise down to 3 days to both Canadian and
United States’ E-Consumers. To assess the economic, social and environmental performances of
SI in an integrated distribution scenario, we used our simulation model presented in section 3.1,
13
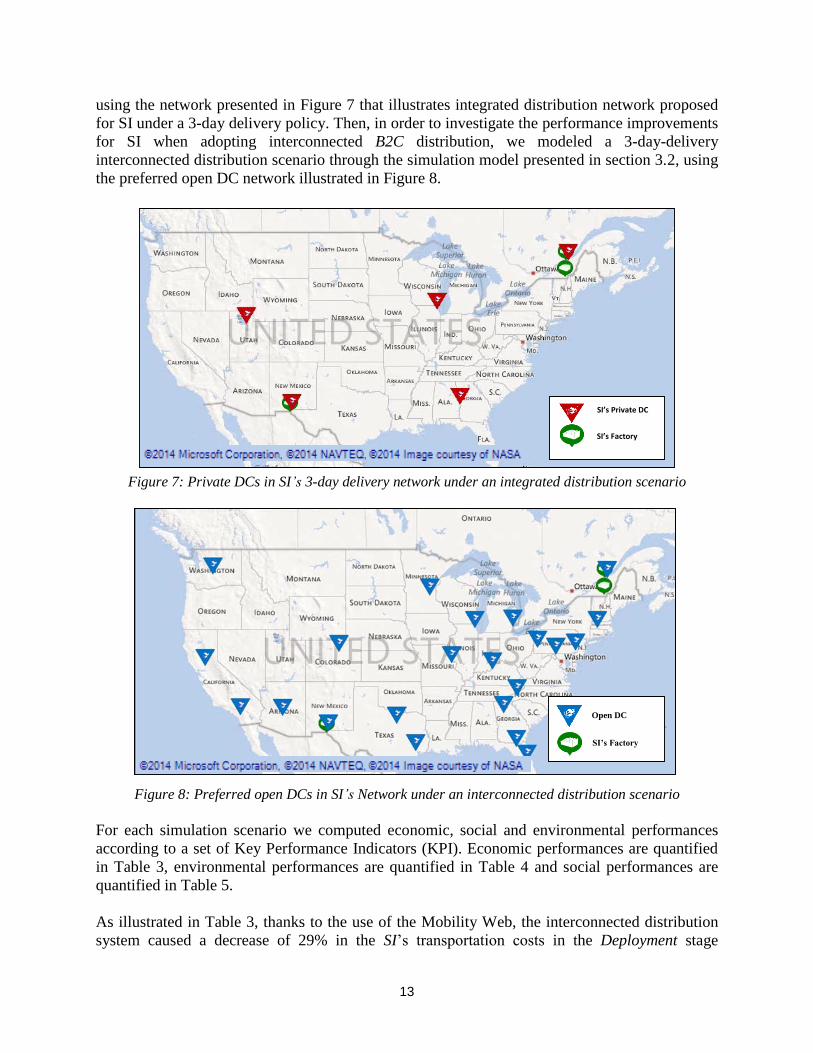
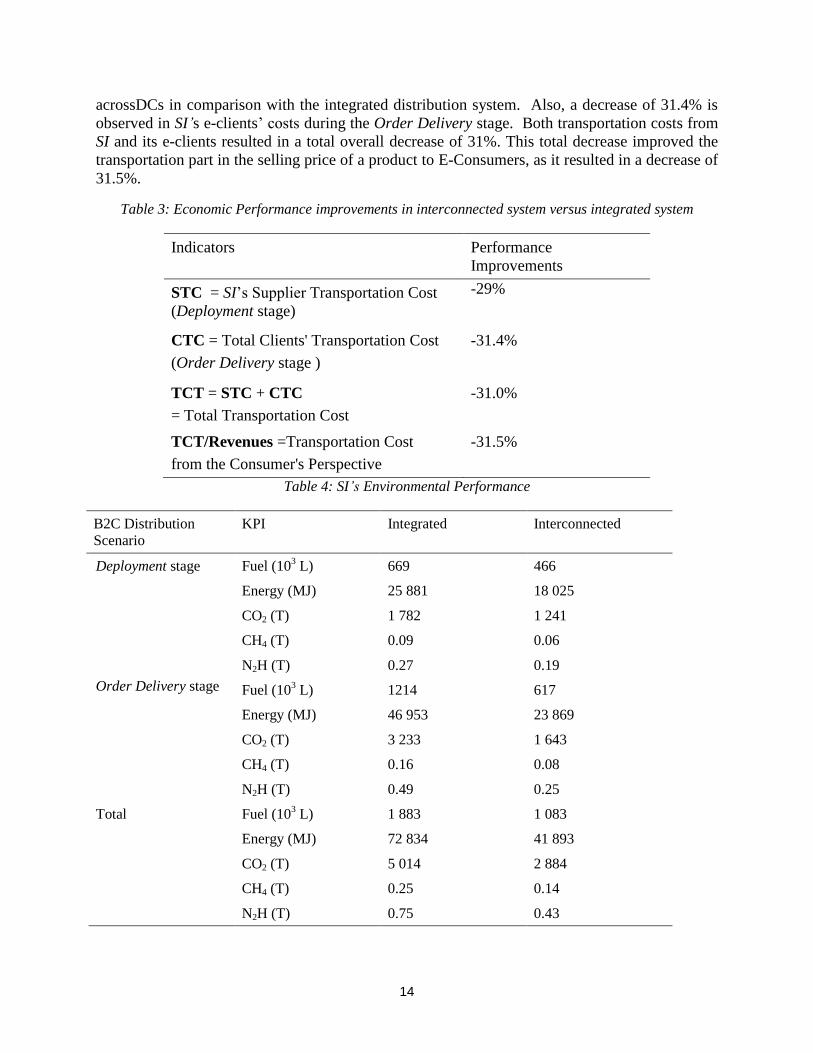
using the network presented in Figure 7 that illustrates integrated distribution network proposed
for SI under a 3-day delivery policy. Then, in order to investigate the performance improvements
for SI when adopting interconnected B2C distribution, we modeled a 3-day-delivery
interconnected distribution scenario through the simulation model presented in section 3.2, using
the preferred open DC network illustrated in Figure 8.
SI’s Private DC
SI’s Factory
Figure 7: Private DCs in SI’s 3-day delivery network under an integrated distribution scenario
Open DC
SI’s Factory
Figure 8: Preferred open DCs in SI’s Network under an interconnected distribution scenario
For each simulation scenario we computed economic, social and environmental performances
according to a set of Key Performance Indicators (KPI). Economic performances are quantified
in Table 3, environmental performances are quantified in Table 4 and social performances are
quantified in Table 5.
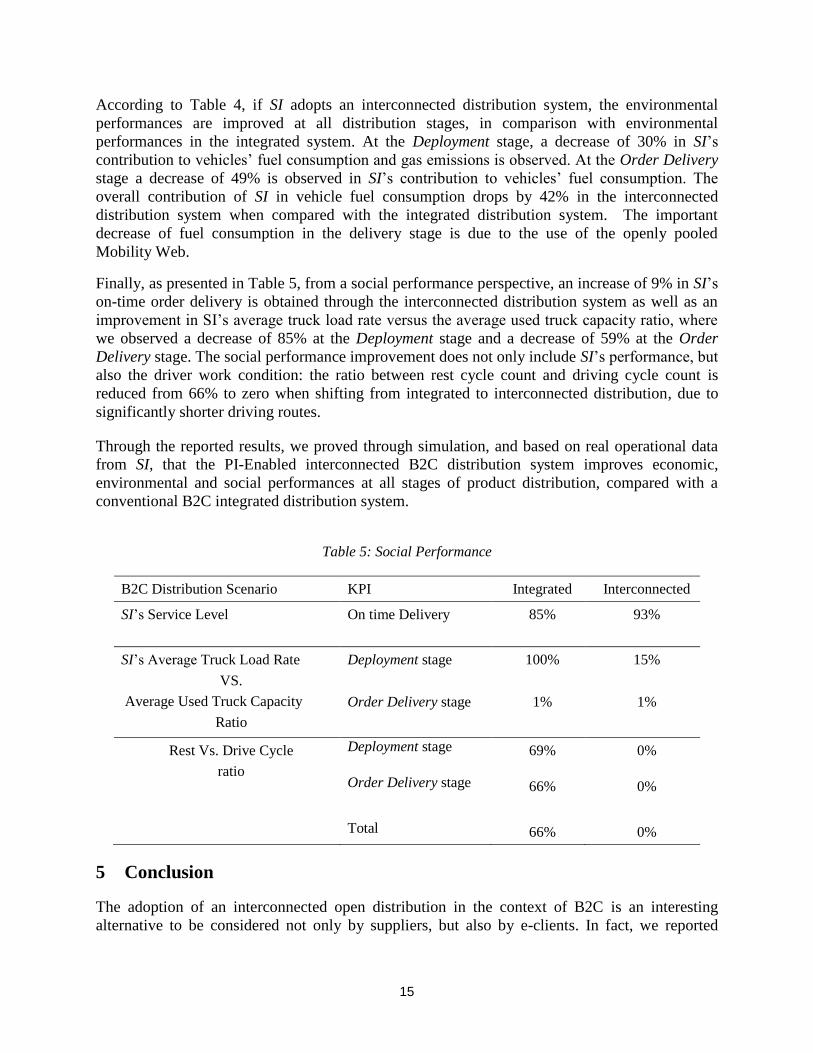
As illustrated in Table 3, thanks to the use of the Mobility Web, the interconnected distribution
system caused a decrease of 29% in the SI’s transportation costs in the Deployment stage
14
acrossDCs in comparison with the integrated distribution system. Also, a decrease of 31.4% is
observed in SI’s e-clients’ costs during the Order Delivery stage. Both transportation costs from
SI and its e-clients resulted in a total overall decrease of 31%. This total decrease improved the
transportation part in the selling price of a product to E-Consumers, as it resulted in a decrease of
31.5%.
Table 3: Economic Performance improvements in interconnected system versus integrated system
Indicators Performance
Improvements
STC = SI’s Supplier Transportation Cost
(Deployment stage)
-29%
CTC = Total Clients' Transportation Cost
(Order Delivery stage )
-31.4%
TCT = STC + CTC
= Total Transportation Cost
-31.0%
TCT/Revenues =Transportation Cost
from the Consumer's Perspective
-31.5%
Table 4: SI’s Environmental Performance
B2C Distribution
Scenario
KPI Integrated Interconnected
Deployment stage Fuel (103 L) 669 466
Energy (MJ) 25 881 18 025
CO2 (T) 1 782 1 241
CH4 (T) 0.09 0.06
N2H (T) 0.27 0.19
Order Delivery stage Fuel (103 L) 1214 617
Energy (MJ) 46 953 23 869
CO2 (T) 3 233 1 643
CH4 (T) 0.16 0.08
N2H (T) 0.49 0.25
Total Fuel (103 L) 1 883 1 083
Energy (MJ) 72 834 41 893
CO2 (T) 5 014 2 884
CH4 (T) 0.25 0.14
N2H (T) 0.75 0.43
15
According to Table 4, if SI adopts an interconnected distribution system, the environmental
performances are improved at all distribution stages, in comparison with environmental
performances in the integrated system. At the Deployment stage, a decrease of 30% in SI’s
contribution to vehicles’ fuel consumption and gas emissions is observed. At the Order Delivery
stage a decrease of 49% is observed in SI’s contribution to vehicles’ fuel consumption. The
overall contribution of SI in vehicle fuel consumption drops by 42% in the interconnected
distribution system when compared with the integrated distribution system. The important
decrease of fuel consumption in the delivery stage is due to the use of the openly pooled
Mobility Web.
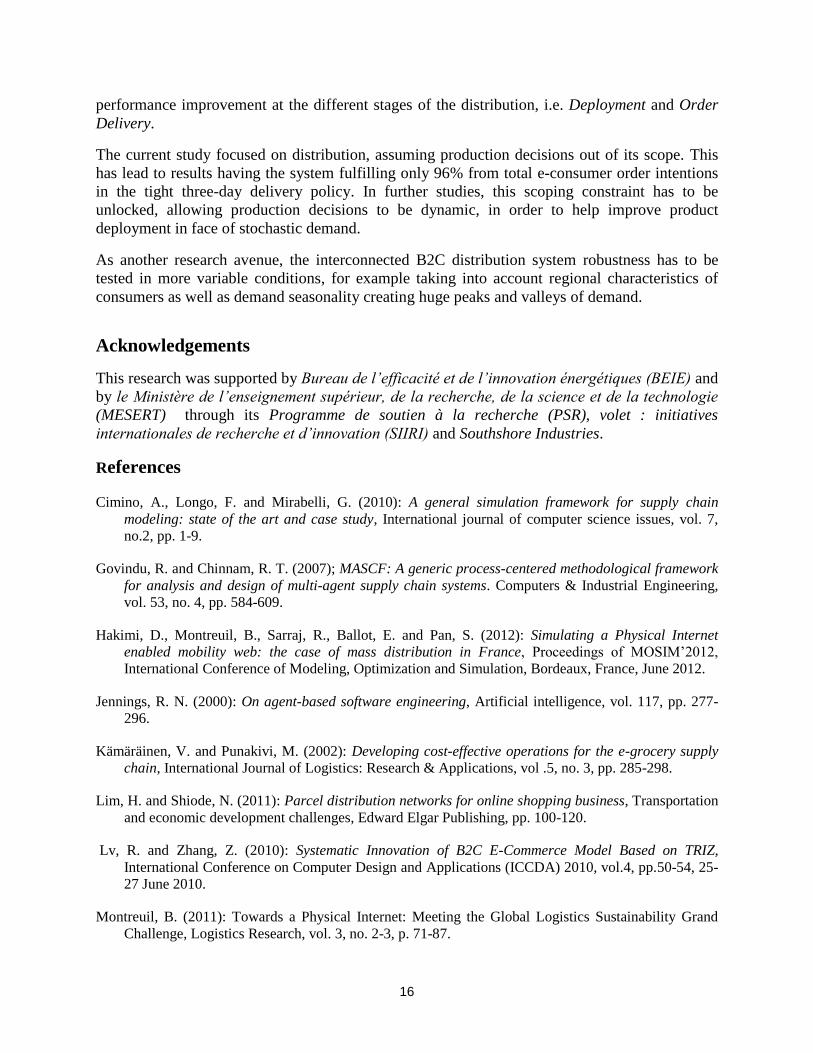
Finally, as presented in Table 5, from a social performance perspective, an increase of 9% in SI’s
on-time order delivery is obtained through the interconnected distribution system as well as an
improvement in SI’s average truck load rate versus the average used truck capacity ratio, where
we observed a decrease of 85% at the Deployment stage and a decrease of 59% at the Order
Delivery stage. The social performance improvement does not only include SI’s performance, but
also the driver work condition: the ratio between rest cycle count and driving cycle count is
reduced from 66% to zero when shifting from integrated to interconnected distribution, due to
significantly shorter driving routes.
Through the reported results, we proved through simulation, and based on real operational data
from SI, that the PI-Enabled interconnected B2C distribution system improves economic,
environmental and social performances at all stages of product distribution, compared with a
conventional B2C integrated distribution system.
Table 5: Social Performance
B2C Distribution Scenario KPI Integrated Interconnected
SI’s Service Level On time Delivery 85% 93%
SI’s Average Truck Load Rate
VS.
Average Used Truck Capacity
Ratio
Deployment stage 100% 15%
Order Delivery stage 1% 1%
Rest Vs. Drive Cycle
ratio
Deployment stage 69% 0%
Order Delivery stage 66% 0%
Total 66% 0%
5 Conclusion
The adoption of an interconnected open distribution in the context of B2C is an interesting
alternative to be considered not only by suppliers, but also by e-clients. In fact, we reported
16
performance improvement at the different stages of the distribution, i.e. Deployment and Order
Delivery.
The current study focused on distribution, assuming production decisions out of its scope. This
has lead to results having the system fulfilling only 96% from total e-consumer order intentions
in the tight three-day delivery policy. In further studies, this scoping constraint has to be
unlocked, allowing production decisions to be dynamic, in order to help improve product
deployment in face of stochastic demand.
As another research avenue, the interconnected B2C distribution system robustness has to be
tested in more variable conditions, for example taking into account regional characteristics of
consumers as well as demand seasonality creating huge peaks and valleys of demand.
Acknowledgements
This research was supported by Bureau de l’efficacité et de l’innovation énergétiques (BEIE) and
by le Ministère de l’enseignement supérieur, de la recherche, de la science et de la technologie
(MESERT) through its Programme de soutien à la recherche (PSR), volet : initiatives
internationales de recherche et d’innovation (SIIRI) and Southshore Industries.
References
Cimino, A., Longo, F. and Mirabelli, G. (2010): A general simulation framework for supply chain
modeling: state of the art and case study, International journal of computer science issues, vol. 7,
no.2, pp. 1-9.
Govindu, R. and Chinnam, R. T. (2007); MASCF: A generic process-centered methodological framework
for analysis and design of multi-agent supply chain systems. Computers & Industrial Engineering,
vol. 53, no. 4, pp. 584-609.
Hakimi, D., Montreuil, B., Sarraj, R., Ballot, E. and Pan, S. (2012): Simulating a Physical Internet
enabled mobility web: the case of mass distribution in France, Proceedings of MOSIM’2012,
International Conference of Modeling, Optimization and Simulation, Bordeaux, France, June 2012.
Jennings, R. N. (2000): On agent-based software engineering, Artificial intelligence, vol. 117, pp. 277-
296.
Kämäräinen, V. and Punakivi, M. (2002): Developing cost-effective operations for the e-grocery supply
chain, International Journal of Logistics: Research & Applications, vol .5, no. 3, pp. 285-298.
Lim, H. and Shiode, N. (2011): Parcel distribution networks for online shopping business, Transportation
and economic development challenges, Edward Elgar Publishing, pp. 100-120.
Lv, R. and Zhang, Z. (2010): Systematic Innovation of B2C E-Commerce Model Based on TRIZ,
International Conference on Computer Design and Applications (ICCDA) 2010, vol.4, pp.50-54, 25-
27 June 2010.
Montreuil, B. (2011): Towards a Physical Internet: Meeting the Global Logistics Sustainability Grand
Challenge, Logistics Research, vol. 3, no. 2-3, p. 71-87.
17
Montreuil B. (2013): Physical Internet Manifesto, v1.10, (Original v1.0, 2009),
www.physicalinternetinitiative.org, 2014/02/20.
Montreuil B., Meller, R.D. and Ballot, E. (2013): Physical Internet Foundations, in Service Orientation in
Holonic and Multi Agent Manufacturing and Robotics, ed. T. Borangiu, A. Thomas and D.
Trentesaux, Springer, p. 151-166.
Naccache, S., Montreuil, B., Sohrabi, H., Barriault, F. and Brotherton, E. (2014): B2C Drop-Ship
Consolidation: An Agent-Based Simulation Model, Proceedings of ILS 2014, International
Conference on Information Systems, Logistics and Supply Chain, Breda, The Netherlands, 24-27
August 2014.
Taniguchi, E. and Kakimoto, Y. (2003): Effects of E-Commerce on Urban Distribution and the
Environment, Journal of the Eastern Asia Society for Transportation Studies, vol. 4, pp. 2355-2366.
Vergnion, J. and Montreuil , B. (2001) : Le réseau logistique de la e-entreprise de détail (The logistics
network of e-retail businesses), Gestion 2000, vol.18, no. 2, pp. 129-148.
Yu, G. and Xiu-yan, G. (2010): Study on Physical Distribution of B2C E-Commerce Model, 2010
International Forum on Information Technology and Applications (IFITA) 2010, ,vol.2, pp.3,5, 16-
18 July 2010.
Zhu, K. and Kraemer, K. L. (2002): E-Commerce Metrics for Net-Enhanced Organizations: Assessing the
Value of E-Commerce to Firm Performance in the Manufacturing Sector, Information Systems
Research, vol. 8, no. 3, pp. 275-295.