friend nigm 2012-05-23
DESCRIPTION
Stephen Friend May 23, 2012 Northwest Institute of Genetic Medicine 2012 Retreat Seattle, WATRANSCRIPT
Building Be*er Models of Disease Together
Stephen H Friend MD PhD Sage Bionetworks
NIGM 4th Annual Retreat May 23 2012
Sea*le
What is the problem?
Most approved therapies assume indica2ons would represent homogenous popula2ons
Our exis2ng disease models o8en assume pathway knowledge sufficient to infer correct therapies
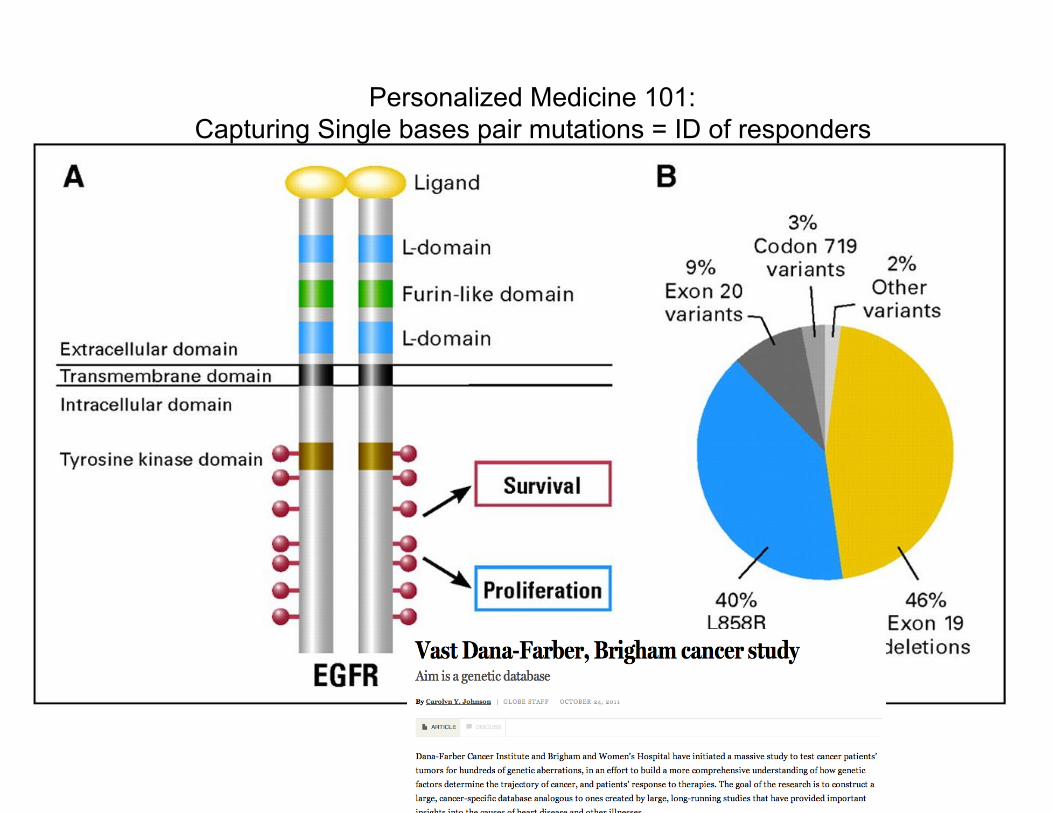
Personalized Medicine 101: Capturing Single bases pair mutations = ID of responders
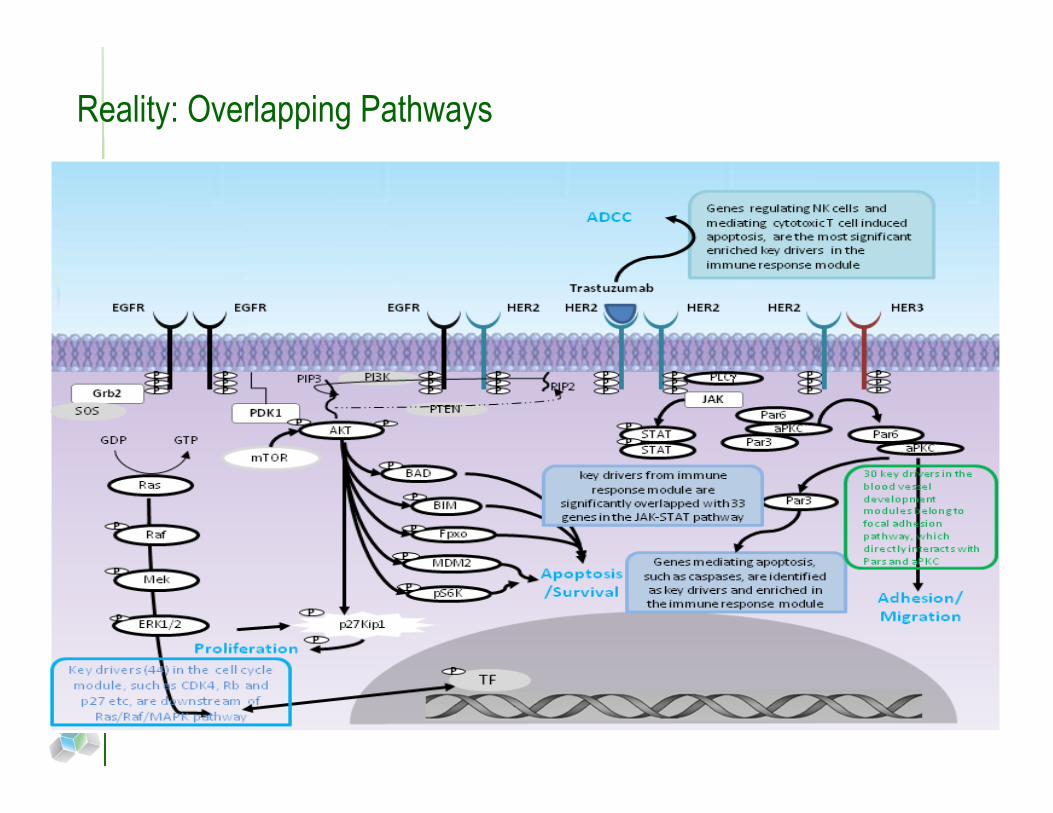
Reality: Overlapping Pathways
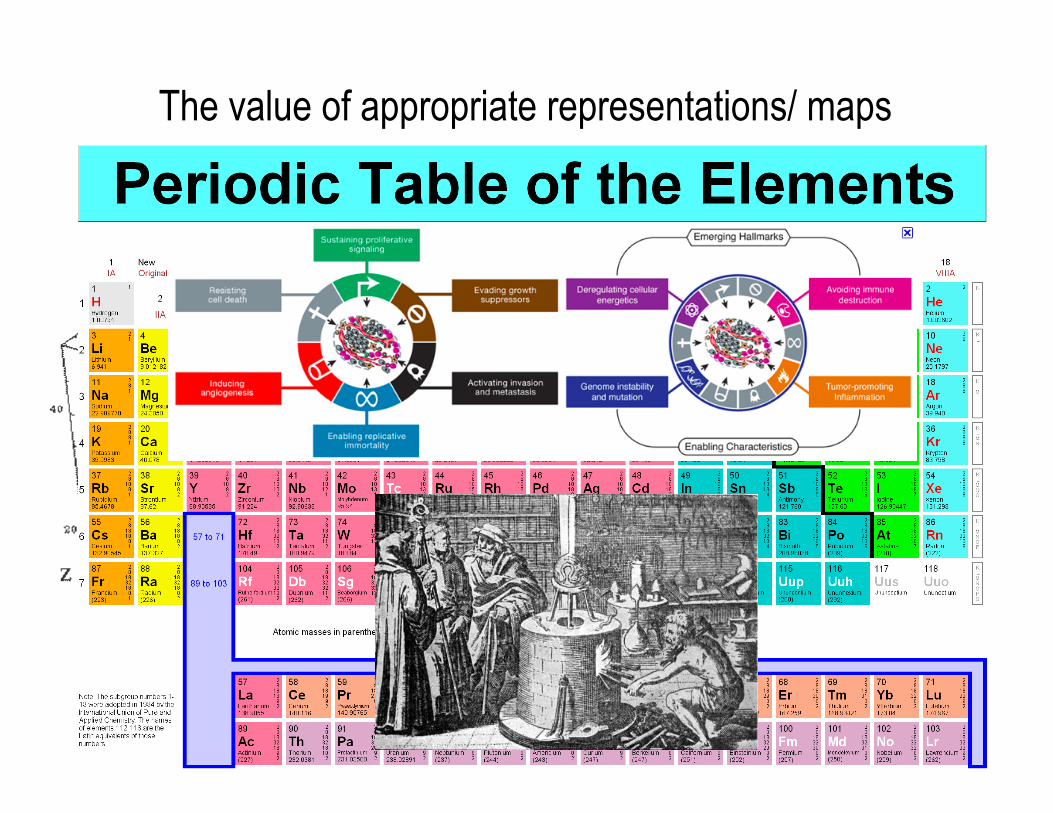
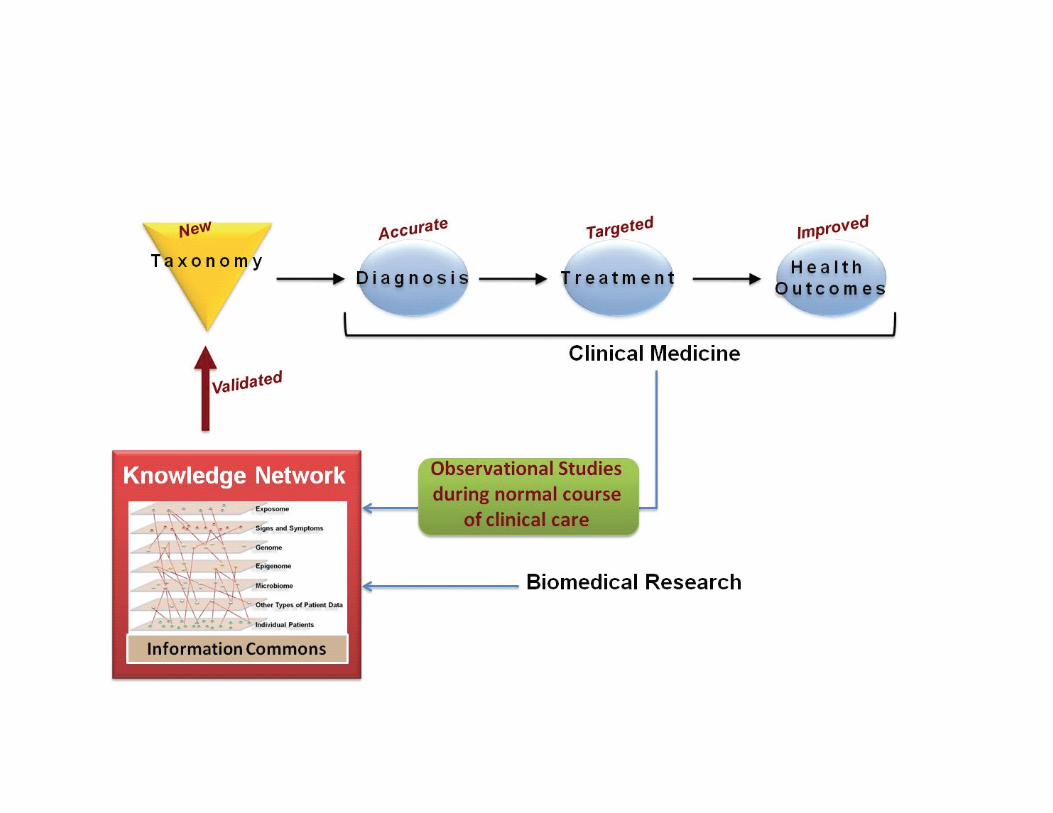
The value of appropriate representations/ maps
Disease PrevenLon and Treatment
• To Prevent need to: – Have clinical & molecular definiLon of disease – Be able to predict progression – Have drugs that target mechanisms that drive progression
• To Treat need to: – Have clinical & molecular definiLon of disease – Disease modifying therapies
For Alzheimer’s we need work to develop all of these!
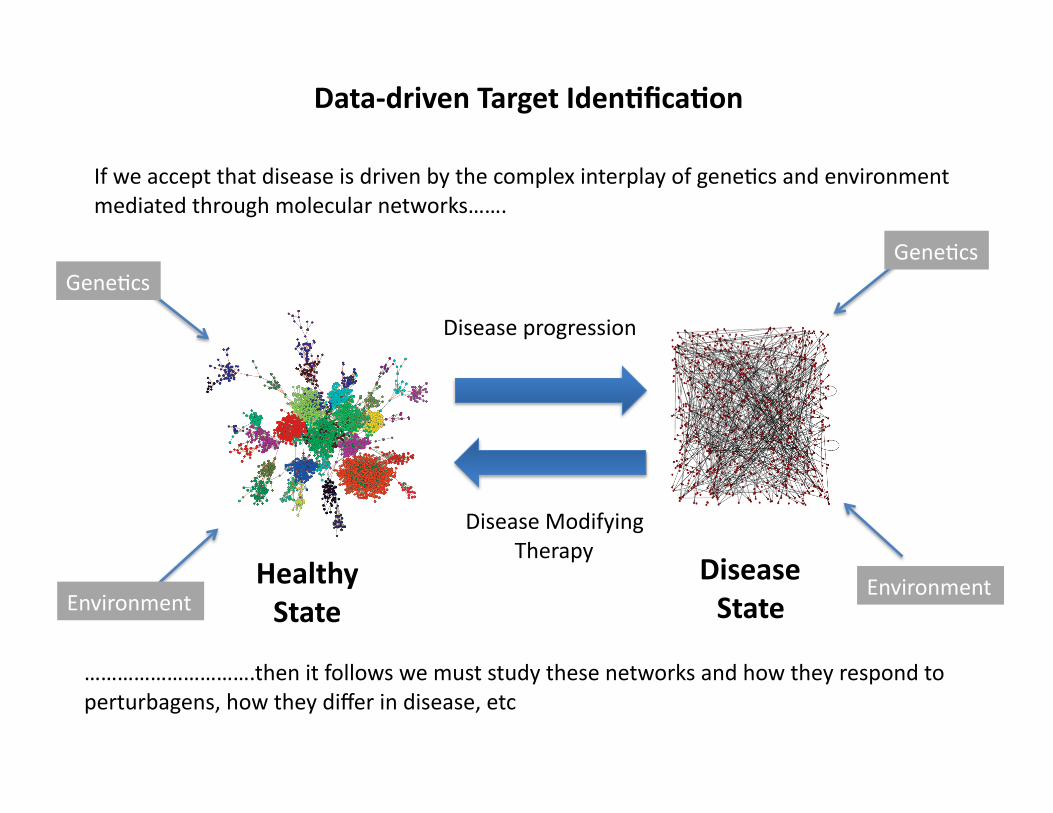
Data-‐driven Target Iden2fica2on
Disease progression
Disease Modifying Therapy
Healthy State
Disease State
If we accept that disease is driven by the complex interplay of geneLcs and environment mediated through molecular networks…….
GeneLcs
Environment
GeneLcs
Environment
………………………….then it follows we must study these networks and how they respond to perturbagens, how they differ in disease, etc
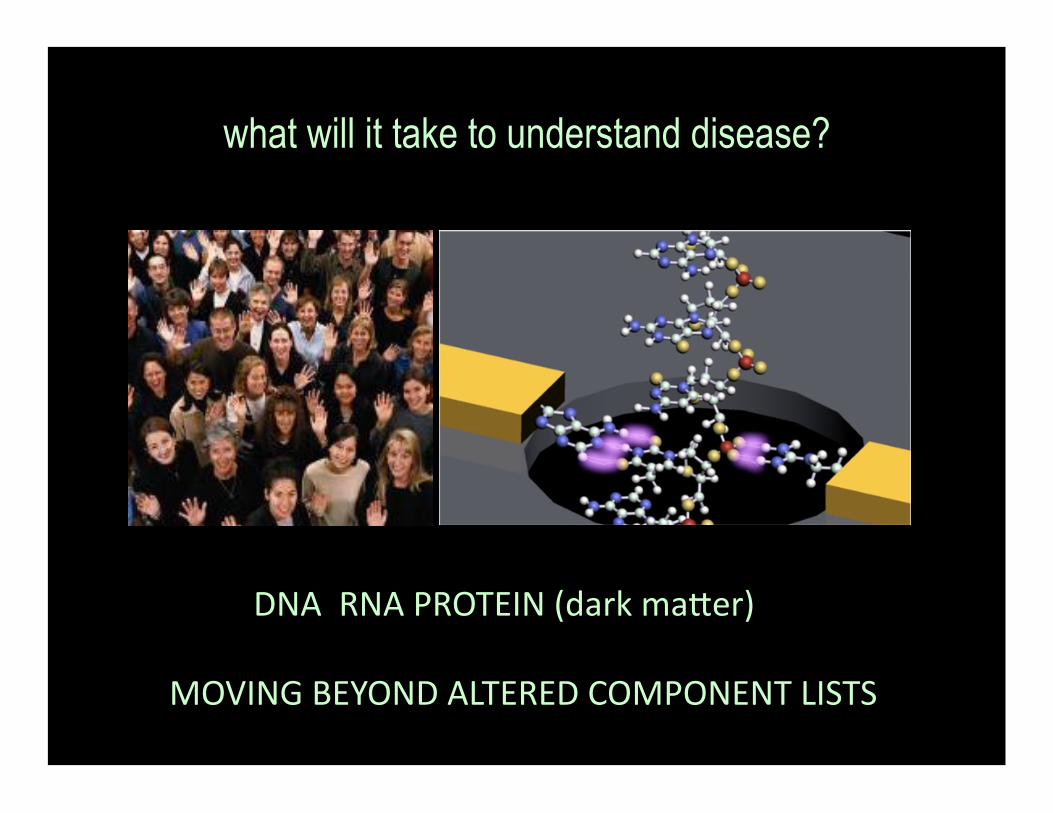
what will it take to understand disease?
DNA RNA PROTEIN (dark ma*er)
MOVING BEYOND ALTERED COMPONENT LISTS
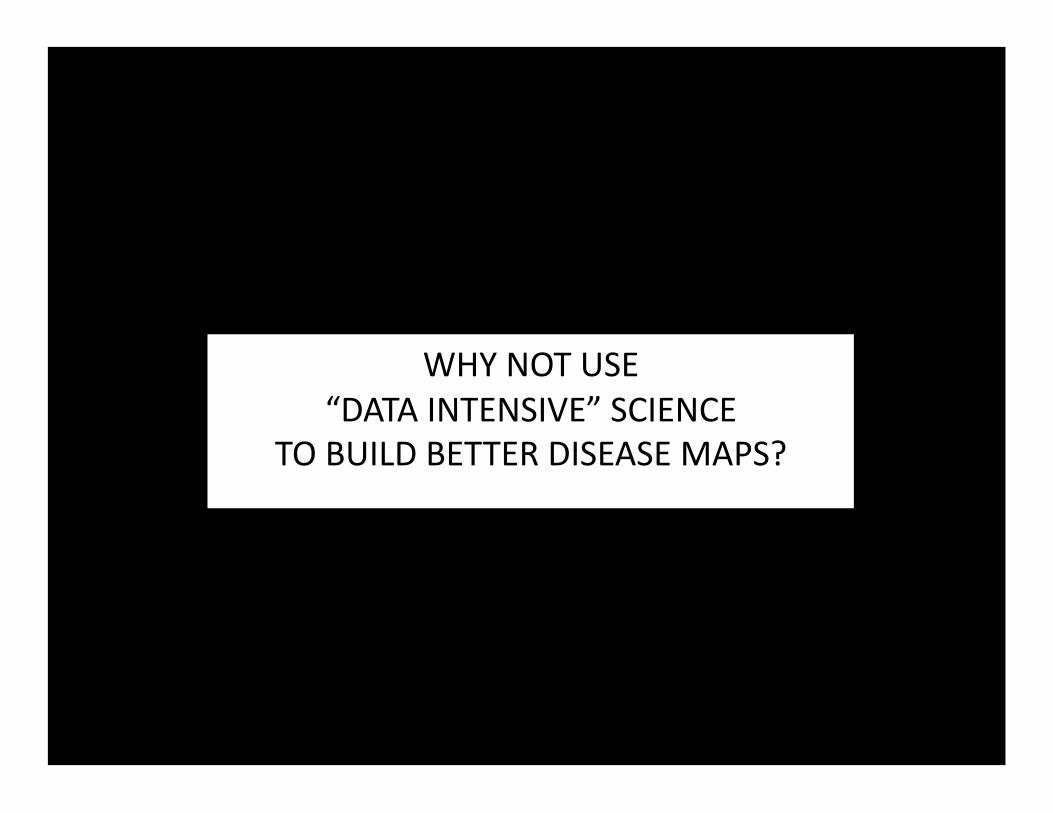
WHY NOT USE “DATA INTENSIVE” SCIENCE
TO BUILD BETTER DISEASE MAPS?
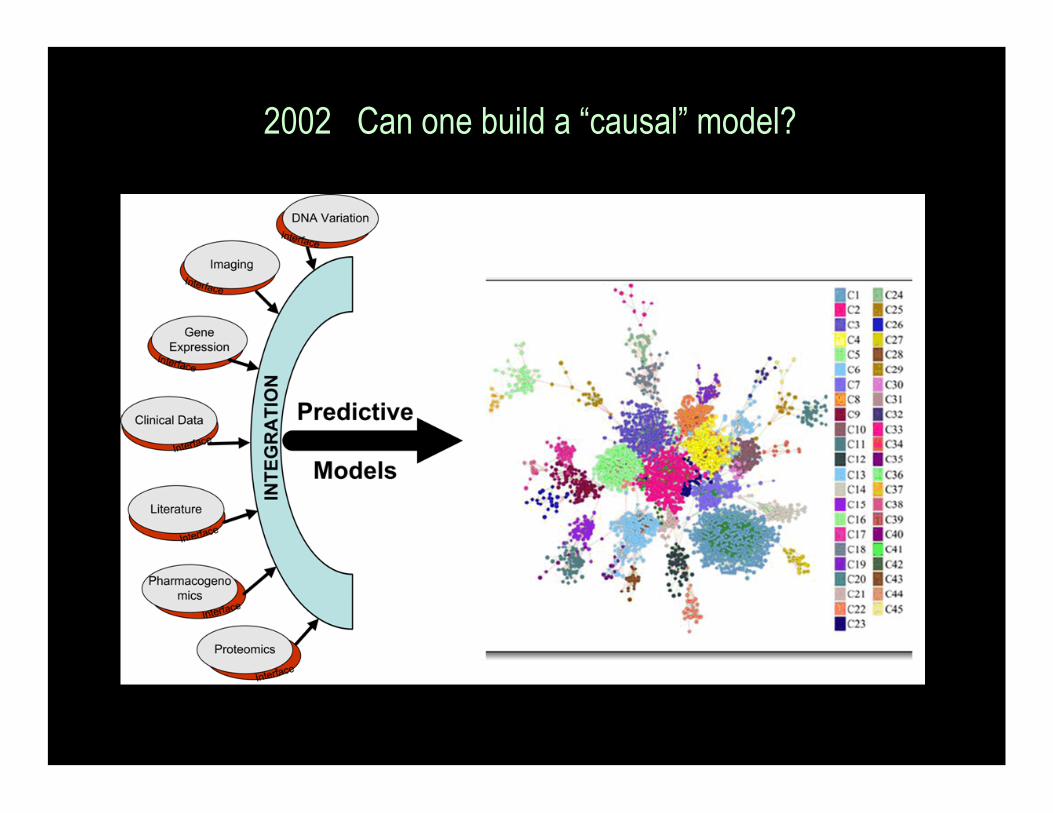
2002 Can one build a “causal” model?
trait
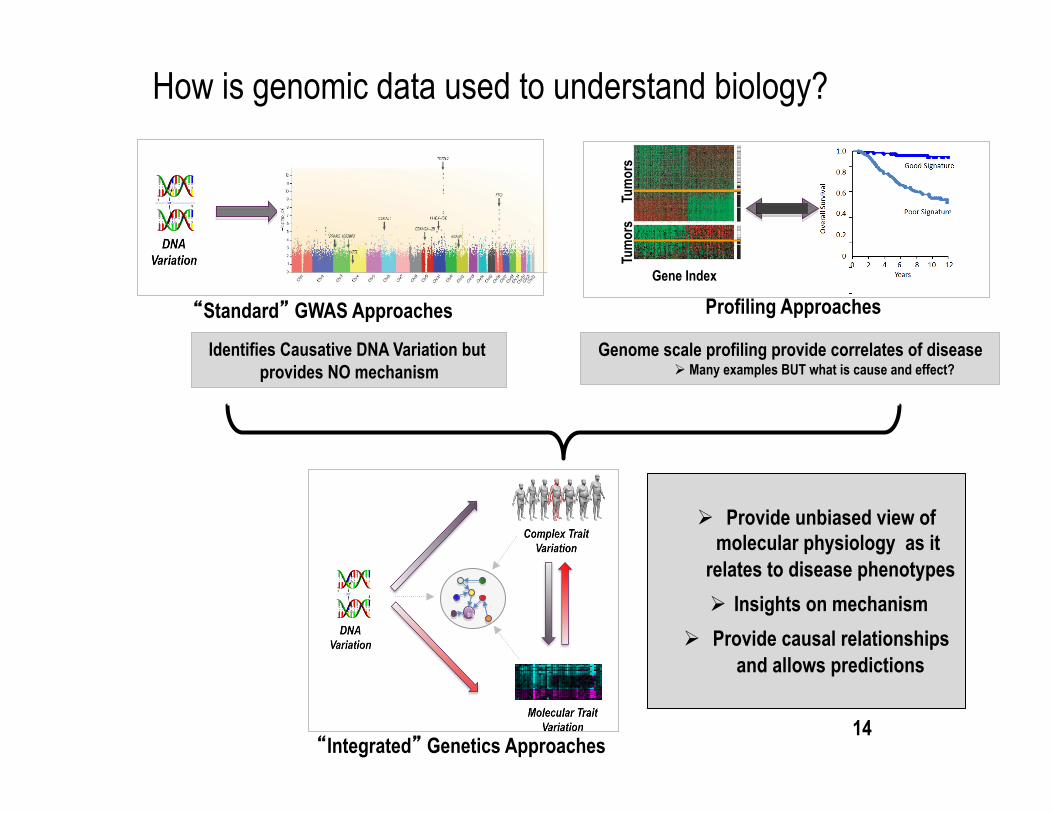
How is genomic data used to understand biology?
“Standard” GWAS Approaches Profiling Approaches
“Integrated” Genetics Approaches
Genome scale profiling provide correlates of disease Many examples BUT what is cause and effect?
Identifies Causative DNA Variation but provides NO mechanism
Provide unbiased view of molecular physiology as it
relates to disease phenotypes
Insights on mechanism
Provide causal relationships and allows predictions
RNA amplification Microarray hybirdization
Gene Index
Tum
ors
Tum
ors
14
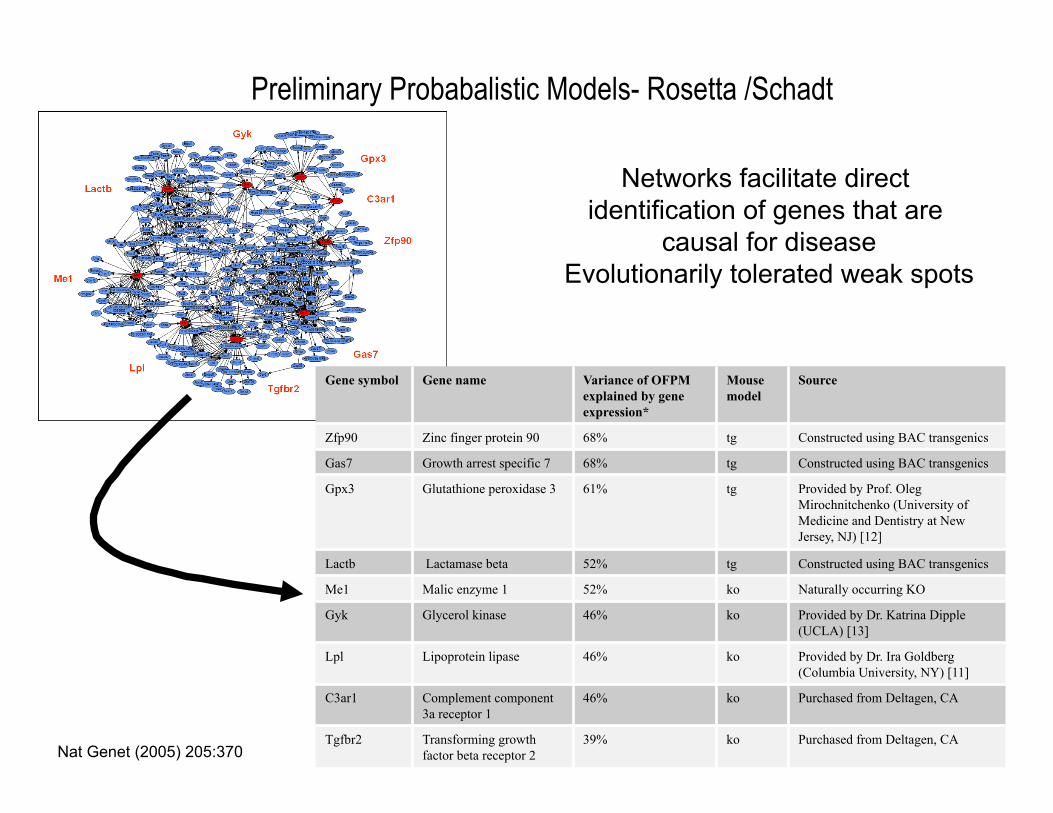
Preliminary Probabalistic Models- Rosetta /Schadt
Gene symbol Gene name Variance of OFPM explained by gene expression*
Mouse model
Source
Zfp90 Zinc finger protein 90 68% tg Constructed using BAC transgenics Gas7 Growth arrest specific 7 68% tg Constructed using BAC transgenics Gpx3 Glutathione peroxidase 3 61% tg Provided by Prof. Oleg
Mirochnitchenko (University of Medicine and Dentistry at New Jersey, NJ) [12]
Lactb Lactamase beta 52% tg Constructed using BAC transgenics Me1 Malic enzyme 1 52% ko Naturally occurring KO Gyk Glycerol kinase 46% ko Provided by Dr. Katrina Dipple
(UCLA) [13] Lpl Lipoprotein lipase 46% ko Provided by Dr. Ira Goldberg
(Columbia University, NY) [11] C3ar1 Complement component
3a receptor 1 46% ko Purchased from Deltagen, CA
Tgfbr2 Transforming growth factor beta receptor 2
39% ko Purchased from Deltagen, CA
Networks facilitate direct identification of genes that are
causal for disease Evolutionarily tolerated weak spots
Nat Genet (2005) 205:370
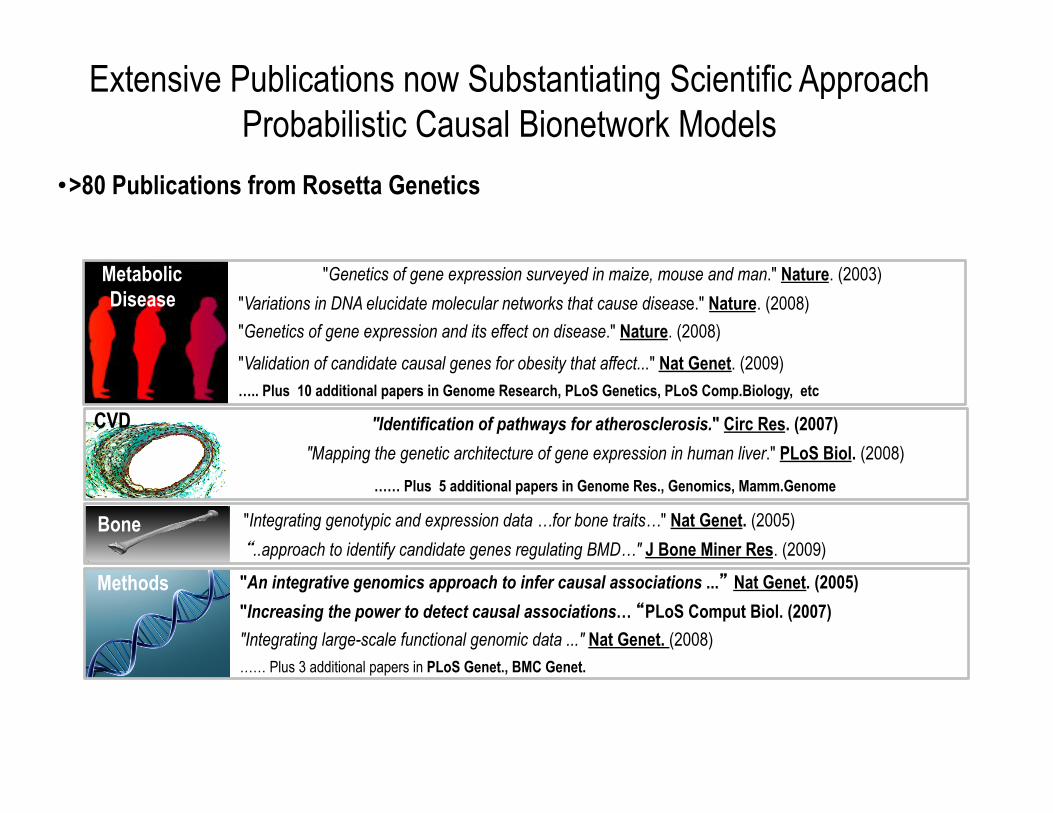
"Genetics of gene expression surveyed in maize, mouse and man." Nature. (2003)
"Variations in DNA elucidate molecular networks that cause disease." Nature. (2008)
"Genetics of gene expression and its effect on disease." Nature. (2008)
"Validation of candidate causal genes for obesity that affect..." Nat Genet. (2009) ….. Plus 10 additional papers in Genome Research, PLoS Genetics, PLoS Comp.Biology, etc
"Identification of pathways for atherosclerosis." Circ Res. (2007)
"Mapping the genetic architecture of gene expression in human liver." PLoS Biol. (2008)
…… Plus 5 additional papers in Genome Res., Genomics, Mamm.Genome
"Integrating genotypic and expression data …for bone traits…" Nat Genet. (2005)
“..approach to identify candidate genes regulating BMD…" J Bone Miner Res. (2009)
"An integrative genomics approach to infer causal associations ...” Nat Genet. (2005)
"Increasing the power to detect causal associations… “PLoS Comput Biol. (2007)
"Integrating large-scale functional genomic data ..." Nat Genet. (2008)
…… Plus 3 additional papers in PLoS Genet., BMC Genet.
d
Metabolic Disease
CVD
Bone
Methods
Extensive Publications now Substantiating Scientific Approach Probabilistic Causal Bionetwork Models
• >80 Publications from Rosetta Genetics
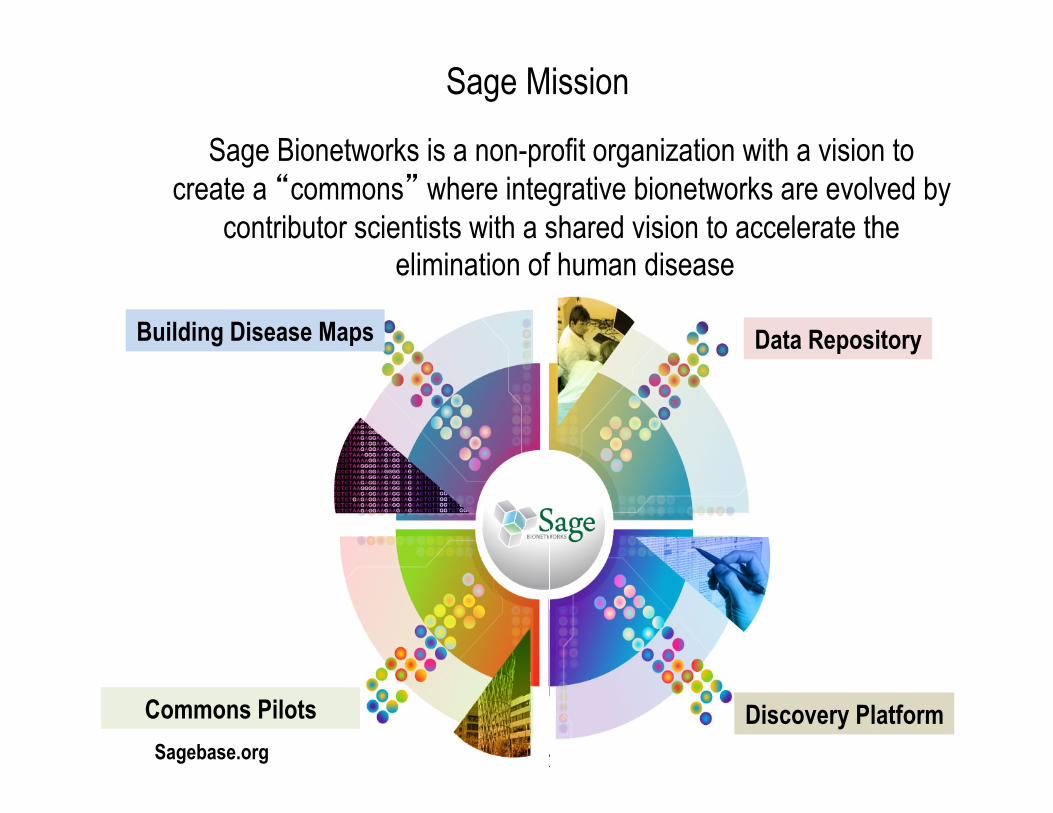
Sage Mission
Sage Bionetworks is a non-profit organization with a vision to create a “commons” where integrative bionetworks are evolved by
contributor scientists with a shared vision to accelerate the elimination of human disease
Sagebase.org
Data Repository
Discovery Platform
Building Disease Maps
Commons Pilots
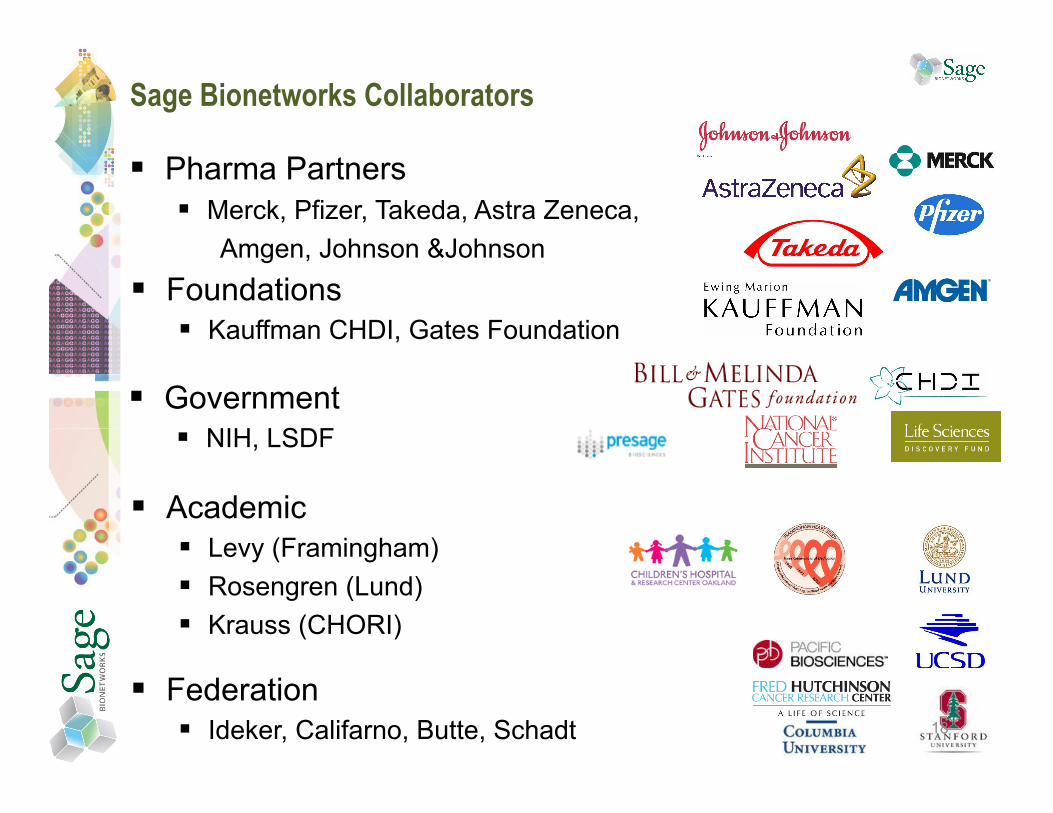
Sage Bionetworks Collaborators
Pharma Partners Merck, Pfizer, Takeda, Astra Zeneca, Amgen, Johnson &Johnson
18
Foundations Kauffman CHDI, Gates Foundation
Government NIH, LSDF
Academic Levy (Framingham) Rosengren (Lund) Krauss (CHORI)
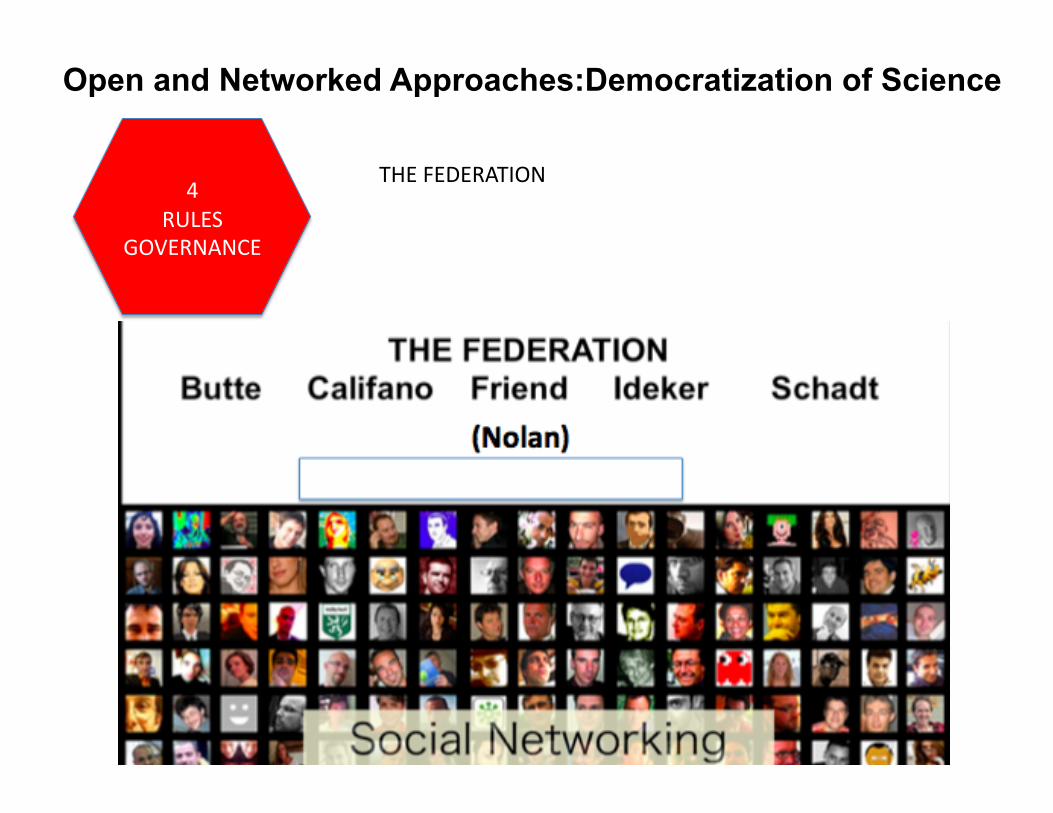
Federation Ideker, Califarno, Butte, Schadt
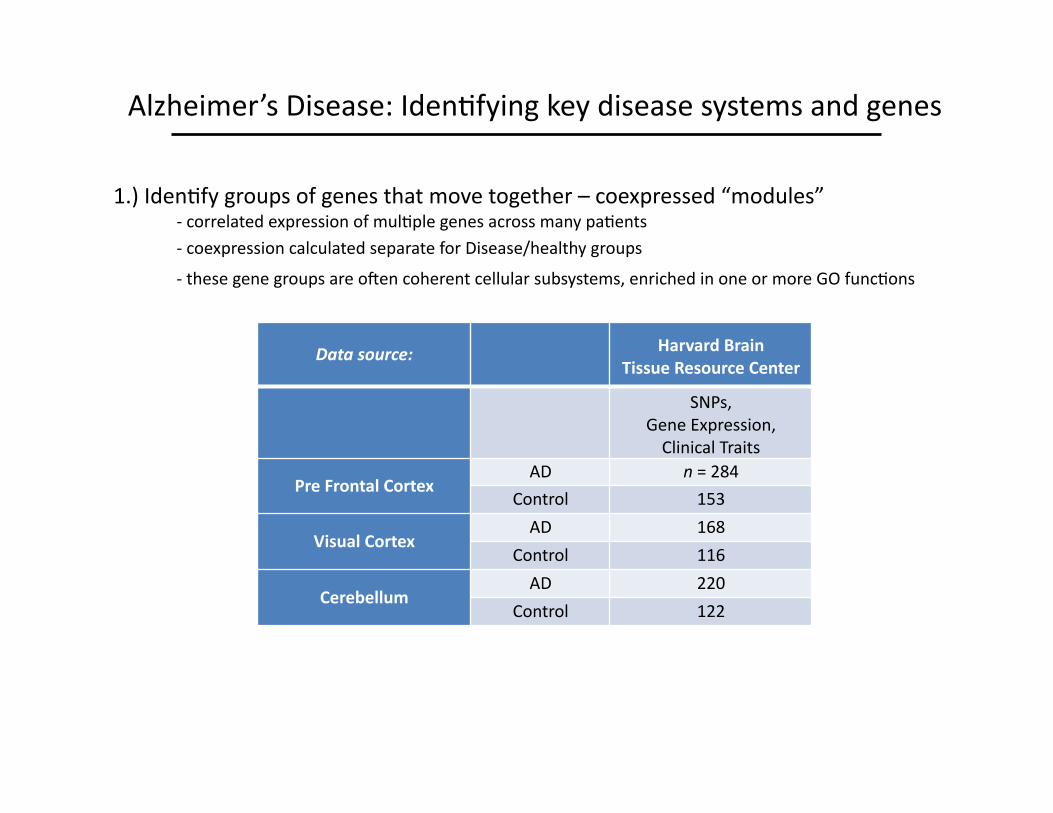
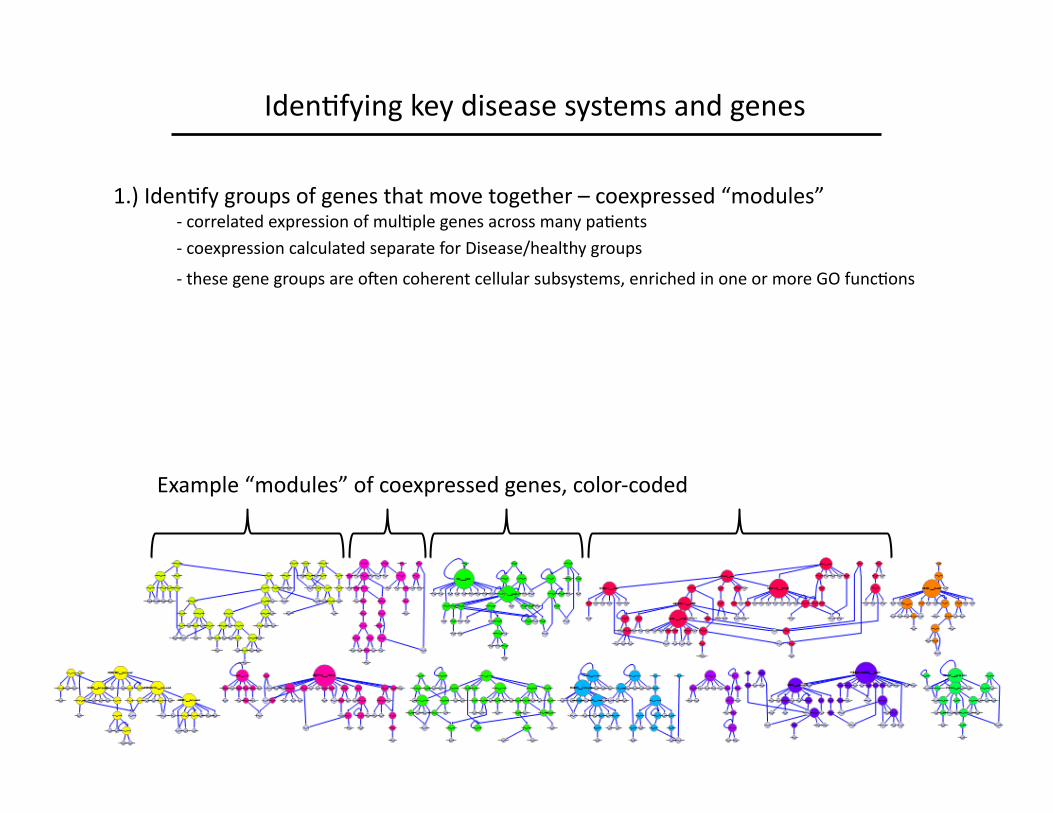
1.) IdenLfy groups of genes that move together – coexpressed “modules” -‐ correlated expression of mulLple genes across many paLents -‐ coexpression calculated separate for Disease/healthy groups -‐ these gene groups are ogen coherent cellular subsystems, enriched in one or more GO funcLons
Alzheimer’s Disease: IdenLfying key disease systems and genes
Data source: Harvard Brain Tissue Resource Center
SNPs, Gene Expression, Clinical Traits
Pre Frontal Cortex AD n = 284
Control 153
Visual Cortex AD 168
Control 116
Cerebellum AD 220
Control 122
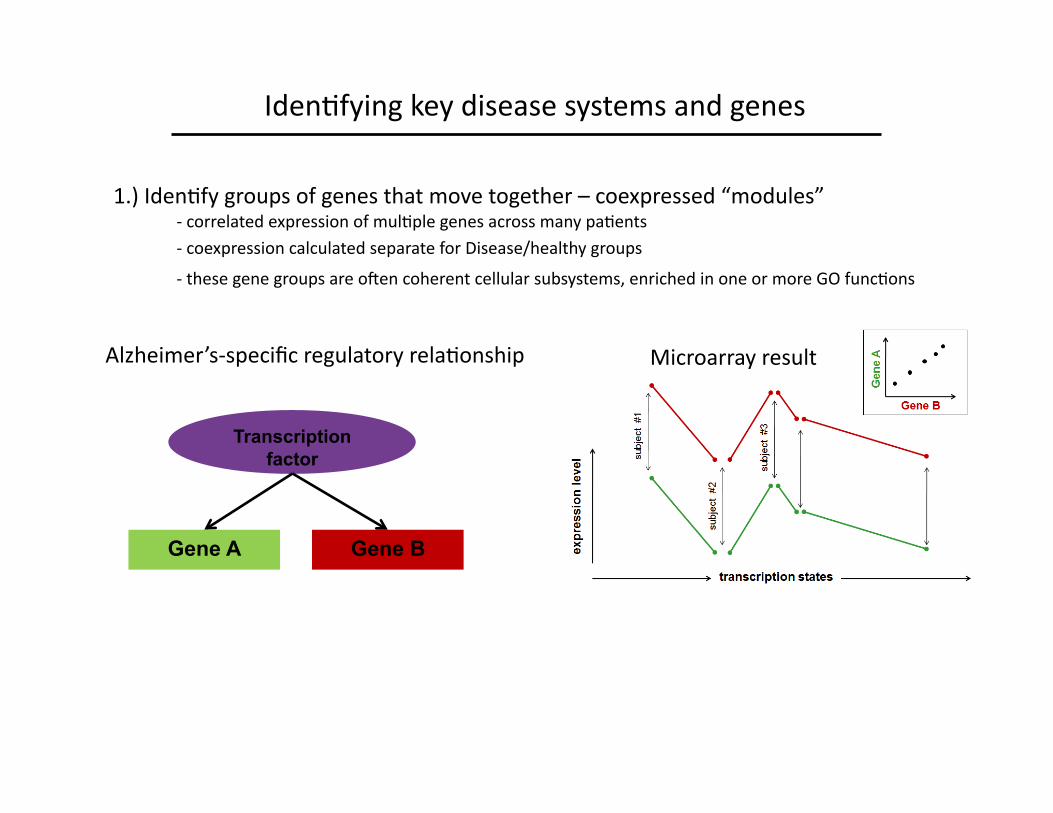
1.) IdenLfy groups of genes that move together – coexpressed “modules” -‐ correlated expression of mulLple genes across many paLents -‐ coexpression calculated separate for Disease/healthy groups -‐ these gene groups are ogen coherent cellular subsystems, enriched in one or more GO funcLons
IdenLfying key disease systems and genes
Transcription factor
Gene A Gene B
Alzheimer’s-‐specific regulatory relaLonship Microarray result
#2/TF
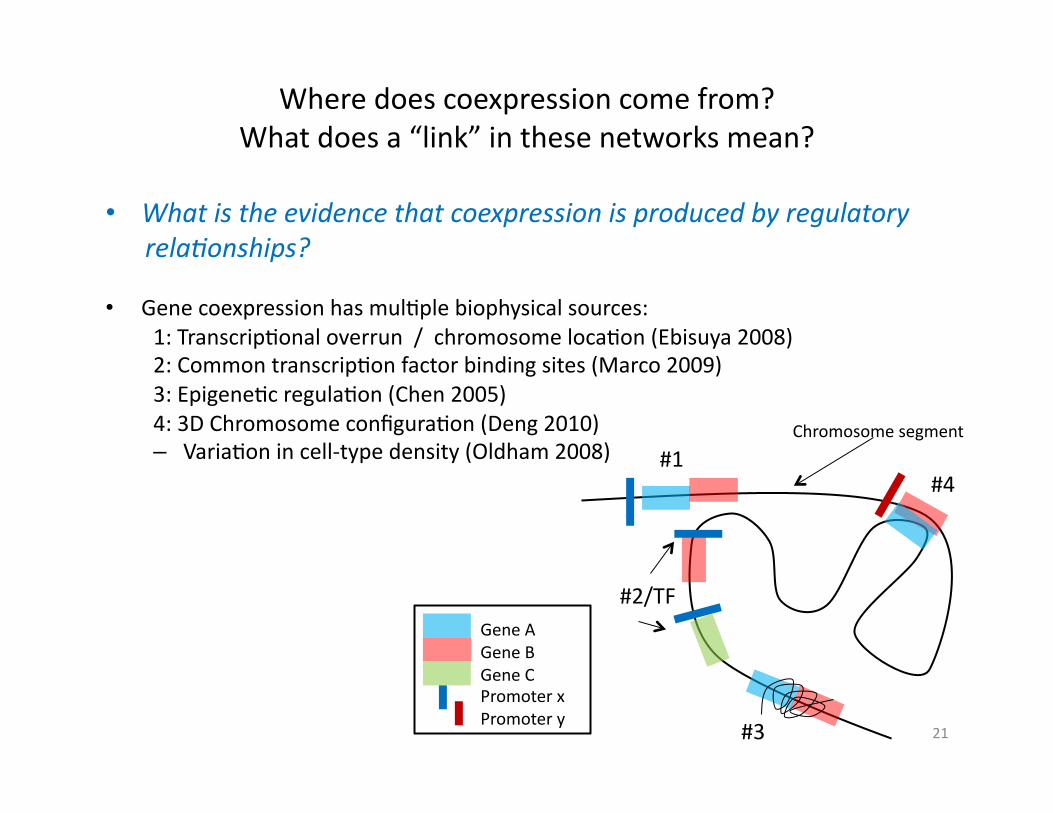
Where does coexpression come from? What does a “link” in these networks mean?
#1 #4
#3
Gene A Gene B Gene C Promoter x Promoter y
Chromosome segment
21
• What is the evidence that coexpression is produced by regulatory rela6onships?
• Gene coexpression has mulLple biophysical sources: 1: TranscripLonal overrun / chromosome locaLon (Ebisuya 2008) 2: Common transcripLon factor binding sites (Marco 2009) 3: EpigeneLc regulaLon (Chen 2005) 4: 3D Chromosome configuraLon (Deng 2010) – VariaLon in cell-‐type density (Oldham 2008)
IdenLfying key disease systems and genes
Example “modules” of coexpressed genes, color-‐coded
1.) IdenLfy groups of genes that move together – coexpressed “modules” -‐ correlated expression of mulLple genes across many paLents -‐ coexpression calculated separate for Disease/healthy groups -‐ these gene groups are ogen coherent cellular subsystems, enriched in one or more GO funcLons
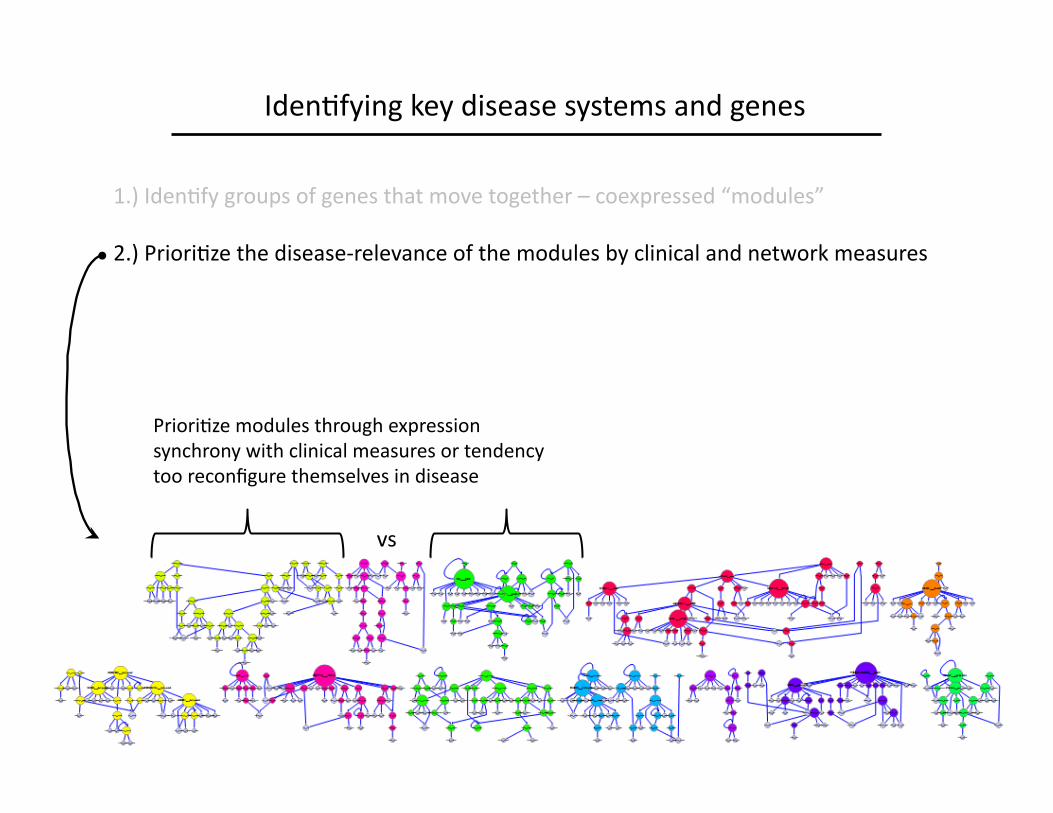
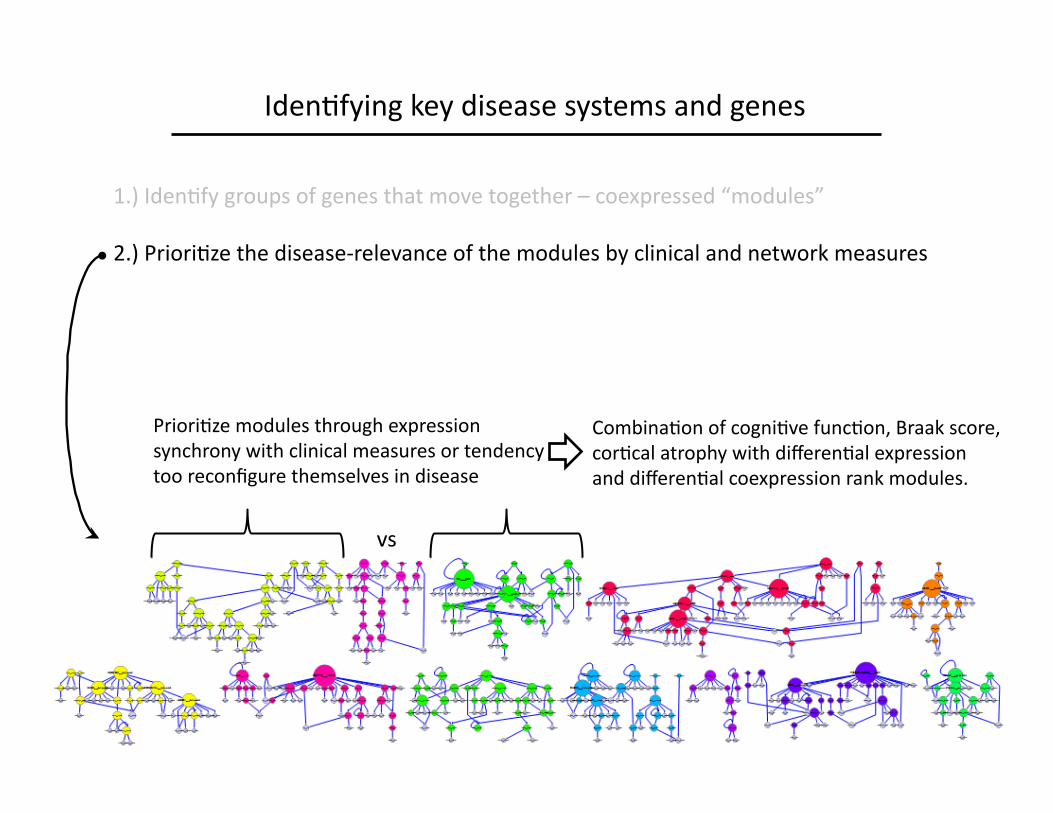
1.) IdenLfy groups of genes that move together – coexpressed “modules”
2.) PrioriLze the disease-‐relevance of the modules by clinical and network measures
PrioriLze modules through expression synchrony with clinical measures or tendency too reconfigure themselves in disease
vs
IdenLfying key disease systems and genes
vs
CombinaLon of cogniLve funcLon, Braak score, corLcal atrophy with differenLal expression and differenLal coexpression rank modules.
PrioriLze modules through expression synchrony with clinical measures or tendency too reconfigure themselves in disease
IdenLfying key disease systems and genes
1.) IdenLfy groups of genes that move together – coexpressed “modules”
2.) PrioriLze the disease-‐relevance of the modules by clinical and network measures
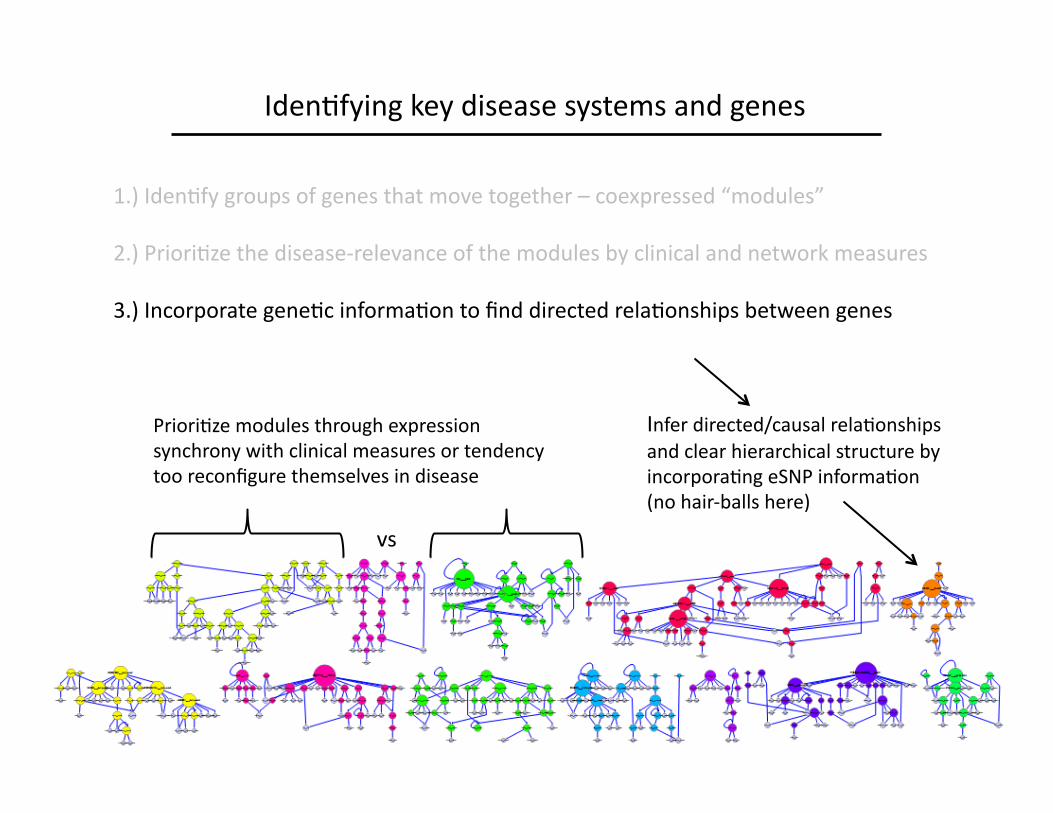
Infer directed/causal relaLonships and clear hierarchical structure by incorporaLng eSNP informaLon (no hair-‐balls here)
vs
PrioriLze modules through expression synchrony with clinical measures or tendency too reconfigure themselves in disease
IdenLfying key disease systems and genes
1.) IdenLfy groups of genes that move together – coexpressed “modules”
2.) PrioriLze the disease-‐relevance of the modules by clinical and network measures
3.) Incorporate geneLc informaLon to find directed relaLonships between genes
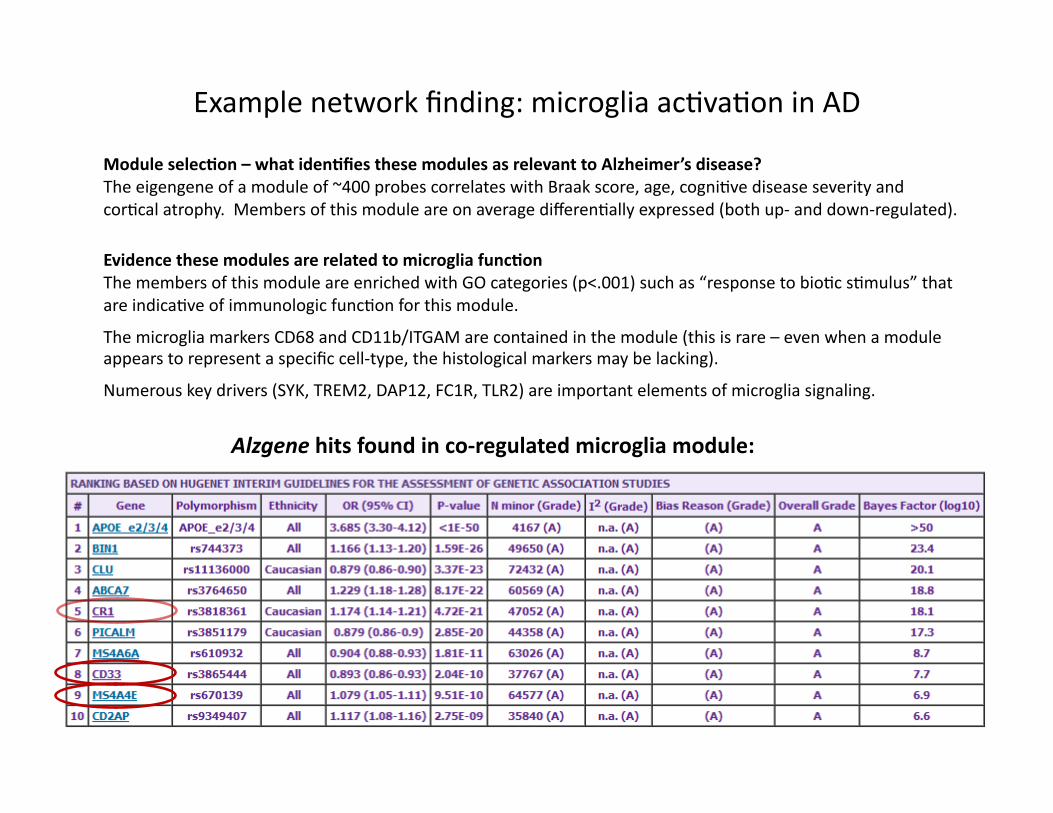
Example network finding: microglia acLvaLon in AD
Module selec2on – what iden2fies these modules as relevant to Alzheimer’s disease? The eigengene of a module of ~400 probes correlates with Braak score, age, cogniLve disease severity and corLcal atrophy. Members of this module are on average differenLally expressed (both up-‐ and down-‐regulated).
Evidence these modules are related to microglia func2on The members of this module are enriched with GO categories (p<.001) such as “response to bioLc sLmulus” that are indicaLve of immunologic funcLon for this module.
The microglia markers CD68 and CD11b/ITGAM are contained in the module (this is rare – even when a module appears to represent a specific cell-‐type, the histological markers may be lacking).
Numerous key drivers (SYK, TREM2, DAP12, FC1R, TLR2) are important elements of microglia signaling.
Alzgene hits found in co-‐regulated microglia module:
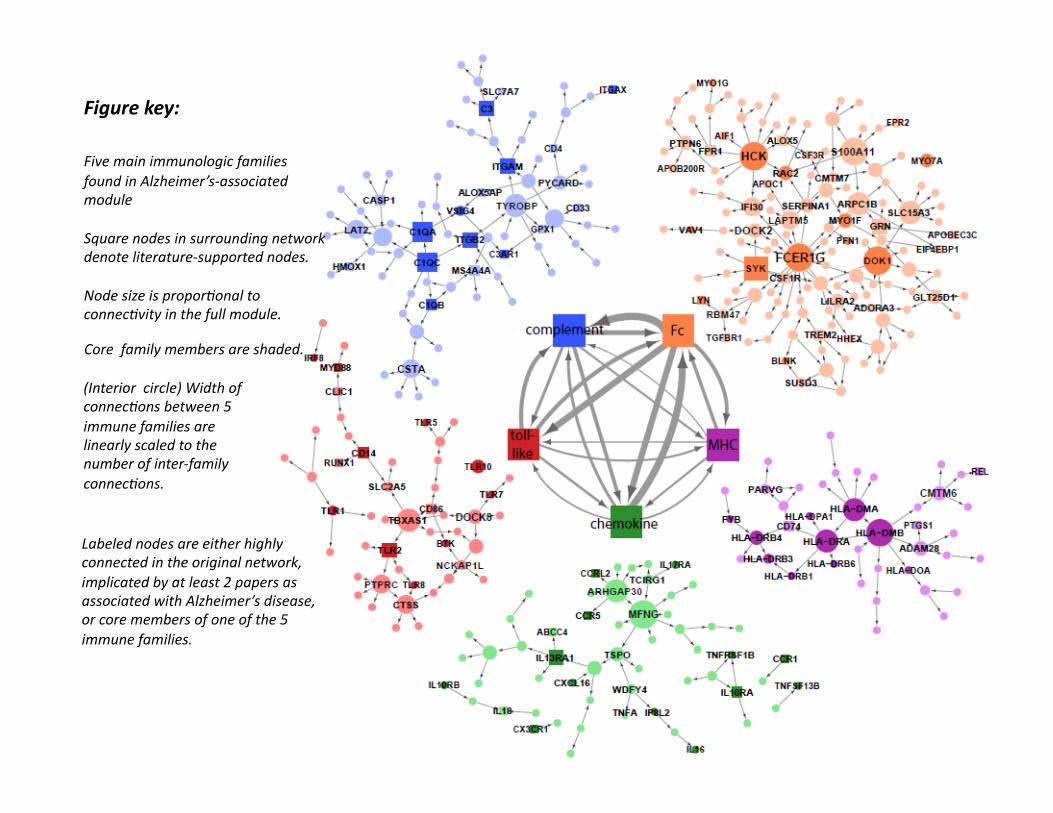
Figure key:
Five main immunologic families found in Alzheimer’s-‐associated module
Square nodes in surrounding network denote literature-‐supported nodes.
Node size is propor6onal to connec6vity in the full module.
(Interior circle) Width of connec6ons between 5 immune families are linearly scaled to the number of inter-‐family connec6ons.
Labeled nodes are either highly connected in the original network, implicated by at least 2 papers as associated with Alzheimer’s disease, or core members of one of the 5 immune families.
Core family members are shaded.
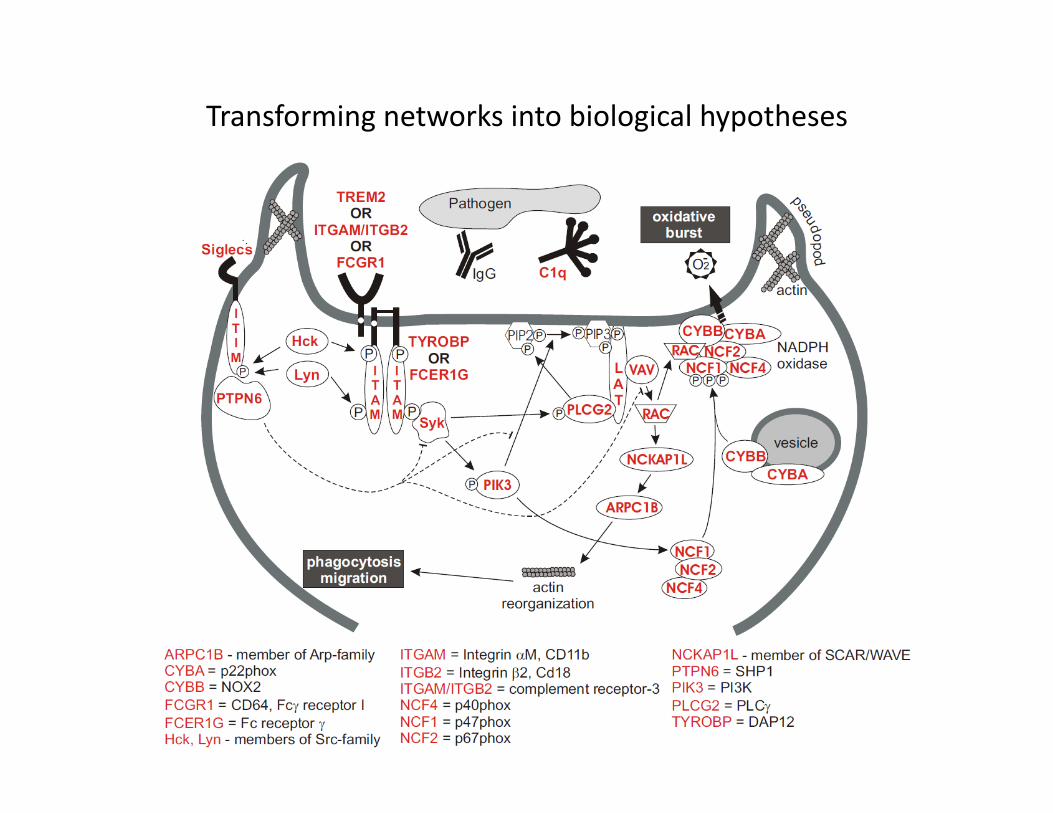
Transforming networks into biological hypotheses
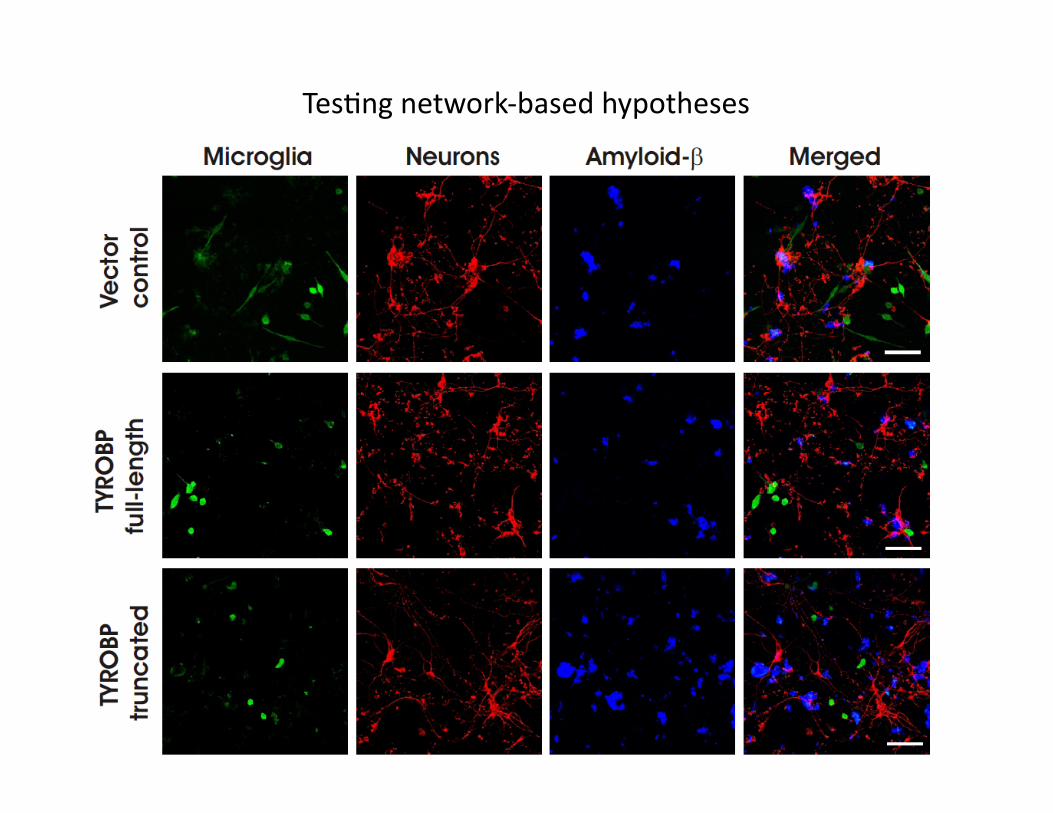
TesLng network-‐based hypotheses
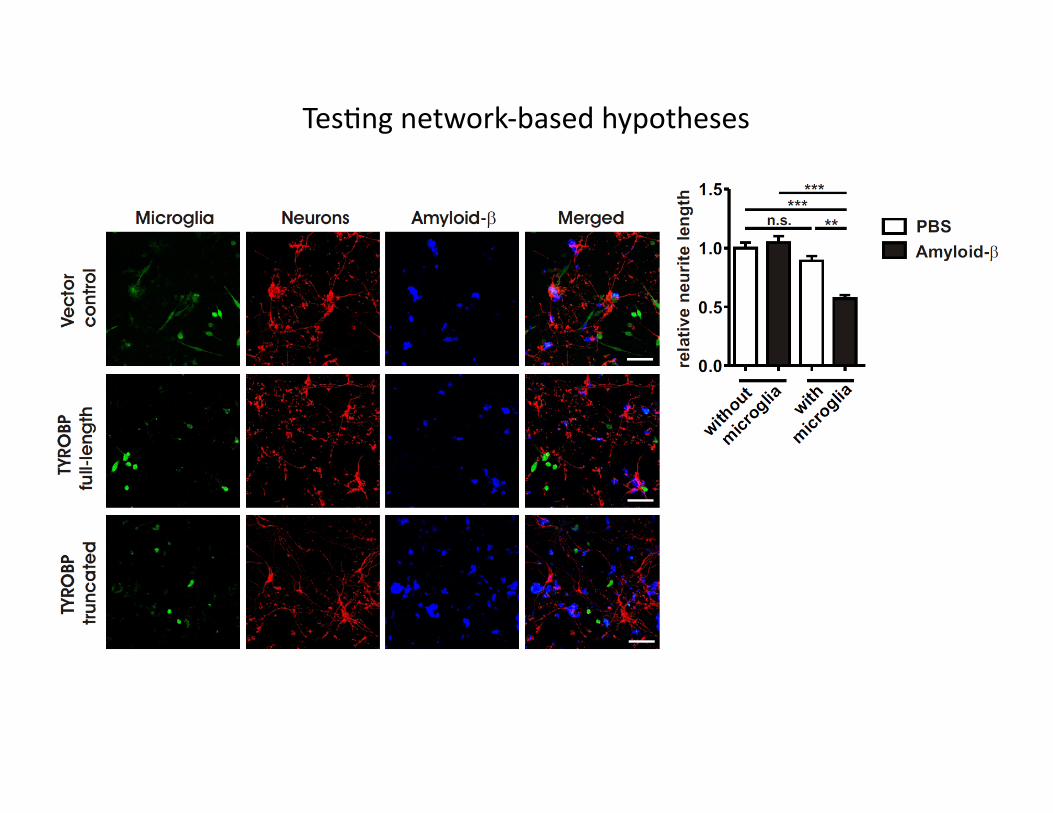
TesLng network-‐based hypotheses
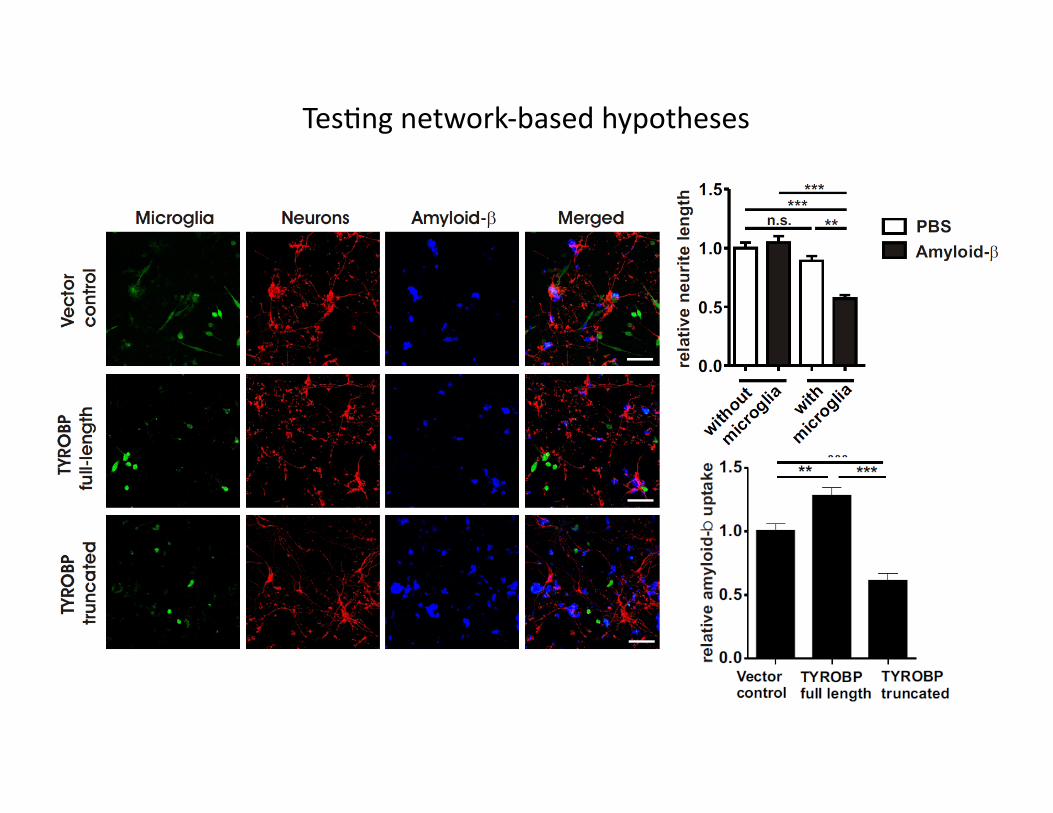
TesLng network-‐based hypotheses
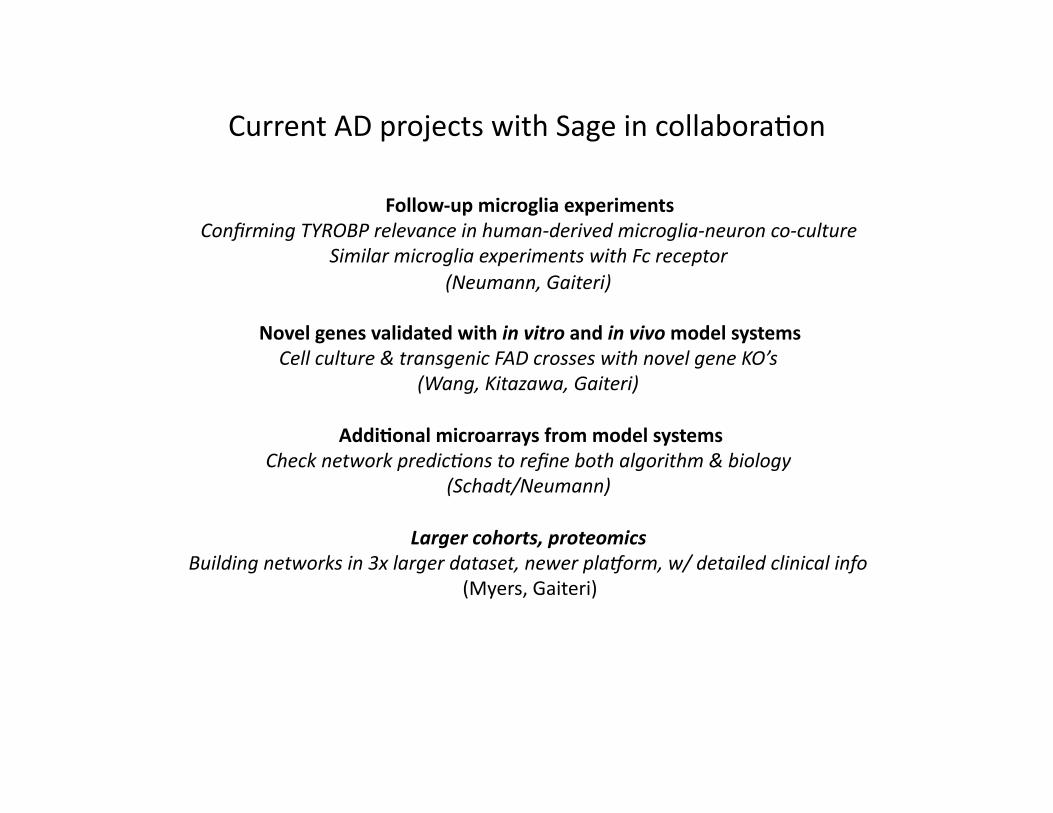
Current AD projects with Sage in collaboraLon
Follow-‐up microglia experiments Confirming TYROBP relevance in human-‐derived microglia-‐neuron co-‐culture
Similar microglia experiments with Fc receptor (Neumann, Gaiteri)
Novel genes validated with in vitro and in vivo model systems Cell culture & transgenic FAD crosses with novel gene KO’s
(Wang, Kitazawa, Gaiteri)
Addi2onal microarrays from model systems Check network predic6ons to refine both algorithm & biology
(Schadt/Neumann)
Larger cohorts, proteomics Building networks in 3x larger dataset, newer plaZorm, w/ detailed clinical info
(Myers, Gaiteri)
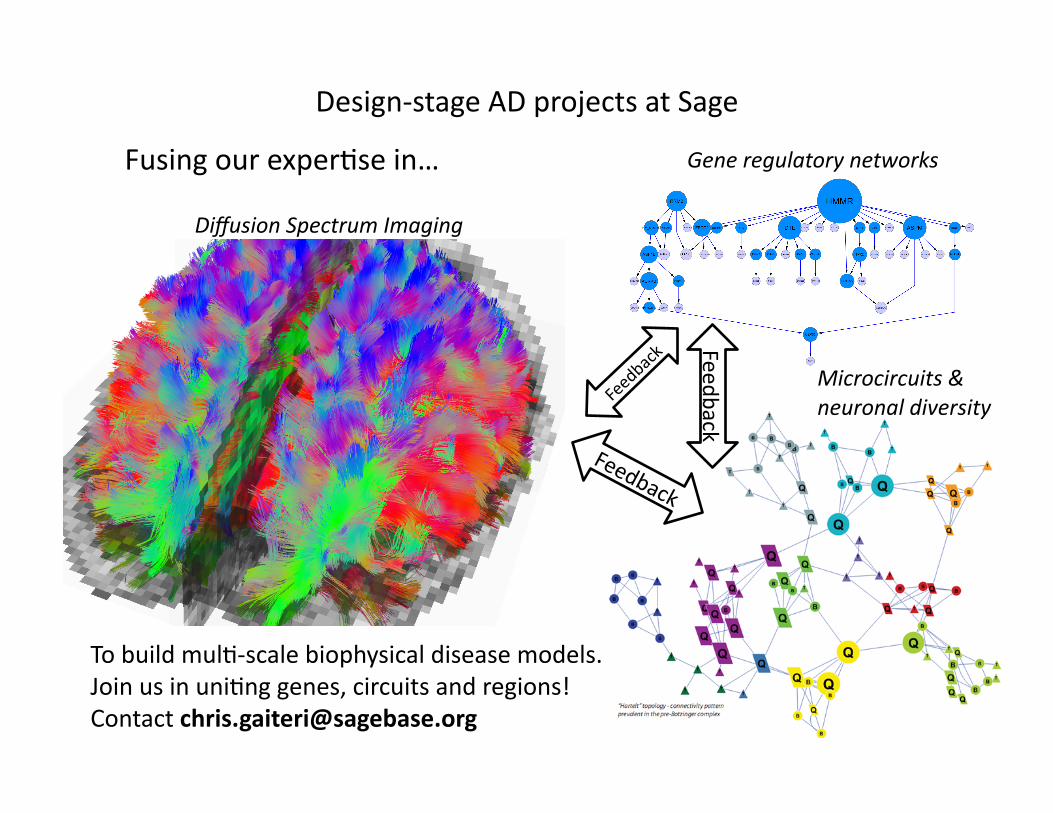
Design-‐stage AD projects at Sage
Fusing our experLse in…
To build mulL-‐scale biophysical disease models. Join us in uniLng genes, circuits and regions! Contact [email protected]
Diffusion Spectrum Imaging
Microcircuits & neuronal diversity
Gene regulatory networks
Feedback
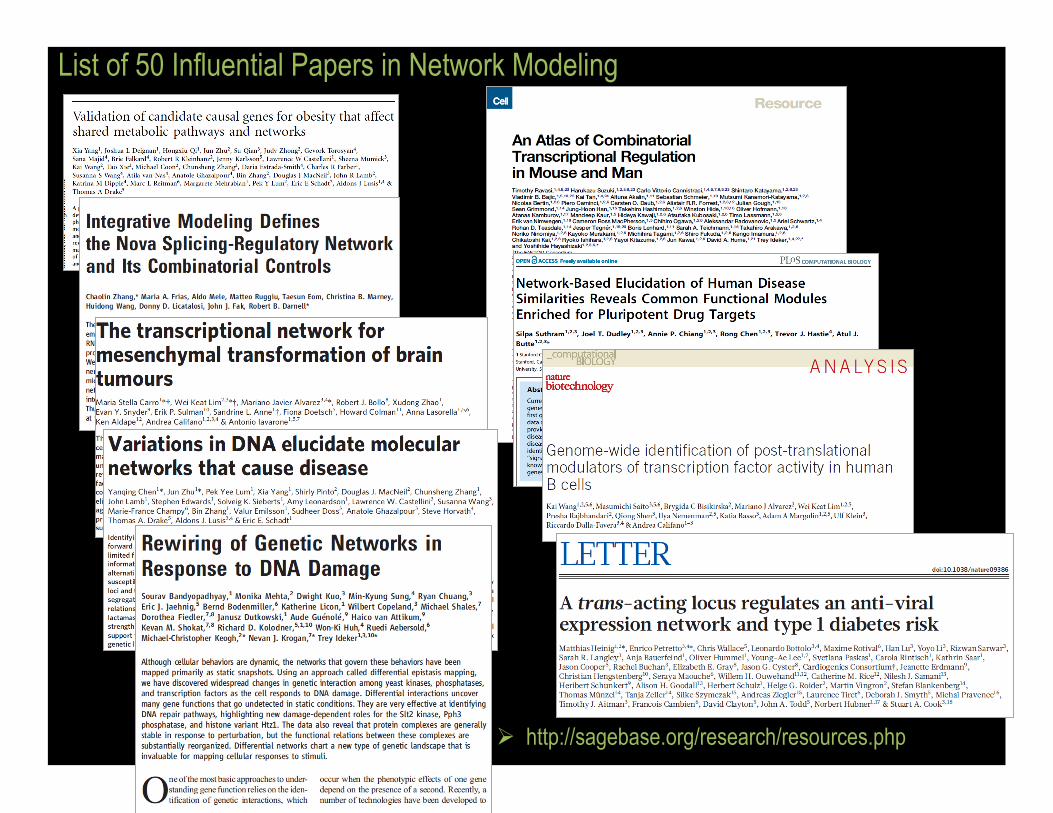
http://sagebase.org/research/resources.php
List of 50 Influential Papers in Network Modeling
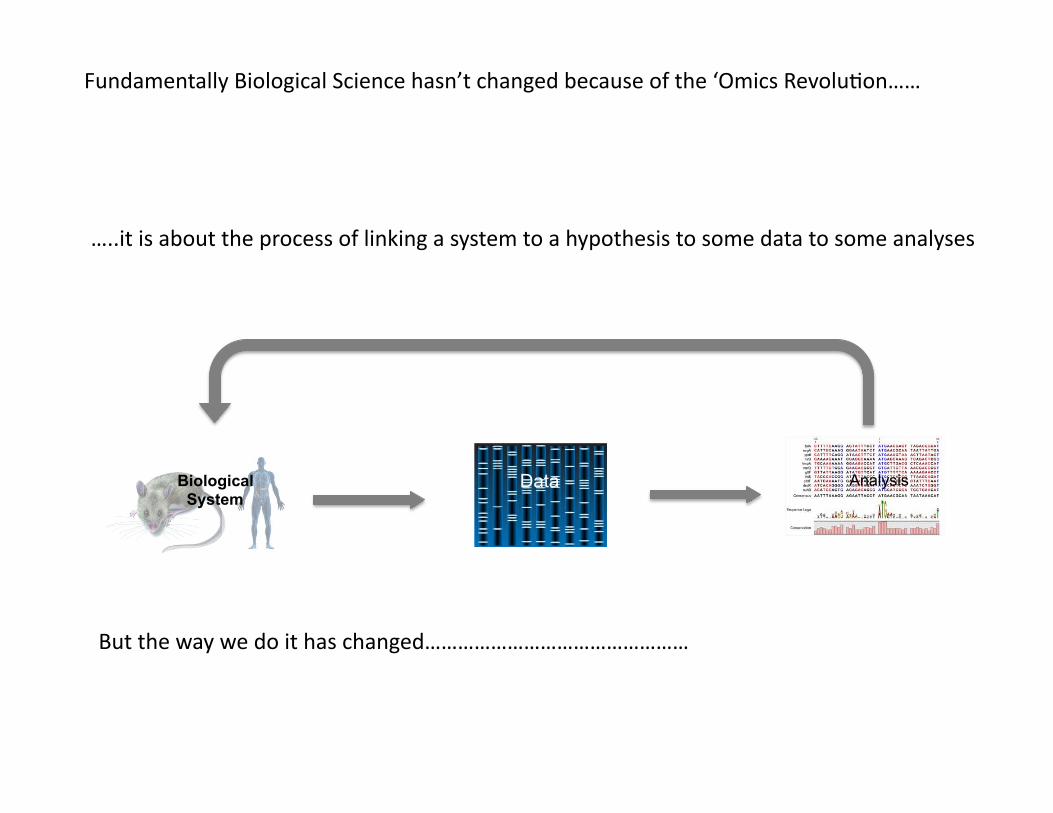
Biological System
Data Analysis
Fundamentally Biological Science hasn’t changed because of the ‘Omics RevoluLon……
…..it is about the process of linking a system to a hypothesis to some data to some analyses
But the way we do it has changed…………………………………………
Biological System
Data
Analysis
Biological System
Analysis
Data
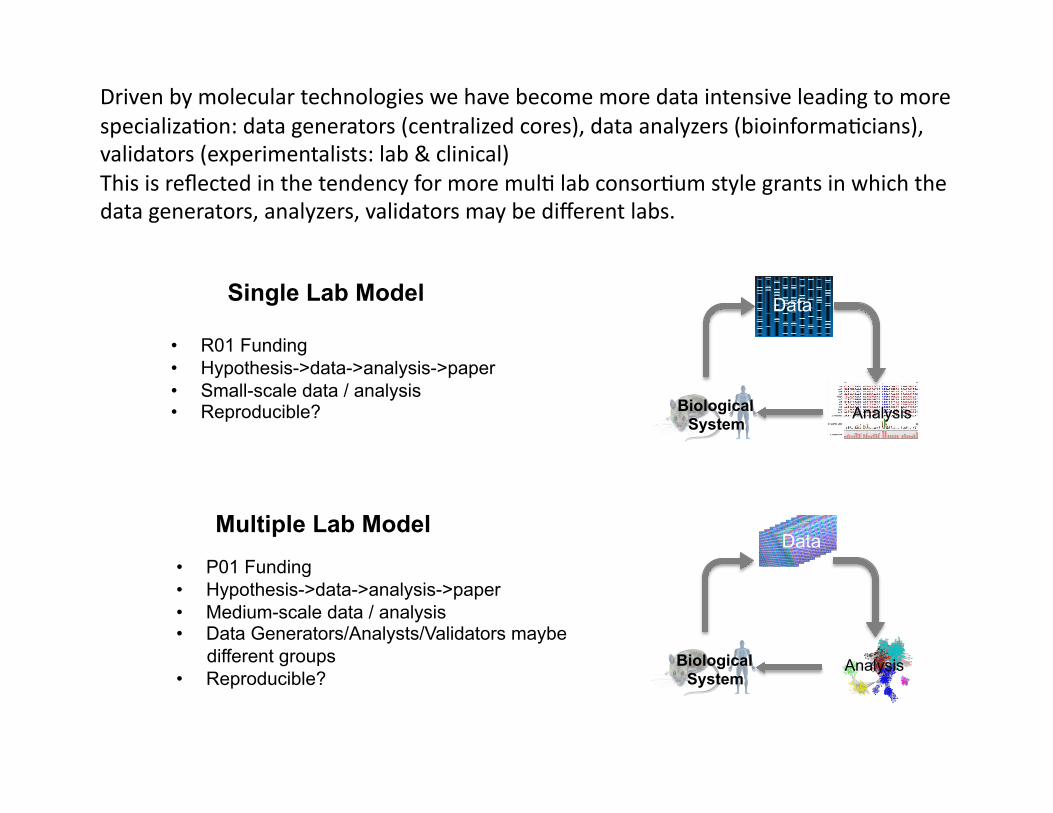
Single Lab Model
Multiple Lab Model
• R01 Funding • Hypothesis->data->analysis->paper • Small-scale data / analysis • Reproducible?
• P01 Funding • Hypothesis->data->analysis->paper • Medium-scale data / analysis • Data Generators/Analysts/Validators maybe
different groups • Reproducible?
Driven by molecular technologies we have become more data intensive leading to more specializaLon: data generators (centralized cores), data analyzers (bioinformaLcians), validators (experimentalists: lab & clinical) This is reflected in the tendency for more mulL lab consorLum style grants in which the data generators, analyzers, validators may be different labs.
Biological System
Data
Analysis
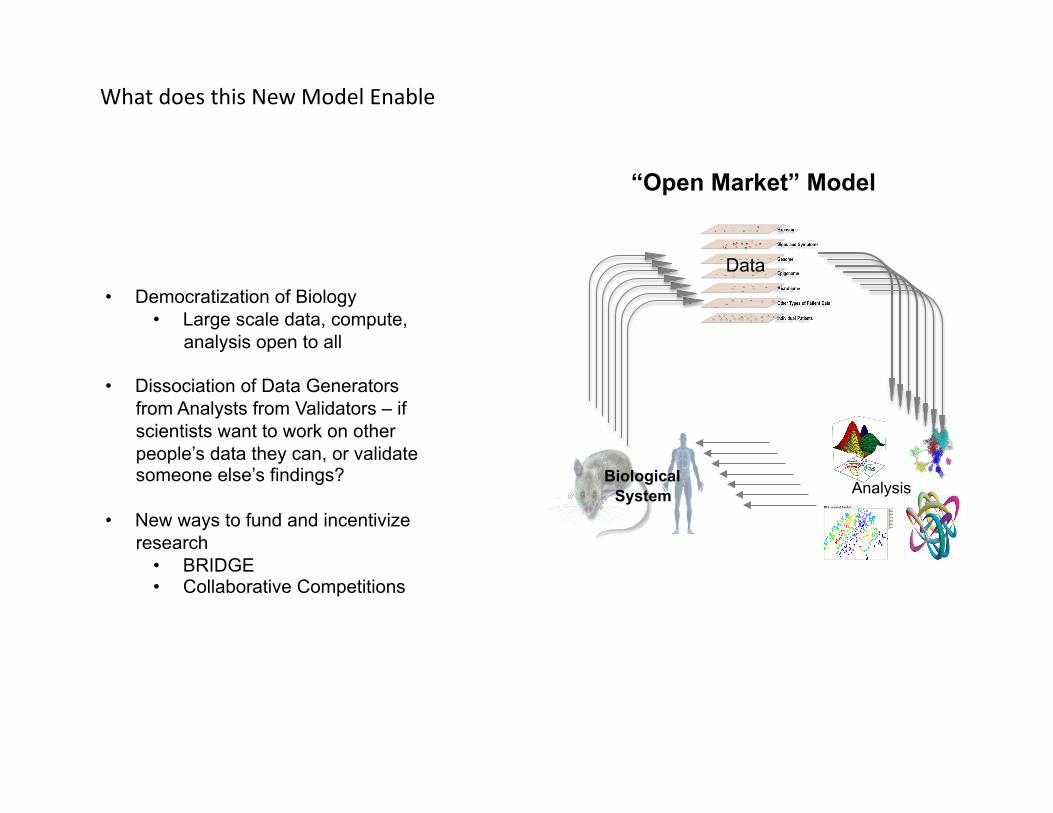
“Open Market” Model
• Democratization of Biology • Large scale data, compute,
analysis open to all
• Dissociation of Data Generators from Analysts from Validators – if scientists want to work on other people’s data they can, or validate someone else’s findings?
• New ways to fund and incentivize research
• BRIDGE • Collaborative Competitions
What does this New Model Enable
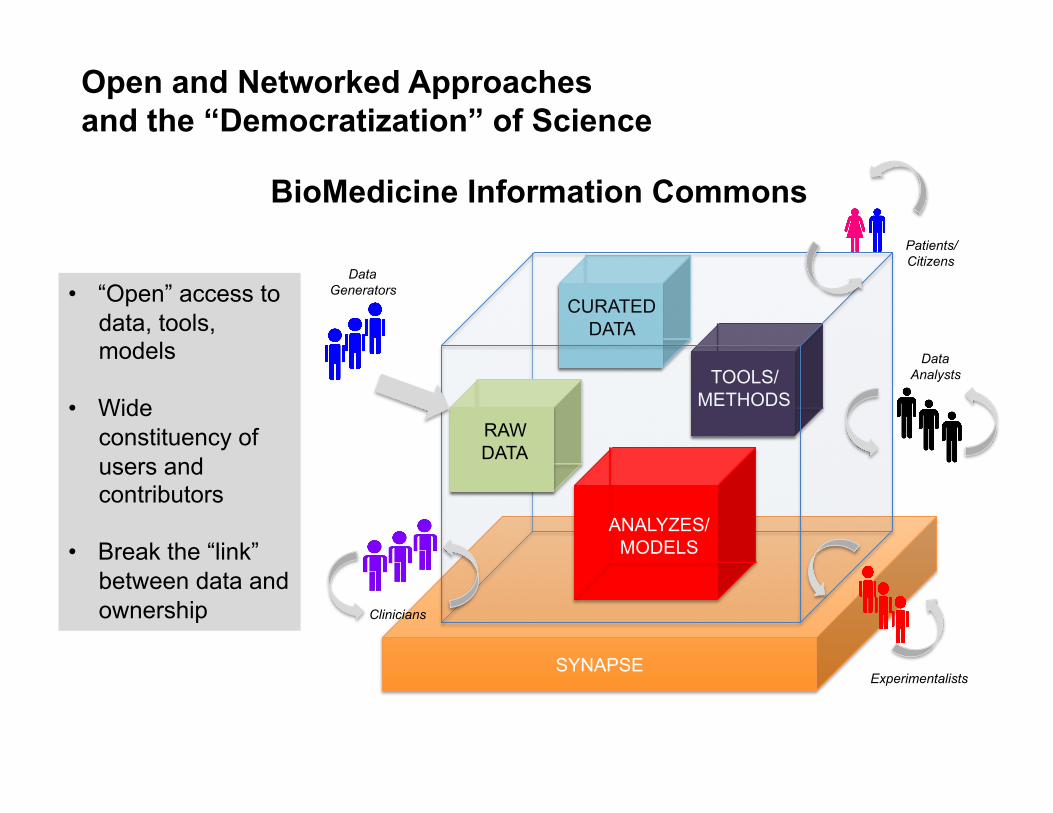
SYNAPSE
CURATED DATA
TOOLS/ METHODS
ANALYZES/ MODELS
RAW DATA
BioMedicine Information Commons
Data Generators
Data Analysts
Experimentalists
Clinicians
Patients/ Citizens
Open and Networked Approaches and the “Democratization” of Science
• “Open” access to data, tools, models
• Wide constituency of users and contributors
• Break the “link” between data and ownership
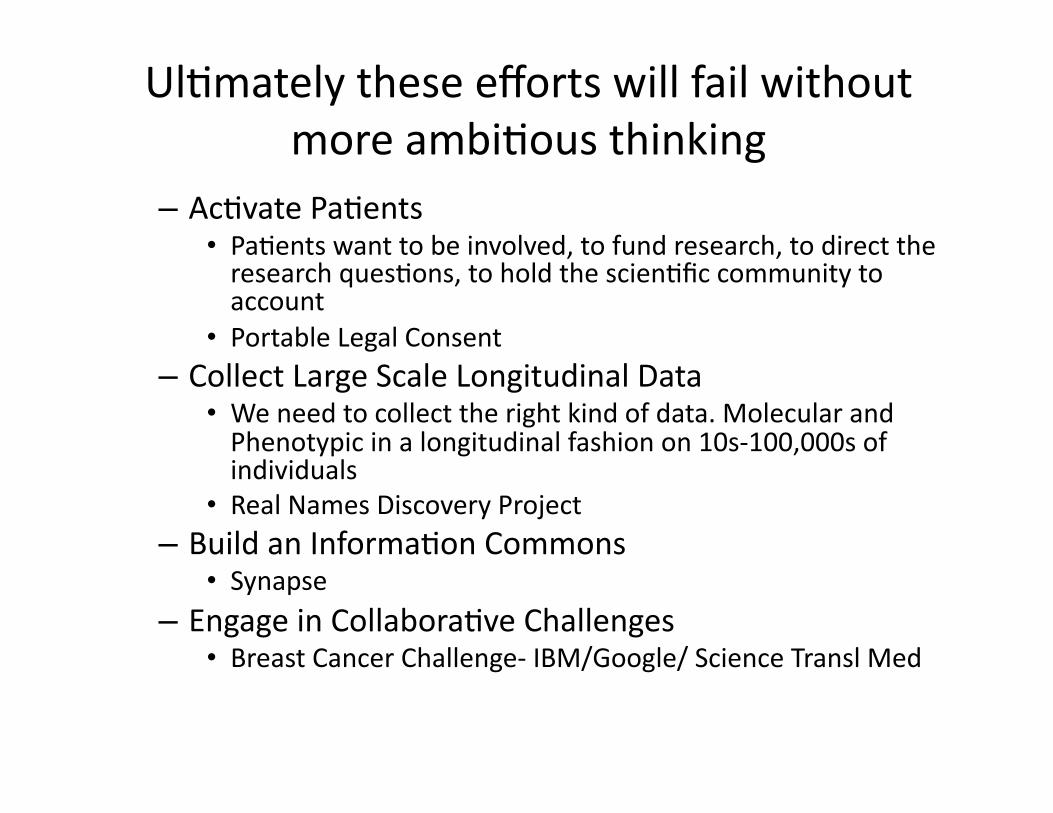
UlLmately these efforts will fail without more ambiLous thinking
– AcLvate PaLents • PaLents want to be involved, to fund research, to direct the research quesLons, to hold the scienLfic community to account
• Portable Legal Consent – Collect Large Scale Longitudinal Data
• We need to collect the right kind of data. Molecular and Phenotypic in a longitudinal fashion on 10s-‐100,000s of individuals
• Real Names Discovery Project – Build an InformaLon Commons
• Synapse – Engage in CollaboraLve Challenges
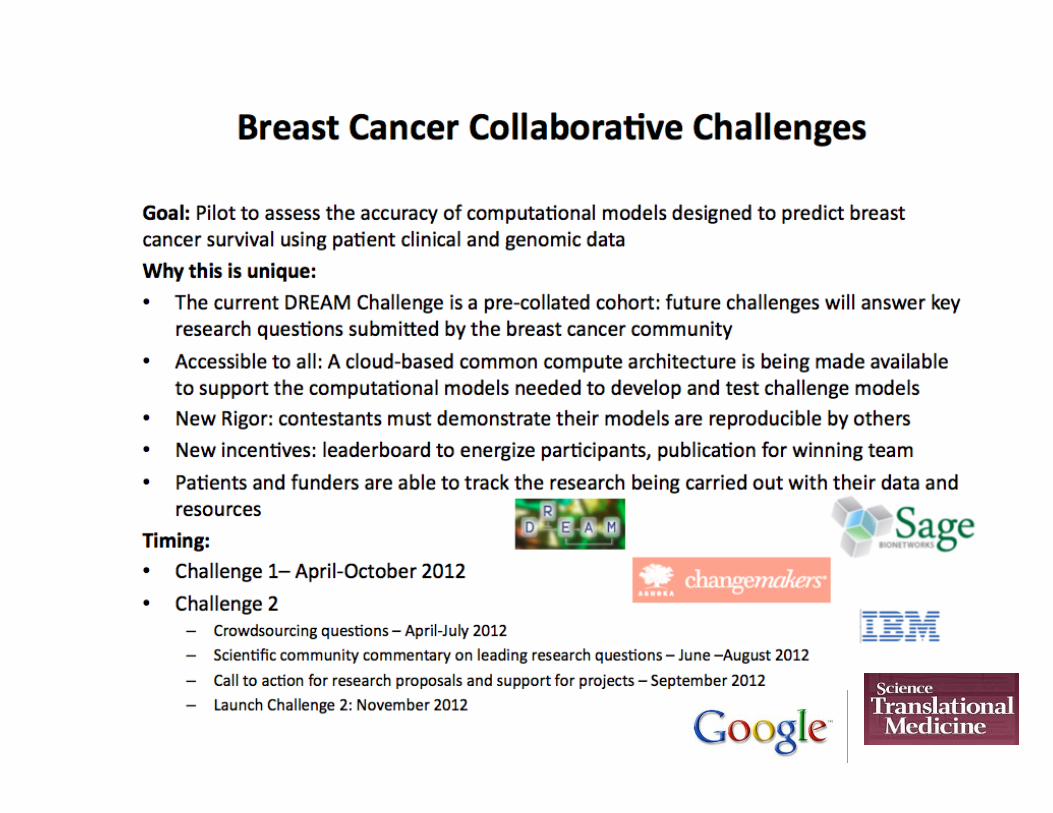
• Breast Cancer Challenge-‐ IBM/Google/ Science Transl Med
SYNAPSE
CURATED DATA
TOOLS/ METHODS
ANALYZES/ MODELS
RAW DATA
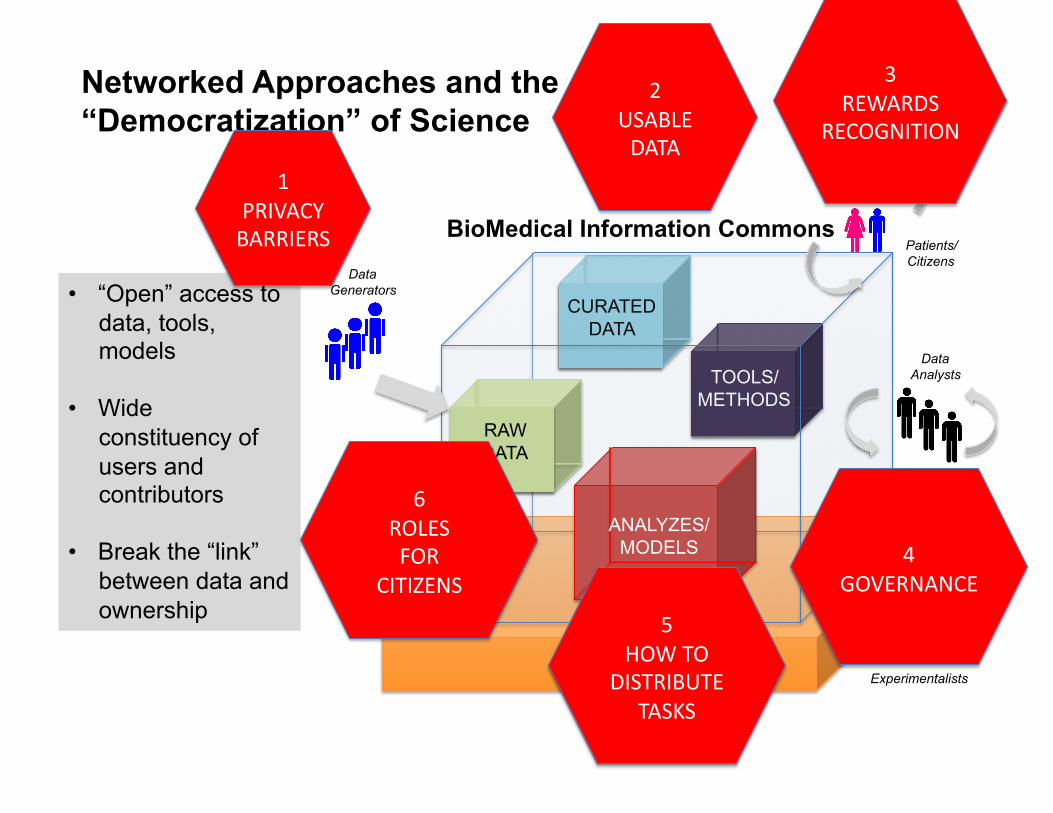
BioMedical Information Commons
Data Generators
Data Analysts
Experimentalists
Clinicians
Patients/ Citizens
Networked Approaches and the “Democratization” of Science
• “Open” access to data, tools, models
• Wide constituency of users and contributors
• Break the “link” between data and ownership
1 PRIVACY BARRIERS
3 REWARDS
RECOGNITION
4 GOVERNANCE
2 USABLE DATA
6 ROLES FOR
CITIZENS
5 HOW TO
DISTRIBUTE TASKS
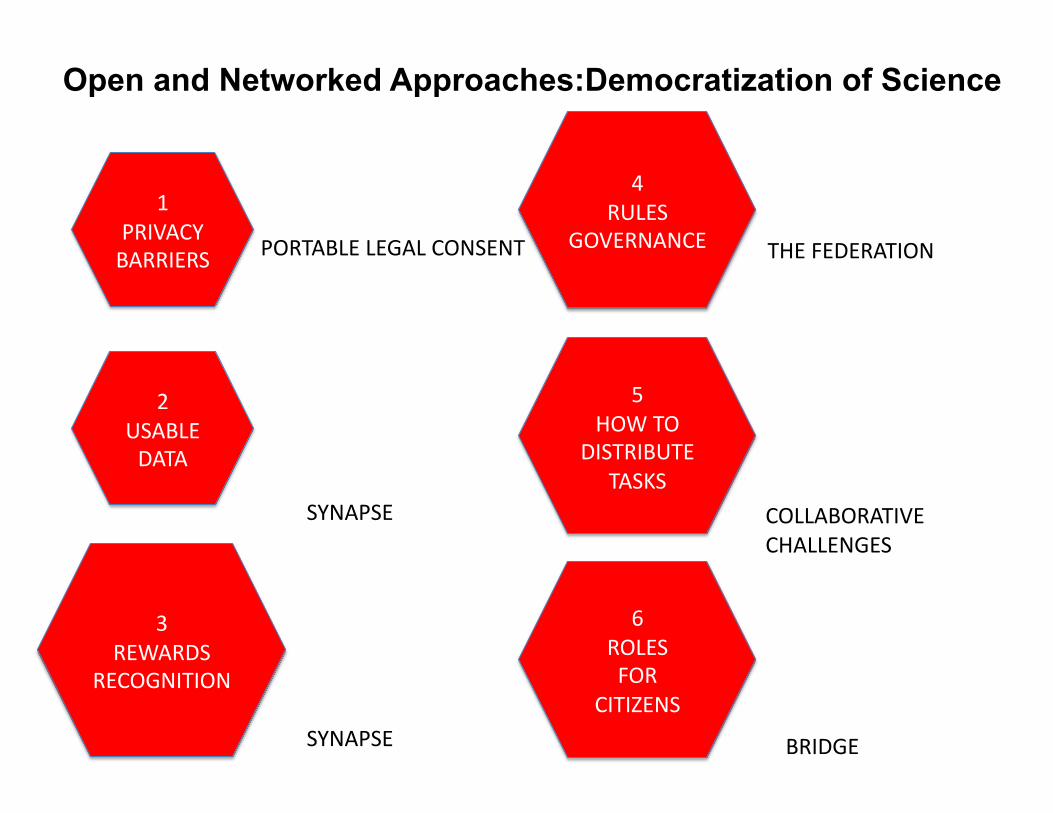
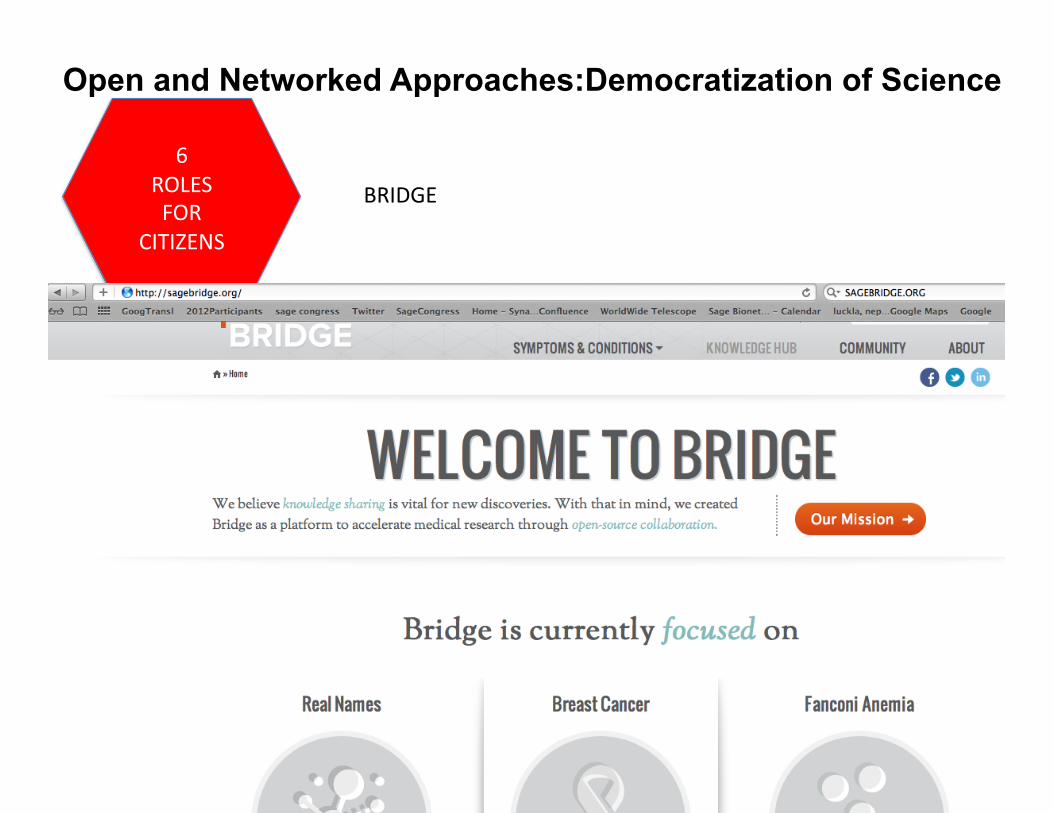
Open and Networked Approaches:Democratization of Science
1 PRIVACY BARRIERS
2 USABLE DATA
4 RULES
GOVERNANCE
3 REWARDS
RECOGNITION
6 ROLES FOR
CITIZENS
5 HOW TO
DISTRIBUTE TASKS
PORTABLE LEGAL CONSENT
SYNAPSE
SYNAPSE
THE FEDERATION
COLLABORATIVE CHALLENGES
BRIDGE
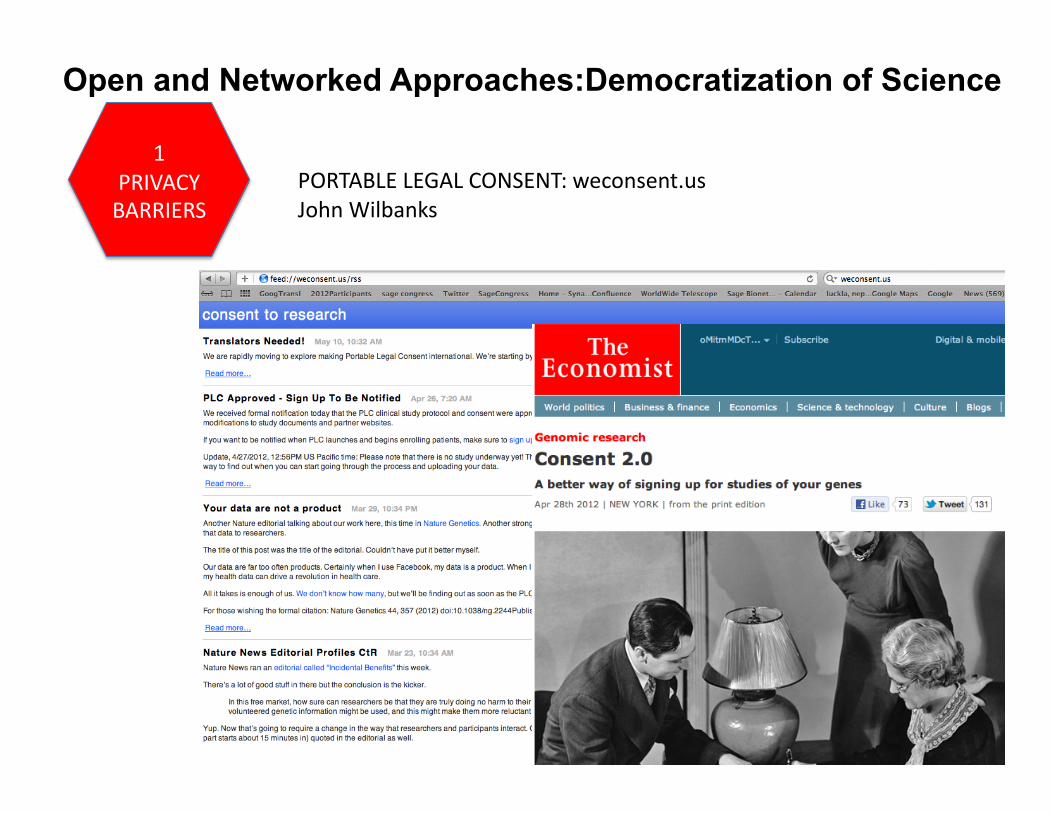
Open and Networked Approaches:Democratization of Science
1 PRIVACY BARRIERS
PORTABLE LEGAL CONSENT: weconsent.us John Wilbanks
Open and Networked Approaches:Democratization of Science
2 USABLE DATA
3 REWARDS
RECOGNITION
SYNAPSE
SYNAPSE
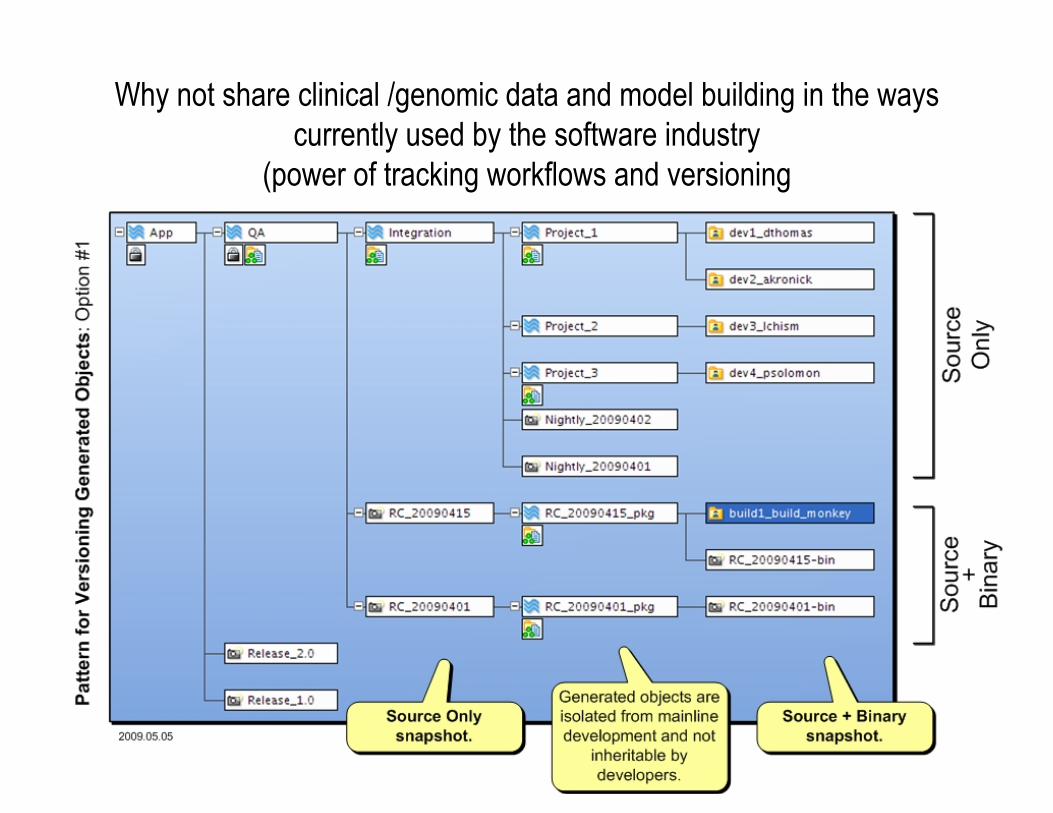
Why not share clinical /genomic data and model building in the ways currently used by the software industry
(power of tracking workflows and versioning
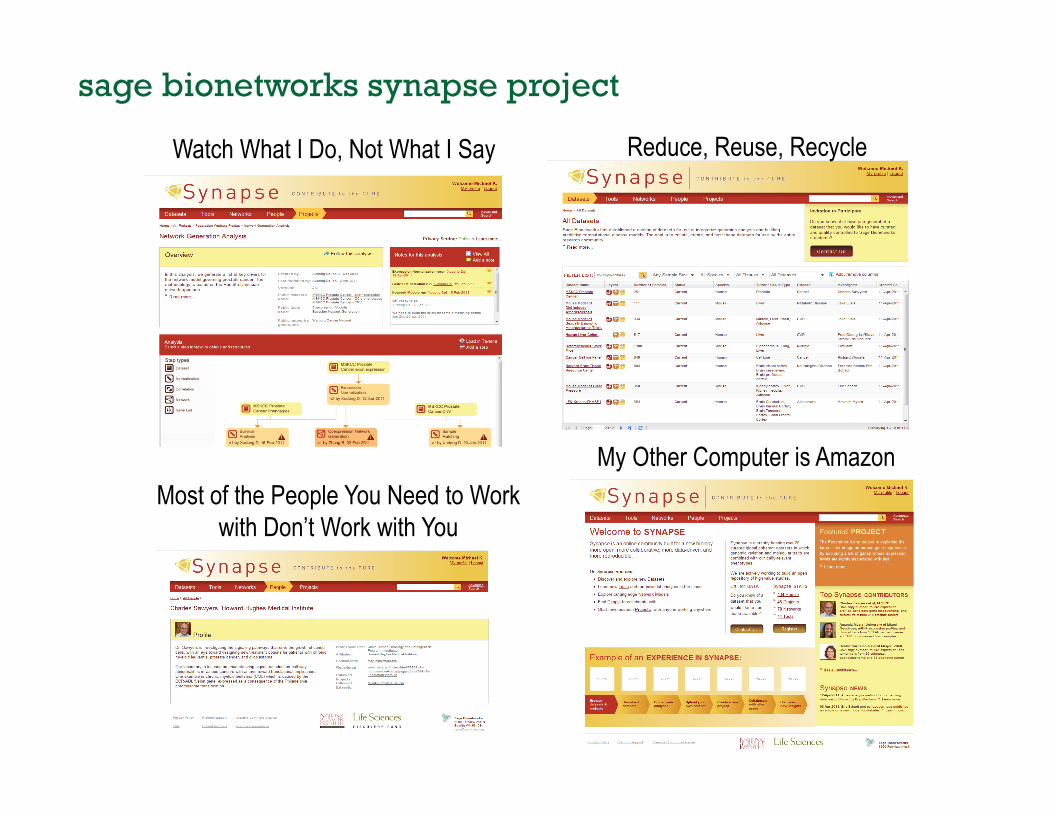
Watch What I Do, Not What I Say Reduce, Reuse, Recycle
Most of the People You Need to Work with Don’t Work with You
My Other Computer is Amazon
sage bionetworks synapse project
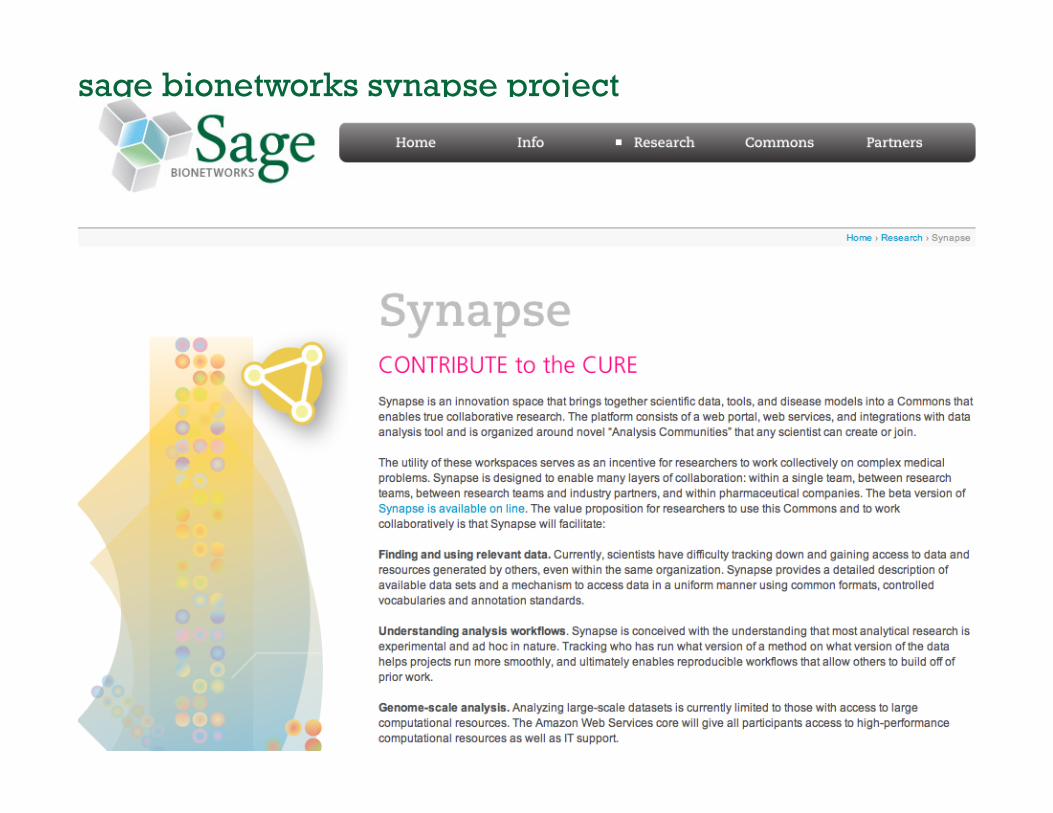
sage bionetworks synapse project
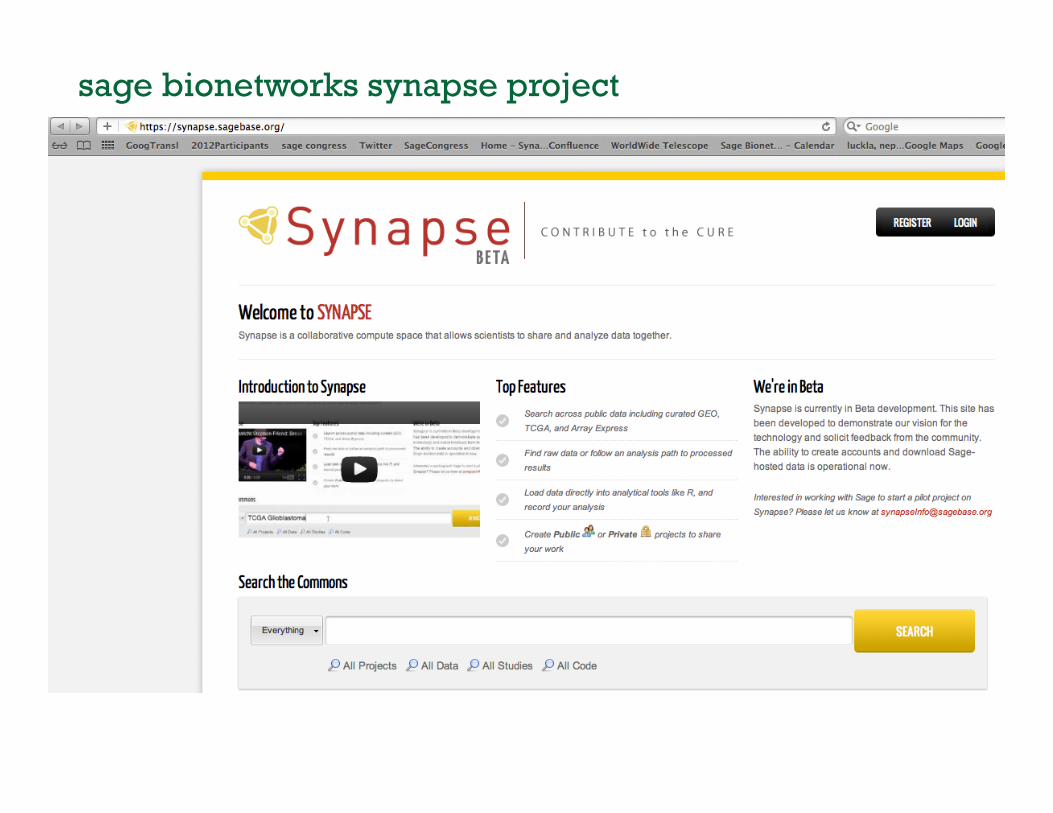
sage bionetworks synapse project
Open and Networked Approaches:Democratization of Science
4 RULES
GOVERNANCE
THE FEDERATION
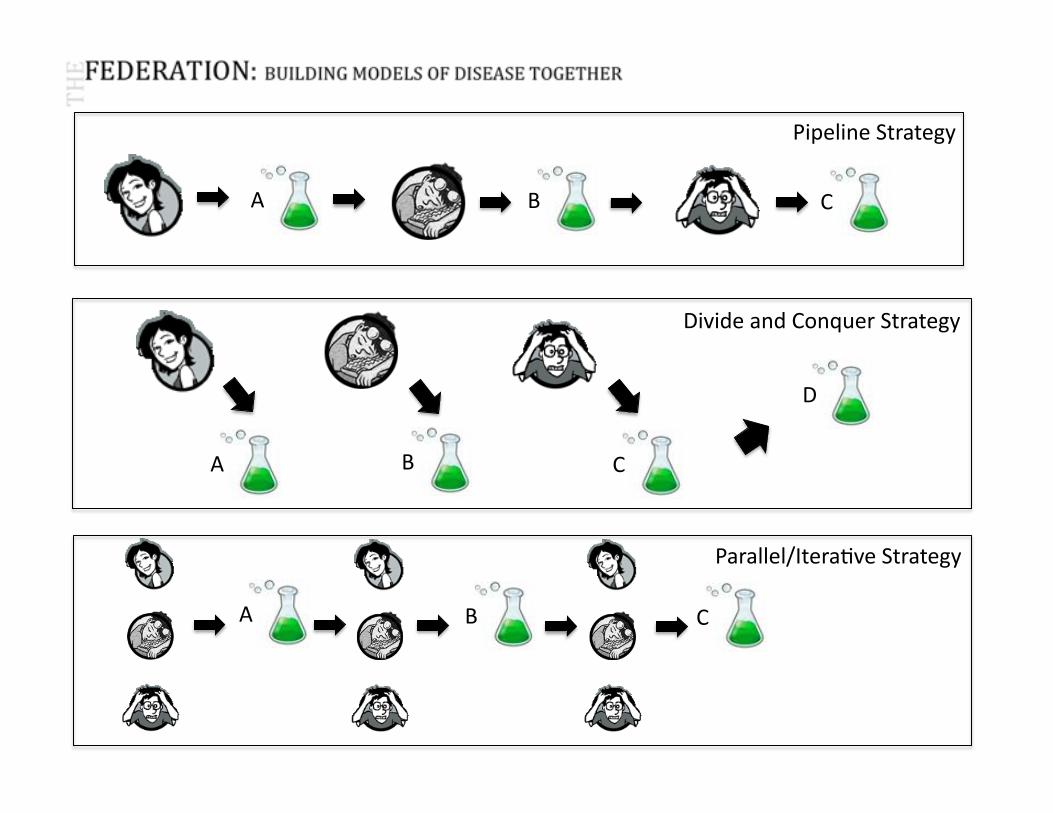
A B C
Pipeline Strategy
A B C
D
Divide and Conquer Strategy
A B C
Parallel/IteraLve Strategy
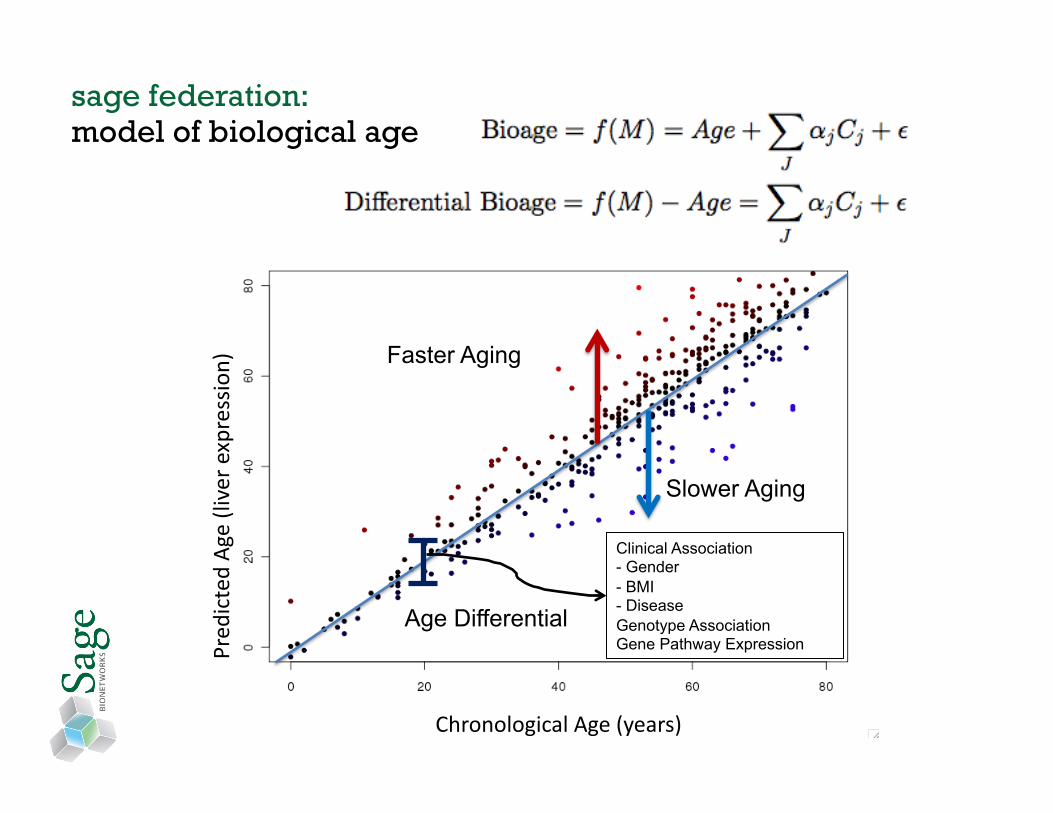
sage federation: model of biological age
Faster Aging
Slower Aging
Clinical Association - Gender - BMI - Disease Genotype Association Gene Pathway Expression Pr
edicted Age (liver expression)
Chronological Age (years)
Age Differential
sage federation: Google- SageBionetworks / The Federation
Open and Networked Approaches:Democratization of Science
5 HOW TO
DISTRIBUTE TASKS
COLLABORATIVE CHALLENGES
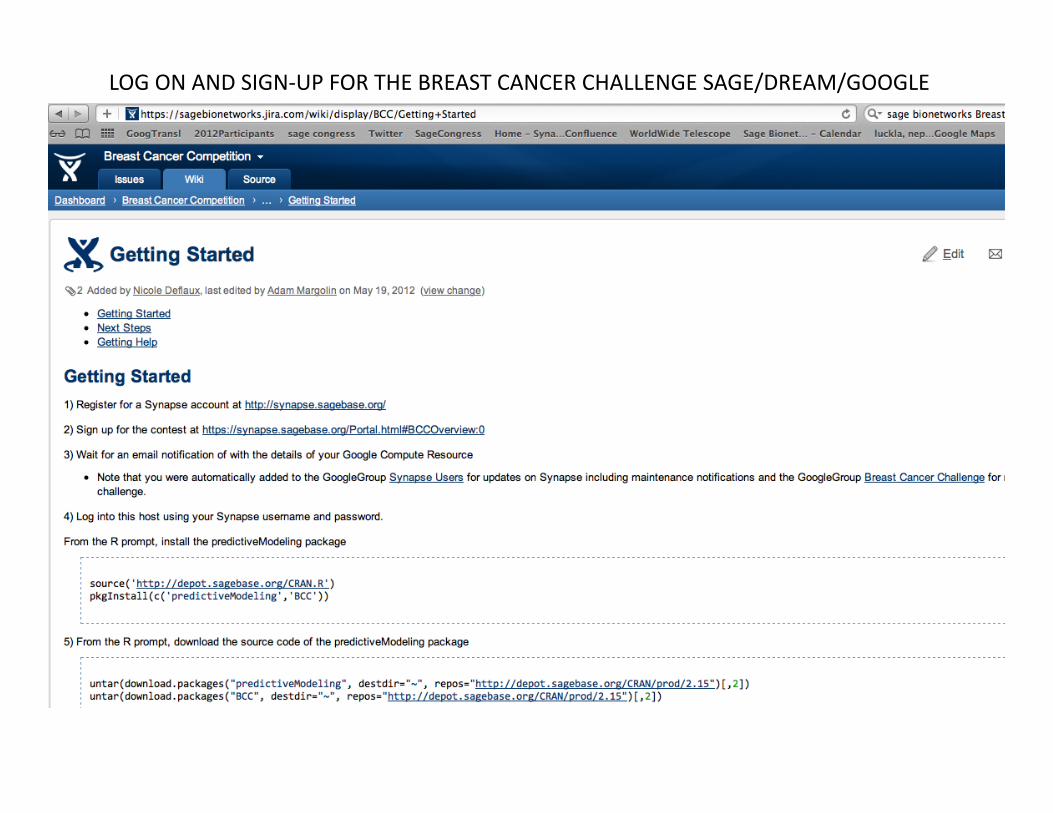
LOG ON AND SIGN-‐UP FOR THE BREAST CANCER CHALLENGE SAGE/DREAM/GOOGLE
Open and Networked Approaches:Democratization of Science
6 ROLES FOR
CITIZENS
BRIDGE
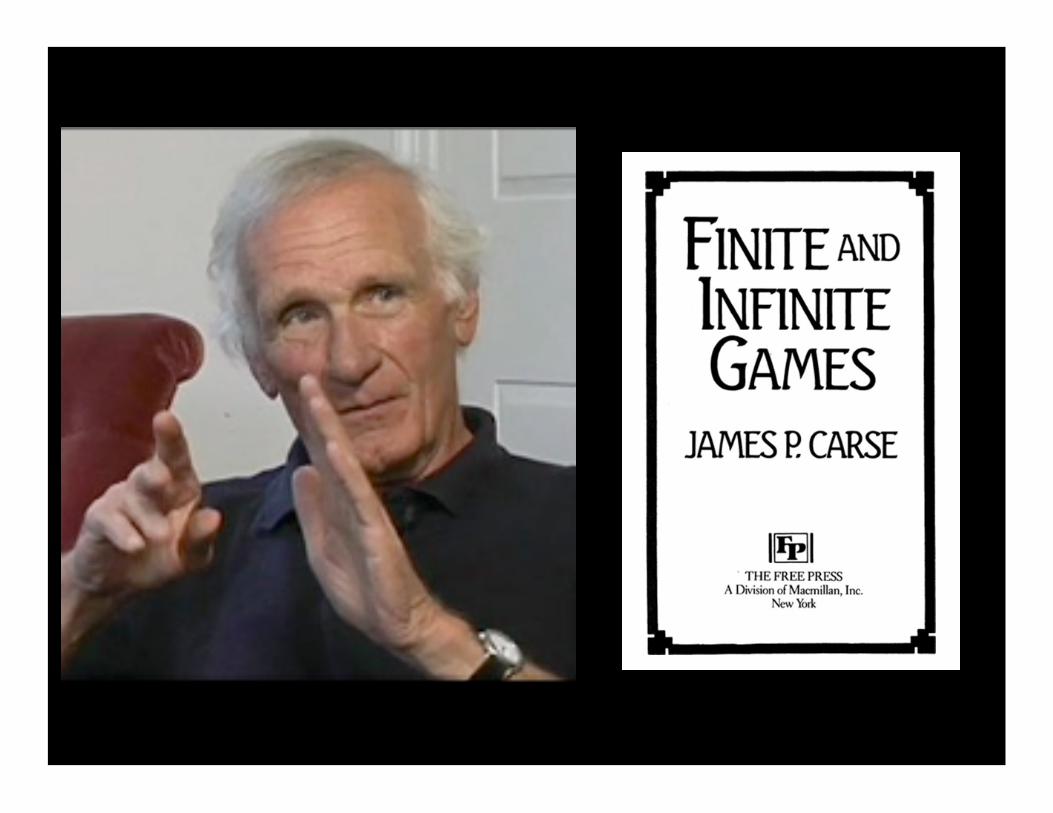
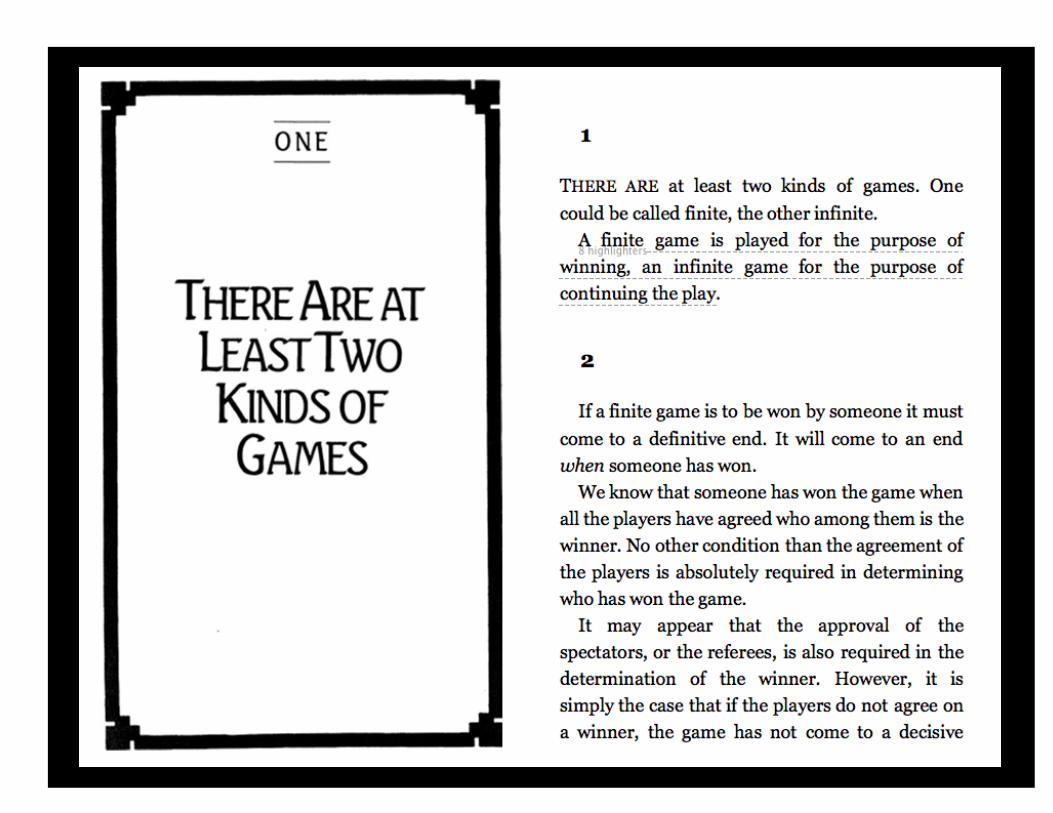
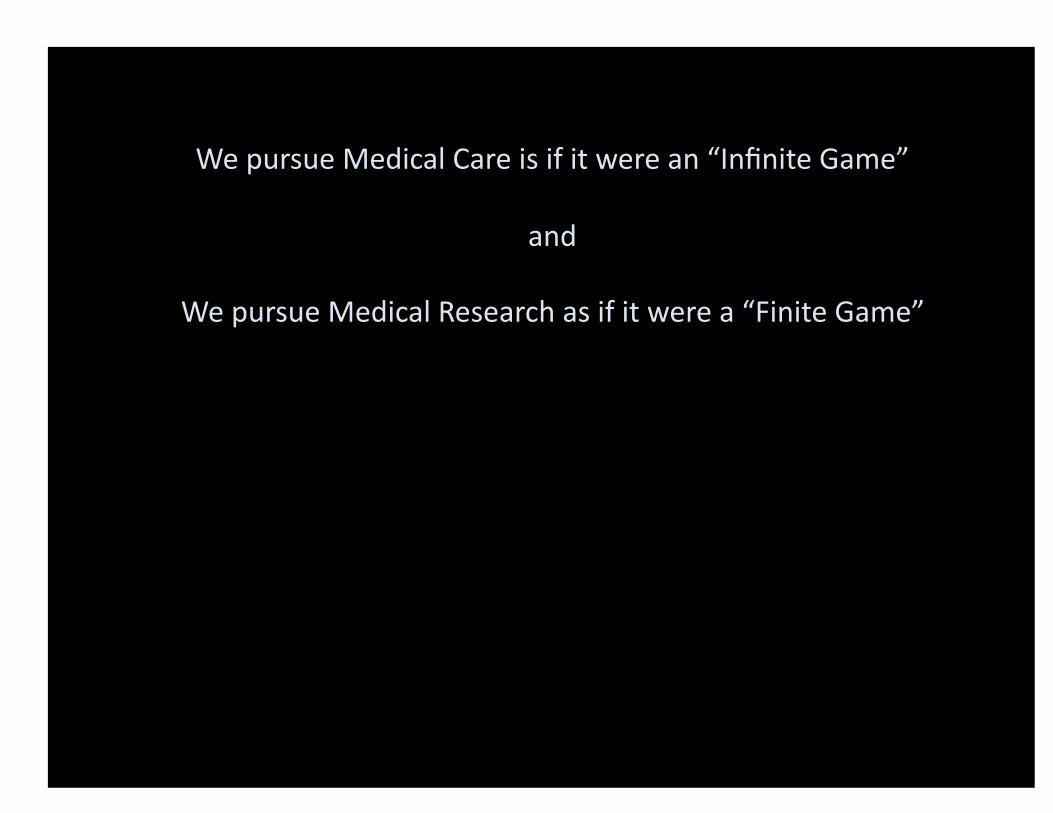
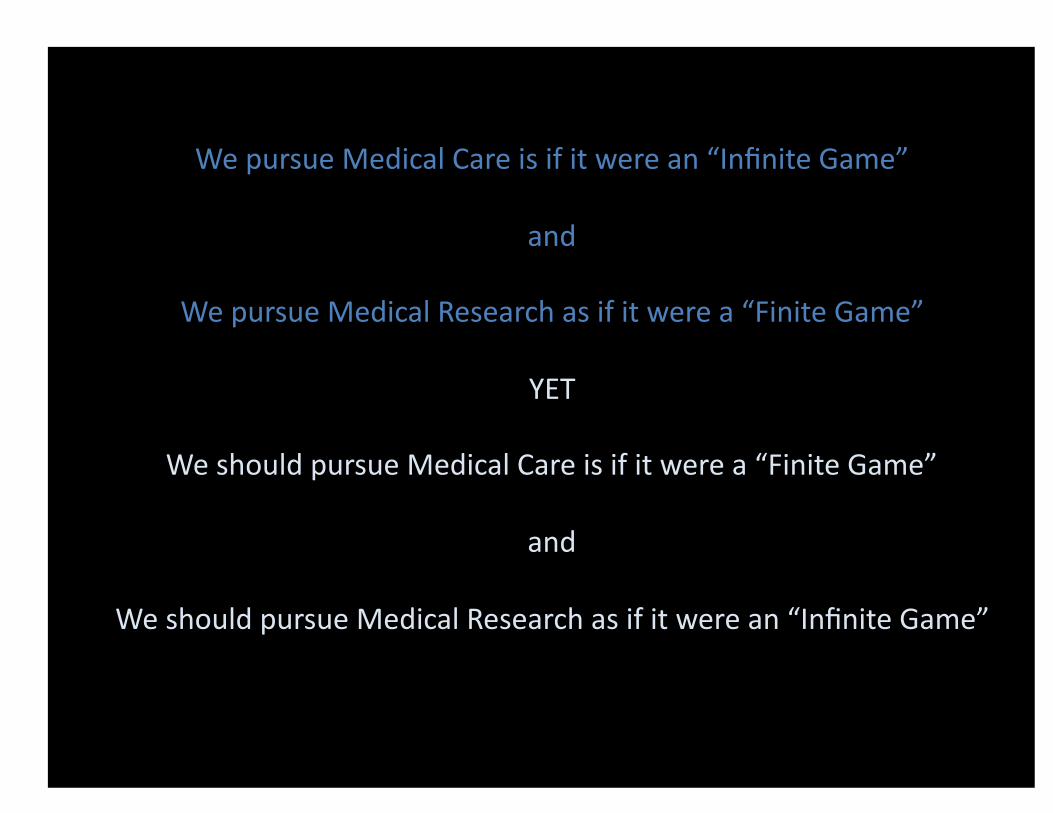
We pursue Medical Care is if it were an “Infinite Game”
and
We pursue Medical Research as if it were a “Finite Game”
We pursue Medical Care is if it were an “Infinite Game”
and
We pursue Medical Research as if it were a “Finite Game”
YET
We should pursue Medical Care is if it were a “Finite Game”
and
We should pursue Medical Research as if it were an “Infinite Game”
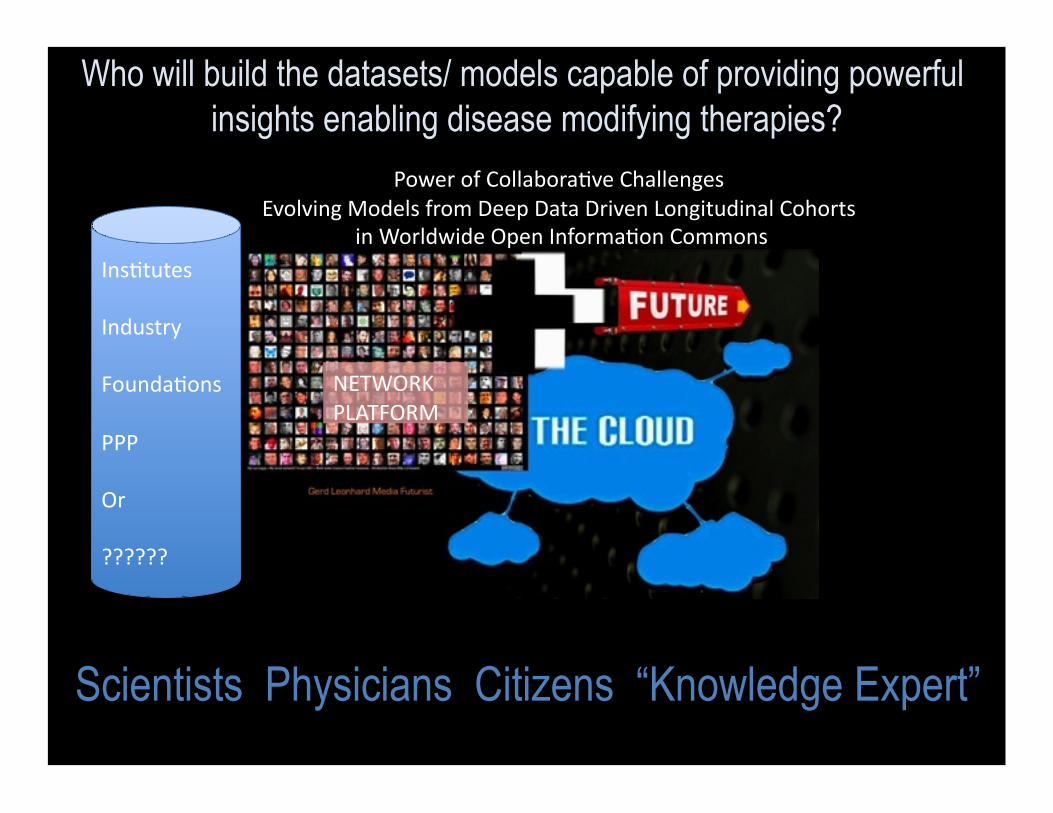
Who will build the datasets/ models capable of providing powerful insights enabling disease modifying therapies?
Scientists Physicians Citizens “Knowledge Expert”
NETWORK PLATFORM
InsLtutes
Industry
FoundaLons
PPP
Or
??????
Power of CollaboraLve Challenges Evolving Models from Deep Data Driven Longitudinal Cohorts
in Worldwide Open InformaLon Commons