freshwater savings from marine protein consumption
TRANSCRIPT
This content has been downloaded from IOPscience. Please scroll down to see the full text.
Download details:
IP Address: 130.63.180.147
This content was downloaded on 04/07/2014 at 09:24
Please note that terms and conditions apply.
Freshwater savings from marine protein consumption
View the table of contents for this issue, or go to the journal homepage for more
2014 Environ. Res. Lett. 9 014005
(http://iopscience.iop.org/1748-9326/9/1/014005)
Home Search Collections Journals About Contact us My IOPscience
Corrigendum: Freshwater savings frommarine protein consumption (2014 Environ.Res. Lett. 9 014005)
Jessica A Gephart, Michael L Pace and Paolo D’ Odorico
Department of Environmental Science, PO Box 400123, 291 McCormick Road, Charlottesville, VA22904-4123, USA
E-mail: [email protected]
The fish consumption data presented in table 2 of this articlerepresents all aquatic protein consumption, rather than themarine-only protein consumption data actually used in theanalysis. The corrected version of table 2 here presents the
correct values for marine protein consumption and shouldreplace the table 2 in this article. This change does not affectany other figures or results presented in this article.
Environmental Research Letters
Environ. Res. Lett. 9 (2014) 069501 (1pp) doi:10.1088/1748-9326/9/6/069501
Table 2. Current marine protein consumption levels multiplied by the calculated water footprints for the two groups of substitutes in fivecountries gives the daily per capita water savings. Five countries are presented as examples. Comparing these values to current waterfootprints gives the percent increase. All Subs means that all food sources were weighted to calculate the average water footprint for a gramof protein, while Animal Subs means that only animal food sources were used.
Marine protein consumption Substitute WFP WFP Increase Current WFP PercentCountry (g protein/cap/day) (l/g protein) (l/cap/day) (l/cap/day) increase
Solomon Islands 11.0 — — 1978.7 —
All Subs — 39.6 435.6 — 22.0Animal Subs — 70 770.0 — 38.9Gambia 6.8 — — 2428.1 —
All Subs — 32.3 219.8 — 9.0Animal Subs — 47.6 323.7 — 13.3Denmark 6.4 — — 4475.2 —
All Subs — 41.6 266.2 — 5.9Animal Subs — 45.7 292.5 — 6.5United States 4.4 — — 7782.2 —
All Subs — 45.9 202.0 — 2.6Animal Subs — 49 215.6 — 2.8Lesotho 0.2 — — 4488.8 —
All Subs — 26 5.2 — 0.1Animal Subs — 61.7 12.3 — 0.3
Content from this work may be used under the terms of theCreative Commons Attribution 3.0 licence. Any further
distribution of this work must maintain attribution to the author(s) and thetitle of the work, journal citation and DOI.
1748-9326/14/069501+01$33.00 © 2014 IOP Publishing Ltd1
Environmental Research Letters
Environ. Res. Lett. 9 (2014) 014005 (8pp) doi:10.1088/1748-9326/9/1/014005
Freshwater savings from marine proteinconsumptionJessica A Gephart, Michael L Pace and Paolo D’Odorico
Department of Environmental Science, PO Box 400123, 291 McCormick Road, Charlottesville,VA 22904-4123, USA
E-mail: [email protected]
Received 23 July 2013, revised 6 November 2013Accepted for publication 23 December 2013Published 15 January 2014
AbstractMarine fisheries provide an essential source of protein for many people around the world.Unlike alternative terrestrial sources of protein, marine fish production requires little to nofreshwater inputs. Consuming marine fish protein instead of terrestrial protein thereforerepresents freshwater savings (equivalent to an avoided water cost) and contributes to a lowwater footprint diet. These water savings are realized by the producers of alternative proteinsources, rather than the consumers of marine protein. This study quantifies freshwater savingsfrom marine fish consumption around the world by estimating the water footprint of replacingmarine fish with terrestrial protein based on current consumption patterns. An estimated7 600 km3 yr−1 of water is used for human food production. Replacing marine protein withterrestrial protein would require an additional 350 km3 yr−1 of water, meaning that marineprotein provides current water savings of 4.6%. The importance of these freshwater savings ishighly uneven around the globe, with savings ranging from as little as 0 to as much as 50%.The largest savings as a per cent of current water footprints occur in Asia, Oceania, andseveral coastal African nations. The greatest national water savings from marine fish proteinoccur in Southeast Asia and the United States. As the human population increases, futurewater savings from marine fish consumption will be increasingly important to food and watersecurity and depend on sustainable harvest of capture fisheries and low water footprint growthof marine aquaculture.
Keywords: water footprint, fish, freshwater, food security, water security, virtual water
1. Introduction
With a current human population greater than 7 billion andgrowing toward 9–10 billion by 2050, many resource analystshave become concerned about meeting basic human needs,including access to freshwater (UNEP 2012). Over the lastcentury, water use has grown at more than twice the rateof population increase, raising the possibility of insufficientwater supply, especially in areas already experiencing watershortages (WWAP 2012). Over 80% of the water currentlyused by humans is allocated to food production (Carr et al2012). Marine fisheries however require little to no freshwater
Content from this work may be used under the terms ofthe Creative Commons Attribution 3.0 licence. Any further
distribution of this work must maintain attribution to the author(s) and thetitle of the work, journal citation and DOI.
inputs, and therefore provide one of the most water-efficientways of supporting the human diet.
The amount of water required to produce a unit of agood is the water footprint (Hoekstra and Chapagain 2007).The calculation of water footprints includes surface andgroundwater (blue water) use, soil water (green water) use,and water required to dilute freshwater pollution to meet waterquality standards (grey water) (Hoekstra et al 2011). Waterfootprints are large for many terrestrial protein sources suchas: chicken (4325 l kg−1), mutton/goat meat (8763 l kg−1), nuts(9063 l kg−1), and bovine meat (15 415 l kg−1) (Mekonnenand Hoekstra 2010).
Marine capture fisheries and aquaculture howevergenerally do not require freshwater inputs; so despite livingin water, marine fish have little to no consumptive water
1748-9326/14/014005+08$33.00 1 c© 2014 IOP Publishing Ltd Printed in the UK
Environ. Res. Lett. 9 (2014) 014005 J A Gephart et al
requirements (Hoekstra 2003). Consequently, marine proteinhas approximately no water footprint (∼ 0 l kg−1). As a result,replacing marine protein with terrestrial protein would result inincreases in individual and national water footprints. The watercost of replacing marine protein with terrestrial protein canalternatively be viewed as a current water savings. These watersavings are realized by the producers of alternative terrestrialprotein sources rather than the consumers of marine protein.A country’s water savings can therefore either be realizedwithin the country itself (a lower internal water footprint) orthrough a lower water footprint of imported food (a lowerexternal water footprint). In this second case, the physicalwater savings are realized in the producing country (Hoekstraet al 2011). While only the internal water footprint is relevantto a country’s domestic water resources, increasing relianceon other countries’ water resources through trade may bepolitically undesirable or economically unfeasible Fader et al(2013), Seekell et al (2011) and is therefore relevant to acountry’s food security.
The low water footprint of marine fisheries andaquaculture makes marine protein a fundamental source ofprotein for a low water footprint diet, which is especiallyimportant for water stressed regions (Duarte et al 2009). Inaddition to providing water savings, fish are essential to thenutrition and food security of many impoverished countries(Kent 2003). For example, fish provide the highest per cent ofanimal calories and protein intake in Africa relative to otherregions of the world (Tacon and Metian 2009). Apart fromAfrican nations, many island nations and countries in Asiaand Oceania also rely on fish for much of their protein (FAO2013). Since many of these same regions are water stressed(WWAP 2012), water savings from marine fish consumptionmay be important to both domestic food and water supplies.
Continuing current water savings from marine fishconsumption depends on future human food preferences,human population growth, the future state of global fisheries,and the development of sustainable aquaculture. Since foodis inextricably linked to the water required to produce it, it isimportant to understand the tradeoffs between water resourcesand different food sources. Here, we translate marine proteinconsumption into a current ‘water savings’ by computing thewater costs of replacing marine protein with terrestrial proteinusing a water footprint framework.
2. Methods
Current water savings from marine protein consumption isexamined by calculating the water footprint (l/capita) ofreplacing marine protein with terrestrial protein in each coun-try. The water footprint of marine capture and marine aquacul-ture fisheries was taken to be zero, as the freshwater inputs tothese systems are considered to be negligible (Verdegem et al2006). Freshwater capture and freshwater aquaculture proteinconsumption was excluded from the analysis because fresh-water aquaculture requires freshwater inputs ranging fromvery low to very high values depending on the species andproduction system (Boyd et al 2007). As a result, there is not areliable estimate for the water footprint of freshwater protein
that could be used in this analysis. Approximately 35% of theaquatic protein comes from freshwater sources (FAO 2012),which means there are many areas where freshwater proteinis important and may provide water savings that unfortunatelycannot be included in this analysis, notably in the countriesbordering the African Rift Valley Lakes and in China.
To calculate the water savings from marine protein, thewater footprint of an average gram of terrestrial protein wascomputed for each country and multiplied by the grams ofmarine protein consumed in each country. The sources ofprotein that would be used to replace fish protein dependon economic development, urbanization, regional soil andclimate conditions, patterns of global food trade, and culturalnorms (York and Gossard 2004). While this makes substitutionsources for marine protein difficult to predict, reasonableestimates were derived from current food consumption pat-terns in each country. A range of estimates was generated bycomputing the water footprint of an average gram of proteinbased on all substitute sources and separately using onlyanimal protein sources.
Current consumption rates for marine protein and over60 potential substitute sources were obtained for the mostrecent data year (2009) from the Food and AgriculturalOrganization’s (FAO) food balance sheets (FAOSTAT 2013).The substitutes were grouped into the 15 food categories usedby Mekonnen and Hoekstra (2010). Sugar, oil, and buttercategories were removed due to the small protein contributionof these foods. The consumption rates for the remaining 12categories (table 1) were used to calculate the proportion oftotal protein derived from each category. Water footprints pergram of protein for each food category were obtained fromMekonnen and Hoekstra (2010).
The amount of water required to replace a gram of marineprotein varies based on the combination of terrestrial pro-tein substitutes (table 1). The water footprint for a gram ofterrestrial protein using all food categories is lower than thefootprint using only animal product categories for nearly allcountries. Water footprints for the two substitute groups in eachcountry were each multiplied by current fish protein consump-tion rates to give a range of daily per capita increase in waterfootprints when fish protein is replaced with terrestrial protein.These values were then compared to current water footprintsusing the WaterStat database (Mekonnen and Hoekstra 2011)to give per cent water footprint increases (table 2).
As an indicator of water availability, the United Nation’swater scarcity index was compared to each country’s totalrenewable water resources per capita (AQUASTAT, FAO2013). Total renewable resources here means total renewablesurface water plus the total renewable groundwater, minus theoverlap between the surface and groundwater, and this measurecorresponds to the annual theoretical maximum amount ofwater actually available to a country at a given moment(FAO 2013). This measurement of renewable water resourcesrepresents available blue water only. According to the UNindex, countries with annual water availabilities: less than1000 m3/capita are water scarce, less than 1700 m3/capitaare water stressed, less than 2500 m3/capita are water vul-nerable, and greater than 2500 m3/capita are water sufficient
2
Environ. Res. Lett. 9 (2014) 014005 J A Gephart et al
Table 1. Water footprints per gram of protein and the corresponding current protein consumption levels as a per cent of total protein intakefor the 12 food categories for the United States. The water footprint times the proportion of protein consumed yields a water footprintweighted by the consumption level. The sum of weighted water footprints yields the water footprint for 1 g of protein based on that group ofsubstitutes.
All substitutes Animal substitutes
Food Category WF (l/g)Per cent ofprotein (%)
Weighted WF(l/g protein)
Per cent ofprotein (%)
Weighted WF(l/g protein)
Vegetables 26 2.3 0.60 — —Starchy roots 31 2.2 0.68 — —Fruits 180 2.1 3.78 — —Cereals 21 21.6 4.54 — —Pulses 19 2.5 0.48 — —Nuts 139 2.1 2.92 — —Milk 31 28.4 8.80 42.2 13.08Eggs 29 3.7 1.07 5.4 1.57Chicken 34 15.7 5.34 23.4 7.96Pig 57 7.2 4.10 10.8 6.16Sheep and goat 63 0.2 0.13 0.3 0.19Bovine 112 12.0 13.44 17.9 20.05Substitute WF(l/g protein)
— — 45.88 — 49.00
Table 2. Current fish consumption levels multiplied by the calculated water footprints for the two groups of substitutes in five countriesgives the daily per capita water savings. Five countries are presented as examples. Comparing these values to current water footprints givesthe per cent increase. All subs means that all food sources were weighted to calculate the average water footprint for a gram of protein, whileanimal subs means that only animal food sources were used.
CountryFish Consumption(g protein/cap/day)
Substitute WF(l/g protein)
WF Increase(l/cap/day)
Current WF(l/cap/day)
Per centincrease
Solomon Islands 11.0 1978.7All subs 39.6 435.6 22.0Animal subs 70.0 770.0 38.9
Gambia 7.6 2428.1All subs 32.3 245.5 10.1Animal subs 47.6 361.8 14.9
Denmark 7.7 4475.2All subs 41.6 320.3 7.2Animal subs 45.7 351.9 7.9
United States 5.5 7782.2All subs 45.9 252.5 3.2Animal subs 49.0 269.5 3.5
Lesotho 0.2 4488.8All subs 26.0 5.2 0.1Animal subs 61.7 12.3 0.3
(WWAP 2012). This metric is used at the country level tocorrespond with the FAO food consumption data, and ittherefore does not account for water scarce regions withincountries. Additionally, the water availability index does notaccount for the seasonality of rain in some countries, wherewater scarcity may occur during part of the year even if annualprecipitation is sufficient.
Data on each country’s agricultural land was obtainedfrom FAOSTAT as an indicator for land availability and accessto green water. FAOSTAT defines agricultural land as thesum of land under temporary agricultural crops, temporarymeadows for mowing or pasture, land under market andkitchen gardens, land temporarily fallow, land under perma-nent cultivation, and permanent meadows and pastures. A landscarcity was considered where there was less than 0.1 ha/capita
based on the results of Cassidy et al (2013). While waterscarcity can be better evaluated by including measurementsof both blue and green water availability (Rockstromp et al2009), data on green water availability was not availablefor this study. So although agricultural land does not pro-vide a direct measurement of green water availability, whichrequires an assessment of factors including precipitation andsoil type, it does indicate a country’s ability to access greenwater through agricultural lands. In some countries, additionalgreen water can be accessed by converting natural ecosystemsinto agricultural land (Ridoutt and Pfister 2010), but thisland was not included in this analysis. Data on renewablewater resources and agricultural land together indicates whichcountries would likely be able to replace marine protein withterrestrial protein domestically. Since it cannot be predicted
3
Environ. Res. Lett. 9 (2014) 014005 J A Gephart et al
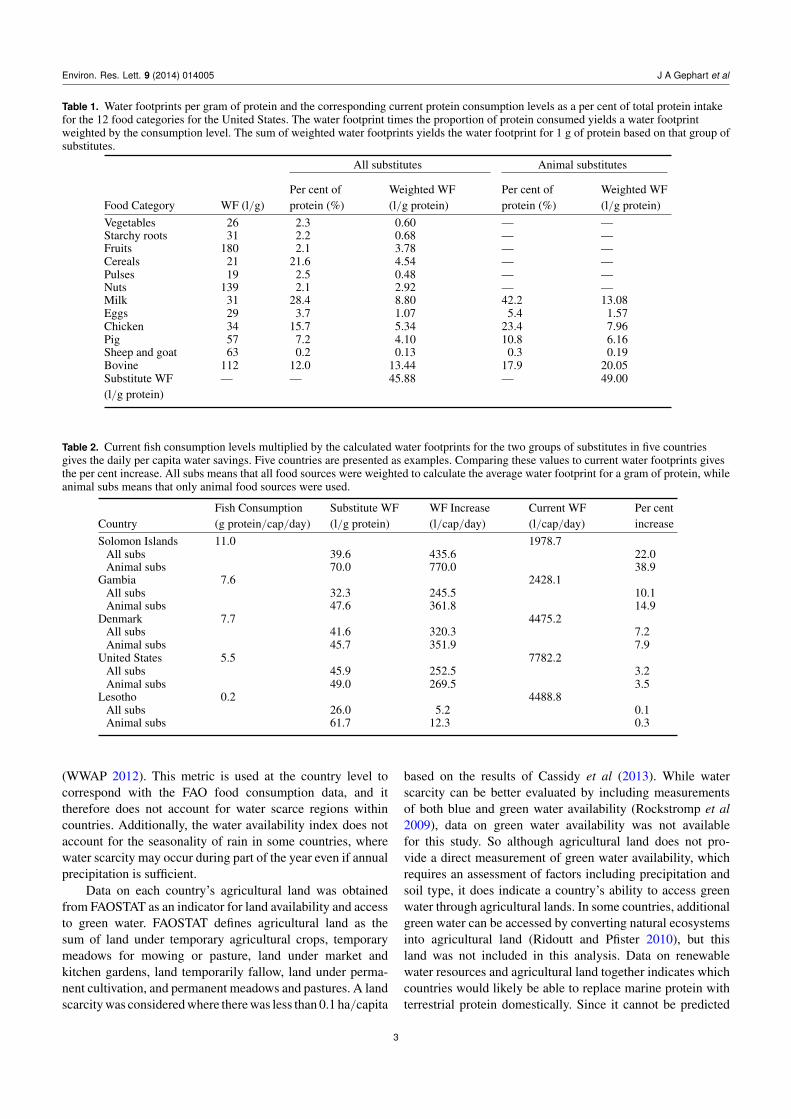
Figure 1. Bubble area is proportional to the per cent water savings from marine fish protein. Bubble color represents current water scarcitystatus, where red is scarce, orange is stressed, yellow is vulnerable, and green is sufficient, according to United Nations standards (greyindicates lack of data on renewable water resources).
from which countries a given country would import alternativeterrestrial protein, this analysis cannot speak to the impactsof replacing fish protein in a given country on the watersecurities of the countries from which it imports. It should berecognized though that a product with a large water footprint isnot necessarily environmentally damaging when it is producedin a region with little water stress (Ridoutt and Pfister 2010).We do note though that increasing reliance on food importsand increasing external water footprints may not be politicallyor economically feasible for some countries (Fader et al 2013,Seekell et al 2011). By considering these factors of renewablewater resources and agricultural land we assessed where fishprotein is most important to national food and water securities.
3. Results and discussion
Marine foods provide an essential low water footprint sourceof protein for much of the world, allowing for water savingsof 300–390 km3 yr−1 (4–5%) globally. While these valuesare small compared to the current water footprint of humanfood production (7600 km3 yr−1), such water savings maybecome increasingly important globally to feed a growingpopulation. Additionally, water savings from marine proteinmay already be important to the food and water security ofspecific countries, particularly economically disadvantagedand water scarce nations.
The contribution of marine protein to water savings ishighly uneven around the globe (figure 1). Per cent increasesreveal which countries experience the largest current watersavings from marine protein consumption relative to currentwater consumption. National per cent increases range from aminimum of a 0.04–0.06% increase in Mongolia to a maximumof a 42–50% increase in Maldives (figure 1). The importance ofwater savings from marine protein to food and water securityvaries greatly due to differences in reliance on marine fishprotein, the water footprints of substitute terrestrial protein,population size, and freshwater availability.
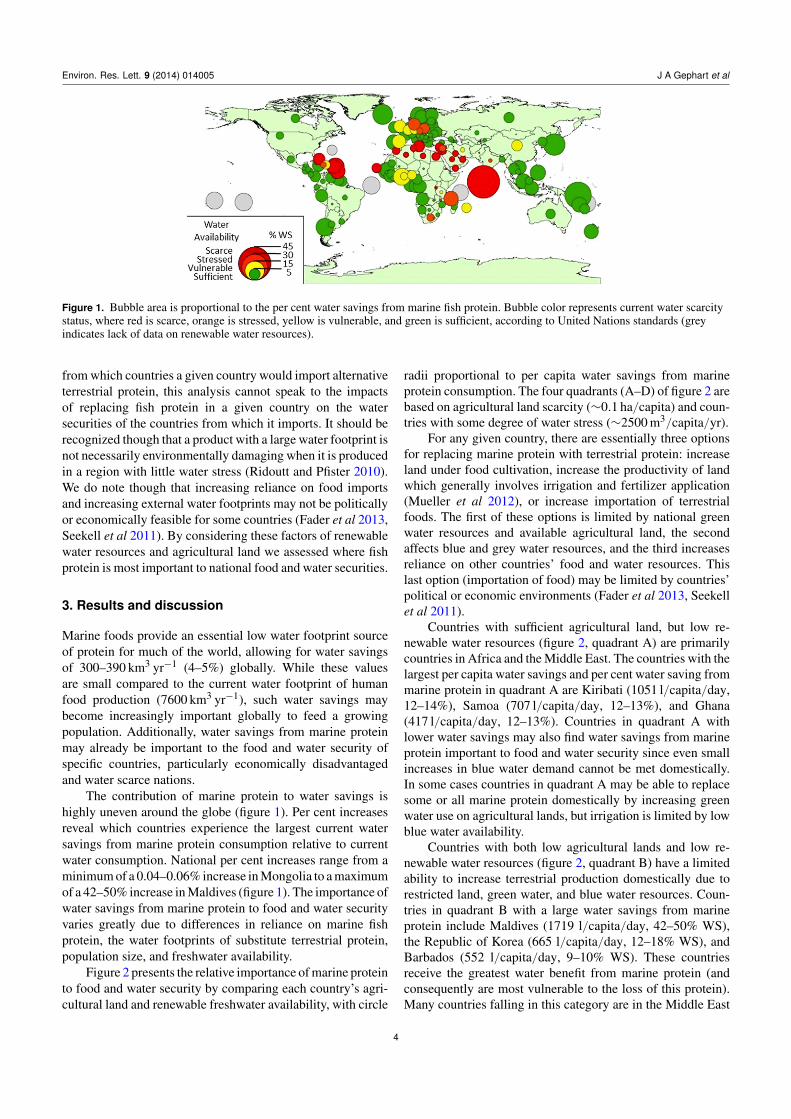
Figure 2 presents the relative importance of marine proteinto food and water security by comparing each country’s agri-cultural land and renewable freshwater availability, with circle
radii proportional to per capita water savings from marineprotein consumption. The four quadrants (A–D) of figure 2 arebased on agricultural land scarcity (∼0.1 ha/capita) and coun-tries with some degree of water stress (∼2500 m3/capita/yr).
For any given country, there are essentially three optionsfor replacing marine protein with terrestrial protein: increaseland under food cultivation, increase the productivity of landwhich generally involves irrigation and fertilizer application(Mueller et al 2012), or increase importation of terrestrialfoods. The first of these options is limited by national greenwater resources and available agricultural land, the secondaffects blue and grey water resources, and the third increasesreliance on other countries’ food and water resources. Thislast option (importation of food) may be limited by countries’political or economic environments (Fader et al 2013, Seekellet al 2011).
Countries with sufficient agricultural land, but low re-newable water resources (figure 2, quadrant A) are primarilycountries in Africa and the Middle East. The countries with thelargest per capita water savings and per cent water saving frommarine protein in quadrant A are Kiribati (1051 l/capita/day,12–14%), Samoa (707 l/capita/day, 12–13%), and Ghana(417 l/capita/day, 12–13%). Countries in quadrant A withlower water savings may also find water savings from marineprotein important to food and water security since even smallincreases in blue water demand cannot be met domestically.In some cases countries in quadrant A may be able to replacesome or all marine protein domestically by increasing greenwater use on agricultural lands, but irrigation is limited by lowblue water availability.
Countries with both low agricultural lands and low re-newable water resources (figure 2, quadrant B) have a limitedability to increase terrestrial production domestically due torestricted land, green water, and blue water resources. Coun-tries in quadrant B with a large water savings from marineprotein include Maldives (1719 l/capita/day, 42–50% WS),the Republic of Korea (665 l/capita/day, 12–18% WS), andBarbados (552 l/capita/day, 9–10% WS). These countriesreceive the greatest water benefit from marine protein (andconsequently are most vulnerable to the loss of this protein).Many countries falling in this category are in the Middle East
4
Environ. Res. Lett. 9 (2014) 014005 J A Gephart et al
Figure 2. The logarithm of annual renewable water resources was plotted against the logarithm of the total agricultural land for eachcountry. The vertical line at log(2500) distinguishes water sufficient from water scarce, while the horizontal line at log(0.1) distinguishessufficient agricultural land from insufficient agricultural land based on the estimated minimum agricultural land requirement estimated by(Cassidy et al 2013). The radius of each circle is proportional to the per capita water savings from marine protein consumption in eachcountry. Each country’s geographic region is indicated by the circle color.
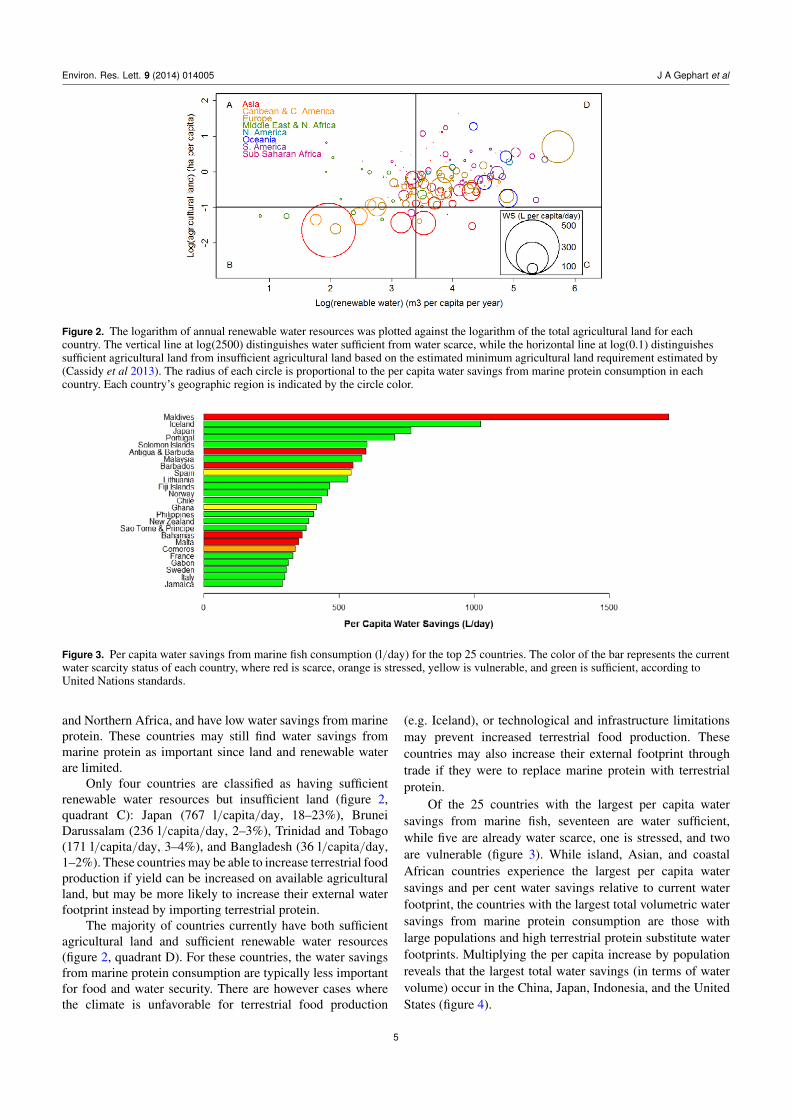
Figure 3. Per capita water savings from marine fish consumption (l/day) for the top 25 countries. The color of the bar represents the currentwater scarcity status of each country, where red is scarce, orange is stressed, yellow is vulnerable, and green is sufficient, according toUnited Nations standards.
and Northern Africa, and have low water savings from marineprotein. These countries may still find water savings frommarine protein as important since land and renewable waterare limited.
Only four countries are classified as having sufficientrenewable water resources but insufficient land (figure 2,quadrant C): Japan (767 l/capita/day, 18–23%), BruneiDarussalam (236 l/capita/day, 2–3%), Trinidad and Tobago(171 l/capita/day, 3–4%), and Bangladesh (36 l/capita/day,1–2%). These countries may be able to increase terrestrial foodproduction if yield can be increased on available agriculturalland, but may be more likely to increase their external waterfootprint instead by importing terrestrial protein.
The majority of countries currently have both sufficientagricultural land and sufficient renewable water resources(figure 2, quadrant D). For these countries, the water savingsfrom marine protein consumption are typically less importantfor food and water security. There are however cases wherethe climate is unfavorable for terrestrial food production
(e.g. Iceland), or technological and infrastructure limitationsmay prevent increased terrestrial food production. Thesecountries may also increase their external footprint throughtrade if they were to replace marine protein with terrestrialprotein.
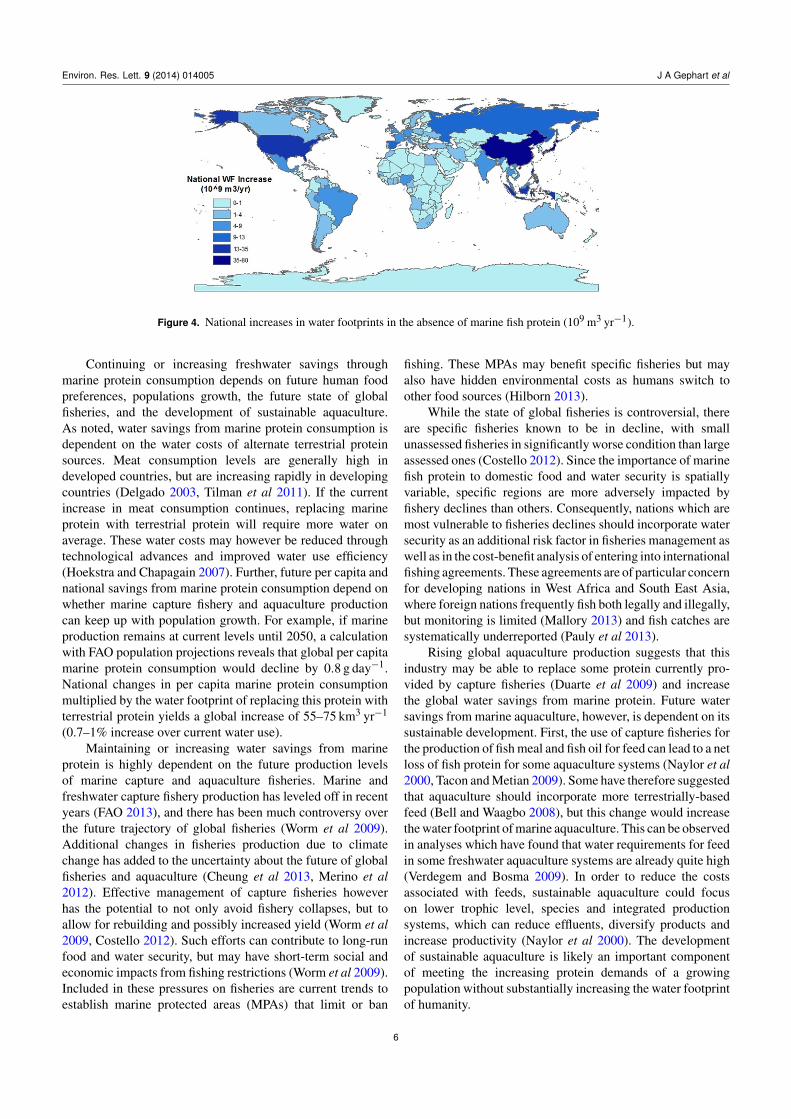
Of the 25 countries with the largest per capita watersavings from marine fish, seventeen are water sufficient,while five are already water scarce, one is stressed, and twoare vulnerable (figure 3). While island, Asian, and coastalAfrican countries experience the largest per capita watersavings and per cent water savings relative to current waterfootprint, the countries with the largest total volumetric watersavings from marine protein consumption are those withlarge populations and high terrestrial protein substitute waterfootprints. Multiplying the per capita increase by populationreveals that the largest total water savings (in terms of watervolume) occur in the China, Japan, Indonesia, and the UnitedStates (figure 4).
5
Environ. Res. Lett. 9 (2014) 014005 J A Gephart et al
Figure 4. National increases in water footprints in the absence of marine fish protein (109 m3 yr−1).
Continuing or increasing freshwater savings throughmarine protein consumption depends on future human foodpreferences, populations growth, the future state of globalfisheries, and the development of sustainable aquaculture.As noted, water savings from marine protein consumption isdependent on the water costs of alternate terrestrial proteinsources. Meat consumption levels are generally high indeveloped countries, but are increasing rapidly in developingcountries (Delgado 2003, Tilman et al 2011). If the currentincrease in meat consumption continues, replacing marineprotein with terrestrial protein will require more water onaverage. These water costs may however be reduced throughtechnological advances and improved water use efficiency(Hoekstra and Chapagain 2007). Further, future per capita andnational savings from marine protein consumption depend onwhether marine capture fishery and aquaculture productioncan keep up with population growth. For example, if marineproduction remains at current levels until 2050, a calculationwith FAO population projections reveals that global per capitamarine protein consumption would decline by 0.8 g day−1.National changes in per capita marine protein consumptionmultiplied by the water footprint of replacing this protein withterrestrial protein yields a global increase of 55–75 km3 yr−1
(0.7–1% increase over current water use).Maintaining or increasing water savings from marine
protein is highly dependent on the future production levelsof marine capture and aquaculture fisheries. Marine andfreshwater capture fishery production has leveled off in recentyears (FAO 2013), and there has been much controversy overthe future trajectory of global fisheries (Worm et al 2009).Additional changes in fisheries production due to climatechange has added to the uncertainty about the future of globalfisheries and aquaculture (Cheung et al 2013, Merino et al2012). Effective management of capture fisheries howeverhas the potential to not only avoid fishery collapses, but toallow for rebuilding and possibly increased yield (Worm et al2009, Costello 2012). Such efforts can contribute to long-runfood and water security, but may have short-term social andeconomic impacts from fishing restrictions (Worm et al 2009).Included in these pressures on fisheries are current trends toestablish marine protected areas (MPAs) that limit or ban
fishing. These MPAs may benefit specific fisheries but mayalso have hidden environmental costs as humans switch toother food sources (Hilborn 2013).
While the state of global fisheries is controversial, thereare specific fisheries known to be in decline, with smallunassessed fisheries in significantly worse condition than largeassessed ones (Costello 2012). Since the importance of marinefish protein to domestic food and water security is spatiallyvariable, specific regions are more adversely impacted byfishery declines than others. Consequently, nations which aremost vulnerable to fisheries declines should incorporate watersecurity as an additional risk factor in fisheries management aswell as in the cost-benefit analysis of entering into internationalfishing agreements. These agreements are of particular concernfor developing nations in West Africa and South East Asia,where foreign nations frequently fish both legally and illegally,but monitoring is limited (Mallory 2013) and fish catches aresystematically underreported (Pauly et al 2013).
Rising global aquaculture production suggests that thisindustry may be able to replace some protein currently pro-vided by capture fisheries (Duarte et al 2009) and increasethe global water savings from marine protein. Future watersavings from marine aquaculture, however, is dependent on itssustainable development. First, the use of capture fisheries forthe production of fish meal and fish oil for feed can lead to a netloss of fish protein for some aquaculture systems (Naylor et al2000, Tacon and Metian 2009). Some have therefore suggestedthat aquaculture should incorporate more terrestrially-basedfeed (Bell and Waagbo 2008), but this change would increasethe water footprint of marine aquaculture. This can be observedin analyses which have found that water requirements for feedin some freshwater aquaculture systems are already quite high(Verdegem and Bosma 2009). In order to reduce the costsassociated with feeds, sustainable aquaculture could focuson lower trophic level, species and integrated productionsystems, which can reduce effluents, diversify products andincrease productivity (Naylor et al 2000). The developmentof sustainable aquaculture is likely an important componentof meeting the increasing protein demands of a growingpopulation without substantially increasing the water footprintof humanity.
6
Environ. Res. Lett. 9 (2014) 014005 J A Gephart et al
It is important to note that when considering the costs ofreplacing fish protein with terrestrial protein, water resourcesare not the only constraints or environmental impacts toconsider. Changes in food production patterns have importantimplications for carbon, nitrogen, and phosphorus cycles aswell as land use. For example, the increased land requiredto produce terrestrial protein to replace fish protein hasbeen demonstrated to be substantial (13–63% increase) ina case study of the Mekong River basin (Orr et al 2012).Such impacts are also important to consider when evaluatingtradeoffs between marine capture and aquaculture fisheries.For example, while aquaculture production can result inhigh nutrient levels in surrounding waters (Islam 2005),capture fisheries are typically more energy intensive thanmany aquaculture systems (Costa-Pierce 2010). Additionally,in some cases there may be social, political and economicconstraints that would prevent marine protein from beingentirely replaced with terrestrial protein. In countries wherethere are not protein deficiencies, this may not be problematic,but in other countries, a decline in per capita fish protein wouldmean that more people would not be able to meet their proteinneeds. This would lead to higher rates of malnutrition, whileincreasing pressure on water resources, outcomes contrary tothe Millennium Development Goals (United Nations 2010).
4. Conclusion
Water and food resources are inextricably linked, and the waterresource implications of changes in fisheries practices musttherefore be considered. This study demonstrates the largefreshwater savings from marine fish consumption, particularlyin Asia, Oceania, and several coastal African nations. Thesesubstantial water savings should be accounted for in the consid-eration of fisheries management policies and in the promotionof sustainable aquaculture. Further, the unequal importance ofwater savings from marine fish should be integrated into futureinternational fishing agreements to protect the joint global foodand water security.
Acknowledgments
We are grateful to David Seekell, Kyle Davis, and JonathanWalter for helpful feedback. We also thank the reviewers for thethoughtful comments and suggestions that greatly improvedthis letter. This research was funded by the National ScienceFoundation Graduate Research Fellowship and the Universityof Virginia Department of Environmental Sciences.
References
Bell J G and Waagbo R 2008 Safe and nutritious aquacultureproduce: benefits and risks of alternative sustainable aquafeedsAquaculture in the Ecosystem ed M Holmer, K Black,C M Duarte, N Marba and I Karakassis (Berlin: Springer)pp 185–225
Boyd C E, Tucker C, McNevin A, Bostick K and Clay J 2007Indicators of resource use efficiency and environmentalperformance in fish and crustacean aquaculture Rev. Fish. Sci.15 336–60
Carr J A, D’Odorico P, Laio F and Ridolfi L 2012 Recent historyand geography of virtual water trade PLoS-One 8 e55825
Cassidy E S, West P C, Gerber J S and Foley J A 2013 Redefiningagricultural yields: from tonnes to people nourished per hectareEnviron. Res. Lett. 8 034015
Cheung W W L, Watson R and Pauly D 2013 Signature of oceanwarming in global fisheries catch Nature 497 365–8
Costa-Pierce B A 2010 Sustainable aquaculture systems: the needfor a new social contract for aquaculture development Mar.Technol. Soc. J. 44 88–112
Costello C, Ovando D, Hilbon R, Gaines S D, Deschenes O andLester S E 2012 Status and solutions for the world’s unassessedfisheries Science 338 517–20
Delgado C L 2003 Rising consumption of meat and milk indeveloping countries has created a new food revolution Am. Soc.Nutr. Sci. 133 3907S–10S
Duarte C, Holmer M, Olsen Y, Soto D, Marba N, Guiu J, Black Kand Karakassis I 2009 Will the oceans help feed humanity?BioScience 59 967–76
Fader M, Gerten D, Krause M, Lucht W and Cramer W 2013Spatial decoupling of agricultural production and consumption:quantifying dependences of countries on food imports due todomestic land and water constraints Environ. Res. Lett. 8 014046
FAO (Food and Agriculture Organization (FAO)) 2012 The State ofWorld Fisheries and Aquaculture (Rome: FAO)
FAO 2013 AQUASTAT database, Food and AgricultureOrganization of the United Nations (Rome: FAO) accessed (14January 2013)
FAOSTAT (Food and Agriculture Organization of the UnitedNations) 2013 Commodity Balances, Crops, Primary Equivalent(Dataset) (Rome: FAO) (latest update: 02 May 2012), accessed (2January 2013) http://ref.data.fao.org/ac2f9731-8464-4589-89fd-7e8242009929
Hilborn R 2013 Environmental cost of conservation victories Proc.Natl Acad. Sci. 110 9187
Hoekstra A Y 2003 Virtual water: An introduction Virtual WaterTrade: Proceedings of the International Expert Meeting onVirtual Water Trade (Delft: IHE-Delft)
Hoekstra A Y and Chapagain A K 2007 Water footprints of nations:water use by people as a function of their consumption patternWater Resour. Manag. 21 35–48
Hoekstra A Y, Chapagain A K, Alday M M and Mekonnen M M2011 The Water Footprint Assessment Manual: Setting the GlobalStandard (London: Earthscan)
Islam S 2005 Nitrogen and phosphorus budget in coastal and marinecage aquaculture and impacts of effluent loading on ecosystem:review and analysis towards model development Mar. Pollut.Bull. 50 48–61
Kent G 2003 Fish trade, food security and the human right toadequate food Report of the FAO Expert Consultation on Int. FishTrade and Food Security (Casablanca, Jan. 2003) FAO FisheriesReport No. 708 (Rome: FAO) pp 49–70
Mallory T G 2013 China’s distant water fishing industry: evolvingpolicies and implications Mar. Policy 38 99–108
Mekonnen M M and Hoekstra A Y 2010 The green, blue and greywater footprint of farm animals and animal products Value ofWater Research Report Series No. 48 (Delft: UNESCO-IHE)
Mekonnen M M and Hoekstra A Y 2011 National water footprintaccounts: the green, blue and grey water footprint of productionand consumption Value of Water Research Report Series No. 50(Delft: UNESCO-IHE)
Merino G et al 2012 Can marine fisheries and aquaculture meet fishdemand from a growing human population and changingclimate? Glob. Environ. Change 22 795–806
7
Environ. Res. Lett. 9 (2014) 014005 J A Gephart et al
Mueller N D, Gerber J S, Johnston M, Ray D K, Ramankutty N andFoley J A 2012 Closing yield gaps through nutrient and watermanagement Nature 490 254–7
Naylor R L, Goldburg R J, Primavera J H, Kautsky N,Beveridge M C M, Clay J, Folke C, Lubchenco J, Mooney H andTroell M 2000 Effect of aquaculture on world fish suppliesNature 405 1017–24
Orr S, Pittock J, Chapagain A and Dumaresq D 2012 Dams on theMekong River: lost fish protein and the implications for land andwater resources Glob. Environ. Change 22 925–32
Pauly D et al 2013 China’s distant-water fisheries in the 21st centuryFish Fish. doi:10.111/faf.12032
Ridoutt B G and Pfister S 2010 A revised approach to waterfootprinting to make transparent the impacts of consumption andproduction on global freshwater scarcity Glob. Environ. Change20 113–20
Rockstromp J, Falkenmark M, Karlberg L, Hoff H, Rost S andGerten D 2009 Future water availability for global foodproduction: The potential of green water for increasing resilienceto global change Water Resour. Res. 45 W00A12
Seekell D A, D’Odorico P and Pace M L 2011 Virtual watertransfers unlikely to redress inequality in global water useEnviron. Res. Lett. 6 024017
Tacon A and Metian M 2009 Fishing for feed or fishing for food:Increasing global competition for small pelagic forage fish Ambio38 294–302
Tilman D, Balzer C, Hill J and Befort B L 2011 Global food demandand the sustainable intensification of agriculture Proc. Natl Acad.Sci. USA 108 20260–4
UNEP (United Nations Environment Programme) 2012 21 issuesfor the 21st century Results of the UNEP Foresight Process onEmerging Environmental Issues (Nairobi: UNEP)
United Nations 2010 The Millennium Development Goals Report(New York, NY)
Verdegem M C J and Bosma R H 2009 Water withdrawal forbrackish and inland aquaculture, and options to produce morefish in ponds with present water use Water Policy 11 52–68
Verdegem M C J, Bosma R H and Verreth J A J 2006 Reducingwater use for animal production through aquaculture Int. J. WaterResour. Dev. 22
Worm B et al 2009 Rebuilding global fisheries Science 325 578–85WWAP (World Water Assessment Programme) 2012 The United
Nations World Water Development Report 4: Managing Waterunder Uncertainty and Risk (Paris: UNESCO)
York R and Gossard M H 2004 Cross-national meat and fishconsumption: exploring the effects of modernization andecological context Ecol. Econom. 48 293–302
8