freight transport for development:...
TRANSCRIPT
i
Pilar Londoño-Kent
FREIGHT TRANSPORT FOR DEVELOPMENT TOOLKIT:
Road Freight
Pub
lic D
iscl
osur
e A
utho
rized
Pub
lic D
iscl
osur
e A
utho
rized
Pub
lic D
iscl
osur
e A
utho
rized
Pub
lic D
iscl
osur
e A
utho
rized
Pub
lic D
iscl
osur
e A
utho
rized
Pub
lic D
iscl
osur
e A
utho
rized
Pub
lic D
iscl
osur
e A
utho
rized
Pub
lic D
iscl
osur
e A
utho
rized
The Transport Research Support program is a joint World Bank/ DFID initiative focusing on emerging issues in the transport sector. Its goal is to generate knowledge in high priority areas of the transport sector and to disseminate to practitioners and decision-makers in developing countries.
Where is the Economy Going? Follow that Truck!
The Road Freight Industry in Low and Middle Income Countries
©2009 The International Bank for Reconstruction and Development / The World Bank 1818 H Street NW Washington DC 20433 Telephone: 202-473-1000 Internet: www.worldbank.org E-mail: [email protected] All rights reserved This volume is a product of the staff of the International Bank for Reconstruction and Development / The World Bank. The findings, interpretations, and conclusions expressed in this volume do not necessarily reflect the views of the Executive Directors of The World Bank or the governments they represent. The World Bank does not guarantee the accuracy of the data included in this work. The boundaries, colors, denominations, and other information shown on any map in this work do not imply any judgment on the part of The World Bank concerning the legal status of any territory or the endorsement or acceptance of such boundaries.
Rights and Permissions The material in this publication is copyrighted. Copying and/or transmitting portions or all of this work without permission may be a violation of applicable law. The International Bank for Reconstruction and Development / The World Bank encourages dissemination of its work and will normally grant permission to reproduce portions of the work promptly. For permission to photocopy or reprint any part of this work, please send a request with complete information to the Copyright Clearance Center Inc., 222 Rosewood Drive, Danvers, MA 01923, USA; telephone: 978-750-8400; fax: 978-750-4470; Internet: www.copyright.com. All other queries on rights and licenses, including subsidiary rights, should be addressed to the Office of the Publisher, The World Bank, 1818 H Street NW, Washington, DC 20433, USA; fax: 202-522-2422; e-mail: [email protected].
CONTENTS
ACKNOWLEDGEMENTS ............................................................................................................................ 1 EXECUTIVE SUMMARY ............................................................................................................................. 2 1 INTRODUCTION .................................................................................................................................. 4 2 INDUSTRY STRUCTURE AND ISSUES AFFECTING EFFICIENCY ............................................................... 5
2.1 MARKET STRUCTURE ..................................................................................................................................... 5 2.1.1 Industry Operators .......................................................................................................................... 6 2.1.2 Representational Arrangements ..................................................................................................... 6 2.1.3 Types of traffic and Types of Cargo ................................................................................................ 6 2.1.4 Various Types of Transport ............................................................................................................. 7
2.2 TRANSPORT USER ISSUES ................................................................................................................................ 7 2.2.1 Level of Service................................................................................................................................ 7 2.2.2 Technology ...................................................................................................................................... 8 2.2.3 Road versus Rail .............................................................................................................................. 8 2.2.4 External Issues ................................................................................................................................ 9 2.2.5 Safety .............................................................................................................................................. 9 2.2.6 Environment.................................................................................................................................... 9 2.2.7 HIV-AIDS.......................................................................................................................................... 9
3 COMPETITIVENESS AND ROAD FREIGHT TRANSPORT ....................................................................... 11 3.1 TRANSPORT LOGISTICS ................................................................................................................................. 11 3.2 LOGISTIC COSTS AND GROSS DOMESTIC PRODUCT ............................................................................................. 13 3.3 LOGISTICS IN THE CURRENT ECONOMIC CRISIS .................................................................................................. 13 3.4 TRANSPORT COMPETITIVENESS ...................................................................................................................... 13 3.5 SERVICES THAT IMPROVE TRANSPORT ............................................................................................................. 15
3.5.1 Door to Door Services ................................................................................................................... 15 3.5.2 Third Party Logistics (3PL) ............................................................................................................. 15 3.5.3 Truck Turn Time ............................................................................................................................ 15
4 INDUSTRY STRUCTURE IN LOW AND MIDDLE-INCOME COUNTRIES .................................................. 17 4.1 MARKET STRUCTURE ................................................................................................................................... 19 4.2 INDUSTRY CONCENTRATION .......................................................................................................................... 20 4.3 REGULATORY ENVIRONMENT ......................................................................................................................... 20 4.4 COMPETITION AND BEHAVIOR ....................................................................................................................... 20 4.5 OVERLOADING ............................................................................................................................................ 21 4.6 TECHNOLOGICAL CHANGES ........................................................................................................................... 22 4.7 EXTERNALITIES ............................................................................................................................................ 22
5 INDUSTRY PERFORMANCE IN LOW AND MIDDLE-INCOME COUNTRIES ............................................ 23 5.1 NUMBER OF TRUCKS .................................................................................................................................... 23 5.2 FREIGHT VEHICLE EFFICIENCY......................................................................................................................... 24 5.3 EMPLOYMENT ............................................................................................................................................ 25 5.4 FINANCIAL PERFORMANCE ............................................................................................................................ 25
5.4.1 Freight Tariffs per Ton Kilometer .................................................................................................. 26 5.5 TRUCK FREIGHT INDICATORS ......................................................................................................................... 26
5.5.1 Trip Length Distribution ................................................................................................................ 26 5.6 DEMYSTIFICATION OF TRUCK FREIGHT COSTS .................................................................................................... 28 5.7 CHANGE FACTORS IN ROAD FREIGHT BEHAVIOR AND TRUCK PROJECTIONS ............................................................. 29
6 KEY FINDING, EMERGING TRENDS, AND DIRECTIONS FOR FUTURE RESEARCH ................................. 31 6.1 KEY FINDINGS AND EMERGING TRENDS ........................................................................................................... 31 6.2 DIRECTIONS FOR FURTHER RESEARCH .............................................................................................................. 34

7 BIBLIOGRAPHY ................................................................................................................................. 35
1
ACKNOWLEDGEMENTS
The “Freight Transport for Development: Road Transport” has been prepared for the World Bank Transport Anchor group (ETWTR) in Washington which administers and manages the Transport Research Support Program, a financing of DFID, the Department for International Development of the United Kingdom Government.
The paper is a sub-sector contribution to a major World Bank Flagship publication focusing on the contribution of freight transport as a whole to economic and social development.
We would like to express our thanks to Pilar Londoño-Kent who was contracted to provide the framework and the technical content. Peter O’Neill, Adviser, ETWTR, provided guidance and advice throughout the preparation of the study. John Hine, World Bank Senior Transport Specialist, provided additional expertise and review. Jacqueline Dubow, ETWTR coordinator, managed the overall production.
.
Freight transport for development toolkit – road transport
2
EXECUTIVE SUMMARY
The developmental purpose of trade is to create wealth, reduce poverty, and sustain growth. All modes of transportation are important to this purpose, but road freight transport has the most direct impact on poverty as it employs millions of people and generates a significant portion of GDP, especially in low and middle-income countries. Trucking in fact is the primary form of transportation for domestic, trans-border, and international cargo, representing over 70 percent of the freight bill and even more of cargo value. In a globalized economy, road freight transport is now vital to production, distribution, and mobilization, driving economic, social, and environmental progress. In short, trucking is the backbone of economies around the world.
In the past 20 years, the industry has advanced as technology has improved communication, management, productivity, including vehicle efficiency. The economic environment has also changed. More and more low and middle-income countries are pursuing bilateral and multilateral free trade agreementswith each other and with high-income countries. Their objective in doing so is to expand markets, generate wealth on the basis of efficient specialization, introduce competition, and lower costs for production, distribution, services, and research and development.
When road freight transport services are efficient, they support these objectives; when they are not they act as nontariff barriers to trade—creating delays, raising costs, worsening congestion and pollution. Such barriers prolong and destabilize delivery schedules, hinder “just in time” inventory management and industrial processes, and impede the efficient combination of factors of production. Recent research suggests that better transportation logistics can reduce trade costs and times substantially, boost trade, and improve general welfare. In identifying the cost impact of inefficient border crossing procedures for U.S.-Mexican trade transported by truck, Fox, Francois, and Londoño-Kent (2004) show that better procedures would ultimately result in a welfare increase of US$1.8 billion for Mexico, a US$1.4 billion for the United States, and a nearly 10 percent increase in trade between the two countries.
Some low and middle-income countries have introduced regulatory reforms to raise their road freight industries to international standards, but implementing reforms presents serious challenges at local and national levels. Advocating and achieving reform requires understanding how the industry works, including the logistics services essential to efficiency, and a clear understanding of problems, many of them rooted in market behavior driven by powerful interests that distort economic forces supply and demand.
This paper provide an overview of the road freight transport industry in low and middle-income countries, synthesizes information gathered in earlier case studies while introducing new regional comparisons of Latin America and Africa.1 It identifies industry trends and issues, emphasizing how the market behaves, how it is regulated, and how the regulatory environment induces competitiveness or leads to and protects cartels and monopolies. A conceptual framework is presented for understanding the structure of the trucking industry from the standpoint of economic efficiency and for understanding how institutional barriers impede market efficiency. The specific objectives are to:
Determine if inefficiencies in road freight industry services (reliability, predictability, certainty of services) are substantial in low and middle-income countries, and, if so
1 Those studies were intended to be the “building blocks” for the World Bank Flagship report on Freight Transport for Development.
Freight transport for development toolkit – road transport
3
Define and analyze factors that explain the difference between an efficient industry where the market reflects an optimal balance of supply and demand and the actual circumstances in the sub-regions.
To achieve these objectives data, provided in studies conducted for client countries of the World Bank, comparing issues and trends in the road freight transport industries of low and middle-income countries are analyzed to:
Describe market structures and explain how changes in regulation affect performance Identify, define, and analyze good and bad transportation practices Examine the competitive nature of road freight transport Examine the role of the industry in logistics services and global supply chains; and Speculate on where the industry may be heading in the next ten years.
A lack of consistent methodology in earlier studies and paucity of accurate and current data presented some challenges for the study. In addition, reliable, up-to-date information on the sector would aid attempts to raise productivity and service quality, and would enhance policy reform in areas such as operator accreditation, access to markets, credit, and performance-based standards. Updated and reliable data would also do much to further the understanding of the freight logistics industry and the role of trucking services.
Chapter 2 presents the market structure of the road freight industry, describing aspects of that structure from the perspective of economic efficiency. Chapter 3 describes how problems in transport logistics and trade facilitation affect the competitiveness of the road freight transport industry. Chapter 4 presents the market structure of the industry in practice, summarizing earlier work that focused on selected low and middle-income countries and presenting findings on how geography, socioeconomic factors, regulatory environments, and legal frameworks affect market structure and competitive behavior. Chapter 5 summarizes industry performance in low and middle-income countries, and Chapter 6 synthesizes findings, summarizing emerging trends and speculating on where the industry may be headed in the next ten years. It also suggests directions for future research.
Freight transport for development toolkit – road transport
4
1 INTRODUCTION
Road freight transport, or trucking, is essential to modern economies, occupying a unique socioeconomic position linking supply to demand and linking many industrial sectors. As the mode of transport that brings most goods to their final destination, it is indispensable to tourism, trade, and the well-being of any economy, and is a primary indicator of economic health—generating a significant portion of GDP, employing millions of people, and offering the primary means for moving domestic, trans-border, and international cargo. Road transport represents more than 70 percent of the land freight service at origin and destination points, connecting businesses to world markets. Road transport is the backbone of the real economy, but its future health depends on providing better, not simply more transport.
The industry is comprised of carriers that transport commodities for shippers using a commercial motor vehicle. Demand is driven by consumer spending and manufacturing output. The profitability of individual companies depends on efficient operations. Large companies have advantages in account relationships, bulk fuel purchasing, fleet size, and access to drivers. Small operations can compete by providing quick turnaround, serving a local market, or transporting unusually sized goods.
Trucking competes with other forms of cargo transportation, including rail, air, and water. However, the shift toward intermodal transportation means that these modes of delivery are often more complementary than competitive.

Freight transport for development toolkit – road transport
5
2 INDUSTRY STRUCTURE AND ISSUES AFFECTING EFFICIENCY
An ideal transportation system is efficient, solid, and financially stable. To help achieve this ideal, regulatory policies governing competing carriers must be neutral. No regulatory agency should provide an unfair advantage to a carrier or an industry through special promotion, user charges, subsidies, taxes, or economic regulation. But achieving neutral regulation is easier said than done. Kneafsey (1974, 15) says that the crucial question of public policy in transportation is “If government regulations were relaxed, to what extent [would] competition [be] workable?” To answer the question—how “workable” is competition in the road freight transport industry—we examined the structure of the industry from the standpoint of economic efficiency, and the barriers to achieving efficiency in some low and middle-income countries.
2.1 MARKET STRUCTURE
The structure of the freight transport industry is complex (Figure 2-1). Like any industry, it has a supply side and a demand side. On the demand side are consigners, predominantly industries, which generate demand for road freight transport services. On the supply side are in-house providers and independent providers, some of whom subcontract with other independent providers.
Figure 2-1: Road freight Industry market Structure
Consigners (Consumers and Manufactures)
Demand
Supply
In house Outsourcing
Ancillary operators Hire and reward operators
_______________________________________________
Independent operator Freight forwarder
___________________________ _______________________
Owner-driver Fleet owner National Local
_____________________________ ________________________
Short-haul Long-haul Multi-modal: Single- mode:
air, sea, road, rail road
Road transport
General and specialist freight sub-contractors
____________________________________________________________
Direct service Tow operator Painted Independent Specialist Own
subcontractor subcontractor subcontractor vehicles
Freight transport for development toolkit – road transport
6
2.1.1 Industry Operators Service providers are ancillary providers, independent freight forwarders, or hire-and-reward operators. Ancillary providers carry freight in vehicles owned by a firm and are employees of the firm. Freight operations are subsidiary to the main function of the firm. In contrast, freight forwarders consolidate freight, often from various consignors. After receiving orders, forwarders can consolidate consignments of various densities to achieve an optimum load in terms of maximum legal weight and available capacity. Forwarders may provide national service or concentrate on moving goods on specific routes. Most are not restricted to one transport mode. A forwarder may operate an independently owned fleet with employee drivers, or, as is more common, have hire-and-reward subcontractors provide services on his behalf.
Hire-and-reward drivers carry freight for another firm—either customers or freight forwarders—on a contractual basis. Drivers contracted by a freight forwarder to complete a line haul are either:
(1) tow operators who supply a prime mover and tow a trailer from terminal to terminal;
(2) painted subcontractors whose equipment bears the name of the forwarder and are employed on a semi-permanent basis;
(3) independent subcontractors employed on an itinerant basis; and
(4) specialist subcontractors who supply specialized equipment for carrying particular commodities such as cement, sand, or beer.
Independent operators are either owner-drivers or fleet-owners. Owner-drivers either own and operate one vehicle or operate one vehicle and employ others to drive other owned vehicles. Fleet owners employ drivers while handling managerial functions directly. The current economic crisis has tended to hit smaller operators (owner-drivers) hardest.
The precise number of operators of each type is not known, and many estimates are conflicting because of problems with definitions, changes over time with movements in and out of the industry, internal changes, and generally poor statistical coverage of the industry. The number of medium and small freight forwarders is especially unclear, and smaller firms tend to be highly specialized. Freight forwarders associations are a good source of information.
2.1.2 Representational Arrangements The industry’s representational arrangements reflect its composition: employers (prime contractors), employees, and owner-drivers. Employers’ interests are represented by numerous prime contractor associations (road transport federations or associations) that operate locally or nationally. These associations usually represent members on the basis of type of operation (e.g., truck, taxi) or by geographical areas at the state or national level. Employees are often represented by a transporter workers’ union. Other unions that have a significant impact on the industry represent store-men and packers, but the drivers’ unions have greater influence. Owner-drivers, to the extent they join any organization, are represented by associations at regional or state levels.
2.1.3 Types of traffic and Types of Cargo The road freight industry serves different four types of traffic: (1) short distance, (2) long distance, (3) national, and (4) international. Operators should be able to serve all types of traffic but tend to be specialized. International traffic is more regulated than national traffic and requires larger vehicles that can carry much more cargo.

Freight transport for development toolkit – road transport
7
Traffic can also be divided by type of cargo supply—complete or partial. Complete cargo means that a shipper fills at least one entire truck to be run on a route to be determined; partial cargo means that the shipper does not fill the cargo capacity so the operator consolidates cargo from different shippers and follows scheduled, predetermined routes.
Three types of cargo—general, specialized, and containers—establish the varieties of traffic:
National long-distance dry cargo o Complete cargo point to point o Partial cargo (express services)
National long distance special products (refrigerated, etc.) International long-distance dry cargo International long-distance special products Short distance with complete down-load cargo along the journey (generally associated with
agro-industry and containers)
2.1.4 Various Types of Transport The following definitions of types of transport clarify the concept of multimodal transportation: 2
Unimodal. If goods are transported by one mode of transport and one carrier that carrier issues the transport document (e.g., bill of lading, air waybill, and consignment note). If there is more than one carrier—for example, carriage from one port via another port to a third port with transshipment at an intermediate port—one may issue a "through bill of lading" covering the entire transport. Depending on the back clauses of this through bill, the issuer may be responsible for the entire port-to-port transport or for only the part that takes place on his vessel.
Intermodal. The goods are transported by several modes from one point or port of origin via one or more interface points to a final port or point where one carrier organizes the whole transport. Depending on how the responsibility for the entire transport is shared, different types of transport documents are issued.
Segmented. If the carrier that organizes the transport only takes responsibility for the portion he is performing himself, he may issue an intermodal bill of lading.
Multimodal. If the carrier that organizes the transport takes the responsibility for the entire transport, he issues a multimodal transport document.
Combined. If the transport of goods is n one and the same loading unit or vehicle by a combination of road, rail and inland waterway modes.
2.2 TRANSPORT USER ISSUES
2.2.1 Level of Service The main qualitative attributes of a freight service are (1) transit time, (2) reliability of meeting expected times, (3) likelihood of loss, damage and theft, (4) availability of capacity, and (5) convenience of departure times and frequency of service. Their relative importance will vary from shipper to shipper depending on the
2 Trade and Transport Facilitation, review of current issues and operational experience, a Joint World Bank, UNCTAD Publication, June 1996.
Freight transport for development toolkit – road transport
8
type of commodity being shipped, its manner of shipment (e.g., refrigerated cargo space, in bulk, in container loads, less than container loads, or in small packages), and the frequency of shipment. In addition to freight charges, these attributes strongly influence the choices transport users make in deciding on a mode of transport. Better or greater levels of service usually command a premium freight rate.
On the basis of a priori reasoning, a literature review, discussions with rail marketing personnel, the results of a pilot study by the Australian Road Freight Industry (1983), and the U.S.-Mexican trucking case study (Londoño-Kent, 2006), we conclude that surveys to review market services in the industry should assess the following attributes:
Door-to-door transit time Reliability of meeting arrival time at destination Availability of capacity when required Frequency of service Freight rates (prices) Avoidance of damage or deterioration Avoidance of loss or theft Convenience of time of departure Communication with respect to problems.
For shippers of manufactured goods, freight rates and the reliability of meeting arrival times at destination in general are the most significant attributes. Avoidance of damage or deterioration, communication with respect to problems, and frequency of service are also important, but to a lesser extent than freight rate and reliability. For some shippers, service factors might outweigh price factors. Freight forwarders usually rank avoidance of loss or theft first, followed by the freight rate and availability of capacity when required.
2.2.2 Technology Technology employed by the road freight transport industry is changing rapidly. Over the past decade, the trend toward larger trucks has continued, reducing demand for labor and fuel per ton-kilometers performed. Competition within the industry should ensure that the benefits of technological developments are passed onto users. Technological improvements can benefit the operator and ultimately the user of the service by raising the general quality of service, lowering the costs of providing the service, and/or improving the service offering. Technology-driven improvements that speed the line-haul segment or make handling and pick-up and delivery services more efficient could improve the reliability factor so highly ranked by shippers.
The proliferation of information communication technology (ICT) and e-commerce since the 1990s—in the form of mobile phones, faxes, computers, the internet, and global positioning systems or satellite navigation—has helped the industry improve customer service, trace products, reduce empty loading, meet delivery times, and reduce processing errors and administrative costs. Small operators, however, are hard put to find a business case for adopting these technologies when associated costs are high and skill sets are new and demanding. They are particularly slow to adopt internet technology and cannot set themselves up for e-commerce, particularly the expensive and cumbersome electronic data interchange (EDI).
2.2.3 Road versus Rail A wide range of shippers favor the road shipping industry over rail in terms of service factors, as is reflected in the fact that road transport provision charges more than rail for a comparable journey, and road has a dominant share of the commodity market even though it offers no advantage in freight rates. Less well known
Freight transport for development toolkit – road transport
9
is the sensitivity of road/rail shares in various markets and submarkets to changes in level of service provided by either mode, and hence the uncertainty as to the likely returns from upgrading the level of service.
2.2.4 External Issues More attention is now being paid to externalities associated with the road freight transport industry. Safety, congestion, ambient air and noise pollution, greenhouse gas emissions, and cost recovery for road damage caused by heavy vehicles are issues likely to become more and more important over time. So far, reforms for correcting externalities associated with trucking have concentrated largely on road damage and safety.
2.2.5 Safety Safety of roads and trucks is a central concern of regulators as well as truck drivers and owners, shippers, other motorists, roadside property owners, and the general community. Factors contributing to truck accidents include number of hours drivers spend at the wheel per week, driver fatigue, and driver attitude toward regulations governing speed and overtaking. Vehicle defects also contribute to accidents. Studies in Australia and elsewhere have shown that a significant portion of heavy haulage vehicles are found to be defective during inspections. The most common defects are in vehicle lighting systems, and the most common major and extremely dangerous defects are in braking systems, tires, and steering systems. Road conditions, overloading, and poor loading also influence safety. In many case studies we reviewed, overloading appeared to be serious problem in low and middle-income countries.
2.2.6 Environment Environmental effects can be broadly grouped under the headings of emissions, noise, etc. Emissions include lead compounds, oxides of nitrogen, carbon monoxide, hydrocarbons, smoke, and odors. Petrol-driven vehicles contribute the greatest proportion to all emissions except smoke and odor, which are caused predominantly by diesel-driven vehicles as well as by causes not originating in vehicles. Exhaust smoke, particularly from diesel vehicles, contains carcinogenic compounds. Smoke and particulate emissions for diesel trucks may be 10 times those for a passenger car and possibly more if operating with heavy loads or if the engine is poorly maintained.
2.2.7 HIV-AIDS
Ease of travel along major routes is important to socioeconomic well-being but it is also associated with HIV/AIDS transmission. Those who work and live along the routes are at elevated risk for HIV, because they often travel for long periods without returning home, and may engage in risky sexual behavior. But major corridors also offer the opportunity to disseminate disease prevention messages across boundaries. Anti-HIV/AIDS campaigns must cut across national boundaries and target specific groups without being restricted by political divisions. The main target groups include truck drivers and managers of transport companies, users of transport services, the local population having contact with truck drivers, commercial sex workers (CSW) at border crossings, and locally-based government employees, including police, immigration and customs. In Zimbabwe, the National Council of the Transport Operating Industry and the National Railways of Zimbabwe have together implemented programs, funded by USAID, promoting behavior change along major transport routes. Training programs were set up as early as 1992 for truck drivers, drivers’ associates, bar attendants,
…mobility presents opportunities for improved connections between people. This can lead to benefits, as it enables opportunities for development and enlarges people’s choices. However, it can also lead to threats, as it makes some people more vulnerable to HIV than they were before these connections were possible. —Dr. Lee Nah Hsu, Manager UNDP South East Asia HIV and Development Project
Freight transport for development toolkit – road transport
10
waitresses, CSW, customs, and police officers. In addition, a number of peer educators were trained to facilitate continued dissemination and sustainability of the program (World Bank 2000).
Tanzania initiated programs targeting truck drivers and transport employees as early as 1989. The programs were based on training, educational materials, and condom distribution. Peer education, as well as involvement of the transport companies, provided a high level of sustainability (World Bank 2000).
In 1998, Burkina Faso started targeting truck drivers, sex workers and seasonal migrants, and developed groups of peer educators who disseminated the information further.
Freight transport for development toolkit – road transport
11
3 COMPETITIVENESS AND ROAD FREIGHT TRANSPORT
Demand for road freight transport services is driven by consumer spending and manufacturing output. The profitability of individual transportation firms depends on efficient operations. Trucking competes with other modes of land transportation, including rail, water, and air, but the shift to intermodal transportation means that these forms of transportation often complement each other as well. In this section, we discuss factors that affect the competitiveness of the industry, including trade logistics and intermodal transportation, and how the industry itself is a factor in general competitiveness.
3.1 TRANSPORT LOGISTICS
Logistics is the management of the flow of goods, information, and other resources, including energy and people, between a point of origin and the point of consumption to meet the requirements of consumers. It involves the integration of information, transportation, inventory, warehousing, material-handling, packaging, and security. Logistics is a channel of the supply chain that adds the value of time and place utility. Transport logistics is the integration of transport with the management of the flow of goods (de Castro, 1996).
Sound transport logistics rest on high-quality transport services that maintain control over worldwide flows of parts and products while remaining flexible enough to respond well to rapid shifts in market demand. Flexibility, speed, and reliability are essential:
Flexibility because transport logistics must be able to adapt to changes in consumer demand and to unforeseen circumstances;
Speed because the speed at which transport operations are carried out can reduce the time during which products —and therefore capital— are tied up; and
Reliability because it reduces the risk of a breakdown in the supply or distribution of goods, and thereby reduces the need for safety/buffer stocks.
Sound transport logistics also rest on transport services that can lower the overall costs of delivered products. The combination of three technically related costs—transport, handling/storage, and administration—under the rubric "logistics costs" defines the basket from which alternative solutions can be picked. The range for arriving at an optimum solution is therefore considerably extended and allows a firm to select a solution of best value to it. For example, higher costs for transport can be more than offset by lower costs for handling/storage and administration.
Carriers have many options for improving transport operations, including economies of scale and network size, and economies of traffic density. Economies of scale and network size are obtained by producing more services more economically. These economies offer the opportunity to expand services on networks at a lower cost, and they consolidate services to new destinations as well as vertically integrating complementary services. Economies of traffic density are obtained by increasing the use of a system to spread system costs among more users. Such economies are usually combined with economies of scale and network size. Economies of traffic density make greater use of vehicle size (e.g., container vessels, wagons, and trucks). Typical examples are the use of large containerships or the development of double–stack train operations, the use of articulated trucks with great container capacity. Such economies result in greater use of available infrastructure capacity, higher rate of capital utilization, and lead to various forms of horizontal integration of services, such as co-loading agreements, consortia, and pools.
Freight transport for development toolkit – road transport
12
Efficient transport operators have made it possible for manufacturers to set-up production logistics systems according to their own needs, taking into account products, supply sites, goods marketed, and customer requirements. These manufacturers demand tailor-made transport logistics services from innovative transport partners who share risks and rewards and cooperate fully in reaching goals for safe product transport, economy, planning, incorporation of new technologies and facilities, and use of communication systems. Cooperation that crosses conventional lines of transportation, warehousing, and inventory management can reduce the cost of commercial transactions between manufacturers and transport logistics providers by encouraging:
Understanding of each party's needs and limitations, thereby reducing transaction uncertainties or the probability of contractual non-performance with regard to quality of goods, packaging, reliability of transport and ancillary services, stability of transport rates, etc.;
Preferential treatment according to transaction frequency, as recurring transactions allow one to establish particular service technologies that would not be economical for one-time or irregular operations;
Long- term commitments that can take into account the idiosyncrasy of transactions requiring specific investment, such as for special handling facilities and equipment, and local electronic data interchange (EDI) standard.
Transport logistic services not only boost customers’ profitability but are also critical to global competitiveness, as stressed by Thomas Foster: "almost 50 percent of our [U.S.] real economic growth in the last half of the 1980s, and nearly all our growth in our current recovery, is attributable to increased exports" (Foster, 2008). However, to take advantage of transport logistic services, manufacturers, traders and, in general, transport users, must adapt their procedures to the trade and commercial practices of the country.
In addition, to succeed in the international marketplace, domestic transport service must be marketable. This means that foreign buyers of transport services (banks, purchasing agents, brokers, freight-forwarders) must find them efficient and expeditious for import/export of goods and supported by effective institutional systems and procedures. With the growth of containerization, documentary credits, and freight forwarding, the marketability of domestic transport has become increasingly important in international transactions. Marketable international transport services—an activity light on capital investment—may produce desirable foreign-exchange savings and/or earnings that would show on trade balances as exports of nonfactor services.
The international marketability of a domestic transport industry is essential to trade facilitation but seldom taken into account in assessing projects. A national transportation industry that performs well by international standards has enormous socioeconomic consequences for the welfare of a country at the micro- and macroeconomic levels. For example, Fox, Francois, Londoño-Kent (2004) estimated that U.S.-Mexican truck restrictions as NAFTA had envisioned have led to inefficiencies and welfare loss for both economies. By one conservative estimate, removing border frictions would cause trade between the two countries to rise by more than US$7 billion, welfare in the United States to increase by about US$1.4 billion per year, and welfare in Mexico by more than US$1.8 billion per year. Impediments to international trucking have pronounced implications for trade and the international organization of production. Reducing border crossing friction will facilitate efficient use of transport equipment, faster equipment turnover, and greater savings in capital equipment, infrastructure construction and maintenance, and pollution.
Freight transport for development toolkit – road transport
13
3.2 LOGISTIC COSTS AND GROSS DOMESTIC PRODUCT
Most industrial economies have paid close attention to the development of efficient transport logistics services. In the United States, for example, the effort to reduce logistics costs is routine. Over the last two decades, the increase in total logistics costs has been slower than the increase in GDP, resulting in a substantial reduction of about 30 percent in the participation of logistics costs in GDP. In 1992, the participation of logistics costs in GDP was estimated at 10.1 percent in Japan, 12.2 percent in Europe, and 13 percent in newly industrialized Pacific Rim countries (de Castro, 1996).
In 2006, the cost of business logistics in the United Sates rose for the fourth straight year to over 11 percent of the GDP to a record US$1.305 billion (Shulz, Logistics Management, 6/6/2007). Managing logistics in today’s complex environment costs more. Driven by fuel prices, transportation costs rose 9.4 percent in 2007, accounting for 6.1 percent of GDP. Trucking, which accounts for nearly half of the transport in the United States, rose from $52 billion to $635 billion, an 8.8 percent increase. Oddly, that increase came almost entirely through rising fuel surcharges as actual tonnage fell in 2008 for the first time in many years, down 1.3 percent. Lack of drivers and reduced demand led some carriers to report idle or underutilized equipment. As a percentage of GDP, those costs hit a record low of 8.6 percent in 2003 (the last year of $30-a-barrel crude). The last year they exceeded 10 percent was 2000. By comparison, however, those costs were 12.3 percent in 1986 and nearly 17 percent of GDP in 1979, the last year of regulated ground transport. In 2007, total US logistics costs grew to nearly $1.4 trillion, representing 10.1 percent of GDP. “Supply chain costs are not always visible to the consumer, yet are a major and growing segment of the economy," says Rick Blasgen, president and CEO of Council of Supply Chain Management Professionals. "That $1.4 trillion equals annual government spending on national defense, health, and Social Security combined."(Blasgen, R. 2008). On a human scale, the cost of moving goods is equal to US$4,656 for every man, woman, and child in the United States.
Meanwhile, rail participation in the land road transport market is growing. Rail transportation costs rose 12 percent last year, with freight revenue for Class I rails up US$5.8 billion or 13 percent. Overall rail revenue hit US$54 billion, still only 8 percent of trucking’s revenue but rising. Transport modes, however, are increasingly complementary rather than competitive. Higher costs for fuel, longer and more complex moves, and higher inventory costs are cited as factors in the rise in logistics costs.
3.3 LOGISTICS IN THE CURRENT ECONOMIC CRISIS
In 2007, intermodal freight, international containers, and truck freight volumes were down in Europe and the United States. Truckers in particular had a rough time. Over 2,000 trucking company bankruptcies were recorded last year in Europe in fleets operating five or less trucks. In the United States, the trend appears to be accelerating as thousands of trucking firms filed for bankruptcy in 2008 and more than 900 filed during the first quarter 2009 (Rojas 2009). Most of these companies have 25 or fewer trucks. Another significant trend is that inventories are increasing after many years of tightening. "For the first time ever, wholesale inventories are larger than retail inventories," says Blasgen. "This is a result of retailers continuing to tighten their inventories coupled with manufacturing shifts in sourcing" (Blagsen 2008).
3.4 TRANSPORT COMPETITIVENESS
To stay competitive, developing countries should ensure that their land side sectors and port interfaces meet the requirements of shippers and carriers. Transshipment load centers, feeder lines, multimodal transport
Freight transport for development toolkit – road transport
14
facilities, and logistic services should be encouraged in order to improve goods handling capacities and to provide economies of scale with handling and transit costs, infrastructure capital costs, and running expenses. Goods moving to and from the interior often spend more than half their total DTD transport times and cost on movement to and from the coastline. Trade and marketing are such that a considerable proportion of foreign trade’s total transport costs are incurred in the domestic leg (e.g., cost added to coffee in Côte d'Ivoire from producer to FOB port is about 170 percent; to cocoa, about 60 percent, de Castro, SSATP, World Bank Working Paper No. 27, 1996).
This means that developing countries should shift work and investment from the ocean side to the promotion of transport intermediaries, to surface transport, and to facilitation of trade logistics. Transport intermediaries usually perform complementary functions under one sole business entity. These functions are ship agency, customs agency, stevedoring, port handling, and freight-forwarding. The importance of intermediaries to the competitiveness of developing countries is exceptional when compared with that of developed countries. Surface transport systems—road, rail, and inland waterways—are often weak and unreliable. Customs formalities, commercial procedures, and transit logistics are complex and inefficient. Communications are poor. Intermediaries at ports of entry and destination are beacons offering service and liability for cargo in transit; their follow-up and control of surface inland transport are essential.
From the perspective of ownership, transport intermediaries in developing countries fall into three main groups (de Castro 1996): national parastatals, private multinational transport groups, and privately owned transport enterprises. The notions of profitability and efficiency are foreign to national parastatals, which largely survive as parasites of the transport chain, often with the help of local shippers’ councils or subsidies.
Private sector multinational transport groups with locally registered companies or joint ventures are usually foreign-managed and their investment decisions are not always governed by local concerns. These companies control a large share of developing countries’ freight-forwarding and clearing business and are ready to invest locally when the commercial, fiscal, and financial prospects are favorable. In spite of this, they are at the core of developing countries’ transport trade needs (land and sea). There is no substitute for them, and the future viability of low and middle income countries’ trade depends on them.
Transport enterprises privately owned by nationals are active in ship agency, clearing, forwarding, stevedoring, port handling, and road transport. Although some of these companies perform efficiently and profitably, their responsibility is poor, their financial situation shaky, their international coverage inconsistent with their trade, and their life expectancy follows the fortunes of their owners. These companies' environments fail to meet financial institutions' expectations, and their capabilities for handling large accounts are inconsistent with the requirements of modern trade. However, these companies will determine the future of most developing countries’ national transport and its contribution to multimodal transport (de Castro, 1996).
Surface transport systems in developing countries (road, rail, and inland waterways) are generally weak and noncompetitive at world prices, with a poor service-to-cost ratio. Road transport is the domain of the private entrepreneur. It is flexible and usually offers the best value in the market. But its product, as measured by ton/kilometer produced, can be expensive (e.g., US$0.12 to 0.93 per ton/km in Cameroon, against US$0.07 to 0.09 in France and about US$ 0.02 to 0.03 in Pakistan; and between US$0.20 and 1.00 per ton/km in Mozambique and Angola). Costs are related to high fiscal charges on inputs and low vehicle utilization (both in terms of kilometers per year—about 35,000—and load factors—50 percent loaded kilometers per round trip). Rail transport is generally cheaper, but consumes substantial government subsidies and is unreliable and slow, compared to road.
Freight transport for development toolkit – road transport
15
3.5 SERVICES THAT IMPROVE TRANSPORT
Due to its its unique flexibility road transport represent over 70 percent of the land freight service at origin and destination points by interconnecting business to world markets. Road transport is the backbone of the real economy; the key to the industry’s future is to provide better rather than simply more transport. The competitiveness of multimodal transport operators is the result of financial liquidity, rather than unit price per segment (origin service, ocean voyage, and destination). To provide better transport services logistics, operators offer door to door services, third-party logistics, and truck turn time services.
3.5.1 Door to Door Services The basic concept of Door to Door (DTD) is as follows: one multimodal contract carrier, a nonvessel-operating-common-carrier (NVOCC) or a vessel-operating common- carrier (VOCC); one document, the DTD or similar private document; one sole responsibility for loss or damage; one sole insurance coverage (whenever feasible). For example, China offers the full set of logistics including the inland trucking and overseas trucking from China to Asia, Europe and America, offering the local service for customers with the local trucking team that offers the best practices.
3.5.2 Third Party Logistics (3PL) A third-party logistics (3PL) firm provides out-sourced services for part or all of a customer’s supply chain management function. These providers typically specialize in integrated operation, warehousing, and transportation services that can be scaled and customized on the basis of market conditions and the demands and delivery service requirements for products and materials. A remarkable example of 3PL is the UPS’s case in the three NAFTA countries, see excerpt below:
UPS Freight will offer door-to-door service to and from Mexico, incorporating UPS's customs-brokerage capabilities and single invoicing for all services between the U.S., Canada and Mexico. The change means that customers on both sides of the border will experience faster transit times, UPS said. Freight moving to and from Mexico will be expedited over five border crossings, including Otay Mesa, Calif.-Mexicali; Nogales, Ariz., and three locations in Texas: Brownsville/McAllen-Matamoros, El Paso-Ciudad Juarez and Laredo-Nuevo Laredo. UPS Freight already operates more than 200 service centers in the U.S. and Canada, and will rely on more than 40 in Mexico. UPS technology provides visibility for shipments entering Mexico, enabling the identification of goods as soon as they enter the UPS network. UPS Customs Brokerage prepares shipment classification, inspections, customs documentation preparation and collection of applicable duties and fees. Single invoicing will automatically apply when UPS Freight provides full door-to-door service, including customs brokerage. Truckload services are available over both borders, with UPS Freight providing dedicated carrier, dry-van equipment and container-on-flatcar services for long-haul intermodal movements. UPS Freight has also announced enhancements to its network in Canada. The next-day service belt around Toronto is being widened to include northern Ohio, northern Indiana and Michigan, while two-day service will be extended to and from Toronto as far as Georgia. Transit times to and from the West will be shortened to points as far as California (Global Logistics and Supply Chain Strategies, UPS Freight, April 15, 2009).
3.5.3 Truck Turn Time Truck turn time (TTT) is a key indicator of efficiency and productivity. Time countdown begins when paperwork is completed in the terminal office, and the average target time frame for a container to be
Freight transport for development toolkit – road transport
16
collected from or delivered onto a truck is less than 20 minutes. A critical component of the TTT is the appointment system. Various scheduling rules affect resource utilization and TTT. Better understanding of scheduling rules could help terminal operators and appointment service providers change scheduling practices. The main types of appointment scheduling strategies, adopted from the healthcare sector are individual appointment systems (IAS) and block appointment systems (BAS). Experimental results in various ports show that terminals lacking an appointment system clearly benefit when they employ an IAS. Such a system keeps yard cranes highly utilized while reducing the internal yard turn time by about 44 percent. With proper spacing between appointments, the IAS can be effective even when a good portion of trucks are walk-ins, no-shows, or late (up to one hour).
Freight transport for development toolkit – road transport
17
4 INDUSTRY STRUCTURE IN LOW AND MIDDLE-INCOME COUNTRIES
In this section, we present our main findings about the structure of the road freight industry in low and middle-income countries. We first present issues that characterize the industry in countries we reviewed, then examine the effects of unbalanced regulation and powerful interest groups, attending closely to the persistence and magnitude of inefficiencies described in case studies of trucking industries in Africa and South America. Describing best and worst practices, we examine why inefficiencies in transport and trade logistics have persisted in the form of cartels, poor service, and high prices in some places while in others deregulation has led to more efficient road freight transport and logistics services. The institutional examples add to our analysis by presenting the context within which economic agents act and the importance of rational reform of legal and institutional frameworks for the industry.
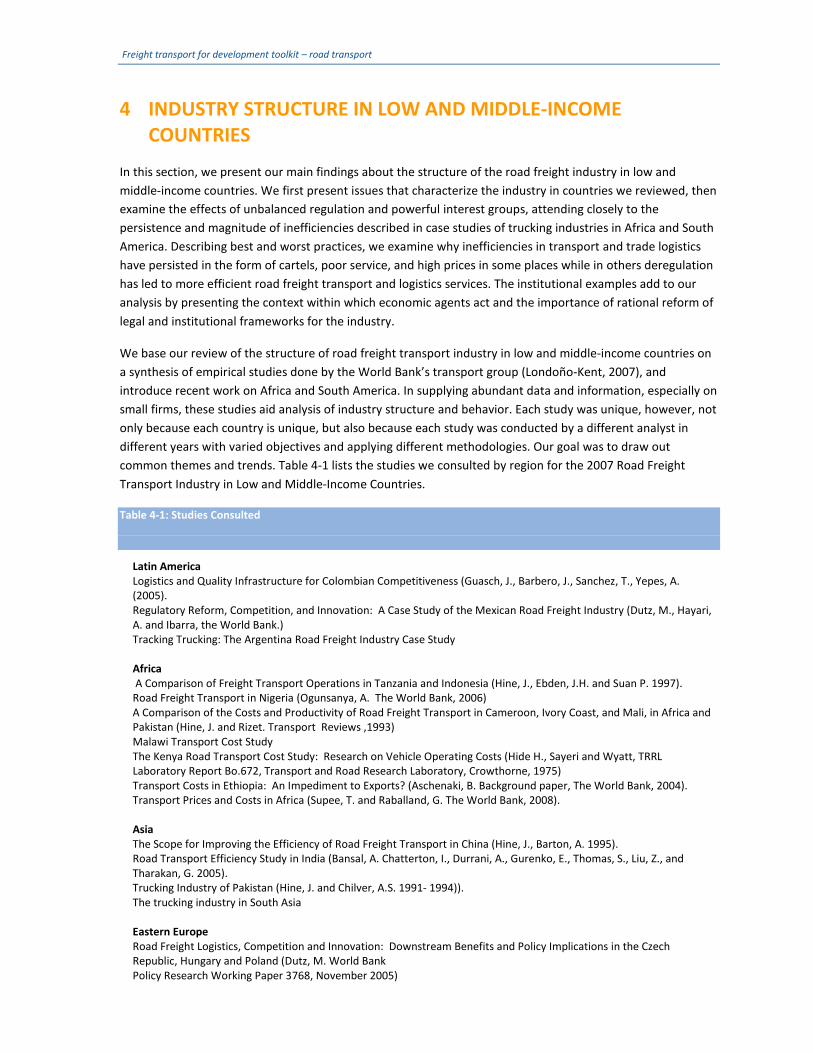
We base our review of the structure of road freight transport industry in low and middle-income countries on a synthesis of empirical studies done by the World Bank’s transport group (Londoño-Kent, 2007), and introduce recent work on Africa and South America. In supplying abundant data and information, especially on small firms, these studies aid analysis of industry structure and behavior. Each study was unique, however, not only because each country is unique, but also because each study was conducted by a different analyst in different years with varied objectives and applying different methodologies. Our goal was to draw out common themes and trends. Table 4-1 lists the studies we consulted by region for the 2007 Road Freight Transport Industry in Low and Middle-Income Countries.
Table 4-1: Studies Consulted
Latin America Logistics and Quality Infrastructure for Colombian Competitiveness (Guasch, J., Barbero, J., Sanchez, T., Yepes, A. (2005). Regulatory Reform, Competition, and Innovation: A Case Study of the Mexican Road Freight Industry (Dutz, M., Hayari, A. and Ibarra, the World Bank.) Tracking Trucking: The Argentina Road Freight Industry Case Study Africa A Comparison of Freight Transport Operations in Tanzania and Indonesia (Hine, J., Ebden, J.H. and Suan P. 1997). Road Freight Transport in Nigeria (Ogunsanya, A. The World Bank, 2006) A Comparison of the Costs and Productivity of Road Freight Transport in Cameroon, Ivory Coast, and Mali, in Africa and Pakistan (Hine, J. and Rizet. Transport Reviews ,1993) Malawi Transport Cost Study The Kenya Road Transport Cost Study: Research on Vehicle Operating Costs (Hide H., Sayeri and Wyatt, TRRL Laboratory Report Bo.672, Transport and Road Research Laboratory, Crowthorne, 1975) Transport Costs in Ethiopia: An Impediment to Exports? (Aschenaki, B. Background paper, The World Bank, 2004). Transport Prices and Costs in Africa (Supee, T. and Raballand, G. The World Bank, 2008). Asia The Scope for Improving the Efficiency of Road Freight Transport in China (Hine, J., Barton, A. 1995). Road Transport Efficiency Study in India (Bansal, A. Chatterton, I., Durrani, A., Gurenko, E., Thomas, S., Liu, Z., and Tharakan, G. 2005). Trucking Industry of Pakistan (Hine, J. and Chilver, A.S. 1991- 1994)). The trucking industry in South Asia Eastern Europe Road Freight Logistics, Competition and Innovation: Downstream Benefits and Policy Implications in the Czech Republic, Hungary and Poland (Dutz, M. World Bank Policy Research Working Paper 3768, November 2005)
Freight transport for development toolkit – road transport
18
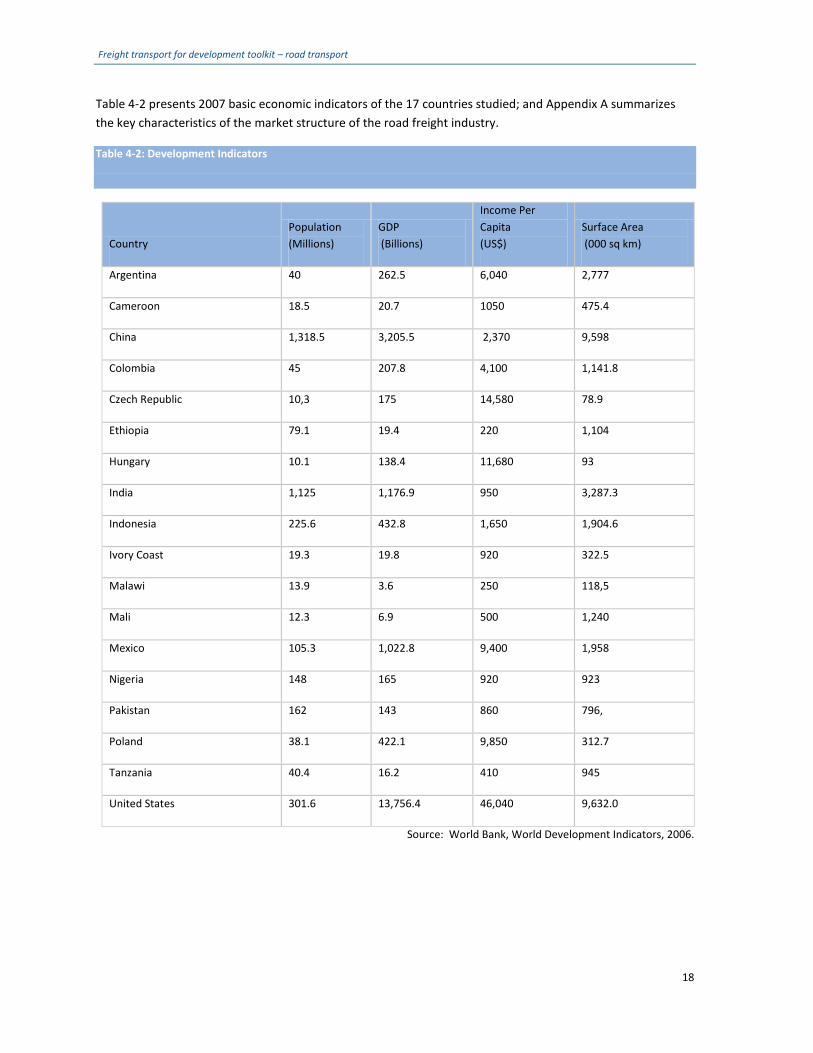
Table 4-2 presents 2007 basic economic indicators of the 17 countries studied; and Appendix A summarizes the key characteristics of the market structure of the road freight industry.
Table 4-2: Development Indicators
Country Population (Millions)
GDP (Billions)
Income Per Capita (US$)
Surface Area (000 sq km)
Argentina 40 262.5 6,040 2,777
Cameroon 18.5 20.7 1050 475.4
China 1,318.5 3,205.5 2,370 9,598
Colombia 45 207.8 4,100 1,141.8
Czech Republic 10,3 175 14,580 78.9
Ethiopia 79.1 19.4 220 1,104
Hungary 10.1 138.4 11,680 93
India 1,125 1,176.9 950 3,287.3
Indonesia 225.6 432.8 1,650 1,904.6
Ivory Coast 19.3 19.8 920 322.5
Malawi 13.9 3.6 250 118,5
Mali 12.3 6.9 500 1,240
Mexico 105.3 1,022.8 9,400 1,958
Nigeria 148 165 920 923
Pakistan 162 143 860 796,
Poland 38.1 422.1 9,850 312.7
Tanzania 40.4 16.2 410 945
United States 301.6 13,756.4 46,040 9,632.0
Source: World Bank, World Development Indicators, 2006.
Freight transport for development toolkit – road transport
19
4.1 MARKET STRUCTURE
Trucking is the main mode of freight transport in most of the low and middle-income countries studied. The structure of the road freight transport industry in these countries is highly complex and fragmented. There are a large number of owner-drivers and small independent operators running 1-5 trucks, rigid 2- and 3-axle, for general cargo with 5-10 ton capacity. Only a handful of large operators with 100 or more, larger, modern trucks exist. Most vehicles are driven for 20 years or more and use antiquated technology, consume a great deal of fuel, and pollute the air. Fleet renovation can be prohibitively expensive in many countries because it is difficult to import trucks and spare parts, and capital is scarce and expensive. The high ratio of drivers-assistants per truck improves the number of driving hours, but average distance per truck per year is lower than in industrialized countries.
In the United States, Canada and Europe the industry offers a professional, competitive, efficient, high quality of integrated logistic services. In 2006, the United States trucking, which accounts for nearly half of all transport, rose to $ 635 billion, or 5 percent of the GDP. With fuel as the main driver, transportation costs rose 9.4 percent last year.
In Mexico trucking represents 70 percent of the freight bill by volume and 80 percent by value. There is segmentation: 85 percent are small operators with 1-5 units with an average age of 20 years; 12 percent own 6-100 units and a handful of companies have 100 or more units, 5-10 years old, but which claim 65 percent of the national haulage. The trucking sector remains constrained by powerful interest groups. Politicians are connected with these interests and the political cost of changing the situation is high. Safety and environmental regulations have been a main issue in the unilateral decision by the United States to impede Mexican trucks to operate in the north side of the border (De la Mora, 2000).
The Central American registered trucking industry benefits from an integrated system recognized by member countries. There are a number of issues with old trucks that lack the technical standards for quality of service and information technology. Also there are security concerns, organized crime, uneven infrastructure development, and a fragmented trucking industry.
In South America, MERCOSUR members—mainly Argentina, Chile and Brazil—are at the top of the freight transport business. It scores particularly well on regulatory and competitive environment. The market is clearly segmented: companies that serve domestic and international cargo, long and short distance, general cargo, and specialized cargo. The professional level of drivers and services characterized the industry in this region.
In contrast, the industry in Andean Pact countries (e.g., Colombia) is over-regulated, has a fragmented, multilayered, and complex market structure, lacking transparency and trust. The fleet is old; these issues drive up the cost of operations, impede efficiency, and erode service quality. The market is not open for international trucking in this region.
Eastern Europe’s market illustrates the international trend toward concentration. Most providers are small owner-driver firms; internationally connected private service providers are geared toward logistics chain.
China has the world’s most dynamic logistics industry, with economic growth continuing over 10 percent per annum, driving trade and demand for freight transport and putting massive demands on the country’s infrastructure. Maritime and inland waterway freight traffic are growing fastest, with an average expansion rate of 17.2 percent as compared to a road freight expansion rate of 13 percent. The road freight fleet has
Freight transport for development toolkit – road transport
20
expanded in large numbers, 80 percent are own-account operators, 14 percent private transporters and 6 percent state-owned for hire. Pakistan has a free market highly competitive at all levels, with low costs; 79 percent are owner operators with 1- 5 vehicles; 20 percent are fleet owners with more than 10 vehicles; and 1 percent are large companies with more than 100 vehicles.
In India, which has the second largest road network in the world, the road freight industry represents 4.7 percent of GDP and is expected to grow at 9.9 percent per year—but the economic crisis may curb this growth. The industry is highly fragmented, competitive, and low cost, with high vehicle utilization and massive overloading. Road freight sector demand is boosted by door-to–door logistics, the move to higher value-lower bulk shipments, the rising size of vehicle fleet and new impetus to improve and extend the network, using private sector highway operators and building transfer-operate (BOT) schemes (BBB 2009).
East Asia’s truck industry is highly fragmented and informal, and at disadvantage compared with the industry in Thailand.
Eastern Africa’s trucking industry is competitive; the market is maturing and rates are determined by market forces. Transport quality is higher than in Central and West Africa and prices are lower. Rigid trucks with 2 and 3 axles represent 75 percent of the fleet, and articulated 25 percent. Trucks and spare parts are expensive in all African countries. Central Africa ‘s trucking industry is very fragmented; the presence of cartels and the use of freight bureaus raise prices and distort the freight market. Quality of service is low, except for the Port of Duai region in Cameroon.
The trucking industry in West Africa is characterized by strong market regulation through freight bureaus and the service quality is uniformly low. Market entry is easy. Ghana has the best services in the region. Cartels capture the benefits of road benefits. In South Africa the trucking sector is relatively modern and consolidated; it presents the best services in the African region.
4.2 INDUSTRY CONCENTRATION
The industry appears to be concentrating in large, dominant firms as part of the general trend toward modernization in an otherwise highly fragmented industry. The larger firms, multinationals or national, have access to managerial resources, capital, and technology; they handle the larger portion of the market. Articulated trucks have played an important role in this development.
4.3 REGULATORY ENVIRONMENT
The regulatory environment has changed in the past ten years and efficiency has improved as a result. Numerous low and middle-income countries have introduced regulatory reforms but problems remain at the level of local and state implementation. Some countries still regulate rates through rates tables but rates are often set by market conditions. Africa seems to abide by a “queuing system” that protects inefficiency and keeps prices high. Its import policies and licenses to exclusive dealers also keep the prices of trucks and spare parts very high.
4.4 COMPETITION AND BEHAVIOR
The importance of trucking has made it the focus of our analysis, but trains are competitors, especially in serving distant regions. In general, shippers are willing to pay a reasonably higher price for an acceptable level
Freight transport for development toolkit – road transport
21
of service and reliability. Railways have problems with long delays, load damage and theft, and accountability and compensation following loss. Many shippers use trucks to avoid railways’ poor service. Once the rail service in a developing country loses its market share to trucking it is hard put to reclaim it in the short and medium term. But some countries, like Ghana, are seeking to revitalize rail as a competitive option; and rail service in Mexico increased from 3 percent of the freight bill in 1999 to 17 percent in 2008 (Embassy of Mexico in Washington, D.C. November 2008) .
Although trucking is the dominant mode of transportation, it faces some problems. National interests, interest groups, associations, government inspections, and less developed transportation systems and logistics management practices can disrupt service and cause excessive handling, delays, and costs. A survey of Fortune 500 companies identified logistics as the most promising area for making trade with low and middle-income countries more efficient (Bonney, 1992, 48/3-48/4).
The industry’s barriers to entry are minimal and participants abundant. In most countries, anyone with a license and a truck can operate a road freight business. Some countries require licenses for certain routes. Sometimes rates are set by officials but usually the market sets the rates. The licensing process can give rise to corruption and informal payments (Ojala 2009).
The product is segmented and heterogeneous; ports and centers of production and consumption define international and domestic freight corridors, the type of cargo, and the freights. Service quality ranges from almost artisan to highly competitive. The growing integration of truck operators, transporters, and freight agents has had spillover efficiencies, and an outsourcing trend among firms is expanding the hire-and-reward sector. Deregulation has gone so well in Argentina, for example, that the industry has reached a competitive level of service overall and drivers are now “professionalized.” One-third of the costs in the industry are administrative cost related to expanding the hire-and-reward sector.
Demand for domestic and international transport services is cyclical, and import volumes are often greater than export volumes. Rates for imported goods tend to be higher than for export cargo, and transporters are willing to accept rates demanded by the shipper, even if they are lower than their operating costs, to avoid empty backhauls.
The industry’s large number of associations and unions protect members’ interests. Individual economic agents acting in their own interest may not be guided by an “invisible hand” to produce a socially optimum economic result (or the invisible hand may be handcuffed by vested interests and economic regulation). Market distortions and irregularities persist even in countries that have deregulated. In Mexico, for example, the long haul trucking industry reports revenues between 10-15 percent versus 3 percent revenue of the U.S trucking industry (Rojas, 2009).
In Africa, there is substantial evidence of cartels and associations influencing productivity and prices through queuing systems. The road freight industry is characterized by a large number of powerful associations and their interests are served through influence wielded at national and regional levels.
4.5 OVERLOADING
Common in low and middle-income countries, the practice of overloading damages roads and is often cited by reformers when arguing for regulations. Overloading is rooted in operators’ behavior, usually owner-drivers. In Pakistan, for example, overloading is a common practice; trucks are reinforced, well maintained, and carefully driven at slow speed. Imposing penalties and investing in expensive control systems is unlikely to

Freight transport for development toolkit – road transport
22
deter overloading and is more likely to create more opportunities for the unofficial payments so common in these countries.
4.6 TECHNOLOGICAL CHANGES
The technology employed by the road freight industry is rapidly changing. In the past ten years the trend toward larger trucks has continued in industrialized countries and in a handful of large firms that handle most cargo in low and middle-income countries. Governments need to create the right tax incentives to make technological changes accessible to smaller operators, probably best through their associations.
4.7 EXTERNALITIES
The studies we reviewed mentioned very little about the safety record of the road freight industry, except in India and Pakistan, where the record is a big issue. Specialists estimate that there about 75,000 highway fatalities per year in India with an economic loss (excluding allowance for pain and suffering) of approximately US $11 billion. Trucks are reported to be involved in about 50 percent of highway accidents, and a disproportionate number of accidents are caused by a few accident-prone drivers. The Indian case points out the importance of keeping the safety record of the industry in low and middle-income countries and brings an important subject that needs to be addressed by the governments in those countries, reviewing their laws and regulations, making sure that they will be enforced.

Freight transport for development toolkit – road transport
23
5 INDUSTRY PERFORMANCE IN LOW AND MIDDLE-INCOME COUNTRIES
The global financial crisis and subsequent economic crisis has caused a dramatic decline in demand for road freight transport services in industrialized countries and less developed countries, though there the decline is not as dramatic. For 2008, IRU reported a decrease in road freight transport activity of nearly 50 percent, a doubling in the number of bankruptcies, a dramatic increase in unemployment (permanent and temporary layoffs). Forecasts for 2009 are extremely negative, and haulage tariffs were generally in decline in the first quarter of 2009. Fundamental measures of performance of the road freight transport industry in low and middle-income countries presented here include (1) number of vehicles, (2) fleet composition, (3) number of vehicles per thousand people, (4) average of empty trips, (5) average distance traveled per truck, per year, (6) average number of ton-kilometers/ truck/ year, and (7) number of vehicles per billion of GDP
5.1 NUMBER OF TRUCKS
According to World Road Statistics, 2006, the number of trucks and vans in the world (000s) by region, is as follows.
Latin America and the Caribbean 15,386
United States and Canada 100,6003
Africa 2,838 (S. Africa 2,200)
Asia 32,507
Australia 2,470
Europe 37,196
Total 196,500
These figures give one an idea of the concentration of trucks in industrialized countries. Table 5-1 presents data on total number of trucks by type, per capita, and per million of GDP in the countries we reviewed.
Table 5-1:Number of Trucks per Type, per Capita and per Unit GDP
Country
Number of Trucks, 2006 Per Thousand Population
No. Trucks/ $million GDP Total % Rigid % Articulated
Argentina 272,000 80 20 NA 4
Australia 2,470,600 84 16 11.4 NA
3 Approximately 60 million trucks of all classes, including 2.9 million typical class 8 trucks and 5.3 million commercial trailers were licensed in the United States in 2008, (Rojas 2009).

Freight transport for development toolkit – road transport
24
Cameroon ___ 89 11 NA NA
China 4,736,129 82 12 3.63 2.11
Colombia 196,226 86 14 4.37 1.60
Czech Republic 349,500 82 18 34.6 2.80
Ethiopia 51,690 NA NA 0.72 4.6
Hungary 406,863 82 18 40 3.7
India 3,488,000 90 10 3.2 4.3
Indonesia 1,700,000 NA 7 5.2
Ivory Coast ___ 89 11 NA NA
Malawi 7,600 NA 0,5 3.6
Mali 1,864 89 11 0.13 0.35
Mexico 6,859,866 85 15 66 8.9
Nigeria ___ NA NA NA
Pakistan 403,000 86 14 2.6 3.6
Poland 2,313,419 82 15 60 7.6
Tanzania 20,000 71 19 0.5 1.6
Notes:
Source for total number of trucks is World Road Statistics 2006. For Tanzania the number of trucks is estimated on the basis of the number of trucks in 1995 (15,000) and a 5% annual growth in the fleet; for Indonesia the total number is estimated on the basis of the number of trucks in 1995 (1 million) and 9% annual growth in the fleet.
Source for average long distance cost for Tanzania is from Hine, Ebden and Swan (1997); freight rates are from 1994.
Average long distance per year per truck for Cameroon and for Pakistan pertains to rigid three-axle Japanese trucks
Source for India’s ton-km per truck per year estimates is from the Sustainable Mobility Program (2010).
Total number of trucks in Malawi was estimated by Swe Road for a safety road project, 2003.
5.2 FREIGHT VEHICLE EFFICIENCY
In low and middle-income countries freight vehicles tend to be smaller rigid vehicles with low fuel efficiency. On the basis of the studies reviewed here, we infer that most trucks in low and middle-income countries are
Freight transport for development toolkit – road transport
25
two- and three-axle rigid trucks, 15-20 years old with 5-10 tons capacity load. These older trucks tend to consume more fuel. New, larger, and technologically advanced trucks are very costly in these countries, and capital is scarce and expensive. Fleet renovation is going to take a long time and governments will have to introduce the right incentives to promote change.
Medium-sized rigid trucks have been losing ground to articulated trucks and small delivery vehicles in the UK as trips have lengthened thanks to improved motorways and new logistic operations. The same trend is observed in countries that have moved towards industrialization and where demand now favors professional trucking services, such as India, China, Thailand, and the MERCOSUR region in Latin America.
Most of our data about the vehicle fleet is drawn from studies we reviewed, complemented by and updated with the Source Road Statistics and the Sustainable Mobility Project (SMP) model. SMP assumes road freight industry growth in middle and low-income countries to be 8 percent faster than GDP growth for a specific country, slowing as economies mature. Data on numbers of trucks in Cameroon, Ivory Coast and Nigeria do not exist but we can assume that the number of trucks in these countries—as well as the percentages of distribution per vehicle type and the amount of trucks per thousand population and million GDP—is similar to figures for Mali. The World Road Statistics indicate that Africa has 2.8 million freight vehicles with 2. 2 million concentrated in South Africa, which leaves only 600,000 in the rest of Africa.
5.3 EMPLOYMENT
The road freight industry employs millions of people directly and indirectly—more than 1 driver and 1 assistant per truck in low and middle-income countries. The opposite situation prevails in industrialized countries where there is a shortage of truck drivers. Over 70 percent of freight is moved by trucks in low and middle-income countries, where the trucking industry contributes substantially to GDP. In the United States the industry is a major employer; there are 3.5 million truck drivers in the United States, with total industry employment at over 8.7 million. That means that one out of every 15 people working in the United States is employed in trucking. The economic crisis has caused thousands of bankruptcies and the loss of more than 4 million jobs over the past 15 months. The situation is similar in Europe.
Information on working conditions, average income, and other labor-related aspects of this industry is rare. The Colombian trucking case study (presents interesting information on the changing social and cultural characteristics of the “camioneros,” or truck drivers, who used to be accorded special social status and were largely independent with good incomes. They were once described as professional, hard working and honest but one now hears complaints about the “truck mentality” versus the “entrepreneur” mentality. Meanwhile, drivers in Pakistan are skillful, take on all the responsibilities of the road freight business, and keep operating costs low. Most drivers own their own vehicle, and in countries in Africa they either own the vehicle or are related to or close friends with the owner.
5.4 FINANCIAL PERFORMANCE
The studies we reviewed—all written before the financial crisis—described intense competition among small operators that lowered freight rates to the point that they barely covered operational costs, even though owner-operators have the lowest overhead costs. Some studies suggested that many small operators would be put out of business, and there is evidence that the global economic crisis has put many operators out of business in the industrialized and less developed countries. In the United States, the ATA reported thousands of bankruptcies in 2008 and even more in 2009. As the economy recovers, this cooling of competition may

Freight transport for development toolkit – road transport
26
allow freight rates to rise to the extent that investment can be attracted back to the industry. Operators able to stay in business will then claim a bigger share of the market.
Before the current crisis, some analysts raised doubts about the observation that competition was driving prices below long-term costs. The same argument had been used for a number of years, yet truck operators were buying new trucks in considerable numbers. It is possible that operating costs have been overestimated or revenues underestimated. Also, there is a lack of documentation and analysis of the cyclical characteristics of the rates. The demand for transportation changes according to the cycles of domestic production, consumption, imports, and exports.
5.4.1 Freight Tariffs per Ton Kilometer Table 5-2 presents statistics on tariffs per ton kilometer of the countries as reported in the studies reviewed for this report. Trucking costs are subject to error, although they reflect some of the inefficiencies of the trucking industry in low and middle-income countries. Tariffs vary according to distance traveled, the load capacity of the freight vehicle, the market characteristics, and the type of cargo and, as noted earlier, are cyclical and change in response to demand. As a result, time is a more reliable indicator of the efficiency or inefficiency of the road freight system than costs.
Long-distance tariffs are lowest in Pakistan at 1-3 US cents per t-k. Similar low rates are found in other Asian countries, but precise data are difficult to obtain and different sources present different scenarios. Mexico reports a tariff of 10 U.S. cents per t-k and the tariff for Africa is about 8-14 US cents per t-k, which is four to eight times higher than in Pakistan. The tariff differentials are partially explained by (1) the queuing system for loads impeding competition and therefore preserving inefficiency, and (2) the cost of trucks and spare parts being very high in Africa because of exclusive import licenses granted to dealers. The highest rates are in Colombia: 16 US cents per t-k.
5.5 TRUCK FREIGHT INDICATORS
Table 5-2 shows a number of road transport statistics for countries under study. As the table suggests, the studies do not report all statistics or the basis for calculating them. The SMP model assumes that trucks in low and middle-income countries average a total distance of 60,000 km per year with an average load of 6 tons. This generates a production of 360,000 ton-km/truck/year. Mexico reported a high ton-km production of 770,000 and Colombia 240,000, t-k/truck/year. China reports only 90,220 ton-km output per truck for 1990. The SMP model assumes a growth rate for future ton-km relative to GDP growth (using the same for rigid and articulated) of 1.25 for 2000-2010. Using this estimate, and taking 9 percent of GDP growth for the last ten years, suggests this indicator for China tripled to about 328,000 ton-km/year. The unexpectedly low output in China is due to the fact that the road freight industry is characterized by short hauls and low loads with an average distance per trip and average load of 40 km and 6 tons, respectively.
5.5.1 Trip Length Distribution In the past decade, the trend toward longer trips continued, in part due to the construction of new roads, improvement in existing roads, and the introduction of better logistics services. There is no recent information about the length distribution, but the estimates of SMP model indicate an average long-distance run per truck/per year of 60,000 km in low and middle-income countries. Average distance per trip is determined by various factors, such as geographical characteristics, average distance to ports, centers of production and consumption, and number of drivers per truck. Even these can vary significantly depending on the country. In China, for example, the average trip distance for a loaded truck was 618 km and 389 km for an empty truck. In
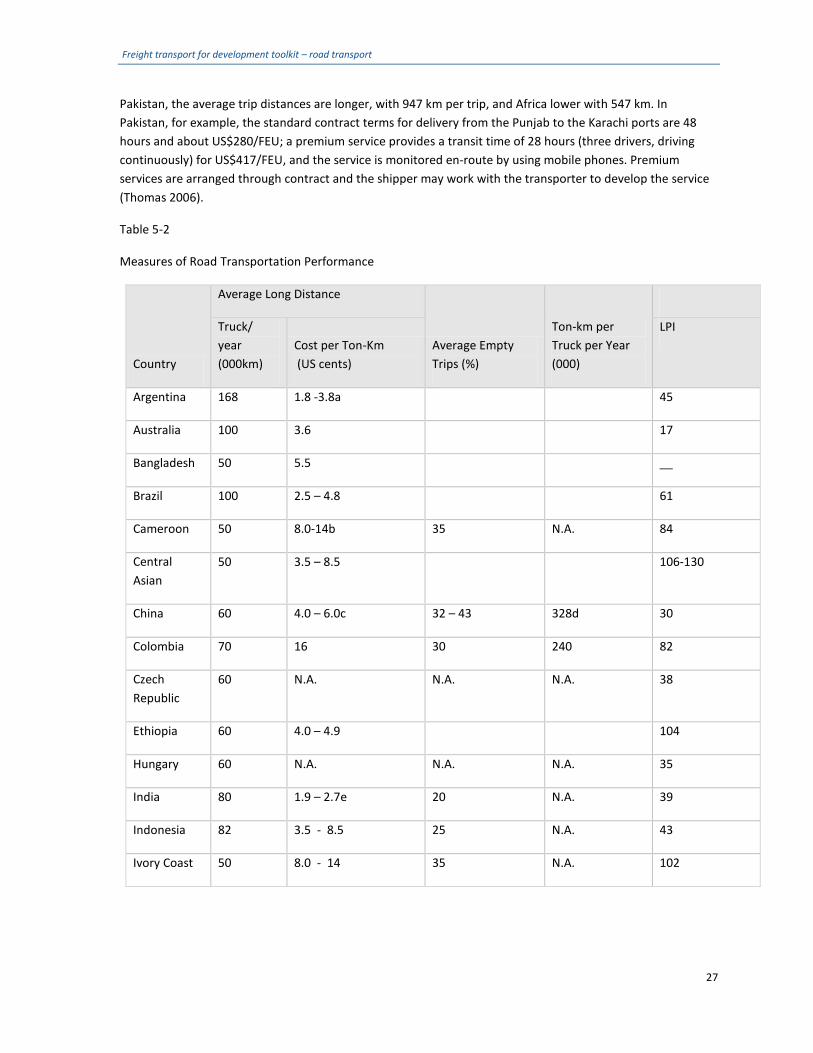
Freight transport for development toolkit – road transport
27
Pakistan, the average trip distances are longer, with 947 km per trip, and Africa lower with 547 km. In Pakistan, for example, the standard contract terms for delivery from the Punjab to the Karachi ports are 48 hours and about US$280/FEU; a premium service provides a transit time of 28 hours (three drivers, driving continuously) for US$417/FEU, and the service is monitored en-route by using mobile phones. Premium services are arranged through contract and the shipper may work with the transporter to develop the service (Thomas 2006).
Table 5-2
Measures of Road Transportation Performance
Country
Average Long Distance
Average Empty Trips (%)
Ton-km per Truck per Year (000)
Truck/ year (000km)
Cost per Ton-Km (US cents)
LPI
Argentina 168 1.8 -3.8a 45
Australia 100 3.6 17
Bangladesh 50 5.5 __
Brazil 100 2.5 – 4.8 61
Cameroon 50 8.0-14b 35 N.A. 84
Central Asian
50 3.5 – 8.5 106-130
China 60 4.0 – 6.0c 32 – 43 328d 30
Colombia 70 16 30 240 82
Czech Republic
60 N.A. N.A. N.A. 38
Ethiopia 60 4.0 – 4.9 104
Hungary 60 N.A. N.A. N.A. 35
India 80 1.9 – 2.7e 20 N.A. 39
Indonesia 82 3.5 - 8.5 25 N.A. 43
Ivory Coast 50 8.0 - 14 35 N.A. 102
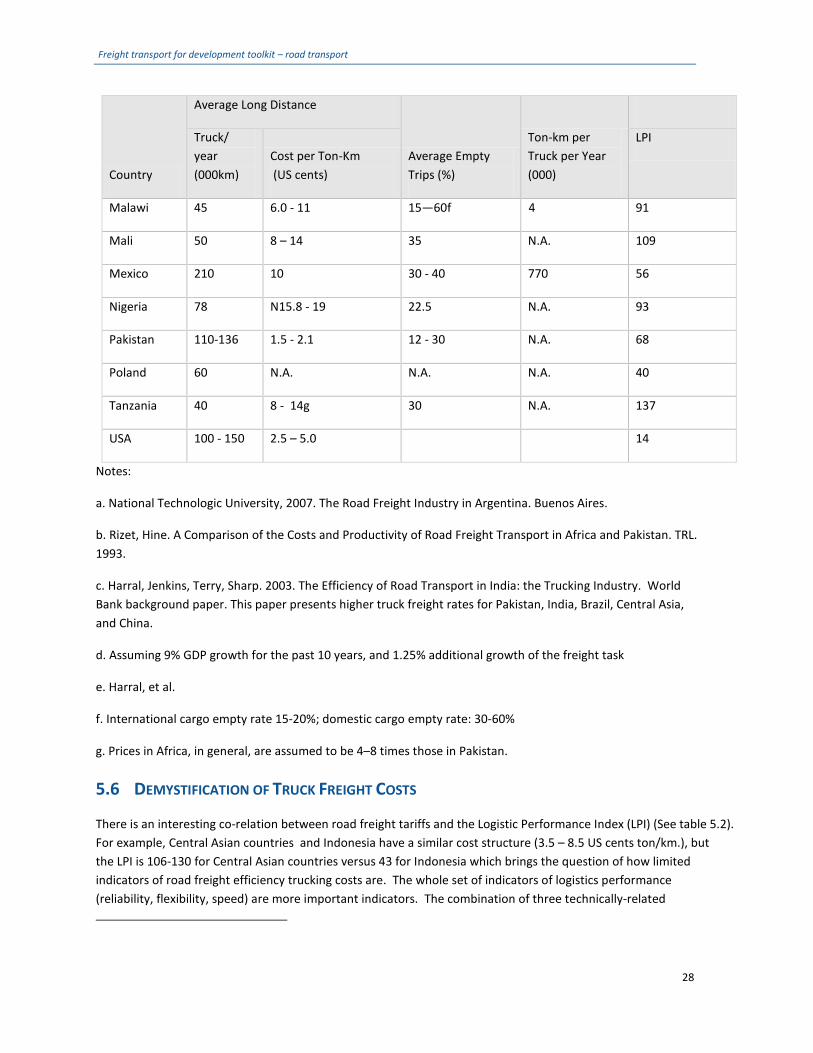
Freight transport for development toolkit – road transport
28
Country
Average Long Distance
Average Empty Trips (%)
Ton-km per Truck per Year (000)
Truck/ year (000km)
Cost per Ton-Km (US cents)
LPI
Malawi 45 6.0 - 11 15—60f 4 91
Mali 50 8 – 14 35 N.A. 109
Mexico 210 10 30 - 40 770 56
Nigeria 78 N15.8 - 19 22.5 N.A. 93
Pakistan 110-136 1.5 - 2.1 12 - 30 N.A. 68
Poland 60 N.A. N.A. N.A. 40
Tanzania 40 8 - 14g 30 N.A. 137
USA 100 - 150 2.5 – 5.0 14
Notes:
a. National Technologic University, 2007. The Road Freight Industry in Argentina. Buenos Aires.
b. Rizet, Hine. A Comparison of the Costs and Productivity of Road Freight Transport in Africa and Pakistan. TRL. 1993.
c. Harral, Jenkins, Terry, Sharp. 2003. The Efficiency of Road Transport in India: the Trucking Industry. World Bank background paper. This paper presents higher truck freight rates for Pakistan, India, Brazil, Central Asia, and China.
d. Assuming 9% GDP growth for the past 10 years, and 1.25% additional growth of the freight task
e. Harral, et al.
f. International cargo empty rate 15-20%; domestic cargo empty rate: 30-60%
g. Prices in Africa, in general, are assumed to be 4–8 times those in Pakistan.
5.6 DEMYSTIFICATION OF TRUCK FREIGHT COSTS
There is an interesting co-relation between road freight tariffs and the Logistic Performance Index (LPI) (See table 5.2). For example, Central Asian countries and Indonesia have a similar cost structure (3.5 – 8.5 US cents ton/km.), but the LPI is 106-130 for Central Asian countries versus 43 for Indonesia which brings the question of how limited indicators of road freight efficiency trucking costs are. The whole set of indicators of logistics performance (reliability, flexibility, speed) are more important indicators. The combination of three technically-related
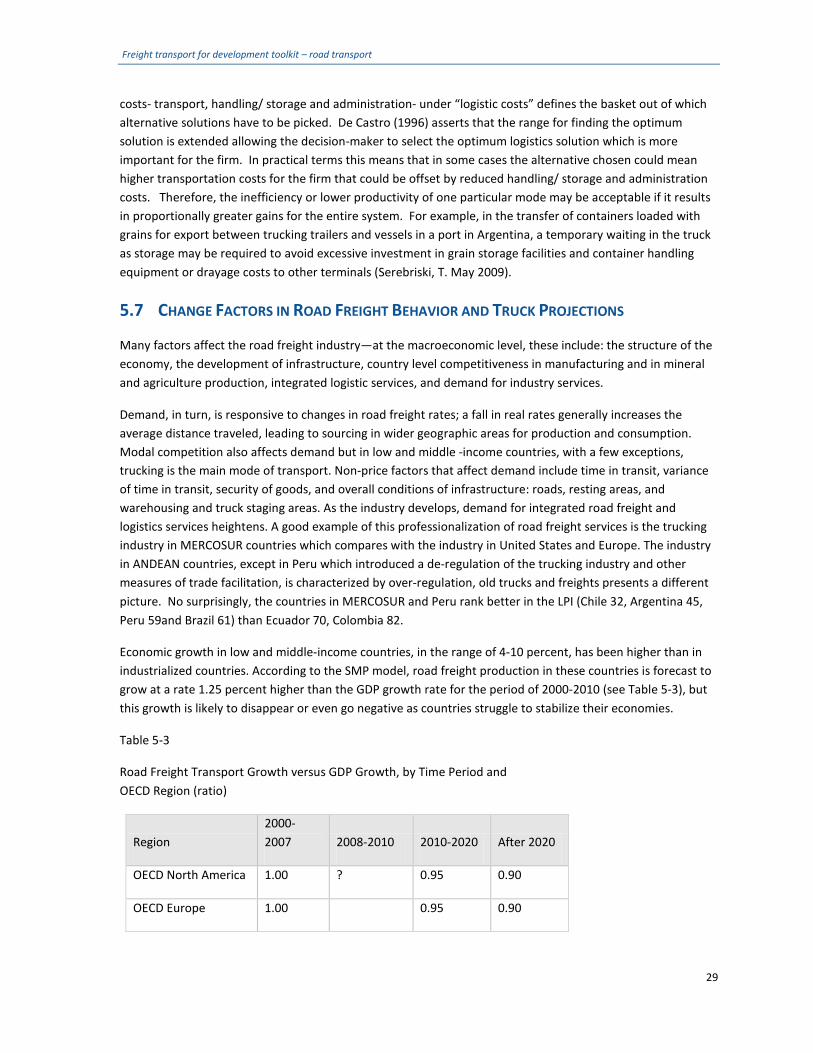
Freight transport for development toolkit – road transport
29
costs- transport, handling/ storage and administration- under “logistic costs” defines the basket out of which alternative solutions have to be picked. De Castro (1996) asserts that the range for finding the optimum solution is extended allowing the decision-maker to select the optimum logistics solution which is more important for the firm. In practical terms this means that in some cases the alternative chosen could mean higher transportation costs for the firm that could be offset by reduced handling/ storage and administration costs. Therefore, the inefficiency or lower productivity of one particular mode may be acceptable if it results in proportionally greater gains for the entire system. For example, in the transfer of containers loaded with grains for export between trucking trailers and vessels in a port in Argentina, a temporary waiting in the truck as storage may be required to avoid excessive investment in grain storage facilities and container handling equipment or drayage costs to other terminals (Serebriski, T. May 2009).
5.7 CHANGE FACTORS IN ROAD FREIGHT BEHAVIOR AND TRUCK PROJECTIONS
Many factors affect the road freight industry—at the macroeconomic level, these include: the structure of the economy, the development of infrastructure, country level competitiveness in manufacturing and in mineral and agriculture production, integrated logistic services, and demand for industry services.
Demand, in turn, is responsive to changes in road freight rates; a fall in real rates generally increases the average distance traveled, leading to sourcing in wider geographic areas for production and consumption. Modal competition also affects demand but in low and middle -income countries, with a few exceptions, trucking is the main mode of transport. Non-price factors that affect demand include time in transit, variance of time in transit, security of goods, and overall conditions of infrastructure: roads, resting areas, and warehousing and truck staging areas. As the industry develops, demand for integrated road freight and logistics services heightens. A good example of this professionalization of road freight services is the trucking industry in MERCOSUR countries which compares with the industry in United States and Europe. The industry in ANDEAN countries, except in Peru which introduced a de-regulation of the trucking industry and other measures of trade facilitation, is characterized by over-regulation, old trucks and freights presents a different picture. No surprisingly, the countries in MERCOSUR and Peru rank better in the LPI (Chile 32, Argentina 45, Peru 59and Brazil 61) than Ecuador 70, Colombia 82.
Economic growth in low and middle-income countries, in the range of 4-10 percent, has been higher than in industrialized countries. According to the SMP model, road freight production in these countries is forecast to grow at a rate 1.25 percent higher than the GDP growth rate for the period of 2000-2010 (see Table 5-3), but this growth is likely to disappear or even go negative as countries struggle to stabilize their economies.
Table 5-3
Road Freight Transport Growth versus GDP Growth, by Time Period and OECD Region (ratio)
Region 2000-2007 2008-2010 2010-2020 After 2020
OECD North America 1.00 ? 0.95 0.90
OECD Europe 1.00 0.95 0.90

Freight transport for development toolkit – road transport
30
OECD Pacific 1.00 0.95 0.90
Eastern Europe 1.25 1.10 0.95
China 1.25 1.10 0.95
Other Asia 1.25 1.10 0.95
India 1.25 1.10 0.95
Latin America 1.25 1.10 0.95
Africa 1.25 1.10 0.95
Source: Sustainable Mobility Project (SMP).
No data are available by which we can distinguish growth between rigid and articulated trucks, but fierce competition, especially among small operators, has forced rates down and many will not be able to compete and will have to withdraw from the market. On the one hand, this cooling of competition could attract investment back to the industry and allow more modern and efficient units to enter the market. On the other hand, the few large trucking companies that operate in low and middle-income countries are taking a greater share of the most profitable routes. This is the situation in Mexico, where large companies that have access to capital to buy new trucks, communication equipment, and managerial resources, charge higher rates and do not contend with the same level of competition as small operators. Thus, in Mexico, monopolistic practices persist despite deregulation. Market inequalities are also revealed by industry revenue. Before the crisis, there were firms in Mexico that had 10-15 percent profits, versus 3 percent in the best cases in the U.S. trucking industry. This difference can be explained only by the presence of market-distorting protectionism.
Freight transport for development toolkit – road transport
31
6 KEY FINDING, EMERGING TRENDS, AND DIRECTIONS FOR FUTURE RESEARCH
6.1 KEY FINDINGS AND EMERGING TRENDS
As the backbone of the real economy, the road transport industry must be promoted and its potential facilitated to provide better rather than more transport, and to tackle current and future economic, energy, and environmental challenges. The gap in trade and transport competitiveness between developed and developing countries is at risk of widening even further. Developing countries’ failure to modernize and set policies in the right direction may further erode efficiency, competitiveness, and the market value of their export commodities. Innovation—even in small increments—is the key to meeting the challenges ahead.
Key findings of the road freight industry are:
Growth. Industry growth in low and middle-countries (4-10 percent) was higher than in industrialized countries (1-3 percent) until 2007. The global financial crisis has dramatically curbed demand for road freight transport services. In the last quarter of 2008, governments and industry sources in Europe and the United States pointed to a greater than 50 percent decrease in road freight transport activity, a doubling in bankruptcies, and a dramatic increase in unemployment, permanent and temporary. Transport forecasts for 2009 are worrying. Haulage tariffs are generally in decline in the first quarter of 2009. In low and middle income countries near-term industry growth will be tied to the downturn in GDP and it can take some time before the economies recuperate from the current crisis and mature.
Market Structure. The industry’s market structure is complex and fragmented, with owner-drivers and small independent operators accounting for more than 70 percent of the fleet. In low and middle-income countries there are only a handful of large, technologically oriented operators, they serve the national and international segment of the market where they are permitted. The market appears to be concentrating in large, dominant firms as part of the trend towards modernization in an otherwise highly fragmented industry. The larger firms, multinational or domestic, have access to managerial resources, capital, and technology; they handle the larger portion of the freight volume. Articulated trucks have played an important role in this development.
Competition. Competition is a big issue in the industry, especially among small operators. The rail sector in general does not compete with trucking, except in some countries like China where the rail sector competes with roads in some regions.
Product. The product is segmented, and heterogeneous, with service quality ranging from almost artisan to highly competitive. The growing integration of truck operators, transporters, and freight agents has had spillover efficiencies, and the outsourcing trend among firms is expanding the hire and reward sector. As the economy grows and matures the demand for better quality transport and logistics services increases.
Regulations. The regulatory environment is a fundamental factor in industry efficiency. Fairness, cost-effectiveness and balanced market regulations are essential to achieve transformation and sustainable development in the industry. Many countries have introduced regulatory reforms but problems remain at the level of local and state implementation. Because powerful actors in the industry operate through a seemingly neutral and “invisible hand that regulates the market,” the devastating impact of engineered hikes in food, fuel and water prices in many low and middle-income regions are dismissed as the result of supply and
Freight transport for development toolkit – road transport
32
demand. In reality, very often, the persistence of high prices for long periods only can be explained by the presence of interest groups that control the “invisible market mechanism.”
Vehicle Size. Freight vehicles tend to be smaller rigid vehicles with low fuel efficiency. In low and middle-income countries most trucks are 2 and 3-axle rigid trucks, 15-20 years old with 5-10 tons load capacity. New, larger, and technologically advanced trucks are costly and capital is scarce and expensive. Fleet renewal is going to take a long time and governments will have to introduce incentives to promote change. Trends in the UK point to larger numbers of articulated trucks and small delivery vans with a loss in the percent of the smaller rigid trucks. This trend has happened with the big rise in trip lengths. These trends reflect the changes in logistics, exploiting the economies of scale of factories and warehouses and the growth of motorways. The same is happening in many low and middle-income countries, including China, India, MERCOSUR countries and Mexico, where the economy is moving toward production of high value manufactures such as machinery and technically advanced products for world markets.
Labor and Employment. The road freight industry employs millions of people—more than 1 driver and 1 assistant per truck in low and middle-income countries. The opposite is true in industrialized countries, which often have shortages of drivers. Truck driving used to endow drivers with special social status, independence, and good income. Drivers were regarded as hardworking, honest, and independent professionals. Now, however, there are complaints in some countries about the “trucking mentality” versus the “entrepreneur mentality.” Drivers in Pakistan exemplify skillful drivers who take on all the responsibilities of the road freight business. Most own their own vehicles, and in countries like Africa, they either own the vehicle or are related to or are close friends with the owner. In MERCOSUR there are positive reports of the “professionalization of the drivers.”
Financial Performance. Intense competition among small operators has raised pressure to reduce freight rates to the point that they barely cover or don’t cover operational costs, even though owner-operators have lower administrative costs. Profit margins are becoming tighter and bankruptcies abound. This situation will put many small operators out of business. The resulting drop off in competition and later economic recovery may see freight rates raise to the extent that investment is again attracted to the industry. The operators that remain in the market will have a larger share of it. There was some skepticism regarding the notion that competition is so strong that prices are below long-run costs, as truck operators in low and middle-income countries had been investing substantially in new trucks. Operating costs may be overestimated or revenues under-reported.
Freight Tariffs. It is very difficult to present reliable quantitative data for transportation costs. Different studies present different freight values in inter-country comparisons offered by each study. Nevertheless, according to recent studies, Pakistan has the lowest rates, opposite to Colombia, West and Central Africa which have the highest rates.
Overloading. Overloading is very common and damages the roads, something regulatory reformers point to when arguing for regulations. Overloading is rooted in operators’ behavior, usually owner-driver operators. Imposing penalties and investing in expensive control systems is unlikely to deter overloading and is more likely to create more opportunities for the unofficial payments so common in these countries.
Empty Running. Empty running ranges from 12 percent to 30 percent in Pakistan, but is about 43 percent in China. Empty running is something to be avoided since it drives up costs.
Freight transport for development toolkit – road transport
33
Externalities. Trucks are involved in many accidents in low and middle-income countries. Safety has become an issue and has even been cited as a reason for closing the U.S. border to Mexican trucks in spite of NAFTA, which allows one truck/one driver from point of origin to point of destination.
Other industry trends are as follows:
Vested economic interests and institutional barriers impede economic efficiency and restrain competition.
Low freight rates and higher costs are eroding profit margins.
The hire and reward segment will keep growing. Consignor outsourcing, which turns fixed costs into variable costs, has helped this segment grow. The industry is benefiting in the form of higher vehicle utilization and better management of logistics operations. The sector is tending to rely more on the freight forwarding business, reflecting a desire to lower costs and improve logistics.
Employment in the industry will continue to grow once the global economy recovers. The industry will continue employing millions in low and middle- income countries—in contrast to the labor shortages in industrialized countries. As the industry becomes more efficient, however, fewer trucks will be on the road and fewer people will be employed unless growth in trade and the economy exceeds the benefits from efficiencies.
Overloading among small operators will continue to be a problem for regulators attempting to minimize road damage. Imposing penalties and investing in control systems is unlikely to deter overloading and is more likely to create more opportunities for the unofficial payments so common in these countries.
The share of articulated trucks in the total long distance road ton-kilometers will continue to rise. The growth in distance traveled and load carried by these trucks has grown faster than rigid trucks.
The industry’s technology is changing rapidly, especially the use of sophisticated data management to match truckload shipment. State-of-the-art trucks will gradually replace very old trucks. Competition and environmental awareness will further press this issue.
The regulatory environment must adapt to the global economy and the industry. The road freight industry is hampered by high costs and scarce capital. Governments should reform regulations and introduce appropriate tax incentives to help small operators acquire technologies to continue competing—otherwise the local economy will suffer from a massive exit of small operators.
Interest groups are fundamental to the industry’s future. The industry has many protectionist associations and unions. Such interest groups rarely aim to produce a socially optimum economic result in the same way as an “invisible hand”; thus, inefficiencies have persisted even in countries that have deregulated and interest groups have blocked the benefits of deregulation at regional and local level.
Externalities such as safety records, emissions, disease transmission, and affordable and safe accommodations for drivers on the road are becoming more important. To help ensure a bright future for the industry, these matters should be taken into account by planners at every level.

Freight transport for development toolkit – road transport
34
6.2 DIRECTIONS FOR FURTHER RESEARCH
This study has sought to provide background information for a major flagship study of freight transport covering many transport modes, and has raised a number of issues worthy of further investigation.
First, data on road freight transport is outdated and inconsistent, not only between sources but also over time. Here, a database that identifies, defines, collects, and updates specific data on road transport in low and middle-income countries would be very helpful and assure consistency and continuity in reporting. One model to consider is the Global Trade Analysis Project. GTAP “enlists” volunteers in “member” countries to generate economic data and in return provides access to the model and its database (for transport this might be called the Global Transportation Analysis Project).
Second, technological changes, proliferating trade agreements, and e-commerce present numerous challenges for the industry. Challenges, however, present opportunities, particularly for integrating services across the industry. This aspect needs to be investigated.
Third, owner-drivers and small operators who make up the bulk of the industry in low and middle-income countries are financially stressed. A solid analysis providing the latest information on this important segment of the industry would be very useful for policymakers seeking to alleviate financial stress in the industry.
Freight transport for development toolkit – road transport
35
7 BIBLIOGRAPHY
Aschenaki, B. 2004. Transport Costs in Ethiopia: an Impediment to Exports? Background paper. World Bank. March.
Bain, J. 1968. Industrial Organization. 2nd edition, New York: John Wiley& Sons, Inc.
Bang, K.L. 1994. Indonesian Highway Capacity Manual Project. Phase 2: Interurban roads, Ministry of Public Works and Sweroad, Bandung.
Bansal, A., I. Chatterton, A. Durrani, E. Gurenko, S. Thomas, Z. Liu, and G. Tharakan. 2005 India Road Transport Efficiency. World Bank, Energy and Infrastructure Operations Division, Country Department II, South Asia Regional Office, May.
Blasgen, R., 2008. Supply Chain Quarterly. November.
Booney, A. 1992. More than Just Cheap Mexican Labor. American Shipper. June.
De Castro, C. 1996. Trade and Transport Facilitation, review of current issues and operational experience. Sub-Saharan Africa Transport Policy Program. SSATP Working Paper No. 27 A Joint World Bank/UNCTAD publication, June.
De la Mora, L.M. 2000 Embassy of Mexico, SECOFI-NAFTA Counselor, interview, Washington, D.C. May 17.
Dutz, M., A. Hayri, and P. Ibarra. Regulatory Reform, Competition, and Innovation: A Case Study of the Mexican Road Freight Industry. World Bank.
Dutz, M. 2005. Road Freight Logistics, Competition and Innovation: Downstream Benefits and Policy Implications. World Bank Policy Research Working Paper 3768, November.
Foster, T. and Amstrong, R. 2008. Transportation and Logistics. Plains, trains and 3PLs?
Francois and Londoño-Kent. 2004. Measuring Border Crossing Costs and their Impact of Trade Flows: The United States-Mexican Trucking Case. Scholarly Articles, Perdue University.
Guasch, J.L., J.G. Reis, J. Barbero, I. Sánchez, T. Yepes, A. Pacheco. 2005. Infraestructura Logistica y de Calidad para la Competitividad de Colombia. World Bank, Latin America and the Caribbean Region.
Haralambides, Londoño-Kent. 2004. Supply Chain Bottlenecks: Border Crossing Inefficiencies between Mexico and the United States. International Journal of Transport Economics, Vol. XXXI No 2, June.
Hide H., S.W. Abaynayaka, Sayeri and R.J. Wyatt. 1975. The Kenya Road Transport Cost Study: Research on Vehicle Operating Costs” TRRL Laboratory Report Bo. 672. Transport and Road Research Laboratory, Crowthorne.
Hine, J.L., A. Barton. 1995. The Scope for Improving the Efficiency of Road Freight Transport in China. 7th World Conference on Transport Research, Sidney, Australia, July.
Hine, J.L. and A.S. Chilver. 1991. Pakistan Road Freight Industry: An Overview. TRL Report No. 314, Transport and Road Research Laboratory, Crowthorne, Berkshire.
Freight transport for development toolkit – road transport
36
Hine, J.L. and A.S. Chilver. 1994. Pakistan Road Freight Industry: An Analysis of Tariffs, Revenues and Costs. TRRL Report No. 94, Transport and Road Research Laboratory, Crowthorne.
Hine, J.L., J.H. Ebden and P. Suan. 1997. A Comparison of Freight Transport Operations in Tanzania and Indonesia. TRRL Report No. 267, Transport and Road Research Laboratory, Crowthorne, Berkshire.
Hine, J.L., C. Rizet. 1993. A Comparison of the Costs and Productivity of Road Freight Transport in Africa and Pakistan. Transport Reviews, Vol. 13, No2. 2, 151-165.
Hine, J.L., C. Rizet. 1991. Halving Africa’s Freight Transport Costs: Could it be Done? International Symposium Transport and Communications in Africa, Brussels.
Humayun, S.M. 2003. Trucking Industry of Pakistan. Pegasus International, Lahore, Pakistan, for the World Bank.
Kneafsey, J.T. 1974. The Economics of the Transportation Firm. Massachusetts Institute of Technology.
Londoño-Kent, M.P. 2007. Road Freight Transport Industry in Low and Middle-Income Countries. Draft Working Paper submitted to John Hine, World Bank, June 21.
Londoño-Kent, M.P. 2006. Institutional Arrangements that Affect Free Trade Agreements: Economic Rationality Versus Interest Groups. Erasmus Research Institute of Management, ERIM Ph.D. Series Research in Management 78.
Majeeda. 1980. Highway Speed Survey. NTRC Report No 51, National Transport Research Centre, Islamabad.
Ogunsanya, A. 2006. Road Freight Transport in Nigeria. Draft submitted to Christopher Willoughby, World Bank, January.
Ojala, L. (2009), Interview road freight industry in former Soviet Union Countries, Washington D.C. May 8.
Rojas, M. 2009. Director of International Affairs for the American Trucking Association, interview, Alexandria, VA, May 7.
Rogers and Smith. 2001. Border Economy. Federal Reserve Bank of Dallas.
Serebriski, T. 2009, Interview, World Bank, Latin American Region, interview May 18.
Thomas, S. 2006. Trade and Transport Facilitation in Asia: Systems in Transition. The World Bank, Energy and Infrastructure Operations Unit, South Asia Region.
Vernon, R. 1970. Organization as a Scale Factor in the Growth of Firms. Industrial Organization and Economic Development. Boston: Houghton-Mifflin Co.
TERA International Group, Inc. 2005. Malawi Transport Cost Study. Sterling VA.
Yu Yongcheng. 1990. Road Freight Transfer Station. Selected papers on highway and Transportation Research, Research Institute of Highways, Beijing.
World Bank. 1995. World Development Report. Washington D.C.
Freight transport for development toolkit – road transport
37
World Bank. 2006. World Development Indicators (www.worldbank.org)
Yeats, A.J. 1989. Do African Countries Pay More for Imports? Yes. Policy, Planning and Research Working Paper No. WPS 265. The World Bank, Washington D.C.
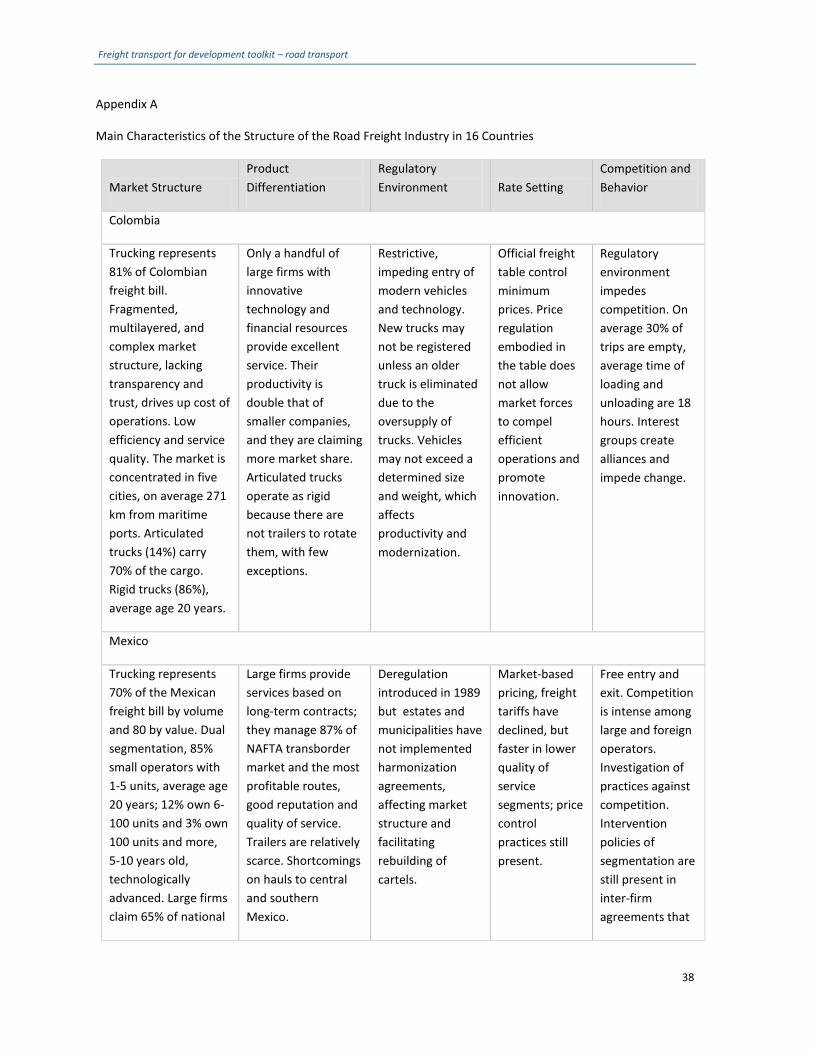
Freight transport for development toolkit – road transport
38
Appendix A
Main Characteristics of the Structure of the Road Freight Industry in 16 Countries
Market Structure Product Differentiation
Regulatory Environment Rate Setting
Competition and Behavior
Colombia
Trucking represents 81% of Colombian freight bill. Fragmented, multilayered, and complex market structure, lacking transparency and trust, drives up cost of operations. Low efficiency and service quality. The market is concentrated in five cities, on average 271 km from maritime ports. Articulated trucks (14%) carry 70% of the cargo. Rigid trucks (86%), average age 20 years.
Only a handful of large firms with innovative technology and financial resources provide excellent service. Their productivity is double that of smaller companies, and they are claiming more market share. Articulated trucks operate as rigid because there are not trailers to rotate them, with few exceptions.
Restrictive, impeding entry of modern vehicles and technology. New trucks may not be registered unless an older truck is eliminated due to the oversupply of trucks. Vehicles may not exceed a determined size and weight, which affects productivity and modernization.
Official freight table control minimum prices. Price regulation embodied in the table does not allow market forces to compel efficient operations and promote innovation.
Regulatory environment impedes competition. On average 30% of trips are empty, average time of loading and unloading are 18 hours. Interest groups create alliances and impede change.
Mexico
Trucking represents 70% of the Mexican freight bill by volume and 80 by value. Dual segmentation, 85% small operators with 1-5 units, average age 20 years; 12% own 6-100 units and 3% own 100 units and more, 5-10 years old, technologically advanced. Large firms claim 65% of national
Large firms provide services based on long-term contracts; they manage 87% of NAFTA transborder market and the most profitable routes, good reputation and quality of service. Trailers are relatively scarce. Shortcomings on hauls to central and southern Mexico.
Deregulation introduced in 1989 but estates and municipalities have not implemented harmonization agreements, affecting market structure and facilitating rebuilding of cartels.
Market-based pricing, freight tariffs have declined, but faster in lower quality of service segments; price control practices still present.
Free entry and exit. Competition is intense among large and foreign operators. Investigation of practices against competition. Intervention policies of segmentation are still present in inter-firm agreements that
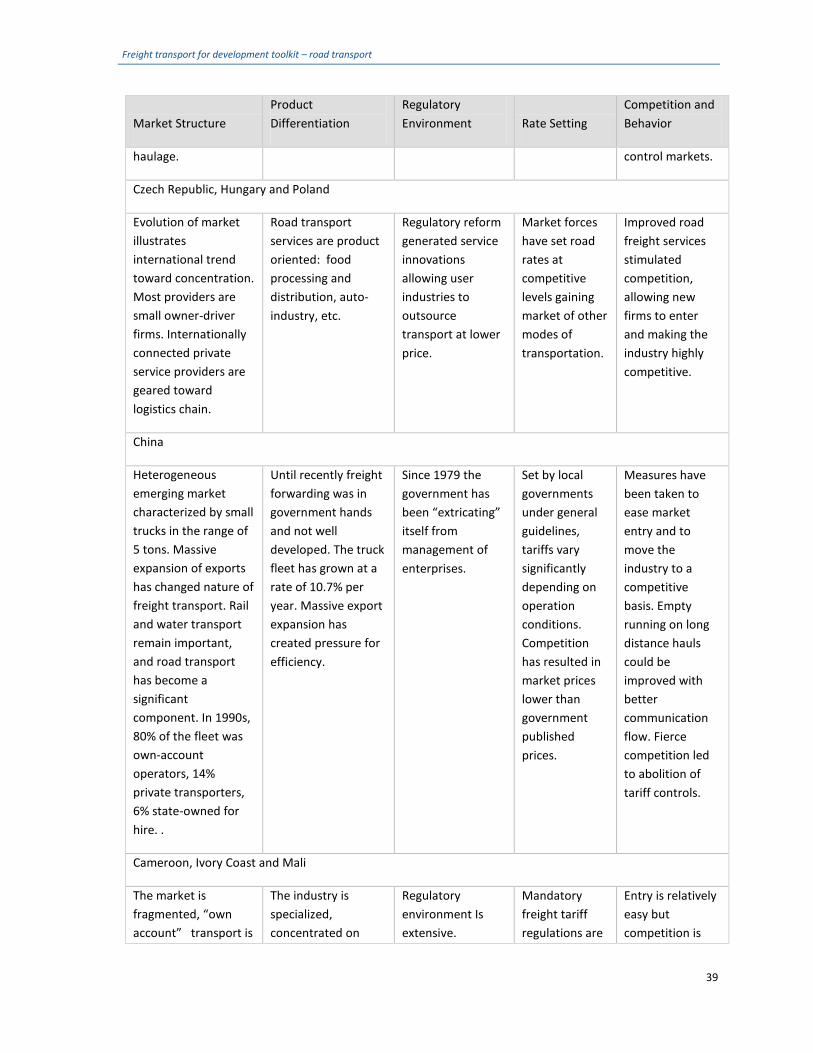
Freight transport for development toolkit – road transport
39
Market Structure Product Differentiation
Regulatory Environment Rate Setting
Competition and Behavior
haulage. control markets.
Czech Republic, Hungary and Poland
Evolution of market illustrates international trend toward concentration. Most providers are small owner-driver firms. Internationally connected private service providers are geared toward logistics chain.
Road transport services are product oriented: food processing and distribution, auto-industry, etc.
Regulatory reform generated service innovations allowing user industries to outsource transport at lower price.
Market forces have set road rates at competitive levels gaining market of other modes of transportation.
Improved road freight services stimulated competition, allowing new firms to enter and making the industry highly competitive.
China
Heterogeneous emerging market characterized by small trucks in the range of 5 tons. Massive expansion of exports has changed nature of freight transport. Rail and water transport remain important, and road transport has become a significant component. In 1990s, 80% of the fleet was own-account operators, 14% private transporters, 6% state-owned for hire. .
Until recently freight forwarding was in government hands and not well developed. The truck fleet has grown at a rate of 10.7% per year. Massive export expansion has created pressure for efficiency.
Since 1979 the government has been “extricating” itself from management of enterprises.
Set by local governments under general guidelines, tariffs vary significantly depending on operation conditions. Competition has resulted in market prices lower than government published prices.
Measures have been taken to ease market entry and to move the industry to a competitive basis. Empty running on long distance hauls could be improved with better communication flow. Fierce competition led to abolition of tariff controls.
Cameroon, Ivory Coast and Mali
The market is fragmented, “own account” transport is
The industry is specialized, concentrated on
Regulatory environment Is extensive.
Mandatory freight tariff regulations are
Entry is relatively easy but competition is
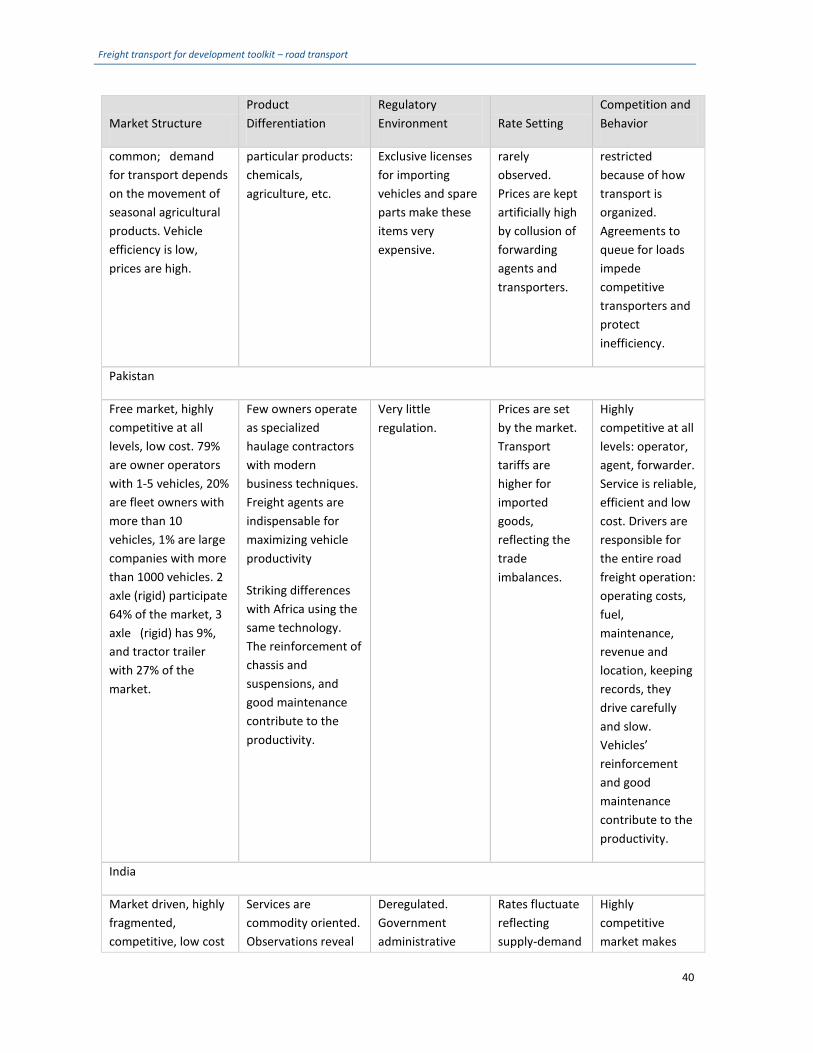
Freight transport for development toolkit – road transport
40
Market Structure Product Differentiation
Regulatory Environment Rate Setting
Competition and Behavior
common; demand for transport depends on the movement of seasonal agricultural products. Vehicle efficiency is low, prices are high.
particular products: chemicals, agriculture, etc.
Exclusive licenses for importing vehicles and spare parts make these items very expensive.
rarely observed. Prices are kept artificially high by collusion of forwarding agents and transporters.
restricted because of how transport is organized. Agreements to queue for loads impede competitive transporters and protect inefficiency.
Pakistan
Free market, highly competitive at all levels, low cost. 79% are owner operators with 1-5 vehicles, 20% are fleet owners with more than 10 vehicles, 1% are large companies with more than 1000 vehicles. 2 axle (rigid) participate 64% of the market, 3 axle (rigid) has 9%, and tractor trailer with 27% of the market.
Few owners operate as specialized haulage contractors with modern business techniques. Freight agents are indispensable for maximizing vehicle productivity
Striking differences with Africa using the same technology. The reinforcement of chassis and suspensions, and good maintenance contribute to the productivity.
Very little regulation.
Prices are set by the market. Transport tariffs are higher for imported goods, reflecting the trade imbalances.
Highly competitive at all levels: operator, agent, forwarder. Service is reliable, efficient and low cost. Drivers are responsible for the entire road freight operation: operating costs, fuel, maintenance, revenue and location, keeping records, they drive carefully and slow. Vehicles’ reinforcement and good maintenance contribute to the productivity.
India
Market driven, highly fragmented, competitive, low cost
Services are commodity oriented. Observations reveal
Deregulated. Government administrative
Rates fluctuate reflecting supply-demand
Highly competitive market makes
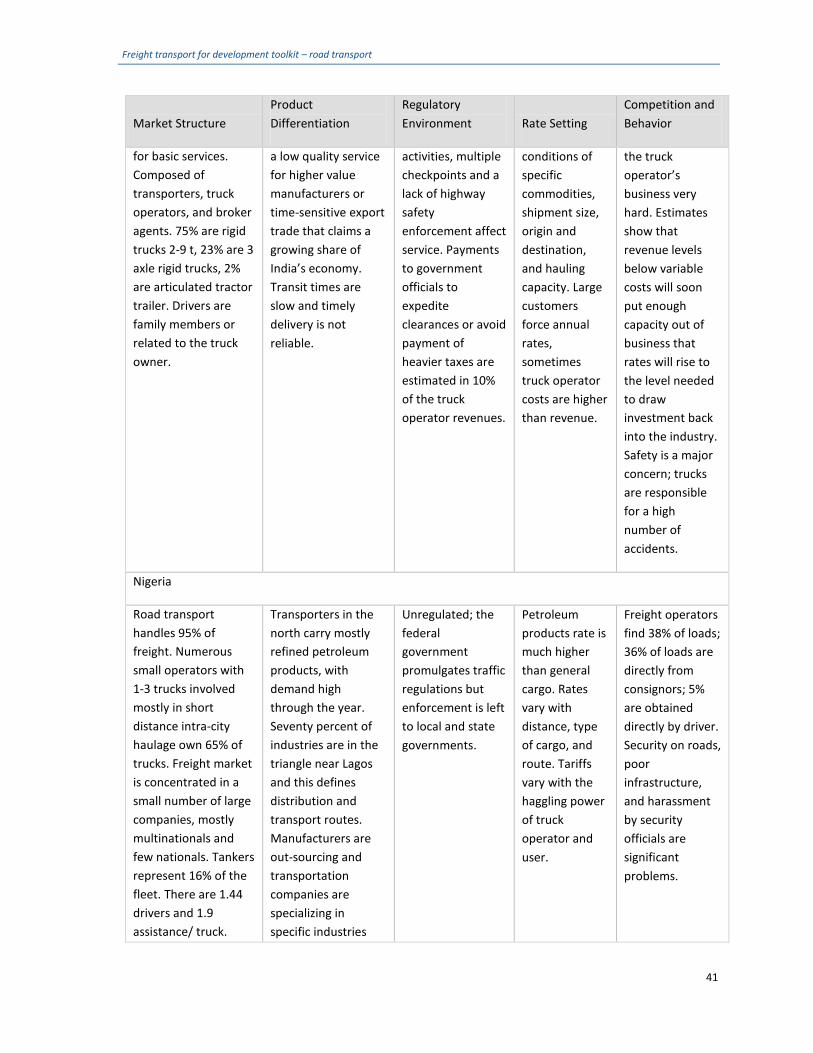
Freight transport for development toolkit – road transport
41
Market Structure Product Differentiation
Regulatory Environment Rate Setting
Competition and Behavior
for basic services. Composed of transporters, truck operators, and broker agents. 75% are rigid trucks 2-9 t, 23% are 3 axle rigid trucks, 2% are articulated tractor trailer. Drivers are family members or related to the truck owner.
a low quality service for higher value manufacturers or time-sensitive export trade that claims a growing share of India’s economy. Transit times are slow and timely delivery is not reliable.
activities, multiple checkpoints and a lack of highway safety enforcement affect service. Payments to government officials to expedite clearances or avoid payment of heavier taxes are estimated in 10% of the truck operator revenues.
conditions of specific commodities, shipment size, origin and destination, and hauling capacity. Large customers force annual rates, sometimes truck operator costs are higher than revenue.
the truck operator’s business very hard. Estimates show that revenue levels below variable costs will soon put enough capacity out of business that rates will rise to the level needed to draw investment back into the industry. Safety is a major concern; trucks are responsible for a high number of accidents.
Nigeria
Road transport handles 95% of freight. Numerous small operators with 1-3 trucks involved mostly in short distance intra-city haulage own 65% of trucks. Freight market is concentrated in a small number of large companies, mostly multinationals and few nationals. Tankers represent 16% of the fleet. There are 1.44 drivers and 1.9 assistance/ truck.
Transporters in the north carry mostly refined petroleum products, with demand high through the year. Seventy percent of industries are in the triangle near Lagos and this defines distribution and transport routes. Manufacturers are out-sourcing and transportation companies are specializing in specific industries
Unregulated; the federal government promulgates traffic regulations but enforcement is left to local and state governments.
Petroleum products rate is much higher than general cargo. Rates vary with distance, type of cargo, and route. Tariffs vary with the haggling power of truck operator and user.
Freight operators find 38% of loads; 36% of loads are directly from consignors; 5% are obtained directly by driver. Security on roads, poor infrastructure, and harassment by security officials are significant problems.
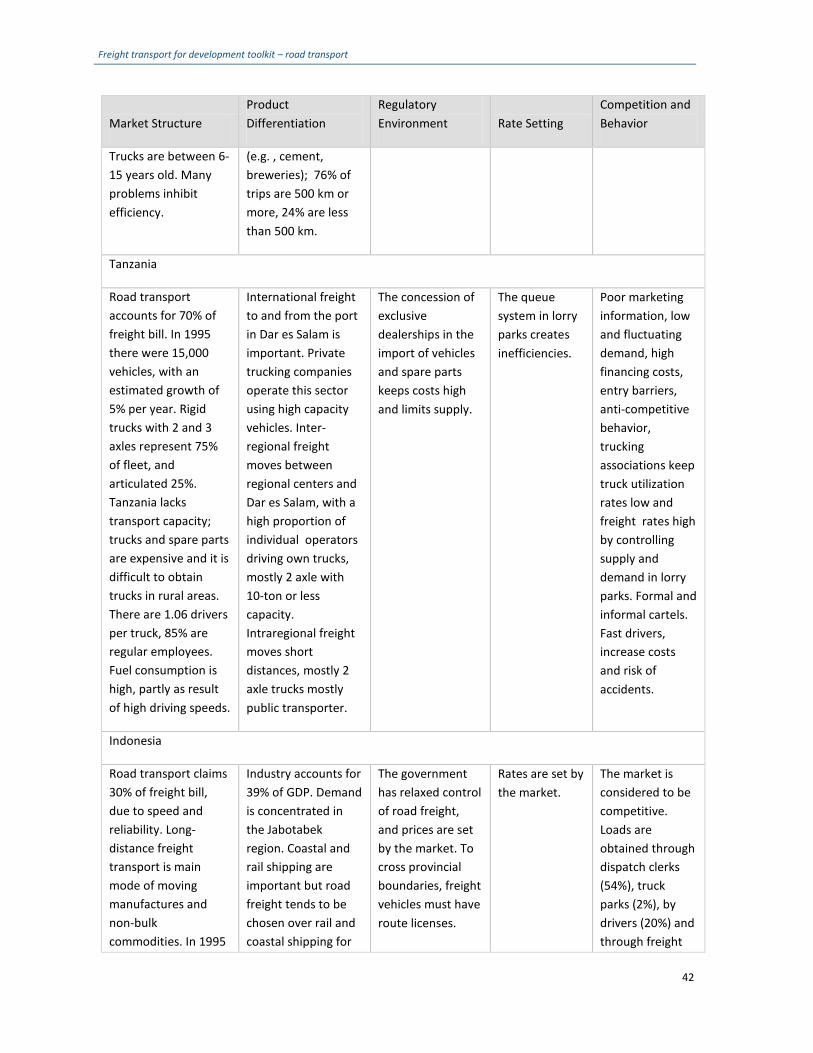
Freight transport for development toolkit – road transport
42
Market Structure Product Differentiation
Regulatory Environment Rate Setting
Competition and Behavior
Trucks are between 6-15 years old. Many problems inhibit efficiency.
(e.g. , cement, breweries); 76% of trips are 500 km or more, 24% are less than 500 km.
Tanzania
Road transport accounts for 70% of freight bill. In 1995 there were 15,000 vehicles, with an estimated growth of 5% per year. Rigid trucks with 2 and 3 axles represent 75% of fleet, and articulated 25%. Tanzania lacks transport capacity; trucks and spare parts are expensive and it is difficult to obtain trucks in rural areas. There are 1.06 drivers per truck, 85% are regular employees. Fuel consumption is high, partly as result of high driving speeds.
International freight to and from the port in Dar es Salam is important. Private trucking companies operate this sector using high capacity vehicles. Inter-regional freight moves between regional centers and Dar es Salam, with a high proportion of individual operators driving own trucks, mostly 2 axle with 10-ton or less capacity. Intraregional freight moves short distances, mostly 2 axle trucks mostly public transporter.
The concession of exclusive dealerships in the import of vehicles and spare parts keeps costs high and limits supply.
The queue system in lorry parks creates inefficiencies.
Poor marketing information, low and fluctuating demand, high financing costs, entry barriers, anti-competitive behavior, trucking associations keep truck utilization rates low and freight rates high by controlling supply and demand in lorry parks. Formal and informal cartels. Fast drivers, increase costs and risk of accidents.
Indonesia
Road transport claims 30% of freight bill, due to speed and reliability. Long-distance freight transport is main mode of moving manufactures and non-bulk commodities. In 1995
Industry accounts for 39% of GDP. Demand is concentrated in the Jabotabek region. Coastal and rail shipping are important but road freight tends to be chosen over rail and coastal shipping for
The government has relaxed control of road freight, and prices are set by the market. To cross provincial boundaries, freight vehicles must have route licenses.
Rates are set by the market.
The market is considered to be competitive. Loads are obtained through dispatch clerks (54%), truck parks (2%), by drivers (20%) and through freight
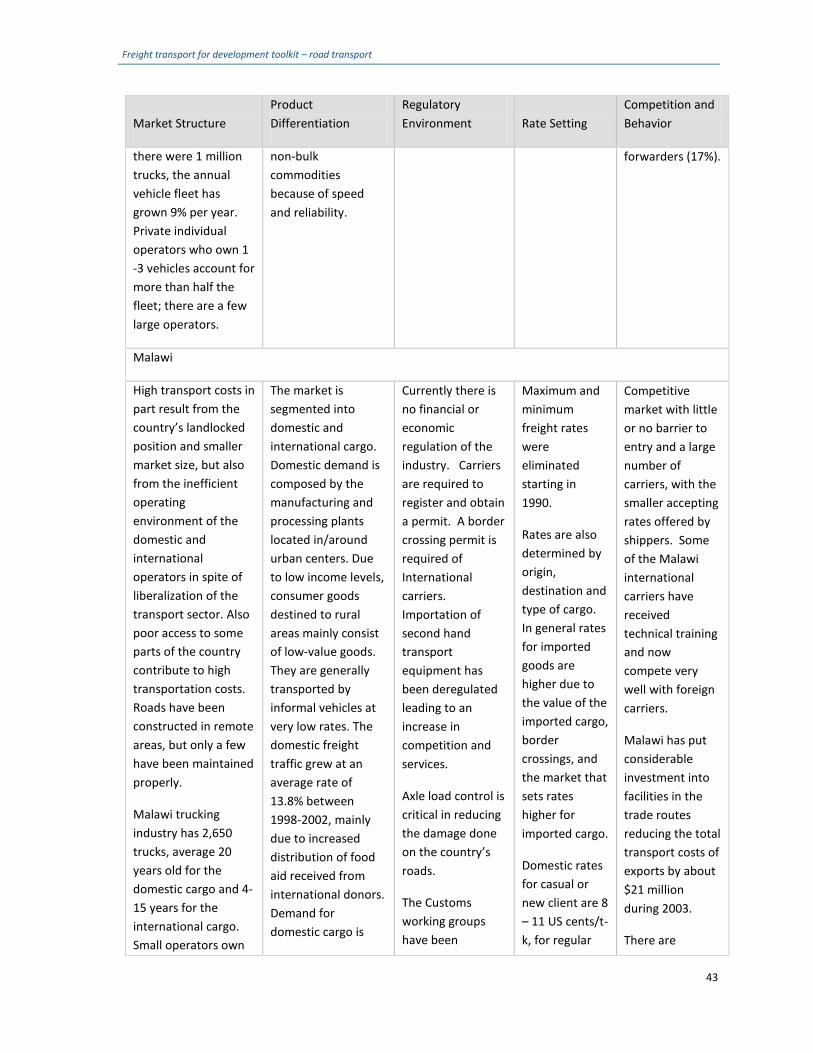
Freight transport for development toolkit – road transport
43
Market Structure Product Differentiation
Regulatory Environment Rate Setting
Competition and Behavior
there were 1 million trucks, the annual vehicle fleet has grown 9% per year. Private individual operators who own 1 -3 vehicles account for more than half the fleet; there are a few large operators.
non-bulk commodities because of speed and reliability.
forwarders (17%).
Malawi
High transport costs in part result from the country’s landlocked position and smaller market size, but also from the inefficient operating environment of the domestic and international operators in spite of liberalization of the transport sector. Also poor access to some parts of the country contribute to high transportation costs. Roads have been constructed in remote areas, but only a few have been maintained properly.
Malawi trucking industry has 2,650 trucks, average 20 years old for the domestic cargo and 4-15 years for the international cargo. Small operators own
The market is segmented into domestic and international cargo. Domestic demand is composed by the manufacturing and processing plants located in/around urban centers. Due to low income levels, consumer goods destined to rural areas mainly consist of low-value goods. They are generally transported by informal vehicles at very low rates. The domestic freight traffic grew at an average rate of 13.8% between 1998-2002, mainly due to increased distribution of food aid received from international donors. Demand for domestic cargo is
Currently there is no financial or economic regulation of the industry. Carriers are required to register and obtain a permit. A border crossing permit is required of International carriers. Importation of second hand transport equipment has been deregulated leading to an increase in competition and services.
Axle load control is critical in reducing the damage done on the country’s roads.
The Customs working groups have been
Maximum and minimum freight rates were eliminated starting in 1990.
Rates are also determined by origin, destination and type of cargo. In general rates for imported goods are higher due to the value of the imported cargo, border crossings, and the market that sets rates higher for imported cargo.
Domestic rates for casual or new client are 8 – 11 US cents/t-k, for regular
Competitive market with little or no barrier to entry and a large number of carriers, with the smaller accepting rates offered by shippers. Some of the Malawi international carriers have received technical training and now compete very well with foreign carriers.
Malawi has put considerable investment into facilities in the trade routes reducing the total transport costs of exports by about $21 million during 2003.
There are
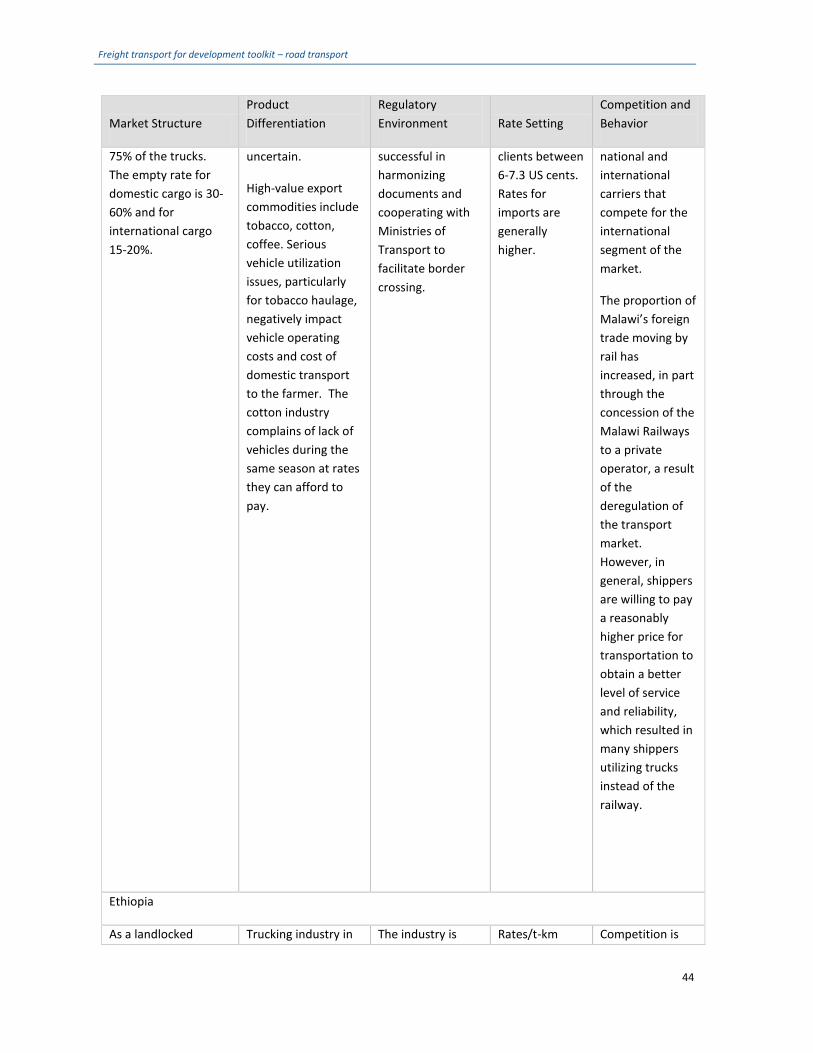
Freight transport for development toolkit – road transport
44
Market Structure Product Differentiation
Regulatory Environment Rate Setting
Competition and Behavior
75% of the trucks. The empty rate for domestic cargo is 30-60% and for international cargo 15-20%.
uncertain.
High-value export commodities include tobacco, cotton, coffee. Serious vehicle utilization issues, particularly for tobacco haulage, negatively impact vehicle operating costs and cost of domestic transport to the farmer. The cotton industry complains of lack of vehicles during the same season at rates they can afford to pay.
successful in harmonizing documents and cooperating with Ministries of Transport to facilitate border crossing.
clients between 6-7.3 US cents. Rates for imports are generally higher.
national and international carriers that compete for the international segment of the market.
The proportion of Malawi’s foreign trade moving by rail has increased, in part through the concession of the Malawi Railways to a private operator, a result of the deregulation of the transport market. However, in general, shippers are willing to pay a reasonably higher price for transportation to obtain a better level of service and reliability, which resulted in many shippers utilizing trucks instead of the railway.
Ethiopia
As a landlocked Trucking industry in The industry is Rates/t-km Competition is
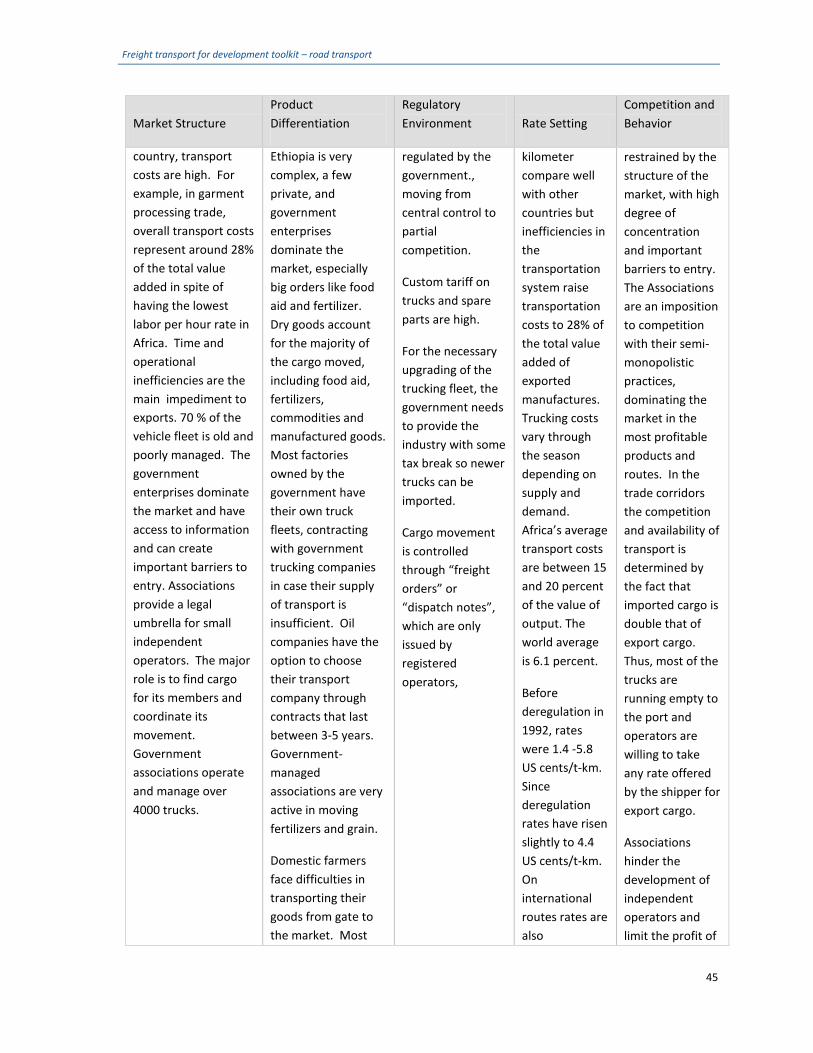
Freight transport for development toolkit – road transport
45
Market Structure Product Differentiation
Regulatory Environment Rate Setting
Competition and Behavior
country, transport costs are high. For example, in garment processing trade, overall transport costs represent around 28% of the total value added in spite of having the lowest labor per hour rate in Africa. Time and operational inefficiencies are the main impediment to exports. 70 % of the vehicle fleet is old and poorly managed. The government enterprises dominate the market and have access to information and can create important barriers to entry. Associations provide a legal umbrella for small independent operators. The major role is to find cargo for its members and coordinate its movement. Government associations operate and manage over 4000 trucks.
Ethiopia is very complex, a few private, and government enterprises dominate the market, especially big orders like food aid and fertilizer. Dry goods account for the majority of the cargo moved, including food aid, fertilizers, commodities and manufactured goods. Most factories owned by the government have their own truck fleets, contracting with government trucking companies in case their supply of transport is insufficient. Oil companies have the option to choose their transport company through contracts that last between 3-5 years. Government-managed associations are very active in moving fertilizers and grain.
Domestic farmers face difficulties in transporting their goods from gate to the market. Most
regulated by the government., moving from central control to partial competition.
Custom tariff on trucks and spare parts are high.
For the necessary upgrading of the trucking fleet, the government needs to provide the industry with some tax break so newer trucks can be imported.
Cargo movement is controlled through “freight orders” or “dispatch notes”, which are only issued by registered operators,
kilometer compare well with other countries but inefficiencies in the transportation system raise transportation costs to 28% of the total value added of exported manufactures. Trucking costs vary through the season depending on supply and demand. Africa’s average transport costs are between 15 and 20 percent of the value of output. The world average is 6.1 percent.
Before deregulation in 1992, rates were 1.4 -5.8 US cents/t-km. Since deregulation rates have risen slightly to 4.4 US cents/t-km. On international routes rates are also
restrained by the structure of the market, with high degree of concentration and important barriers to entry. The Associations are an imposition to competition with their semi-monopolistic practices, dominating the market in the most profitable products and routes. In the trade corridors the competition and availability of transport is determined by the fact that imported cargo is double that of export cargo. Thus, most of the trucks are running empty to the port and operators are willing to take any rate offered by the shipper for export cargo.
Associations hinder the development of independent operators and limit the profit of
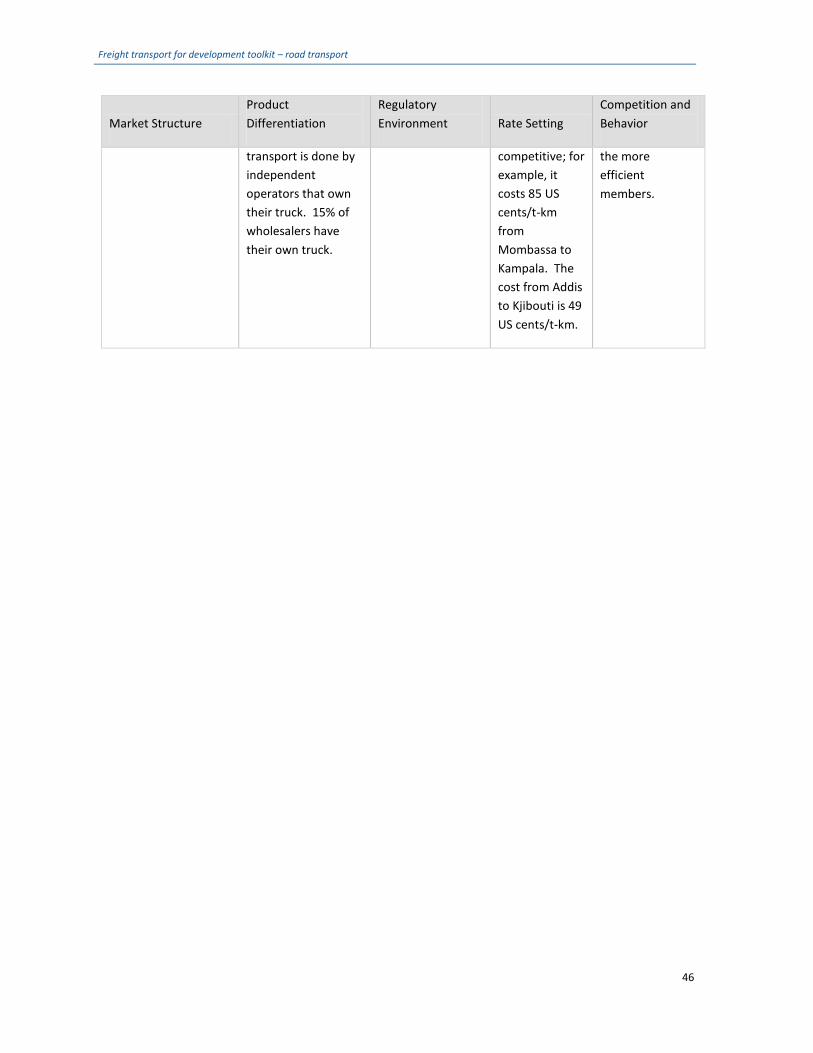
Freight transport for development toolkit – road transport
46
Market Structure Product Differentiation
Regulatory Environment Rate Setting
Competition and Behavior
transport is done by independent operators that own their truck. 15% of wholesalers have their own truck.
competitive; for example, it costs 85 US cents/t-km from Mombassa to Kampala. The cost from Addis to Kjibouti is 49 US cents/t-km.
the more efficient members.
47
Transport Division
Energy, Transport and
Water Department
The World Bank
1818 H Street NW
Washington DC 20433
USA
www.worldbank.org/TRS