franzluebbers_2010 - achieving soil organic carbon sequestration with conservation agricult
TRANSCRIPT
SSSAJ: Volume 74: Number 2 • March–April 2010
347
Soil Sci. Soc. Am. J. 74:347–357Published online 8 Jan. 2010doi:10.2136/sssaj2009.0079Received 26 Feb. 2009. *Corresponding author ([email protected]).© Soil Science Society of America, 677 S. Segoe Rd., Madison WI 53711 USAAll rights reserved. No part of this periodical may be reproduced or transmitted in any form or by any means, electronic or mechanical, including photocopying, recording, or any information storage and retrieval system, without permission in writing from the publisher. Permission for printing and for reprinting the material contained herein has been obtained by the publisher.
Achieving Soil Organic Carbon Sequestration with Conservation Agricultural Systems
in the Southeastern United States
Soil Carbon Sequestration & Greenhouse Gas Mitigation
Soil contains a vast reservoir of terrestrial C as organic matter (1500 Pg), which is both a source and sink of greenhouse gases (Schlesinger and Andrews, 2000).
Agricultural land occupies 40% of the land area in the United States (National Agricultural Statistics Service, 2007) and therefore controls a signifi cant amount of the photosynthetic sink of CO2 from the atmosphere, as well as the respiration source of CO2 from plant biomass and soil organisms. Th e C cycle can be either positively or negatively aff ected by agricultural activities, depending on manage-ment choices.
Agricultural soils provide a number of ecosystem services vital to the hu-man population (Lal, 2008). Two key services among many are (i) production of food, feed, fi ber, and fuel, and (ii) C sequestration and moderation of the climate. Unfortunately, historical exploitation of agricultural soils with unsustainable prac-tices has led to degraded soils in need of restoration (Lal, 2004). Soils of the south-eastern United States are a good example of the land trauma that occurred follow-ing pioneer cultivation and expansion (Triplett and Dick, 2008), which led to soil fertility decline, soil structural degradation, and vast removal of soil from the land-scape via erosion. For example, the average soil loss on the 17 Mha of land in the Southern Piedmont Major Land Resource Area has been nearly 20 cm since 1700
Alan J. Franzluebbers*USDA-ARS1420 Experiment Station Rd.Watkinsville, GA 30677
Conservation management of degraded land has the potential to build soil fertility, restore soil functions, and mitigate greenhouse gas emissions as a consequence of surface soil organic matter accumulation. Literature from the southeastern United States was reviewed and synthesized to: (i) quantitatively evaluate the magnitude and rate of soil organic C (SOC) sequestration with conservation agricultural management; (ii) evaluate how conservation management aff ects surface SOC accumulation and its implications on ecosystem services; and (iii) recommend practical soil sampling strategies based on spatial and temporal issues to improve the detection of statistically signifi cant SOC sequestration. Soil organic C sequestration was 0.45 ± 0.04 Mg C ha−1 yr−1 (mean ± standard error, n = 147, 20 ± 1 cm depth, 11 ± 1 yr) with conservation tillage compared with conventional tillage cropland. Establishment of perennial pastures sequestered 0.84 ± 0.11 Mg C ha−1 yr−1 (n = 35, 25 ± 2 cm depth, 17 ± 1 yr). Stratifi cation of SOC with depth was common under conservation agricultural management and appears to be integrally linked to abatement of soil erosion, improvement in water quality, and SOC sequestration. Sampling of conservation management systems should ideally occur repeatedly with time in controlled and replicated experiments, but there is also an urgent need for chronosequence and paired-fi eld surveys of SOC on working farms in the region to validate and expand the scope of inference of experimental results. Landowners in the southeastern United States have great potential to restore soil fertility and mitigate greenhouse gas emissions with the adoption of and improvement in conservation agricultural systems (e.g., continuous no-till, high-residue crop rotations, high organic matter inputs).
Abbreviations: NT, no-till; SOC, soil organic carbon.
Published March, 2010
348 SSSAJ: Volume 74: Number 2 • March–April 2010
(Trimble, 1974). Restoration of soils in the southeastern United States has been possible with the reintroduction of planted for-ests, perennial pastures, and conservation tillage management of crops to much of the land (Hendrickson et al., 1963; Bruce et al., 1995; Richter et al., 1999; Franzluebbers, 2005).
Th e southeastern United States is a region of high potential productivity based on favorable climatic conditions, e.g., mild winters, hot summers, and plentiful precipitation. Soil acidity, low water-holding capacity, and low nutrient-supplying capacity are conditions that limit productivity but that can be overcome with management to increase soil organic matter. Recent reviews of available data established the value of conservation agricul-tural management systems to sequester SOC in the southeastern United States (Franzluebbers, 2005; Causarano et al., 2006).
Th e objectives of this review of literature in the southeast-ern United States are to: (i) assess whether recently reported data would aff ect the estimated SOC sequestration with conservation agricultural management in the southeastern United States com-pared with a previous review (Franzluebbers, 2005); (ii) summa-rize SOC depth distributions, how they are aff ected by manage-ment, and what their implications on ecosystem services might be; and (iii) address spatial and temporal issues of soil sampling frequency and intensity to obtain more robust estimates of SOC sequestration with conservation agricultural management.
SOIL ORGANIC CARBON SEQUESTRATION WITH CONSERVATION AGRICULTURAL MANAGEMENTConservation Tillage
Since the review of Franzluebbers (2005), an additional 51 comparisons of SOC on conventional- and conservation-tillage cropland in the southeastern United States have been reported (Table 1). Characteristics of these recent data (Table 1) did not vary signifi cantly from those reported earlier (Franzluebbers, 2005), e.g., the duration of the tillage management system was 11 ± 1 yr (mean ± standard error, n = 51) compared with 10 ± 1 yr (n = 96), the soil sampling depth was 21 ± 1 cm compared with 19 ± 1 cm, and the SOC sequestration rate was 0.50 ± 0.09 Mg C ha−1 yr−1 compared with 0.42 ± 0.05 Mg C ha−1 yr−1. Th erefore all data were pooled to create a regional summary of SOC sequestration with conservation tillage.
From 147 comparisons across eight states, SOC sequestra-tion with conservation tillage compared with conventional till-age was 0.45 ± 0.04 Mg C ha−1 yr−1 (mean ± standard error) in a sampling depth of 20 ± 1 cm and experiment duration of 11 ± 1 yr (Table 2). Th e mean value increased only 0.03 Mg C ha−1 yr−1 from that reported earlier (Franzluebbers, 2005), so there was consistency in the central tendency. Data were sorted by states to test if there were diff erences (t-test) due to general characteris-tics (e.g., climate, soils, or cultural practices) unique to each state. Some experimental diff erences occurred among states, e.g., the duration of experimentation was greater in South Carolina than in Georgia or North Carolina (P ≤ 0.001) and the soil sampling depth was greater in Maryland than in Mississippi or North Carolina
(P ≤ 0.001). Th e yearly diff erence in SOC between tillage systems was signifi cantly lower in Texas (0.36 ± 0.04 Mg C ha−1 yr−1) than in Alabama (0.67 ± 0.11 Mg C ha−1 yr−1) (P = 0.01) or Georgia (0.58 ± 0.13 Mg C ha−1 yr−1) (P = 0.08); however, it was greater in Texas than in Maryland (0.16 ± 0.11 Mg C ha−1 yr−1) (P = 0.04). It is possible that the drier climate in Texas (625 mm in Weslaco to 993 mm in College Station) may have limited the SOC seques-tration rate with conservation tillage compared with the wetter climates in Alabama (1391 mm in Belle Mina to 1652 mm in Brewton) and Georgia (1146 mm in Fort Valley to 1308 mm in Griffi n). Similarly, the colder climate in Maryland (~13°C) may have limited the SOC sequestration rate with conservation till-age compared with the warmer climates in Alabama (11.9°C in Crossville to 18.2°C in Brewton) and Georgia (16.0°C in Griffi n to 18.9°C in Fort Valley). Th ese climate-dependent responses were consistent with an earlier review of how conservation tillage aff ected SOC sequestration rates across the United States and Canada (Franzluebbers and Steiner, 2002). Th e lack of statistical diff erence in mean characteristics among other states was prob-ably as dependent on the low number of comparisons within states as on the actual levels. Observations in Alabama, Georgia, and Texas accounted for 66% of the data. Th ere is a need for more SOC data comparisons between conventional and conser-vation tillage in others states of the region.
Th e large variation in the yearly diff erence in SOC between tillage systems (i.e., the SOC sequestration rate, mean ± stan-dard deviation of 0.45 ± 0.52 Mg C ha−1 yr−1) was probably due to several widely varying experimental factors, including the length of experimentation, the size of plots, the number and frequency of soil samples, the depth of sampling, and the type of analytical approach, among others. A large, regionally coor-dinated study of SOC under conventional- and conservation-tillage systems would be useful to limit potential analytical varia-tions. In addition, crop management variables were also widely diff erent, including crop types, crop rotations, fertilization type, amount, and frequency, and pest pressures and control measures. Th ere is still a need to conduct many more studies in the region to understand how these cultural variables might aff ect the SOC sequestration rate.
Th e overall mean SOC sequestration rate across experimen-tal and cultural diff erences represents a broad perspective for the region as a whole. Similar to that reported earlier (Franzluebbers, 2005), the SOC sequestration rate in studies with cover crops (0.55 ± 0.06 Mg C ha−1 yr−1, n = 87) was greater (P < 0.01) than without cover crops (0.30 ± 0.05 Mg C ha−1 yr−1, n = 60). Clearly, site-specifi c and cultural-specifi c eff ects on the SOC se-questration rate need to be better understood so that the process of sequestration can be manipulated for greater benefi t to farm-ers and society.
Since there were a relatively large number of compari-sons of SOC between conventional- and conservation-tillage systems in the region (n = 147), a density distribution was constructed to assess the likelihood of achieving particu-lar SOC sequestration rates (Fig. 1). Th e SOC sequestration

SSSAJ: Volume 74: Number 2 • March–April 2010 349
Table 1. Soil organic C (SOC) and associated site characteristics from recent studies investigating tillage systems (CT, conventional tillage; NT, no-till) in the southeastern United States. These data are in addition to those reported earlier in Franzluebbers (2005).
Location Taxonomic classifi cationSoil
texture†Cropping system‡ Duration Depth
SOC under CT
SOC under NT
Reference
yr cm —— Mg ha−1 ——
Belle Mina, AL Typic Paleudult SiL CO/RY-CO-CN/RY (inorganic) 10 20 37.4 40.1 Sainju et al. (2008)
Bella Mina, AL Typic Paleudult SiL CO/RY-CO-CN/RY (poultry litter) 10 20 43.7 43.7 Sainju et al. (2008)
Belle Mina, AL Rhodic Paleudult SiL CO 9 6 7.2 8.4 Truman et al. (2003)
Headland, AL Plinthic Kandiudult LS CO/RG-PN/O 3 20 21.6 23.3 Siri-Prieto et al. (2007)
Shorter, AL Typic Paleudult LS CO/BO+RY-CN/WL+CC 2.5 30 23.5 26.2 Terra et al. (2005)
Shorter, AL Typic Paleudult LS CO/BO+RY-CN/L+CC (with manure) 2.5 30 29.1 32.6 Terra et al. (2005)
AL Coastal Plain Kandiudults–Haploxeralfs LS CO/RY-PN/RY 13.3 20 18.0 20.1 Causarano et al. (2008)
AL Piedmont Kanhapludults SCL CO 10 20 19.6 25.4 Causarano et al. (2008)
Bartow, GA Plinthic Kandiudult SL CO/RY 2 15 17.6 19.3 Sainju et al. (2007)
Tifton, GA Plinthic Kandiudult LS CO/RY-CO/RY-PN/RY 2 15 17.7 17.0 Sainju et al. (2007)
Fort Valley, GA Plinthic Paleudult SL CO-GS 7 30 21.4 24.2 Sainju et al. (2006)
Fort Valley, GA Plinthic Paleudult SL CO/RY-GS/RY 7 30 22.6 27.2 Sainju et al. (2006)
Fort Valley, GA Plinthic Paleudult SL CO/HV-GS/HV 7 30 23.1 26.7 Sainju et al. (2006)
Fort Valley, GA Plinthic Paleudult SL CO/RY+HV-GS/RY+HV 7 30 23.9 27.9 Sainju et al. (2006)
Watkinsville, GA Typic Kanhapludult SL CO/RY-CN/RY-ML/RY-GS/RY-SB/CC-CN/CC 7 20 27.1 32.7 Franzluebbers et al. (2007)
Watkinsville, GA Typic Kanhapludult SL GS/RY (ungrazed) 3 30 40.6 51.6 Franzluebbers and Stuedemann (2008)
Watkinsville, GA Typic Kanhapludult SL GS/RY (grazed) 3 30 46.5 49.5 Franzluebbers and Stuedemann (2008)
Watkinsville, GA Typic Kanhapludult SL WT/ML (ungrazed) 3 30 45.6 45.1 Franzluebbers and Stuedemann (2008)
Watkinsville, GA Typic Kanhapludult SL WT/ML (grazed) 3 30 42.8 46.6 Franzluebbers and Stuedemann (2008)
GA Coastal Plain Plinthic Kandiudults LS CO-PN/WT-SB/RY 15.3 20 16.7 21.5 Causarano et al. (2008)
GA Piedmont Kanhapludults SL GS/WT-SB-CO/O 8.3 20 26.7 27.5 Causarano et al. (2008)
Harmony, NC Typic Kanhapludult SCL-L CN (silage)/BL (silage) 7 20 33.5 36.6 Franzluebbers and Brock (2007)
Harmony, NC Typic Kanhapludult SCL-L CN (silage)/RY 7 20 33.5 33.1 Franzluebbers and Brock (2007)
Harmony, NC Typic Kanhapludult SCL-L CN (silage)/BL-SG/RY 7 20 33.5 39.1 Franzluebbers and Brock (2007)
NC Coastal Plain Quartzipsamments–Kandiudults LS CO-CO/RY-SB/WT 7.5 20 18.2 33.6 Causarano et al. (2008)
NC Piedmont Typic Kanhapludults SCL PN/WT-CO/WT-SB/CC 12.7 20 25.0 32.6 Causarano et al. (2008)
Florence. SC Typic Kandiudult LS CO-WT/SB-CO 25 7.6 10.1 20.3 Bauer et al. (2006)
Florence. SC Typic Kandiudult LS CO-WT/SB-CO 24 15 20.6 31.4 Novak et al. (2007)
SC Coastal Plain Kandiudults–Kanhapludults LS CO-SB 16 20 24.8 25.3 Causarano et al. (2008)
SC Piedmont Typic Kanhapludults SCL CO-SB/WT-ML 14.7 20 22.2 26.5 Causarano et al. (2008)
College Station, TX Udifl uventic Haplustept SiCL WT (0N) 20 30 36.5 37.8 Dou and Hons (2006)
College Station, TX Udifl uventic Haplustept SiCL WT (2N) 20 30 37.5 40.8 Dou and Hons (2006)
College Station, TX Udifl uventic Haplustept SiCL GS-WT/SB (0N) 20 30 35.5 44.3 Dou and Hons (2006)
College Station, TX Udifl uventic Haplustept SiCL GS-WT/SB (2N) 20 30 35.4 49.2 Dou and Hons (2006)
College Station, TX Udifl uventic Haplustept SiCL WT/SB (0N) 20 30 35.8 42.3 Dou and Hons (2006)
College Station, TX Udifl uventic Haplustept SiCL WT/SB (2N) 20 30 35.6 46.5 Dou and Hons (2006)
College Station, TX Udifl uventic Haplustept SiCL GS 20 15 15.1 19.5 Wright and Hons (2005)
College Station, TX Udifl uventic Haplustept SiCL WT 20 15 22.2 23.7 Wright and Hons (2005)
College Station, TX Udifl uventic Haplustept SiCL SB 20 15 14.1 22.2 Wright and Hons (2005)
College Station, TX Udifl uventic Haplustept SiCL GS-WT/SB 20 15 17.4 25.1 Wright and Hons (2004)
College Station, TX Udifl uventic Haplustept SiCL WT/SB 20 15 18.7 22.9 Wright and Hons (2004)
College Station, TX Udifl uventic Haplustept SiCL SB 20 15 15.1 20.5 Wright and Hons (2004)
Weslaco, TX Typic Calciustoll SCL CO/CN 9 30 40.2 41.8 Zibilske et al. (2002)
VA Coastal Plain Aquic Hapludult SL CO-WT/SB 14 15 15.9 21.9 Spargo et al. (2008)
VA Coastal Plain Aquic Hapludult SL CO-WT/SB (with biosolids) 9 15 20.2 22.9 Spargo et al. (2008)
VA Coastal Plain Typic Hapludult LfS CO-WT/SB 3 15 14.1 13.3 Spargo et al. (2008)
VA Coastal Plain Typic Hapludult LfS CO-WT/SB (with biosolids) 9 15 16.7 19.1 Spargo et al. (2008)
VA Coastal Plain Typic Hapludult LfS CO-WT/SB 11 15 17.2 19.3 Spargo et al. (2008)
VA Coastal Plain Typic Hapludult LfS CO-WT/SB (with biosolids) 11 15 20.2 29.9 Spargo et al. (2008)
VA Coastal Plain Hapludults SL CO/WT-SB 13.3 20 20.4 31.4 Causarano et al. (2008)
VA Piedmont Kanhapludults–Kandiudults L SB-CO/WT 9 20 27.7 29.9 Causarano et al. (2008)
Mean ± SE (n = 51) 11 ± 1 21 ± 1 25.6 ± 1.4 30.2 ± 1.4
† L, loam; LfS, loamy fi ne sand; LS, loamy sand; SCL, sandy clay loam; SiCL, silty clay loam; SL, sandy loam; SiL, silt loam.
‡ BL, barley; BO, black oat; CC, crimson clover; CN, corn; CO, cotton; GS, grain sorghum; HV, hairy vetch; ML, millet; O, oat; PN, peanut; RG, ryegrass; RY, rye; SB, soybean; WT, wheat; 0N, no N fertilizer; 2N, recommended N fertilizer input.
350 SSSAJ: Volume 74: Number 2 • March–April 2010
rate averaged 0.45 Mg C ha−1 yr−1 and the median rate was 0.35 Mg C ha−1 yr−1. Th e cumulative density function in Fig. 1 suggested that there was an 82% chance of achieving a value of at least 0.10 Mg C ha−1 yr−1 (a value at least marginally dif-ferent from zero), a 63% chance of achieving a value of at least 0.25 Mg C ha−1 yr−1, a 32% chance of achieving a value of at least 0.50 Mg C ha−1 yr−1, and a 15% chance of achieving a value of at least 0.75 Mg C ha−1 yr−1. Th is probability density func-tion based on previously collected data should be viewed as a guide for future observations, assuming that the observations are randomly associated and not a function of a unique controlling factor. Th is could be tested with a coordinated sampling cam-paign across the region.
Th e rate of SOC sequestration with conservation tillage in the southeastern United States was similar to the rate reported for the central United States (0.48 ± 0.59 Mg C ha−1 yr−1, Johnson et al., 2005), but higher than rates reported for the southwest-ern United States (0.30 ± 0.21 Mg C ha−1 yr−1, Martens et al., 2005), the northwestern United States and western Canada (0.27 ± 0.19 Mg C ha−1 yr−1. Liebig et al., 2005), and eastern Canada (−0.07 ± 0.27 Mg C ha−1 yr−1, Gregorich et al., 2005). From 93 paired comparisons around the world, SOC sequestra-tion with no-till (NT) compared with conventional tillage was 0.48 ± 0.13 Mg C ha−1 yr−1 (West and Post, 2002). In a review of literature projected to a 20-yr period, Six et al. (2004) report-ed SOC sequestration rates of 0.22 and 0.10 Mg C ha−1 yr−1 under humid and dry climates, respectively. Although lim-ited in data, N2O emission would have reduced these rates by 0.07 Mg C ha−1 yr−1 based on equivalent global warming po-tential. Mean comparisons in diff erent regions of the United States and the world indicate that regionally defi ned diff erences in SOC sequestration rates with conservation tillage probably do exist, but that there is also a need for more thorough character-ization and evaluation.
Th e overwhelming majority of data suggests that conserva-tion tillage in the southeastern United States will lead to signifi -cantly positive organic C sequestration in the upper 20 cm of the soil. Still greatly lacking in the region are data on how conser-vation agriculture aff ects other important greenhouse gases, i.e., N2O and CH4. Th is research must be undertaken.
Pasture ManagementEstablishment of perennial pasture following convention-
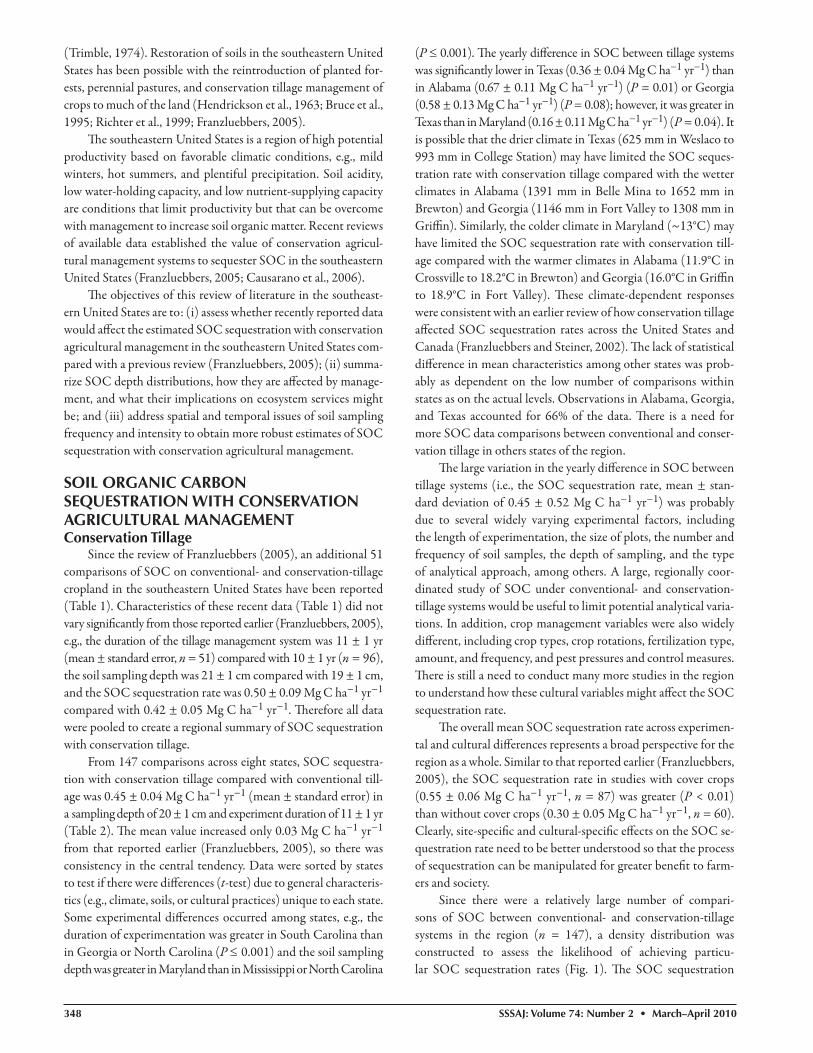
ally tilled cropland can also lead to signifi cantly positive SOC sequestration (Table 3). Th ree recent studies reported SOC con-tent following grass establishment to provide an additional 23 observations to the 12 observations reported previously in the southeastern United States (Franzluebbers, 2005). Across the 35 observations, SOC sequestration with pasture establishment had a mean ± standard error of 0.84 ± 0.11 Mg C ha−1 yr−1. Th e cumulative density function in Fig. 2 suggested that there was an 87% chance of achieving a value of at least 0.10 Mg C ha−1 yr−1, an 81% chance of achieving a value of at least 0.25 Mg C ha−1 yr−1, a 66% chance of achieving a value of at least 0.50 Mg C ha−1 yr−1,
Tabl
e 2.
Mea
n ±
sta
ndar
d er
ror
of s
oil o
rgan
ic C
(SO
C)
char
acte
rist
ics
unde
r co
nven
tion
al a
nd n
o-ti
ll sy
stem
s fr
om s
tudi
es b
y st
ate
(dat
a fr
om T
able
1 a
nd p
revi
ousl
y re
port
ed in
Fr
anzl
uebb
ers
[200
5]).
Prop
erty
Ala
bam
aG
eorg
iaM
aryl
and
Mis
siss
ippi
N. C
arol
ina
S. C
arol
ina
Texa
sV
irgi
nia
Mea
n
Com
pari
sons
, no.
2731
136
159
388
147
Dur
atio
n of
com
pari
son,
yr
9 ±
18
± 1
14 ±
28
± 1
7 ±
117
± 2
13 ±
110
± 1
11 ±
1
Soil
dept
h, c
m21
± 1
21 ±
123
± 1
1515
± 1
15 ±
122
± 1
16 ±
120
± 1
SOC
with
con
vent
iona
l till
age,
Mg
ha−
122
.4 ±
1.5
25.5
± 1
.739
.2 ±
4.4
16.4
± 1
.721
.5 ±
1.7
20.7
± 2
.228
.5 ±
1.9
19.0
± 1
.525
.5 ±
0.9
SOC
with
no-
till,
Mg
ha−
126
.6 ±
1.5
28.8
± 1
.940
.6 ±
4.3
19.5
± 1
.124
.5 ±
2.1
25.4
± 2
.233
.0 ±
1.8
23.5
± 2
.329
.2 ±
0.9
Diff
eren
ce in
SO
C b
etw
een
tilla
ge s
yste
ms,
Mg
ha−1
4.1
± 0
.63.
3 ±
0.5
1.5
± 0
.93.
1 ±
0.9
3.0
± 1
.14.
7 ±
1.2
4.5
± 0
.54.
4 ±
1.5
3.7
± 0
.3
Year
ly d
iffer
ence
in S
OC
bet
wee
n til
lage
sys
tem
s,
Mg
ha−
1 yr
−1
0.66
± 0
.11
0.59
± 0
.13
0.16
± 0
.11
0.37
± 0
.10
0.40
± 0
.14
0.27
± 0
.06
0.36
± 0
.04
0.36
± 0
.13
0.45
± 0
.04
Rat
io o
f SO
C w
ith n
o-til
l to
conv
entio
nal t
illag
e ,
kg k
g−1
1.21
± 0
.03
1.15
± 0
.03
1.05
± 0
.02
1.22
± 0
.06
1.14
± 0
.06
1.28
± 0
.10
1.19
± 0
.02
1.23
± 0
.07
1.18
± 0
.02

SSSAJ: Volume 74: Number 2 • March–April 2010 351
a 48% chance of achieving a value of at least 0.75 Mg C ha−1 yr−1, and a 30% chance of achieving a value of at least 1.00 Mg C ha−1 yr−1.
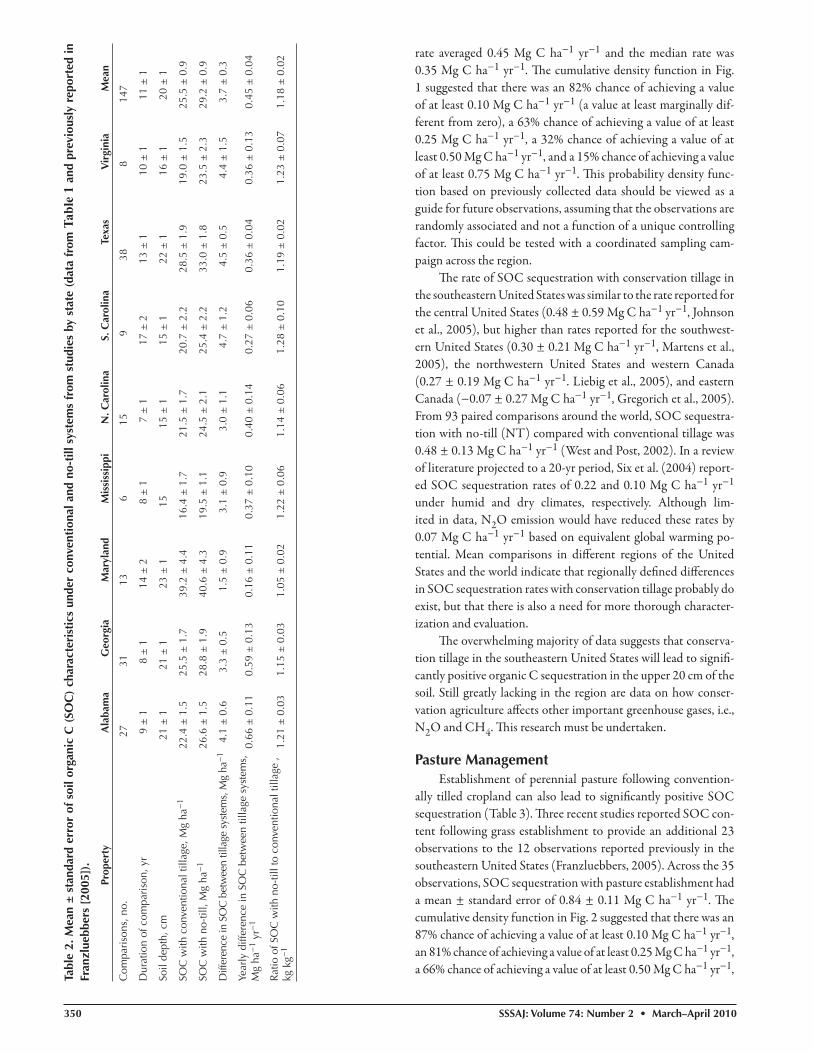
Th e type of pasture management can have a signifi cant in-fl uence on SOC sequestration. In a 5-yr study on ‘Coastal’ ber-mudagrass [Cynodon dactylon (L.) Pers.] in Georgia, SOC ac-cumulated with a moderate cattle stocking rate (~6 steers ha−1) compared with no cattle grazing, but declined at a high stocking rate (Fig. 3). In contrast, surface-residue C declined at all cattle stocking rates. Evidence for SOC sequestration with organic fertilization (i.e., poultry litter) compared with inorganic fer-tilization has not been convincing in Georgia (Franzluebbers and Stuedemann, 2009). Soil retention of C applied as manure in warm, moist environments was estimated as 7 to 8%, while retention in cool, dry environments was estimated as 11 to 23% (Franzluebbers and Doraiswamy, 2007). In Virginia, orchard-grass (Dactylis glomerata L.) pastures with management-inten-sive grazing sequestered SOC at a rate of 0.61 Mg C ha−1 yr−1 (time-weighted estimates based on 14 ± 11 yr) compared with the prevailing extensive grazing (Conant et al., 2003). Th ere is a great need to conduct further studies to determine the rate of SOC sequestration under the diversity of pasture management systems used in the region.
STRATIFICATION OF SOIL ORGANIC CARBON WITH DEPTH
Conservation agricultural systems in the southeastern United States typically develop a highly stratifi ed vertical distri-bution of SOC with time (Fig. 4). Signifi cant changes in SOC
Fig. 1. Density of soil organic C sequestration estimates with conservation-tillage cropland in the southeastern United States (n = 147). Inset shows all data, while the main graph shows the range of soil organic C values encompassing approximately the middle 80% of observations.
Table 3. Rate of soil organic C (SOC) sequestration following grass establishment from recent studies in the southeastern United States. These data are in addition to those reported earlier in Franzluebbers (2005).
Location Taxonomic classifi cation Experimental conditions Duration SOC sequestration Reference
yr Mg C ha−1 yr−1
Farmington, GA Typic Kanhapludult unharvested ‘Coastal’ bermudagrass with inorganic fertilizer, 30-cm depth
12 0.54 Franzluebbers and Stuedemann (2009)
Farmington, GA Typic Kanhapludult grazed Coastal bermudagrass at low pressure with inorganic fertilizer, 30-cm depth
12 1.15 Franzluebbers and Stuedemann (2009)
Farmington, GA Typic Kanhapludult grazed Coastal bermudagrass at high pressure with inorganic fertilizer, 30-cm depth
12 0.73 Franzluebbers and Stuedemann (2009)
Farmington, GA Typic Kanhapludult hayed Coastal bermudagrass with inorganic fertilizer, 30-cm depth
12 0.24 Franzluebbers and Stuedemann (2009)
Farmington, GA Typic Kanhapludult unharvested Coastal bermudagrass with low broiler litter fertilization, 30-cm depth
12 0.52 Franzluebbers and Stuedemann (2009)
Farmington, GA Typic Kanhapludult grazed Coastal bermudagrass at low pressure with low broiler litter fertilization, 30-cm depth
12 1.64 Franzluebbers and Stuedemann (2009)
Farmington, GA Typic Kanhapludult grazed Coastal bermudagrass at high pressure with low broiler litter fertilization, 30-cm depth
12 1.13 Franzluebbers and Stuedemann (2009)
Farmington, GA Typic Kanhapludult hayed Coastal bermudagrass with low broiler litter fertilization, 30-cm depth
12 0.39 Franzluebbers and Stuedemann (2009)
Farmington, GA Typic Kanhapludult unharvested Coastal bermudagrass with high broiler litter fertilization, 30-cm depth
12 1.33 Franzluebbers and Stuedemann (2009)
Farmington, GA Typic Kanhapludult grazed Coastal bermudagrass at low pressure with high broiler litter fertilization, 30-cm depth
12 1.42 Franzluebbers and Stuedemann (2009)
Farmington, GA Typic Kanhapludult grazed Coastal bermudagrass at high pressure with high broiler litter fertilization, 30-cm depth
12 0.90 Franzluebbers and Stuedemann (2009)
Farmington, GA Typic Kanhapludult Hayed Coastal bermudagrass with high broiler litter fertilization, 30-cm depth
12 −0.06 Franzluebbers and Stuedemann (2009)
AL Coastal Plain Kandiudults–Haploxeralfs grazed (2) and hayed (1) pastures, 20-cm depth 27 ± 12 0.60 Causarano et al. (2008)
AL Piedmont Kanhapludults grazed (1) and hayed (2) pastures, 20-cm depth 33 ± 6 0.34 Causarano et al. (2008)
GA Coastal Plain Plinthic Kandiudults grazed pastures (3), 20-cm depth 17 ± 6 1.13 Causarano et al. (2008)
GA Piedmont Kanhapludults grazed pastures (3), 20-cm depth 24 ± 15 0.33 Causarano et al. (2008)
NC Coastal Plain Quartzipsamments–Kandiudults grazed (1) and hayed (1) pastures, 20-cm depth 15 ± 7 1.12 Causarano et al. (2008)
NC region Typic Kanhapludults grazed pastures (2), 20-cm depth 14 ± 4 0.92 Causarano et al. (2008)
SC Coastal Plain Kandiudults–Kanhapludults grazed (2) and hayed (1) pastures, 20-cm depth 20 0.08 Causarano et al. (2008)
SC Piedmont Typic Kanhapludults grazed pastures (3), 20-cm depth 23 ± 6 1.03 Causarano et al. (2008)
VA Coastal Plain Hapludults grazed (2) and hayed (1) pastures, 20-cm depth 27 ± 3 0.51 Causarano et al. (2008)
VA Piedmont Kanhapludults–Kandiudults grazed pastures (3), 20-cm depth 27 ± 12 0.82 Causarano et al. (2008)
Charlottesville, VA Typic Hapludult rotationally grazed orchardgrass/clover, 50-cm depth 29 ± 24 0.15 Conant et al. (2004)
Mean ± SE (n = 23) 17 ± 1 0.74 ± 0.10
352 SSSAJ: Volume 74: Number 2 • March–April 2010
that do occur with conservation agricultural systems in the re-gion are usually limited to the surface 30 cm of soil and even more typically to the surface 15 cm of soil. Th e ratio of SOC at 0 to 15 cm to that at 15 to 30 cm in the example in Fig. 4 increased from 2.4 at initiation to 3.1 at the end of 5 yr to 3.6 at the end of 12 yr.
High surface SOC has important impacts on several soil functions. Enrichment of the soil surface with organic C is eco-logically essential, because the soil surface is the interface that (i) receives much of the fertilizers and pesticides applied to agricul-tural land, (ii) receives the intense impact of rainfall, and (iii) partitions the fl uxes of gases and water into and out of the soil (Franzluebbers, 2002a). Th erefore, organic-C-enriched surface soil fosters productivity, regulates terrestrial water fl ow, seques-ters C from the atmosphere, cycles nutrients through biological activity, fi lters and denatures pollutants, and creates a biologically active and diverse warehouse of soil microorganisms. Soil organ-ic C allows plant roots and soil biota to reconfi gure the soil ma-trix into a stable structure with permanent channels (biopores), a process that is important in achieving high water infi ltration. As an example, the positive eff ect of a high stratifi cation ratio of SOC (an index of biophysical changes in the soil structure) on water infi ltration was demonstrated in a controlled infi ltration experiment on a Typic Kanhapludult, whereby water infi ltra-tion increased 27% with doubling of the organic C uniformly throughout a 12-cm depth of soil and increased more than 200% when organic C was concentrated in the surface 3 cm of the soil (Franzluebbers, 2002b). In fi eld studies with small-plot rainfall simulations (4.6–5.5 m2) in Mississippi and Ohio (Rhoton et al., 2002), soil loss was inversely related to the calculated SOC stratifi cation ratio (Franzluebbers, 2008). Other fi eld-plot and water-catchment studies have documented the positive infl uence of conservation tillage and pasture management on soil stabiliza-tion and the avoidance of water and nutrient runoff (reviewed in Franzluebbers, 2008). Very few of these studies provided mea-surements of the depth distribution of SOC, however, which would have probably been highly stratifi ed under conservation
systems and uniformly distributed with depth under inversion tillage systems (i.e., bare surface). Th e assumed surface accumulation and high stratifi cation ratio of SOC under conservation management systems are further supported by observations in the following.
In a tillage × cropping system experiment in Watkinsville, GA, the stratifi cation ratio of SOC (0–6/12–20 cm) was ini-tially 3.7 when a long-term pasture was terminated, and then became widely divergent throughout the subsequent 3 yr of the study (Franzluebbers and Stuedemann, 2008). Th e stratifi cation ratio of SOC was 0.9 and 3.8 under conventional tillage and NT, respectively, at the end of 1 yr, 1.1 and 3.8 at the end of 2 yr, and 1.2 and 3.9 at the end of 3 yr. Similar values for the stratifi cation ratio of SOC (0–5/15–30 cm) were reported for four measure-ments during 30 yr of experimentation with moldboard plowing (1.7 ± 0.2), NT management (3.4 ± 0.1), and grass sod (4.0 ± 0.2) in Kentucky (Diaz-Zorita and Grove, 2002).
In a survey of agricultural land uses in Alabama, Georgia, South Carolina, North Carolina, and Virginia, the stratifi cation ratio of SOC (0–5/12.5–20 cm) averaged 1.4 with convention-al-tillage cropland and reached a plateau of 2.8 within 10 yr on conservation-tillage cropland and a plateau of 4.2 with perennial pasture (Fig. 5). Th is survey included a wide diversity of crop-ping histories and soil types, which may have contributed to the wide variation observed. In a survey of cropland fi elds on three diff erent soil types in the Virginia Coastal Plain, the stratifi ca-tion ratio of SOC (0–2.5/7.5–15 cm) was linearly related to the number of years of continuous NT (initially 1.5 following con-ventional tillage and increasing to 3.6 with 14 yr of NT) (Spargo et al., 2008).
Stratifi cation of SOC with depth may also be predictive of terrestrial C storage with conservation agricultural systems in the southeastern United States. In the land use survey by Causarano et al. (2008), the stratifi cation ratio of SOC (0–5/12.5–20 cm) was related to the total stock of SOC in the surface 20-cm depth (Fig. 6). Th is relationship indicates that the majority of C stored under conservation management in these Ultisols and Alfi sols of the region occurred within the surface 5 cm. More data will be needed to extend the applicability of this relationship through-out the region. When using only the surface 2.5 cm of soil for
Fig. 2. Density of soil organic C sequestration estimates with pasture establishment in the southeastern United States (n = 35). Inset shows all data, while the main graph shows the range of soil organic C values encompassing approximately the middle 80% of observations.
Fig. 3. Soil organic C and surface residue C as a function of cattle stocking rate on bermudagrass in Georgia (data from Franzluebbers et al., 2001).

SSSAJ: Volume 74: Number 2 • March–April 2010 353
calculation of the stratifi cation ratio, there was little relationship between the stratifi cation ratio and the stock of SOC in the sur-face 15 cm of conservation-tilled Coastal Plain soils in Virginia (Spargo et al., 2008). Taking these data together suggests that signifi cant accumulation (if not the majority) of SOC occurs within the surface 5 cm with conservation management.
SAMPLING ISSUES FOR SOIL ORGANIC CARBON DETERMINATION
Sampling issues have been raised in various studies when assessing SOC sequestration in agricultural systems. Th ese is-sues, including bulk density determination, depth of sampling, frequency of sampling, and stratifi ed sampling, are addressed here to provide recommendations based on observations and synthesis of the literature to balance practicality and scientifi c rigor.
Bulk DensityBulk density and SOC concentration are two key prop-
erties needed to calculate SOC stocks and changes with time. Bulk density has not always been determined in older studies reporting SOC concentration with diff erent management. Bulk density can be estimated through pedotransfer functions, most
typically from soil organic matter and soil texture (clay, silt, and sand contents) (Manrique and Jones, 1991; De Vos et al., 2005; Kätterer et al., 2006; Benites et al., 2007). Th e relation-ship between bulk density and SOC in Typic Kanhapludults from Georgia is shown in Fig. 7. Despite the apparent limited sampling domain, the relationship is, in fact, similar to that re-ported for forested soils in Belgium (BD = 1.78 − 0.173 LOI1/2, where BD is bulk density and LOI is loss-on-ignition) (De Vos et al., 2005). Th erefore in the absence of bulk density measure-ments, SOC can be used to predict bulk density (note that the greater the SOC concentration, the lower the bulk density—an inverse relationship that limits the growth of SOC stock and clearly indicates the need to either measure bulk density directly or estimate bulk density for a soil type with an adjustment for SOC concentration). In a survey of land uses in the Coastal Plain and Southern Piedmont (including three Haploxeralfs, three Hapludalfs, three Quartzipsamments, eight Hapludults, three Paleudults, 22 Kandiudults, and 45 Kanhapludults), soil bulk density predicted by the relationship with SOC in Fig. 7 was 6.1 ± 6.9% (mean ± standard deviation) lower than actual measurements of bulk density (Causarano et al., 2008). Using predicted bulk density, SOC sequestration with conservation tillage compared with conven-tional tillage would have changed from 5.1 ± 6.8 to 4.2 ± 6.4 Mg ha−1
Fig. 4. Soil organic C depth distribution as a function of duration of pasture management (data from Franzluebbers and Stuedemann, 2009).
Fig. 5. Stratifi cation ratio of soil organic C as a function of years of conservation management (data from Causarano et al., 2008). Diamonds are pasture, squares are conservation-tillage cropland, and fi lled circles are conventional-tillage cropland.
Fig. 7. Relationship of soil bulk density to soil organic C concentration among Typic Kanhapludults from three studies in Georgia (data from Franzluebbers et al., 1999, 2000a, 2001).
Fig. 6. Stock of soil organic C to a depth of 20 cm as a function of the stratifi cation ratio of soil organic C, independent of land management (data from Causarano et al., 2008).
354 SSSAJ: Volume 74: Number 2 • March–April 2010
and with perennial pasture compared with conventional tillage would have changed from 14.3 ± 10.5 to 12.8 ± 8.8 Mg ha−1. Predictions would have been reasonably close to actual determinations.
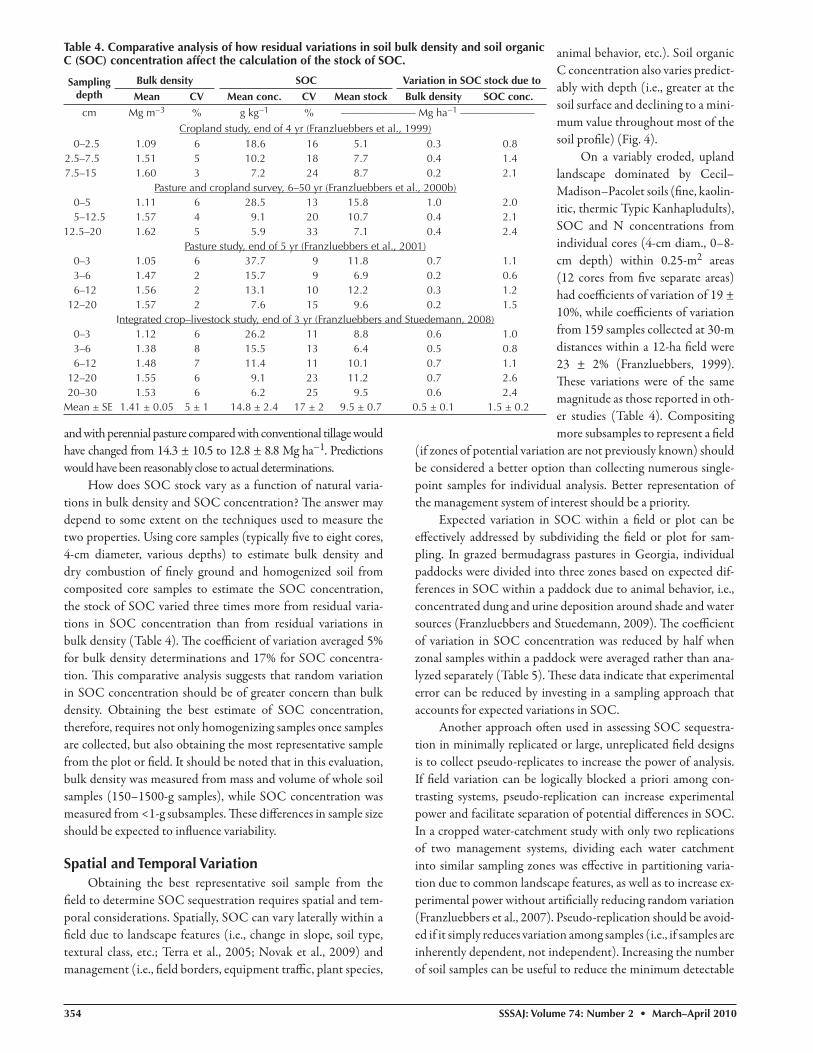
How does SOC stock vary as a function of natural varia-tions in bulk density and SOC concentration? Th e answer may depend to some extent on the techniques used to measure the two properties. Using core samples (typically fi ve to eight cores, 4-cm diameter, various depths) to estimate bulk density and dry combustion of fi nely ground and homogenized soil from composited core samples to estimate the SOC concentration, the stock of SOC varied three times more from residual varia-tions in SOC concentration than from residual variations in bulk density (Table 4). Th e coeffi cient of variation averaged 5% for bulk density determinations and 17% for SOC concentra-tion. Th is comparative analysis suggests that random variation in SOC concentration should be of greater concern than bulk density. Obtaining the best estimate of SOC concentration, therefore, requires not only homogenizing samples once samples are collected, but also obtaining the most representative sample from the plot or fi eld. It should be noted that in this evaluation, bulk density was measured from mass and volume of whole soil samples (150–1500-g samples), while SOC concentration was measured from <1-g subsamples. Th ese diff erences in sample size should be expected to infl uence variability.
Spatial and Temporal VariationObtaining the best representative soil sample from the
fi eld to determine SOC sequestration requires spatial and tem-poral considerations. Spatially, SOC can vary laterally within a fi eld due to landscape features (i.e., change in slope, soil type, textural class, etc.; Terra et al., 2005; Novak et al., 2009) and management (i.e., fi eld borders, equipment traffi c, plant species,
animal behavior, etc.). Soil organic C concentration also varies predict-ably with depth (i.e., greater at the soil surface and declining to a mini-mum value throughout most of the soil profi le) (Fig. 4).
On a variably eroded, upland landscape dominated by Cecil–Madison–Pacolet soils (fi ne, kaolin-itic, thermic Typic Kanhapludults), SOC and N concentrations from individual cores (4-cm diam., 0–8-cm depth) within 0.25-m2 areas (12 cores from fi ve separate areas) had coeffi cients of variation of 19 ± 10%, while coeffi cients of variation from 159 samples collected at 30-m distances within a 12-ha fi eld were 23 ± 2% (Franzluebbers, 1999). Th ese variations were of the same magnitude as those reported in oth-er studies (Table 4). Compositing more subsamples to represent a fi eld
(if zones of potential variation are not previously known) should be considered a better option than collecting numerous single-point samples for individual analysis. Better representation of the management system of interest should be a priority.
Expected variation in SOC within a fi eld or plot can be eff ectively addressed by subdividing the fi eld or plot for sam-pling. In grazed bermudagrass pastures in Georgia, individual paddocks were divided into three zones based on expected dif-ferences in SOC within a paddock due to animal behavior, i.e., concentrated dung and urine deposition around shade and water sources (Franzluebbers and Stuedemann, 2009). Th e coeffi cient of variation in SOC concentration was reduced by half when zonal samples within a paddock were averaged rather than ana-lyzed separately (Table 5). Th ese data indicate that experimental error can be reduced by investing in a sampling approach that accounts for expected variations in SOC.
Another approach oft en used in assessing SOC sequestra-tion in minimally replicated or large, unreplicated fi eld designs is to collect pseudo-replicates to increase the power of analysis. If fi eld variation can be logically blocked a priori among con-trasting systems, pseudo-replication can increase experimental power and facilitate separation of potential diff erences in SOC. In a cropped water-catchment study with only two replications of two management systems, dividing each water catchment into similar sampling zones was eff ective in partitioning varia-tion due to common landscape features, as well as to increase ex-perimental power without artifi cially reducing random variation (Franzluebbers et al., 2007). Pseudo-replication should be avoid-ed if it simply reduces variation among samples (i.e., if samples are inherently dependent, not independent). Increasing the number of soil samples can be useful to reduce the minimum detectable
Table 4. Comparative analysis of how residual variations in soil bulk density and soil organic C (SOC) concentration affect the calculation of the stock of SOC.
Sampling depth
Bulk density SOC Variation in SOC stock due to
Mean CV Mean conc. CV Mean stock Bulk density SOC conc.
cm Mg m−3 % g kg−1 % ——————— Mg ha−1 ———————Cropland study, end of 4 yr (Franzluebbers et al., 1999)
0–2.5 1.09 6 18.6 16 5.1 0.3 0.82.5–7.5 1.51 5 10.2 18 7.7 0.4 1.47.5–15 1.60 3 7.2 24 8.7 0.2 2.1
Pasture and cropland survey, 6–50 yr (Franzluebbers et al., 2000b)0–5 1.11 6 28.5 13 15.8 1.0 2.05–12.5 1.57 4 9.1 20 10.7 0.4 2.1
12.5–20 1.62 5 5.9 33 7.1 0.4 2.4Pasture study, end of 5 yr (Franzluebbers et al., 2001)
0–3 1.05 6 37.7 9 11.8 0.7 1.13–6 1.47 2 15.7 9 6.9 0.2 0.66–12 1.56 2 13.1 10 12.2 0.3 1.2
12–20 1.57 2 7.6 15 9.6 0.2 1.5Integrated crop–livestock study, end of 3 yr (Franzluebbers and Stuedemann, 2008)
0–3 1.12 6 26.2 11 8.8 0.6 1.03–6 1.38 8 15.5 13 6.4 0.5 0.86–12 1.48 7 11.4 11 10.1 0.7 1.1
12–20 1.55 6 9.1 23 11.2 0.7 2.620–30 1.53 6 6.2 25 9.5 0.6 2.4
Mean ± SE 1.41 ± 0.05 5 ± 1 14.8 ± 2.4 17 ± 2 9.5 ± 0.7 0.5 ± 0.1 1.5 ± 0.2

SSSAJ: Volume 74: Number 2 • March–April 2010 355
diff erence (Yang et al., 2008). Pseudo-replication would be ideally suited to get better estimates from on-farm assessments (e.g., strip plots or side-by-side fi elds) that can be sampled with delineation of expected diff er-ences due to soil type, textural class, topography, etc. (VandenBygaart et al., 2002).
Soil organic C sequestration could be expected to occur not only near the soil surface where large deposi-tions of plant and animal residues combined with fre-quently cold or dry conditions would limit their decom-position, but also deeper in the soil profi le where soil remains undisturbed and low available nutrients might limit decomposition of root deposits. Th e few data that are available, however, do not support statistically sig-nifi cant deep-profi le SOC sequestration in the south-eastern United States. On eroded cropland converted to a pine plantation in South Carolina, organic C sequestration was 0.95 Mg C ha−1 yr−1 in the forest-fl oor litter layer, 0.04 Mg C ha−1 yr−1 in the 0- to 15-cm soil depth, and unchanged or tending to de-cline at a depth of 15 to 60 cm (Richter et al., 1999). Organic C from profi les of major soil types throughout the southeastern United States was greater under forest and grass than under crops at a depth of 0 to 25 cm, but was not diff erent among land uses at depths below the plow layer (Fig. 8). Although management details were lacking from this survey report from several soils throughout the southeastern United States, the data did suggest a nonsignifi cant trend for progressively diminishing SOC se-questration deeper in the profi le under perennial grass compared with annual crops.
Detailed soil characterization with time would probably be necessary to detect signifi cant changes in SOC with depth in management systems having vigorous deep-rooting capability. To provide some perspective, roots of bermudagrass at the end of 3 yr of experimentation were 3.3 ± 1.7, 0.9 ± 0.5, and 0.9 ± 0.5 Mg ha−1 at depths of 0 to 30, 30 to 60, and 60 to 90 cm, respectively (Adams et al., 1966). Assuming that 50% of the root biomass accumulated within a year, 43% of the root biomass was organic C (Franzluebbers et al., 1994), and 24% of the organic C could be retained as SOC following a year of decomposition (Franzluebbers et al., 1998), then it would have taken 9, 32, and 31 yr to achieve SOC accumulation of 1.5 Mg ha−1 (a minimum detectable limit reported in Table 4) at depths of 0 to 30, 30 to 60, and 60 to 90 cm, respectively. Much larger minimum detect-able diff erences can be expected, however; e.g., values of 10.3 ± 3.0 Mg ha−1 were reported for three studies in Ontario and Illinois at a depth of 40 to 50 cm (Yang et al., 2008). Th erefore, overcoming inherent variability to detect signifi cant changes in SOC deeper in the profi le may require an unusually long evalua-tion period or more intensive sampling protocols.
As noted in Table 5, SOC concentration declines with depth and the coeffi cient of variation oft en increases with depth. Th ese eff ects result in an increasingly larger diff erence in SOC needed for the detection of signifi cance; e.g., the least signifi cant diff erence increased an average of 0.6 Mg ha−1 for each addition-
al 30 cm of soil depth analyzed (Franzluebbers and Stuedemann, 2005). Reports from other ecological regions have also found greater random variation in SOC (and therefore none or mar-ginally signifi cant diff erences between management systems) when sampling below the plow layer (Deen and Kataki, 2003; Carter, 2005; Dolan et al., 2006; Yang et al., 2008). In contrast, SOC at the end of 28 yr of NT in Indiana was greater than with conventional tillage at a depth of 0 to 30 cm and to a cumulative depth of 100 cm, despite observation of a reverse tillage eff ect at the 30- to 50-cm depth (Gál et al., 2007). To overcome experi-mental limitations of increasing variability with lower C concen-tration at depth, numerous soil samples (Yang et al., 2008) and frequent sampling events throughout time have been suggested (Franzluebbers and Stuedemann, 2005). Results from single-point-in-time measurements could be either verifi ed with multi-ple samplings or improved by obtaining a more robust temporal estimate of SOC sequestration, rather than a rate assumed from a homogenous starting point or from relative comparison with an-other land use (e.g., NT vs. conventional tillage, not knowing if conventional tillage were in an assumed steady-state condition).
Table 5. Comparative analysis of soil organic C concentration and its coeffi cient of variation as affected by subsampling within a paddock at the end of 12 yr of cattle grazing bermudagrass in Georgia (data from Franzluebbers and Stuedemann, 2009).
Sampling depth
Soil organic C conc.
Subsampling within paddocks (experimental units = 54)
Pooling subsamples(experimental units =18†)
Zone 1(near shade)
Zone 2(midway)
Zone 3(far from shade)
CV Paddock mean CV
cm ————— g kg−1 ————— % g kg−1 %0–15 23.8 18.5 20.0 20 20.7 915–30 5.6 5.1 5.9 43 5.6 2330–60 2.2 2.0 2.4 45 2.2 1960–90 0.8 0.8 1.0 39 0.9 1690–120 0.6 0.5 0.6 93 0.6 48120–150 0.3 0.4 0.5 60 0.4 42† Averaged across three zones within each paddock.
Fig. 8. Relative difference in soil organic C between (a) forest and cropland and (b) grass and cropland as affected by depth in the profi le (data from McCracken, 1959).
356 SSSAJ: Volume 74: Number 2 • March–April 2010
Frequent sampling of SOC could reduce the detection limit for SOC sequestration. Sampling the surface 30 cm of soil at initiation and at the end of 5 yr of pasture management resulted in a least signifi cant diff erence of 1.1 Mg ha−1 yr−1 (Franzluebbers and Stuedemann, 2005). Annual sampling of the surface 6 cm of soil in the same systems resulted in a least signifi cant diff erence of only 0.3 Mg ha−1 yr−1 (Franzluebbers et al., 2001). Regression analysis of SOC determination during each of 7 yr in the mid-dle of long-term NT experiments resulted in signifi cantly posi-tive C sequestration estimates in Georgia (0.81 Mg ha−1 yr−1; Franzluebbers et al., 2007) and in North Carolina (0.55 Mg ha−1 yr−1; Franzluebbers and Brock, 2007). For an experiment expected to last ≥10 yr, a reasonable strategy would be to collect soil every 2 to 4 yr to obtain at least four points for regression analysis with time, while not sampling too frequently to avoid unnecessarily high research cost and exhaustion.
On-farm surveys can be a valuable approach to evaluate practically achievable SOC sequestration; however, sampling de-signs should be robust enough to overcome potentially distract-ing assumptions (e.g., uniform starting conditions, peculiar man-agement infl uences, subtle diff erences in landscape features, etc.), which cannot be readily verifi ed under such uncontrolled condi-tions. Replication of fi elds under similar management should be a high priority. Sampling a single fi eld with pseudo-replication results in a limited scope of inference. Th e SOC survey reported by Causarano et al. (2008) illustrates an experimental design that maximized the scope of inference by selecting paired long-term land use conditions within a general area (county) and repeat-ing this approach in three diff erent counties in each of fi ve dif-ferent states across two diff erent Major Land Resource Areas (Piedmont and Coastal Plain). To get a good representation of each fi eld sampled, eight cores were composited. An inclination might have been to collect multiple samples (pseudo-replicates) from within each fi eld. Although this would have produced a bet-ter estimate of the fi eld mean, it would have contributed nothing to experimental variation and separation of land use means.
CONCLUSIONSA preponderance of evidence suggests that conservation
agricultural systems in the southeastern United States will se-quester a signifi cant amount of organic C in the surface 20 cm of soil. Both conservation-tillage cropland and perennial pastures exhibit high SOC sequestration. Whether signifi cant subsurface SOC sequestration can be achieved within a human generation in this warm, humid climate remains debatable. Suffi cient data to support deep-profi le SOC sequestration are lacking. Sampling strategies for future research endeavors should consider spatial and temporal opportunities to increase experimental power to detect statistically signifi cant SOC sequestration. With 45 Mha of agricultural land in the southeastern United States, 28 Tg C yr−1 could be reasonably calculated (0.45 Mg C ha−1 yr−1 on 26 Mha of cropland and 0.86 Mg C ha−1 yr−1 on 19 Mha of pastureland) as potentially sequestered in soil organic matter. Th is highly sig-nifi cant amount of SOC sequestration is vital to improve the soil
fertility of these historically degraded lands and to off set green-house gas emissions in the region.
ACKNOWLEDGMENTSTh e excellent technical support provided by Steve Knapp is greatly appreciated. Th anks are also extended to Kim Lyness, Josh Cown, Amanda Limbaugh, Devin Berry, Carson Pruitt, and Zack Schroer, who provided assistance at various times. Appreciation is extended to the multiple funding sources that fostered data collection and synthesis of ideas, including USDA-ARS (base and GRACEnet sources), U.S. Dep. of Energy, Offi ce of Science (Grant no. DE-IA02-00ER63021), USDA National Research Initiative Competitive Grants Program, Soil Processes (Agr. no. 2001-35107-11126 and 2007-35107-17868), Georgia Agricultural Commodity Commission for Corn, and Cotton Incorporated (Agr. no. 05-712).
REFERENCESAdams, W.E., C.B. Elkins, Jr., and E.R. Beaty. 1966. Rooting habits and moisture use
of Coastal and common bermudagrass. J. Soil Water Conserv. 21:133–135.Bauer, P.J., J.R. Frederick, J.M. Novak, and P.G. Hunt. 2006. Soil CO2 fl ux from a
Norfolk loamy sand aft er 25 years of conventional and conservation tillage. Soil Tillage Res. 90:205–211.
Benites, V.M., P.L.O.A. Machado, E.C.C. Fidalgo, M.R. Coelho, and B.E. Madari. 2007. Pedotransfer functions for estimating soil bulk density from existing soil survey reports in Brazil. Geoderma 139:90–97.
Bruce, R.R., G.W. Langdale, L.T. West, and W.P. Miller. 1995. Surface soil degradation and soil productivity restoration and maintenance. Soil Sci. Soc. Am. J. 59:654–660.
Carter, M.R. 2005. Long-term tillage eff ects on cool-season soybean in rotation with barley: Soil properties and carbon and nitrogen storage for fi ne sandy loams in the humid climate of Atlantic Canada. Soil Tillage Res. 81:109–120.
Causarano, H.J., A.J. Franzluebbers, D.W. Reeves, and J.N. Shaw. 2006. Soil organic carbon sequestration in cotton production systems of the southeastern United States: A review. J. Environ. Qual. 35:1374–1383.
Causarano, H.J., A.J. Franzluebbers, J.N. Shaw, D.W. Reeves, R.L. Raper, and C.W. Wood. 2008. Soil organic carbon fractions and aggregation in the Southern Piedmont and Coastal Plain. Soil Sci. Soc. Am. J. 72:221–230.
Conant, R.T., J. Six, and K. Paustian. 2003. Land use eff ects on soil carbon fractions in the southeastern United States: I. Management-intensive versus extensive grazing. Biol. Fertil. Soils 38:386–392.
Conant, R.T., J. Six, and K. Paustian. 2004. Land use eff ects on soil carbon fractions in the southeastern United States: II. Changes in soil carbon fractions along a forest to pasture chronosequence. Biol. Fertil. Soils 40:194–200.
Deen, W., and P.K. Kataki. 2003. Carbon sequestration in a long-term conventional versus conservation tillage experiment. Soil Tillage Res. 74:143–150.
De Vos, B., M.V. Meirvenne, P. Quataert, J. Deckers, and B. Muys. 2005. Predictive quality of pedotransfer functions for estimating bulk density of forest soils. Soil Sci. Soc. Am. J. 69:500–510.
Diaz-Zorita, M., and J.H. Grove. 2002. Duration of tillage management aff ects carbon and phosphorus stratifi cation in phosphatic Paleudalfs. Soil Tillage Res. 66:165–174.
Dolan, M.S., C.E. Clapp, R.R. Allmaras, J.M. Baker, and J.A.E. Molina. 2006. Soil organic carbon and nitrogen in a Minnesota soil as related to tillage, residue and nitrogen management. Soil Tillage Res. 89:221–231.
Dou, F., and F.M. Hons. 2006. Tillage and nitrogen eff ects on soil organic matter fractions in wheat-based systems. Soil Sci. Soc. Am. J. 70:1896–1905.
Franzluebbers, A.J. 1999. Potential C and N mineralization and microbial biomass from intact and increasingly disturbed soils of varying texture. Soil Biol. Biochem. 31:1083–1090.
Franzluebbers, A.J. 2002a. Soil organic matter stratifi cation ratio as an indicator of soil quality. Soil Tillage Res. 66:95–106.
Franzluebbers, A.J. 2002b. Water infi ltration and soil structure related to organic matter and its stratifi cation with depth. Soil Tillage Res. 66:197–205.
Franzluebbers, A.J. 2005. Soil organic carbon sequestration and agricultural greenhouse gas emissions in the southeastern USA. Soil Tillage Res. 83:120–147.
Franzluebbers, A.J. 2008. Linking soil and water quality in conservation agricultural systems. J. Integr. Biosci. 6:15–29.
Franzluebbers, A.J., and B.G. Brock. 2007. Surface soil responses to silage

SSSAJ: Volume 74: Number 2 • March–April 2010 357
cropping intensity on a Typic Kanhapludult in the Piedmont of North Carolina. Soil Tillage Res. 93:126–137.
Franzluebbers, A.J., and P.C. Doraiswamy. 2007. Carbon sequestration and land degradation. p. 343–358. In M.V.K. Sivakumar and N. Ndiang’ui (ed.) Climate and land degradation. Springer-Verlag, Berlin.
Franzluebbers, A.J., F.M. Hons, and D.A. Zuberer. 1998. In situ and potential CO2 evolution from a Fluventic Ustochrept in southcentral Texas as aff ected by tillage and cropping intensity. Soil Tillage Res. 47:303–308.
Franzluebbers, A.J., G.W. Langdale, and H.H. Schomberg. 1999. Soil carbon, nitrogen, and aggregation in response to type and frequency of tillage. Soil Sci. Soc. Am. J. 63:349–355.
Franzluebbers, A.J., H.H. Schomberg, and D.M. Endale. 2007. Surface-soil responses to paraplowing of long-term no-tillage cropland in the Southern Piedmont USA. Soil Tillage Res. 96:303–315.
Franzluebbers, A.J., and J.L. Steiner. 2002. Climate infl uences on soil organic carbon storage with no tillage. p. 71–86. In J.M. Kimble et al. (ed.) Agricultural practices and policies for carbon sequestration in soil. Lewis Publ., Boca Raton, FL.
Franzluebbers, A.J., and J.A. Stuedemann. 2005. Bermudagrass management in the Southern Piedmont USA: VII. Soil-profi le organic carbon and total nitrogen. Soil Sci. Soc. Am. J. 69:1455–1462.
Franzluebbers, A.J., and J.A. Stuedemann. 2008. Early response of soil organic fractions to tillage and integrated crop–livestock production. Soil Sci. Soc. Am. J. 72:613–625.
Franzluebbers, A.J., and J.A. Stuedemann. 2009. Soil-profi le organic carbon and total nitrogen during 12 years of pasture management in the Southern Piedmont USA. Agric. Ecosyst. Environ. 129:28–36.
Franzluebbers, A.J., J.A. Stuedemann, and H.H. Schomberg. 2000a. Spatial distribution of soil carbon and nitrogen pools under grazed tall fescue. Soil Sci. Soc. Am. J. 64:635–639.
Franzluebbers, A.J., J.A. Stuedemann, H.H. Schomberg, and S.R. Wilkinson. 2000b. Soil organic C and N pools under long-term pasture management in the Southern Piedmont USA. Soil Biol. Biochem. 32:469–478.
Franzluebbers, A.J., J.A. Stuedemann, and S.R. Wilkinson. 2001. Bermudagrass management in the Southern Piedmont USA: I. Soil and surface residue carbon and sulfur. Soil Sci. Soc. Am. J. 65:834–841.
Franzluebbers, K., R.W. Weaver, A.S.R. Juo, and A.J. Franzluebbers. 1994. Carbon and nitrogen mineralization from cowpea plants part decomposing in moist and in repeatedly dried and wetted soil. Soil Biol. Biochem. 26:1379–1387.
Gál, A., T.J. Vyn, E. Michéli, E.J. Kladivko, and W.W. McFee. 2007. Soil carbon and nitrogen accumulation with long-term no-till versus moldboard plowing overestimated with tilled-zone sampling depths. Soil Tillage Res. 96:42–51.
Gregorich, E.G., P. Rochette, A.J. VandenBygaart, and D.A. Angers. 2005. Greenhouse gas contributions of agricultural soils and potential mitigation practices in eastern Canada. Soil Tillage Res. 83:53–72.
Hendrickson, B.H., A.P. Barnett, and O.W. Beale. 1963. Conservation methods for soils of the Southern Piedmont. Agric. Inf. Bull. 269. U.S. Gov. Print. Offi ce, Washington, DC.
Johnson, J.M.F., D.C. Reicosky, R.R. Allmaras, T.J. Sauer, R.T. Venterea, and C.J. Dell. 2005. Greenhouse gas contributions and mitigation potential of agriculture in the central USA. Soil Tillage Res. 83:73–94.
Kätterer, T., O. Andrén, and P.-E. Jansson. 2006. Pedotransfer functions for estimating plant available water and bulk density in Swedish agricultural soils. Acta Agric. Scand. 56:263–276.
Lal, R. 2004. Soil carbon sequestration impacts on global climate change and food security. Science 304:1623–1627.
Lal, R. 2008. Promise and limitations of soils to minimize climate change. J. Soil Water Conserv. 63:113A–118A.
Liebig, M.A., J.A. Morgan, J.D. Reeder, B.H. Ellert, H.T. Gollany, and G.E. Schuman. 2005. Greenhouse gas contributions and mitigation potential of agricultural practices in northwestern USA and western Canada. Soil Tillage Res. 83:25–52.
Manrique, L.A., and C.A. Jones. 1991. Bulk density of soils in relation to soil physical and chemical properties. Soil Sci. Soc. Am. J. 55:476–481.
Martens, D.A., W. Emmerich, J.E.T. McLain, and T.N. Johnsen. 2005. Atmospheric carbon mitigation potential of agricultural management in the southwestern USA. Soil Tillage Res. 83:95–119.
McCracken, R.J. 1959. Certain properties of selected southeastern United States soils and mineralogical procedures for their study. South. Region Bull. 61. Virginia Agric. Exp. Stn., Virginia Polytechnic Inst., Blacksburg.
National Agricultural Statistics Service. 2007. Census of agriculture. Vol. 1, Ch. 1: U.S. national level data. Available at www.agcensus.usda.gov/Publications/2007/Full_Report/Volume_1,_Chapter_1_US/st99_1_008_008.pdf (accessed 17 Feb. 2009; verifi ed 5 Dec. 2009). U.S. Gov. Print. Offi ce, Washington, DC.
Novak, J.M., P.J. Bauer, and P.G. Hunt. 2007. Carbon dynamics under long-term conservation and disk tillage management in a Norfolk loamy sand. Soil Sci. Soc. Am. J. 71:453–456.
Novak, J.M., J.R. Frederick, P.J. Bauer, and D.W. Watts. 2009. Rebuilding organic carbon contents in Coastal Plain soils using conservation tillage systems. Soil Sci. Soc. Am. J. 73:622–629.
Rhoton, F.E., M.J. Shipitalo, and D.L. Lindbo. 2002. Runoff and soil loss from midwestern and southeastern US silt loam soils as aff ected by tillage practice and soil organic matter content. Soil Tillage Res. 66:1–11.
Richter, D.D., D. Markewitz, S.E. Trumbore, and C.G. Wells. 1999. Rapid accumulation and turnover of soil carbon in a re-establishing forest. Nature 400:56–58.
Sainju, U.M., H.H. Schomberg, B.P. Singh, W.F. Whitehead, P.G. Tillman, and S.L. Lachnicht-Weyers. 2007. Cover crop eff ect on soil carbon fractions under conservation tillage cotton. Soil Tillage Res. 96:205–218.
Sainju, U.M., Z.N. Senwo, E.Z. Nyakatawa, I.A. Tazisong, and K.C. Keddy. 2008. Tillage, cropping systems, and nitrogen fertilizer source eff ects on soil carbon sequestration and fractions. J. Environ. Qual. 37:880–888.
Sainju, U.M., B.P. Singh, W.F. Whitehead, and S. Wang. 2006. Carbon supply and storage in tilled and nontilled soils as infl uenced by cover crops and nitrogen fertilization. J. Environ. Qual. 35:1507–1517.
Schlesinger, W.H., and J.A. Andrews. 2000. Soil respiration and the global carbon cycle. Biogeochemistry 48:7–20.
Siri-Prieto, G., D.W. Reeves, and R.L. Raper. 2007. Tillage systems for a cotton–peanut rotation with winter-annual grazing: Impacts on soil carbon, nitrogen and physical properties. Soil Tillage Res. 96:260–268.
Six, J., S.M. Ogle, F.J. Breidt, R.T. Conant, A.R. Mosier, and K. Paustian. 2004. Th e potential to mitigate global warming with no-tillage management is only realized when practiced in the long term. Global Change Biol. 10:155–160.
Spargo, J.T., M.M. Alley, R.F. Follett, and J.V. Wallace. 2008. Soil carbon sequestration with continuous no-till management of grain cropping systems in the Virginia Coastal Plain. Soil Tillage Res. 100:133–140.
Terra, J.A., D.W. Reeves, J.N. Shaw, and R.L. Raper. 2005. Impacts of landscape attributes on carbon sequestration during the transition from conventional to conservation management practices on a Coastal Plain fi eld. J. Soil Water Conserv. 60:438–446.
Trimble, S.W. 1974. Man-induced soil erosion on the Southern Piedmont: 1700–1970. Soil Water Conserv. Soc., Ankeny, IA.
Triplett, G.B., Jr., and W.A. Dick. 2008. No-till crop production: A revolution in agriculture! Agron. J. 100:S153–S165.
Truman, C.C., D.W. Reeves, J.N. Shaw, A.C. Motta, C.H. Burmester, R.L. Raper, and E.B. Schwab. 2003. Tillage impacts on soil property, runoff , and soil loss variations from a Rhodic Paleudult under simulated rainfall. J. Soil Water Conserv. 58:258–267.
VandenBygaart, A.J., X.M. Yang, B.D. Kay, and J.D. Aspinall. 2002. Variability in carbon sequestration potential in no-till soil landscapes of southern Ontario. Soil Tillage Res. 65:231–241.
West, T.O., and W.M. Post. 2002. Soil organic carbon sequestration rates by tillage and crop rotation: A global data analysis. Soil Sci. Soc. Am. J. 66:1930–1946.
Wright, A.L., and F.M. Hons. 2004. Soil aggregation and carbon and nitrogen storage under soybean cropping sequences. Soil Sci. Soc. Am. J. 68:507–513.
Wright, A.L., and F.M. Hons. 2005. Soil carbon and nitrogen storage in aggregates from diff erent tillage and crop regimes. Soil Sci. Soc. Am. J. 69:141–147.
Yang, X.M., C.F. Drury, M.M. Wander, and B.D. Kay. 2008. Evaluating the eff ect of tillage on carbon sequestration using the minimum detectable diff erence concept. Pedosphere 18:421–430.
Zibilske, L.M., J.M. Bradford, and J.R. Smart. 2002. Conservation tillage induced changes in organic carbon, total nitrogen and available phosphorus in a semi-arid alkaline subtropical soil. Soil Tillage Res. 66:153–163.