fracture mechanics life analytical methods verification ... · fracture mechanics life analytical...
TRANSCRIPT
NASA Contractor Report 4602
Fracture Mechanics Life Analytical MethodsVerification TestingJ.A. Favenesi, T.G. Clemmons, and T.J. LambertNichols Research Corporation • Huntsville, Alabama
National Aeronautics and Space AdministrationMarshall Space Flight Center • Alabama 35812
Prepared for Marshall Space Flight Centerunder Contract NAS8-38103
May 1994
https://ntrs.nasa.gov/search.jsp?R=19940032507 2018-07-11T09:40:17+00:00Z

TABLE OF CONTENTS
INTRODUCTION ....................1
TECHNICAL B A CKG ROU/_D'.I.I iii;.'.'.'._iii : ii;.'.'.'._ii: i ii.'.'.'.'._ii i iii;." .................. 2VERIFICATION AND VALIDATION METHODOLOGY ........... "................... 5RESULTS AND DISCUSSION ..................................... i...'._iii(_.'.'._i:ii_.'.'._iii 7
K vs a -- UNIFORM THICKNESS ................................................... 7100 Series Results ............................................................... 7200 Series Results ............................................................... 9300 Series Results ............................................................... 14400 Series Results ............................................................... 16600 Series Results ............................................................... 20700 Series Results ............................................................... 32800 Series Results ............................................................... 41
K vs a -- VARIABLE THICKNESS .................................................. 43Jvs a ...................................................................................... 45COA vs a ............................................ •
SUMMARY and RECOMMENDATIONS 48REFERENCES ..................................................... 50
• ''''" ........ '''**'*'* ...... '''''''" °''**'*''*'''*'***'''''''''''''*'*" '''*''''*.o 52
iii

INTRODUCTION
NASCRAC TM (NASA Crack Analysis Code - Version 2.0) is a second generation fractureanalysis code developed for NASA/MSFC. The code uses a weight function approach tosolve traditional fracture problems such as stress intensity factors and life calculation due tofatigue. NASCRAC also contains capabilities for advanced fracture analysis, e.g., crackretardation, life calculation due to creep, and elastic-plastic stress redistribution near thecrack tip. Since NASCRAC includes the computationally efficient weight function approachand a broad spectrum of advanced capabilities, NASA/MSFC expects to employ NASCRACas an integral component of the NASA Fracture Control Program for validating flighthardware. This critical role of NASCRAC in future NASA analyses dictates both a completeand objective independent verification and validation (V/V) of the code to ascertain therestrictions and ranges of applicability for each NASCRAC solution. Nichols ResearchCorporation (NRC) and its subcontractor, Cornell University, and consultant, FractureAnalysis Consultants (FAC), have been contracted by NASA/MSFC to perform such aV/V. This report discusses methodology and interim results from the V/V effort.
The current effort focuses on verification and validation of solutions embedded in
NASCRAC. No attempts are made to correct solutions or to develop new solutions. In thecase of minor programming errors, corrected versions are run offline to determine theextent of the problem.
The level of effort has been divided into two distinct areas: 1) literature research/analysis,and 2) testing. NRC has been the lead in the first effort with assistance from FAC.Comell has performed the testing effort.
The NASCRAC V/V plan partitioned the available solutions into three groups: basicinformation (BI), synthesized results (SR), and advanced capabilities (AC). This reportwill only discuss results from the BI group, including K vs a, J vs a, and crack openingarea (COA) vs a. Section II provides a succinct description of the theory behind
NASCRAC. Section III focuses on the V/V methods and decision process being used byNRC. Interim results are presented in Section IV. Recommendations and a mid contract
summary are included in Section V. Throughout the report the letter K implies KI, theopening mode stress intensity factor.
TECHNICAL BACKGROUND
NASCRAC is a fracture analysis code capable of performing linear elastic and elastic-plasticfracture analyses. NASCRAC is restricted to mode I, or opening mode, fracture.
Capabilities incorporated into NASCRAC include computation of K vs a, J vs a, COA vs a,fatigue crack growth, tolerable crack size, creep crack growth, proof test logic, tearinginstability, and localized elastic-plastic stress redistribution. NASCRAC can accept cyclical,steady-state, and random load spectrum definitions. Eleven material libraries are available:two miscellaneous steel libraries, stainless steel, AL-2024, AL-6061, AL- 7075, twomiscellaneous aluminum libraries, cast aluminum, inconel, and titanium. Users may also
define a material interactively or create a material library. Currently twenty-eight crack
configurations are incorporated in the code. Crack retardation is possible using either theWheeler or Willenborg models.
K solutions in NASCRAC are computed using encoded closed form solutions for uniformtensile loads and weight function formulations for arbitrary loads. Robust integration
routines incorporating Gaussian integration and a broad library of weight functions providean extensive computational capability for calculating K solutions of various loadings and
geometries. In the weight function approach, a K solution of a specific geometry can becalculated for an arbitrary loading by integrating a point load solution over the crack face.
This approach can be expressed as:
a
K = lo(X) h(x,a) dx0
where a = crack lengtho(x) = crack plane stress derived from the uncracked geometryh(x,a) = weight function from a known solution
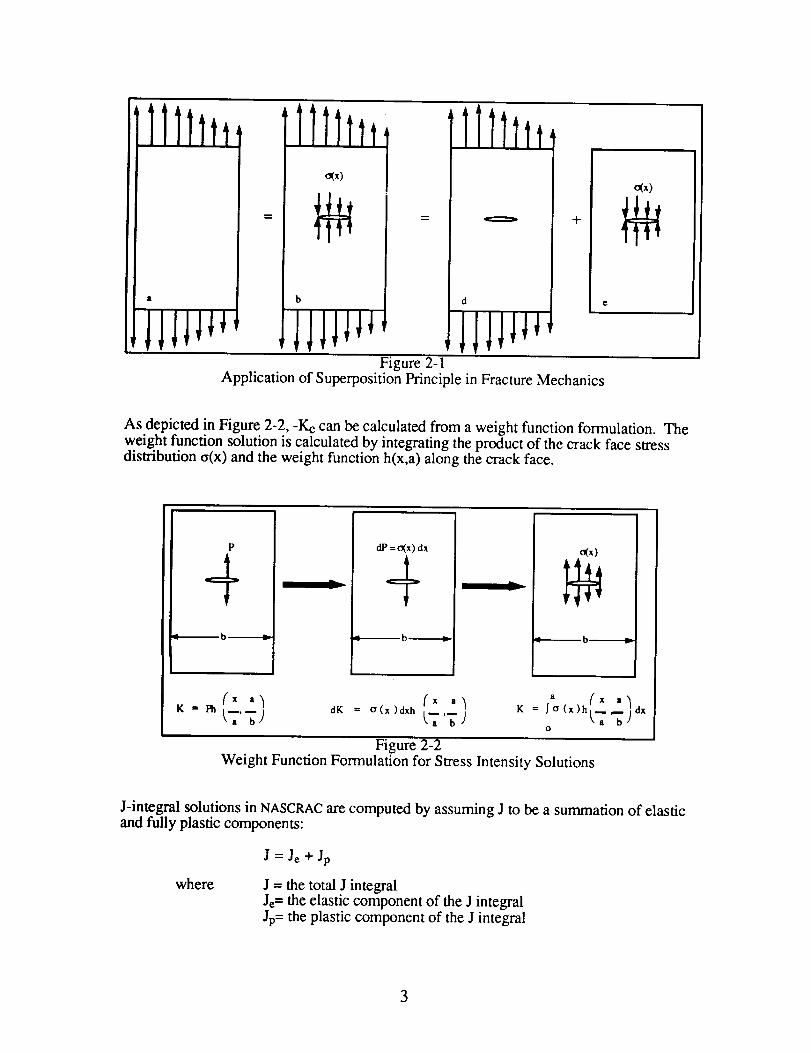
Weight functions can be determined from simple load cases and applied to unique, complexload cases. Figures 2-1 and 2-2 illustrate the weight function approach to fracture analysis.As shown in Figure 2-1, K solutions can be obtained for an arbitrary loading by employingsuperposition to reduce the arbitrary loading to two simpler loadings: a cracked geometrywith external tractions (the problem of interest) and an identical cracked geometry with
tractions only along the crack face. Since these two loadings are reduced from anuncracked problem, their K solutions sum to zero, i.e., Kd = -Ke.
2
b d
+
o(x)
Figure 2-1Application of Superposition Principle in Fracture Mechanics
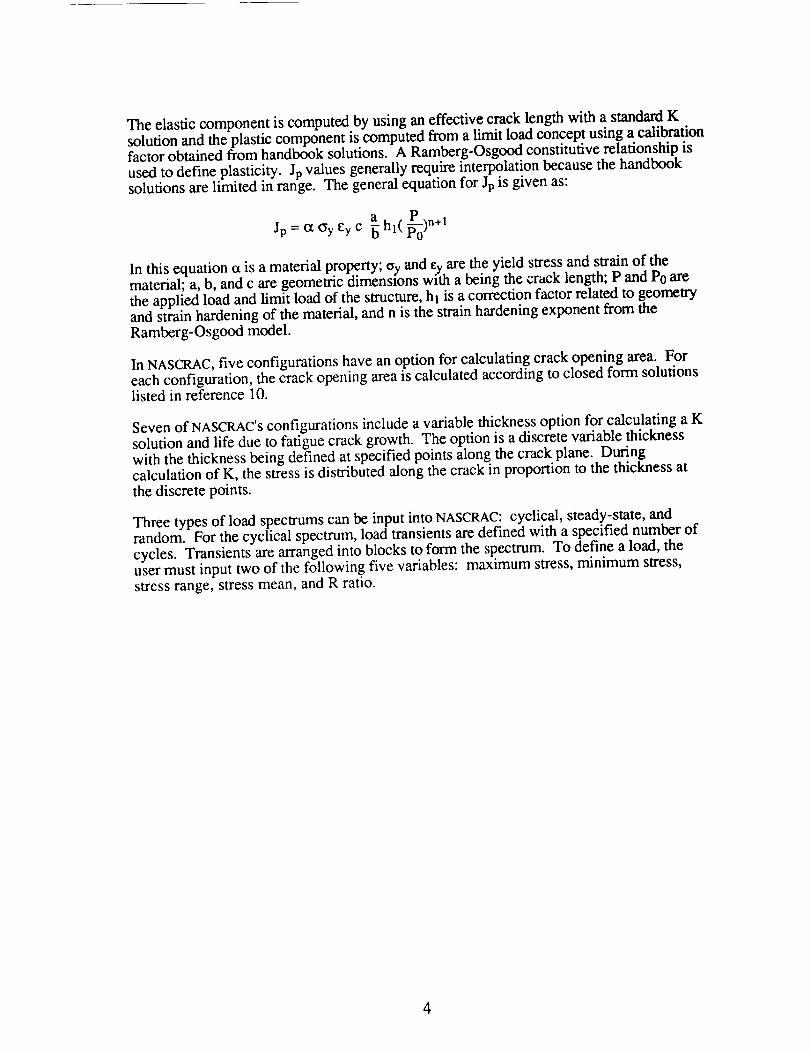
As depicted in Figure 2-2, -Ke can be calculated from a weight function formulation. Theweight function solution is calculated by integrating the product of the crack face stressdistribution a(x) and the weight function h(x,a) along the crack face.
_----------.-.----b --------------._
dP = o(x) dx
_-------- b ---------_
o(x)
_---'---------_ b ..---------------_
(x .'_ Cx ,.'_ K = i (x,_•i' a (x)h i _ ,-_,) dx0
Figure 2-2Weight Function Formulation for Stress Intensity Solutions
J-integral solutions in NASCRAC are computed by assuming J to be a summation of elasticand fully plastic components:
where
J = Je + Jp
J = the total J integralJe= the elastic component of the J integralJp= the plastic component of the J integral
Theelasticcomponentis computedbyusinganeffectivecracklengthwith a standard Ksolution and the plastic component is computed from a limit load concept using a calibrationfactor obtained from handbook solutions. A Ramberg-Osgood constitutive relatlonsmp is
used to define plasticity. Jp values generally require interpolation because the handbooksolutions are limited in range. The general equation for Jp is given as:
a P "n+lJp = Or, t_y Ey c _ hl( _00 )
In this equation a is a material property; cy and ey are the yield stress and strain of thematerial; a, b, and c are geometric dimensions with a being the _ack length; P and P0 are
the applied load and limit load of the structure, hi is a correction factor related to geometryand strain hardening of the material, and n is the strain hardening exponent from the
Ramberg-Osgood model.
In NASCRAC, five configurations have an option for calculating crack opening area. Foreach configuration, the crack opening area is calculated according to closed form solutionslisted in reference 10.
Seven of NASCRAC'S configurations include a variable thickness option for calculating a Ksolution and life due to fatigue crack growth. The option is a discrete variable thicknesswith the thickness being defined at specified points along the crack plane. Duringcalculation of K, the stress is distributed along the crack in proportion to the thickness at
the discrete points.
Three types of load spectrums can be input into NASCRAC" cyclical, steady-state, andrandom. For the cyclical spectrum, load transients are defined with a specified number of
cycles. Transients are arranged into blocks to form the spectrum. To define a load, theuser must input two of the following five variables: maximum stress, minimum stress,
stress range, stress mean, and R ratio.
4
VERIFICATION AND VALIDATION METHODOLOGY
The NASCRAC V/V plan is a comparative approach using three different types of referencesolutions: 1) documented solutions from the literature, including closed form and
graphical solutions, 2) finite element and boundary element solutions, and 3) testing.NASCRAC solutions were categorized into three areas: Basic Information (BI), SynthesizedResults (SR), and Advanced Capabilities (AC). The BI category includes K vs a, J vs a,and crack opening area (COA) vs a. The SR category includes life calculations due to
fatigue and creep, tolerable crack size, proof test logic, and tearing instability. The ACcategory includes elastic-plastic stress redistribution and crack transitioning. This reportpresents methodology and results solely from the BI category.
A minimum of 422 solutions are available in NASCRAC. This quantity was derived bysumming the number of crack topologies available for each NASCRAC capability.Variations in loading conditions were not included in the tabulation. Each NASCRAC
solution group, i.e., BI, SR, and AC, requires a different V/V approach. BI solutions aredependent on analytical, numerical, and experimental results external to NASCRAC plus theweight function feature of NASCRAC. Solutions in the SR category use a number ofprogrammed theoretical or empirical crack-growth rate and stability models (e.g., Paris'sequation) plus data calculated or interpolated from BI results to synthesize or computeresults. An accurate SR depends on the accuracy of the BI and also on the proper choiceof a theoretical or empirical model for the physical problem. Thus, verification of Blsolutions can be accomplished with literature and numerical analyses whereas verificationof an SR solution requires verifying the BI and determining the applicability of the chosenempirical or theoretical model using experimental and numerical techniques. AC solutions(spectrum loading, elastic-plastic stress redistribution, crack transitioning) require BIresults and advanced theoretical formulations. Accurate AC solutions are stronglydependent on understanding the range for which the formulation is applicable.
A three-step V/V procedure has been used for the BI solutions: 1) check coded equations,2) check weight function capability, and 3) check variable thickness functionality. Thecoded equations have been checked by review of the NASCRAC source code or bycomparison of NASCRAC results to literature sources. If reasonable agreement betweenNASCRAC and the literature source is not found, an independent solution using finiteelement analysis has been generated. Agreement between the literature source and the finiteelement solution indicates an error in NASCRAC. Agreement between NASCRAC and thefinite element solution suggests a problem with the literature source. Such disagreementwith the literature has been resolved by obtaining a second literature source.
Independent integration external to NASCRAC was used to check the NASCRAC integrationroutines. The external routines were based on a Romberg integration algorithm whichdiffered from the Gaussian algorithm in NASCRAC.
The accuracy of NASCRAC's ability to estimate K solutions for variable thickness planarbodies using weight function solutions has been determined by comparing NASCRACresults with finite element results. The finite element models included up to third orderpolynomial variation in global thickness.
Several references have been used extensively for V/V of the BI solutions. For K vs asolutions and uniform or bending loads, references 10 and 12 provided graphical, curve fit,and closed form solutions. Reference 12 also contained closed form point load solutionsfor certain NASCRAC configurations. These point load solutions were integratednumerically to verify the NASCRAC weight function solution. Reference 14 was also aprimary reference for weight function solution V/V. For several of the non-through crack
K vs a, J vs a, and crack opening area (COA) vs a solutions, references 6 and 11 were
critical resources.
References 5 and 6 were the primary V/V sources for NASCRAC'S seven J vs a
configurations. These two references listed the coefficient tables coded into NASCRAC inaddition to the coded equations.
Three different NASCRAC BI sections were verified by direct comparison of coded
equations with literature sources. In the 100 series configurations (ASTM standard fracturetoughness specimens), the coded equations were compared to reference 2, ASTM E 399.For the J-integral capabilities, the coded limit load (P0) equations were compared to
reference 5. Finally, for the five COA vs a configurations, the coded equations werecompared to equations listed in references 12 and 14.
FRANC and FRANC-3D, fracture specific finite element codes, were employed in the K vs aV/V efforts. These workstation based codes allow an analyst to compute stress intensityfactors for arbitrary cracks in arbitrary bodies. Menu-driven post-processing tools provide
both numerical and graphical results.
RESULTS AND DISCUSSION
The techniques described in the previous section have been used to verify and validate theK vs a, J vs a, and COA vs a solutions in NASCRAC. Results have ranged from identicaland acceptable solutions versus references to coding errors, documentation errors, andunacceptable solutions. This section presents V/V results of NASCRAC solutions in whicherrors and/or recommendations have been determined.
K vs a -- UNIFORM THICKNESS
The uniformly thick K solutions in NASCRAC are the key to the code's capabilities. Thereare twenty-eight (28) uniformly thick K solutions. These solutions permit static checks ofK versus KIc and also drive the fatigue crack growth and the tolerable crack sizecapabilities.
100 Series Results
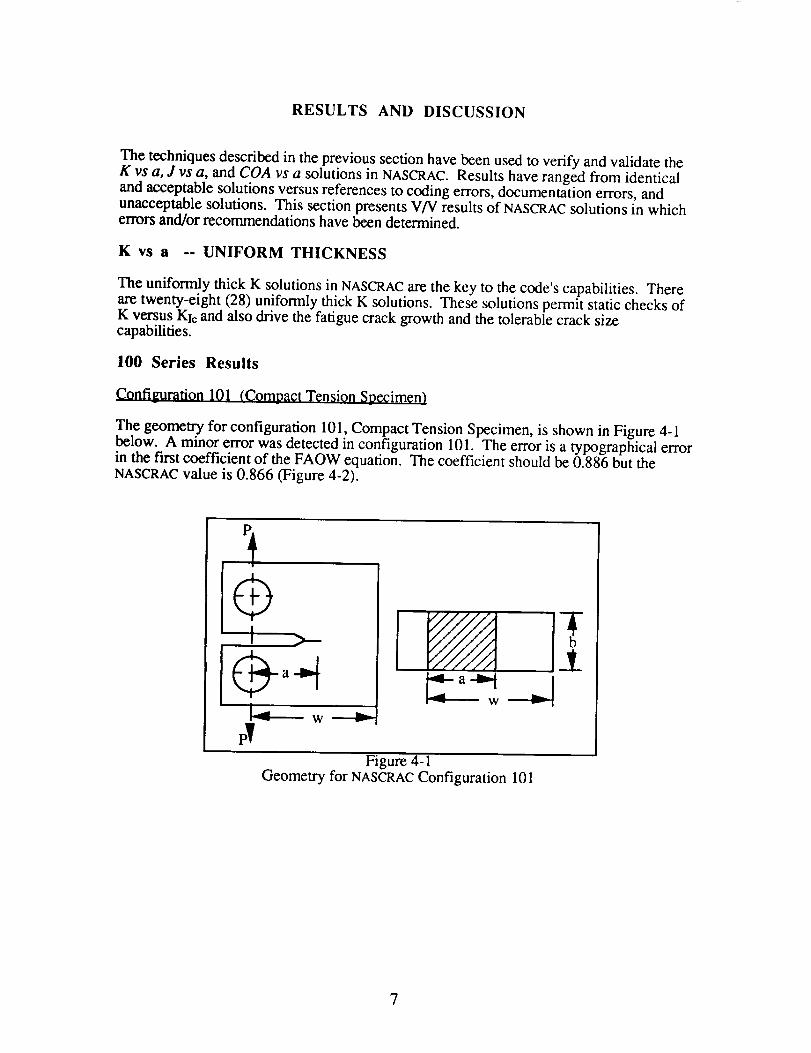
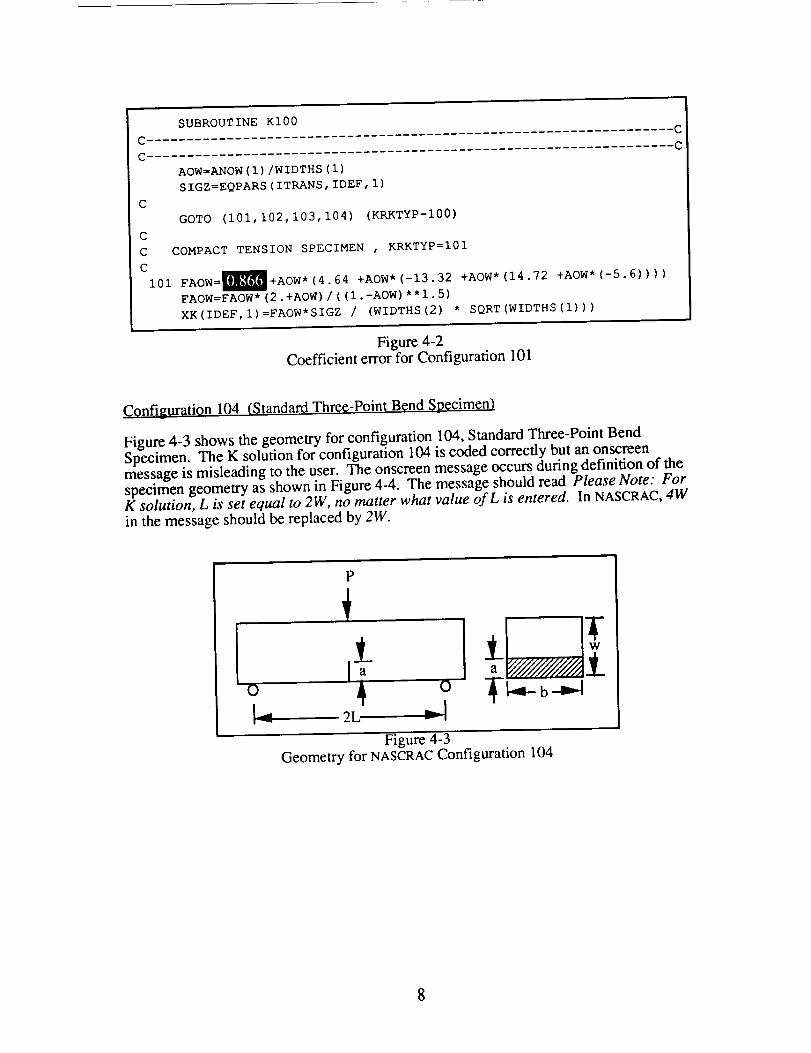
Configuration 101 (Compact Tension Specimen)
The geometry for configuration 101, Compact Tension Specimen, is shown in Figure 4-1below. A minor error was detected in configuration 101. The error is a typographical errorin the fast coefficient of the FAOW equation. The coefficient should be 0.886 but theNASCRAC value is 0.866 (Figure 4-2).
I >---
1.4v----- w
Figure 4-1Geometry for NASCRAC Configuration 101
SUBROUTINE KIO0C
C-_°
CC--"
C
C
C
C
i01
AOW=ANOW (1 ) /WIDTHS (1 )
SIGZ=EQPARS (ITRANS, IDEF, i)
GOTO (i01,102,103,104) (KRKTYP-100)
COMPACT TENSION SPECIMEN , KRKTY P=I01
FAOW=M+AOW*(4.64 +AOW* (-13.32 +AOW* (14.72 +AOW* (-5.6))))
FAOW=FAOW * (2 .+AOW) / ((I.-AOW) **i. 5)
XK(IDEF, I)=FAOW*SIGZ / (WIDTHS (2) * SQRT(WIDTHS(1)) )
Figure 4-2Coefficient error for Configuration 101
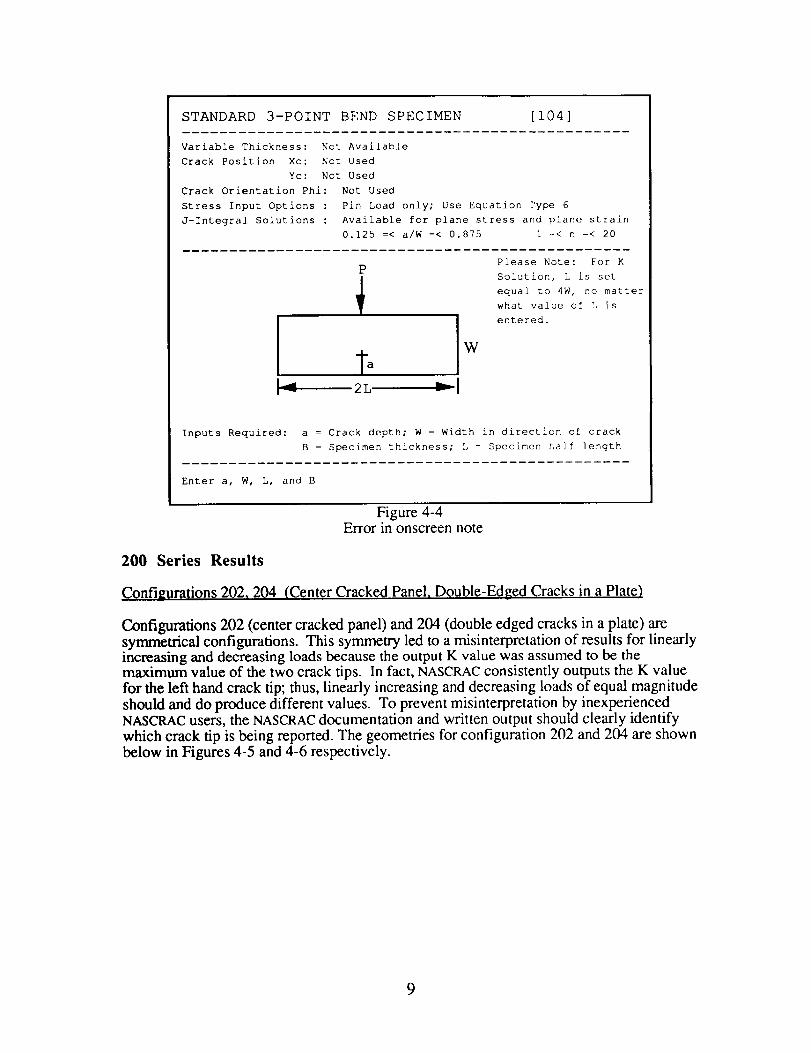
Configuration 104 (Standard Three-Point Bend Specimen)
Figure 4-3 shows the geometry for configuration 104, Standard Three-Point BendSpecimen. The K solution for configuration 104 is coded correctly but an onscreenmessage is misleading to the user. The onscreen message occurs during definition of thespecimen geometry as shown in Figure 4-4. The message should read Please Note: ForK solution, L is set equal to 2W, no matter what value of L is entered. In NASCRAC, 4W
in the message should be replaced by 2W.
P
lao oI_ 2L| _
Figure 4-3
Geometry for NASCRAC Configuration 104
8
STANDARD 3-POINT BEND SPECIMEN [104]
Variable Thickness: Not Available
Crack Position Xc: Not Used
Yc: Not Used
Crack Orientation Phi: Not Used
Stress Input Options : Pin Load only; Use Equation Type 6
J-Integral Solutions : Available for plane stress and plane strain
0.125 =< a/W =< 0.875 1 =< n =< 20
I-._dm
P
Ta Iw2L ----'-I
Please Note: For K
Solution, L is set
equal to 4W, no matter
what value of L is
entered.
Inputs Required: a = Crack depth; W = Width in direction of crack
B = Specimen thickness; L = Specimen half length
Enter a, W, L, and B
Figure 4-4Error in onscreen note
200 Series Results
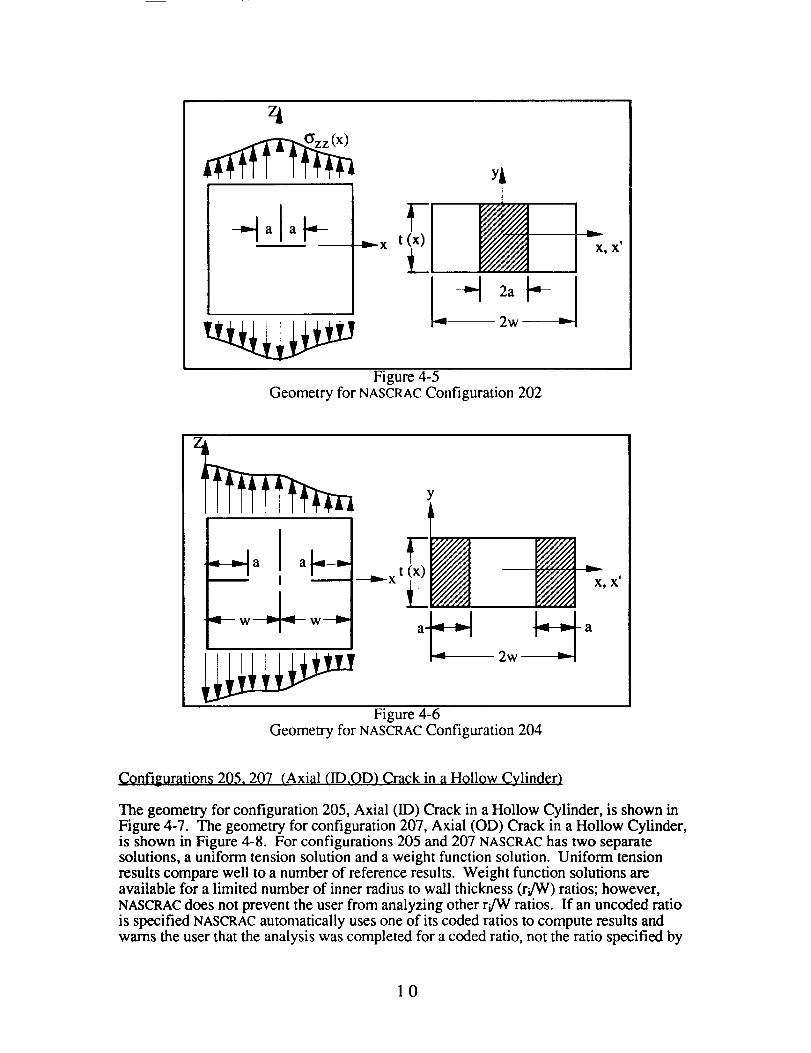
Configorafions 202, 204 (Center Cracked Panel, Double-Edged Cracks in a Plate)
Configurations 202 (center cracked panel) and 204 (double edged cracks in a plate) aresymmetrical configurations. This symmetry led to a misinterpretation of results for linearlyincreasing and decreasing loads because the output K value was assumed to be themaximum value of the two crack tips. In fact, NASCRAC consistently outputs the K valuefor the left hand crack tip; thus, linearly increasing and decreasing loads of equal magnitude
should and do produce different values. To prevent misinterpretation by inexperiencedNASCRAC users, the NASCRAC documentation and written output should clearly identifywhich crack tip is being reported. The geometries for configuration 202 and 204 are shown
below in Figures 4-5 and 4-6 respectively.
9
-qa{a _x t (x)
,-- 2w
X !
Figure 4-5Geometry for NASCRAC Configuration 202
Y
a
Figure 4-6Geometry for NASCRAC Configuration 204
Configurations 205. 207 (Axial (ID,OD) Crack in a Hollow Cylinder)v
The geometry for configuration 205, Axial (ID) Crack in a Hollow Cylinder, is shown inFigure 4-7. The geometry for configuration 207, Axial (OD) Crack in a Hollow Cylinder,is shown in Figure 4-8. For configurations 205 and 207 NASCRAC has two separatesolutions, a uniform tension solution and a weight function solution. Uniform tension
results compare well to a number of reference results. Weight function solutions areavailable for a limited number of inner radius to wall thickness (r._¢) ratios; however,
NASCRAC does not prevent the user from analyzing other r.a_V ratios. If an uncoded ratiois specified NASCRAC automatically uses one of its coded ratios to compute results andwarns the user that the analysis was completed for a coded ratio, not the ratio specified by
10
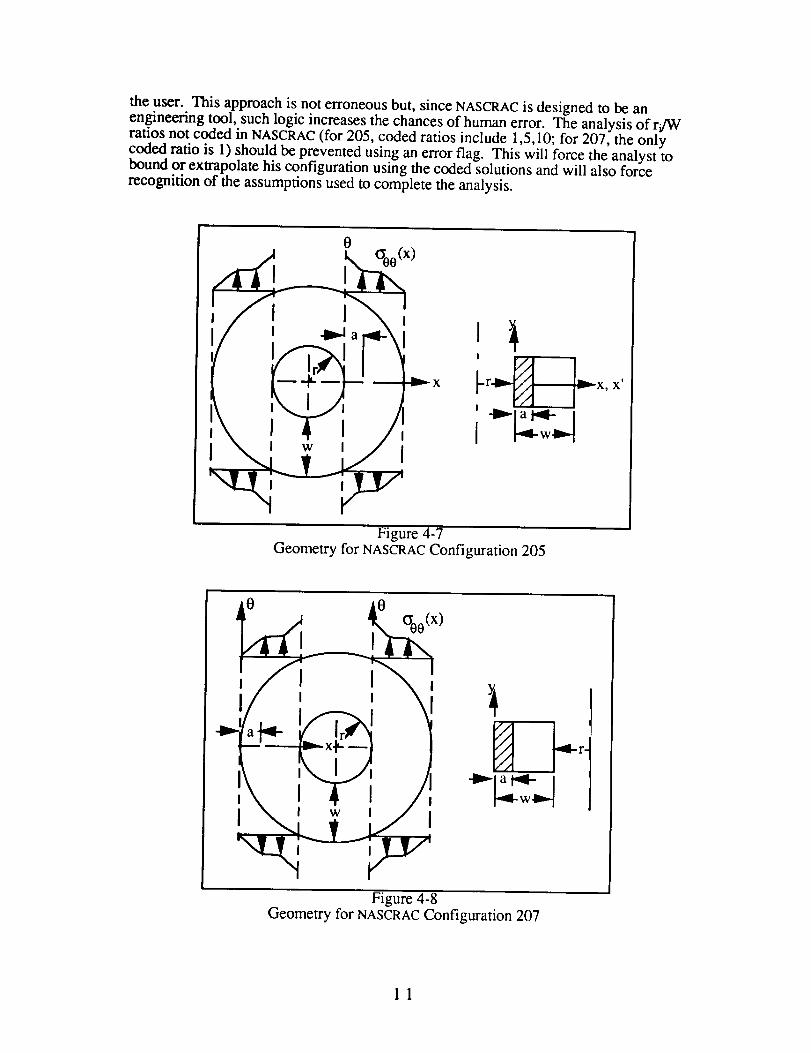
the user. This approach is not erroneous but, since NASCRAC is designed to be anen.gineering tool, such logic increases the chances of human error. The analysis of r.dW
rauos not coded in NASCRAC (for 205, coded ratios include 1,5,10; for 207, the onlycoded ratio is 1) should be prevented using an error flag. This will force the analyst tobound or extrapolate his configuration using the coded solutions and will also force
recognition of the assumptions used to complete the analysis.
0
'I!
x,r X,
l
Figure 4-7Geometry for NASCRAC Configuration 205
I , i I
I , i {I w I
Figure 4-8Geometry for NASCRAC Configuration 207
11
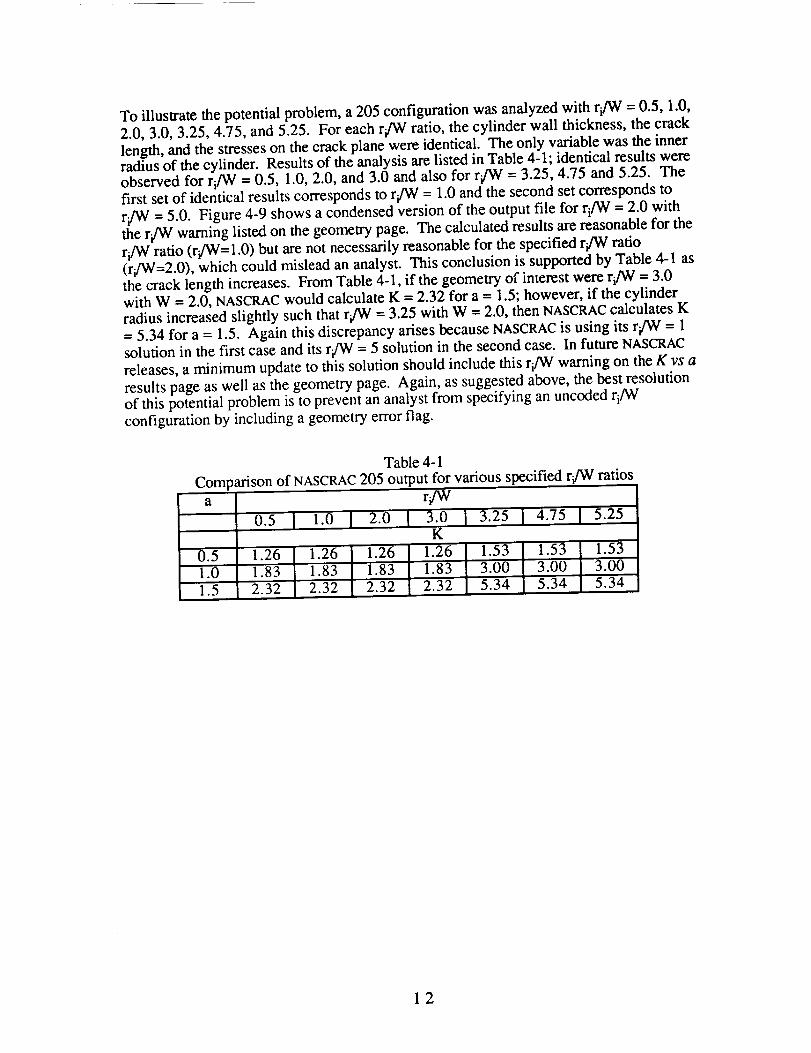
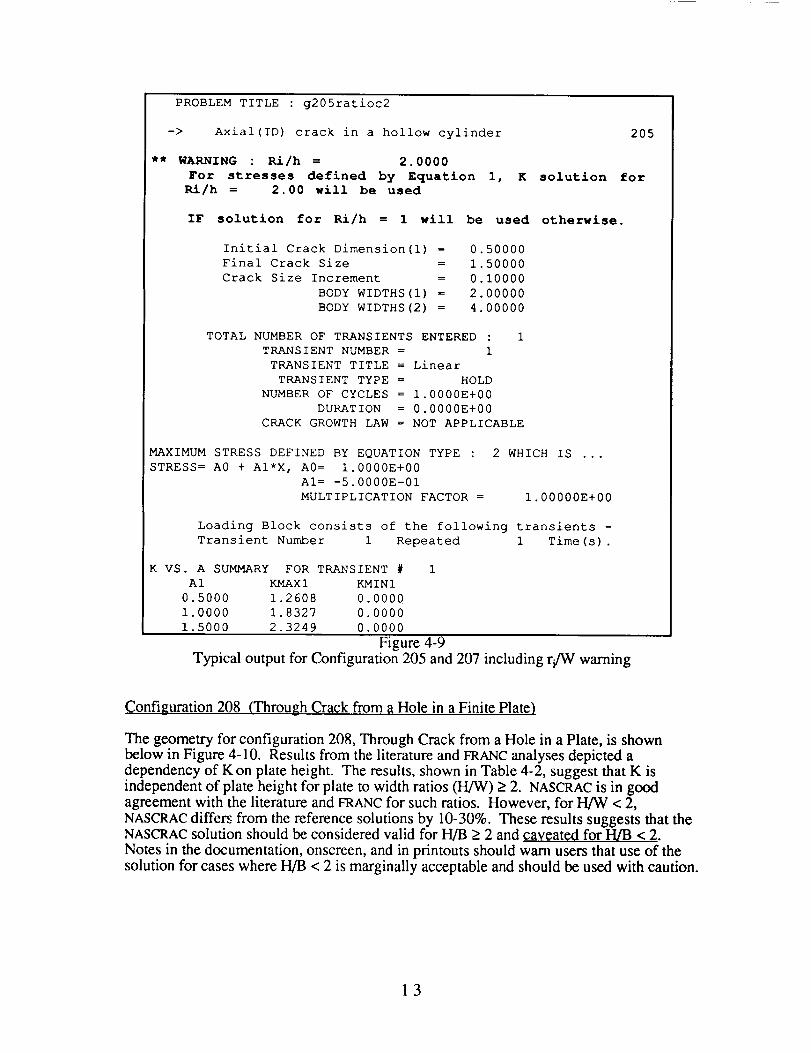
To illustratethepotentialproblem,a205configurationwasanalyzedwith ri/W = 0.5, 1.0,2.0, 3.0,3.25,4.75,and5.25. Foreachri/W ratio, thecylinderwall thickness,thecracklength,andthestresseson thecrackplanewereidentical.Theonly variablewastheinnerradiusof thecylinder. Resultsof theanalysisarelistedinTable4-1; identicalresultswereobservedfor ri/W = 0.5, 1.0,2.0, and3.0 andalsofor r._W= 3.25,4.75and5.25. Thefirst setof identicalresultscorrespondsto r._q = 1.0andthesecondsetcorrespondstor.JW= 5.0. Figure4-9 showsacondensedversionof theoutputfile for ri/W = 2.0withther-_tWwarninglistedon thegeometrypage.Thecalculatedresultsarereasonablefor theri/W ratio (r.JW=l.0)butarenotnecessarilyreasonablefor thespecifiedri/W ratio(r-_V=2.0),whichcouldmisleadananalyst.Thisconclusionis supportedby Table4-1 asthecracklengthincreases.FromTable4-1, if thegeometryof interestwereri/W = 3.0with W = 2.0,NASCRACwouldcalculateK = 2.32for a= 1.5;however,if thecylinderradiusincreasedslightly suchthatri/W = 3.25with W = 2.0,thenNASCRACcalculatesK= 5.34for a = 1.5. Again thisdiscrepancyarisesbecauseNASCRACis using its r.r/W= 1solutionin thefirst caseandits ri/W = 5 solutionin thesecondcase.In futureNASCRACreleases,aminimumupdateto thissolutionshouldincludethisri/W warningon theK vs a
results page as well as the geometry page. Again, as suggested above, the best resolutionof this potential problem is to prevent an analyst from specifying an uncoded ri/W
configuration by including a geometry error flag.
Table 4-1
Comparison of NASCRAC 205 output for various specified r-JW ratios
0.5
1.0
1.5
few0.5 1.0 2.0 3.0 3.25 4.75 5.25
K
1.26 1.26 1.26 1.26 1.53 1.53 1.53
1.83 1.83 1.83 1.83 3.00 3.00 3.002.32 2.32 2.32 2.32 5.34 5.34 5.34
12
PROBLEM TITLE : g205ratioc2
-> Axial(ID) crack in a hollow cylinder
** WARNING : Ri/h = 2.0000
For stresses defined by Equation I,
Ri/h = 2.00 will be used
K solution for
IF solution for Ri/h = 1 will be used otherwise.
Initial Crack Dimension(l) = 0.50000
Final Crack Size = 1.50000
Crack Size Increment = 0.10000
BODY WIDTHS(l) = 2.00000
BODY WIDTHS(2) = 4.00000
TOTAL NUMBER OF TRANSIENTS ENTERED : 1
TRANSIENT NUMBER = 1
TRANSIENT TITLE = Linear
TRANSIENT TYPE = HOLD
NUMBER OF CYCLES = 1.0000E+00
DURATION = 0.0000E+00
CRACK GROWTH LAW = NOT APPLICABLE
MAXIMUM STRESS DEFINED BY EQUATION TYPE :
STRESS = A0 + AI*X, A0 = 1.0000E+00
AI= -5.0000E-01
MULTIPLICATION FACTOR =
2 WHICH IS ...
1.00000E+00
Loading Block consists of the following transients -
Transient Number 1 Repeated 1 Time(s).
K VS. A SUMMARY FOR TRANSIENT #
A1 KMAXI KMINI
0.5000 1.2608 0.0000
1.0000 1.8327 0.0000
1.5000 2.3249 0.0000
205
Figure 4-9Typical output forConfigurafion 205 and 207 including r-/Wwarning
Configuration 208 (Through Crack from a Hole in a Finite Plate)
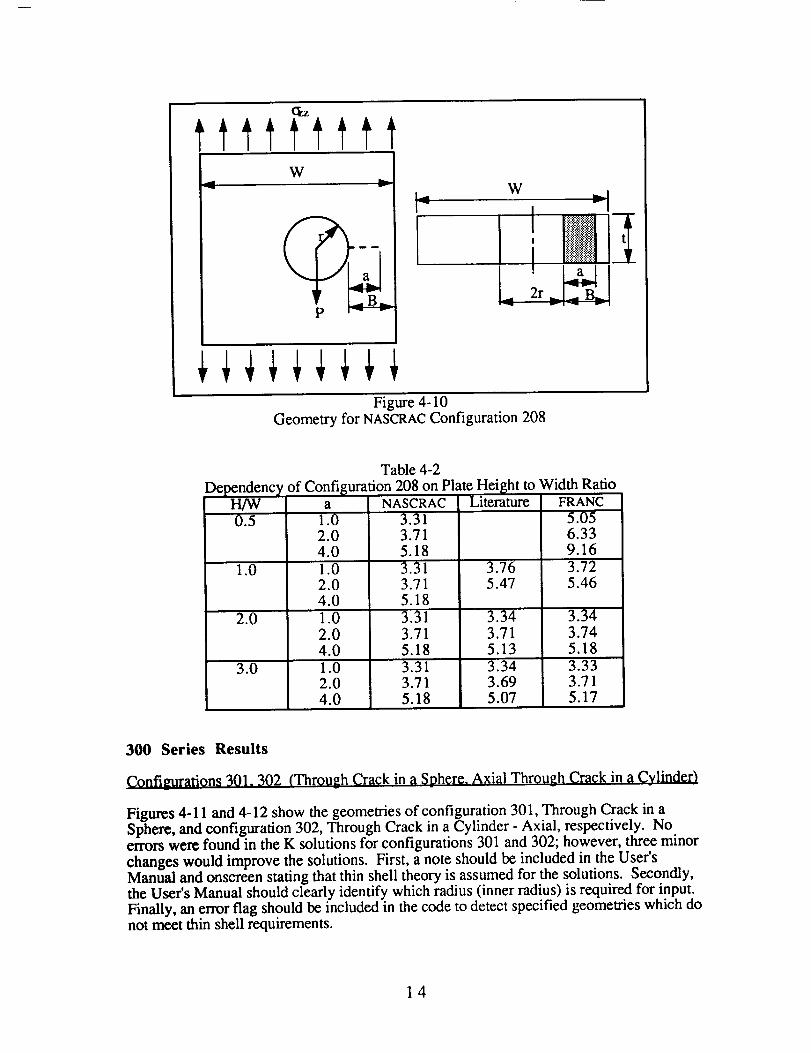
The geometry for configuration 208, Through Crack from a Hole in a Plate, is shownbelow in Figure 4-10. Results from the literature and FRANC analyses depicted adependency of K on plate height. The results, shown in Table 4-2, suggest that K isindependent of plate height for plate to width ratios (H/W) > 2. NASCRAC is in goodagreement with the literature and FRANC for such ratios. However, for H/W < 2,
NASCRAC differs from the reference solutions by 10-30%. These results suggests that theNASCRAC solution should be considered valid for H/B > 2 and caveat¢O for I-I/B < 2.Notes in the documentation, onscreen, and in printouts should warn users that use of the
solution for cases where H/B < 2 is marginally acceptable and should be used with caution.
13
t_tz
Wv
a
W ,...._
, I!ilil_l_il
i ::_:::__..<_,:i
Figure 4-10Geometry for NASCRAC Configuration 208
Table 4-2
Dependency of Configuration 208 on Plate Height to Width RatioH/W a NASCRAC Literature FRANC
0.5
1.0
2.0
3.0
1.02.04.0
1.02.04.0
1.02.04.0
1.02.04.0
3.313.715.18
3.313.715.18
3.31
3.715.183.313.715.18
3.765.47
3.343.715.13
3.343.695.07
5.056.339.16
3.725.46
3.343.745.18
3.333.715.17
300 Series Results
Configurations 301. 302 (Through Crack in a Sphere. Axial Through Crack in a Cylinder)
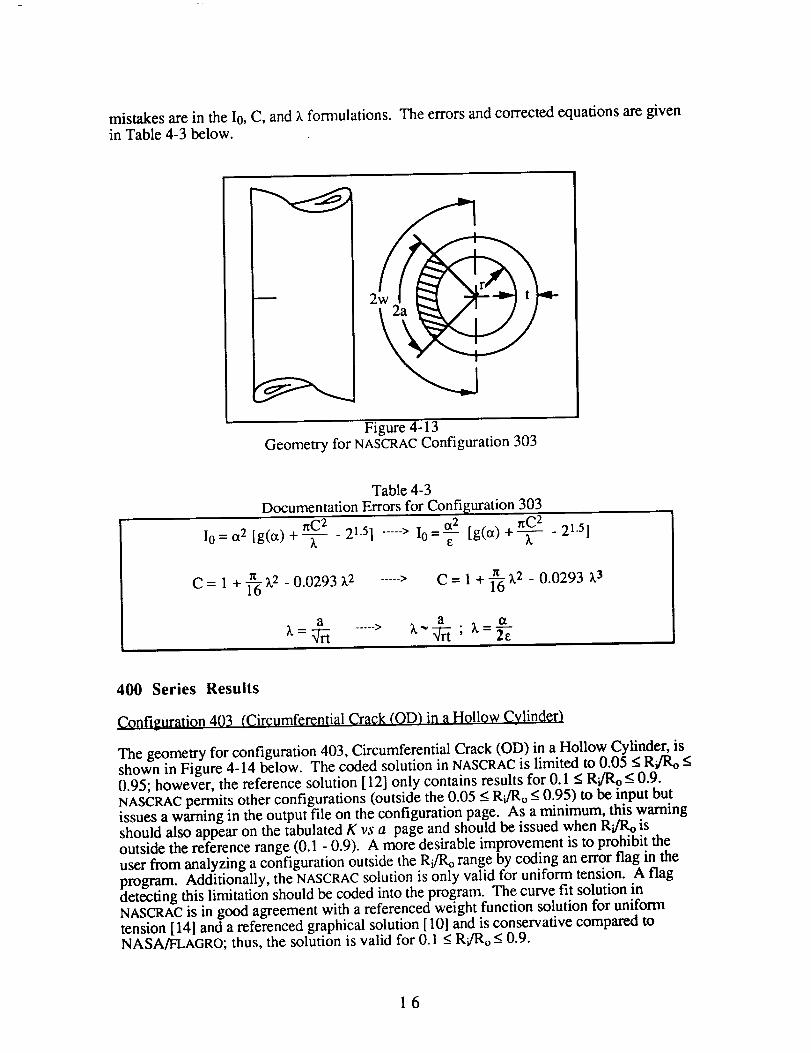
Figures 4-11 and 4-12 show the geometries of configuration 301, Through Crack in aSphere, and configuration 302, Through Crack in a Cylinder - Axial, respectively. Noerrors were found in the K solutions for configurations 301 and 302; however, three minor
changes would improve the solutions. First, a note should be included in the User'sManual and onscreen stating that thin shell theory is assumed for the solutions. Secondly,the User's Manual should clearly identify which radius (inner radius) is required for input.Finally, an error flag should be included in the code to detect specified geometries which donot meet thin shell requirements.
14
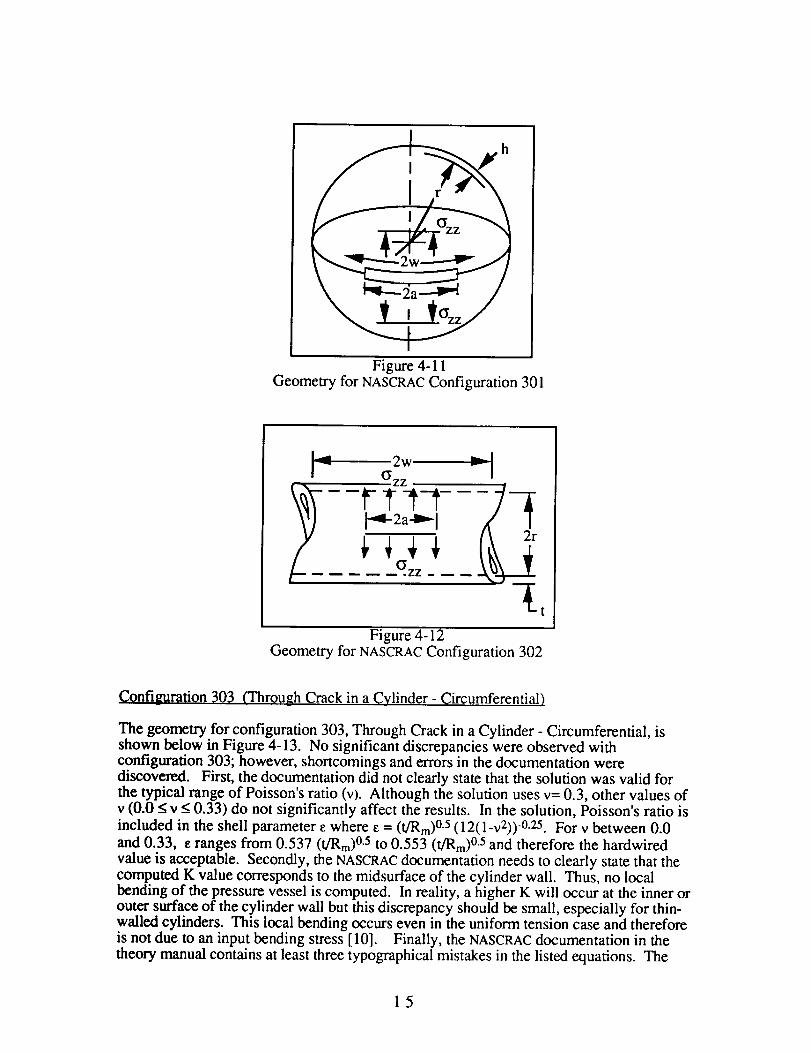
Figure4-11Geometryfor NASCRACConfiguration301
2wI'_ Gz z
I-4-2a- 12r
t ,i
Figure 4-12Geometry for NASCRAC Configuration 302
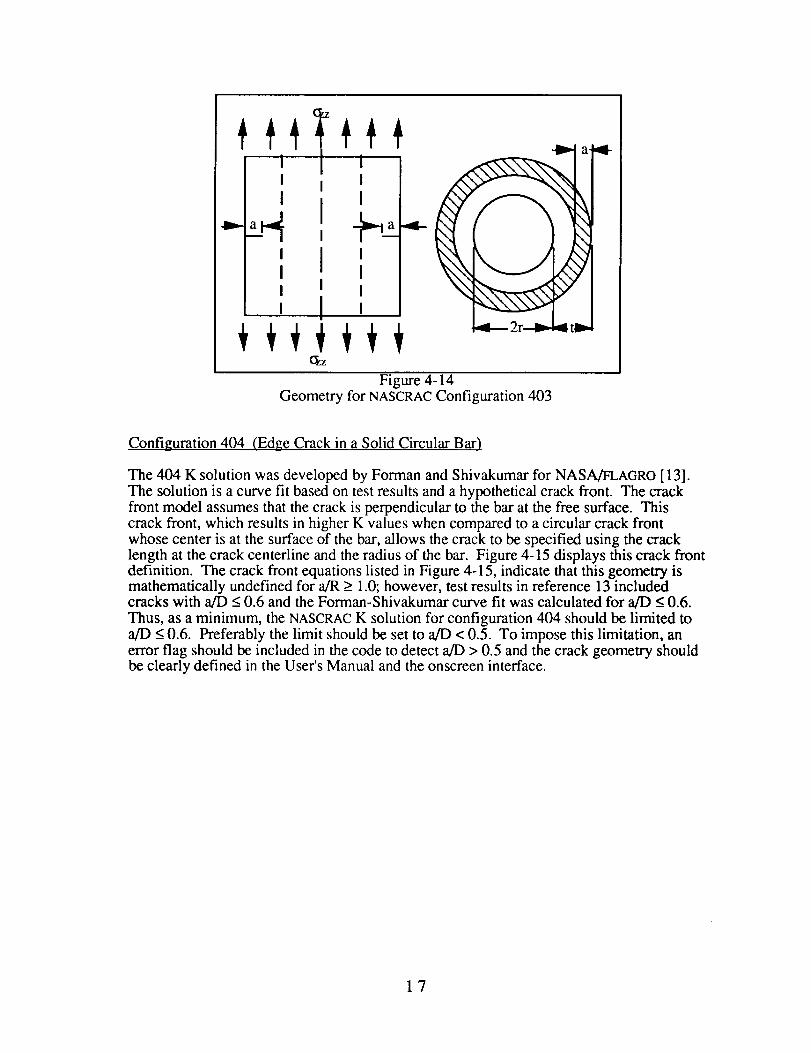
Configurdtion 303 O'hrough Crack in a Cylinder - Circumferential)
The geometry for configuration 303, Through Crack in a Cylinder - Circumferential, isshown below in Figure 4-13. No significant discrepancies were observed withconfiguration 303; however, shortcomings and errors in the documentation werediscovered. First, the documentation did not clearly state that the solution was valid forthe typical range of Poisson's ratio (v). Although the solution uses v= 0.3, other values ofv (0.0 < v < 0.33) do not significantly affect the results. In the solution, Poisson's ratio is
included in the shell parameter e where e = (t/Rm) °'5 (12(1-v2)) -°-25. For v between 0.0
and 0.33, e ranges from 0.537 (t/Rm) °.5 to 0.553 (t/Rm)0.5 and therefore the hardwiredvalue is acceptable. Secondly, the NASCRAC documentation needs to clearly state that thecomputed K value corresponds to the midsurface of the cylinder wall. Thus, no localbending of the pressure vessel is computed. In reality, a higher K will occur at the inner orouter surface of the cylinder wall but this discrepancy should be small, especially for thin-walled cylinders. This local bending occurs even in the uniform tension case and thereforeis not due to an input bending stress [10]. Finally, the NASCRAC documentation in the
theory manual contains at least three typographical mistakes in the listed equations. The
15
mistakesarein theI0,C, and_,formulations.Theerrorsandcorrectedequationsaregivenin Table4-3below.
2
Figure4-13Geometryfor NASCRACConfiguration303
Table4-3DocumentationErrorsfor Configuration303
Ct2 nC 2
nC2 21.5] ..... > I0 [g(a) +--_-- - 21"5]I0 = ct2 [g(a) + _ - = -_-
C = 1 + 1_ z'2 - 0.0293 _2 C = 1 +-_6 z'2 - 0.0293 Z.3
a
_=:_a ..... > k" :_ ," Z.-2e
400 Series Results
Configuration 403 (Circumferential Crack (OD) in a Hollow Cylinder)
The geometry for configuration 403, Circumferential Crack (OD) in a Hollow Cylinder, isshown in Figure 4-14 below. The coded solution in NASCRAC is limited to 0.05 < Ri/Ro <0.95; however, the reference solution [12] only contains results for 0.1 < R'JRo < 0.9.NASCRAC permits other configurations (outside the 0.05 < Ri/Ro < 0.95) to be input butissues a warning in the output file on the configuration page, As a minimum, this warningshould also appear on the tabulated K vs a page and should be issued when Ri/Ro isoutside the reference range (0.1 - 0.9). A more desirable improvement is to prohibit the
user from analyzing a configuration outside the Ri/Ro range by coding an error flag in theprogram. Additionally, the NASCRAC solution is only valid for uniform tension. A flagdetecting this limitation should be coded into the program. The curve fit solution inNASCRAC is in good agreement with a referenced weight function solution for uniformtension [ 14] and a referenced graphical solution [ 10] and is conservative compared toNASA/FLAGRO; thus, the solution is valid for 0.1 < R.JRo < 0.9.
16
I
II
I
' III
I ,I I
I ,
a,91-
",2
._-.- 2r--_ 4t_
Figure 4-14Geometry for NASCRAC Configuration 403
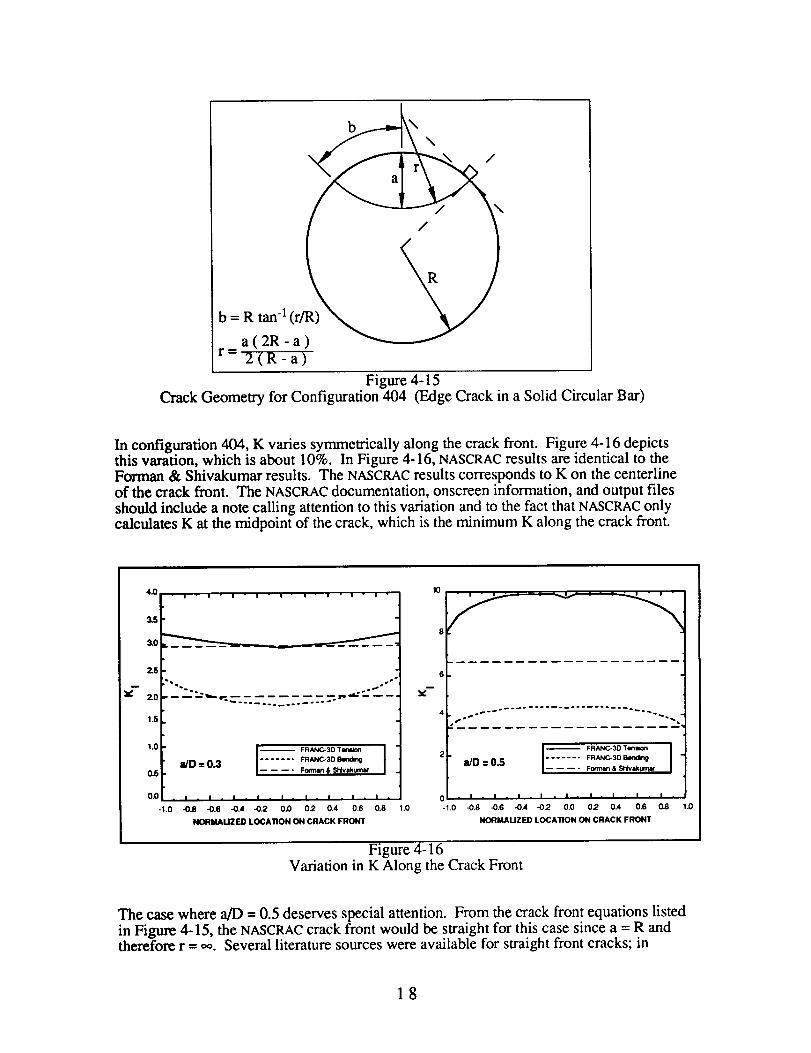
Configuration 404 (Edge Crack in a Solid Circular Bar)
The 404 K solution was developed by Forman and Shivakumar for NASA/FLAGRO [13].
The solution is a curve fit based on test results and a hypothetical crack front. The crackfront model assumes that the crack is perpendicular to the bar at the free surface. Thiscrack front, which results in higher K values when compared to a circular crack frontwhose center is at the surface of the bar, allows the crack to be specified using the cracklength at the crack centerline and the radius of the bar. Figure 4-15 displays this crack frontdefinition. The crack front equations listed in Figure 4-15, indicate that this geometry ismathematically undefined for a/R > 1.0; however, test results in reference 13 includedcracks with a/D < 0.6 and the Forman-Shivakumar curve fit was calculated for a/D < 0.6.
Thus, as a minimum, the NASCRAC K solution for configuration 404 should be limited toa/D < 0.6. Preferably the limit should be set to a/D < 0.5. To impose this limitation, anerror flag should be included in the code to detect a/D > 0.5 and the crack geometry shouldbe clearly defined in the User's Manual and the onscreen interface.
17
b = R tan -1 (r/R) _ _/"
a(2R-a)r= 2(R-a)
Figure 4-15Crack Geometry for Configuration 404 (Edge Crack in a Solid Circular Bar)
In configuration 404, K varies symmetrically along the crack front. Figure 4-16 depictsthis varation, which is about 10%. In Figure 4-16, NASCRAC results are identical to theForman & Shivakumar results. The NASCRAC results corresponds to K on the centerlineof the crack front. The NASCRAC documentation, onscreen information, and output files
should include a note calling attention to this variation and to the fact that NASCRAC onlycalculates K at the midpoint of the crack, which is the minimum K along the crack front.
4.O" i " | - | - a - i - i " i - i " i "
3,51"
2.5 L
1.5 .
I Ia/D = 0.3 m_e.3o _,*_0.5 ll- Fomutn & Shivakurnar
• I • I • I . I . I . I . I . I - I .
-1.0 -0.8 .0.6 -0.4 -0.2 0.0 0.2 0.4 0.6 0.8
NORMAUZEID LOCATION ON CRACK FRONT
1.0
6
v--
I FRANC- 3D Tenlion2 J]D = 0,5 ....... FRANC-3D Bending
Fom,.an& Shlvaktm,,ar
• I • I • I - I . I . I . I . I .
-I.0 -0,8 .0.6 -0.4 -0.2 0.0 0.2 0.4 0.6
NORMAUZED LOCATION ON CRACK FRONT
D,
I! .
O,8 1.0
Figure 4-16Variation in K Along the Crack Front
The case where aft) = 0.5 deserves special attention. From the crack front equations listedin Figure 4-15, the NASCRAC crack front would be straight for this case since a = R andtherefore r = 0o. Several literature sources were available for straight front cracks; in
18
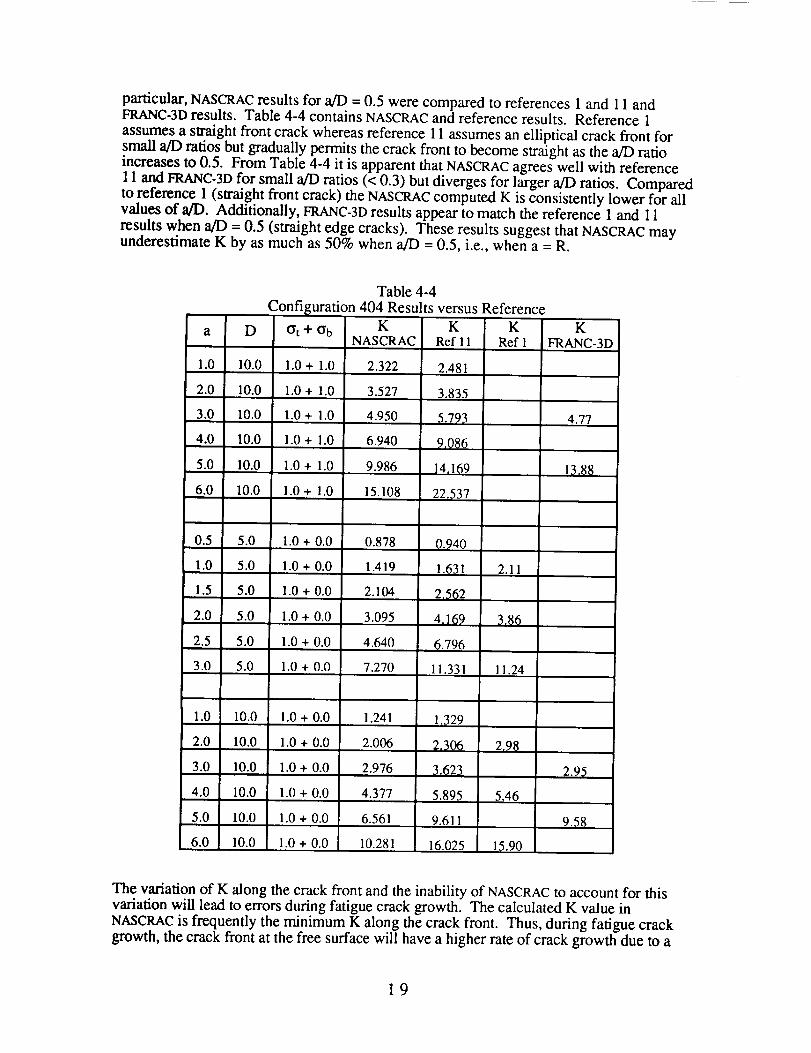
particular, NASCRAC results for a/D = 0.5 were compared to references 1 and 11 andFRANC-3D results. Table 4-4 contains NASCRAC and reference results. Reference 1
assumes a straight front crack whereas reference 11 assumes an elliptical crack front for
small a/D ratios but gradually permits the crack front to become straight as the a/D ratio
increases to 0.5. From Table 4-4 it is apparent that NASCRAC agrees well with reference
1 1 and FRANC-3D for small a/D ratios (< 0.3) but diverges for larger a/D ratios. Comparedto reference 1 (straight front crack) the NASCRAC computed K is consistently lower for allvalues of a/D. Additionally, FRANC-3D results appear to match the reference 1 and 11
results when a/I) = 0.5 (straight edge cracks). These results suggest that NASCRAC mayunderestimate K by as much as 50% when a/D = 0.5, i.e., when a = R.
a D
1.0 10.0
2.0 10.0
3.0 10.0
4.0 10.0
5.0 10.0
6.0 10.0
Table 4-4
Confi uration 404 Results versus Referenc_
(Yt -I- (Yb KNASCRAC
KRef 11
1.0 + 1.0 2.322 2.481
1.0 + 1.0
1.0 + 1.0
1.0 + 1.0
1.0 + 1.0
1.0 + 1.0
3.527
0.5 5.0
1.0 5.0 1.0 + 0.0
1.5 5.0 1.0 + 0.0
2.0 5.0 1.0 + 0.0
2.5 5.0 1.0 + 0.0
3.0 5.0 1.0 + 0.0
4.950
6.940
9.986
15.108
3.835
5.793
9,086
14,169
22fi37
1.0 + 0.0 0.878 0.940
1.419
2.104
3.095
4.640
7.270
1.241
2.006
2.976
4.377
1.0 10.0 1.0+0.0
2.0 10.0 1.0+0.0
3.0 10.0 1.0+0.0
4.0 10.0 1.0+0.0
5.0 10.0 1.0+0.0
6.0 10.0 1.0+0.0
6.561
10.281
1.631
2,_62
4,169
_i,796
11.331
1.329
2,}06
.62_
5.895
9.611
16.025
KRef 1
2.11
3.86
11.24
2,9_
5.46
15.90
K
FRANC-3D
4.77
13,88
The variation of K along the crack front and the inability of NASCRAC to account for this
variation will lead to errors during fatigue crack growth. The calculated K value in
NASCRAC is frequently the minimum K along the crack front. Thus, during fatigue crack
growth, the crack front at the free surface will have a higher rate of crack growth due to a
19
higher K value. This variation in crack growth rate would lead to a change in crack frontshape until K is uniform along the crack front. The uniform K crack front is bounded bythe NASCRAC model and a straight front crack.
In summary, the NASCRAC 404 model for K vs a is valid for static checks of K where a/D< 0.5 if the crack front of interest adheres to the condition of intersecting the free surface
perpendicularly. The geometry on which the NASCRAC curve fit model is based should befully identified in the NASCRAC user's manual and a corresponding full explanation of thegeometry should be included onscreen. Warnings should be given when applying themodel to fatigue crack growth and for a/D > 0.5. Results suggest that for a/D > 0.5,NASCRAC is nonconservative by as much as 50% compared to reference results for straight
crack fronts. Finally, current results show that K values for a propagated crack frontwhose initial shape matches the NASCRAC model are bounded by the NASCRAC model and
a straight crack front model.
600 Series Results
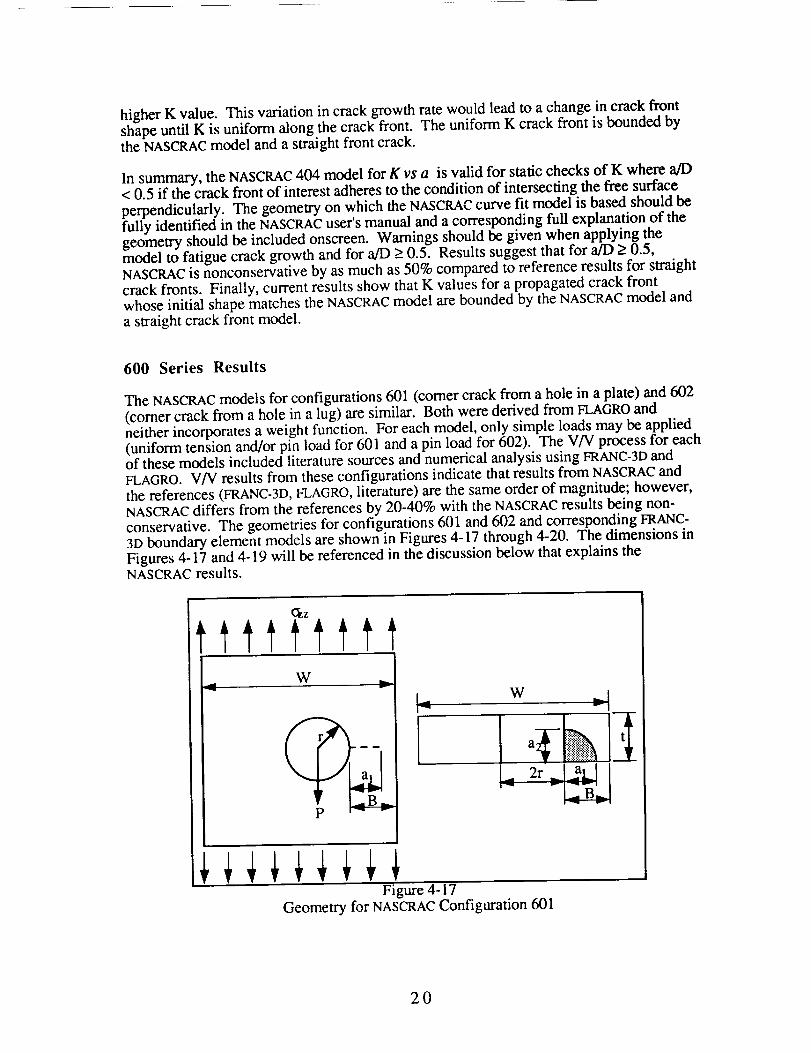
The NASCRAC models for configurations 601 (comer crack from a hole in a plate) and 602
(comer crack from a hole in a lug) are similar. Both were derived from FLAGRO andneither incorporates a weight function. For each model, only simple loads may be applied(uniform tension and/or pin load for 601 and a pin load for 602). The V/V process for eachof these models included literature sources and numerical analysis using FRANC-3D andFLAGRO. V]V results from these configurations indicate that results from NASCRAC andthe references (FRANC-3D, FLAGRO, literature) are the same order of magnitude; however,NASCRAC differs from the references by 20-40% with the NASCRAC results being non-conservative. The geometries for configurations 601 and 602 and corresponding FRANC-3D boundary element models are shown in Figures 4-17 through 4-20. The dimensions in
Figures 4-17 and 4-19 will be referenced in the discussion below that explains theNASCRAC results.
I_EZ
tt tt ttW
v
P
w
t
Figure 4-17Geometry for NASCRAC Configuration 601
20
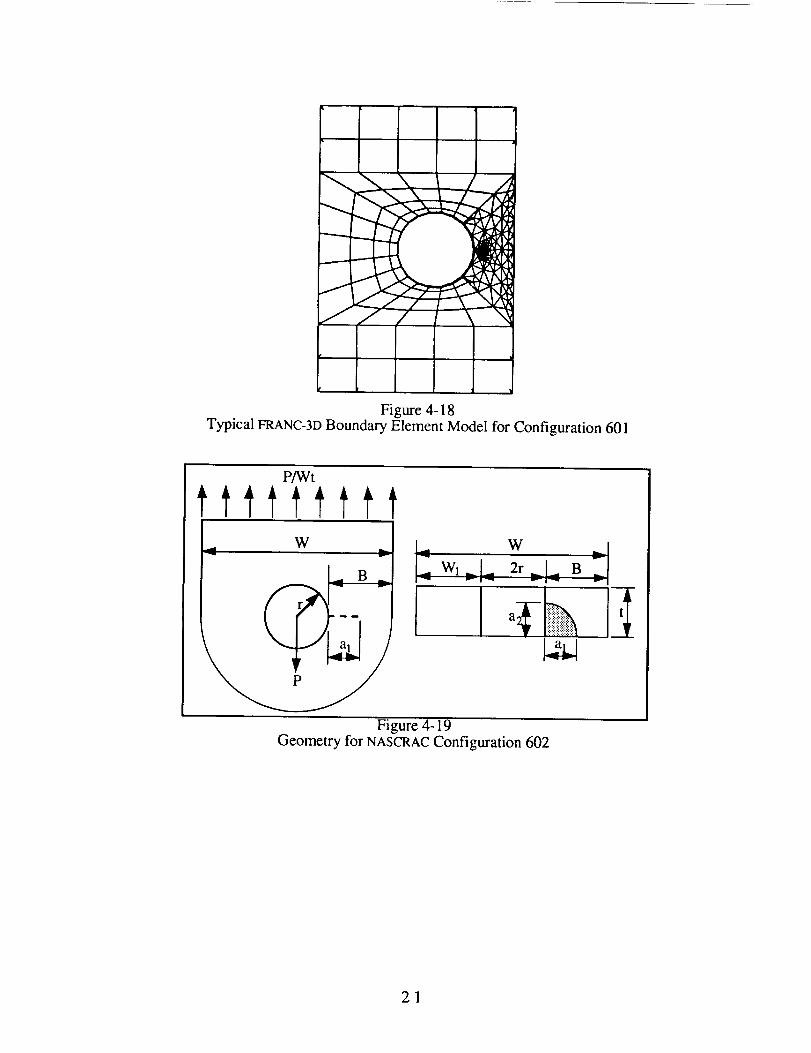
Figure 4-18Typical FRANC-3D Boundary Element Model for Configuration 601
P/Wt
"t tt ttW
v
W
Wl_i 2r _[_. B v
Figure 4-19Geometry for NASCRAC Configuration 602
21
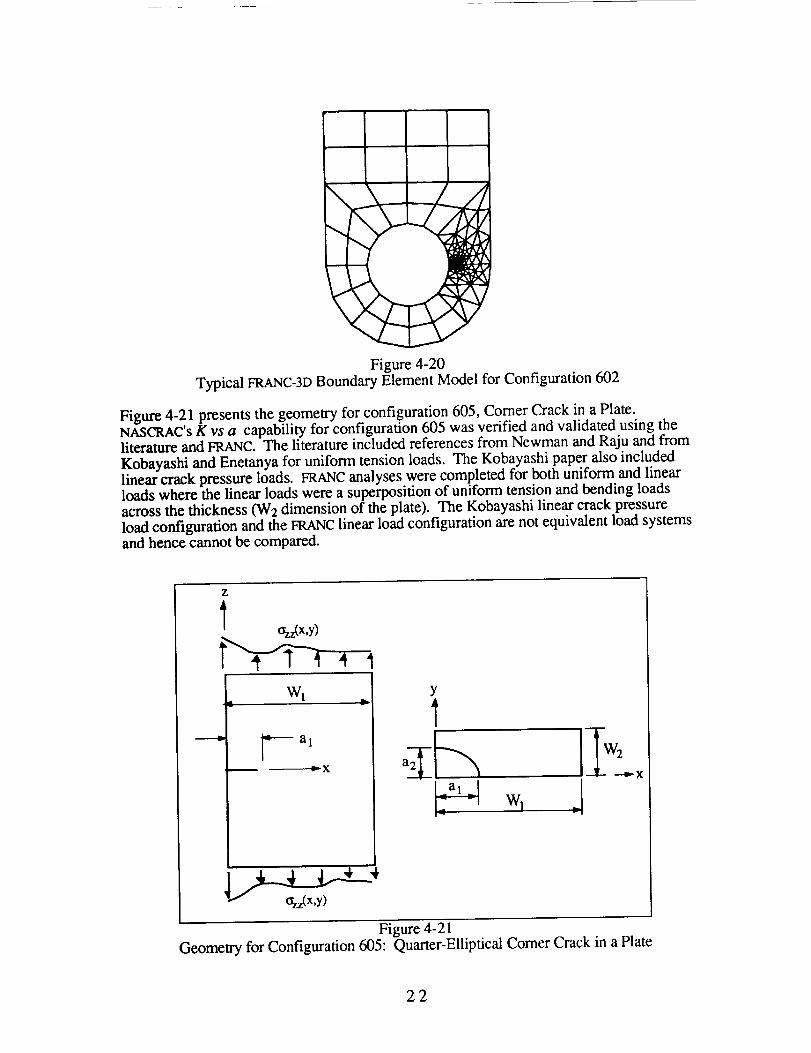
Figure4-20TypicalFRANC-3DBoundaryElementModel for Configuration602
Figure4-21presentsthegeometryfor confi.guration605,ComerCrackin aPlate.NASCRAC'S K vs a capability for configurauon 605 was verified and validated using theliterature and FRANC. The literature included references from Newman and Raju and from
Kobayashi and Enetanya for uniform tension loads. The Kobayashi paper also includedlinear crack pressure loads. FRANC analyses were completed for both uniform and linearloads where the linear loads were a superposition of uniform tension and bending loadsacross the thickness (W2 dimension of the plate). The Kobayashi linear crack pressure
load configuration and the FRANC linear load configuration are not equivalent load systemsand hence cannot be compared.
Z
_zz(X,Y)
Wlr
Y
m
Figure 4-21
Geometry for Configuration 605: Quarter-Elliptical Comer Crack in a Plate
22
Configuration 601 (Comer Crack from a Hole in a Plate_
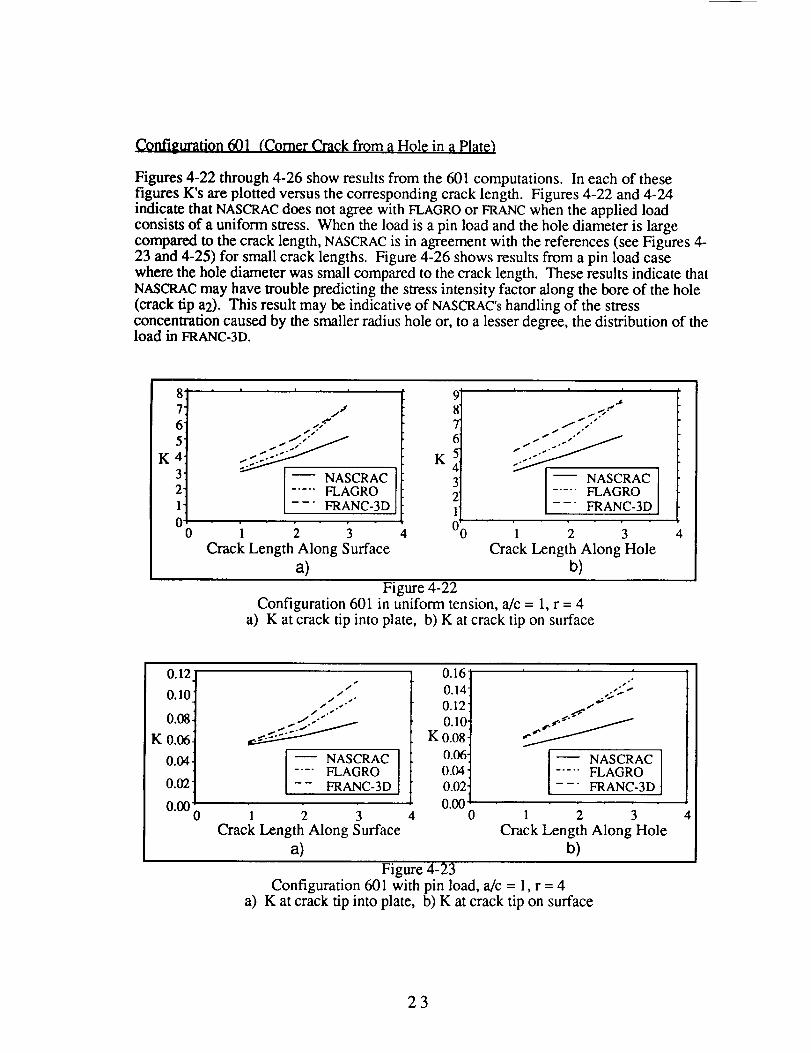
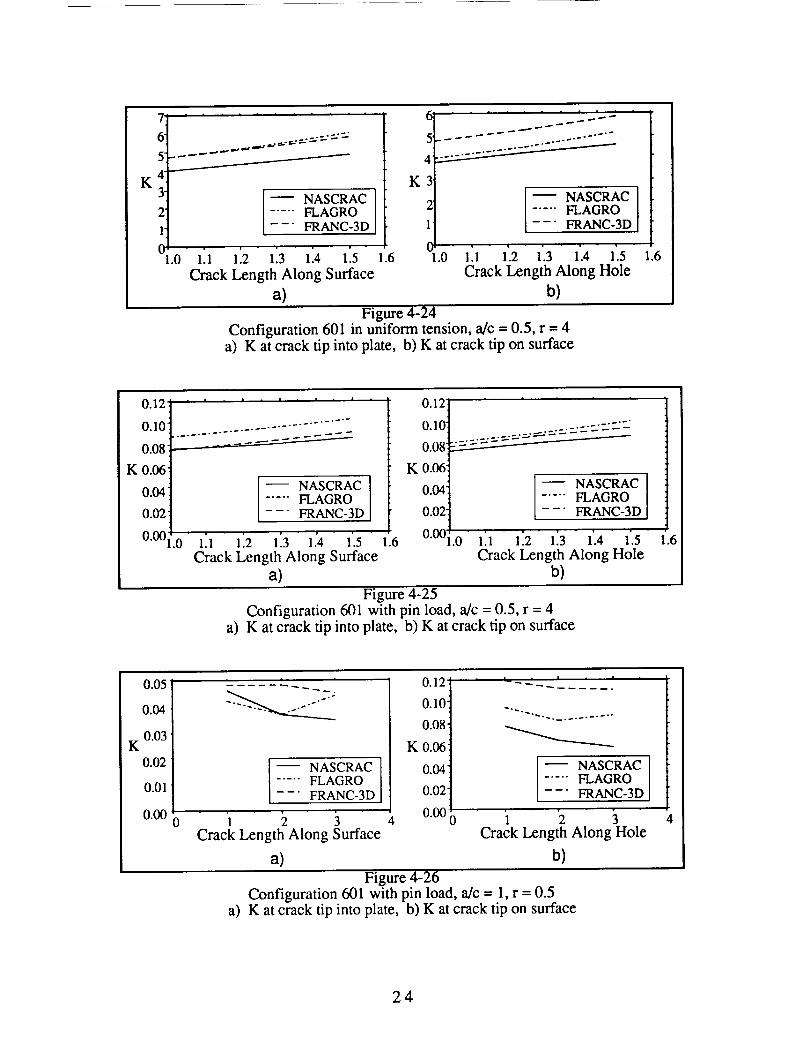
Figures 4-22 through 4-26 show results from the 601 computations. In each of thesefigures K's are plotted versus the corresponding crack length. Figures 4-22 and 4-24indicate that NASCRAC does not agree with FLAGRO or FRANC when the applied loadconsists of a uniform stress. When the load is a pin load and the hole diameter is largecompared to the crack length, NASCRAC is in agreement with the references (see Figures 4-23 and 4-25) for small crack lengths. Figure 4-26 shows results from a pin load casewhere the hole diameter was small compared to the crack length. These results indicate thatNASCRAC may have trouble predicting the stress intensity factor along the bore of the hole(crack tip a2). This result may be indicative of NASCRAC's handling of the stressconcentration caused by the smaller radius hole or, to a lesser degree, the distribution of theload in FRANC-3D.
8765
K432
jJ
.s S •
NASCRAC 1..... FLAGRO
1 FRANC-3D
0 _0 1 2 3 4
Crack Length Along Surface
a)
K
|
876
321
0 0
i , | i i |
.4
s "_.'_"f .s °
l 2 3
Crack Length Along Hole
b)
Figure 4-22Configuration 601 in uniform tension, a/c = 1, r = 4
a) K at crack tip into plate, b) K at crack tip on surface
0.1240.10l
0.081
K 0.061
0.04_
0.02"
0.00 0
j,J
j •"j .J"
j .s
_ NASCRACFLAGROFRANC-3D
0.160.1410.12 _0.1ff
K 0.08:0.06 _0.04 _0.02 _
0.000
.s
NASCRAC ]..... FLAGRO
FRANC-3D
1 2 3 4 1 2 3
Crack Length Along Surface Crack Length Along Hole
a) b)
Figure 4-23Configuration 601 with pin load, a/c = 1, r = 4
a) K at crack tip into plate, b) K at crack tip on surface
23
K
7i * - " "
5.1_ _ _ _ _ .._ _..,., __. ,_-_ "._ -- .-..---
l1.0
NASCRAC..... FLAGRO-- FRANC-3D I
111 1'.2 113 114 115 1.6
Crack Length Along Surface
a)
6i
K 3t
_ NASCRAC21 ..... FLAGRO11 FRANC-3D
0 I1.0 111 1_2 1_3 1_4 l'.S
Crack Length Along Hole
b)Figure 4-24
Configuration 601 in uniform tension, a/c = 0.5, r = 4a) K at crack tip into plate, b) K at crack tip on surface
1.6
0.12i
0.101
0.08_K 0.06"
0.041
0.02t1
0.001_.0
i . | . A , | - ,
........ -__"_S .........
NASCRAC ]..... FLAGRO-- FRANC-3D
lh 112 113 1.'4 1'.5Crack Length Along Surface
a)
i o.12i-
[ O.lOr 0.08
K 0.06t
0.04
r 0.02!!J
1.6 0"001
...... _._.=-_'_=====_
NASCRAC..... FLAGRO
FRANC-3D
.0 1:1 1:2 113 1'.4 1_5
Crack Length Along Hole
b)
1
144
14
4
]1.1
1.6
Figure 4-25Configuration 601 with pin load, a/c = 0.5, r = 4
a) K at crack tip into plate, b) K at crack tip on surface
0.05
0.04
0.03K
0.02
0.01
0.000
NASCRAC..... FLAGRO
FRANC-3D
Crack Length Along Surface
a)
K
0.12
0.10!
0.081
0.06
0.04"
0.02"
0.00
, t._ -- i , ' -
a)
NASCRAC..... FLAGRO
FRANC-3D
4 "1 '2Crack Length Along Hole
b)Figure 4-26
Configuration 601 with pin load, a/c = 1, r = 0.5K at crack tip into plate, b) K at crack tip on surface
24
The trends displayed in the NASCRAC results appear to agree with FLAGRO and FRANC-3D.
For example, in Figure 4-26 above, K at crack tip al decreases as the crack lengthincreases. This decrease is reflected in all three sets of the plotted results. Another trendreflected in the NASCRAC calculations is the percent change in the K values as the crack
length increases. This change is reflected in the five figures above. In a majority of thecases, the absolute difference between NASCRAC and FRANC-3D is nearly constant as thecrack length increases. A final trend of significance is the relative difference between aland a2. In general, the NASCRAC differences are less than those predicted by FRANC-3D.For example, in Figure 4-23 above, the ratio of K at a2 to K at al in NASCRAC varies from1.11 to 1.16 whereas in FRANC-3D the ratio varies from 1.17 to 1.33.
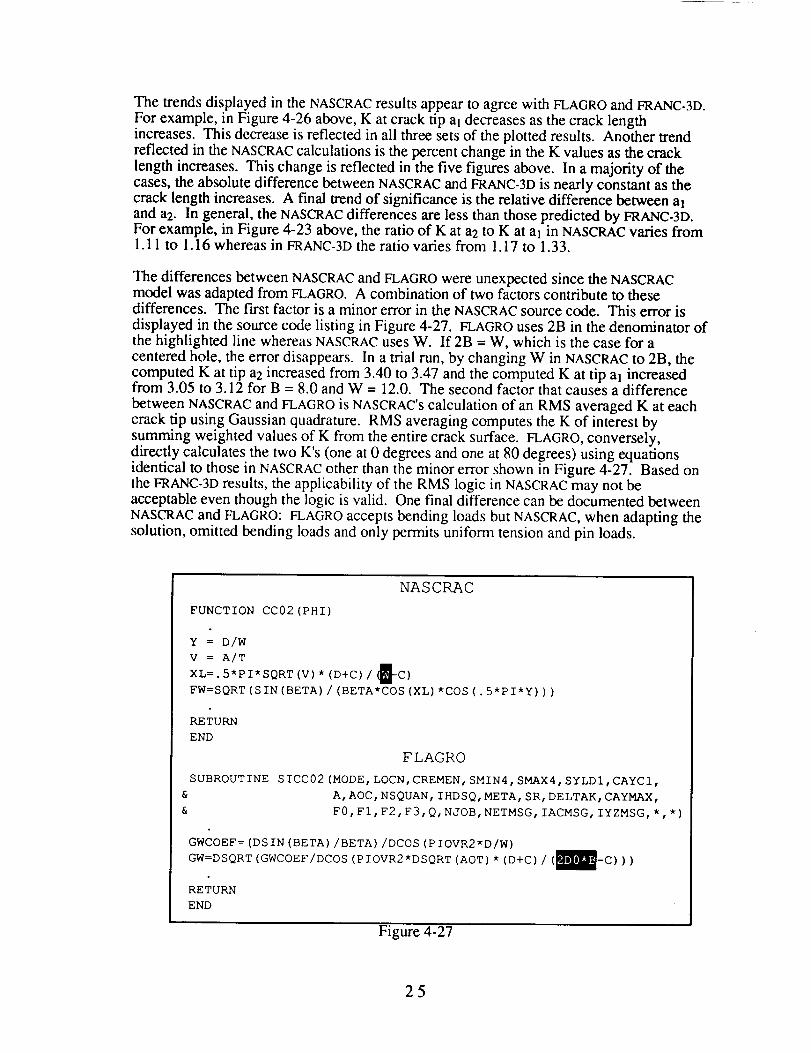
The differences between NASCRAC and FLAGRO were unexpected since the NASCRACmodel was adapted from FLAGRO. A combination of two factors contribute to thesedifferences. The first factor is a minor error in the NASCRAC source code. This error is
displayed in the source code listing in Figure 4-27. FLAGRO uses 2B in the denominator ofthe highlighted line whereas NASCRAC uses W. If 2B = W, which is the case for acentered hole, the error disappears. In a trial run, by changing W in NASCRAC to 2B, thecomputed K at tip a2 increased from 3.40 to 3.47 and the computed K at tip at increasedfrom 3.05 to 3.12 for B = 8.0 and W = 12.0. The second factor that causes a difference
between NASCRAC and FLAGRO is NASCRAC'S calculation of an RMS averaged K at eachcrack tip using Gaussian quadrature. RMS averaging computes the K of interest bysumming weighted values of K from the entire crack surface. FLAGRO, conversely,directly calculates the two K's (one at 0 degrees and one at 80 degrees) using equationsidentical to those in NASCRAC other than the minor error shown in Figure 4-27. Based onthe FRANC-3D results, the applicability of the RMS logic in NASCRAC may not beacceptable even though the logic is valid. One final difference can be documented between
NASCRAC and FLAGRO: FLAGRO accepts bending loads but NASCRAC, when adapting thesolution, omitted bending loads and only permits uniform tension and pin loads.
NASCRAC
FUNCTION CC02(PHI)
x = D/W
V = A/T
5*PI*SQRT (V) * (D+C) / (_C)XL=.
FW=SQRT (SIN (BETA) / (BETA*COS (XL) *COS (. 5*PI*Y) ) )
RETURN
END
SUBROUTINE
&
&
FLAGRO
S ICC02 (MODE, LOCN, CREMEN, SMIN4, SMAX4, SYLDI, CAYCI,
A, AOC, NSQUAN, IHDSQ, META, SR, DELTAK, CAYMAX,
F0, FI, F2, F3, Q, NJOB, NETMSG, IACMSG, IYZMSG, *, *)
GWCOEF=(DSIN(BETA)/BETA)/DCOS(PIOVR2*D/W)
GW=DSQRT(GWCOEF/DCOS(PIOVR2*DSQRT(AOT)*(D+C)/(_-C)))
RETURN
END
Figure 4-27
25
CC02 Source Code in NASCRAC and FLAGRO Highlighting Difference in Codes
Configuration 602 (Comer Crack from a Hole in a Lug)
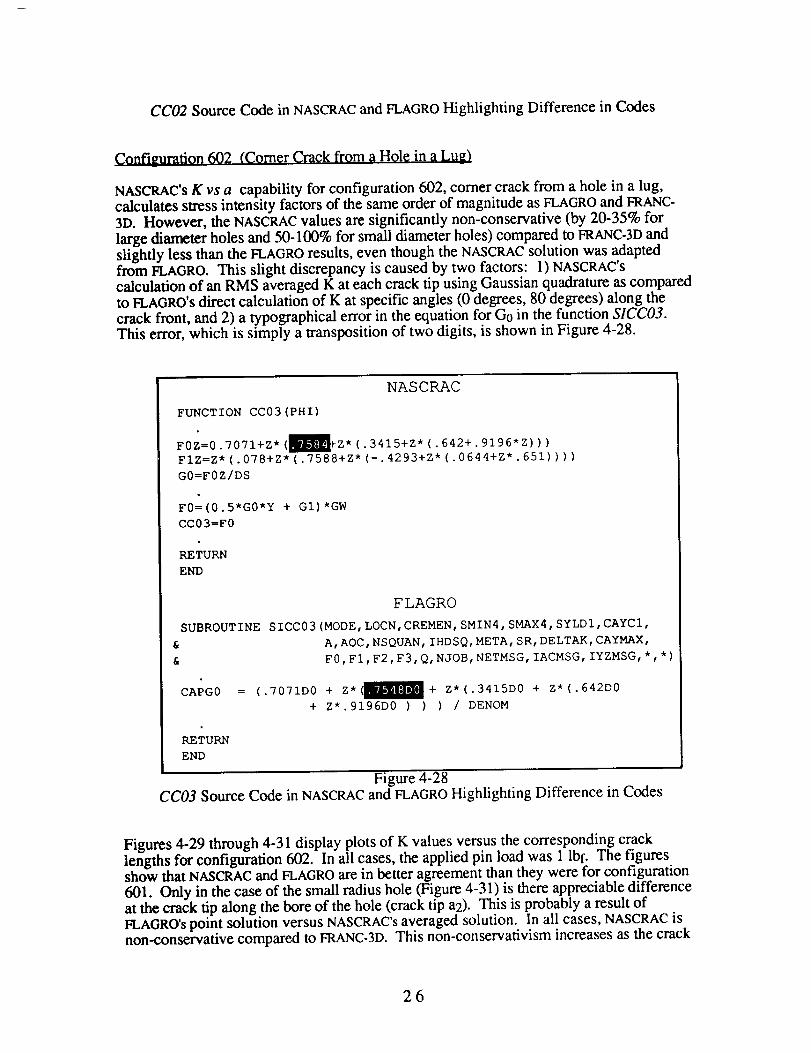
NASCRAC's K vs a capability for configuration 602, corner crack from a hole in a lug,calculates stress intensity factors of the same order of magnitude as FLAGRO and FRANC-3D. However, the NASCRAC values are significantly non-conservative (by 20-35% for
large diameter holes and 50-100% for small diameter holes) compared to FRANC-3D andslightly less than the FLAGRO results, even though the NASCRAC solution was adaptedfrom FLAGRO. This slight discrepancy is caused by two factors: 1) NASCRAC'scalculation of an RMS averaged K at each crack tip using Gaussian quadrature as comparedto FLAGRO's direct calculation of K at specific angles (0 degrees, 80 degrees) along thecrack front, and 2) a typographical error in the equation for Go in the function SICC03.This error, which is simply a transposition of two digits, is shown in Figure 4-28.
NASCRAC
FUNCTION CC03(PHI)
FOZ=0.7071+Z*(DZ*(.3415+Z*(.642+.9196*Z)))
FIZ=Z*(.078+Z*(.7588+Z*(-.4293+Z*(.0644+Z*.651))))
G0=FOZ/DS
F0=(0.5*G0*Y + GI)*GW
CC03=F0
RETURN
END
SUBROUTINE
&
&
CAPG0
FLAGRO
SICC03 (MODE, LOCN, CREMEN, SMIN4, SMAX4, SYLDI, CAYCI,
A, AOC, NSQUAN, IHDSQ, META, SR, DELTAK, CAYMAX,
F 0, F 1, F2, F 3, Q, N JOB, NETMSG, IACMSG, IYZMSG, *, * )
= (.7071D0 + Z*_+ Z*(.3415D0 + Z*(.642D0
+ Z*.9196D0 ) ) ) / DENOM
RETURN
END
Figure 4-28CC03 Source Code in NASCRAC and FLAGRO Highlighting Difference in Codes
Figures 4-29 through 4-31 display plots of K values versus the corresponding crack
lengths for configuration 602. In all cases, the applied pin load was 1 lbf. The figuresshow that NASCRAC and FLAGRO are in better agreement than they were for configuration
601. Only in the case of the small radius hole (Figure 4-31) is there appreciable differenceat the crack tip along the bore of the hole (crack tip a2). This is probably a result ofFLAGRO's point solution versus NASCRAC's averaged solution. In all cases, NASCRAC isnon-conservative compared to FRANC-3D. This non-conservativism increases as the crack
26
length increases and is more pronounced at crack tip a2. Since FRANC-3D is a refined finiteelement program adept at handling the stress fields around the hole, the FRANC-3D resultsprovide a higher level of confidence.
The 602 results plotted in Figures 4-29, 4-30, and 4-31 show that relative differences in Kfor various crack lengths are similar in NASCRAC compared to FRANC-3D and FLAGRO.
For example, in Figure 4-29a (crack tip a]) the percent increase in K from al = 1 to al = 2
is 23% in NASCRAC compared to 26% for FLAGRO and 33% for FRANC-3D. Similarly, forcrack tip a2 (Figure 4-29b), the percent increase in K from a2 = 1 to a2 = 2 for NASCRAC is33% compared to 37% for FLAGRO and 36% for FRANC-3D.
0.180.160.140.12
K 0.100.080.060.040.02:
0.00 o
I m I i I
fs"
f
f
f o
NASCRAC.... FLAGRO-- FRANC-3D
0.24
0.20
0.16
K0.12
0.08
0.04i
0.00o
I i I i ! i
/ /
JI'
II
1 2 3 _, 1 2 3Crack Length Along Surface Crack Length Along Hole
a) b)
a)
Figure 4-29Configuration 602 with pin load, a/c = 1, r = 4
K at crack tip into plate, b) K at crack tip on surface
0.16 i1
0.12_."
K 0.081
0.041
0.00! 0
• i • I i I i ! , i
-- NASCRACFLAGROFRANC-3D
1.1 1.2 1.3 1.4 1.5
0.20!
0.16!
0.12K
0.08
0.04
• L , I = " | i ! i
NASCRAC.... FLAGRO-- FRANC-3D
•6 0.00 .0 1.1 1.2 1.3 1.4 1.5
Crack Length Along Surface Crack Length Along Hole
a) b)
1.6
Figure 4-30Configuration 602 with Pin Load, a/c = 0.5, r = 4
a) K at crack tip into plate, b) K at crack tip on surface
27
o.12!
0.10"
0.08_
K 0.06"
0.04"
0.02
0.00'o
| i | | , I
/
/S
t
NASCRAC.... FLAGRO-- FRANC-3D
' 0.24
0.20
0.16
K 0.12
0.08
I '0.041
4 0.00 0
I | I
_ NASCRACFLAGROFRANC-3D
1 2 3 1 2 3Crack Length Along Surface Crack Length Along Hole
a) b)Figure 4-31
Configuration 602 with Pin Load, a/c = 1, r = 0.5a) K at crack tip into plate, b) K at crack tip on surface
Configuration 605 (Quarter Elliptical Comer Crack in a Plate)
605 V/V results are presented in Figures 4-32 through 4-34. Each of the figures presentsthree cases. Case 1 consists of W1 = 20.0 and W2 = 2.0. Case 2 consists of Wl= 10.0
and W2 = 0.8. The final geometry, case 3, consists of W1 = 10.0 and W2 = 0.2. Figure
4-21 depicts the definition of W 1 and W2. Figure 2 displays plots of K vs a/W fromNASCRAC, FLAGRO, and Newman and Raju for three different crack geometries subjectedto uniform tension. These results indicate that NASCRAC calculates reasonable values of Kfor uniform tension loads. In case 1 where NASCRAC'S K value at al is non-conservative,the maximum difference is less than 15%. As the crack becomes smaller (cases 2 and 3),
the difference between NASCRAC and the references becomes smaller. For K at a2,NASCRAC is consistently conservative. NASCRAC does issue a warning when a2/W2exceeds 0.6 which states that the accuracy limitations of the solution have been exceeded;
thus, the non-conservative results for K at al occur beyond the limitations of the solution.The actual warning issued is for al/Wl but this warning is incorrect. The warning should
reference a2/W2 for the cases studied.
28
5
4
_3®_2
1
NASCRAC ]FLAGRO INewman &Raju[
........ _ -:
00.00
i I i I i I i
0.05 0.10 0.15 0.20al/W1
¢q
_3@_2
00.0
CASE 1
5
4
"_3 ........
1
00.00
NASCRAC ]FLACRO /Newman &Raju[FRANC 3-D ]
0.04' ' '0.08' '0.12 0.16
al/W1
5
4
_3
1
00.0
CASE 2
NASCRAC I
-,4 -- -- FLAGRO ]Newman &Raju I
•_ 3 FRANC 3-D ]
d2
1
00.00
NASCRAC ]
FLAGRO {Newman &Raju I .ji_J...7_.7.':
........FRANC,y_ >'"
.
4
_3®i
O,0.0
I * I , _ ,0.2 0.4 .6 0.8_AV2
NASCRAC IFLAGRO [Newman &Raju [FRANC 3-D I
I , I , I ,
0.2 0.4 0.6 0.8a2/W2
NASCRAC [
FLAGRO [Newman &Raju[FRANC 3-D ]
I , ' , I , , i
0.01 0102 0'.03 0.04 0.2 014 ().6 0.8
a 1/W 1 a2/W2
CASE 3Figure 4-32
Uniform Tension Load Results from NASCRAC and References
Figure 4-33 presents K vs a/W results from NASCRAC, FLAGRO, and Newman and Rajufor the three crack geometries subjected to a linear load across the thickness of the plate.NASCRAC is non-conservative for small cracks (e.g., a2/W2 < 0.25), within +40% for0.25 < a2/W2 < 0.6, and conservative for larger cracks.
29
6
5
_4
1
OIr0.00 0.05 0.10 0.15 0.20
A1/W1
or
51
2t
1!
0I0.0 I i ! i 80.2 0.4 .6
A2/W2
CASE 1
0.8
5
_4
]
I
(0.00
!72 IFRANC-3DFLAGRO
? ) * , , i _ * ) * ,
0.04 0.08 0.12 0.16A1]Wl
61
51
2
1
%.0
-_. NASCRAC IFRANC-3D I ,_
I I s / i .
0.2 0.4 0.6 0JA2/W2
CASE 2
6
5
4
_3_2
1
Co.0o
_ NASCRAC [-- FRANC-3D I
•-. FLAGRO l
.. ira._._-._-% P-,.
0.01 0.02 0.03A1/W1
1
--'_. NASCRAC I5| FRANC-3D I
FLAGRO l_41
21
11
• 0t).04 0.0 0.2 0.4 0.6 0.8
A2/W2
CASE 3Figure 4-33
Linear Load Results from NASCRAC and References
Figure 4-34 presents Kvs a/W results from NASCRAC and Kobayashi for the three crackgeometries subjected to a linear crack face pressure. This figure indicates that reasonable
agreement between NASCRAC and Kobayashi exists for this loading at al but not at a2.
30
3.1 3.0
2.12.q
1.:
1.(
02
I_NASCRAC] ] 2.5
_2.0
®1.5
M 1.0
................ 0.5
I P l |%.00 0.05 0.10 0.15 020 ooA1/Wl
It t b
0.0 0.2 0.4 0.6 0.8
A2/W2
CASE 1
3.0 --NASCRAC ] 3"01 [--NASCRAC]
2.a l- -" Kobayashi ] 1 2"51 1- -" Kobayashi ]
._2.0 I _2.0 i91"5 ] @1.5 I
1.0 __ __..._ _ 1.0l _..0.5 ...........oo J ;l0.00 0.04 0.08 0.12 0.16 "0.0 ' ().2 ' 13.4 ' ;.6 ' 0.8
A 1/W 1 A2/W2
CASE 2
3.0
2.5
.., 2.0
_)1.5
0.5
0"00.00
3.0 1
_NASCRAC- -. Kobayashi
I
2.51
c_2.0 I
®_.5 I
1.0[
0.5t
' 0.0 , , ,I ! I 9 t .
0.01 A10"02/W1 0.03 0.04 0.0 0.2
CASE 3
NASCRAq- -- Koba),ashi [
I t I I |
0.4 0.6 0.8A2/W2
Figure 4-34Linear Crack Face Pressure Results from NASCRAC and Kobayashi
In summary, 605 appears acceptable for uniform tension loads. For non-uniform loads,analysts can expect differences as high as 50% (both conservative and non-conservative)for specific configurations and hence should use the non-uniform load results fromconfiguration 605 with caution. These results described above strongly suggest that furtherrefinement is required before configuration 605 is acceptable as a valid capability for non-uniform loadings.
31
700 Series Results
The 700 series K vs a solutions in NASCRAC are based on the same weight function. This
function was originally developed for configuration 703, a semi-elliptical (circumferential)surface crack in a cylinder. NASCRAC and reference results were in agreement for both
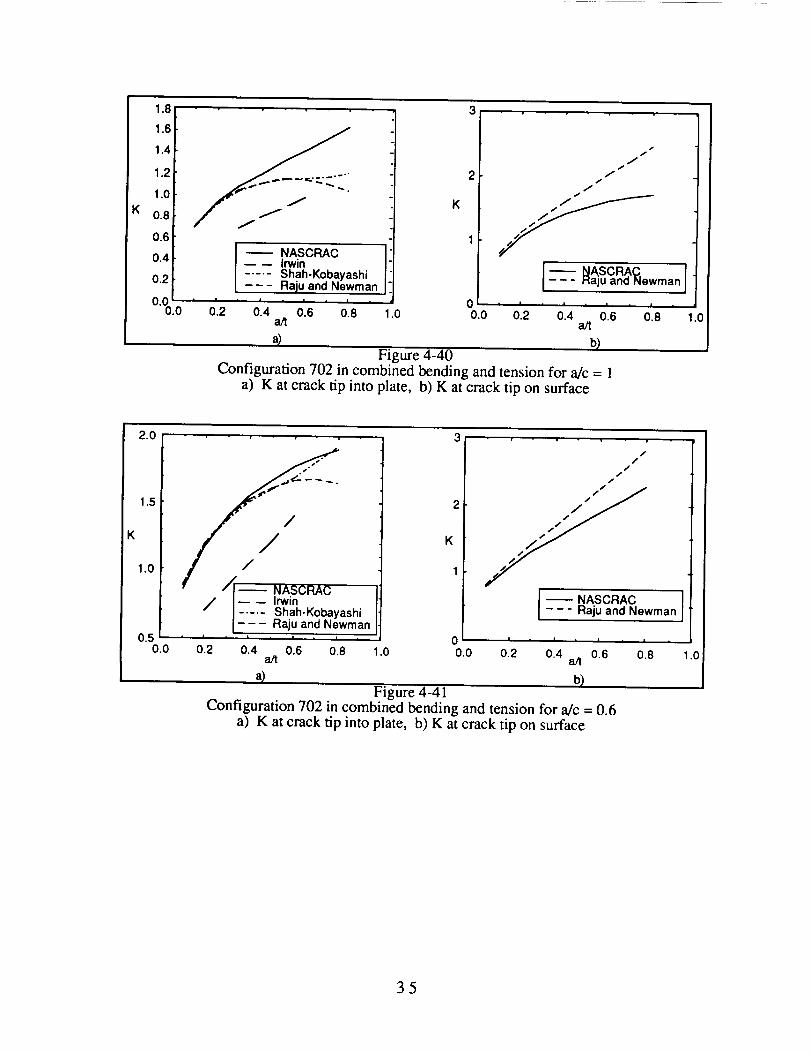
configurations 703 and 705, a semi-elliptical surface crack in a sphere. The only problemrelated to these configurations was the potential for a through crack to develop withoutdetection by NASCRAC. Results for configurations 702 and 704 are discussed below.These two configurations did not agree with the references, especially at the surface crack
tip (a2).Configuration 702 fSemi-Elliptical Surface Crack in a Plate_
Figure 4-35 displays the geometry for configuration 702, Semi-Elliptical Surface Crack in aPlate. Several literature sources were available for the analysis of this configuration.
Additionally, unpublished results from a round-robin study conducted by NASA/MSFCwere available. The primary literature source was reference 7, a Raju and Newman paperdescribing an empirical K equation for surface cracks. The results, shown in Figures 4-36through 4-43, indicate that the NASCRAC K model at the crack tip into the plate (crack tipal) is valid for the case of uniform tension (Figure 4-36). Figures 4-37 through 4-39 andFigure 4-43 indicate that the NASCRAC model for crack tip at is valid in bending for cracktip to thickness ratios al/t < 0.5. These same figures show that NASCRAC differs fromreference 7 at al for bending when al/t > 0.5. For these cases, the reference values arebelievable because crack tip al is in a region of compressive stresses and hence a reduced
or negative K value is expected. The trends shown by NASCRAC for the bending casesappear reasonable. As the crack tip extends into the region of compressive stress, the valueof K is less. Additionally, as the crack becomes more circular (a/c increases) the value ofK at al decreases. The combined bending and tension curves in Figures 40 through 42show similar trends for crack tip al, i.e., agreement between NASCRAC and reference 6 isreasonable for small al/t ratios but more disagreement occurs as al/t approaches 0.8. For
crack tip a2, along the surface of the plate, NASCRAC was consistently non-conservativeversus the references for both bending and combined bending and tension (Figures 4-40
through 4-42). NASCRAC also exhibited an unexpected trend for the cases of linear andnon-linear bending, as shown in Figures 4-37 through 4-39 and 4-41. In these figures theK value at a2 (along the surface) decreased as the crack length increased. This result is
unexpected because this region incurs the maximum tensile stress.
RMS averaging causes the disagreement between NASCRAC and the references. RMSaveraging computes K by sumrmng weighted values of K over the entire crack surface.Thus, if part of the crack lies in a region of compressive or reduced tensile stresses, theaveraged value of K at the crack tip of interest is less than a point calculation of the same K.This situation occurs in configuration 702 when bending loads are applied. At crack tip al,which is the tip into the plate, K should decrease as al becomes large, i.e., as al propagatesinto the region of compressive stress. This behavior is observed in the Raju and Newmanresults plotted in Figures 4-37 through 4-43. As al propagates into the compressive orreduced tensile (for combined bending and tension) region, NASCRAC does a poor job of
following the Raju and Newman results because the NASCRAC computed K value is beinginfluenced by the tensile stresses near the surfaces of the crack. Converse logic applies tocrack tip a2. Here, the crack tip remains in a region of high tensile stress and thus Kshould increase in value as the crack length increases. This behavior can be seen in the
Raju and Newman results plotted in Figures 4-37 through 4-43. These same fig.ures showthat the NASCRAC computed K at a2 begins to flatten out or decrease with increasing crack
length. This unexpected trend in the NASCRAC results is caused by the influence ofcompressive stresses in the al region of the crack surface.
32
Z
¢ °zz y, i
Figure 4-35Geometry for Configuration 702
K
!.8
la/c= 1.(_1.6,
1.4, I__NA_C
1.2 i1.0_
0.8_
0.6_
0.4_ I0._ I Raju & Newmani
0"010.0 0.2 0.4 0.6 0.8 1.0
1.8
1.6
1.4
1.2
1.0
Ko.8
0.6
0.4
0.2
0.00.0 0.2 0.4 0.6 0.8 1.0
_t _t
a) b)
a)
Figure 4-36Configuration 702 in uniform tension
K at crack tip into plate b) K at crack tip on surface
1.0
090.8
0.70.60.5
:_ 0.40.30.2
%
0.1 [_NASCRAC ] xxx0.0 __ .
-0.1 --Raju&Newm_ x.-0.2
0.0 0.2 0.4 0.6 0.8_t
a)
2.0
1.8
1.6
1.4
1.2
_].0
0.8
0.6
0.4 [_NASCRAC
0.2 - - Raju & Newman0.0
0.0 0.2 0.4 0.6 0.8 1.oa/t
b)
33
Figure 4-37Configuration 702 in bending for a/c = 1.0
a) K at crack tip into plate b) K at crack tip on surface
1.00.90.80.70.60.50.40.3
[a/c =0.61
0.2[ _"%
0.1_ I=='_NASCRAC l ',.
-_'I_-" Raju &Newman
"0:20.0 0.2 0.4 0.6 0.'_8a/t
a)
2.011.8tl.O[1.4[
1.0t0.8t
o.6rOAr0.2t
1.0 0"0'3.0
la/c=0C4
_ NASCRNA:wm_ '
0.2 0.4 0.6 0.8aJt
b)Figure 4-38
Configuration 702 in bending for a/c = 0.6a) K at crack tip into plate b) K at crack tip on surface
1.0
0.910.80.70.60.5
_0.40.3
0.0-0.1
"0.20. 0
[a/c
_NASCRAC I-- Raju & Newman ]
2.011.81l.Ol1.411#-IiL._I
1.010.80.60.40.2
0"00. 0
I 'c=ozl ,,/
//
/J
_f
_- [-- Raju & Newman [
0.2 0.4 0.6 0.8 1.0 0.2 0.4 0.6 0.8_t _t
a) b)
1.0
a)
Figure 4-39
Configuration 702 in bending for a/c = 0.2K at crack tip into plate b) K at crack tip on surface
34
K
1._
1.E
1.,d
1.2
I.C
).8
].6
).4
).2
).00.0
2
K
//
J
/
NASCRAC I
--- Irwin..... Shah-Kobayashi-- - Raju and Newman
0.2 0.4 a/t 0.6 0.8 1.0 0.0 0.2 0.4 aJt 0.6 0.8
a) b)F"J'gure 4-40
Configuration 702 in combined bending and tension for a/c = ]a) K at crack tip into plate, b) K at crack tip on surface
-- NASCRAC_aju andNewman I
1.0
..i.=
2.0
1.5
K
1.0
0.50.0
/q aSh,a n0.2 0.4 0.6 0.8 .0
a/t
2
K
1
00.0
//
//
/
J[ -- NASCRAC ]Raju and Newman
I = I = I
0.2 0.4 0.6
Figure 4-41Configuration 702 in combined bending and tension for a/c = 0.6
a) K at crack tip into plate, b) K at crack tip on surface
i | ,
0.8 1.0
35
s'
,_ J' ,o
3
//.,S,. / "
1 //" / I_ NASCRACIrwn
Shah-KN:_ayashiRaju and Newman
4
K2
0 _ 00.0 0.2 0.4 0.6 0.8 1.0 0.0
alt
Configuration 702 in combined bending and tension for a/c = 0.2a) K at crack tip into plate, b) K at crack tip on surface
I
/
/
tI"_" I NASCRACRaju and Newman J
0.2 0.4 0.6 0.8 1.0a/t
K 1
o
-1
/f
",, •
0.0 0.2 0.4 0.6 0.8 1.0al/W1
al FLAGRO (al/a2 = 0.2)
a2 FLAGRO(al/a2 0.2 I....... al FLAGRO (al/a2" 1.0...... a2. FLAGRO (al/a2. - 1.0)
al NASCRAC (alia2 = 0.2)
-= a2 NASCRAC (alia2 ,=0.2)• al NASCRAC (alia2 1.0)• a2. NASCRAC (alia2 = 1.0)
1.5
1.00.5
oc_ -o.5
-1,o
500' 0'.4 016"o saoNormalized Depth Location
Figure 4-43Configuration 702 in non-linear bending
Results from a round-robin study conducted by NASA/MSFC
Configuration 704 (Scmi-Elliptit;al (Axial) Surface Crack in a Cylinder)
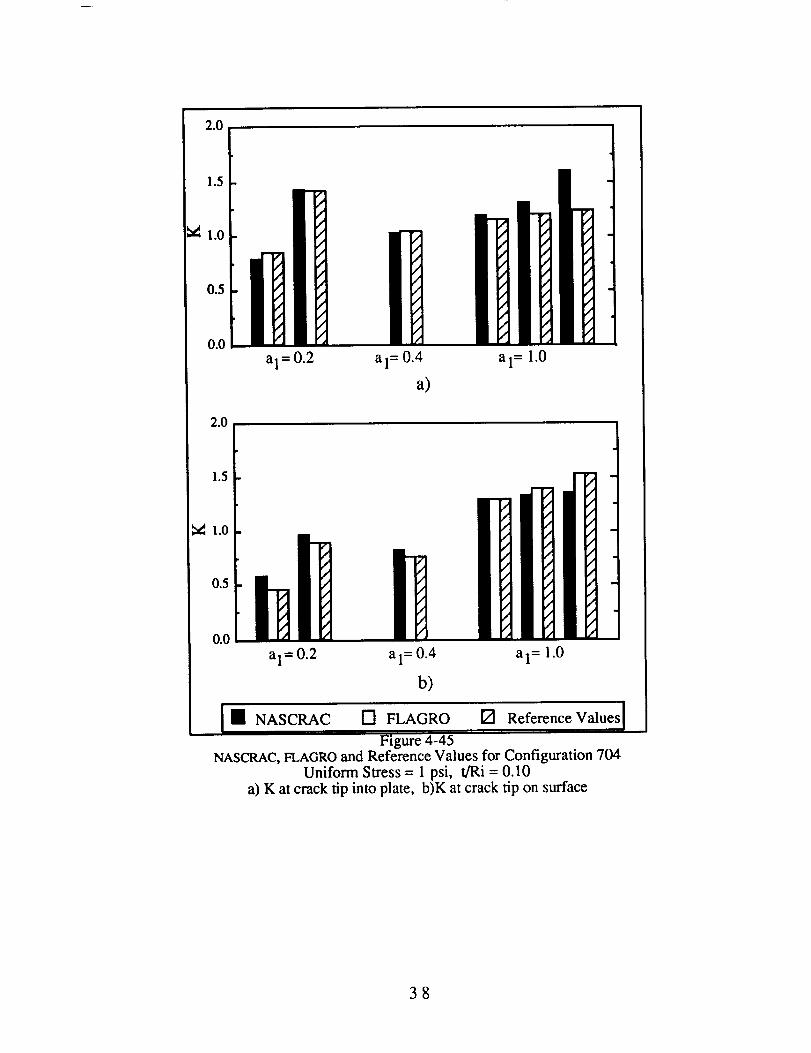
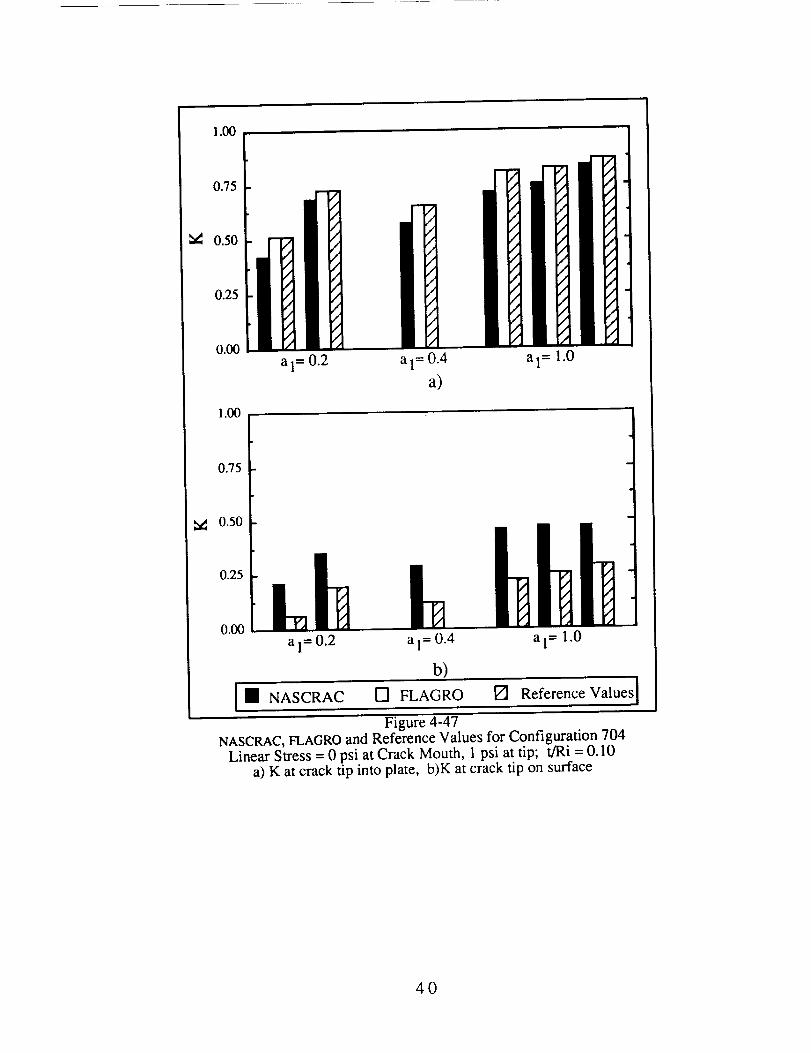
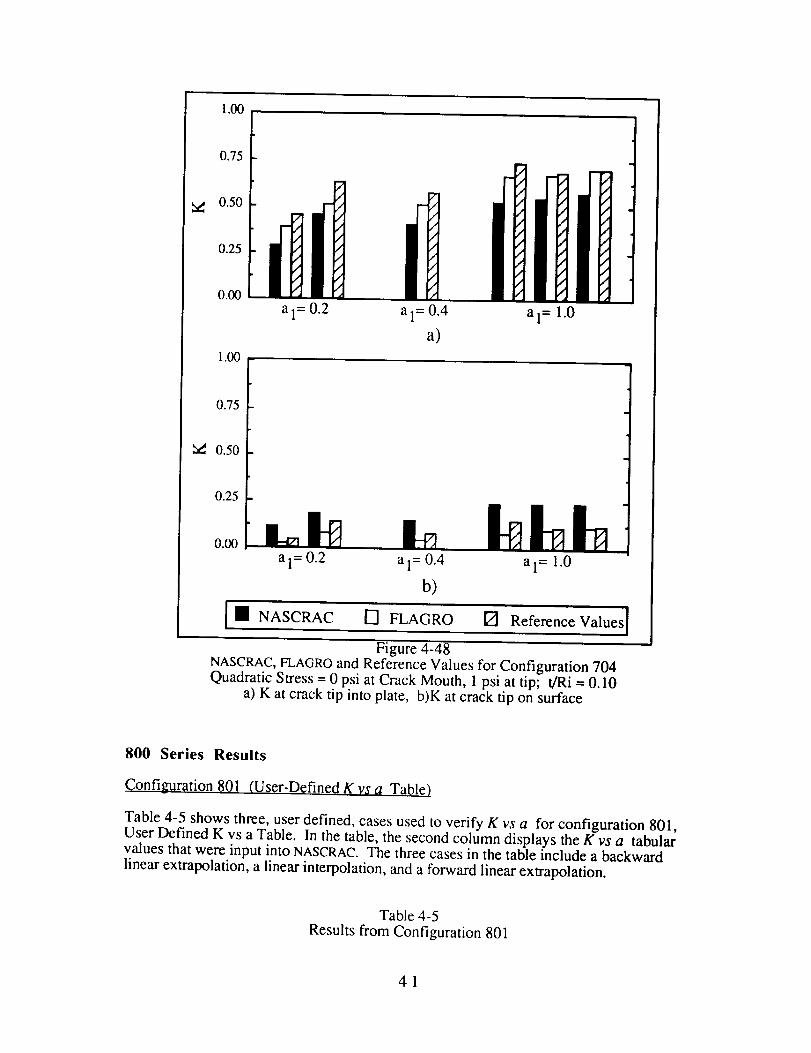
Figure 4-44 shows the geometry for configuration 704, Semi-Elliptical (axial) SurfaceCrack in a Cylinder. This configuration was verified and validated using literature sources.The NASCRAC model is reasonable for the crack tip extending into the cylinder thickness
(crack tip al). For this crack tip, differences between NASCRAC and the references varied
36
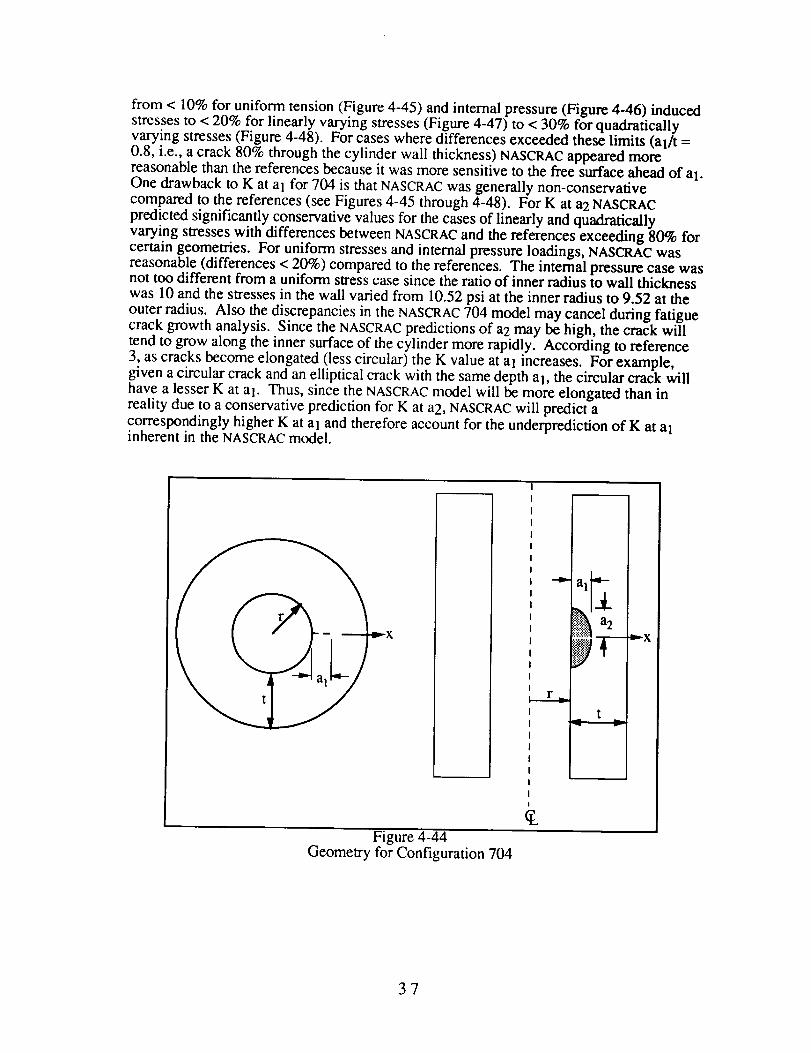
from < 10%for uniformtension(Figure4-45)andinternalpressure(Figure4-46) inducedstressesto < 20%for linearlyvaryingstresses(Figure4-47)to < 30%for quadraticallyvaryingstresses(Figure4-48). Forcaseswheredifferencesexceededtheselimits (al/t =0.8, i.e.,acrack80%throughthecylinderwall thickness)NASCRACappearedmorereasonablethanthereferencesbecauseit wasmoresensitiveto thefreesurfaceaheadof al.Onedrawbackto K at al for 704is thatNASCRACwasgenerallynon-conservativecomparedto thereferences(seeFigures4-45through4-48). For K at a2NASCRACpredictedsignificantlyconservativevaluesfor thecasesof linearlyandquadraticallyvaryingstresseswith differencesbetweenNASCRACandthereferencesexceeding80%forcertaingeometries.For uniformstressesandinternalpressureloadings,NASCRACwasreasonable(differences< 20%)comparedto thereferences.Theinternalpressurecasewasnot toodifferentfrom auniform stresscasesincetheratioof innerradiusto wall thicknesswas10andthestressesin thewall variedfrom 10.52psiatthe innerradiusto 9.52at theouterradius. Also thediscrepanciesin theNASCRAC704modelmaycancelduring fatiguecrackgrowthanalysis.SincetheNASCRACpredictionsof a2maybehigh,thecrackwilltendto growalongtheinnersurfaceof thecylindermorerapidly. Accordingto reference3,ascracksbecomeelongated(lesscircular)theK valueat al increases.Forexample,givenacircularcrackandanellipticalcrackwith thesamedepthal, thecircularcrackwillhavealesserK at al. Thus,sincetheNASCRACmodelwill bemoreelongatedthaninrealitydueto aconservativepredictionfor K at a2,NASCRACwill predictacorrespondinglyhigherK atal andthereforeaccountfor theunderpredictionof K at alinherent in the NASCRAC model.
X
• w
f.',!_ a2
NI
t
Figure 4-44Geometry for Configuration 704
37
2.0
1.5
1.o0.5 _
0.0
a 1= 0.2 a 1= 0.4 a 1= 1.0
a)
ffIIfff
i"i
2.0
1.5
al= 0.2 al= 0.4 al= 1.0
b)
1 NASCRAC [] FLAGRO [] Reference Values[
Figure 4-45NASCRAC, FLAGRO and Reference Values for Configuration 704
Uniform Stress = 1 psi, t/Ri = 0.10a) K at crack tip into plate, b)K at crack tip on surface
38
25
20
15
10
0
25
a 1 = 0.25 a 1= 0.50
a)
2O
15
10
5
a 1= 0.25
[" NASCRAC [] FLAGRO [] Reference Values[
Figure 4-46
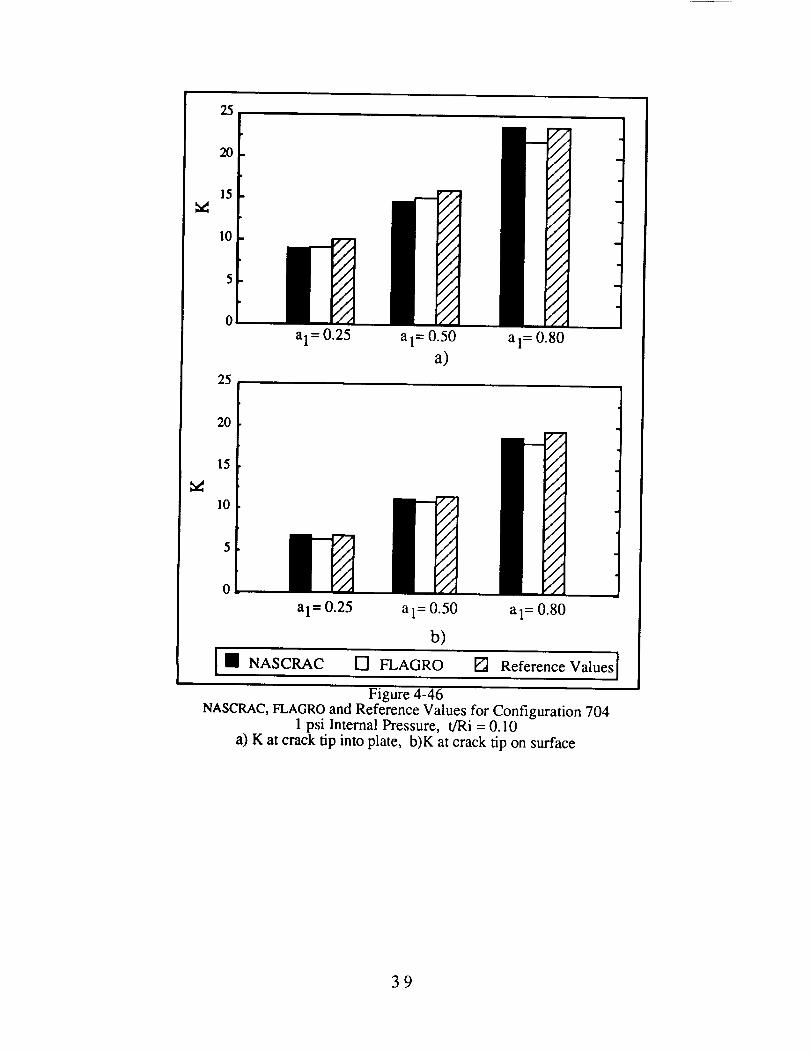
NASCRAC, FLAGRO and Reference Values for Configuration 7041 psi Internal Pressure, t/Ri = 0.10
a) K at crack tip into plate, b)K at crack tip on surface
39
l.oo ]
0.75 /_
fi '0.25 i
0.00a1=0.2 al= 0.4 al= 1.0
a)
1.00
0.75
0.50
0.00 .1
al=O. 2 al= 0.4 al= 1.0
b)
[ • NASCRAC [] FLAGRO [] Reference ValuesIFigure 4-47
NASCRAC, FLAGRO and Reference Values for Configuration 704Linear Stress = 0 psi at Crack Mouth, 1 psi at tip; t/Ri = 0.10
a) K at crack tip into plate, b)K at crack tip on surface
4O
1.00
0.75
000 0I1a1=0.2 al= 0.4 al= 1.0
a)1.00
!
0.75
_d 0.50
0.al= 0.2 al= 0.4 al= 1.0
b)
I I NASCRAC [] FLAGRO [] Reference Valuesl
Figure 4-48
NASCRAC, FLAGRO and Reference Values for Configuration 704Quadratic Stress = 0 psi at Crack Mouth, 1 psi at tip; t/Ri = 0.10
a) K at crack tip into plate, b)K at crack tip on surface
800 Series Results
Configuration 801 (User-Defined K vs a Table)
Table 4-5 shows three, user defined, cases used to verify K vs a for configuration 801,User Defined K vs a Table. In the table, the second column displays the K vs a tabularvalues that were input into NASCRAC. The three cases in the table include a backwardlinear extrapolation, a linear interpolation, and a forward linear extrapolation.
Table 4-5
Results from Configuration 801
41
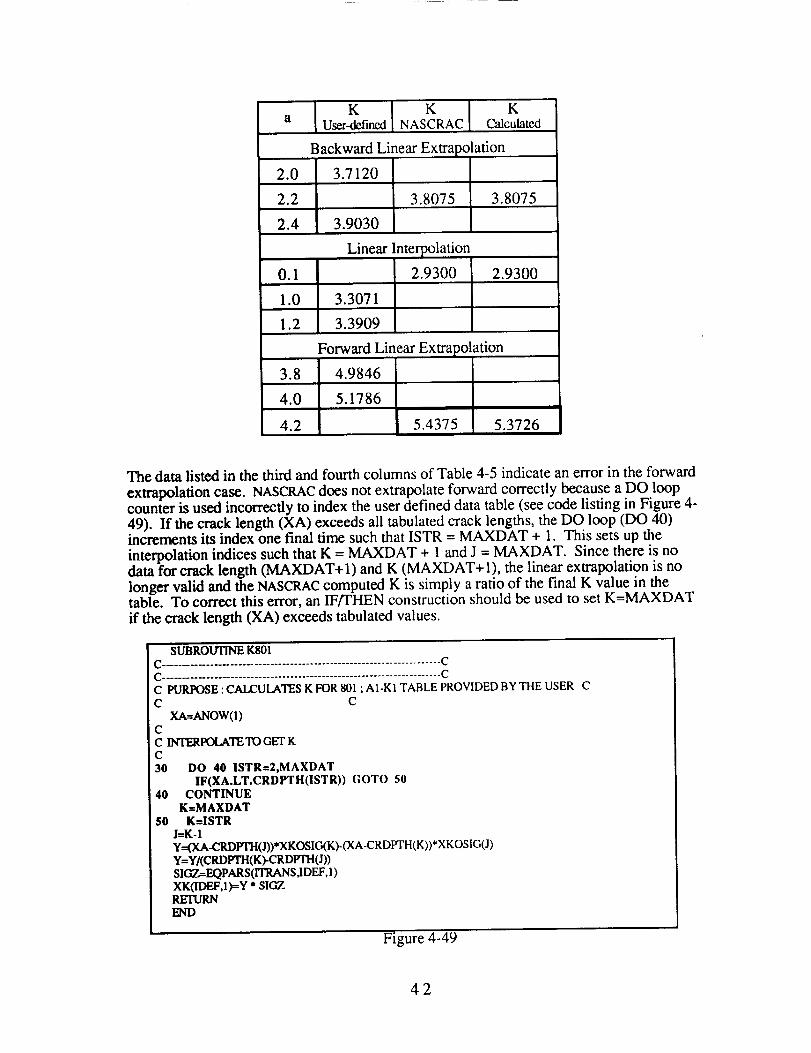
K K Ka User-defined NASCRAC Calculated
Backward Linear Extrapolation
2.0 3.7120
2.2 3.8075 3.8075
2.4 3.9030
0.1 2.9300
1.0
1.2
Linear Interpolation
2.9300
3.3071
3.3909
Forward Linear Extrapolation
3.8 4.9846
4.0 5.1786
4.2 5.4375 5.3726
The data listed in the third and fourth columns of Table 4-5 indicate an error in the forward
extrapolation case. NASCRAC does not extrapolate forward correctly because a DO loopcounter is used incorrectly to index the user defined data table (see code listing in Figure 4-49). If the crack length (XA) exceeds all tabulated crack lengths, the DO loop (DO 40)increments its index one final time such that ISTR = MAXDAT + 1. This sets up the
interpolation indices such that K = MAXDAT + 1 and J = MAXDAT. Since there is nodata for crack length (MAXDAT+I) and K (MAXDAT+I), the linear extrapolation is nolonger valid and the NASCRAC computed K is simply a ratio of the final K value in thetable. To correct this error, an IF/THEN construction should be used to set K=MAXDAT
if the crack length (XA) exceeds tabulated values.
SUBROLrI'INE KS0IC ...................................................................... C
C ...................................................................... C
C PURPOSE : CA1._ULATES K FOR 801 ; A1-KI TABLE PROVIDED BY THE USER C
C CXA=ANOWO)
CC INTERIKX,ATE TO GET K
C
30 DO 40 ISTR=2,MAXDATIF(XA.LT.CRDPTH(ISTR)) GOTO 50
40 CONTINUE
K=MAXDAT50 K=ISTR
J=K-Iy=(XA-CRDPTH(J))*XKOSIG(K)-(XA-CRDPTH(K))* XKOSIG(J)
y=Y/(CRDgrH(K)-CR Dlrl_ (J))
SIGZ=EQPARS(ITRANS.IDEF,I)XKODEF.1)=Y * SIGZRETURNEND
Figure 4-49
42
SourceCodefor SubroutineK801ShowingErrorin DO LoopAssignment
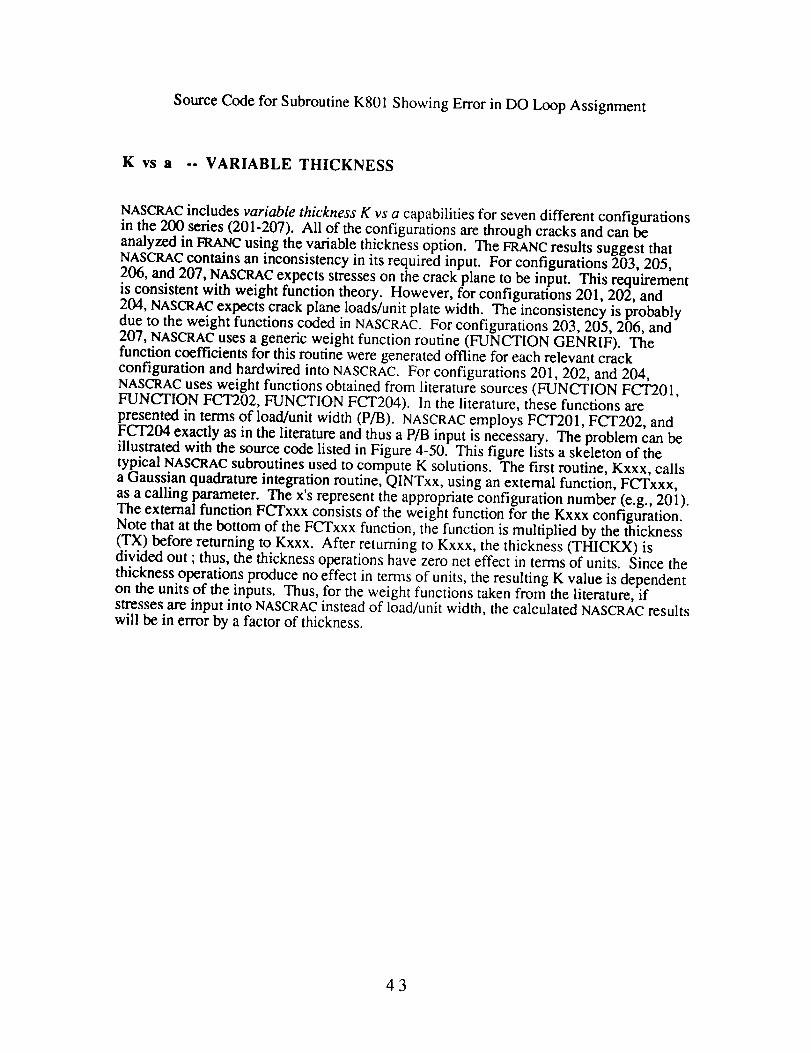
K vs a -- VARIABLE THICKNESS
NASCRAC includes variable thickness K vs a capabilities for seven different configurationsin the 200 series (201-207). All of the configurations are through cracks and can be
analyzed in FRANC using the variable thickness option. The FRANC results suggest thatNASCRAC contains an inconsistency in its required input. For configurations 203, 205,
206, and 207, NASCRAC expects stresses on the crack plane to be input. This requirementis consistent with weight function theory. However, for configurations 201,202, and
204, NASCRAC expects crack plane loads/unit plate width. The inconsistency is probablydue to the weight functions coded in NASCRAC. For configurations 203, 205,206, and207, NASCRAC uses a generic weight function routine (FUNCTION GENRIF). Thefunction coefficients for this routine were generated offline for each relevant crack
configuration and hardwired into NASCRAC. For configurations 201,202, and 204,NASCRAC uses weight functions obtained from literature sources (FUNCTION FCT201,FUNCTION FCT202, FUNCTION FCT204). In the literature, these functions are
presented in terms of load/unit width (P/B). NASCRAC employs FCT201, FCT202, andFCT204 exactly as in the literature and thus a P/B input is necessary. The problem can beillustrated with the source code listed in Figure 4-50. This figure lists a skeleton of thetypical NASCRAC subroutines used to compute K solutions. The first routine, Kxxx, callsa Gaussian quadrature integration routine, QINTxx, using an external function, FcTxxx,
as a calling parameter. The x's represent the appropriate configuration number (e.g., 201).The external function FCTxxx consists of the weight function for the Kxxx configuration.Note that at the bottom of the FCTxxx function, the function is multiplied by the thickness(TX) before returning to Kxxx. After returning to Kxxx, the thickness (THICKX) isdivided out ; thus, the thickness operations have zero net effect in terms of units. Since the
thickness operations produce no effect in terms of units, the resulting K value is dependenton the units of the inputs. Thus, for the weight functions taken from the literature, ifstresses are input into NASCRAC instead of load/unit width, the calculated NASCRAC resultswill be in error by a factor of thickness.
43
SUBROUTINE Kxxx
C
EXTERNAL FCTxxx
C
c INTEGRATION USING THE INFLUENCE FUNCTION
C
CALL QINTxx(FCTxxx,Y)
RETURNEND
FUNCTION FCTxxx(XOA)
CALL STRINT(X,Y,Z,SIGMA)
FCTxxx = FCTxxx*TXRETURNEND
Figure 4-50Variable Thickness Operations in K Solution Subroutines
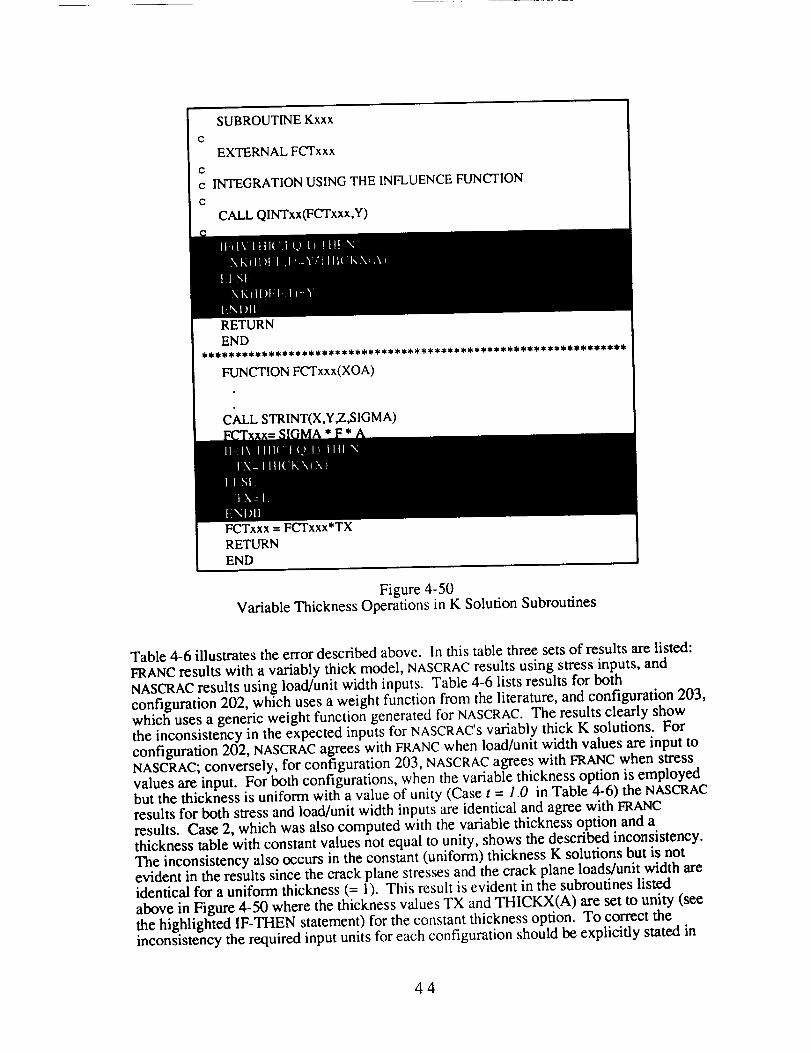
Table 4-6 illustrates the error described above. In this table three sets of results are listed:FRANC results with a variably thick model, NASCRAC results using stress inputs, andNASCRAC results using load/unit width inputs. Table 4-6 lists results for both
configuration 202, which uses a weight function from the literature, and configuration 203,which uses a generic weight function generated for NASCRAC. The results clearly showthe inconsistency in the expected inputs for NASCRAC's variably thick K solutions. For
configuration 202, NASCRAC agrees with FRANC when load/unit width values are input toNASCRAC; conversely, for configuration 203, NASCRAC agrees with FRANC when stressvalues are input. For both configurations, when the variable thickness option is employedbut the thickness is uniform with a value of unity (Case t = 1.0 in Table 4-6) the NASCRACresults for both stress and load/unit width inputs are identical and agree with FRANCresults. Case 2, which was also computed with the variable thickness option and athickness table with constant values not equal to unity, shows the described inconsistency.
The inconsistency also occurs in the constant (uniform) thickness K solutions but is notevident in the results since the crack plane stresses and the crack plane loads/unit width areidentical for a uniform thickness (= 1). This result is evident in the subroutines listed
above in Figure 4-50 where the thickness values TX and THICKX(A) are set to unity (see
the highlighted IF-THEN statement) for the constant thickness option. To correct theinconsistency the required input units for each configuration should be explicitly stated in
44
the documentation and displayed by the user interface. A more rigid resolution of the
inconsistency is to recode NASCRAC to expect stress values on the crack plane in allsituations.
Case a
0.5t = 1.0 1.5
2.5
0.5t = 2.5 1.5
2.5
t= 0.50.5 + 0.2x 1.5
2.5
t= 0.52.5 - 0.2x 1.5
2.5
t = 1.0 + 0.50.2x + 1.5o.02x 2 2.5
Table 4-6
K Results for Variable Thickness
Configuration 202 aNASCRAC
(stresses)0.1340.2410.344
NASCRAC
Ooad/width)0.1340.2410.344
FRANC
0.1340.2400.342
0.021 0.053 0.0540.039 0.097 0.0960.055 0.138 0.138
0.062 0.096 0.0990.092 0.154 0.1640.109 0.192 0.218
0.076 0.109 0. !090.173 0.226 0.2200.316 0.376 0.366
0.1270.1720.184
0.1350.2050.241
)tion
ConfiBuration 203NASCRAC NASCRAC
(stresses) Ooad/width ) FRANC1.0 0.206 0.206 0.2013.0 0.495 0.495 0.4955.0 1.117 1.117 1.110
1.0 0.083 0.207 0.0803.0 0.199 0.498 0.1985.0 0.448 1.120 0.443
1.0 0.227 0.141 0.2103.0 0.414 0.354 0.3715.0 0.730 0.748 0.652
1.0 0.068 0.160 0.0693.0 0.239 0.510 0.2715.0 0.729 1.431 0.863
0.139 1.0 0.368 0.189 0.3410.221 3.0 0.684 0.392 0.5770.277 5.0 1.090 0.733 0.897
To summarize the verification and validation effort for NASCRAC's variable thickness
option, the NASCRAC variable thickness capability is valid for uniform thicknesses _ 1.0
and linearly varying thicknesses for all variably thick configurations (201-207) as partially
evidenced by Table 4-6 if the correct loading (as discussed above) is appli¢.d Table 4-6
also suggests that NASCRAC is valid for small cracks and quadratically varying thicknesses.
The discrepancies between NASCRAC and FRANC for quadratically varying thicknesses andlarger cracks may, in part, be due to the coarseness of the discretization applied inNASCRAC for the stress and thickness tabular inputs.
Jvsa
NASCRAC contains J vs a capabilities for eight configurations. In general, the J vs a
capabilities are valid; however, several exceptions were determined. Configuration 303, a
circumferential through crack in a cylinder, is the most significant exception because itincludes a runtime error. The remaining exceptions hinge on the hi table included in
NASCRAC and the method of calculating Je, the elastic J integral, h 1 is a dimensionless
function included in the Jp formulation. It is dependent on a/b, the crack length to
specimen width ratio, and n, a hardening exponent for the Ramberg-Osgood constitutive
relationship. These relationships are expressed in the following equations:
a P)n+lJp = a ay Ey c _ hi( P0
aht = f(b,n)
45
w__a( rtE0 (I0
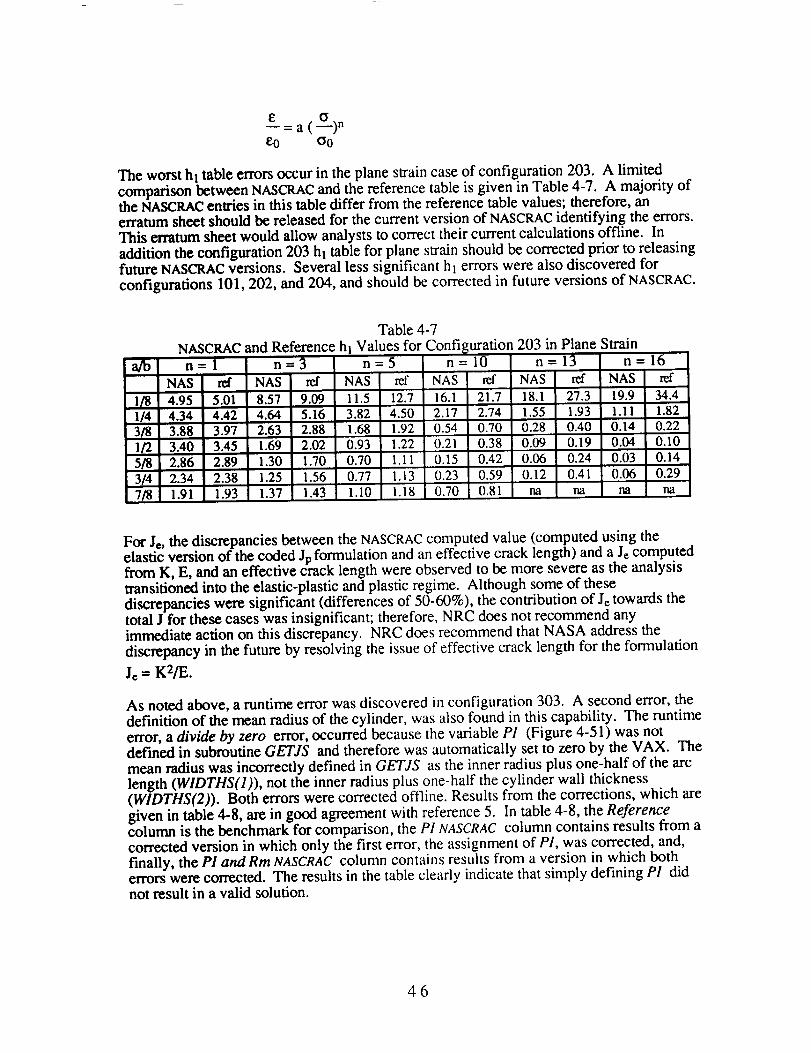
The worst hi table errors occur in the plane strain case of configuration 203. A limitedcomparison between NASCRAC and the reference table is given in Table 4-7. A majority ofthe NASCRAC entries in this table differ from the reference table values; therefore, anerratum sheet should be released for the current version of NASCRAC identifying the errors.This erratum sheet would allow analysts to correct their current calculations offline. Inaddition the configuration 203 hi table for plane strain should be corrected prior to releasingfuture NASCRAC versions. Several less significant hi errors were also discovered for
configurations 101,202, and 204, and should be corrected in future versions of NASCRAC.
a/b
Table 4-7
NASCRAC and Reference hi Values for Confi r,uration 203 in Plane Strainn=l n=3 n=5 n=10 n=13 n=16
NAS ref NAS red NAS ref NAS ref NAS tef NAS ref
1/8 4.95 5.01 8.57 9.09 11.5 12.7 16.1 21.7 18.1 27.3 19.9 34.41/4 4.34 4.42 4.64 5.16 3.82 4.50 2.17 2.74 1.55 1.93 1.11 1.823/8 3.88 3.97 2.63 2.88 1.68 1.92 0.54 0.70 0.28 0.40 0.14 0.221/2 3.40 3.45 1.69 2.02 0.93 1.22 0.21 0.38 0.09 0.19 0.04 0.10
5/8 2.86 2.89 1.30 1.70 0.70 1.11 0.15 0.42 0.06 0.24 0.03 0.14
3/4 2.34 2.38 1.25 1.56 0.77 1.13 0.23 0.59 0.12 0.41 0.06 0.29
7/8 1.91 1.93 1.37 1.43 1.10 1.18 0.70 0.81 na na na na
For Jc, the discrepancies between the NASCRAC computed value (computed using theelastic version of the coded Jp formulation and an effective crack length) and a Je computedfrom K, E, and an effective crack length were observed to be more severe as the analysistransitioned into the elastic-plastic and plastic regime. Although some of these
discrepancies were significant (differences of 50-60%), the contribution of Je towards thetotal J for these cases was insignificant; therefore, NRC does not recommend anyimmediate action on this discrepancy. NRC does recommend that NASA address the
discrepancy in the future by resolving the issue of effective crack length for the formulation
Je = K2/E.
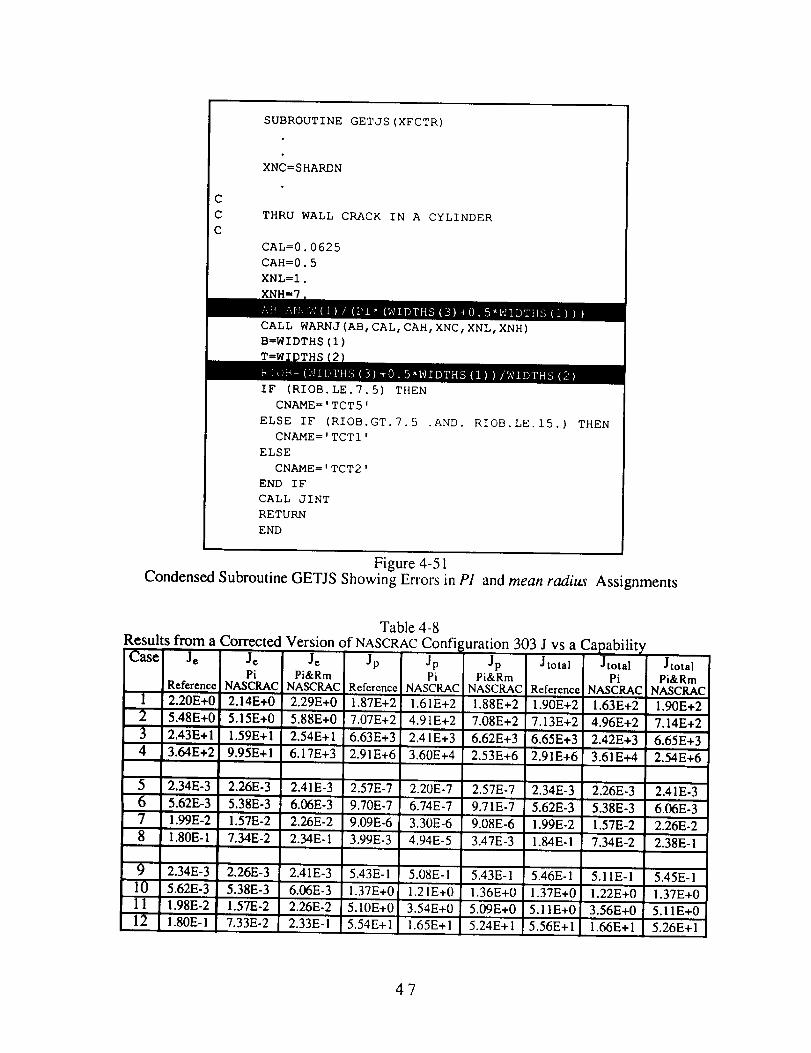
As noted above, a runtime error was discovered in configuration 303. A second error, thedefinition of the mean radius of the cylinder, was also found in this capability. The runtime
error, a divide by zero error, occurred because the variable PI (Figure 4-51) was notdefined in subroutine GETJS and therefore was automatically set to zero by the VAX. Themean radius was incorrectly defined in GETJS as the inner radius plus one-half of the arc
length (WIDTHS(l)), not the inner radius plus one-half the cylinder wall thickness(WIDTHS(2)). Both errors were corrected offline. Results from the corrections, which are
given in table 4-8, are in good agreement with reference 5. In table 4-8, the Referencecolumn is the benchmark for comparison, the PI NASCRAC column contains results from acorrected version in which only the first error, the assignment of PI, was corrected, and,
finally, the Pl and Rrn NASCRAC column contains results from a version in which botherrors were corrected. The results in the table clearly indicate that simply defining PI did
not result in a valid solution.
46
SUBROUTINE GETJS(XFCTR)
XNC=SHARDN
THRU WALL CRACK IN A CYLINDER
CAL=0. 0625
CAH=0.5
XNL=I.
I=7.
CALL WARNJ (AB, CAL, CAH, XNC, XNL, XNH)
B=WIDTHS (i)T--WIDT
IF (RIOB.LE.7.5) THEN
CNAME='TCT5'
ELSE IF (RIOB.GT.7.5 .AND. RIOB.LE.15.) THENCNAME='TCTI'
ELSE
CNAME='TCT2'
END IF
CALL JINT
RETURN
END
Figure 4-51
Condensed Subroutine GETJS Showing Errors in P1 and mean radius Assignments
Table 4-8
Results from a Corrected Version of NASCRAC Confi uration 303 J vs a Capabilit)
Case Je Je Je Jp Jp Jp Jtotal Jtotal JtotalPi&Rm
NASCRAC
1.90E+2
7.14E+2
1
2
3
4
Pi Pi&Rm PiRe_rence NASCRAC NASCRAC Re_rence NASCRAC
2.20E+0 2.14E+0 2.29E+0 1.87E+2 1.61E+2
5.48E+0 5.15E+0 5.88E+0 7,07E+2 4.91E+2
2.43E+1 1.59E+1 2.54E+1
3.64E+2 9.95E+1 6.17E+3
5 2.34E-3 2.26E-3
6 5.62E-3 5.38E-3
7
Pi&RmNASCRAC
1.88E+2
6,63E+3 2.41E+3
2.91E+6 3.60E+4
2.57E-7 2.20E-7
9.70E-7 6.74E-7
9,09E-6 3,30E-6
3.99E-3 4,94E-5
7.08E+2
6.62E+3
2.53E+6
2.41E-3 2.57E-7
Reference
1.90E+2
7,13E+2
6.65E+3
2.91E+6
2.34E-3
5.62E-3
PiNASCRAC
1.63E+2
4.96E+2
2.42E+3
3.61E+4
2.26E-3
6.65E+3
2.54E+6
2.41E-3
6.06E-3 9171E-7 5.38E-3 6.06E-3
1.99E-2 1.57E-2 2.26E-2 9.08E-6 1.99E-2 1.57E-2 2.26E-2
1.80E- 1 7.34E-2 2.34E- 1 3.47E-3 1.84E- 1 7.34E-2 2.38E- l
5.43E-1 5.46E-1 5.11E-I 5.45E-1
1.36E+0 1.37E+0 1.22E+0 1.37E+0
5.09E+0 5.11E+0 3.56E+0 5.11E+0
1.66E+15.24E+ 1 5.56E+ 1
9 2.34E-3 2.26E-3 2.41E-3 5.43E-1 5.08E-1
10 5.62E-3 5.38E-3 6.06E-3 1.37E+0 1.21E+0
11 1.98E-2 1.57E-2 2.26E-2 5.10E+0 3.54E+0
12 1.80E-1 7.33E-2 2.33E-1 5,54E+1 1.65E+1 5.26E+1
47
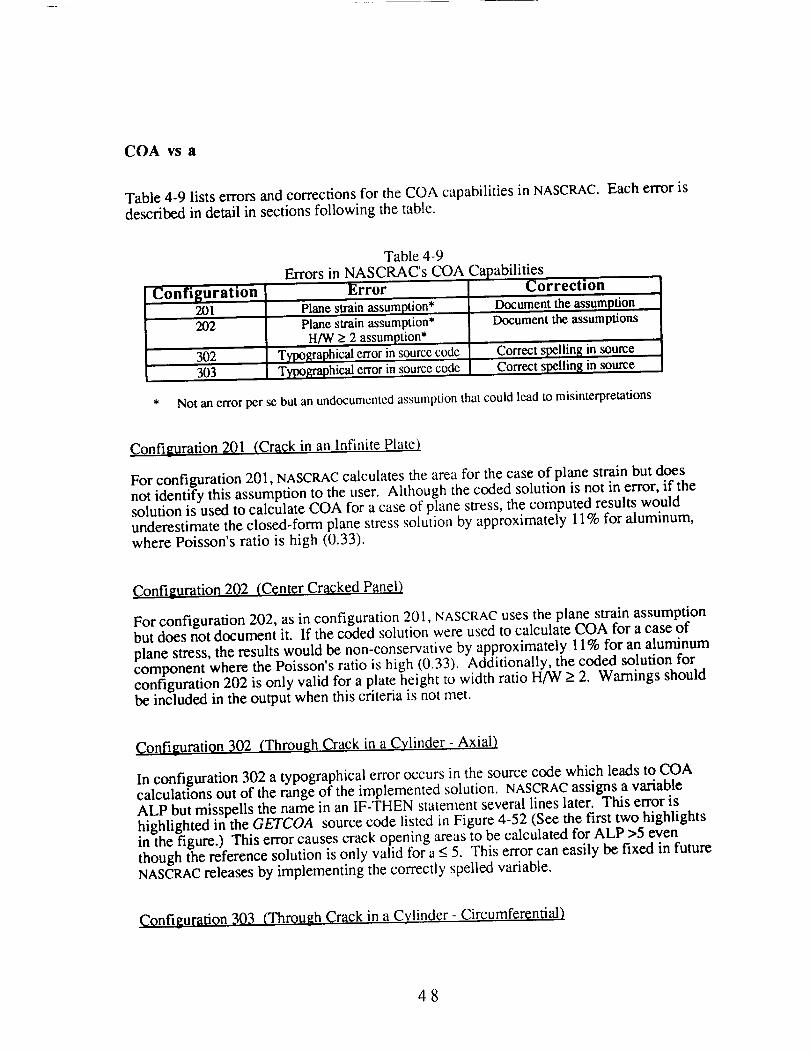
COA vs a
Table 4-9 lists errors and corrections for the COA capabilities in NASCRAC. Each error is
described in detail in sections following the table.
Confi[uration2oi2O2
302_03
Table 4-9
Errors in NASCRAC's COA CapabilitiesError
Plane strain assumption*Plane strain assumption*
H/W _>2 assumption*Typographical error in source codeTvoographical error in source code
Correction
Document the assumptionDocument the assulclptJons
Correct spelling in sourceCorrect spellin 8 in source
* Not an error per se but an undocumented assumption that could lead to misinterpretations
Configuration 201 (Crack in an Infinite Plate)
For configuration 201, NASCRAC calculates the area for the case of plane strain but doesnot identify this assumption to the user. Although the coded solution is not in error, if thesolution is used to calculate COA for a case of plane stress, the computed results wouldunderestimate the closed-form plane stress solution by approximately 11% for aluminum,
where Poisson's ratio is high (0.33).
Configuration 202 (Center Cracked Panel)
For configuration 202, as in configuration 201, NASCRAC uses the plane strain assumptionbut does not document it. If the coded solution were used to calculate COA for a case of
plane stress, the results would ,be non-conservative by approximately 11% for an aluminumcomponent where the Poisson s ratio is high (0.33). Additionally, the coded solution forconfiguration 202 is only valid for a p.late height to width ratio H/W > 2. Warnings shouldbe included in the output when this crtteria is not met.
Configuration 302 (Through Crack in a Cylinder - Axial)
In configuration 302 a typographical error occurs in the source code which leads to COAcalculations out of the range of the implemented solution. NASCRAC assigns a variableALP but misspells the name in an IF-THEN statement several lines later. This error is
highlighted in the GETCOA source code listed in Figure 4-52 (See the first two highlightsin the figure.) This error causes crack opening areas to be calculated for ALP >5 eventhough the reference solution is only valid for a < 5. This error can easily be fixed in futureNASCRAC releases by implementing the correctly spelled variable.
Configuration 303 (Through Crack in a Cylinder - Circumferential)
48
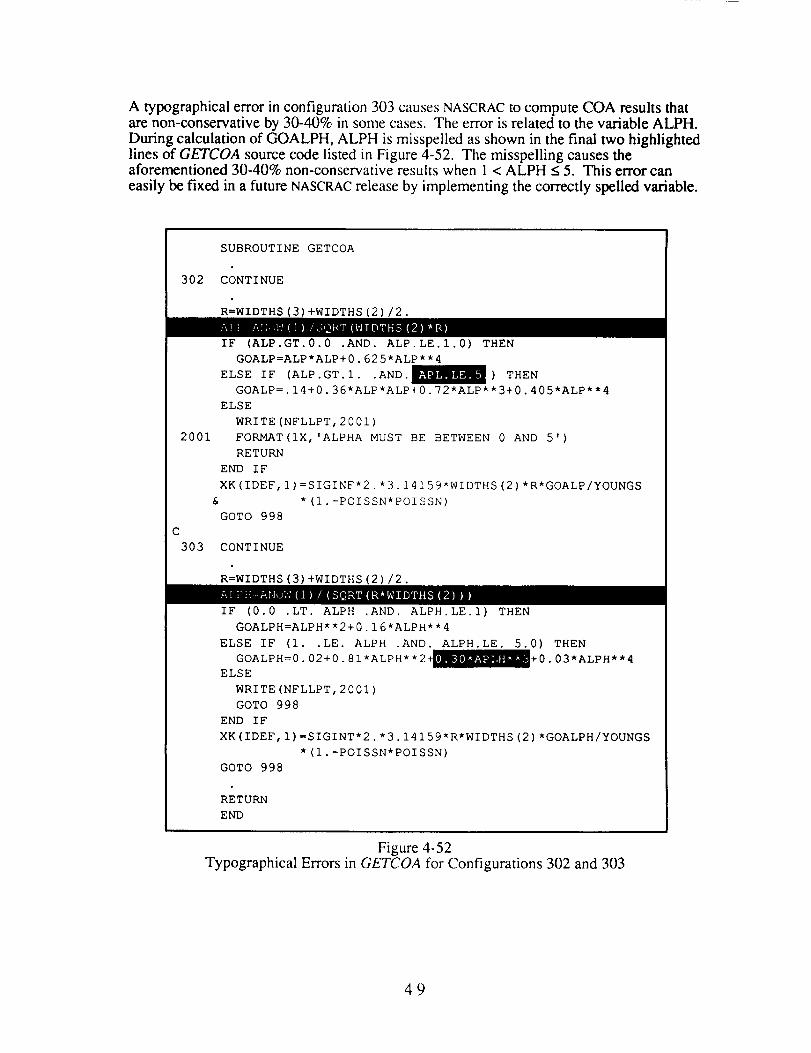
A typographical error in configuration 303 causes NASCRAC to compute COA results thatare non-conservative by 30-40% in some cases. The error is related to the variable ALPH.During calculation of GOALPH, ALPH is misspelled as shown in the final two highlightedlines of GETCOA source code listed in Figure 4-52. The misspelling causes theaforementioned 30-40% non-conservative results when 1 < ALPH < 5. This error can
easily be fixed in a future NASCRAC release by implementing the correctly spelled variable.
SUBROUTINE GETCOA
302 CONTINUE
SQ[<T (WIDTHS (2) *R)
2001
C
303
R=WIDTHS (3)+WIDTHS (2) /2.
IF (ALP.GT.0.0 .AND. ALP.LE.I.0) THEN
GOALP=ALP*ALP+0.625*ALP**4
(ALP.GT.I. .AND._) THENELSE IF
GOALP=.I4+0.36*ALP*ALP+0.72*ALP**3+0.405*ALP**4
ELSE
WRITE(NFLLPT, 2001)
FORMAT(IX, 'ALPHA MUST BE BETWEEN 0 AND 5')
RETURN
END IF
XK(IDEF, I)=SIGINF*2.*3.14159*WIDTHS(2)*R*GOALP/YOUNGS
& * (I.-POISSN*POISSN)
GOTO 998
CONTINUE
R=WIDTHS (3)+WIDTHS (2) /2.
ALPi{ AN<A4 SQRT R*WIDTHI (2
IF (0.0 .LT. ALPH .AND. ALPH.LE.I) THEN
GOALPH=ALPH**2+0.16*ALPH**4
ELSE IF (i. .LE. ALPH .AND. ALPH.LE. 5.0) THEN
GOALPH=0.02+0.81*ALPH**2_+0.03*ALPH**4
ELSE
WRITE(NFLLPT, 2001)
GOTO 998
END IF
XK(IDEF, I)=SIGINT*2.*3.14159*R*WIDTHS(2)*GOALPH/YOUNGS
*(I.-POISSN*POISSN)
GOTO 998
RETURN
END
Figure 4-52Typographical Errors in GETCOA for Configurations 302 and 303
49
SUMMARY and RECOMMENDATIONS
Verification and validation of NASCRAC's K vs a, J vs a and COA vs a capabilities have
been completed. Several limitations of NASCRAC and several minor errors such astypographical mistakes were found. Additionally a few significant discrepancies inNASCRAC results were observed and documented. The K vs a capabilities for the 100
series (standard specimens), 200 series (through thickness cracks in planar bodies), 300series (through thickness cracks in shells), 400 series (one degree-of-freedom cracks inbodies of revolution), and 500 series (buried cracks) cracks generally compared well withthe reference solutions. The 600 series (comer cracks) and 700 series (surface cracks)cracks tended to differ more from the reference solutions. Variable thickness K vs a
solutions were in good agreement with the references when consistent input quantities wereincluded. J vs a solutions showed good agreement with the references except for caseswhere hi table entries were incorrect in NASCRAC. Additionally Je, the elastic component
of J, diverged significantly from reference results after the solution had entered the plasticzone. This result is expected and does not affect the validity of the total J solution becausethe elastic component is insignificant in this region. Finally, other than minor
typographical errors, the COA vs a solutions in NASCRAC compared favorably to reference12, which was the source for the coded solutions.
Typographical errors that were uncovered should be corrected as soon as possible andreleased in an updated version. The corrections should include the errors found in K vs afor configurations 101,601, and 602; J vs a hi tables and for configuration 303; and COAvs a for configurations 302 and 303. A correction to the screen message for configuration104 geometry (the message defines the relationship between the specimen width andlength) should also be made while editing the typographical errors.
The updated version should include coded error flags which force the user to input valueswithin the geometry domain of the coded solution. These flags are necessary for geometrydefinitions for configurations 205, 207, 208, 301,302, 403, and 404.
Documentation which fully discusses the expected load inputs for the variable thickness Kvs a solutions should be released as soon as possible. In a future version of NASCRAC theK vs a solutions should be recoded so that stress values will always be the required input
quantity. This recoding will ensure consistency throughout the code and also consistencywith weight function theory.
The K solution for configuration 404 should be reformulated in future releases ofNASCRAC. The current solution assumes a geometry that is easily described with two
variables. This geometry is reasonable for static K vs a analyses where a is less than theradius of the cylinder; however, during fatigue crack growth, this model would grow thecrack in a non-conservative manner.
For configurations 601 and 602, NRC recommends that NASA/MSFC sponsor aparametric finite element analysis to develop an upgrade to these solutions which moreaccurately models the configuration. The analytical studies should include hole diameter,plate width, plate thickness, and, perhaps, pin load distribution as parameters. Forconfiguration 605, NASA/MSFC should develop an improved solution for non-uniform
load configurations.
Weight functions for 702, 704, and 705 were derived from the 703 weight function andadjusted for geometry. Application of this function to the 702 and 704 geometry isquestionable due to curvature effects, especially at crack tip a2, which is curved in the case
5O
of 703and705but straightin thecaseof 702and704. To increaseconfidence,NASAshoulddevelopindependentweightfunctionsolutionsfor 702and704for incorporationintoNASCRAC.It maybepossibleto derivesuchindependentsolutionsfrom thework ofNewmanandRaju.
In Section IV, Results, under configuration 704, a hypothesis from reference 3 wasparaphrased: As cracks become elongated (less circular) the K value at al increases. Forexample, given a circular crack and an elliptical crack with the same depth al, the circularcrack will have a lesser K at al. If this statement is true, then the tendency of NASCRAC tOunderpredict K at al for configuration 704 will cause the crack to become less circular andmore elongated during fatigue crack growth simulations. Since the crack will be more
elongated than in reality, NASCRAC will predict a higher K value at al compared to itsprediction for a circular crack with the same crack depth al, a crack which may moreclosely model the real crack. This hypothesis from reference 3 and the application of it tothe NASCRAC 704 model should be verified through finite element studies and incorporatedinto any new algorithms developed for configuration 704.
The use of RMS averaging to calculate K values for three dimensional cracks such as
configurations 601,602, 702 and 704 is highly suspect for bending loads. NASA/MSFCshould develop a consensus on this approach to calculating K before employing NASCRACcomputed K's for these configurations under bending. Results presented in this reportsuggest that NASCRAC should not be employed for these cases.
To conclude, several minor corrections to NASCRAC version 2.0 and its accompanyingdocumentation can be completed with minimal effort and released in an updated version inthe near term. Other more complicated questions about specific NASCRAC solutions will
require analytical efforts to determine more acceptable solutions than the ones currently inNASCRAC. These efforts should be sponsored by NASA/MSFC. Finally use of NASCRACversion 2.0 as a tool for computation of K vs a, J vs a, and COA vs a should be acceptableto NASA/MSFC except as noted in this report.
51
REFERENCES
1. Bush, A.J., "Stress Intensity Factors for Single-Edge-Crack Solid and Hollow RoundBars Loaded in Tension," Journal of Testing and Evaluation, vol 9, no 4 (July 1981),
pp 216-223.2. "E 399 (Standard Test Method of Plane-Strain Fracture Toughness of Metallic
Materials)" in 1992 Annual Book of ASTM Standards, Philadelphia, American Society
for Testing and Materials, 1992, pp 506-536.3. Heliot, J., Labbens, R.C., and Pellissier-Tanon, A., "Semi-Elliptical Cracks in a
Cylinder Subjected to Stress Gradients", Fracture Mechanics ASTM STP 677, C.W.Smith ,Ed., Philadelphia, American Society for Testing and Materials, 1979, pp. 341-364.
4. Kobayashi, A.S., and Enetanya, A.N., "Stress Intensity Factor of a Comer Crack,"in Mechanics of Crack Growth 8th Symposium on Fracture Mechanics ASTM STP590, Philadelphia, American Society for Testing and Materials, 1976, pp. 477 - 495.
5. Kumar, V., et al, Advances in Elastic-Plastic Fracture Analysis, EPRI Report NP-3607, Schenectady, NY, prepared by General Electric Company for Electric PowerResearch Institute, Palo Alto, CA, 1984.
6. Kumar, V., et al, An Engineering Approach for Elastic-Plastic Fracture Analysis,EPRI Report NP-1931, Schenectady, NY, prepared by General Electric Company forElectric Power Research Institute, Palo Alto, CA, 1981.
7. Newman, J.C., and Raju, I.S., "Stress Intensity Factor Equations for Cracks inThree-Dimensional Finite Bodies," in Fracture Mechanics 14th Symposium Volume I:
Theory and Analysis ASTM STP 791, Philadelphia, American Society for Testingand Materials, 1983, pp. 1-238 - 1-265.
8. Raju, I.S., and Newman, J.C., "Stress Intensity Factors for a Wide Range of Semi-Elliptical Surface Cracks in Finite Thickness Plates," in Engineering FractureMechanics, vol 11, no 4, 1979, pp 817-829.
9. Raju, I.S., and Newman, J.C., "Stress-Intensity Factors for Internal and ExternalSurface Cracks in Cylindrical Vessels", Journal of Pressure Vessel Technology, v104, November 1982, pp. 293-298.
10. Rooke, D.P., and Cartwright, D.J., Compendium of Stress Intensity Factors,London, Her Majesty's Stationery Office, 1976.
11. Si, Erjian, "Stress Intensity Factors for Edge Cracks in Round Bars," EngineeringFracture Mechanics, vol 37, no 4, (1990), pp 805-812.
12. Tada, H., Paris, P.C., and Irwin, G.R., Stress Analysis of Cracks Handbook, 2nded, St. Louis, Pads Productions, Inc, 1985.
13. Underwood, J.H., et al (editors), Fracture Mechanics, vol 17, ASTM STP 905,
Philadelphia, American Society for Testing and Materials, 1986, pp 59-74, 789-805.14. Wu, X.R., and Carlsson, A.J., Weight Functions and Stress Intensity Factor
Solutions, New York, Pergamon Press, 1991.
52


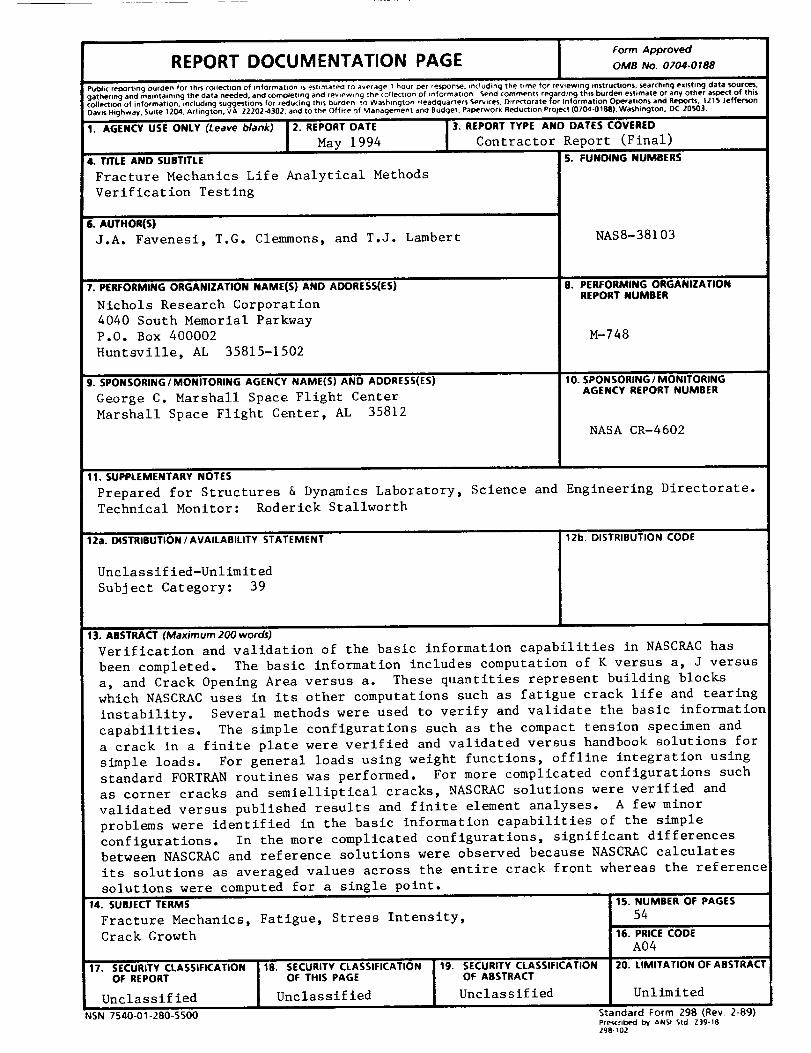
Form Approved
REPORT DOCUMENTATION PAGE OMBNo.0704-O,Se
Public reporting burden for this collection of information ps est=matec! to average 1 hour Der resloonse, including the t_me for revtewlng instructions, searching ex_stmcj data sources.
gathermg and mamta n ng the data nc_eded_ and c_m_iet_ng and re_ewm_ the c_ec_n _f inf_rrnat_n Send comments re_arding this t)urden estimate or any other aspect of thiscollection of information, including suggestions for reducing this burclen to Washington Headquarters ¢Jerv=ces, Directorate for Informat on ODerat ons and Rel)octs, t215 Jefferson
Davis Highway, Suite 1204. Arlington, VA 22202-4302. and to the Office of Management and Budget. Paperwork Reduction Pro ect (0704-0188), Washington. DC 2050.t,
1. AGENCY USE ONLY (Leave blank) 2. REPORT DATE 3. REPORT TYPE AND DATES COVERED
May 1994 Contractor Report (Final)
4. TITLE AND SUBTITLE 5. FUNDING NUMBERS
Fracture Mechanics Life Analytical Methods
Verification Testing
6.AUTHOR(S)
J.A. Favenesi, T.G. Clemmons, and T.J. Lambert
7. PE_ORMING ORGANIZATION NAME(S) AND ADDRESS(ES)
Nichols Research Corporation
4040 South Memorial ParkwayP.O. Box 400002
Huntsville, AL 35815-1502
9. SPONSORING/MONITORINGAGENCY NAME(S) AND ADDRESS(ES)
George C. Marshall Space Flight Center
Marshall Space Flight Center, AL 35812
NAS8-38103
B. PERFORMING ORGANIZATIONREPORT NUMBER
M-748
10. SPON SORING / MONITORINGAGENCY REPORT NUMBER
NASA CR-4602
11. SUPPLEMENTARYNOTES
Prepared for Structures & Dynamics Laboratory, Science and Engineering Directorate.
Technical Monitor: Roderlck Stallworth
1Za. DISTRIBUTION/AVAILABILITY STATEMENT
Unclassified-Unlimited
Subject Category: 39
12b. DISTRIBUTION CODE
13. ABSTRACT(Maximum200words)Verification and validation of the basic information capabilities in NASCRAC has
been completed. The basic information includes computation of K versus a, J versus
a, and Crack Opening Area versus a. These quantities represent building blocks
which NASCRAC uses in its other computations such as fatigue crack life and tearing
instability. Several methods were used to verify and validate the basic information
capabilities. The simple configurations such as the compact tension specimen and
a crack in a finite plate were verified and validated versus handbook solutions for
simple loads. For general loads using weight functions, offline integration usingstandard FORTRAN routines was performed. For more complicated configurations such
as corner cracks and semielliptical cracks, NASCRAC solutions were verified and
validated versus published results and finite element analyses. A few minor
problems were identified in the basic information capabilities of the simple
configurations. In the more complicated configurations, significant differences
between NASCRAC and reference solutions were observed because NASCRAC calculates
its solutions as averaged values across the entire crack front whereas the reference
solutions were computed for a single point.
14. SU_ECTTERMS
Fracture Mechanics, Fatigue, Stress Intensity,
Crack Growth
17. SECURITY CLASSIFICATIONOF REPORT
Unclassified
NSN 7540-01-280-$500
18. SECURITY CLASSIFICATIONOF THIS PAGE
Unclassified
19. SECURITY CLASSIFICATION
OF ABSTRACT
Unclassified
15. NUMBER OF PAGES
54
16. PRICE CODE
A04
20. LIMITATION OF ABSTRACT
Unlimited
Standard Form 298 (Rew 2-89)Pre_rlb¢_ by ANSI r_td Z39-18
298-102