fouux-a framework for usability & user experience829950/fulltext01.pdf · 2015-06-30 ·...
TRANSCRIPT
i
Master Thesis Software Engineering Thesis no: MSE-2009-23 September-2009
School of Computing Blekinge Institute of Technology Box 520 SE – 372 25 Ronneby Sweden
FOUUX-A Framework for Usability & User Experience
Jia Tan

ii
This thesis is submitted to the School of Computing at Blekinge Institute of Technology in partial fulfillment of the requirements for the degree of Master of Science in SoftwareEngineering. The thesis is equivalent to 40 weeks of full time studies.
Contact Information: Author: Jia Tan E-mail: [email protected]
University advisor(s): Dr. Cigdem Gencel Department of Systems and Software Engineering Dr. Kari Rönkkö User-Oriented Design and Development group manager
School of Computing Blekinge Institute of Technology Box 520 SE – 372 25 Ronneby Sweden
Internet : www.bth.se/tek Phone : +46 457 38 50 00 Fax : + 46 457 271 25

i
ABSTRACT
The main focus of the research in this thesis is to develop a consolidated framework of usability and user experience testing for telecom companies.
The existing usability standards, literature and models are reviewed. Different usability evaluation methods; user experience definitions and evaluation methods are identified through a comprehensive literature survey. A brief discussion of the relationship between usability and user experience together with the challenges are also presented. Based on these, then it is explained how to unify these several resources into a single consolidated framework. A unified terminology for the usability attributes, sub-attributes and measures are presented in the framework. The framework is called Framework for Usability and User Experience (FOUUX).
FOUUX serves as a guideline for tracing and
interpreting the data collected on usability of products. It includes nine usability attributes, each of which corresponds to a specific aspect of usability that is identified in an existing standard, literature or model. These nine usability attributes are decomposed into twenty seven sub-attributes, and the relationship between the attributes and sub-attributes are presented. Questions and measures are then classified under sixty three sub-goals utilizing the Goal Question Metric (GQM) approach.
In this thesis study, case study approach was used for validating the framework. The framework has been applied to a specific industry share case, that is, the Fitness application which is being developed by an industrial partner.
Keywords: Usability; User Experience; Framework; Evaluation; Measurement.

ii
ACKNOWLEDGEMENT
I would especially like to thank Dr.Cigdem Gencel and Dr.Kari Rönkkö, my supervisors of the thesis work, for their constant encouragement and patient guidance during the past six months. Thanks to all of the people at Adduce AB, particular thanks to CEO Mats Hellman and Usability Expert Mårten Ahlberg, for their constant help and time for the case study. To my parents, Hua Wei and Zhiyi Tan, Thanks for your unconditional love and great confidence in me all through these years, although Sweden is far from Shanghai. To my boy friend, Xiaodong Wang, Your absolute and determined belief in me inspires me all the time in the past three years. Your love has always been and continues to be the inspirational force in my life.

iii
TABLE OF CONTENTS ABSTRACT .......................................................................................................................................... I
ACKNOWLEDGEMENT .................................................................................................................. II
TABLE OF CONTENTS .................................................................................................................. III
LIST OF FIGURES............................................................................................................................. V
LIST OF TABLES..............................................................................................................................VI
1 INTRODUCTION ....................................................................................................................... 1
1.1 BACKGROUND .............................................................................................................................. 1 1.2 AIMS AND OBJECTIVES................................................................................................................ 2 1.3 RESEARCH QUESTIONS................................................................................................................ 3 1.4 EXPECTED OUTCOMES ................................................................................................................ 3 1.5 RESEARCH METHODOLOGY........................................................................................................ 4 1.6 OVERVIEW OF ISO STANDARDS .................................................................................................. 5 1.7 OVERVIEW OF QUALITY MODELS AND USABILITY MEASUREMENT MODELS............................. 7
2 USABILITY ................................................................................................................................. 8
2.1 USABILITY DEFINITIONS FROM DIFFERENT STANDARDS ............................................................ 8 2.2 USABILITY DEFINITIONS IN THE LITERATURE .......................................................................... 10 2.3 USABILITY DEFINITIONS IN DIFFERENT MEASUREMENT MODELS............................................ 11
3 A CONSOLIDATED USABILITY FRAMEWORK............................................................. 15
3.1 RATIONALE FOR A CONSOLIDATED FRAMEWORK .................................................................... 15 3.2 FIRST PART OF FOUUX: A CONSOLIDATED FRAMEWORK-USABILITY PART .......................... 15
3.2.1 Target user group and Context of Use................................................................................ 15 3.2.2 FOUUX: Usability Attributes ............................................................................................. 16 3.2.3 FOUUX: Usability Sub-Attributes ...................................................................................... 18 3.2.4 FOUUX: Overview of relationship between Usability Attributes & Sub-Attributes........... 20 3.2.5 FOUUX: Developing and Classifying Questions & Measures related to Usability Attributes & Sub-Attributes.......................................................................................................... 21
3.2.5.1 Rational for developing and classifying questions & measures ................................................ 21 3.2.5.2 Presentation of Questions and Measures................................................................................... 22
4 USABILITY EVALUATION METHODS ............................................................................ 41
4.1 USER-BASED EVALUATIONS ...................................................................................................... 41 4.1.1 User-administered questionnaires ...................................................................................... 41 4.1.2 Observing Users ................................................................................................................. 42 4.1.3 Empirical Usability Testing ................................................................................................ 43
4.2 INSPECTION-BASED EVALUATIONS ........................................................................................... 47 4.2.1 Heuristic Evaluation ........................................................................................................... 47 4.2.2 Guideline-Based Methods ................................................................................................... 48 4.2.3 Cognitive Walk-Through..................................................................................................... 48 4.2.4 Heuristic Walkthrough........................................................................................................ 48
4.3 MODEL-BASED EVALUATIONS................................................................................................... 49 4.3.1 Task Network Models.......................................................................................................... 49 4.3.2 Cognitive Architecture Models ........................................................................................... 50 4.3.3 Goals Operators Methods Selection rules (GOMS) Models............................................... 50
5 USER EXPERIENCE (UX) .................................................................................................... 51
5.1 UX DEFINITIONS FROM LITERATURE ........................................................................... 51 5.1.1 Definitions........................................................................................................................... 51 5.1.2 Building Blocks ................................................................................................................... 52
iv
5.1.3 A model distinguishes between Pragmatic and Hedonic attributes .................................... 55 5.2 MEASURING UX......................................................................................................................... 56
5.2.1 The Sum-of-Factor Approach ............................................................................................. 56 5.2.2 The cultural probe methods ................................................................................................ 57 5.2.3 The Narration and Storytelling Approach .......................................................................... 57 5.2.4 Emotion evaluation Approach ............................................................................................ 57 5.2.5 Questionnaire Approach..................................................................................................... 59
5.3 SECOND PART OF FOUUX: A CONSOLIDATED FRAMEWORK-UX PART .................................. 59
6 RELATIONSHIP BETWEEN USABILITY & UX.................................................................. 61
7 USABILITY & UX CHALLENGES THAT CURRENTLY MOBILE INDUSTRY MEET.............................................................................................................................................................. 62
8 TEST THE FRAMEWORK ON AN INDUSTRY SHARE CASE ..................................... 64
8.1 INTRODUCTION OF THE ORGANIZATION ................................................................................... 64 8.2 INTRODUCTION OF THE PROJECT.............................................................................................. 64 8.3 CASE STUDY CONDUCT .............................................................................................................. 69
8.3.1 Develop test procedure ....................................................................................................... 69 8.3.1.1 Develop Usability & UX evaluation documents.................................................................. 69 8.3.1.2 Select evaluation methods .......................................................................................................... 70
8.3.2 Conduct a test ..................................................................................................................... 71 8.4 ANALYZING AND PRESENTING TEST RESULTS .......................................................................... 71 8.5 RESULTS AND SUGGESTIONS...................................................................................................... 75 8.6 EXPERT EVALUATION ................................................................................................................ 76
9 CONCLUSIONS AND FUTURE WORK ............................................................................. 78
10 REFERENCES ...................................................................................................................... 80
APPENDIX A...................................................................................................................................... 90

v
LIST OF FIGURES Figure 1: Overview of Case study…………………………………………………………….4 Figure 2: Published ISO standards related to HCI and usability.……………………………..5 Figure 3: Categories of Usability Standards.………………………………………………….8 Figure 4: UX building blocks………………………………………………………………..55 Figure 5: Product Emotion Measurement instrument interface……………………………..58 Figure 6: Main screen………………………………………………………………………..65 Figure 7: Today’s information………………………………………………………………65 Figure 8: Goals………………………………………………………………………………66 Figure 9: Journals……………………………………………………………………………66 Figure 10: Add meal…………………………………………………………………………67 Figure 11: Add activity………………………………………………………………………67 Figure 12: Personal information……………………………………………………………..68 Figure 13: Program plan……………………………………………………………………..68 Figure 14: raw data in spreadsheet…………………………………………………………..71 Figure 15: Test leader’s feedback collection based on observation…………………………72 Figure 16: Fitness Application Usability & UX test result………………………………….75
vi
LIST OF TABLES Table 1: Categories of Usability Standards Description……………………………………..8 Table 2: Usability Definitions in Standards………………………………………………….9 Table 3: Usability Definitions from literature……………………………………………….10 Table 4: Usability in quality models and specific measurement models……………………12 Table 5: FOUUX: Usability Attributes Description………………………………………...17 Table 6: FOUUX: Usability Sub-Attributes Description………………………………… ...18 Table 7: FOUUX: Relations between Usability Attributes and Sub-attributes……………..21 Table 8: UX Definitions from Literature……………………………………........................52 Table 9: User Experience Building Blocks………………………………………………….53 Table 10: FOUUX: User Experience aspects and components……………………………...60 Table 11: Raw data and calculation results of Learnability evaluation……………………..73 Table 12: Raw data and calculation results of Effectiveness evaluation……………………74 Table A.1: Overall Satisfaction and User Experience evaluation form……………………..90 Table A.2: Fitness Application Usability Survey form……………………………………...92 Table A.3: Fitness Application Test Protocol……………………………………………….93 Table A.4: Fitness Application Use Case Data Bank………………………………………..94 Table A.5: Usability evaluation questionnaire for each Use case.…………………………..96 Table A.6: Usability evaluation form for Test leader's consideration regarding each Use case
………………………………………………………………………………...102

1
1 INTRODUCTION 1.1 Background
Software quality has a vital role in software products. Developing high quality is
the key for successful software as well as the requirement of every customer. Due to increasing demands of software systems from the customers, the
organizations try to develop software which satisfies the users by achieving their expectations. The users will be satisfied if the software is conforming to the required functionality with desired quality level (Bhatti, 2005). The quality is considered as a criterion which satisfies the user by meeting the functional and non functional requirements of the system (Bhatti, 2005). It is not easy to develop high quality software which satisfies every user, as the expectations of every user are different from each other.
There are different quality models and standards like ISO 9126 (1991), ISO 25000 (2005), McCall (1977) and Boehm (1978)’s quality model which identify different quality attributes of software products. ISO 9126 categories software product quality attributes into six characteristics; Functionality, Reliability, Usability, Efficiency, Maintainability and Portability. Each of them is further sub-divided into sub characteristics (ISO/IEC 9126, 1991). There are a number of internal, external and quality in use metrics provided to measure the quality attributes of the system.
Usability is one of the important quality requirements from process and product perspective. The concept of usability can be used in different contexts such as execution time, performance, user satisfaction, ease of learning and etc. Most of the research studies and work on standardization have been done from the user-orientation perspective. The user-orientation mainly composed of usability and user experience (Henningsson et al., 2005).
The International Organization for Standardization (ISO) defines the usability as process-oriented and product-oriented along with different measures defined in ISO 9241-11(1998) and ISO 9126-1(1991), respectively (Cheikhi et al., 2006). ISO 9241-11 (1998) was developed in close conjunction with the Metrics for Usability Standards in Computing (MUSiC) project. Different organizations use different measures for testing the usability and user experience. A gap can be observed between the academia and industry in the context of usability testing (Gulliksen et al., 2004). Some other issues like end user representation and participation during development of mass market products, trustworthiness of end-user representations, understanding end-user techniques etc. complicate the understanding of how to incorporate the end-users. Obviously, usability is a multifaceted challenge (Henningsson et al., 2005).
Except for the ISO standards, lots of other authors have defined Usability by different methods. Shneiderman (1992) defines usability in terms of five measurable human factors. Preece et al. (1994) express usability in terms of four components. There are lots of other identifications as well.
However, the discussion has recently moved to a wider relationship between people and technology, the user experience (UX) (Rönkkö et al., 2008). As Kirakowski et al. (2006) mentioned, there are three primary elements that need to be considered when evaluating technology namely, the product, the interaction between the user and the product, and the experience of using the product. Each of these three elements represents unique but interdependent aspect of usage. They are Functionality (product), Usability (interaction), and Experience (user experience).
2
These three elements are independent, but somehow, they can influence each other as well. It is easy to image that poor usability for sure will influence user experience negatively, which in turn might discourage further use of the product or might make the user unwilling to buy another product in the future.
Some work (both theoretical and industrial) has been done in the field of UX, but much work remains to be done, as it is a new and developing field. There are a number of definitions of UX in existence and there is still no consensus yet. Taking the point of view from Hassenzahl & Tractinsky (2006), UX can be defined into three components, they are user’s internal state (expectations, needs, motivation, mood and etc); the characteristics of the designed system (complexity, usability, functionality and etc); and finally the context within which the interaction occurs.
Assessing User experience is a relatively new area of investigation, there aren’t any well-developed assessment methods yet.
Different stakeholders have different perceptions of usability. The size of sample remains a problem. The studies (Virzi, 1990, 1992, Lewis, 1994, Molich et al., 2001) have shown that usability is measured by subjective means which is not consistent. The testing of usability in this manner results in inconsistent results about the usability and have high risk from different usability aspects (McGee, 2004).Some studies proposed to broaden the usability construct to include more subjective dimension, while others advocate for creation a completely new construct. McCarthy and Wright (2005)’s Felt-Life framework, argues against design reductionism, suggesting that user experience cannot be deduced from product features. They propose that usability professionals should not be concerned with designing an experience but rather designing for experience.
The specific context such as users, tasks, and environment in which the quality attributes are studied may influence the results (Bevan et al., 1994). Mobile phones have become a natural part of our everyday lives, their usability are increasingly in demand. Usability brings many benefits: users are able and willing to use various features of the phone and services supplied by the operators, the need for customer support decreases and above all, user satisfaction increases. This thesis study mainly focused on the Mobile industry. Mobile industry grows rapidly but is not mature yet; they face a number of challenges. One of most significant challenges is to provide consumers with a reliable and usable product that meets their expectations and gives them a satisfying experience. User experience surfaces as a factor that determines success or failure on the market, phones that do not live up to the high expectations of the users will no longer be able to compete.
Some small companies even do not use common terminology to identify usability and user experience criteria and metrics for testing. How to introduce a framework of usability and user experience testing to these small telecom companies motivate us to do this thesis study. Although some studies have shown the difference between usability and UX, different definitions and identifications still confuse.
There are many methods, models and measures available in international standards (ISO, International Electrotechnical Commission (IEC), The Institute of Electrical and Electronics Engineers (IEEE) and etc), but these standards are not well-integrated to each other and have diverse nature in the definitions and measures of usability and user experience context (Seffal et al., 2006). The study in the present thesis will focus on how usability related ISO standards and authors define usability and user experience. This study will contribute by identifying relations between different standards along with published usability tests. Moreover, a framework of usability and user experience testing will be introduced aimed for small telecom companies in order to help them to improve the methods for measuring usability and user experience.
1.2 Aims and Objectives
3
The main aim of this thesis is to develop a framework that comprises the different measures for usability testing and user experience which helps the small telecom companies to improve the measures for usability testing and user experience.
It attempts to fulfill the aims through the following objectives:
• To collect the different definitions for usability and user experience from different ISO standards and literature in one report.
• Identification of interrelation between usability and user experience. • To identify different measures for usability and user experience identified in
different ISO standards and literature, and present a coherent view. • Identification of relations between different standards from the usability and user
experience point of view. • Identification of the currently published Usability testing methods and to understand
how they are implemented. • Identification of the Usability and User experience challenges which mobile industry
facing currently. 1.3 Research Questions
The research aims to answer the following questions:
• What are the definitions for Usability and User Experience? • Which measures are defined for usability testing in different ISO standards? • What are the currently published methods for Usability testing and User Experience
and how they are used? • What is the relationship between different ISO standards and literatures regarding
the definitions of Usability and User Experience? • Which are the Usability and User experience challenges that currently mobile
industry face? • What kind of framework can be developed to customize the number of questions and
measures for Usability and User Experience that is suitable for small telecom companies?
• Can FOUUX be used for designing a Usability and UX evaluation method by tailoring
FOUUX to the specific needs of the company and the application?
• Can these evaluations methods be used in an industrial context?
• How can the test results be used to provide suggestions for the company for further
improvement?
1.4 Expected Outcomes
This thesis report is organized to answer the research questions along with following outcomes as well.
• Literature review of different ISO standards and published papers. • A description of different definitions of Usability and User experience. • A description of interrelationship between Usability and UX. • A list of attributes or building blocks for Usability and User experience. • A list of currently published testing methods of Usability and User experience. • A framework developed from this thesis study, which shows different questions and
measures for the usability testing and user experience. • A test on an industry share case that applies the study results found after literature
review.

4
o To find how to apply the framework to evaluate Usability and User experience of mobile products and services in small company.
• To find how the framework we developed can improve the methods for measuring usability and user experience in Mobile Industry. Analysis of obtained results.
• Suggestions for organizations • Discussion and lesson learned.
1.5 Research Methodology
This thesis study uses a Case study approach (Creswell, 2002). Initially it will be conducted a literature review that comprises three steps. The
understanding of definitions and measures from different standards and currently published testing methods regarding Usability and User Experience will be the outcome of first step.
In second step the relationship between these standards from the usability testing and UX perspective will be sorted out.
In third step a framework will be developed which customize the number of questions and measures for usability testing and user experience that is suitable for small telecom companies. These steps are based on literature review.
An analysis will be carried out to apply our literature review research findings and tests the proposed framework through a test on an industrial share case. The results obtained from case will be analyzed to provide suggestions to organizations for future development consideration. Finally, the results are evaluated through an expert evaluation approach, to provide suggestions for improvement and work in the future.
The overview of case study can be seen in Figure 1.
Figure 1: Overview of Case study

5
1.6 Overview of ISO standards
Over the last fifteen years, a comprehensive range of international standards have been developed to define the general principles of user centered design and good practice in user interface design. Bevan (2001) claimed that Human-Computer Interaction (HCI) and usability standards can be described in the categories as follows: usability definitions, user in context, software interface and interaction, hardware interface, documentation and the development process and capability of the organization. The author presented all related ISO standards according to above classification in figure 2
.Figure 2: Published ISO standards related to HCI and usability ISO/IEC 9126-1(2001) defines usability in terms of understandability, learnability,
operability and attractiveness. Parts 2 and 3 include examples of metrics for these characteristics. They can be used to specify and evaluate detailed usability criteria.
6
ISO/IEC TR 9126-4 (2004) contains examples of metrics for effectiveness, productivity, safety and satisfaction that can be verified in a usability test. The results can be documented using the Common Industry Format for usability test reports.
ISO 9241-11(1998) describes how the usability of a product can be defined, documented and verified as part of a quality system.
ISO WD 20282 (2001) specifies the information about usability that should be provided with a consumer product, so that a purchaser can judge the ease of use of the product.
ISO 9241 parts 10, 12-17 (1998): provide detailed guidance on the design of user
interfaces. ISO 14915(2002) & IEC 61997 (2001) contain recommendations for multi-media
interfaces (to specify details of the appearance and behavior of the user interface). ISO/IEC 10741(1995) contains specific guidance for cursor control. ISO/IEC 11581(2000) contains specific guidance for icons. ISO/IEC 18021(2002) contains user interface specifications for PDAs with a data
interchange capability with corresponding servers. ISO 11064 (2000) contains eight parts and gives ergonomic principles,
recommendations and guidelines. ISO 9241 parts 3-9 (1998): provide detailed requirements and guidance on the
hardware design. ISO 13406 (1999) establishes ergonomic image-quality requirements for the
design and evaluation of flat panel displays and specifies methods of determining image quality.
ISO/IEC 14754 (1999) defines a set of basic gesture commands and feedback for pen interfaces. The gestures include: select, delete, insert space, split line, move, copy, cut, paste, scroll and undo.
ISO AWI 18789 (1999) is intended to revise and replace ISO 9241 Parts 3,7 and 8 and ISO 13406.
ISO/IEC WD 18019 (2000) describes how to establish what information users need, how to determine the way in which that information should be presented to the users, and how to prepare the information and make it available. This standard is intended to compliment ISO/IEC 9127 - User documentation and cover information for software packages, and ISO/IEC 15910 Software user documentation process.
ISO/IEC 15910 (1999) specifies the minimum process for creating user documentation for software that has a user interface, including printed documentation (e.g. user manuals and quick-reference cards, on-line documentation, help text and on-line documentation systems).
ISO 13407 (1999) provides guidance on human-centered design (HCD) activities throughout the life cycle of interactive computer-based systems. It is a tool for managing design processes and provides guidance on sources of information and standards relevant to the human-centered approach. It describes human-centered design as a multidisciplinary activity, which incorporates human factors and ergonomics knowledge and techniques with the objective of enhancing effectiveness and efficiency, improving human working conditions, and counteracting possible adverse effects of use on human health, safety and performance.
ISO/IEC 14598 (1999) specifies the process to be used to evaluate software products.
ISO DTR 16982 (2002) outlines different types of usability methods that can be used to support user centered design.
ISO TR 18529 (2000) contains a structured set of processes derived from ISO 13407 and a survey of good practice. It can be used to assess the extent to which an organization is capable of carrying out user-centered design.
ISO 9241-1 (1997) provides some guidance on how to use the standard and describes how conformance to parts of ISO 9241 should be reported.
7
ISO 9241-2 (1992) contains the design of tasks and jobs involving work with visual display terminals. It provides guidance on how task requirements may be identified and specified within individual organizations and how task requirements can be incorporated into the system design and implementation process.
ISO 10075-1 (2000) explains the terminology and provides definitions in the area of mental workload.
ISO DTS 16071 (2000) provides guidelines and recommendations for the design of systems and software that will enable users with disabilities greater accessibility to computer systems.
The objective of this thesis study is focusing on collecting usability definitions and
presenting a coherent view of different measures for usability, hence, ISO 9241-11; ISO/IEC 9126-1; ISO/IEC TR 9126-2, 3; and ISO/IEC TR 9126-4 are included in this thesis study. Detailed description will be presented in chapter 2.
1.7 Overview of Quality models and usability measurement models
This thesis study aims to find how usability is defined and measured, McCall (1977)’s quality model is included, but Boehm (1978)’s quality model is not included because this model does not identify usability directly.
Detailed description of usability measurement models which are included in this thesis study are presented in Chapter 2. There are some other usability measurement models like Task Network Model (Chubb, 1981; Laughery, 1989); it is developed to assist in design stages before detailed design, especially for complex military systems. During the first part of thesis study, the focus is to collect definitions and measures of usability, hence, this model is not included in Chapter 2, but a brief introduction will be given through Chapter 3 when we are talking about evaluation method. Cognitive architecture model (Byrne, 2003) is rather complex and primarily used in basic research projects and there is limited experience in actual design settings, hence, it is not included as well.

8
2 USABILITY Usability is increasingly recognized as an important quality factor for interactive
software systems, including traditional GUIs-style applications, Web sites, and the large variety of mobile and PDA interactive services. There are numbers of studies in the literature such as Jokela et al. (2005), Hart et al. (2008) which have addressed the problem of how to measure usability. Several different standards (ISO 9126 (1991), ISO 9241-11(1998)) and models (Kirakowski and Corbett (1993), Macleod and Rengger (1993), Bevan (1995), Sears (1995) and Macleod et al. (1997)) for quantifying and assessing usability have been proposed. However, there is still no consistently used way across the standards and other models to define usability. Most of these various definitions do not include all aspects of usability. They are not easily integrated into practice. These make it difficult to select or measure specific aspects of usability for particular computer applications in practice. One of the major motivations of conducting this thesis study is to develop one possible consistent and consolidated framework for usability in the domain of mobile applications. .This framework will provide a basis for understanding various usability measures, and a common terminology between different stakeholders of software development.
2.1 Usability definitions from different standards
Usability has been defined in different ways from different standards, which makes it a confusing concept. Some broad definitions for usability were given by several standards. Bevan (1995) categorized these standards into two categories, one is Top-Down Approach which is focus on broad quality objective, and the other is Bottom-Up approach which is product-oriented. This categorization is shown in Figure 3 and Table 1. The corresponding standards which provide the usability definitions are summarized in Table 2.
Figure 3: Categories of Usability Standards.
Table 1: Categories of Usability Standards Description Categories of Usability Standards (Bevan, 1995)
Description
Top-Down Approach (Broad Quality Objective)
Originates from human factors, and standards of this type are applicable in the broad context of design and quality objectives.
Bottom-Up Approach (Product-Oriented)
Concentrates on the design of specific attributes, and relates more closely to the needs of the interface designer and the role of usability in software engineering.
Categories of Usability Standards
Top-Down A h
Bottom-Up Approach

9
Table 2: Usability Definitions in Standards
Standards Usability Definition Top-Down Approach (Broad Quality Objective Standards) ISO 9241-11 (1998)
Usability is defined as “The extent to which a product can be used by specified users to achieve specified goals with effectiveness, efficiency and satisfaction in a specified context of use”.
Guidance The guidance in ISO 9241-11 (1998) can be used in procurement,
design, development, evaluation, and communication of information about usability. ISO 9241-11(1998) includes guidance on how the usability of a product can be specified and evaluated. It applies both to products intended for general application and products being acquired for or being developed within a specific organization. The guidance includes procedures for measuring usability but does not detail all the activities to be undertaken.
Used For Activities
• Specification of overall quality and usability requirements and evaluation against these requirements (ISO 9241-11 (1998) and ISO/IEC 14598-1 (1999))
• Incorporation of usability into a quality system (ISO 9241-11 (1998))
• Incorporation of usability into the design process (ISO/IEC 13407 (1999))
Bottom Up Approach (Product-Oriented Standards) ISO/IEC 9126-1 (2001)
Usability is defined as “A set of attributes of software which bear on the effort needed for use and on the individual assessment of such use by a stated or implied set of users”.
ISO/IEC 9126-4 (2004)
Uses the term “Quality in use”: the capability of the software product to enable specified users to achieve specified goals with effectiveness, productivity, safety and satisfaction in specified contexts of use.
IEEE Std.610.12 (1990)
The ease, with which a user can learn to operate, prepares inputs for and interprets outputs of a system or component.
The ISO 9241-11 (1998) standard identified efficiency, effectiveness and
satisfaction as three major attributes of usability. But this standard gives relatively few guidelines about how to interpret scores from specific usability measures.
The ISO/IEC 9126-1 (2001) standard defined usability as one of the software quality attributes that can be further decomposed into five different factors, including understandability, learnability, operability, attractiveness, and usability compliance with published style guides or conventions for user interfaces.
ISO/IEC 9126-4 (2004) standard defined the related concept of quality in use as a kind of higher-order software quality attribute that can be decomposed into four factors, effectiveness, productivity, safety and satisfaction. In this standard, the difference between usability and the quality in use is a matter of context of use. That is, when usability is evaluated, the focus is on improving the user interface while the context of use is treated as a given. This means that the level of usability achieved will depend on the specific circumstances in which the product is used. In contrast, when quality in use is evaluated, any components of context of use might be changed or modified. For example, before evaluating the appropriateness of the design and content of a help system, it is necessary to consider specific user groups. While, when evaluating quality in use by user testing, specified users, their specified goals and particular environments, all these factors might change during evaluation.
This kind of concept of quality in use has been proposed by Bevan et al. in the year of 1994, the authors mentioned that the definition of the quality of use of an overall system can encompass all factors which may influence use of a product in the real

10
world, while the term usability is sometimes used narrowly to refer to the usability attributes of a product. The usability attributes of a product are only one contribution to the quality of use of an overall system.
Bevan et al. (1994) concluded that usability can be identified as three points of views. That it, the product-centered view which says that the usability of a product is the attributes of the product which contribute towards the quality of use; the context of use view which advocates that usability depends on the nature of the user, product, task and environment; and finally the quality of use view of usability which identifies usability as the outcome of interactions with a computer system, including whether intended goals of the system are achieved (effectiveness) with the appropriate expenditure of resources such as time, mental effort and etc. in a way the user finds acceptable (satisfaction).
IEEE Std.610.12 (1990) defined usability as the ease with which as user can learn to operate, prepare inputs for, and interpret outputs of a system or component. This standard gave separate definition for user friendly, that is, pertaining to a computer system, device, program, or document designed with ease of use as a primary objective.
Except for the standards which give definitions of usability (See Table 2), ISO/IEC 9126-2 & 3 (2003) standards provides both external and internal quality and related measures of usability. Internal quality generally concerns properties of the non-executable portion of a software product during development and measures for internal quality generally concern the quality of intermediate deliverables such as the source code for a prototype. While external quality concerns the behavior of the computer system, measures for external quality can be obtained only by executing the software product in the system environment for which the product is intended.
2.2 Usability definitions in the literature There are varying definitions of usability proposed by different authors. They
concern more specific attributes of usability. Based on the literature review of this thesis study, the definitions are summarized in Table 3.
Table 3: Usability Definitions from literature
Usability attributes from literature proposed by different authors Shackel (Shackel,1991)
Effectiveness (Speed) Learnability (Time to learn) Learnability (Retention) Effectiveness (Errors)
Usability is expressed in terms of five components :
Attitude Shneiderman (Shneiderman,1992)
Time to Learn Speed of Performance Rate of Errors by Users Retention Over Time
Defines usability in terms of five measurable human factors:
Subjective Satisfaction Nielsen (Nielsen,1993)
Efficiency of use Learnability (Ease of learning) Memorability Errors/safety
Defined usability in terms of five factors:
Satisfaction Dix et al. (Dix et al.,1993)
Learn-ability Define the concept on two levels. The Flexibility

11
top level has three main categories:
Robustness
Preece et al. (Preece et al., 1994) Learn-ability (Ease of learning) Throughput Flexibility
Usability is expressed in terms of four components : Attitude
Bevan and Macleod (Bevan and Macleod,1994) Usability is a result of use of a computer tool in a particular context, specially, these authors assume that quality in use can be measured as the outcome of interactions with a computer system, including whether intended goals of the system are achieved (effectiveness) with the appropriate expenditure of resources (e.g. time, mental effort) in a way the user finds acceptable (satisfaction).
Constantine & Lockwood (Constantine & Lockwood,1999) Efficiency in use Learnability Rememberability Reliability in use
Defined usability in terms of five factors:
User satisfaction Molich (Molich, 2000)
Easy to Learn Easy to Remember Efficient to Use Satisfactory to Use
State that a user-friendly system fulfils five goals:
Understandable From the table, it can be seen that most sources describe “efficiency” as a usability
attribute, but not all sources use this particular term, such as Shackel(1991); Dix et al.(1993); Preece et al(1994) and Shneiderman (1992). Meanwhile, not all sources include the same set of usability attributes. These can be a source of confusion for researchers and developers. It again highlights the need for a consolidated framework about usability measurement with consistent terms for usability attributes.
2.3 Usability definitions in different measurement models
The idea of usability has been represented in various software engineering quality models for more than three decades. Tracing back to the year of 1977, McCall has described usability into the classical quality models. Usability in McCall’s model is decomposed into three criteria, operability, training, and effectiveness.
Later, Nunnally and Bernstein (1994) defined a hypothetical construct as software usability is not directly measurable, instead, they can be only inferred indirectly though observed measures, such as perceived effectiveness, user satisfaction and performance evaluation.
Besides the standards, literature by different authors and famous quality models mentioned above, there are also some other usability measurement models and tools proposed over last 15 years.
One of the representatives among these measurement models is the Metrics for Usability Standards in Computing (MUSiC) model which is developed by Bevan (1995) and Macleod et al. (1997). This model is concerned specifically with defining measures of software usability, and mainly it is integrated into the original ISO 9241-11 standard.
Besides MUSiC model, there are several other models developed for different context of use such as the semi-Automated Interface Designer and Evaluator (AIDE) model which was developed by Sears (1995), it is a software tool aimed to evaluate static HTML pages.

12
The Diagnostic Recorder for Usability Measurement (DRUM) model which was developed by Macleod and Rengger (1993) is a software tool for analyzing user-based evaluations and delivery of these data to the appropriate party.
These measurement models are summarized in Table 4. And the set of usability attributes are highlighted so that different aspects of usability which are commonly identified to measure are listed.
Table 4: Usability in quality models and specific measurement models
Usability in traditional software quality models and other specific measurement models Global satisfaction Effectiveness Efficiency Helpfulness Control
The Software Usability Measurement Inventory (SUMI) (Kirakowski and Corbett, 1993) As part of the MUSiC project, a 50-item user satisfaction questionnaire called the Software Usability Measurement Inventory was developed to provide measures of global satisfaction and of five more specific usability areas.
Learn-ability
The Diagnostic Recorder for Usability Measurement (DRUM) (Macleod and Rengger, 1993)
The Diagnostic Recorder for Usability Measurement is a software tool for analyzing user-based evaluations and delivery of these data to the appropriate party, such as a usability engineer.
Task time or total time required for each task under study Snag, help, and search times, which concern the amount of time users spend dealing with problems such as seeking help or unproductively hunting through a system. Effectiveness, which as a metric is derived from measures of the quantity and quality of task output and measures whether user succeed in achieving their goals when working with a system. Efficiency, which relates effectiveness to the task time and thus measures the rate of task output. Relative efficiency, which indicates how efficiently a task is performed by a general user compared with an expert user on the same system or with the same task on another system.
The Log Processor component of DRUM is the tool concerned with metrics, it calculate several different performance-based usability metrics.
Productive period or the proportion of task time not spent in snag, help, or search (i.e., the relative amount of productive work time)
Nunally and Bernstein (Nunally and Bernstein,1994) Perceived effectiveness User satisfaction
Software usability can be only inferred indirectly through observed measures
Performance evaluation
The Skill Acquisition Network model (SANe) (Macleod, 1994) The Skill Acquisition Network model dealt with the analysis of the quality of use of interactive devices. This approach assumes a user interaction model that defines user tasks, the dynamics of the device, and procedures for executing user tasks. Specially, a task model and a device model are simultaneously developed and subsequently linked. Next user procedures are simulated within the linked task device model.
Efficiency (which is determined by the estimated costs of executing user procedures.)
A total of 60 different metrics are described in this framework, of which 24 Learning (which is defined as the number of states and
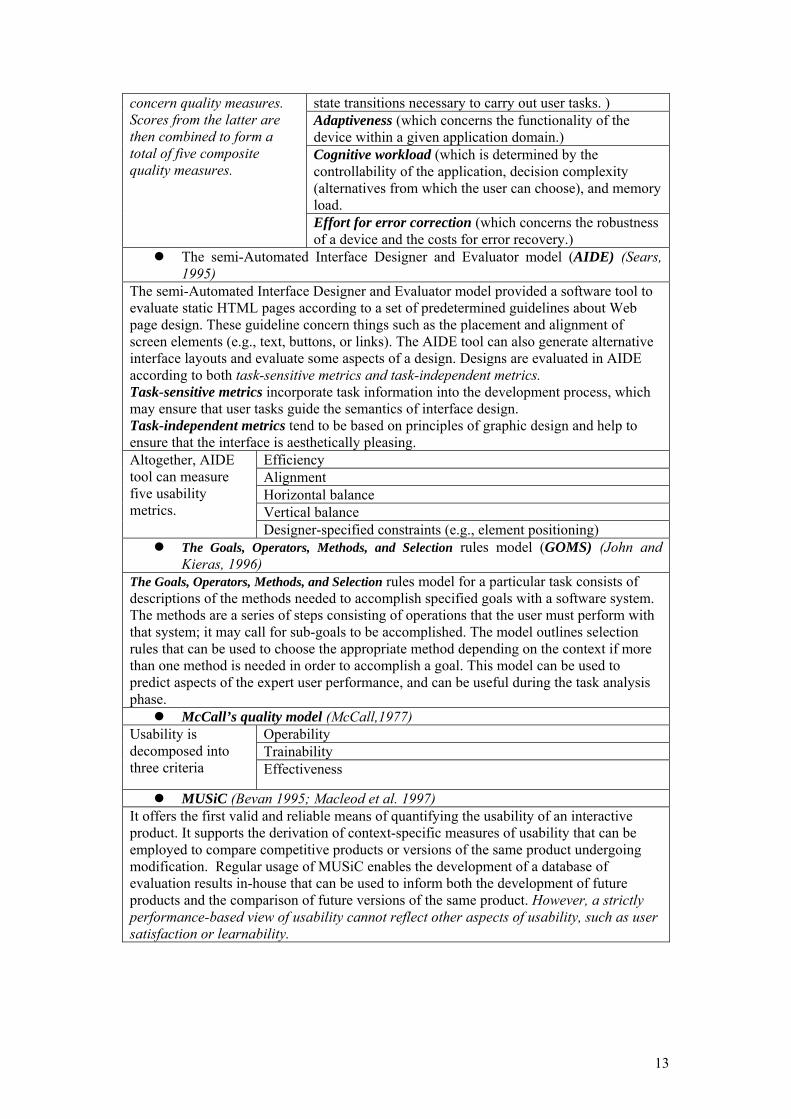
13
state transitions necessary to carry out user tasks. ) Adaptiveness (which concerns the functionality of the device within a given application domain.) Cognitive workload (which is determined by the controllability of the application, decision complexity (alternatives from which the user can choose), and memory load.
concern quality measures. Scores from the latter are then combined to form a total of five composite quality measures.
Effort for error correction (which concerns the robustness of a device and the costs for error recovery.)
The semi-Automated Interface Designer and Evaluator model (AIDE) (Sears, 1995)
The semi-Automated Interface Designer and Evaluator model provided a software tool to evaluate static HTML pages according to a set of predetermined guidelines about Web page design. These guideline concern things such as the placement and alignment of screen elements (e.g., text, buttons, or links). The AIDE tool can also generate alternative interface layouts and evaluate some aspects of a design. Designs are evaluated in AIDE according to both task-sensitive metrics and task-independent metrics. Task-sensitive metrics incorporate task information into the development process, which may ensure that user tasks guide the semantics of interface design. Task-independent metrics tend to be based on principles of graphic design and help to ensure that the interface is aesthetically pleasing.
Efficiency Alignment Horizontal balance Vertical balance
Altogether, AIDE tool can measure five usability metrics.
Designer-specified constraints (e.g., element positioning) The Goals, Operators, Methods, and Selection rules model (GOMS) (John and
Kieras, 1996) The Goals, Operators, Methods, and Selection rules model for a particular task consists of descriptions of the methods needed to accomplish specified goals with a software system. The methods are a series of steps consisting of operations that the user must perform with that system; it may call for sub-goals to be accomplished. The model outlines selection rules that can be used to choose the appropriate method depending on the context if more than one method is needed in order to accomplish a goal. This model can be used to predict aspects of the expert user performance, and can be useful during the task analysis phase.
McCall’s quality model (McCall,1977) Operability Trainability
Usability is decomposed into three criteria Effectiveness
MUSiC (Bevan 1995; Macleod et al. 1997) It offers the first valid and reliable means of quantifying the usability of an interactive product. It supports the derivation of context-specific measures of usability that can be employed to compare competitive products or versions of the same product undergoing modification. Regular usage of MUSiC enables the development of a database of evaluation results in-house that can be used to inform both the development of future products and the comparison of future versions of the same product. However, a strictly performance-based view of usability cannot reflect other aspects of usability, such as user satisfaction or learnability.
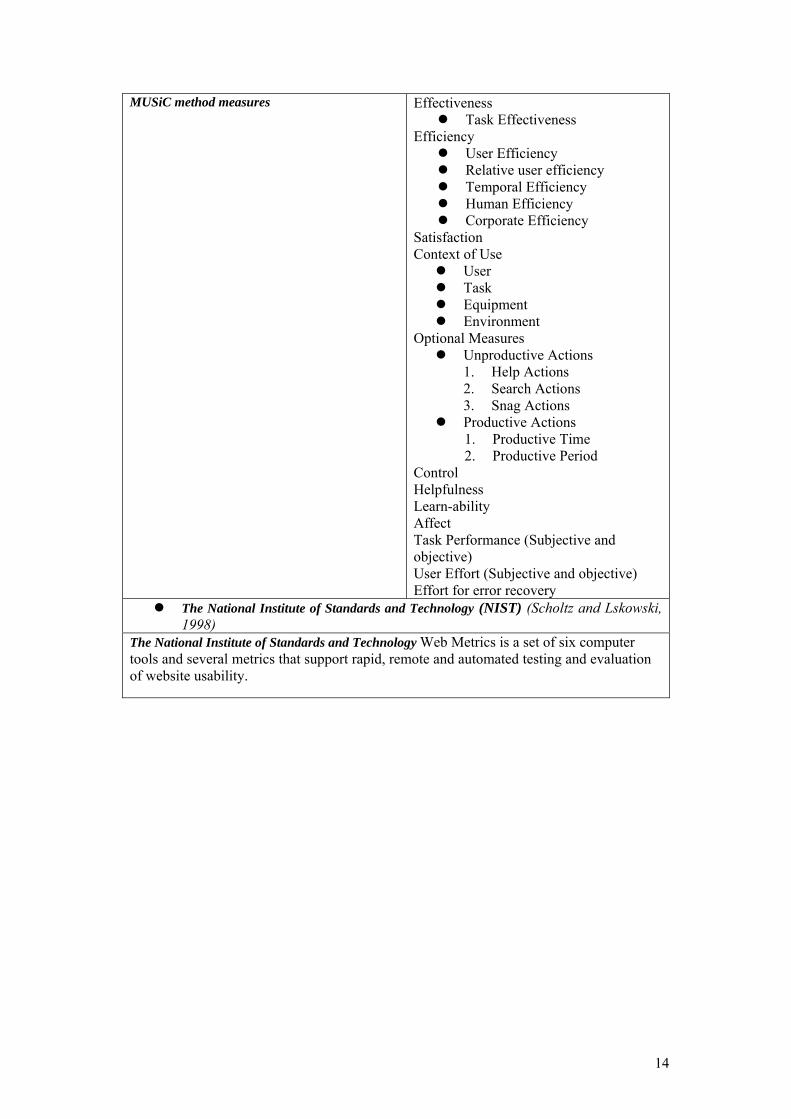
14
MUSiC method measures Effectiveness Task Effectiveness
Efficiency User Efficiency Relative user efficiency Temporal Efficiency Human Efficiency Corporate Efficiency
Satisfaction Context of Use
User Task Equipment Environment
Optional Measures Unproductive Actions
1. Help Actions 2. Search Actions 3. Snag Actions
Productive Actions 1. Productive Time 2. Productive Period
Control Helpfulness Learn-ability Affect Task Performance (Subjective and objective) User Effort (Subjective and objective) Effort for error recovery
The National Institute of Standards and Technology (NIST) (Scholtz and Lskowski, 1998)
The National Institute of Standards and Technology Web Metrics is a set of six computer tools and several metrics that support rapid, remote and automated testing and evaluation of website usability.

15
3 A CONSOLIDATED USABILITY FRAMEWORK
3.1 Rationale for a consolidated framework Based on the literature review of standards, literature and models related to
usability, it is clear that there is room for a consolidated framework for usability definition and measurement. Currently, there is no link between usability attributes, sub-attributes and measures defined in various standards, literature or models. The variation in definitions, terminology and relevant measures makes it difficult to apply usability standards in practice. A consolidated framework can provide unified terminology for usability attributes, sub-attributes and measures. It will incorporate different viewpoints on usability and its measurement in a consistent and uniform way. It can serve as a guideline for tracing and interpreting the data collected on usability of products. This kind of framework will introduce a unified terminology of usability for easier understanding. It may help developers or testers who may not be already familiar with usability measures to create a concrete usability measurement plan for different types of applications. This may help to avoid the problem that occurs when data from multiple usability measures are collected, and developers are not really sure about what the numbers actually mean.
3.2 First part of FOUUX: a consolidated framework-usability part
This chapter includes the first part of thesis study result, that is, the usability part in the consolidated framework: Framework for Usability and User Experience (FOUUX).
FOUUX basically serves as a consolidated framework under which other models for usability measurement can be derived. It is developed based on the existing standards, literature and models described in section 2.1, 2.2 and 2.3.
3.2.1 Target user group and Context of Use As defined in section 2.1, usability is generally a measure of the capability of a
software product that enables a particular set of users to achieve specified goals in a specified context of use. It can vary from one user to another and will differ in the context of use. Thus, before identifying the consolidated usability framework, it is necessary to emphasize the importance of understanding the characteristics of target users (user profiles), the kinds of tasks they will carry out with the system, hardware, software, physical and organizational environments before start measuring usability. Information about the context of use is suggested to be documented as part of the requirement specifications for an application and ISO 9241-11 (1998) standard provides a summary of context of use attributes as follows:
1> User characteristics Relevant data can be psychological attributes including cognitive
style (e.g., attitude towards the job, motivation to use the system, habits and etc.) 2> Task characteristics
Relevant data can be Complexity as perceived by the user task structure; Task flow including input/ start conditions, output/ finish conditions and dependencies; relation to business workflow; physical and mental demands; duration; frequency and etc.
3> Technical environment characteristics

16
Relevant data can be hardware capabilities and constraints; operating system; network connection; supporting software and etc.
4> Physical environment Relevant data can be Noise level, privacy, ambient qualities; potential health hazards, and safety issues.
5> Organizational environment Relevant data can be structure of the operational teams and the individual staff members’ level of autonomy, work and safety policies, organizational culture and feedback to employee on job quality.
6> Social environment Relevant data can be multi- or single- user environment, degree of assistance available and interruptions.
Some additional attributes concerning specific type of test and application also need to be considered.
3.2.2 FOUUX: Usability Attributes ISO 9241-11 (1998) standard takes a broader perspective than ISO/IEC 9126
(2001) standards. However, these two different standards are complementary. As Bevan and Schoeffel (2001) mentioned, an interactive computer system does
not have intrinsic usability, only an ability to be used in a particular context of use. From this point of view, ISO 9241-11 (1998) standard helps in understanding in which context particular attributes specified in ISO/IEC 9126 (2001) standards can be used.
In this thesis study, as the baseline standard, ISO 9241-11 (1998) standard is used to develop the consolidated framework: FOUUX. Then the usability attributes defined in ISO/IEC 9126 (2001) are included to complement. Hense, productivity and safety are added to those identified basically in ISO 9241-11(1998).
As section 2.2 and 2.3 indicated, many researchers consider learnability as part of usability, and it is also classified as sub-attribute of usability in ISO/IEC 9126-1(2001). Therefore, learnability is included into FOUUX.
Some recent emphasis on developing websites which are accessible to special kinds of users such as disabled persons (Olsina et al., 1999), it provides this thesis study a motivation to include accessibility into the framework.
A common thinking among “marketing people” is that for every product that enters the market there must be a path, a target or a need that decides how the product must enter the consumer’s life, which part of the population is more likely to go for it, and which niche it is going to fill. It is important to accommodate different kinds of users with different cultural backgrounds, gender, age and etc. The world’s population grows older. Larger street signs, brighter traffic lights and better nighttime lighting make driving safer for drivers and pedestrians. Similarly, mobile devices can be improved for all users by providing users with control over font sizes, display contrast, and audio levels. Interfaces can be designed with easier-to-use pointing devices, clearer navigation paths, consistent layouts and simpler command languages to improve access for older adults and every user. It provides this thesis study a motivation to include generalizability into the framework.
Understandability is a sub-attribute of usability which is defined in ISO/IEC 9126-1 (2001). It is important for users to be able to understand how to select a software product that is suitable for their intended use and how it can be used for particular tasks. It is included into FOUUX as well.
Some other sub-attributes of usability which are identified in ISO/IEC 9126-1(2001) like operability and attractiveness are not include in the high-level attributes of usability in FOUUX, Based on the understanding of different attributes regarding usability after literature review, it was found that these two attributes can be related to several usability attributes like Satisfaction, accessibility, generalizability and efficiency. Hence, they will be included in the Sub-attributes of Usability in FOUUX.

17
Nine usability attributes included in FOUUX and definitions of each attributes are presented in Table 5.
Table 5: FOUUX: Usability Attributes Description
FOUUX: Usability Attributes Description
Efficiency (ISO9241-11,1998;Nielsen,1993;Constantine&Lockwood,1999;Molich, 2000;Bevan and Macleod,1994; Shneiderman,1992; Sears, 1995; Macleod and Rengger, 1993; Kirakowski and Corbett, 1993; Bevan 1995; Macleod et al. 1997)
“The capability of the software product to provide appropriate performance, relative to the amount of resources used, under stated conditions.” (ISO/IEC 9126- 1, 2001).
Effectiveness
(ISO9241-11,1998; ISO/IEC9126-4,2004; Shackel,1991; Macleod and Rengger, 1993; Kirakowski and Corbett, 1993; Bevan 1995; Macleod et al. 1997; Nunally and Bernstein,1994; McCall,1977)
“The capability of the software product to enable users to achieve specified tasks with accuracy and completeness in a specified context of use.”(ISO/IEC 9126- 4, 2004).
Satisfaction (ISO/IEC9126-4,2004; ISO9241-11,1998; Bevan and Macleod,1994; Shneiderman,1992; Preece et al., 1994; Molich,2000;Constantine & Lockwood,1999; Shackel,1991;Nielsen,1993; Nunally and Bernstein,1994; Bevan 1995; Macleod et al. 1997; Kirakowski and Corbett, 1993)
“Satisfaction measures assess the user’s attitudes towards the use of the product in a specified context of use.” (ISO/IEC 9126- 4, 2004). Productivity (ISO/IEC9126-4,2004; Macleod et al.,1997; Macleod and Rengger, 1993)
“The capability of the software product to enable users to expend appropriate amounts of resources (i.e. time to complete tasks, user efforts, materials or financial cost of usage) in relation to the effectiveness achieved in a specified context of use.” (ISO/IEC 9126- 4, 2004). Macleod et al. (1997) noted that there are generally two types of user task actions, one that is productive and the other is unproductive. The productive user task actions are those that contribute to the task output, Productive Time is defined as the Task Time remaining after Help, Search, and Snag periods have been removed. It is the time a user spends progressing towards the task goals. In contrast with efficiency, productivity concerns the amount of useful output that is obtained from user interaction with the software product. “Shorter system response time usually leads to higher productivity, but in some situation users who receive long system response time can find clever shortcuts or ways to do concurrent processing to reduce the effort and time to accomplish a task. Working too quickly, though, may lead to errors that reduce productivity.”(Shneiderman et al., 2004, p466) Learn-ability (Shneiderman,1992; Preece et al., 1994; Nielsen,1993;Dix et al.,1993;
Constantine & Lockwood,1999; Molich,2000; Shackel,1991; Bevan 1995; Macleod et al. 1997; Kirakowski and Corbett, 1993; Macleod,1994; Lin et al., 1997)
“The capability of the software product to enable the user to learn its application.” (ISO/IEC 9126-1, 2001)
Safety (ISO/IEC9126-4,2004)

18
“Safety metrics assess the level of risk of harm to people, business, software, property or the environment in a specified context of use. It includes the health and safety of the both the user and those affected by use, as well as unintended physical or economic consequences.” (ISO/IEC 9126- 4, 2004). There are two aspects of software product safety stated in the ISO/IEC 9126-4 (2004) standard, operational safety and contingency safety. Operational safety refers to the capability of the software product to meet the user requirements during normal operation without harm to other resources and the environment. Contingency safety concerns the capability of the software product to operate outside its normal operation but still prevent risks. Accessibility (Olsina et al., 1999) The capability of a software product to be used by persons with some type of disability (e.g., visual, hearing).
Generalizability This attribute concerns whether a software product accommodates different kinds of users with different cultural backgrounds, gender, age and etc.
Understandability (ISO/IEC9126-1,2001; Molich,2000)
Whether users can understand how to select a software product that is suitable for their intended use and how it can be used for particular tasks.
3.2.3 FOUUX: Usability Sub-Attributes Based on the literature review of existing usability measurement standards, models
and literatures, each attribute in FOUUX discussed in above section is tried to be further broken down into measurable sub-attributes. And these sub-attributes are collected from standards, literature and models.
In FOUUX, totally twenty-seven sub-attributes (with descriptions) are included (see Table 6).
Table 6: FOUUX: Usability Sub-Attributes Description
FOUUX: Usability Sub-attributes Description Sub-Attributes Description Time behaviour (Bevan and Macleod,1994; ISO/IEC 9126-1,2001)
“The capability of the software product to provide appropriate response and processing times and throughput rates when performing its function, under stated conditions.” (ISO/IEC 9126-1, 2001)
Resource utilization (Bevan and Macleod,1994; ISO/IEC 9126-1,2001)
“Capability to consume appropriate amounts and types of resources when the software performs its function under stated conditions.” (ISO/IEC 9126-1, 2001)
Attractiveness (ISO/IEC9126-1,2001)
Capability of the software product to be attractive to the user (e.g., through use of color or graphic design; ISO/IEC 9126-1, 2001)
Operability (McCall,1977,ISO/IEC9126-1,2001)
“The capability of the software product to enable the user to operate and control it.” (ISO/IEC9126-1,2001)
Likeability (Rubin, 1994; Czerwinski et al., 1999, p. 169))
“User’s perceptions, feelings, and opinions of the product” (Rubin, 1994)
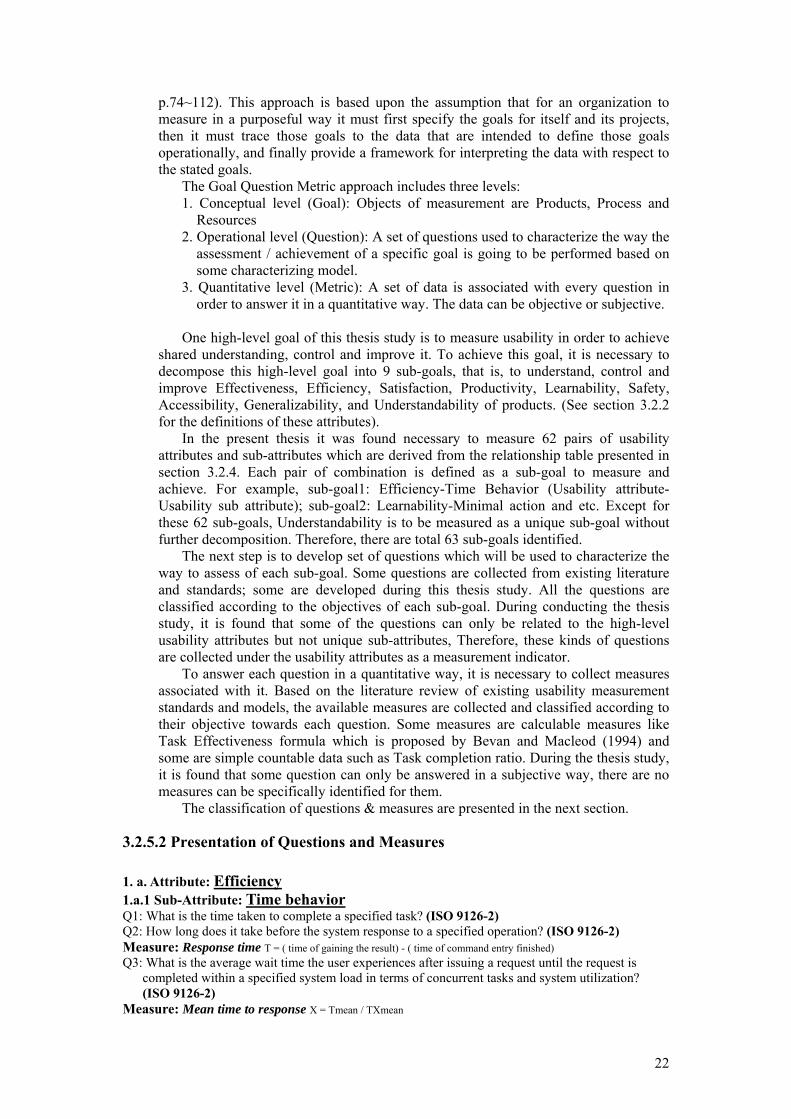
Flexibility (Preece et al., 1990; Dix et al.,1993; Lin et al., 1997)
“Whether the user interface of the software product can be tailored to suit users’ personal preferences. It is important to ensure good Flexibility of an
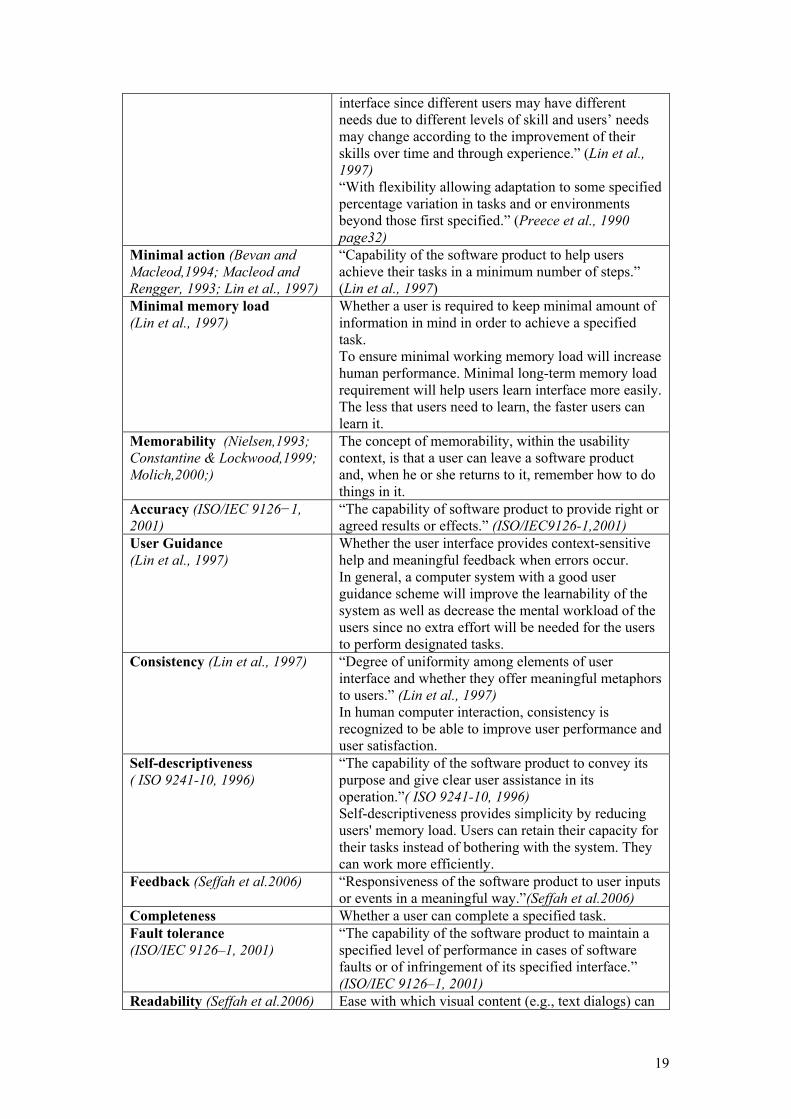
19
interface since different users may have different needs due to different levels of skill and users’ needs may change according to the improvement of their skills over time and through experience.” (Lin et al., 1997) “With flexibility allowing adaptation to some specified percentage variation in tasks and or environments beyond those first specified.” (Preece et al., 1990 page32)
Minimal action (Bevan and Macleod,1994; Macleod and Rengger, 1993; Lin et al., 1997)
“Capability of the software product to help users achieve their tasks in a minimum number of steps.” (Lin et al., 1997)
Minimal memory load (Lin et al., 1997)
Whether a user is required to keep minimal amount of information in mind in order to achieve a specified task. To ensure minimal working memory load will increase human performance. Minimal long-term memory load requirement will help users learn interface more easily. The less that users need to learn, the faster users can learn it.
Memorability (Nielsen,1993; Constantine & Lockwood,1999; Molich,2000;)
The concept of memorability, within the usability context, is that a user can leave a software product and, when he or she returns to it, remember how to do things in it.
Accuracy (ISO/IEC 9126−1, 2001)
“The capability of software product to provide right or agreed results or effects.” (ISO/IEC9126-1,2001)
User Guidance (Lin et al., 1997)
Whether the user interface provides context-sensitive help and meaningful feedback when errors occur. In general, a computer system with a good user guidance scheme will improve the learnability of the system as well as decrease the mental workload of the users since no extra effort will be needed for the users to perform designated tasks.
Consistency (Lin et al., 1997) “Degree of uniformity among elements of user interface and whether they offer meaningful metaphors to users.” (Lin et al., 1997) In human computer interaction, consistency is recognized to be able to improve user performance and user satisfaction.
Self-descriptiveness ( ISO 9241-10, 1996)
“The capability of the software product to convey its purpose and give clear user assistance in its operation.”( ISO 9241-10, 1996) Self-descriptiveness provides simplicity by reducing users' memory load. Users can retain their capacity for their tasks instead of bothering with the system. They can work more efficiently.
Feedback (Seffah et al.2006) “Responsiveness of the software product to user inputs or events in a meaningful way.”(Seffah et al.2006)
Completeness Whether a user can complete a specified task. Fault tolerance (ISO/IEC 9126–1, 2001)
“The capability of the software product to maintain a specified level of performance in cases of software faults or of infringement of its specified interface.” (ISO/IEC 9126–1, 2001)
Readability (Seffah et al.2006) Ease with which visual content (e.g., text dialogs) can

20
be understood. Controllability ( ISO 9241-10, 1996; Bevan 1995; Macleod et al. 1997; Kirakowski and Corbett, 1993; )
Whether users feel that they are in control of the software product.
Navigability (Seffah et al.2006) Whether users can move around in the application in an efficient way.
Simplicity (ISO/IEC 12207, 1995)
“Whether extraneous elements are eliminated from the user interface without significant information loss.” (ISO/IEC 12207, 1995)
Privacy (Seffah et al.2006) Whether users’ personal information is appropriately protected
Security (ISO/IEC 9126–1, 2001)
“The capability of the software product to protect information and data so that unauthorized persons or systems cannot read or modify them and authorized persons or systems are not denied access.” (ISO/IEC 9126–1, 2001)
Quality of outcome (Hornbæk,2006)
Measures of the quality of the outcome of the interaction
Experts’ assessment (Hornbæk,2006)
Experts’ assessment of outcomes of the interaction
Users’ assessment (Hornbæk,2006)
Users’ assessment of the outcome of interaction
Preference ( Gutwin,2002; Rui et al.,2001; Wang et al.,2001)
“Measures satisfaction as the interface users prefers using.”(Hornbæk,2006)
Users’ attitudes and perceptions (Hornbæk,2006)
“Users’ attitudes towards and perceptions of phenomena other than the interface”(Hornbæk,2006)
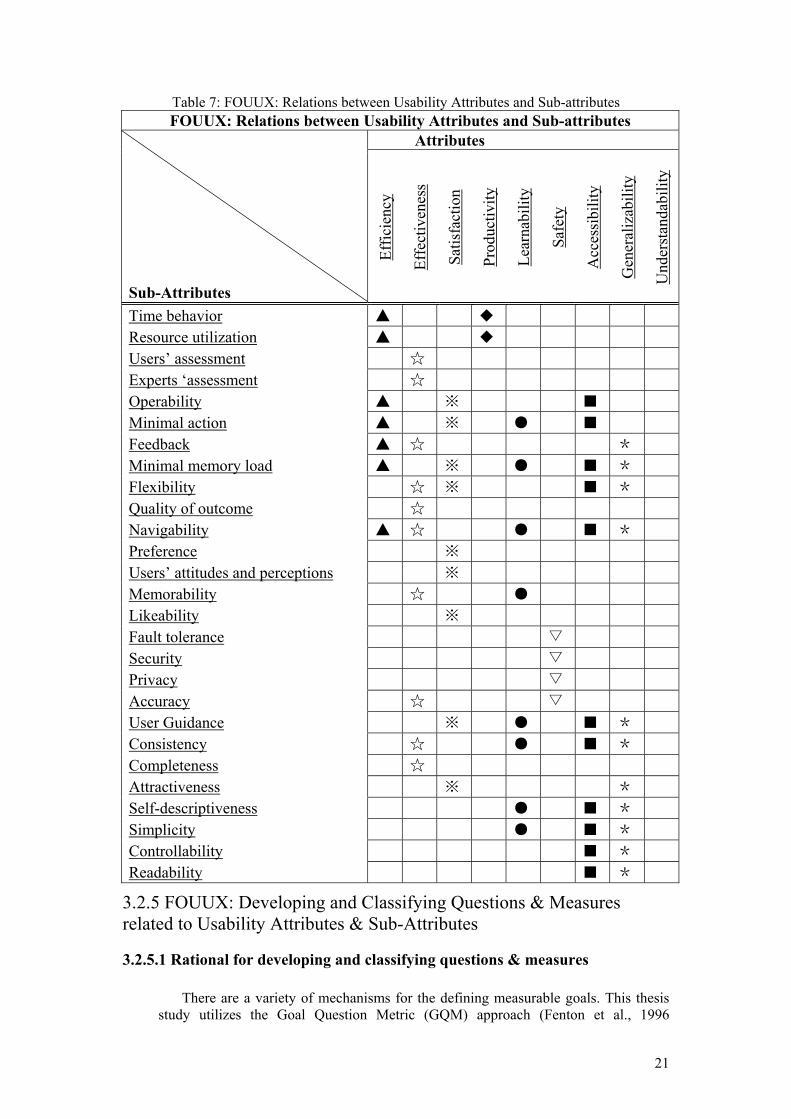
3.2.4 FOUUX: Overview of relationship between Usability Attributes & Sub-Attributes
Table 7 gives the relations between the 9 usability attributes and the 27 Sub-attributes in FOUUX. For example, 7 sub-attributes; Time behavior, Resource utilization, Operability, Minimal action, Feedback, Minimal memory load and Navigability, are assumed to be related to Efficiency attribute. Thus, in Table 7, it is assumed that efficiency can be measured with measures associated with these sub-attributes listed for this usability attribute.
From the perspective of sub-attributes, for example, it is also possible that Attractiveness is related to two different usability attributes; Satisfaction and Generalizability.
Understandability can be measured directly without further breaking down into sub-attributes, thus, there is no sub-attributes related to it in Table 7.
To test these relations, a test on an industrial share case will be conducted in the scope of this thesis study (See Chapter 8).
21
Table 7: FOUUX: Relations between Usability Attributes and Sub-attributes FOUUX: Relations between Usability Attributes and Sub-attributes
Attributes
Sub-Attributes
Effic
ienc
y
Effe
ctiv
enes
s
Satis
fact
ion
Prod
uctiv
ity
Lear
nabi
lity
Safe
ty
Acc
essi
bilit
y
Gen
eral
izab
ility
Und
erst
anda
bilit
y
Time behavior ▲ ◆
Resource utilization ▲ ◆
Users’ assessment ☆
Experts ‘assessment ☆
Operability ▲ ※ ■
Minimal action ▲ ※ ● ■
Feedback ▲ ☆ *
Minimal memory load ▲ ※ ● ■ *
Flexibility ☆ ※ ■ *
Quality of outcome ☆
Navigability ▲ ☆ ● ■ *
Preference ※
Users’ attitudes and perceptions ※
Memorability ☆ ●
Likeability ※
Fault tolerance ▽
Security ▽
Privacy ▽
Accuracy ☆ ▽
User Guidance ※ ● ■ *
Consistency ☆ ● ■ *
Completeness ☆
Attractiveness ※ *
Self-descriptiveness ● ■ *
Simplicity ● ■ *
Controllability ■ *
Readability ■ *
3.2.5 FOUUX: Developing and Classifying Questions & Measures related to Usability Attributes & Sub-Attributes
3.2.5.1 Rational for developing and classifying questions & measures There are a variety of mechanisms for the defining measurable goals. This thesis
study utilizes the Goal Question Metric (GQM) approach (Fenton et al., 1996
22
p.74~112). This approach is based upon the assumption that for an organization to measure in a purposeful way it must first specify the goals for itself and its projects, then it must trace those goals to the data that are intended to define those goals operationally, and finally provide a framework for interpreting the data with respect to the stated goals.
The Goal Question Metric approach includes three levels: 1. Conceptual level (Goal): Objects of measurement are Products, Process and
Resources 2. Operational level (Question): A set of questions used to characterize the way the
assessment / achievement of a specific goal is going to be performed based on some characterizing model.
3. Quantitative level (Metric): A set of data is associated with every question in order to answer it in a quantitative way. The data can be objective or subjective.
One high-level goal of this thesis study is to measure usability in order to achieve
shared understanding, control and improve it. To achieve this goal, it is necessary to decompose this high-level goal into 9 sub-goals, that is, to understand, control and improve Effectiveness, Efficiency, Satisfaction, Productivity, Learnability, Safety, Accessibility, Generalizability, and Understandability of products. (See section 3.2.2 for the definitions of these attributes).
In the present thesis it was found necessary to measure 62 pairs of usability attributes and sub-attributes which are derived from the relationship table presented in section 3.2.4. Each pair of combination is defined as a sub-goal to measure and achieve. For example, sub-goal1: Efficiency-Time Behavior (Usability attribute-Usability sub attribute); sub-goal2: Learnability-Minimal action and etc. Except for these 62 sub-goals, Understandability is to be measured as a unique sub-goal without further decomposition. Therefore, there are total 63 sub-goals identified.
The next step is to develop set of questions which will be used to characterize the way to assess of each sub-goal. Some questions are collected from existing literature and standards; some are developed during this thesis study. All the questions are classified according to the objectives of each sub-goal. During conducting the thesis study, it is found that some of the questions can only be related to the high-level usability attributes but not unique sub-attributes, Therefore, these kinds of questions are collected under the usability attributes as a measurement indicator.
To answer each question in a quantitative way, it is necessary to collect measures associated with it. Based on the literature review of existing usability measurement standards and models, the available measures are collected and classified according to their objective towards each question. Some measures are calculable measures like Task Effectiveness formula which is proposed by Bevan and Macleod (1994) and some are simple countable data such as Task completion ratio. During the thesis study, it is found that some question can only be answered in a subjective way, there are no measures can be specifically identified for them.
The classification of questions & measures are presented in the next section.
3.2.5.2 Presentation of Questions and Measures 1. a. Attribute: Efficiency 1.a.1 Sub-Attribute: Time behavior Q1: What is the time taken to complete a specified task? (ISO 9126-2) Q2: How long does it take before the system response to a specified operation? (ISO 9126-2) Measure: Response time T = ( time of gaining the result) - ( time of command entry finished) Q3: What is the average wait time the user experiences after issuing a request until the request is
completed within a specified system load in terms of concurrent tasks and system utilization? (ISO 9126-2)
Measure: Mean time to response X = Tmean / TXmean

23
Tmean = ∑(Ti) / N, (for i=1 to N) TXmean = required mean response time Ti= response time for i-th evaluation (shot) N= number of evaluations (sampled shots)
Q4: What is the absolute limit on time required in fulfilling a function? (ISO 9126-2) Q5: In the worst case, can user still get response within the specified time limit? (ISO 9126-2) Q6: In the worst case, can user still get reply from the software within a time short enough to be tolerable for user? (ISO 9126-2) Measure: Worst case response time ratio X= Tmax / Rmax
Tmax= MAX(Ti) (for i=1 to N) Rmax = required maximum response time MAX(Ti)= maximum response time among evaluations N= number of evaluations (sampled shots) Ti= response time for i-th evaluation (shot)
Q7: How many tasks can be successfully performed over a given period of time? (ISO 9126-2) Measure: Throughput time X = A / T
A = number of completed tasks T = observation time period Q8: What is the average number of concurrent tasks the system can handle over a set unit of time? (ISO 9126-2) Measure: Mean amount of throughput X = Xmean / Rmean
Xmean = ∑(Xi)/N Rmean = required mean throughput Xi = Ai / Ti Ai = number of concurrent tasks observed over set period of time for i-th evaluation Ti = set period of time for i-th evaluation N = number of evaluations
Q9: What is the absolute limit on the system in terms of the number and handling of concurrent tasks as throughput? (ISO 9126-2) Measure: Worst case throughput ratio X = Xmax / Rmax
Xmax = MAX(Xi) (for i = 1 to N) Rmax = required maximum throughput. MAX(Xi) = maximum number of job tasks among evaluations Xi = Ai / Ti Ai = number of concurrent tasks observed over set period of time for i-th evaluation Ti = set period of time for i-th evaluation N= number of evaluations
Q10: What is the wait time the user experiences after issuing an instruction to start a group of related tasks and their completion? (ISO 9126-2)
Measure: Turnaround time T = Time between user’s finishing getting output results and user’s finishing request Q11: What is the average wait time the user experiences after issuing an instruction to start a group of
related tasks and their completion within a specified system load in terms of concurrent tasks and system utilization? (ISO 9126-2)
Measure: Mean time for turnaround X = Tmean/TXmean Tmean = ∑(Ti)/N, (for i=1 to N) TXmean = required mean turnaround time Ti = turnaround time for i-th evaluation (shot) N = number of evaluations (sampled shots)
Q12: What is the absolute limit on time required in fulfilling a job task? (ISO 9126-2) Q13: In the worst case, how long does it take for software system to perform specified tasks? (ISO 9126-2) Measure: Worst case turnaround time ratio X= Tmax / Rmax
Tmax= MAX(Ti) (for i=1 to N) Rmax = required maximum turnaround time MAX(Ti)= maximum turnaround time among evaluations N= number of evaluations (sampled shots) Ti= turnaround time for i-th evaluation (shot)
Q14: What proportion of the time do users spend waiting for the system to respond? Measure: Waiting time X = Ta / Tb
Ta = total time spent waiting Tb = task time
Q15: What is the duration the users use particular functions of interfaces? Measure: Duration time T = Time between user’s finishing getting output results and user’s finishing request to use particular functions of interface. Q16: What is the mean duration the users take pauses between actions? Measure: Mean duration of pause X = Tmeanpause / TXmeanpause
Tmeanpause = ∑(Ti) / N, (for i=1 to N) TXmeanpause = required mean pause time
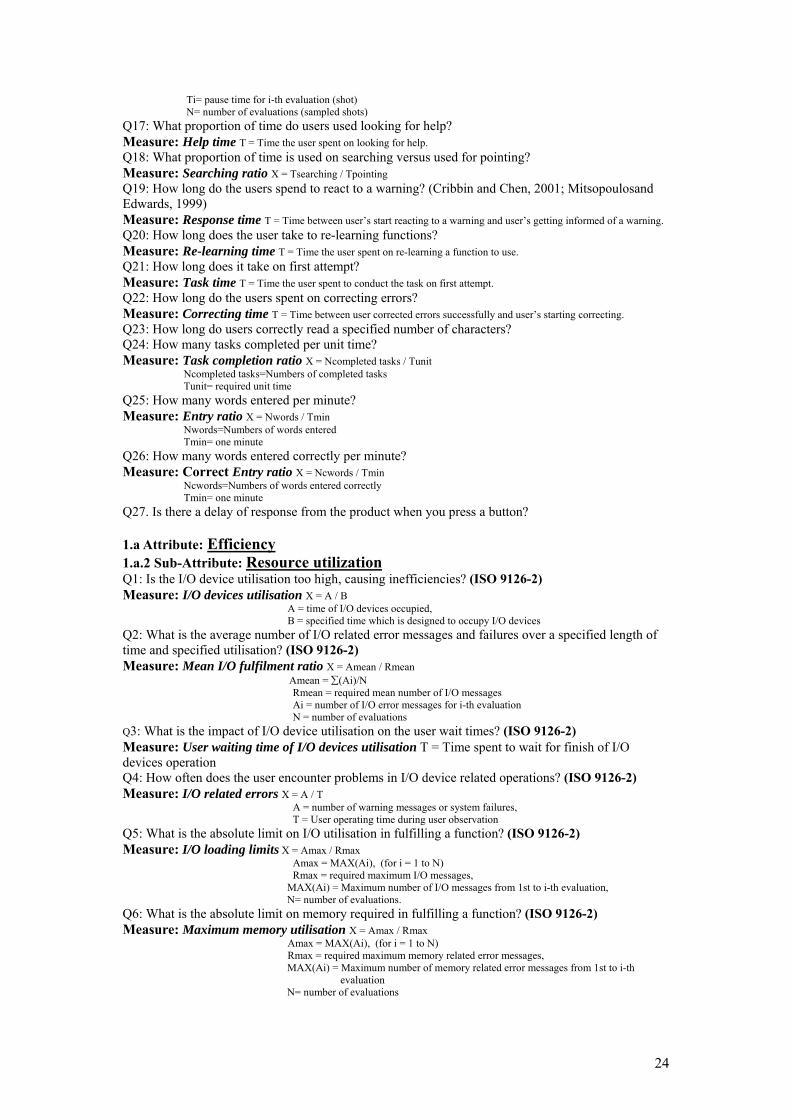
24
Ti= pause time for i-th evaluation (shot) N= number of evaluations (sampled shots)
Q17: What proportion of time do users used looking for help? Measure: Help time T = Time the user spent on looking for help. Q18: What proportion of time is used on searching versus used for pointing? Measure: Searching ratio X = Tsearching / Tpointing Q19: How long do the users spend to react to a warning? (Cribbin and Chen, 2001; Mitsopoulosand Edwards, 1999) Measure: Response time T = Time between user’s start reacting to a warning and user’s getting informed of a warning. Q20: How long does the user take to re-learning functions? Measure: Re-learning time T = Time the user spent on re-learning a function to use. Q21: How long does it take on first attempt? Measure: Task time T = Time the user spent to conduct the task on first attempt. Q22: How long do the users spent on correcting errors? Measure: Correcting time T = Time between user corrected errors successfully and user’s starting correcting. Q23: How long do users correctly read a specified number of characters? Q24: How many tasks completed per unit time? Measure: Task completion ratio X = Ncompleted tasks / Tunit Ncompleted tasks=Numbers of completed tasks Tunit= required unit time Q25: How many words entered per minute? Measure: Entry ratio X = Nwords / Tmin Nwords=Numbers of words entered Tmin= one minute Q26: How many words entered correctly per minute? Measure: Correct Entry ratio X = Ncwords / Tmin Ncwords=Numbers of words entered correctly Tmin= one minute Q27. Is there a delay of response from the product when you press a button? 1.a Attribute: Efficiency 1.a.2 Sub-Attribute: Resource utilization Q1: Is the I/O device utilisation too high, causing inefficiencies? (ISO 9126-2) Measure: I/O devices utilisation X = A / B
A = time of I/O devices occupied, B = specified time which is designed to occupy I/O devices
Q2: What is the average number of I/O related error messages and failures over a specified length of time and specified utilisation? (ISO 9126-2) Measure: Mean I/O fulfilment ratio X = Amean / Rmean
Amean = ∑(Ai)/N Rmean = required mean number of I/O messages Ai = number of I/O error messages for i-th evaluation N = number of evaluations
Q3: What is the impact of I/O device utilisation on the user wait times? (ISO 9126-2) Measure: User waiting time of I/O devices utilisation T = Time spent to wait for finish of I/O devices operation Q4: How often does the user encounter problems in I/O device related operations? (ISO 9126-2) Measure: I/O related errors X = A / T
A = number of warning messages or system failures, T = User operating time during user observation
Q5: What is the absolute limit on I/O utilisation in fulfilling a function? (ISO 9126-2) Measure: I/O loading limits X = Amax / Rmax
Amax = MAX(Ai), (for i = 1 to N) Rmax = required maximum I/O messages,
MAX(Ai) = Maximum number of I/O messages from 1st to i-th evaluation, N= number of evaluations.
Q6: What is the absolute limit on memory required in fulfilling a function? (ISO 9126-2) Measure: Maximum memory utilisation X = Amax / Rmax
Amax = MAX(Ai), (for i = 1 to N) Rmax = required maximum memory related error messages, MAX(Ai) = Maximum number of memory related error messages from 1st to i-th
evaluation N= number of evaluations

25
Q7: How many memory errors were experienced over a set period of time and specified resource utilisation? (ISO 9126-2) Measure: Ratio of memory error/time X = A / T
A = number of warning messages or system failures, T = User operating time during user observation
Q8: What is the average number of memory related error messages and failures over a specified length of time and a specified load on the system? (ISO 9126-2) Measure: Mean occurrence of memory error X = Amean / Rmean
Amean = ∑(Ai)/N Rmean = required mean number of memory related error messages, Ai = number of memory related error messages for i-th evaluation, N = number of evaluations
Q9: Is software system capable of performing tasks within expected transmission capacity? (ISO 9126-2) Measure: Transmission capacity utilisation X = A / B
A = transmission capacity, B = specified transmission capacity which is designed to be used by the software during
execution Q10: How many transmission-related error messages were experienced over a set period of time and specified resource utilisation? (ISO 9126-2) Measure: Mean of transmission error / time X = A / T
A = number of warning messages or system failures, T = User operating time during user observation
Q11: What is the average number of transmission related error messages and failures over a specified length of time and specified utilisation? (ISO 9126-2) Measure: Mean occurrence of transmission error X = Amean / Rmean
Amean = ∑(Ai)/N Rmean = required mean number of transmission related error messages and failures, Ai = Number of transmission related error messages and failures for i-th evaluation, N = number of evaluations
Q12: What is the absolute limit of transmissions required to fulfil a function? (ISO 9126-2) Measure: Maximum transmission utilisation X = Amax / Rmax
Amax = MAX(Ai), (for i = 1 to N) Rmax = required maximum number of transmission related error messages and failures, MAX(Ai) = Maximum number of transmission related error messages and failures from 1st to i-th evaluation, N= number of evaluations
1.a Attribute: Efficiency 1.a.3 Sub-Attribute: Minimal action Q1: Will the required data be entered only once? (Lin et al., 1997) Q2: Does it provide combined entry of related data? (Lin et al., 1997) Q3: Does it provide function keys for frequent control entries? (Lin et al., 1997) Q4: Does it require minimal cursor positioning? (Lin et al., 1997) Q5: Does it require minimal user control actions? (Lin et al., 1997) 1.a Attribute: Efficiency 1.a.4 Sub-Attribute: Minimal memory load Q1: Does it indicate current position in menu structure? (Lin et al., 1997) Q2: Are data items kept short? (Lin et al., 1997) Q3: Are long data items partitioned? (Lin et al., 1997) 1.a Attribute: Efficiency 1.a.5 Sub-Attribute: Operability Q1: Is there any message which caused the user a delay in understanding before starting the next action? Measure: Message understandability in use (ISO/IEC9126-3,2001) X = A / UOT
A = number of times that the user pauses for a long period or successively and repeatedly fails at the same operation, because of the lack of message comprehension.
UOT = user operating time (observation period) Q2 : Can user operate the software long enough without human error? Measure: Time Between Human Error Operations in use (ISO/IEC9126-3,2001)
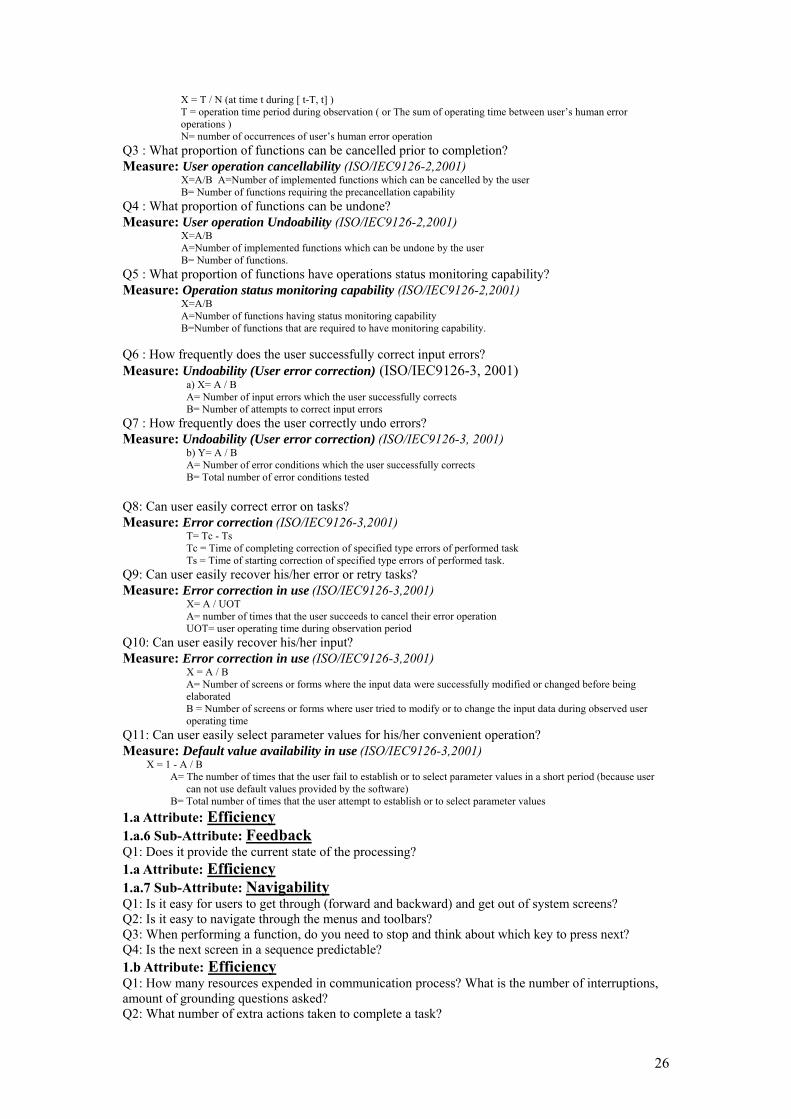
26
X = T / N (at time t during [ t-T, t] ) T = operation time period during observation ( or The sum of operating time between user’s human error operations ) N= number of occurrences of user’s human error operation
Q3 : What proportion of functions can be cancelled prior to completion? Measure: User operation cancellability (ISO/IEC9126-2,2001)
X=A/B A=Number of implemented functions which can be cancelled by the user B= Number of functions requiring the precancellation capability
Q4 : What proportion of functions can be undone? Measure: User operation Undoability (ISO/IEC9126-2,2001)
X=A/B A=Number of implemented functions which can be undone by the user B= Number of functions.
Q5 : What proportion of functions have operations status monitoring capability? Measure: Operation status monitoring capability (ISO/IEC9126-2,2001)
X=A/B A=Number of functions having status monitoring capability B=Number of functions that are required to have monitoring capability.
Q6 : How frequently does the user successfully correct input errors? Measure: Undoability (User error correction) (ISO/IEC9126-3, 2001)
a) X= A / B A= Number of input errors which the user successfully corrects B= Number of attempts to correct input errors
Q7 : How frequently does the user correctly undo errors? Measure: Undoability (User error correction) (ISO/IEC9126-3, 2001)
b) Y= A / B A= Number of error conditions which the user successfully corrects B= Total number of error conditions tested
Q8: Can user easily correct error on tasks? Measure: Error correction (ISO/IEC9126-3,2001)
T= Tc - Ts Tc = Time of completing correction of specified type errors of performed task Ts = Time of starting correction of specified type errors of performed task.
Q9: Can user easily recover his/her error or retry tasks? Measure: Error correction in use (ISO/IEC9126-3,2001)
X= A / UOT A= number of times that the user succeeds to cancel their error operation UOT= user operating time during observation period
Q10: Can user easily recover his/her input? Measure: Error correction in use (ISO/IEC9126-3,2001)
X = A / B A= Number of screens or forms where the input data were successfully modified or changed before being elaborated B = Number of screens or forms where user tried to modify or to change the input data during observed user operating time
Q11: Can user easily select parameter values for his/her convenient operation? Measure: Default value availability in use (ISO/IEC9126-3,2001) X = 1 - A / B
A= The number of times that the user fail to establish or to select parameter values in a short period (because user can not use default values provided by the software)
B= Total number of times that the user attempt to establish or to select parameter values 1.a Attribute: Efficiency 1.a.6 Sub-Attribute: Feedback Q1: Does it provide the current state of the processing?
1.a Attribute: Efficiency 1.a.7 Sub-Attribute: Navigability Q1: Is it easy for users to get through (forward and backward) and get out of system screens? Q2: Is it easy to navigate through the menus and toolbars? Q3: When performing a function, do you need to stop and think about which key to press next? Q4: Is the next screen in a sequence predictable? 1.b Attribute: Efficiency Q1: How many resources expended in communication process? What is the number of interruptions, amount of grounding questions asked? Q2: What number of extra actions taken to complete a task?

27
Measure: Deviation from optimal solution The ratio between actual behavior and an optimal method of solution (Tan et al., 2001) Q3: What is the number of buttons looked at? Measure: Information accessed The amount of information that users access or employ (Westerman and Cribbin, 2000) Q4. What about the frequency of function use or actions? What is the number of keystrokes? What is the number of functions used? What is the number of interface actions? Measure: Usage patterns
Measures of how users make use of the interface to solve tasks(Marshall et al. 2001; Drucker et al., 2002) Use frequency The frequency of function use or actions. (MacKenzie et al., 2001)
Q5: What is the number of persistent errors? Q6: What is the user’s input rate by using mouse or keyboard? Q7: How about the Relative efficiency on first attempt? Q8: What is the monetary cost of performing the task? Q9: What about the users’ mental effort when using the interface? Measure: NASA’s Task Load Index questionnaire (Hart and Staveland 1988) Task difficulty rated by experts. Ratings of mental effort by users. Physiological measures of effort, such as heart rate variability. Q10: What about the user efficiency? Measure: User Efficiency=Task Effectiveness/ Task Time (MUSiC) Task Effectiveness - how completely and accurately a user achieves the goals of each task
(overall Effectiveness across tasks is also calculated) Q11: What about the Human efficiency? Measure: Human Efficiency= Task Effectiveness /Effort (MUSiC) From a user's viewpoint, the amount of effort input may be quantified in terms the time spent carrying out the task, or the mental/physical effort required to complete the task. These two types of input produce two different definitions of efficiency which can be stated as User efficiency and Human efficiency. Q12: What about the Corporate Efficiency? Measure: Corporate Efficiency=Effectiveness/Total Cost (MUSiC)
The cost includes labor cost of user’s time; cost of the resources and the equipment used and cost of any training required by the user.
Q13: What is the number of calls to support? Q14: What is the number of accesses to help? 2. Attribute: Productivity 2.1Sub-Attribute: Time behavior Q1: How long does it take to complete a task? (ISO 9126-4) Measure: Task time X = Ta
Ta = task time Q2: How efficient are the users? (ISO 9126-4) Measure: Task efficiency X = M1 / T
M1 = task effectiveness T = task time
NOTE 1 Task efficiency measures the proportion of the goal achieved for every unit of time. Efficiency increases with increasing effectiveness and reducing task time. It enables comparisons to be made, for example between fast error-prone interfaces and slow easy interfaces. NOTE 2 If Task completion has been measured, task efficiency can be measured as Task completion/task time. This measures the proportion of users who were successful for every unit of time. A high value indicates a high proportion of successful users in a small amount of time. Q3: What proportion of the time is the user performing productive action? (ISO 9126-4) Measure: Productive proportion X = Ta / Tb
Ta = productive time = task time - help time - error time – search time, Tb = task time
This metric requires detailed analysis of a videotape of the interaction (Macleod et al. (1997), The MUSiC Performance Measurement method) Q4: How efficient is a user compared to an expert? (ISO 9126-4) Measure: Relative user efficiency X = A / B
A = ordinary user’s task efficiency, B = expert user’s task efficiency

28
2. Attribute: Productivity 2.2 Sub-Attribute: Resource utilization Q1: How cost-effective is the user? (ISO 9126-4) Measure: Economic productivity X = M1 / C
M1 = task effectiveness, C = total cost of the task
Costs could for example include the user’s time, the time of others giving assistance, and the cost of computing resources, telephone calls, and materials 3. Attribute: Effectiveness Q1: What is the percentage of goals achieved? Measure: Task Effectiveness (TES) (MUSiC, ISO9126-4)
• TES=(Quantity * Quality) / 100%
(A value for the Task Effectiveness (TES - effectiveness for a specific task) achieved by a user is obtained by measuring the Quantity and Quality components independently)
• M1 = |1-ΣAi|
Ai= proportional value of each missing or incorrect component in the task output Q2: What is the number of correct tasks? (e.g., correctly selected icons); Measure: Correct task ratio X = Nc/Nt
Nc = number of correctly completed tasks Nt = number of conducted tasks
Q3: What is the number of tasks that users do not complete in the allotted time? Measure: Failed task frequency X = Nf/ Tallotted
Nf = number of tasks that users do not complete Tallotted= allotted time to complete the tasks
Q4: What is the number of tasks where users give up? Measure: Given up task ratio X = Ng/Nt
Ng = number of tasks that users give up Nt = number of conducted tasks
Q5: What is the number of incomplete tasks? Measure: Incomplete task ratio X = Nincomplete/Nt
Nincomplete = number of incomplete tasks Nt = number of conducted tasks
Q6: What is the percentage of tasks completed successfully on first attempt? Measure: Completed task ratio X = Ncf/Nt
Ncf = number of completed tasks on first attempt Nt = number of conducted tasks
Q7: What is the number of functions learned? Q8: What is the percentage of users who manage to learn to criterion? Measure: successful users percentage X = Nsl/Nt*100%
Nsl = number of users who manage to learn to criterion Nt = the total number of users
3.1 Sub-Attribute: Flexibility Q1: Does it have by-passing menu selection with command entry? Q2: Does it have direct manipulation capability? Q3: Is the design for data entry flexible? Q4: Can the display be controlled by user flexibly? Q5: Does it provide flexibly sequence control? Q6: Are the menu options dependent on context?
3. Attribute: Effectiveness 3.2 Sub-Attribute: Consistency (Lin et al., 1997) Q1: Is the coding consistent across displays, menu options? Q2: Is the cursor placement consistent? Q3: Is the format within data fields consistent? Q4: Is the display orientation consistent? panning vs. scrolling. Q5: Is the data display consistent with entry requirements? Q6: Is the option wording consistent with command language? Q7: Is the layout consistent from screen to screen?

29
Q8: Are users required to make large, sweeping movements from one area of the screen to another, distant quadrant to complete a task?
Q9: Does it require the smallest amount of movement for the user to access the area of screen in which the user most often make selections?
Q10: Do messages or instructions always appear in a consistent place on the screen in a consistent format for easy recognition?
Q11: Do you think there is too much inconsistency in this system? 3. Attribute: Effectiveness 3.3 Sub-Attribute: Accuracy Q1: How completely have the accuracy requirements been implemented? Measure: Computational accuracy (ISO 9126-3)
X=A/B A= Number of functions in which specific accuracy requirements had been implemented, as confirmed in evaluation. B= Number of functions for which specific accuracy requirements need to be implemented.
Q2: Are differences between the actual and reasonable expected results acceptable? Measure: Accuracy to expectation (ISO 9126-2)
X=A / T A= Number of cases encountered by the users with a difference against to reasonable expected results beyond allowable T= Operation time
Q3: How often do the end users encounter results with inadequate precision? Measure: Precision (Nyberg et al., 2001) X=A / T
A= Number of results encountered by the users with level of precision different from required T= Operation time
Q4: How complete was the implementation of specific levels of precision for the data items? Measure: Precision (Nyberg et al., 2001) X=A/B
A= Number of data items implemented with specific levels of precision, confirmed in evaluation B= Number of data items that require specific levels of precision
Q5: How frequent does user make errors when conducting numbers of tasks? Measure: Error Rate (Nyberg et al., 2001)
X = A/T A = number of errors made by the user T= time or number of tasks
Q6: What is the number of errors on the way to task completion? Q7: What is the number of correctly done subtasks? Q8: What is the number of attempts to achieve to correct tasks? Q9: What is the number of hints needed to complete a task? Q10: What percentage of words read correctly at normal viewing distance? Q11: What is the number of user errors can be tolerated? Q12: What proportions of input items provide check for valid data? Measure: Input validity checking (ISO/IEC9126-2,2001)
X=A/B A=Number of input items which check for valid data B=Number of input items which could check for valid data
3. Attribute: Effectiveness 3.4 Sub-Attribute: Completeness Q1: What proportion of the tasks is completed? Measure: Task completion (Westerman et al., 2001; Dumais et al., 2001, ISO 9126-4) X = A/B
A = number of tasks completed B = total number of tasks attempted
3. Attribute: Effectiveness 3.5 Sub-Attribute: Navigability
Q1: Is next screen in a sequence predictable? 3. Attribute: Effectiveness 3.6 Sub-Attribute: Feedback Q1: Does is provide how correct user entries are?
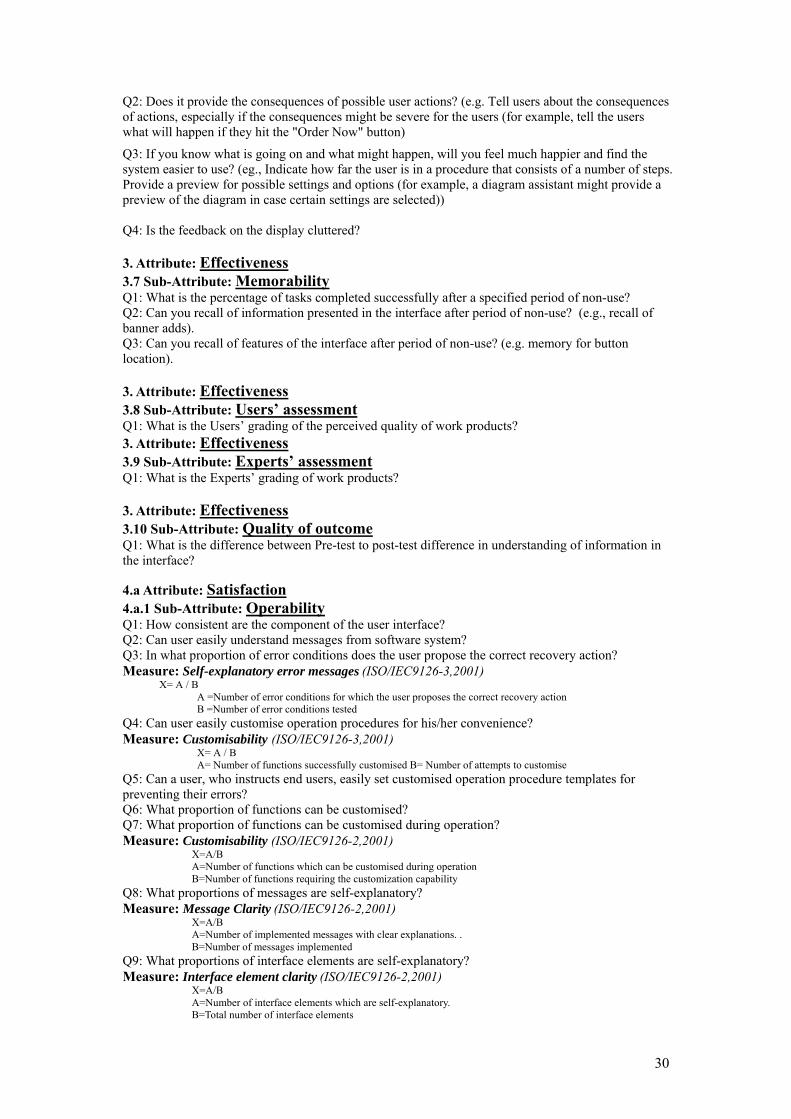
30
Q2: Does it provide the consequences of possible user actions? (e.g. Tell users about the consequences of actions, especially if the consequences might be severe for the users (for example, tell the users what will happen if they hit the "Order Now" button)
Q3: If you know what is going on and what might happen, will you feel much happier and find the system easier to use? (eg., Indicate how far the user is in a procedure that consists of a number of steps. Provide a preview for possible settings and options (for example, a diagram assistant might provide a preview of the diagram in case certain settings are selected)) Q4: Is the feedback on the display cluttered? 3. Attribute: Effectiveness 3.7 Sub-Attribute: Memorability Q1: What is the percentage of tasks completed successfully after a specified period of non-use? Q2: Can you recall of information presented in the interface after period of non-use? (e.g., recall of banner adds). Q3: Can you recall of features of the interface after period of non-use? (e.g. memory for button location). 3. Attribute: Effectiveness 3.8 Sub-Attribute: Users’ assessment Q1: What is the Users’ grading of the perceived quality of work products? 3. Attribute: Effectiveness 3.9 Sub-Attribute: Experts’ assessment Q1: What is the Experts’ grading of work products? 3. Attribute: Effectiveness 3.10 Sub-Attribute: Quality of outcome Q1: What is the difference between Pre-test to post-test difference in understanding of information in the interface? 4.a Attribute: Satisfaction 4.a.1 Sub-Attribute: Operability Q1: How consistent are the component of the user interface? Q2: Can user easily understand messages from software system? Q3: In what proportion of error conditions does the user propose the correct recovery action? Measure: Self-explanatory error messages (ISO/IEC9126-3,2001) X= A / B
A =Number of error conditions for which the user proposes the correct recovery action B =Number of error conditions tested
Q4: Can user easily customise operation procedures for his/her convenience? Measure: Customisability (ISO/IEC9126-3,2001)
X= A / B A= Number of functions successfully customised B= Number of attempts to customise
Q5: Can a user, who instructs end users, easily set customised operation procedure templates for preventing their errors? Q6: What proportion of functions can be customised? Q7: What proportion of functions can be customised during operation? Measure: Customisability (ISO/IEC9126-2,2001)
X=A/B A=Number of functions which can be customised during operation B=Number of functions requiring the customization capability
Q8: What proportions of messages are self-explanatory? Measure: Message Clarity (ISO/IEC9126-2,2001)
X=A/B A=Number of implemented messages with clear explanations. . B=Number of messages implemented
Q9: What proportions of interface elements are self-explanatory? Measure: Interface element clarity (ISO/IEC9126-2,2001)
X=A/B A=Number of interface elements which are self-explanatory. B=Total number of interface elements

31
4.a Attribute: Satisfaction 4.a.2 Sub-Attribute: Attractiveness Q1: How attractive is the interface to the user? Q2: Please rate the interface between love and hate. Q3: Does this software have appealing graphics? (Czerwinski, 2001) Q4: Does this software use appealing audio? (Czerwinski, 2001) 4.a Attribute: Satisfaction 4.a.3 Sub-Attribute: Likeability Q1: Do you like this interface? Q2: Do you like the software product you used today? (e.g. rated on a scale from 1 (disagree) to a 5 (agree)) Q3: How likely would you be to choose this BRAND of product/service again, based on your experiences of it? Q4: Do you like to recommend this product to your friends based on your experiences of it? Q5: Is it easy to write a text on this handset using this product/service? Have you ever had a problem with it? Q6: Is it comfortable to hold and operate the handset using just one hand? Q7: Do you like the visual appearance of the graphics, icons and colors on this product interface? 4. a Attribute: Satisfaction 4.a.4 Sub-Attribute: Minimal action Q1: Is it easy to fill out data entry form? Q2: Is the shifting among windows easy? (Lin et al., 1997) Q3: Are you confident that you will never need to press a key more than once in order for it to register or work using this product/service? 4. a Attribute: Satisfaction 4.a.5 Sub-Attribute: Minimal memory load Q3: Is the guidance information always available? (Lin et al., 1997) 4. a Attribute: Satisfaction 4.a.6 Sub-Attribute: User Guidance Q1: How helpful is the error message? Note: Error messages should be specific to the point, explain what is wrong, and how it can be
corrected. System should be able to give more detailed error message upon users’ request. Q2: Does it provide RESTART option? (Lin et al., 1997) Q3: Does it provide UNDO to reverse control actions? (Lin et al., 1997) Q4: Does it provide CANCEL option? (Lin et al. ,1997) Q5: Does it provide explicit entry of corrections? (Lin et al., 1997) Q6: Does it provide feedback for control entries? (Lin et al., 1997) Q7: Is completion of processing indicated? (Lin et al., 1997) Q8: Are repeated errors indicated? (Lin et al., 1997) Q9: If you make a mistake or go into the wrong place whilst using this product menu, is it always easy to get back to where I want to be? 4.a Attribute: Satisfaction 4.a.7 Sub-Attribute: Preference Q1: Which interface did you prefer?
Measure: Rank preferred interface (Users chose or rank interfaces according to preference)
Rate preference for interfaces (Users rate the preference of each interface)
“Rate preference on a 1 to 10 scale” (Rui et al.2001)
“ preference about markup methods in 5 levels”(Wang et al.2001)
Behavior in interaction (The preferred interface is indicated by users’ behavior in interaction)
Enable users to continually chose an interface to perform tasks with; Observe which interface facilities users chose to use

32
4.a Attribute: Satisfaction 4.a.8 Sub-Attribute: Users’ attitudes and perceptions Q1: Do you feel connected to the other persons in my group? Q2: Do you feel sense of being together? (Slater et al., 2000) Q3: Which character did you feel familiar with? Measure: Attitudes towards other persons (Measures of the relation to other persons or to interfaces, considered as persons) Such measures typically aim at capturing the feeling of presence, trust, common ground and ease of communication One study had subjects complete a social anxiety test in addition to answering questions on their sense of being together (Basdogan et al., 2000). In some studies, measures of attitudes and perceptions of other persons are applied to user interfaces, for example to evaluate agents. Brickmore and Cassell (2001), for example, had users complete a standard questionnaire on trust after interacting with a conversational agent. Q4: Do you think the information is of high quality? Q5: How appealing was the subject matter of the multimedia experience to you? (1:Not appealing at
all, 7:Very appealing)” (Karat et al. (2001, p. 460)) Measure: Attitudes towards content (Attitudes towards the content of the interface when content can
be distinguished from the interface) Q6: How do you judge the quality of the task outcome? Q7: Do you feel a sense of success? Q8: What is your assessment of your own performance? Measure: Perception of outcomes (Users’ perception of the outcome of the interaction) (LeeTiernan
and Grudin,2001) Q9: With which interface did you think you were faster? Q10: How difficult were the tasks? Measure: Perception of interaction (Measures users’ perception of the interaction) Q11: Do you think this software is satisfying to use? Q12: Is this interface easy to use? Measure: Ease-of-use(Broad measures of users’ overall satisfaction or attitudes towards the
interface or user experience) Q13: Do you think it is overall a good system? Q14: If this software product is compared to others you have used, which one is your favorable? Q15: How satisfied do you feel with the use of the keyword comparison? Q16: Do you have some negative comments during use of this software product? 4.a Attribute: Satisfaction 4.a.9 Sub-Attribute: Flexibility Q1: Is it straightforward to change the settings on this product/service? Q2: Is it easy to set up shortcuts to my favourite functions and services using this product/service? 4. b Attribute: Satisfaction Measure: Rating scale for satisfaction (ISO 9241-11, ISO9126-4) X = A/B
A = questionnaire producing psychometric scales B = population average
E.g. Rating scale for satisfaction with power features
Rate of voluntary use Frequency of use Rating scale for satisfaction with support facilities Rating scale for ease of learning Rating scale for error handling Rating scale for effort
Q1: What proportions of potential users choose to use the system? Measure: Discretionary Usage (ISO 9241-11, ISO9126-4) X = A/B
A= number of times that specific software functions/applications/systems are used B = number of times they are intended to be used

33
Q2: What is the rate of complaints from users? Measure: Frequency of complaints (ISO 9241-11) Q3: How satisfied is the user with specific software features? Q4: Do you feel pleasantly surprising? Q5: Do you think it is easy to make mistakes? Q6: Do you feel the product was reliable? Q7: Do you feel embarrassment during executing the task? Q8: Will you willing to use this software product on a regular basis? Q9: Will you recommend this software to others? Q10: Is the purpose of the software was clear? Q11.Do you know what you can do when you start? Measure: Before use (Measures of satisfaction with the interface obtained before users have
interacted with the interface) Q12: Is it easy to get where you wanted to go? Q13: Was each area clearly marked? Q14: Does this software provide valuable information? Q15: Is this software product timely (or up-to-date)? Q16: Does this software provide a shared experience? Q17: Do you feel this software product is unique? Q18: Do you feel this software is familiar? Q19: Is this software product responsive (not too slow)? Q20: Do you find this method is confusing to use? Q21: Do you always know what you are expected to do when you are using this software product? Measure: During use (Measures of satisfaction obtained while users solve tasks with the interface) Q22: Do you felt flustered when using this software product? Q23: Will you be happy to use this software product again? Q24: Do you think this software product is efficient? Q25: Do you felt under stress when using this software product? Q26: Do you enjoy entering the data in this way? Q27: Do you think this method needs a lot of improvement? Q28: Do you think this software product is too complicated to use? Q29: Do you feel you have to concentrate hard to use this software product? Q30: Do you feel out of control when using this software product? Q31: Will you use this system frequently? Q32: Do you find the various functions in this system were well integrated? Q33: Did you feel very confident when using the system? Q34: Do you feel frustrating when using the software? Q35: Is the amount of information that can be displayed on screen adequate? Q36: Is the instructions for correcting errors clear? Q37: Does the product always keep you informed about what it is doing? Q38: Does performing an operation always lead to a predictable result? Q39: Is the length of delay between operations acceptable? Q40: Is it difficult to learn advanced features? Q41: Does system failure occur frequently? Q42: Does it warn you about potential problems always? Q43: Do you feel easy to correct your mistakes? Q44: Is the sound output choppy or smooth? Q45: Is the sound output garbled or clear? Q46: Do you think audio is always in sync with video images? 5.a Attribute: Learnability 5.a.1 Sub-Attribute: Minimal action Q1: Does it provide default values? (Lin et al., 1997) Q2: Does it provide global search and replace capability? (Lin et al., 1997) Q3: Does it require minimal steps in sequential menu selection? (Lin et al., 1997) Q4: Is the return to higher-level menus required only one simple key action? (Lin et al., 1997) Q5: Is the return to general menu required only one simple key action? (Lin et al., 1997) 5.a Attribute: Learnability 5.a.2 Sub-Attribute: Minimal memory load

34
Q1: How are abbreviations and acronyms used? Note: If possible, do not use abbreviations and acronyms at all.
· If it is necessary to use abbreviations and acronyms, use standard ones. · If there are no standard ones, use a consistent rule to generate them throughout the system. Q2: Does it provide aids for entering hierarchic data? (Lin et al. ,1997) Q3: Does it provide hierarchic menus for sequential selection? (Lin et al. ,1997) Q4: Are selected data highlighted? (Lin et al. ,1997) Q5: Does it provide index of commands? (Lin et al. ,1997) Q6: Does it provide index of data? (Lin et al. ,1997) Q7: Are upper and lower cases equivalent? (Lin et al. ,1997) 5.a Attribute: Learnability 5.a.3 Sub-Attribute: User Guidance Q1: Are error messages non-disruptive/informative? (Lin et al., 1997) Q2: How helpful is the error message? Q3: What proportions of functions are described in the user documentation and/or help facility? 5.a Attribute: Learnability 5.a.4 Sub-Attribute: Consistency Q1: Is the wording consistent with user guidance? (Lin et al. ,1997) Q2: Are colors used in a manner consistent with the domain? Q3: Is the feedback consistent? Q4: Is the label format consistent? Q5: Is the label location consistent? Q6: Is the labeling itself consistent? Q7: Is the wording consistent across displays? 5.a Attribute: Learnability 5.a.5 Sub-Attribute: Self-descriptiveness Q1: Is the application simple enough? Q2: Are the task and its procedures so well known (or well-trained) that no further explanation is necessary? Q3: Does the application explain itself through cues, such as instructions or diagrams, which are presented on the screen or by using metaphors? Q4: Do you feel always confident that when you press or move the joystick or navigation button that it will move in the direction you intended and perform the action you want, using this product? 5.a Attribute: Learnability 5.a.6 Sub-Attribute: Simplicity Q1: Do you think the system unnecessarily complex? Q2: Is the main function of the application immediately apparent? Q3: Does the application minimize the number of controls from which users have to choose and labeling them clearly so users understand exactly what they do? Q4: Does the device provide as much information or functionality as possible for each piece of information users provide? (Minimize required input because it takes user’s time and attention, it slows users down and can discourage them from persevering with it when the device requires a lot of user input before anything useful happens.) Q5: Is the text on user interface short and direct so that users can absorb it quickly and easily? Q6: Does the application focus on its primary functionality? Q7: Do you think the tasks can be always performed in a straight-forward manner? Q8: Do you think the number of steps per task is too many or just right? Q9: Do the steps to complete a task always follow a logical sequence? Q10: Do you think it is easy to get started and does not take long time to learn to use the system? 5.a Attribute: Learnability 5.a.7 Sub-Attribute: Navigability Q1: Is the data grouping reasonable for easy learning? Q2: Is the ordering of menu options logical?
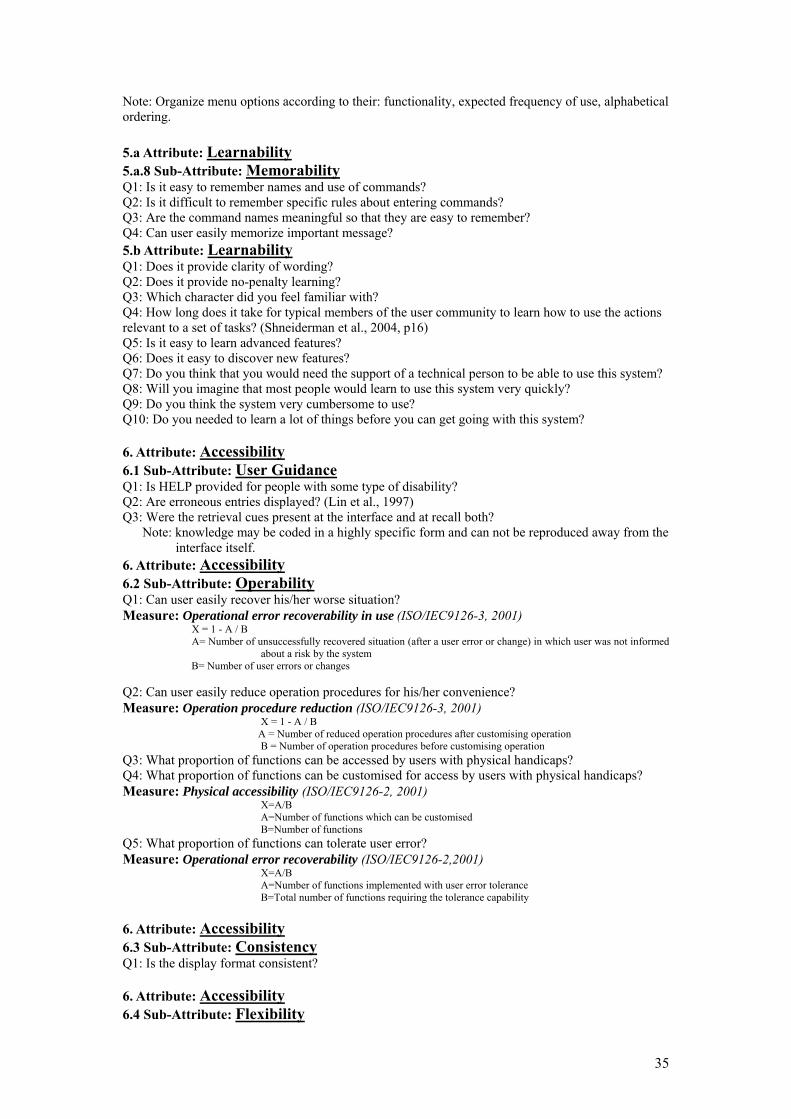
35
Note: Organize menu options according to their: functionality, expected frequency of use, alphabetical ordering. 5.a Attribute: Learnability 5.a.8 Sub-Attribute: Memorability Q1: Is it easy to remember names and use of commands? Q2: Is it difficult to remember specific rules about entering commands? Q3: Are the command names meaningful so that they are easy to remember? Q4: Can user easily memorize important message? 5.b Attribute: Learnability Q1: Does it provide clarity of wording? Q2: Does it provide no-penalty learning? Q3: Which character did you feel familiar with? Q4: How long does it take for typical members of the user community to learn how to use the actions relevant to a set of tasks? (Shneiderman et al., 2004, p16) Q5: Is it easy to learn advanced features? Q6: Does it easy to discover new features? Q7: Do you think that you would need the support of a technical person to be able to use this system? Q8: Will you imagine that most people would learn to use this system very quickly? Q9: Do you think the system very cumbersome to use? Q10: Do you needed to learn a lot of things before you can get going with this system? 6. Attribute: Accessibility 6.1 Sub-Attribute: User Guidance Q1: Is HELP provided for people with some type of disability? Q2: Are erroneous entries displayed? (Lin et al., 1997) Q3: Were the retrieval cues present at the interface and at recall both?
Note: knowledge may be coded in a highly specific form and can not be reproduced away from the interface itself.
6. Attribute: Accessibility 6.2 Sub-Attribute: Operability Q1: Can user easily recover his/her worse situation? Measure: Operational error recoverability in use (ISO/IEC9126-3, 2001) X = 1 - A / B A= Number of unsuccessfully recovered situation (after a user error or change) in which user was not informed
about a risk by the system B= Number of user errors or changes
Q2: Can user easily reduce operation procedures for his/her convenience? Measure: Operation procedure reduction (ISO/IEC9126-3, 2001)
X = 1 - A / B A = Number of reduced operation procedures after customising operation
B = Number of operation procedures before customising operation Q3: What proportion of functions can be accessed by users with physical handicaps? Q4: What proportion of functions can be customised for access by users with physical handicaps? Measure: Physical accessibility (ISO/IEC9126-2, 2001)
X=A/B A=Number of functions which can be customised B=Number of functions
Q5: What proportion of functions can tolerate user error? Measure: Operational error recoverability (ISO/IEC9126-2,2001)
X=A/B A=Number of functions implemented with user error tolerance B=Total number of functions requiring the tolerance capability
6. Attribute: Accessibility 6.3 Sub-Attribute: Consistency Q1: Is the display format consistent? 6. Attribute: Accessibility 6.4 Sub-Attribute: Flexibility
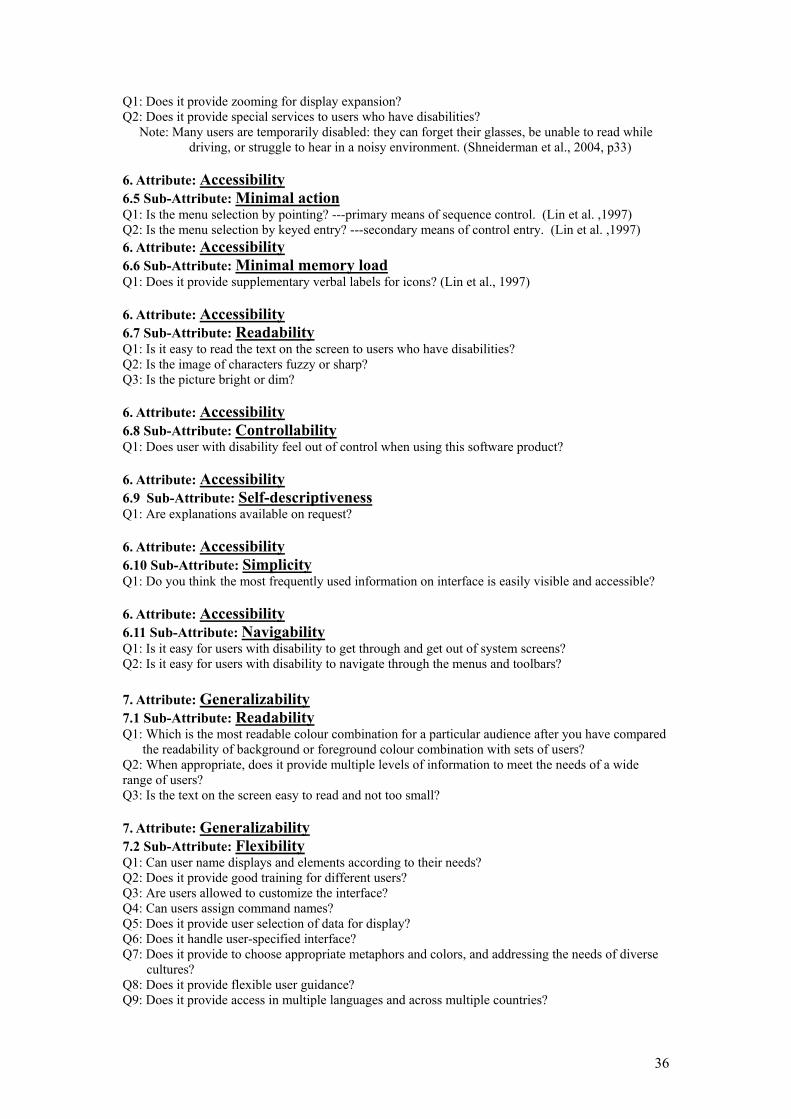
36
Q1: Does it provide zooming for display expansion? Q2: Does it provide special services to users who have disabilities? Note: Many users are temporarily disabled: they can forget their glasses, be unable to read while
driving, or struggle to hear in a noisy environment. (Shneiderman et al., 2004, p33) 6. Attribute: Accessibility 6.5 Sub-Attribute: Minimal action Q1: Is the menu selection by pointing? ---primary means of sequence control. (Lin et al. ,1997) Q2: Is the menu selection by keyed entry? ---secondary means of control entry. (Lin et al. ,1997) 6. Attribute: Accessibility 6.6 Sub-Attribute: Minimal memory load Q1: Does it provide supplementary verbal labels for icons? (Lin et al., 1997) 6. Attribute: Accessibility 6.7 Sub-Attribute: Readability Q1: Is it easy to read the text on the screen to users who have disabilities? Q2: Is the image of characters fuzzy or sharp? Q3: Is the picture bright or dim? 6. Attribute: Accessibility 6.8 Sub-Attribute: Controllability Q1: Does user with disability feel out of control when using this software product? 6. Attribute: Accessibility 6.9 Sub-Attribute: Self-descriptiveness Q1: Are explanations available on request? 6. Attribute: Accessibility 6.10 Sub-Attribute: Simplicity Q1: Do you think the most frequently used information on interface is easily visible and accessible? 6. Attribute: Accessibility 6.11 Sub-Attribute: Navigability Q1: Is it easy for users with disability to get through and get out of system screens? Q2: Is it easy for users with disability to navigate through the menus and toolbars? 7. Attribute: Generalizability 7.1 Sub-Attribute: Readability Q1: Which is the most readable colour combination for a particular audience after you have compared
the readability of background or foreground colour combination with sets of users? Q2: When appropriate, does it provide multiple levels of information to meet the needs of a wide range of users? Q3: Is the text on the screen easy to read and not too small? 7. Attribute: Generalizability 7.2 Sub-Attribute: Flexibility Q1: Can user name displays and elements according to their needs? Q2: Does it provide good training for different users? Q3: Are users allowed to customize the interface? Q4: Can users assign command names? Q5: Does it provide user selection of data for display? Q6: Does it handle user-specified interface? Q7: Does it provide to choose appropriate metaphors and colors, and addressing the needs of diverse
cultures? Q8: Does it provide flexible user guidance? Q9: Does it provide access in multiple languages and across multiple countries?
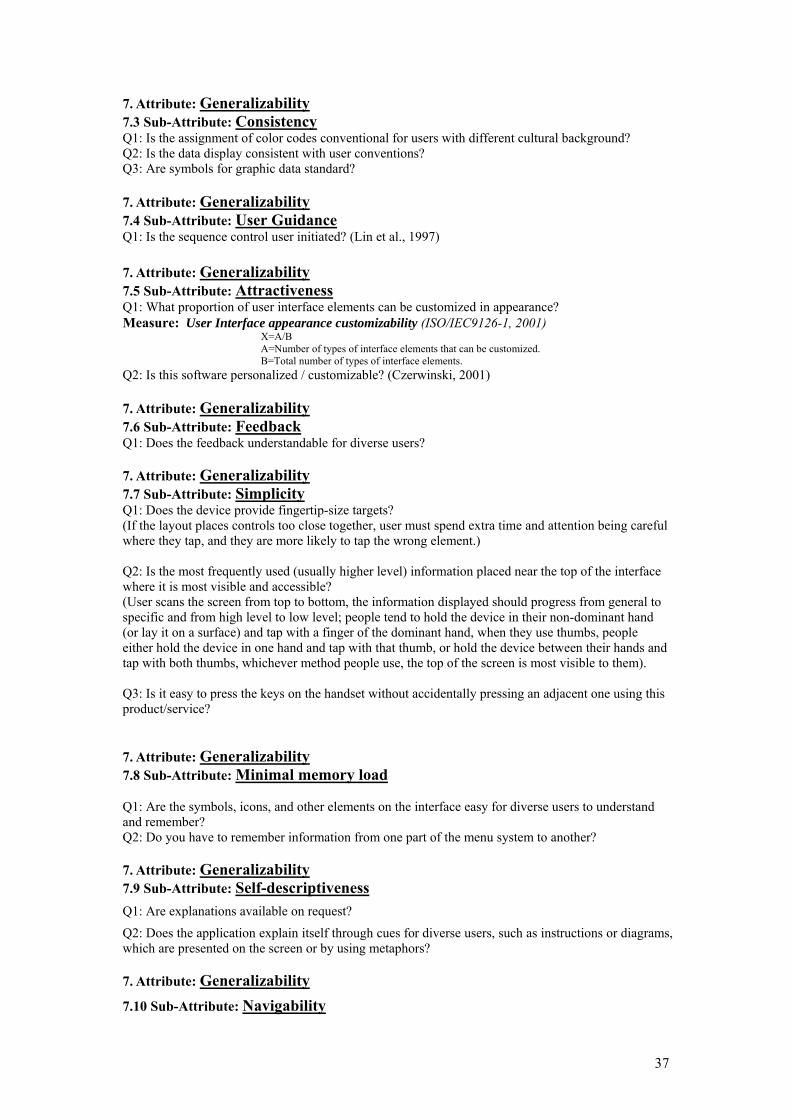
37
7. Attribute: Generalizability 7.3 Sub-Attribute: Consistency Q1: Is the assignment of color codes conventional for users with different cultural background? Q2: Is the data display consistent with user conventions? Q3: Are symbols for graphic data standard? 7. Attribute: Generalizability 7.4 Sub-Attribute: User Guidance Q1: Is the sequence control user initiated? (Lin et al., 1997) 7. Attribute: Generalizability 7.5 Sub-Attribute: Attractiveness Q1: What proportion of user interface elements can be customized in appearance? Measure: User Interface appearance customizability (ISO/IEC9126-1, 2001)
X=A/B A=Number of types of interface elements that can be customized. B=Total number of types of interface elements.
Q2: Is this software personalized / customizable? (Czerwinski, 2001) 7. Attribute: Generalizability 7.6 Sub-Attribute: Feedback Q1: Does the feedback understandable for diverse users? 7. Attribute: Generalizability 7.7 Sub-Attribute: Simplicity Q1: Does the device provide fingertip-size targets? (If the layout places controls too close together, user must spend extra time and attention being careful where they tap, and they are more likely to tap the wrong element.) Q2: Is the most frequently used (usually higher level) information placed near the top of the interface where it is most visible and accessible? (User scans the screen from top to bottom, the information displayed should progress from general to specific and from high level to low level; people tend to hold the device in their non-dominant hand (or lay it on a surface) and tap with a finger of the dominant hand, when they use thumbs, people either hold the device in one hand and tap with that thumb, or hold the device between their hands and tap with both thumbs, whichever method people use, the top of the screen is most visible to them). Q3: Is it easy to press the keys on the handset without accidentally pressing an adjacent one using this product/service? 7. Attribute: Generalizability 7.8 Sub-Attribute: Minimal memory load Q1: Are the symbols, icons, and other elements on the interface easy for diverse users to understand and remember? Q2: Do you have to remember information from one part of the menu system to another? 7. Attribute: Generalizability 7.9 Sub-Attribute: Self-descriptiveness Q1: Are explanations available on request?
Q2: Does the application explain itself through cues for diverse users, such as instructions or diagrams, which are presented on the screen or by using metaphors? 7. Attribute: Generalizability 7.10 Sub-Attribute: Navigability

38
Q1: Have you take Personality difference into consideration when organizing the hierarchy of menu? (To designer; developer) Note: The theory behind the MBTI provides portraits of the relationships between professions and personality types and between people of different personality types. It has been applied to testing of user communities and has provides guidance for designers. MBTI include the Big Five Test, which is based on the OCEAN model: Openness to Experience (closed/open); Conscientiousness (disorganized/ organized); Extraversion (introverted/ extraverted); Agreeableness (disagreeable/ agreeable); and Neuroticism (calm/ nervous) Other psychological scales, including risk taking versus risk avoidance; internal versus external locus of control; reflective versus impulsive behavior; convergent versus divergent thinking; high versus low anxiety; tolerance for stress, tolerance for ambiguity; motivation, or compulsiveness; field dependence versus independence; assertive versus passive personality and left-versus right-brain orientation. Another approach to personality assessment is by studies of user behavior. (Shneiderman et al., 2004, p29~30) 7. Attribute: Generalizability 7.11 Sub-Attribute: Controllability Q1: Does the device accommodate older adult users? Note: As the world’s population grows older. Larger street signs, brighter traffic lights and better nighttime lighting can make driving safer for drivers and pedestrians. Similarly, mobile devices can be improved for all users by providing users with control over font sizes, display contrast, and audio levels. Interfaces can be designed with easier-to-use pointing devices, clearer navigation paths, consistent layouts and simpler command languages to improve access for older adults and every user. (Shneiderman et al., 2004, p34) 8. Attribute: Understandability Q1: What proportion of functions (or types of function) is described in the product description? Q2: What proportions of functions requiring demonstration have demonstration capability? Q3: What proportions of the product functions are evident to the user? Q4: What proportion of the product functions will the user be able to understand correctly? Q5: What proportion of functions (or types of functions) is understood after reading the product description? Q6: What proportion of the demonstrations/ tutorials can the user access? Q7: What proportion of the demonstrations / tutorials can the user access whenever user actually needs to do during operation? Q8: What proportion of functions can the user operate successfully after a demonstration or tutorial? Q9: What proportion of functions (or types of function) can be identified by the user based upon start up conditions? Q10: Can users understand what is required as input data and what is provided as output by software system? Q11: Are the terms and abbreviations used throughout the system understandable and free of jargon? Q12: Is information presented in a way that matches how you view solving the problem? Q13: Are the items and information on the screen grouped logically? Q14: Does the system contain understandable status messages to let the user know what is taking place during processing? Q15: Do you think the amount of information that can be displayed on screen is adequate or not? Q16: Does the sequence of screens confusing or clear? Q17: Do you think the messages on screen which prompt user for input confusing or clear? Q18: Are the instructions for correcting errors confusing or clear? 9. Attribute: Safety 9.1 Sub-Attribute: Accuracy
Q1: How often do the end users encounter inaccurate results? Measure: Computational accuracy (ISO/IEC9126-2,2001)
X=A / T A= Number of inaccurate computations encountered by users T= Operation time
Q2: How often do the end users encounter results with inadequate precision?

39
Measure: Precision (Nyberg et al., 2001) X=A / T A= Number of results encountered by the users with level of precision different from required T= Operation time
9. Attribute: Safety 9.2 Sub-Attribute: Fault tolerance
Q1: How often the software product causes the break down of the total production environment?
Measure: Breakdown avoidance (ISO/IEC9126-2,2001) X= 1- A / B
A= Number of breakdowns B= Number of failures
Q2: How many fault patterns were brought under control to avoid critical and serious failures? Measure: Failure avoidance (ISO/IEC9126-2,2001)
X=A / B A= Number of avoided critical and serious failure occurrences against test cases of fault pattern B= Number of executed test cases of fault pattern (almost causing failure) during testing.
Q3: How many functions are implemented with incorrect operations avoidance capability? Measure: Incorrect operation avoidance (ISO/IEC9126-2,2001)
X=A / B A= Number of avoided critical and serious failures occurrences, B= Number of executed test cases of incorrect operation patterns (almost causing failure) during testing
Q4: Do you think the product’s menu system prevents you from making mistakes? 9. Attribute: Safety 9.3 Sub-Attribute: Security
Q1: How complete is the audit trail concerning the user access to the system and data? Measure: Access audit-ability (ISO/IEC9126-2, 2001)
X= A / B A= Number of “user accesses to the system and data” recorded in the access history database B= Number of “user accesses to the system and data” done during evaluation
Q2: How controllable is access to the system? Measure: Access controllability (ISO/IEC9126-2, 2001)
X= A / B A= Number of detected different types of illegal operations, B= Number of types of illegal operations as in the specification
Q3: How complete is the implementation of data corruption prevention? Measure: Data corruption prevention (ISO/IEC9126-2,2001)
X=A/B A= Number of implemented instances of data corruption prevention as specified confirmed in review. B= Number of instances of operation/access identified in requirements as capable of corrupting/destroying data.
Q4: How complete is the implementation of data encryption? Measure: Data encryption (ISO/IEC9126-2,2001)
X=A/B A=Number of implemented instances of encryptable/decryptable data items as specified confirmed in review B= Number of data items requiring data encryption/decryption facility as in specifications
Q5: What is the incidence of health problems among users of the product? Measure: User health and safety (ISO/IEC9126-4,2001)
X = 1-A / B A = number of users reporting RSI B = total number of users
NOTE Health problems can include Repetitive Strain Injury, fatigue, headaches, etc. Q6: What is the incidence of hazard to people affected by use of the system? Measure: Safety of people affected by use of the system (ISO/IEC9126-4,2001)
X = 1-A / B

40
A = number of people put at hazard B = total number of people potentially affected by the system
Q7: What is the incidence of economic damage? Measure: Economic damage (ISO/IEC9126-4,2001)
X = 1-A/ B A = number of occurrences of economic damage B = total number of usage situations
Q8: What is the incidence of software corruption? Measure: Software damage (ISO/IEC9126-4,2001)
X = 1-A / B A = number of occurrences of software corruption B = total number of usage situations
NOTE 1 This can also be measured based on the number of occurrences of situations where there was a risk of software damage NOTE 2 Can also be measured as X = cumulative cost of software corruption/usage time. 9. Attribute: Safety 9.4 Sub-Attribute: Privacy Q1: Can user’s personal information be accessed by un-authorized people? Q2: Can the device avoid personal information leakage?

41
4 USABILITY EVALUATION METHODS This chapter provides a brief discussion of usability evaluation methods which
were found common in literature. Developing computing technologies is an iterative process, and evaluation is a
critical component of any effective iterative process. In this context, an effective evaluation will not only identify problems, but also will provide guidance for the next iteration of design activities.
Prototyping software and the acceptance of paper prototyping make it possible to evaluate designs as early concepts, then throughout the detailed design phases. User participation is no longer postponed until just before the product is in its final form, early user involvement has blurred the distinction between design and evaluation.
An effective evaluation will be based on knowledge of the intended users, their goals, and the environment in which they will interact with the system (Sears, 2003).Different approaches are useful throughout the development process, depending on the purpose of the evaluation and the resources available.
Three standard approaches for evaluating interfaces are: user-based evaluation, inspection-based evaluation and model-based evaluation (Sears, 2003). There is also increasing focus on evaluating affective or emotional aspects of the interactions between people and computers.
4.1 User-based Evaluations
In User-Based evaluations, Dumas (2003) explores a variety of techniques that depend on the involvement of individuals’ representative of those who will ultimately use the system. There are three approaches are involved, they are user-administered questionnaires, observing users and empirical usability testing.
4.1.1 User-administered questionnaires
Over the past 20 years, there have been developed different types of questionnaires
to measure usability of a software product. A questionnaire can be used as a stand-alone measure of usability or it can be used alone with other measures. For example, it can be used at the end of a usability test to measure the subjective reactions of the participant to the product tested, or it can be used as a stand-alone usability measure of the product.
There are mainly two objectives for developing questionnaires to measure usability. The first one is to create a short questionnaire to measure users’ subjective evaluation of a product, usually as part of another evaluation method. And the second one is to create a questionnaire to provide an absolute measure of usability, that is, a numerical measure of the usability of a product that is independent of its relationship to any other product.
Creating a valid and reliable questionnaire takes considerable effort and specialized skills. There is an increasing use of the off-the-shelf questionnaires. Such kind of questionnaires can be mainly divided into two types:
a) Short Questionnaires which can be used to obtain a quick measure of users’ subjective reactions, usually to a product that they have just used for the first time.
b) Longer questionnaires that can be used alone as an evaluation method and that may be broken out into more specific subscales.
Brooke (1996) developed Software Usability Scale (SUS). It is a representative of short questionnaire and contains 10 questions with a Likert scale format-a statement
42
followed by a five-level agreement scale. The author claimed that this questionnaire can be used as a stand-alone evaluation or as part of a user test and it can be used to any kind of products.
Computer User Satisfaction Inventory (CUSI) is a somewhat longer questionnaire with 22 questions that break into two subscales: affect (the degree to which respondent like the software) and competence (the degree to which respondents feel they can complete tasks with the product), it was developed to measure attitudes toward software applications by Kirakowski and Corbett (1988).
The Questionnaire for User Interaction Satisfaction (QUIS) was developed at the Human-Computer Interaction Lab at the University of Maryland at College Park by Chin, Diehl and Norman (1988). It was designed to assess users’ subjective satisfaction with several aspects of the human-computer interface. This questionnaire is a representative of Stand-Alone questionnaires. It consists of a set of general questions which provide an overall assessment of a product and a set of detailed questions about interface components. Not all the factors are always relevant to every product, it was suggested that practitioners can select a subset of the questions to use. Each question of QUIS uses 9-point rating scale.
Software Usability Measurement Inventory (SUMI) was developed by Kirakowski (1996) and it is used to evaluate software only. It breaks answers into six subscales: global, efficiency, affect, helpfulness, control and learnability. And it includes 50 statements. Dumas (2003) concluded that SUMI has been applied not only to new software under development but also to compare software products and to establish a usability baseline. It has been used in development environments to set quantitative goals, track achievement of goals during product development and highlight good and bad aspects of a product.
Questionnaires can play an important role in a toolkit of usability evaluation methods. Short ones can be used as part of other evaluation methods, and longer ones can be used to establish a usability baseline and to track progress over time.
4.1.2 Observing Users
Another approach to evaluate the product is by observing its use and recording
what happens. But this approach has several limitations when used alone (Baber & Stanton, 1996).
1. Because the observer is not manipulating the events that occur, it is not always clear what caused a behavior. It is relatively difficult to infer causality while observing any behavior.
2. The observer is unable to control when events occur, sometimes important events might never occur while the observer is watching. So it may take a long time to observe what you are looking for.
3. A common problem with any user-based evaluation method which is not unique to observation is that participants might change their behavior when they know they are being observed.
4. There is a direct challenge to the validity of observation. It is observers often see what they want to see.
Bauersfled and Halgren (1996) proposed a method of video observation, a video
camera is set up in the user’s work environment and a second camera that shows what is on the user’s screen or desk surface. These two images are mixed and recorded. Participants are told to ignore the cameras as much as possible and to work as they normally would. They are shown how to turn on the equipment and told to do whenever they work. This method can be used during any stage of product development and not only for evaluation.
This kind of passive video capture can be done without present of usability specialist, but we can not know whether participants act differently because they know
43
they are being taped. Meanwhile, it takes long time to watch as if the participants were being observed directly because data must be extracted from videotapes. But still this method can be an option when an observer can not be present when users are working.
4.1.3 Empirical Usability Testing
Tracing back the history of usability testing, empirical usability testing has begun
since 1980s. In 1982, professionals who interested in studying Human-Computer Interaction are
came together for the first time at the Human Factors in Computer Systems conference held at Gaithersburg, Maryland. There was a session on evaluating text editors which described early usability tests by Ledgard (1982). The reports were written in the style of experimental psychology reports. But the reliance on psychological research experiments as a model for usability testing was challenged.
Young and Barnard (1987) proposed the concept of scenarios instead of experiments.
In the first edition of book on usability written by Shneiderman (1987), Designing the User Interface, there was no section for usability testing but there was one on quantitative evaluations. In the 1992 edition, there again was no entry in the index for usability testing, but there is one for usability laboratories, from which Shneiderman described usability tests as “pilot tests”, and he mentioned these testes “can be run to compare design alternatives, to contrast the new system with current manual procedures or to evaluate competitive products” (p.479). There is one chapter section on usability testing and laboratories in the 1997 edition.
Based on the research studies by Virzi (1990, 1992) on small number of participants, it shows that usability test could identify usability problems quickly. The book of Rubin (1994) explicitly presented usability as a method separate from psychological research.
Valid usability tests have following six characteristics (Dumas, 2003): The focus is on usability
It seems like obviously that a usability test should focus on usability, but sometimes people tries to use this test for other inappropriate purpose, such as marketing and promotional issues. For example, adding a question to a posttest questionnaire to ask participants if they want buy the product they just used. If the purpose of adding this question is to provide an opportunity for the participant to talk about his or her reactions to the test session, then the question is appropriate. But if the question is added to see if customers would buy the product, then is it not appropriate. Obviously, a company would not base its sales projections on the results of such a question, and this method is not appropriate for estimating sales or market share. But people who read the test report might draw inappropriate conclusions. For example, when five of six participants say that they would buy the product, but actually, there are several severe usability problems, it might provide an excuse for ignoring usability problems.
The participants are end users or potential end users A valid usability test must test people who are part of the target market for the product. The key to find people who are potential candidates for the test is a user profile (Branaghan, 1997). In a test of an upgrade to a design for a cellular phone, participants can be people who own a cell phone now or who would consider to buy one. Of the people who own a phone, it can include people who owned the previous version of the manufacturer’s phone and people who own other manufacturer’s phones. These characteristics build a user profile. From this profile, it can plan to select participants. The size of sample remains a problem, the early research study by Virzi (1990, 1992)
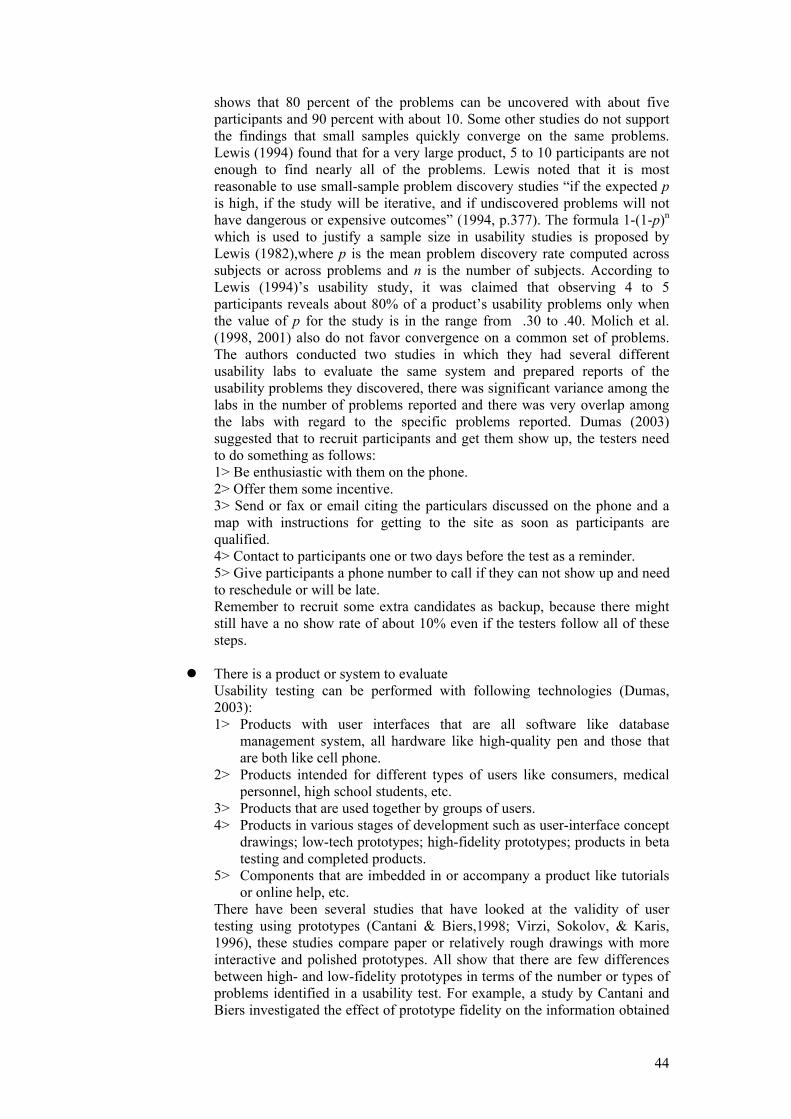
44
shows that 80 percent of the problems can be uncovered with about five participants and 90 percent with about 10. Some other studies do not support the findings that small samples quickly converge on the same problems. Lewis (1994) found that for a very large product, 5 to 10 participants are not enough to find nearly all of the problems. Lewis noted that it is most reasonable to use small-sample problem discovery studies “if the expected p is high, if the study will be iterative, and if undiscovered problems will not have dangerous or expensive outcomes” (1994, p.377). The formula 1-(1-p)n which is used to justify a sample size in usability studies is proposed by Lewis (1982),where p is the mean problem discovery rate computed across subjects or across problems and n is the number of subjects. According to Lewis (1994)’s usability study, it was claimed that observing 4 to 5 participants reveals about 80% of a product’s usability problems only when the value of p for the study is in the range from .30 to .40. Molich et al. (1998, 2001) also do not favor convergence on a common set of problems. The authors conducted two studies in which they had several different usability labs to evaluate the same system and prepared reports of the usability problems they discovered, there was significant variance among the labs in the number of problems reported and there was very overlap among the labs with regard to the specific problems reported. Dumas (2003) suggested that to recruit participants and get them show up, the testers need to do something as follows: 1> Be enthusiastic with them on the phone. 2> Offer them some incentive. 3> Send or fax or email citing the particulars discussed on the phone and a map with instructions for getting to the site as soon as participants are qualified. 4> Contact to participants one or two days before the test as a reminder. 5> Give participants a phone number to call if they can not show up and need to reschedule or will be late. Remember to recruit some extra candidates as backup, because there might still have a no show rate of about 10% even if the testers follow all of these steps.
There is a product or system to evaluate Usability testing can be performed with following technologies (Dumas, 2003): 1> Products with user interfaces that are all software like database
management system, all hardware like high-quality pen and those that are both like cell phone.
2> Products intended for different types of users like consumers, medical personnel, high school students, etc.
3> Products that are used together by groups of users. 4> Products in various stages of development such as user-interface concept
drawings; low-tech prototypes; high-fidelity prototypes; products in beta testing and completed products.
5> Components that are imbedded in or accompany a product like tutorials or online help, etc.
There have been several studies that have looked at the validity of user testing using prototypes (Cantani & Biers,1998; Virzi, Sokolov, & Karis, 1996), these studies compare paper or relatively rough drawings with more interactive and polished prototypes. All show that there are few differences between high- and low-fidelity prototypes in terms of the number or types of problems identified in a usability test. For example, a study by Cantani and Biers investigated the effect of prototype fidelity on the information obtained

45
from a performance test. They had three levels of prototypes; paper (low fidelity); screen shots (medium fidelity) and interactive Visual Basic (high fidelity). Thirty university students performed four typical library search tasks using one of these three prototypes, A total of 99 usability problems were uncovered, and the mean number of total problems encountered was 24.8 (Low fidelity); 29.4 (Medium fidelity) and 28 (High fidelity). There were no significant differences in the number and severity of problems identified and the specific problems uncovered by users using these three prototypes were highly common.
The participants Think Aloud when they perform tasks The test participant and the test administrator interact in the execution phase of the test and collect necessary data, before the test session starts, the administrator gives a set of pretest instructions, which tell the participant how the test will proceed and about thinking aloud. The administrator needs to tell the participants to say out loud what they are experiencing when they work. In usability testing, the focus is on interactions with the object being tested and with reporting not only thoughts, but also expectations and feelings. Test participants usually attempt tasks that users of the product will want to do, but there are more tasks than there is time available to test them. So it is necessary to select a sample of tasks, but this also makes it as a limitation to the scope of a test. Dumas (2003) concluded that testers usually select tasks for following reasons: 1> Include important tasks which are performed frequently or are basic to
the job users will want to accomplish. Basic tasks which tap into the core functionality of the product should be included.
2> Include tasks that probe areas where usability problems are likely. But these tasks can make a product look less usable than if they were not included.
3> Include tasks that probe the components of a design. For example, tasks that force the user to navigate to the lowest level of the menus or tasks that have toolbar shortcuts. The goal is to increase thoroughness at uncovering problems.
4> Include tasks which may be easy to do because they have been redesigned in response to the results of a previous test.
5> Include tasks which may be new to the product line. 6> Include tasks which may cause interference from old habits. Tasks are usually presented in Task Scenarios. The scenarios should be carefully worded so as not to mislead the participant. Meanwhile, the order of scenarios is also very important, they should have some dependencies. For example, when testing a mobile phone, there may be a task to enter contact information into memory and then a later task to change it. If the user can not complete the first task, there will be a problem happening with this dependency. It is better that tester expert have prepared strategies to handle this problem, such as putting contact information in another memory location can direct the user to it when they could not complete the earlier task.
The participants are observed and data are recorded and analyzed Recording data during the session remains a challenge, there are too many events happening too quickly to be able to record them in free-form notes. There are three ways that testers can use to deal with the complexity of recording data: 1> Create data collection forms for events that can be anticipated (Kantner,
2001). 2> Create or purchase data logging software (Philips & Dumas, 1990).
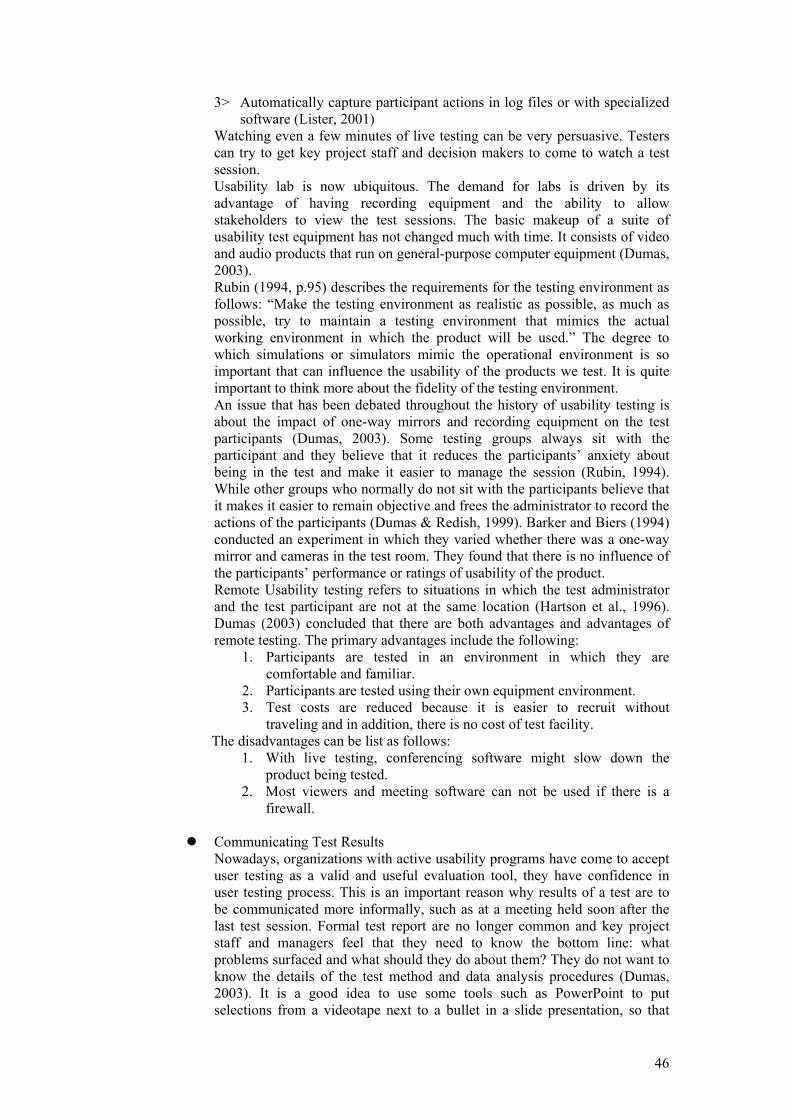
46
3> Automatically capture participant actions in log files or with specialized software (Lister, 2001)
Watching even a few minutes of live testing can be very persuasive. Testers can try to get key project staff and decision makers to come to watch a test session. Usability lab is now ubiquitous. The demand for labs is driven by its advantage of having recording equipment and the ability to allow stakeholders to view the test sessions. The basic makeup of a suite of usability test equipment has not changed much with time. It consists of video and audio products that run on general-purpose computer equipment (Dumas, 2003). Rubin (1994, p.95) describes the requirements for the testing environment as follows: “Make the testing environment as realistic as possible, as much as possible, try to maintain a testing environment that mimics the actual working environment in which the product will be used.” The degree to which simulations or simulators mimic the operational environment is so important that can influence the usability of the products we test. It is quite important to think more about the fidelity of the testing environment. An issue that has been debated throughout the history of usability testing is about the impact of one-way mirrors and recording equipment on the test participants (Dumas, 2003). Some testing groups always sit with the participant and they believe that it reduces the participants’ anxiety about being in the test and make it easier to manage the session (Rubin, 1994). While other groups who normally do not sit with the participants believe that it makes it easier to remain objective and frees the administrator to record the actions of the participants (Dumas & Redish, 1999). Barker and Biers (1994) conducted an experiment in which they varied whether there was a one-way mirror and cameras in the test room. They found that there is no influence of the participants’ performance or ratings of usability of the product. Remote Usability testing refers to situations in which the test administrator and the test participant are not at the same location (Hartson et al., 1996). Dumas (2003) concluded that there are both advantages and advantages of remote testing. The primary advantages include the following:
1. Participants are tested in an environment in which they are comfortable and familiar.
2. Participants are tested using their own equipment environment. 3. Test costs are reduced because it is easier to recruit without
traveling and in addition, there is no cost of test facility. The disadvantages can be list as follows:
1. With live testing, conferencing software might slow down the product being tested.
2. Most viewers and meeting software can not be used if there is a firewall.
Communicating Test Results
Nowadays, organizations with active usability programs have come to accept user testing as a valid and useful evaluation tool, they have confidence in user testing process. This is an important reason why results of a test are to be communicated more informally, such as at a meeting held soon after the last test session. Formal test report are no longer common and key project staff and managers feel that they need to know the bottom line: what problems surfaced and what should they do about them? They do not want to know the details of the test method and data analysis procedures (Dumas, 2003). It is a good idea to use some tools such as PowerPoint to put selections from a videotape next to a bullet in a slide presentation, so that
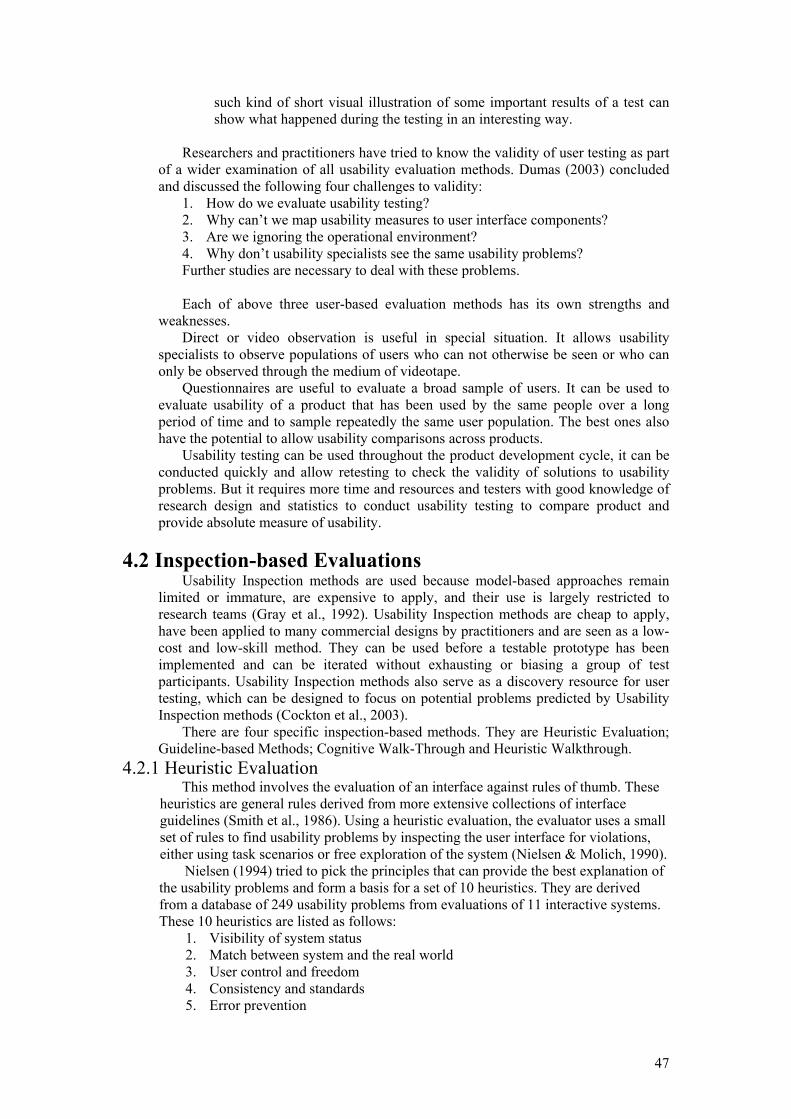
47
such kind of short visual illustration of some important results of a test can show what happened during the testing in an interesting way.
Researchers and practitioners have tried to know the validity of user testing as part
of a wider examination of all usability evaluation methods. Dumas (2003) concluded and discussed the following four challenges to validity:
1. How do we evaluate usability testing? 2. Why can’t we map usability measures to user interface components? 3. Are we ignoring the operational environment? 4. Why don’t usability specialists see the same usability problems? Further studies are necessary to deal with these problems. Each of above three user-based evaluation methods has its own strengths and
weaknesses. Direct or video observation is useful in special situation. It allows usability
specialists to observe populations of users who can not otherwise be seen or who can only be observed through the medium of videotape.
Questionnaires are useful to evaluate a broad sample of users. It can be used to evaluate usability of a product that has been used by the same people over a long period of time and to sample repeatedly the same user population. The best ones also have the potential to allow usability comparisons across products.
Usability testing can be used throughout the product development cycle, it can be conducted quickly and allow retesting to check the validity of solutions to usability problems. But it requires more time and resources and testers with good knowledge of research design and statistics to conduct usability testing to compare product and provide absolute measure of usability.
4.2 Inspection-based Evaluations
Usability Inspection methods are used because model-based approaches remain limited or immature, are expensive to apply, and their use is largely restricted to research teams (Gray et al., 1992). Usability Inspection methods are cheap to apply, have been applied to many commercial designs by practitioners and are seen as a low-cost and low-skill method. They can be used before a testable prototype has been implemented and can be iterated without exhausting or biasing a group of test participants. Usability Inspection methods also serve as a discovery resource for user testing, which can be designed to focus on potential problems predicted by Usability Inspection methods (Cockton et al., 2003).
There are four specific inspection-based methods. They are Heuristic Evaluation; Guideline-based Methods; Cognitive Walk-Through and Heuristic Walkthrough.
4.2.1 Heuristic Evaluation This method involves the evaluation of an interface against rules of thumb. These
heuristics are general rules derived from more extensive collections of interface guidelines (Smith et al., 1986). Using a heuristic evaluation, the evaluator uses a small set of rules to find usability problems by inspecting the user interface for violations, either using task scenarios or free exploration of the system (Nielsen & Molich, 1990).
Nielsen (1994) tried to pick the principles that can provide the best explanation of the usability problems and form a basis for a set of 10 heuristics. They are derived from a database of 249 usability problems from evaluations of 11 interactive systems. These 10 heuristics are listed as follows:
1. Visibility of system status 2. Match between system and the real world 3. User control and freedom 4. Consistency and standards 5. Error prevention

48
6. Recognition rather than recall 7. Flexibility and efficiency of use 8. Aesthetic and minimalist design 9. Help users recognize, diagnose, and recover from errors 10. Help and documentation Muller et al. (1995) claimed that Nielsen’s heuristics do not consider the context
in which the proposed system will be used. They added another three new heuristics to assess how well the interactive system meets the needs of its users and their work environments. These new heuristics are as follows:
1. Respect the user and his or her skills 2. Promote a pleasurable experience with the system 3. Support quality work
4.2.2 Guideline-Based Methods Guidelines provide advice at the range of levels of abstraction and contextual
sensitivity to developers. Recent guidelines are provided by ISO 9241, a multipart standard on ergonomics requirements for office work with visual display terminals.
4.2.3 Cognitive Walk-Through
Cognitive walk-Through (Lewis & Wharton, 1997) is a procedural inspection method. It assesses the learnability of “walkup-and-use” systems. The evaluators choose a set of tasks for analysis. Analysts step through each step of the task answering a set of questions backing up their answers with empirical evidence, experience, or scientific evidence. A negative answer to any of the questions indicates potential usability problems.
There are two main forms of Cognitive walk-through presented in the literature: Early versions of cognitive walkthrough (Polson et al., 1992) which consider users’ goals explicitly. The later versions of cognitive walkthrough (Wharton et al., 1994) simplify the early version, which de-emphasis the explicit consideration of the users’ goals. Thus reduces the number of questions needed and making the method easier to use.
The cognitive walkthrough questions developed by Wharton et all. (1994) are as follows:
1. Will the user try to achieve the right effect? 2. Will the user notice that the correct action is available? 3. Will the user associate the correct action with the effect that the user is trying
to achieve? 4. If the correct action is performed, will the user see that progress is being
made toward solution of the task?
4.2.4 Heuristic Walkthrough This method is a combination of Heuristic Evaluation and cognitive
Walkthrough (Sears, 1997). The input to the method is a prioritized list of user tasks, which should include frequent or critical tasks and may include tasks designed purely to ensure coverage of the system.
There are two phases to the evaluation. The first one is a task-based phase, in which the evaluators explore the tasks using a set of thought-provoking questions derived from cognitive walkthrough. They are free to explore the tasks in any order, but they should be guided by the priorities. The second phase is a free-form phase, in which the evaluators are free to explore the system using set of thought of provoking-questions and heuristic evaluations.
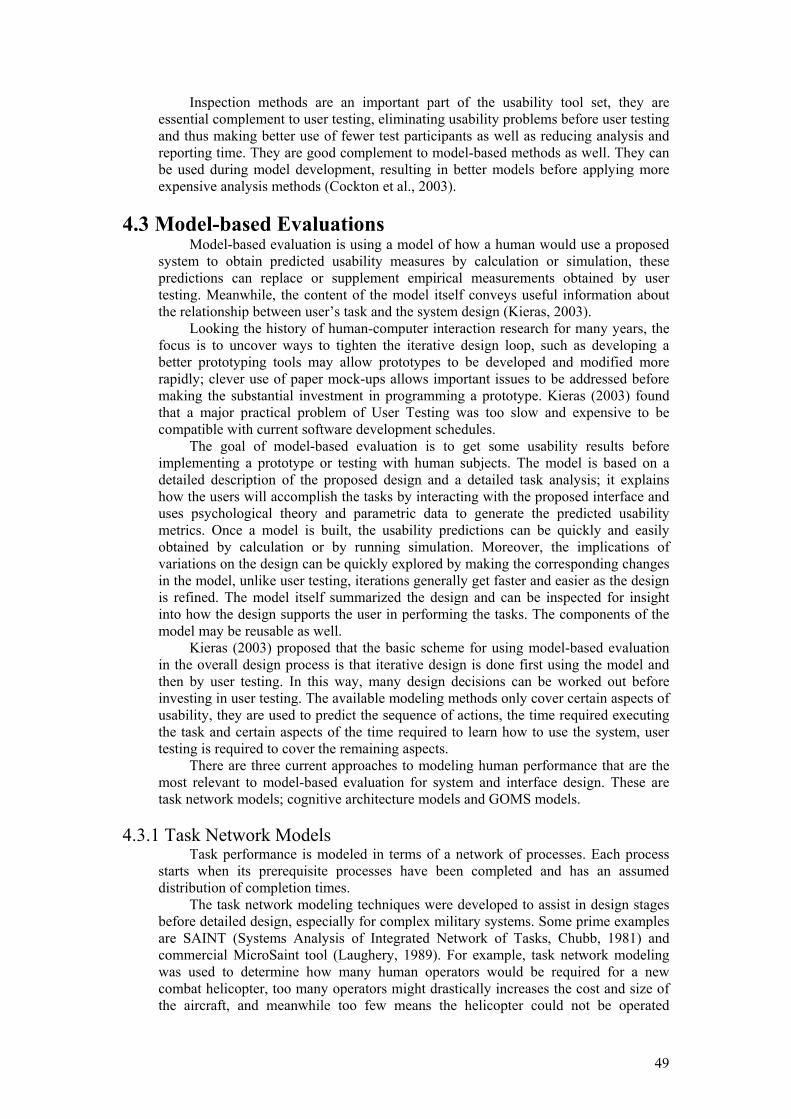
49
Inspection methods are an important part of the usability tool set, they are essential complement to user testing, eliminating usability problems before user testing and thus making better use of fewer test participants as well as reducing analysis and reporting time. They are good complement to model-based methods as well. They can be used during model development, resulting in better models before applying more expensive analysis methods (Cockton et al., 2003).
4.3 Model-based Evaluations
Model-based evaluation is using a model of how a human would use a proposed system to obtain predicted usability measures by calculation or simulation, these predictions can replace or supplement empirical measurements obtained by user testing. Meanwhile, the content of the model itself conveys useful information about the relationship between user’s task and the system design (Kieras, 2003).
Looking the history of human-computer interaction research for many years, the focus is to uncover ways to tighten the iterative design loop, such as developing a better prototyping tools may allow prototypes to be developed and modified more rapidly; clever use of paper mock-ups allows important issues to be addressed before making the substantial investment in programming a prototype. Kieras (2003) found that a major practical problem of User Testing was too slow and expensive to be compatible with current software development schedules.
The goal of model-based evaluation is to get some usability results before implementing a prototype or testing with human subjects. The model is based on a detailed description of the proposed design and a detailed task analysis; it explains how the users will accomplish the tasks by interacting with the proposed interface and uses psychological theory and parametric data to generate the predicted usability metrics. Once a model is built, the usability predictions can be quickly and easily obtained by calculation or by running simulation. Moreover, the implications of variations on the design can be quickly explored by making the corresponding changes in the model, unlike user testing, iterations generally get faster and easier as the design is refined. The model itself summarized the design and can be inspected for insight into how the design supports the user in performing the tasks. The components of the model may be reusable as well.
Kieras (2003) proposed that the basic scheme for using model-based evaluation in the overall design process is that iterative design is done first using the model and then by user testing. In this way, many design decisions can be worked out before investing in user testing. The available modeling methods only cover certain aspects of usability, they are used to predict the sequence of actions, the time required executing the task and certain aspects of the time required to learn how to use the system, user testing is required to cover the remaining aspects.
There are three current approaches to modeling human performance that are the most relevant to model-based evaluation for system and interface design. These are task network models; cognitive architecture models and GOMS models.
4.3.1 Task Network Models
Task performance is modeled in terms of a network of processes. Each process starts when its prerequisite processes have been completed and has an assumed distribution of completion times.
The task network modeling techniques were developed to assist in design stages before detailed design, especially for complex military systems. Some prime examples are SAINT (Systems Analysis of Integrated Network of Tasks, Chubb, 1981) and commercial MicroSaint tool (Laughery, 1989). For example, task network modeling was used to determine how many human operators would be required for a new combat helicopter, too many operators might drastically increases the cost and size of the aircraft, and meanwhile too few means the helicopter could not be operated
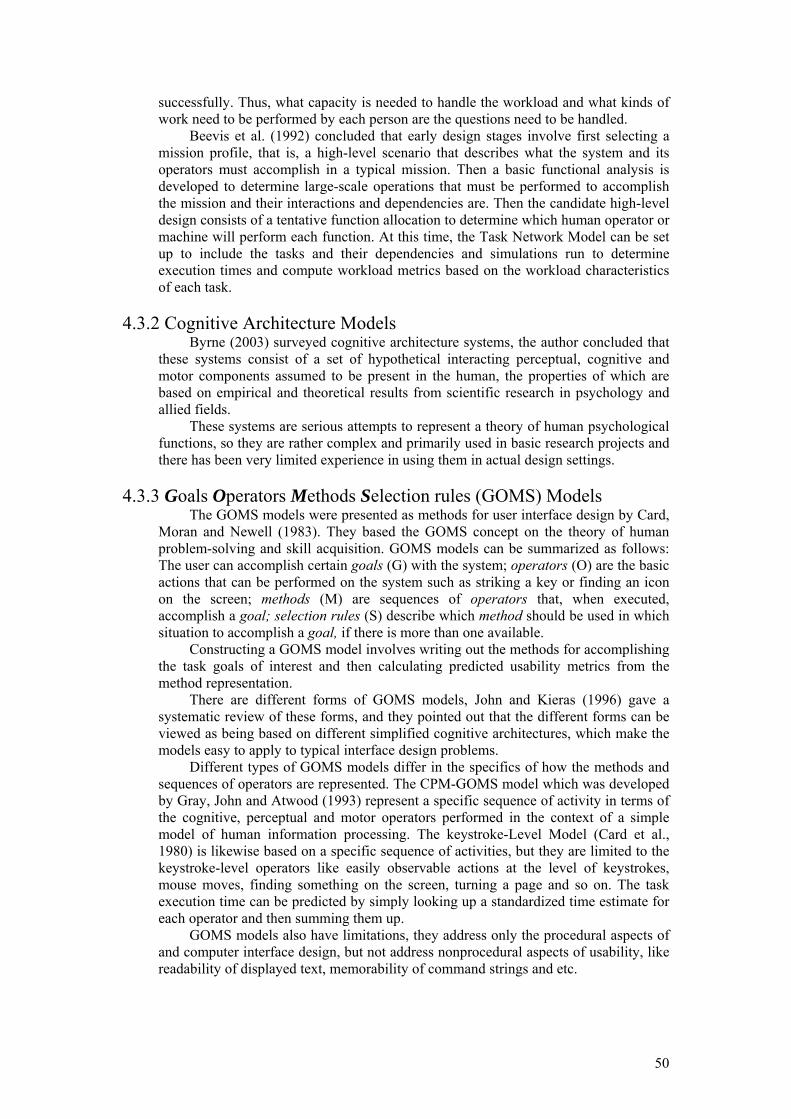
50
successfully. Thus, what capacity is needed to handle the workload and what kinds of work need to be performed by each person are the questions need to be handled.
Beevis et al. (1992) concluded that early design stages involve first selecting a mission profile, that is, a high-level scenario that describes what the system and its operators must accomplish in a typical mission. Then a basic functional analysis is developed to determine large-scale operations that must be performed to accomplish the mission and their interactions and dependencies are. Then the candidate high-level design consists of a tentative function allocation to determine which human operator or machine will perform each function. At this time, the Task Network Model can be set up to include the tasks and their dependencies and simulations run to determine execution times and compute workload metrics based on the workload characteristics of each task.
4.3.2 Cognitive Architecture Models
Byrne (2003) surveyed cognitive architecture systems, the author concluded that these systems consist of a set of hypothetical interacting perceptual, cognitive and motor components assumed to be present in the human, the properties of which are based on empirical and theoretical results from scientific research in psychology and allied fields.
These systems are serious attempts to represent a theory of human psychological functions, so they are rather complex and primarily used in basic research projects and there has been very limited experience in using them in actual design settings.
4.3.3 Goals Operators Methods Selection rules (GOMS) Models
The GOMS models were presented as methods for user interface design by Card, Moran and Newell (1983). They based the GOMS concept on the theory of human problem-solving and skill acquisition. GOMS models can be summarized as follows: The user can accomplish certain goals (G) with the system; operators (O) are the basic actions that can be performed on the system such as striking a key or finding an icon on the screen; methods (M) are sequences of operators that, when executed, accomplish a goal; selection rules (S) describe which method should be used in which situation to accomplish a goal, if there is more than one available.
Constructing a GOMS model involves writing out the methods for accomplishing the task goals of interest and then calculating predicted usability metrics from the method representation.
There are different forms of GOMS models, John and Kieras (1996) gave a systematic review of these forms, and they pointed out that the different forms can be viewed as being based on different simplified cognitive architectures, which make the models easy to apply to typical interface design problems.
Different types of GOMS models differ in the specifics of how the methods and sequences of operators are represented. The CPM-GOMS model which was developed by Gray, John and Atwood (1993) represent a specific sequence of activity in terms of the cognitive, perceptual and motor operators performed in the context of a simple model of human information processing. The keystroke-Level Model (Card et al., 1980) is likewise based on a specific sequence of activities, but they are limited to the keystroke-level operators like easily observable actions at the level of keystrokes, mouse moves, finding something on the screen, turning a page and so on. The task execution time can be predicted by simply looking up a standardized time estimate for each operator and then summing them up.
GOMS models also have limitations, they address only the procedural aspects of and computer interface design, but not address nonprocedural aspects of usability, like readability of displayed text, memorability of command strings and etc.

51
5 USER EXPERIENCE (UX) User Experience is an intriguing notion which has been widely disseminated and
is increasingly accepted in the HCI community. Hassenzahl et al. (2008) say the immense interest in UX in academia and industry are attributed to the fact that HCI researchers and practitioners have become well aware of the limitations of the traditional usability framework, which focuses primarily on user cognition and user performance in human-technology interactions. In contrast, UX highlights non-utilitarian aspects of such interactions, shifting the focus to user affect and sensation.
UX is seen as something desirable, but without clearly defined or well understood, this notion is still open and debatable.
There are lots of conferences, workshops, forums have been held in recent years, and the aim is to better understand UX and to develop a unified view on it. One obvious outcome of these activities is a number of diverse definitions and viewpoints on UX, but a shared definition is still lacking.
This thesis study is trying to collect different definitions and evaluation methods through reviewing currently published literature regarding UX issue, the aim is to take a small step towards a shared definition of User Experience.
5.1 UX DEFINITIONS FROM LITERATURE 5.1.1 Definitions
There are several reasons why it is hard to get a universal definition of UX. First, UX is associated with a broad range of fuzzy and dynamic concepts which
includes emotion, affect, experience, hedonic and aesthetic. Some examples of so-called elemental attributes of UX proposed by Cockton (2006) are fun, pleasure, pride, joy, surprise, and intimacy. And these are just a subset of a growing list of human values, including or excluding these particular attributes looks like still arbitrary without any clear criteria. It is depending on the author’s background and interest.
Second, as Sward (2006) mentioned the unit of analysis for UX is too malleable, ranging from a single aspect of an individual end-user’s interaction with a standalone application to multiple end-users’ interactions with the company and the merging of the services of multiple disciplines.
Some authors like Joerg Doerr & Daniel Kerkow (2006) claim UX to be closely related to User perceived Quality in Use which is identified in ISO9126 (2001) & ISO25000 (25000) and give the alternative definition of UX similar to Quality in Use as “UX is the perceived quality of a product that is being used within a socio-technical environment.” While some others such as Geven et al. (2006) advocate that Usability is still important for user experience, but experience shows that usability alone will not create a positive user experience although lack of usability in a product can lead to a negative user experience. These authors believe User experience is originated from usability but has shifted away and has become a topic on its own. More discussion related to the relationship between Usability and UX will be presented in chapter 6.
A brief summary of the definitions of User Experience published recently by different authors are listed in Table 8.

52
Table 8: UX Definitions from Literature Definitions of User Experience
Preece et al.(Preece, 2002) Satisfying Enjoyable Funny Entertaining Helpful Motivating Aesthetically Pleasing
Supportive of Creativity
suggest that user experience involves the following elements:
Rewarding Emotionally Fulfilling A different approach is to define user experience as a wider concept and include
usability as one of its elements. (Stage, 2006) Learnable and Usable Understanding of
Users Effective design Process
Needed
Appropriate Aesthetic Experience
An early definition of quality of experience suggests that this can be assessed in terms of eight criteria, they are:
Mutable Manageable A methodology for assessing user experience in a quantitative way (Stage, 2006)
Usability Branding Defines user experience in terms of four factors, they are: Functionality Content
Forlizzi and Battarbee(Forlizzi and Battarbee, 2004) Product-centered User-centered distinguish between three approaches to
understand experience: Interaction-centered They suggest an interaction-centered framework for describing user-product interaction and the user experience arising from this interaction
Hans-Christian Jetter & Jens Gerken (2006) User experience incorporates not only the traditional qualities like reliability, functionality, or usability but also novel and hard-to-grasp concepts from visual or industrial design, psychology or marketing research, e.g. attractiveness, stimulation, fun, “coolness”, “sexiness” or the successful delivery of a brand proposition.
Roto & Kaasinen (2008) User experience (UX) is a term that describes user’s feelings towards a specific product, system, or object during and after interacting with it. Various aspects influence the feelings, such as user’s expectations, the conditions in which the interaction takes place, and the system’s ability to serve user’s current needs.
It shows that the difference between some of above definitions is related to sub-
concepts used in the definition and the relation to usability, for example, whether usability is part of user experience or something separate. Taking Hans-Christian Jetter & Jens Gerken (2006)’s perspective, UX should not be considered as a “competitor” for traditional usability, but as the perfect vehicle to leverage user-centered design and usability to a greater extent and thus strengthening the importance of UX and usability likewise in industry practice.
5.1.2 Building Blocks
In order to design for good experience, it is important to state what UX stands for and how we can say whether a product provides a good UX or not.
Norman (2004) list the goals of a successful product are to engage users on behavioral, visceral, and reflective level, or to provide users functionality, usability, pleasure and pride. It shows that in addition to behavioral level, which includes the right functionality and usability, there is also visceral level and reflective level that includes the self-esteem of owning the product. How to design a product that fulfils these goals? It becomes a trigger to identify the building blocks of UX, and when the building blocks of UX is identified, it might help the product development team to

53
further identify attributes specific to their product based on the general building blocks during evaluation.
There are a number of researchers have investigated UX components, and there is a wide agreement that user’s earlier experiences and expectations affect UX, as well as the context of use (Mäkelä & Fulton Suri (2001), Hiltunen et al (2002), Forlizzi & Ford (2000), Arhippainen & Tähti (2003), Hassenzahl & Tractinsky (2006)). But Mäkelä & Fulton Suri (2001) also list the product or system as one UX component. Arhippainen and Tähti (2003) list five components affecting UX, they are user, social factor, cultural factors, context of use and product.
Hassenzahl & Tractinsky (2006) define three high level components which are able to cover all aspects mentioned above, and Virpi Roto (2006, 2008) takes these three components as a starting point and based on the knowledge about mobile browsing UX, the author tried to identify a set of attributes that are close to the appropriate level of abstraction to be applicable for a wide range of UX cases. A brief summary is presented in Table 9.
Table 9: User Experience Building Blocks
User Experience Building Blocks Hassenzahl & Tractinsky (2006)
1. User’s internal state (predispositions, expectations, needs, motivation, mood, etc.)
2. The characteristics of the designed system (e.g. complexity, purpose, usability, functionality, etc.)
Define UX into three components:
3. The context (or the environment) within which the interaction occurs (e.g. organizational/social setting, meaningfulness of the activity, voluntaries of use, etc.)
Virpi Roto (2006) Takes above three components as a starting point and based on the knowledge about mobile browsing UX, he tried to identify a set of attributes that are close to the appropriate level of abstraction to be applicable for a wide range of UX cases. UX components Related set of attributes Examples in mobile browsing
Products involved Objects involved Services involved Infrastructure involved People involved
System
System
Mobile device, browser, connection, gateway, and the site.
Physical context Everything we can see or feel, namely the tangible physical surroundings and their movement, temperature, rain or humidity and lighting, current location and noises
Social context Expectations and influence that other people have for the user.
Temporal context The time period that the user is able to dedicate for the system given the context restrictions
Context
Task context. The user may also have several ongoing tasks at the same time.
Needs accessing favorite web sites User Resources (Mental, Physical) Mental Resources: For
example, when taking notes during a lecture, if the system

54
does not work smoothly, the user can not concentrate both in listening to the lecture and writing. Physical Resources: Especially in mobile context, user may have limited physical resources available for using the system, such as only one hand for the device when the other is carrying a bag.
Emotional state If the user is in bad mood, he/she might be less patient to the system, and the UX is easily poor.
Experiences Expectations
Earlier failure experiences with WAP sites have make users expect failures with the true web, when they were able to accomplish something on the mobile web browser, even if with some difficulties, the overall UX was positive.
Taking Hans-Christian Jetter & Jens Gerken (2006)’s point of view, in the
experience economy, people do not buy a brand new fancy mobile phone solely on its superior functionality or usability. They buy the experience of being a part of social and professional life. They buy the experience of being spatially independent and able to plan and communicate spontaneously. They buy the experience of feeling informed anytime and anyplace by novel nomadic applications and information services. They buy the experience of being admired for their trendy but sensible choice of technological tools. These individual experiences are summed up in total user experience that has become crucial for commercial success today.
The often cited Apple iPod MP3 players with a market share of over 90% in the US market are a vivid example. How design and marketing can lead to a positive total UX that can even compensate serious disadvantages of a product such as higher costs or arguable usability. Such a total UX does not only incorporate the traditional qualities like reliability, functionality or usability but also hard-to-grasp concepts from industrial design, psychology or marketing research, like attractiveness, stimulation, fun, coolness, sexiness or the successful delivery of a brand proposition.

55
Hans-Christian Jetter & Jens Gerken (2006) developed a simplified model of UX
as a basis for the practical application of UX in design and evaluation processes, especially aimed at the practitioner. Their aim was to unify the different views from scientific and practitioners’ literature in a simplified, yet complete and unbiased model, which includes the user-product relationship (mainly discussed in UX literature from the fields of HCI, Joy-of-Use, Funoloty or Emotional Design) and the organization-product relationship (mainly discussed in e-Commerce or marketing related literature about branding, customer experience or customer relationship management), the model provides a quick overview over influential factors on UX and illustrates which influential factors can be addressed during a design process. A brief summary of this model is presented in Figure 4.
Figure 4: UX building blocks The authors advocate that subjective values of all stakeholders including
organization and user plan a central role in designing UX. They identified two most important building blocks which are shown in Figure 4.
The User-Product Relationship is defined by the User, the Product and the User Values, which are strongly depending on the current Context of Use such as the user’s tasks and social or physical environment. The relationship is perceived by the user in terms of functionality and usability on the pragmatic level and in terms of hedonic quality on a hedonic level.
The Organization-Product Relationship does not contain user perceptions, but a two level hierarchy of business processes and goals including “Everyday operations”, “Marketing, Branding, and Business communication”. “Selling items on a website; providing communication or information service; offering customer support” these operations lay the foundation of every organization and are considered by the authors to be closely related to functionality and usability of a product. However, there are also higher level goals of organizations like communicating a certain product or brand identity, or establishing an emotional link between the organization, its brand and the user or customer. These are considered by the authors as a crucial part of marketing and business communication. So delivering a successful brand proposition requires more than designing solely pragmatic qualities (Hans-Christian Jetter & Jens Gerken, 2006).
5.1.3 A model distinguishes between Pragmatic and Hedonic attributes
Hassenzahl (2003) proposed a complex model which defined key elements of UX
and their functional relations. Specifically, it aims to address following aspects: 1> the subjective nature of experience 2> perception of a product 3> emotional responses to products in 4> varying situations The author shows an overview of the key elements of the model of UX from a
designer perspective and a user perspective. Taking Hassenzahl (2003)’s opinions, “A
UX
The User-Product Relationship
The organization-Product Relationship

56
product has certain features (content, presentational style, functionality, interaction style) chosen and combined by a designer to convey a particular, intended product character. A character is a high-level description. It summarized a product’s attributes such as novel, interesting, useful, and predictable. The character’s function is to reduce cognitive complexity and to trigger particular strategies for handling the product. When individuals come in contact with a product, a process is triggered. First, people perceive the product’s features. Based on this, each individual constructs a personal version of the product character, the apparent product character. This character consists of groups of pragmatic and hedonic attributes. Second, the apparent product character leads to consequences: a judgment about the product’s appeal such as it is good or bad, emotional consequences such as pleasure or satisfaction and behavioral consequences such as increased time spend with the product. The author emphasized that the consequences are moderated by the specific usage situation, so it is not always the same.”
It should note that it is a user’s personal reconstruction of the designer’s intended product character and it is based on people’s personal standards and expectations. And the apparent character mentioned above may change within a person over time due to increasing experiences with the product.
Hassenzahl (2003) distinguished the difference between Pragmatic and Hedonic attributes in his model. It is claimed that a product may be perceived as pragmatic because it provides effective and efficient means to manipulate the environment, while a product may be perceived as hedonic because it provides stimulation, identification or provokes memories. And the combination of these two independent attributes is the product character.
The model also distinguished the difference between Satisfaction and Joy. It is claimed that satisfaction is linked to the success in using a product to achieve particular desirable behavioral goals while Pleasure is linked to using a product in a particular situation and encountering something desirable but unexpected.
5.2 Measuring UX 5.2.1 The Sum-of-Factor Approach
As Section 5.1 discussed, several researchers have tried to decompose
“experience” into its elements such as personality, emotions, expectation, age, gender, cultural factors, context factors like time and place, trust, enjoyment and etc. Each of these elements contributes to UX and can be analyzed one by one, but as it is not possible to assess all single elements at the same time, and by measuring one element, sometimes, it might influence the others, so it will remain uncertain about the total UX.
Meanwhile, the experience itself is not the same as the sum of its parts, it is something relates to the user’s interpretation of his or her relation to a product as a whole (Arjan Geven, 2006).
Though the interpretation depends on elements which are mentioned above, it is still not possible to receive complete information just by looking at UX from a sum of elements perspective.
This kind of sum-of-factor approach will be problematic when concerning UX analysis. And one more thing is that user is active from the beginning, they start already with deciding which things are important in the first place. No matter how much tried to design for all users, there is an idiosyncratic experience which is shaped by the meaning that the user gives to an interaction which varies from each user.
The sum-of-factor approach definitely does not consider this active meaning-giving role of the user.

57
5.2.2 The cultural probe methods The cultural probe method provides a qualitative method for assessing UX
without decomposing the experience, it provides a general overview of local user’s opinions and views, but the formal analysis of results of the probes is very difficult and highly subject to creativity of the researcher.
5.2.3 The Narration and Storytelling Approach
As discussed in section 5.2.1, before being able to understand the UX, it is
essential to understand which meaning users give to interactions and what the context of generation of this meaning is. Meaning is created in a social and communication process, it is also relational, it is in the relation between the user and the product that meaning is given. It is subjective, thus, meaning is not expressed in any other way than through direct communication.
Geven (2006) advocates a new approach to capture holistic nature of experience, by using an interview style. It is narration and storytelling.
The author suggests that in a narrative interview, users will be asked to narrate stories about situations in which they interact with a product and elaborate on the precise circumstances under which the situation occurred. How they feel during the experience, etc. The aim is to create as complete a picture as possible. Here it is important to bring people really relive the experience including the related emotions that came up at the moment of the experience.
The author conducted a case study to practice the narrative method, and concluded the findings as lessons learned from the case study. It was found that narrative interviews mostly can teach a lot about UX with current technologies in a real setting filled with context information. Although it is not a perfect solution, it is a method gives a holistic view on UX that can complement the knowledge which has been gained so far.
5.2.4 Emotion evaluation Approach
One current approach to evaluate UX is to evaluate users’ emotional responses to
product usage by measuring their arousal states. Desmet (2003) developed an instrument named the Product Emotion
Measurement instrument (PrEmo) to measure emotions, the development was an iterative design process, it takes five years and six versions have been created, each subsequent version was designed to correct the flaws of the previous one. The author claims that at present most favored definition of emotion is “Emotions are best treated as a multifaceted phenomenon consisting of the following components: behavioral reactions (e.g. approaching), expressive reactions (e.g. smiling), physiological reactions (e.g. heart pounding), and subjective feelings (e.g. feeling amused)”.
Today’s instruments range form simple pen-and-paper rating scales to high-tech equipment that measures brain waves or eye movements. And these instruments can be mainly categorized into non-verbal and verbal instruments.
Desmet (2003) concludes that non-verbal instruments mainly measure expressive or physiological component of emotion. Such as the Facial Action Coding System (FACS) developed by Ekman & Friesen (1978); the Maximally Discriminative Facial Moving Coding System (MAX) developed by Izard (1979) and the Facial Expression Analysis Tool (FEAT) developed by Kaiser & Wehrle (2001), they are facial expression instruments. And vocal instruments are just like facial expression instruments that link patterns of vocal cues to emotions (Johstone & Scherer, 2001). Emotions show a variety of physiological aspects that can be measured with different techniques. Such as instruments that measure blood pressure responses, skin responses,

58
papillary responses, brain waves and heart responses. One example is IBM’s emotion mouse (Ark, Dryer, & Lu 1999), with the instruments, computers can gather multiple physiological signals while a person is experiencing an emotion, and learn which pattern is most indicative of which emotion. As non-verbal instruments are language-independent, so it can be used in different cultures. This kind of instruments is less subjective because they do not rely on the participants’ own assessment of the emotional experience. But the main limitation of this kind of instruments can only reliably assess a limited set of emotions, and can not assess mixed emotions. This limits its usage.
This limitation can be overcame by verbal self-report instruments which assess the subjective feeling component of emotions. It requires respondents to report their emotions with the use of a set of rating scales or verbal protocols. The advantage of this kind of instruments is that rating scales can be assembled to represent any set of emotions, and can be sued to measure mixed emotions, but the limitation is that they are difficult to apply between cultures.
To overcome this problem, a handful of non-verbal self-report instruments have been developed that use pictograms instead of words to represent emotional responses. Respondents can point out the puppets that in their opinion best portray their emotion. But this kind of instrument still have limitation, they do not measure distinct emotions but only generalized emotional states.
This limitation provides the trigger to develop a new instrument which can measure distinct and mixed emotions but does not require the participants to verbalize their emotions.
Ettcoff and Magee (1992) showed that in some cases facial expression provides a means of communicating emotions that are even more effective than verbal expression; this interpretation skill was the starting point for the development of PrEmo.
PrEmo is a non-verbal self-report instrument that measures 14 emotions that are often elicited by product design. The respondents can report their emotions with the use of expressive cartoon animations; each of the 14 measured emotions is portrayed by an animation by means of dynamic facial, bodily, and vocal expressions. Figure 5 shows an example of the instrument interface.
Figure 5: Product Emotion Measurement instrument interface

59
During an experiment, the respondents are first shown a picture of a product and
subsequently instructed to use the animations to report their emotions evoked by the product, they must ask themselves the following question when viewing an animation, “Does this animation express what I feel? ” then they can use the three-point scale to answer the question.
The author decided to use a cartoon character because it is often particularly efficient in portraying emotions. The unique strength of PrEmo is that it combines two qualities, that is, it measures distinct and mixed emotions and it can be used cross-culturally.
The operation requires neither expensive equipment nor technical expertise. Meanwhile, the measurement task with PrEmo is pleasant or enjoyable.
The limitation of PrEmo is that the 14 measured emotions represent a cross-section of emotions experienced towards static product design but not dynamic human product interaction. Some emotions may be over-represented while others may be missing.
Frijda and Schram (1995) stated that art often elicits paradoxical emotions, that is, positive and negative emotions simultaneously, and that is precisely these paradoxical emotions that we seek enjoy. In the word of Frijda (1995) “we enjoy watching tragic miseries, and we pay fair amounts of money to suffer threat and suspense.” Hence, it is not correct to relate fun only to pleasant emotions. It may be interesting for further research to investigate possibilities of designing such paradoxical emotions.
5.2.5 Questionnaire Approach
As section 5.1.3 discussed, Hassenzahl (2003) suggested a model which distinguishes between pragmatic and hedonic quality aspects and suggested an according questionnaire to measure both quality perceptions.
5.3 Second part of FOUUX: a consolidated framework-UX part
The UX aspects and components which influence UX are summarized in FOUUX (see Table 10)

60
Table 10: FOUUX: User Experience aspects and components
FOUUX: UX aspects Pragmatic aspects (behavioral level) Usability; functionality; reliability; complexity
Visual / Industrial design Beauty; Attractiveness
Psychology Challenge; Stimulation; Fun; Coolness; Sexiness; Self-esteem; Pleasure; Pride; Surprise; Joy; Intimacy; Identification
Hedonic aspects (visceral level and reflective level)
Marketing research The successful delivery of a brand proposition
The components which influence UX
UX components Related set of attributes characteristics
Products involved Objects involved Services involved Infrastructure involved
System
People involved
Functionality; Usability; Reliability; Complexity; Purpose.
Physical context
Everything we can see or feel, namely the tangible physical surroundings and their movement, temperature, rain or humidity and lighting, current location and noises
Social context Expectations and influence that other people have for the user.
Temporal context The time period that the user is able to dedicate for the system given the context restrictions
Context
Task context. The user may also have several ongoing tasks at the same time.
Needs (For example, accessing favorite web sites) Resources (Mental, Physical) Emotional state (For example, if the user is in bad mood, he/she might be less patient to the system, and the UX is easily poor.)
User
Earlier Experiences & Expectations

61
6 RELATIONSHIP BETWEEN USABILITY & UX This chapter provides a brief discussion of the relations between Usability and UX
based on this thesis study. First of all, Usability strongly focuses on Users’ tasks and their accomplishment
that is Pragmatic side of the user product relationship while UX takes a more holistic approach, aiming for a balance between pragmatic aspects and hedonic aspects of product possession and use such as beauty, challenge, stimulation, or self-expression (Hassenzahl, 2006).
Secondly, Usability takes an objective view of quality, the hallmark of usability testing methods primarily rests on observation or measurement when participants interact with a product, and it is based on judgment on observations of product use rather than on opinion even though evaluating user satisfaction is one approach to capturing subjective aspects of usability. While UX is subjective, it may not matter how good a product is objectively, its quality must also be “experienced” subjectively to have impact. And how people perceive the quality during experiencing interacting with the product subjectively can be influenced by several aspects which are discussed in section 5.1.3.
Finally, Usability traditionally focuses on barriers, problems, frustration, stress and other negative aspects, and their removal. While UX often stresses the importance of positive outcomes of technology use or possession, be it positive emotions such as joy, pride, and excitement or simply “value” (Cockton, 2004).

62
7 USABILITY & UX CHALLENGES THAT CURRENTLY MOBILE INDUSTRY MEET
Mobile industry is growing rapidly. .The most important goal for mobile industry is to provide consumers with a usable and reliable product which meets their expectations and evokes a satisfying experience. As the authors who write the inside information report: Usability and User Research at UIQ Technology say that they have noticed User experience is surfacing as the factor that determines success or failure on the market. Consumers will insist on satisfaction. Phones that do not fulfill the high expectations of the users will no longer be able to compete in the market.
In the experience economy, people no longer buy a brand new fancy mobile phone solely on its great functionality or usability. As Hans-Christan Jetter & Jens Gerken (2006) mentioned, people buy the experience of being a part of social and professional life, they buy the experience of being spatially independent and able to plan and communicate spontaneously, they buy the experience of feeling informed anytime and anyplace by novel nomadic applications and information services, they buy the experience of being admired for their trendy but sensible choice of technological tools, and some also buy the experience of being recognized as a technology connoisseur. These individual experiences are summed up in total as UX that has become crucial for commercial success today. Apple iPod MP3 players with a market share of over 90% in US market are a vivid example. How design and marketing can lead to a positive UX that can even compensate serious disadvantages of a product provides a big challenge to current mobile industry.
The increasing hardware and software capacities of mobile phones are transforming from simple voice communication devices to increasingly complex carriers of computing and data services such as messaging, e-mail, Web access and etc.
Designing is becoming increasingly challenging with number of functions and reduction of the size of the phones, the ever shortening life of the phones resulting in less time for development.
An empirical research case study conducted by Virpi Roto (2006) from Nokia research center, the research aimed to improve UX of web browsing on mobile phones; it proposed some interesting aspects of mobile web browsing for UX researchers. It is briefly summarized as follows:
1. Mobile browsing requires a mobile device, browser, connection, and a web site, each of these is typically provided by a different party, and each party may aim to deliver conflicting experiences.
2. Mobile context provides an interesting context of use for web browsing. 3. Mobile phone is a very personal device that users have an emotional relation to. 4. Mobile browsing should fulfill both utilitarian (find a specific piece of
information) and hedonic (entertainment while waiting) needs. 5. Mobile web browsing may have complex billing models 6. Because mobile browsing technology is immature, each component is clearly
invisible when evaluating UX. Jones (2006) also mentioned one of the important challenges in mobile web
browsing is how to present navigation elements to optimize the browsing capabilities. And some people do not use mobile for web browsing, as they concerned about the cost, speed and believed browsing web on mobile will not be comfortable and convenient.
Mobile phones are consumer products, it should give users a satisfying experience, otherwise, it will not retain its place on the market. Meanwhile, mobile phones with

63
advanced technology are quickly moving into high-volume market; it must have higher degree of Usability and UX as users’ expectations are growing.

64
8 TEST THE FRAMEWORK ON AN INDUSTRY SHARE CASE 8.1 Introduction of the organization
Adduce AB is a Swedish usability consultancy. It is located in Karlskrona. The company is established at the beginning of the year 2009. There are five employees work for the company. The company mainly provides four parts of services, namely, Adduce Research; Adduce Studios; Adduce Consulting and Adduce Courses. The research part focuses on developing the Adduce toolbox, which is possible for clients to drive, prove and maintain a high-level of usefulness in their products. Adduce Studio mainly works on producing fun and innovative mobile applications and games. And finally, the company also offers expert consultancy in the area of usability, user experience, product management and software development.
8.2 Introduction of the project
This thesis study conducted a case study of Usability & UX evaluation based on this Fitness application installed on iPod 8GB product, model number: A1288.
Through the case study, following research questions can be answered: 1> What kind of use cases can be developed for this application? 2> How to customize the questions and measures which are collected
from the FOUUX framework for this application? 3> How to design test procedure? 4> How to conduct the test? 5> How to collect test data and analyze the results? 6> How to present the test results and provide suggestions for the
company for further improvement? The Fitness application is a new application which is being developed by Adduce
AB for iPod products, and it will be released from Adduce and will be available on App store.
The main purpose of developing this application is to help people to keep fit and healthy by controlling daily calories gaining and burning amount.
Based on the personal information including age, height, weight and gender, the application can calculate your BMI figure and recommend a plan to reduce weight in a healthy manner.
User can add meals and activities daily, and the application will provide live information regarding your current status and your target.
All journal records are kept for user’s reference since the program is set. And the target weight or program duration can be customized by user.
Some interface screen displays of this application are listed as follows, and it is permitted by CEO Mats Hellman from Adduce AB.

65
Figure 6: Main screen
Figure 7: Today’s information
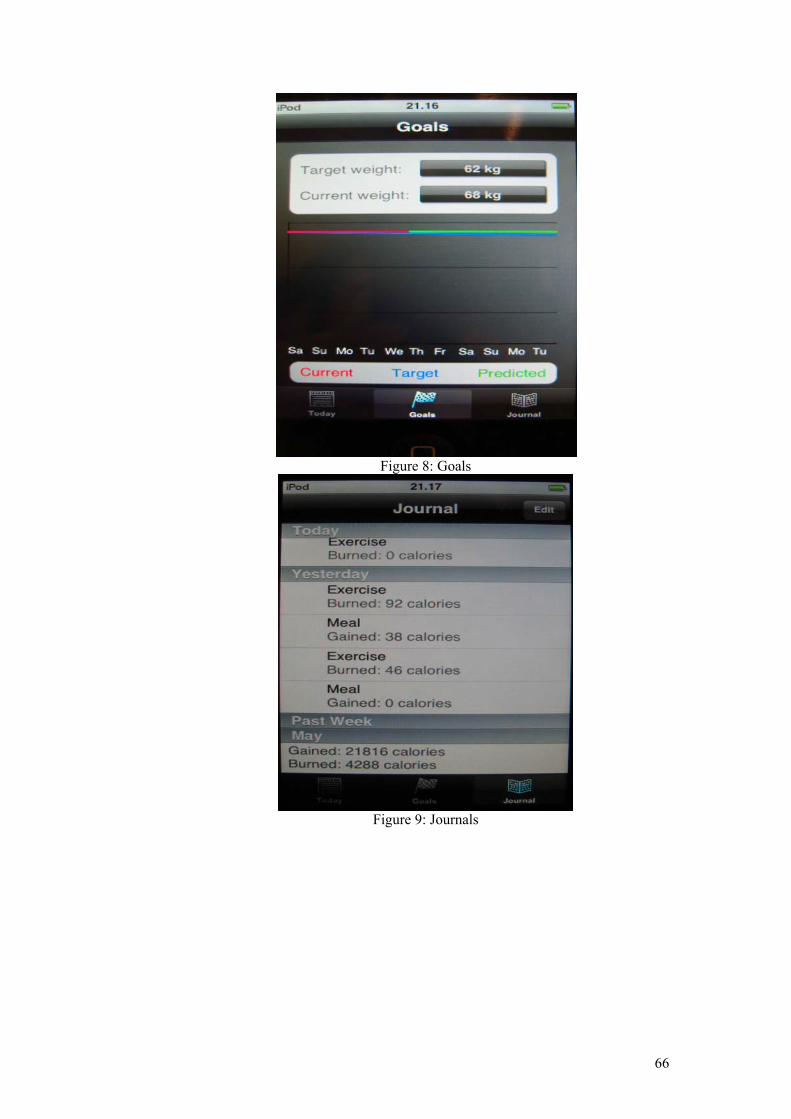
66
Figure 8: Goals
Figure 9: Journals

67
Figure 10: Add meal
Figure 11: Add activity

68
Figure 12: Personal information
Figure 13: Program plan

69
8.3 Case study conduct 8.3.1 Develop test procedure
The first step of the case study is to develop a Usability & UX test procedure. The idea of designing test procedure is inspired from the UTUM (UIQ Technology
Usability Metrics) which is developed by the UIQ Technology. The development of UTUM considerably and continuous involves researchers
from the Blekinge Institute of Technology, Dr. Kari Rönkkö and Ph.D. student Jeff Winter.
UIQ Technology was founded to provide world-leading handset manufactures with a software platform for Symbian OS. They need to provide an open, powerful and flexible platform for handsets with a variety of form factors and interaction styles, for a relatively small company with limited resources, this is a big challenge. They need to find a way to work smarter, and UTUM is developed as the method accordingly.
UTUM has four distinctive characteristics, the first two are related to getting good user input, the aim is to work side-by-side with users and jointly design phones that work for them. The other two distinctive characteristics deal with using the input in such a way that it has an impact on the platform both immediately and in the long run.
Test experts form UIQ Technology take on the role of user ombudsman to promote user interests in the development of the UIQ software platform.
The main flow of UTUM can be described as follows: 1> Decide what to test. This step includes deciding user group first and then the most important functions for the user group. 2> Test a use case. Use cases are selected from a collection of about 50 use cases which have put together to cover the functions which are most important to users. Each use case is expressed as a concrete task. When the task is being worked through, tester is encouraged to think aloud, and this gives test expert insight. 3> Assess Effectiveness and Efficiency. When tester finished each use case, he or she is required to fill in a form with six statements using Likert-type scale assessment, meanwhile, test expert fills in a similar Likert-type scale assessment with four statements based on observing how tester uses the phone to execute the tasks. All together, 10 responses from these 10 statements express a position on the statement “This phone provides an effective way of completing the given task.” Efficiency is evaluated by test expert via the time clocked to complete the task and the test expert’s perception of how efficient the phone is for this tester in this test situation. 4> Assess total Usability. When all use cases are conducted, tester is required to fill in a SUS questionnaire. 5> Post Analysis. After finishing the whole session of test, test expert compiles the notes taken and talks to the interaction Architect about the difficulty he or she found during test regarding the tester. Then test expert enters the numerical data from all of the evaluations into the test database.
8.3.1.1 Develop Usability & UX evaluation documents
Before designing test procedure of the case study, it took several days to be familiar with the Fitness application.
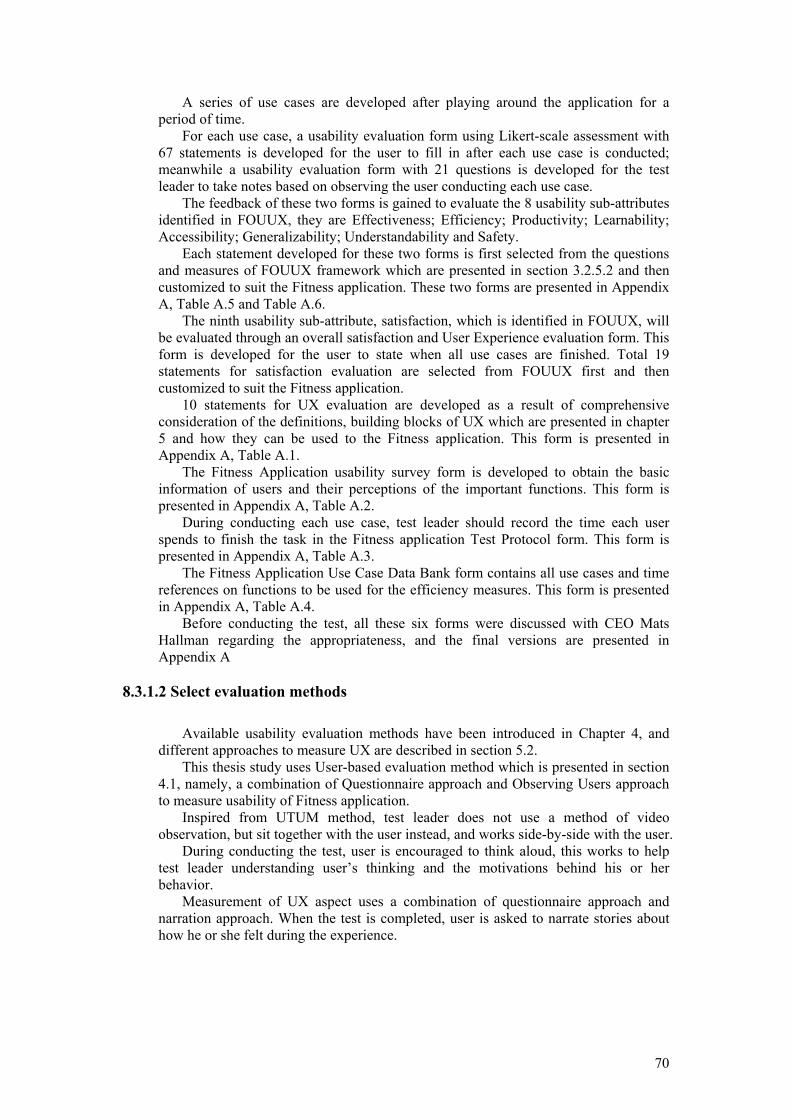
70
A series of use cases are developed after playing around the application for a period of time.
For each use case, a usability evaluation form using Likert-scale assessment with 67 statements is developed for the user to fill in after each use case is conducted; meanwhile a usability evaluation form with 21 questions is developed for the test leader to take notes based on observing the user conducting each use case.
The feedback of these two forms is gained to evaluate the 8 usability sub-attributes identified in FOUUX, they are Effectiveness; Efficiency; Productivity; Learnability; Accessibility; Generalizability; Understandability and Safety.
Each statement developed for these two forms is first selected from the questions and measures of FOUUX framework which are presented in section 3.2.5.2 and then customized to suit the Fitness application. These two forms are presented in Appendix A, Table A.5 and Table A.6.
The ninth usability sub-attribute, satisfaction, which is identified in FOUUX, will be evaluated through an overall satisfaction and User Experience evaluation form. This form is developed for the user to state when all use cases are finished. Total 19 statements for satisfaction evaluation are selected from FOUUX first and then customized to suit the Fitness application.
10 statements for UX evaluation are developed as a result of comprehensive consideration of the definitions, building blocks of UX which are presented in chapter 5 and how they can be used to the Fitness application. This form is presented in Appendix A, Table A.1.
The Fitness Application usability survey form is developed to obtain the basic information of users and their perceptions of the important functions. This form is presented in Appendix A, Table A.2.
During conducting each use case, test leader should record the time each user spends to finish the task in the Fitness application Test Protocol form. This form is presented in Appendix A, Table A.3.
The Fitness Application Use Case Data Bank form contains all use cases and time references on functions to be used for the efficiency measures. This form is presented in Appendix A, Table A.4.
Before conducting the test, all these six forms were discussed with CEO Mats Hallman regarding the appropriateness, and the final versions are presented in Appendix A
8.3.1.2 Select evaluation methods
Available usability evaluation methods have been introduced in Chapter 4, and
different approaches to measure UX are described in section 5.2. This thesis study uses User-based evaluation method which is presented in section
4.1, namely, a combination of Questionnaire approach and Observing Users approach to measure usability of Fitness application.
Inspired from UTUM method, test leader does not use a method of video observation, but sit together with the user instead, and works side-by-side with the user.
During conducting the test, user is encouraged to think aloud, this works to help test leader understanding user’s thinking and the motivations behind his or her behavior.
Measurement of UX aspect uses a combination of questionnaire approach and narration approach. When the test is completed, user is asked to narrate stories about how he or she felt during the experience.
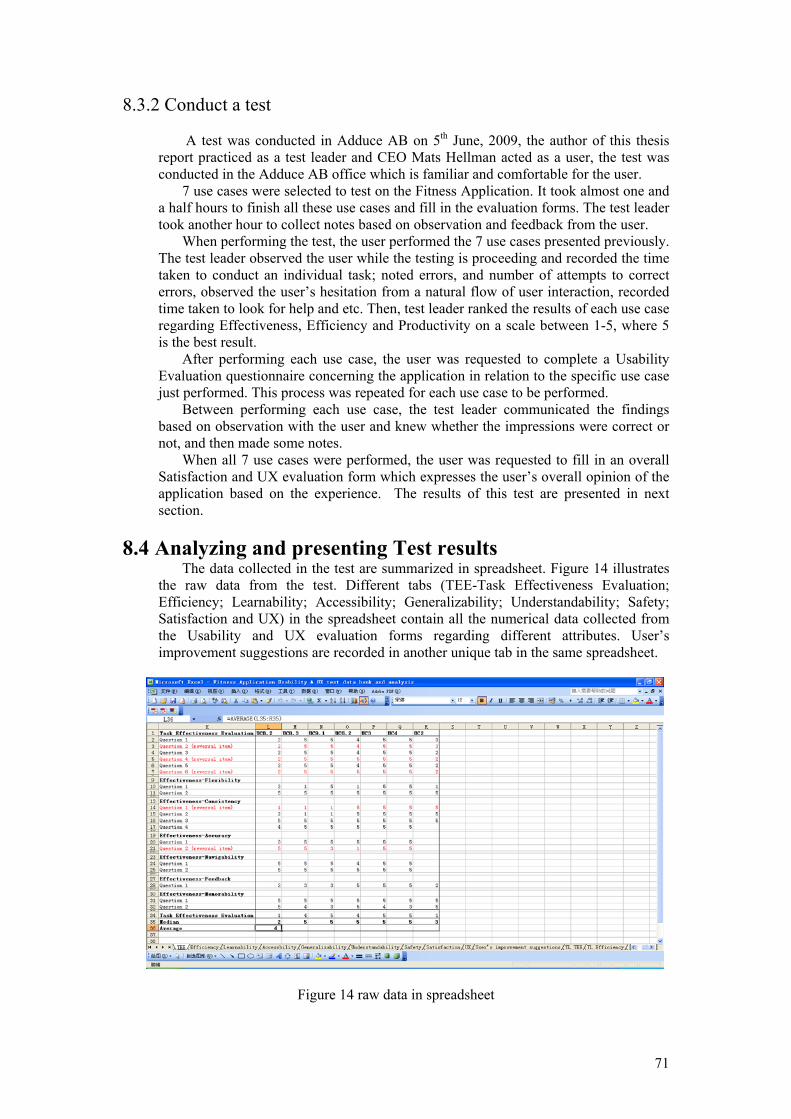
71
8.3.2 Conduct a test
A test was conducted in Adduce AB on 5th June, 2009, the author of this thesis report practiced as a test leader and CEO Mats Hellman acted as a user, the test was conducted in the Adduce AB office which is familiar and comfortable for the user.
7 use cases were selected to test on the Fitness Application. It took almost one and a half hours to finish all these use cases and fill in the evaluation forms. The test leader took another hour to collect notes based on observation and feedback from the user.
When performing the test, the user performed the 7 use cases presented previously. The test leader observed the user while the testing is proceeding and recorded the time taken to conduct an individual task; noted errors, and number of attempts to correct errors, observed the user’s hesitation from a natural flow of user interaction, recorded time taken to look for help and etc. Then, test leader ranked the results of each use case regarding Effectiveness, Efficiency and Productivity on a scale between 1-5, where 5 is the best result.
After performing each use case, the user was requested to complete a Usability Evaluation questionnaire concerning the application in relation to the specific use case just performed. This process was repeated for each use case to be performed.
Between performing each use case, the test leader communicated the findings based on observation with the user and knew whether the impressions were correct or not, and then made some notes.
When all 7 use cases were performed, the user was requested to fill in an overall Satisfaction and UX evaluation form which expresses the user’s overall opinion of the application based on the experience. The results of this test are presented in next section.
8.4 Analyzing and presenting Test results
The data collected in the test are summarized in spreadsheet. Figure 14 illustrates the raw data from the test. Different tabs (TEE-Task Effectiveness Evaluation; Efficiency; Learnability; Accessibility; Generalizability; Understandability; Safety; Satisfaction and UX) in the spreadsheet contain all the numerical data collected from the Usability and UX evaluation forms regarding different attributes. User’s improvement suggestions are recorded in another unique tab in the same spreadsheet.
Figure 14 raw data in spreadsheet

72
The spreadsheet includes another three tabs (TL TEE- Test Leader Task Effectiveness Evaluation; TL Efficiency-Task Leader Efficiency and TL Productivity- Test Leader Productivity) which illustrate the findings recorded by the test leader based on observation of the test. These three tabs include some qualitative data as knowledge possessed by the test leader. Figure 15 illustrates one example tab.
Figure 15: Test leader’s feedback collection based on observation To analyze Learnability, Accessibility, Generalizability, Understandability, Safety,
Satisfaction, UX and Productivity, median value is calculated for each use case based on the Likert scale data, and then an average score is calculated from the 7 median values as the final score of relative attribute. Table 11 illustrates the raw data and calculation result of Learnability evaluation. The explanation will be provided following the table.

73
Table 11: Raw data and calculation results of Learnability evaluation Learnability Evaluation
Learnability-Minimal
action UC8.2 UC8.3
UC9.
1
UC6.
2 UC3 UC4 UC2
Question 1 5 5 5 5 5 5 5
Question 2 5 5 5 5 5 5 3
Learnability-Minimal
memory load
Question 1 3 4 5 5 3 3
Question 2 5 5 5 5 5 5
Learnability-User
Guidance
Question 1 4 3 3 3 2
Learnability-Self-
Descriptiveness
Question 1 2 5 5 5 5 5 3
Question 2 1 5 5 5 5 5 2
Question 3 5 3 5 4 5 5 2
Learnability-Simplicity
Question 1 (reversal
item) 5=>1 1=>5 1=>5 1=>5 1=>5 1=>5 5=>1
Question 2 5 5 5 5 5 5 5
Question 3 5 5 4 4 5 3 3
Question 4 1 5 5 5 5 5 1
Question 5 (reversal
item) 2=>4 3 3 5=>1 1=>5 1=>5 3
Question 6 (reversal
item) 1=>5 1=>5 1=>5 1=>5 1=>5 1=>5 2=>4
Learnability-
Navigability
Question 1 2 3 3 5 5 3 2
Learnability-
Memorability
Question 1 4 4 4 5 5 4 4
Median 4 5 5 5 5 5 3Average 5
All numerical data are collected from usability evaluation questionnaires filled by
the user. There are some questions marked with reversal item in Table 11, it is because of the corresponding statement is written in a negative manner, it is reversed in meaning from the overall direction of the scale, that’s why it is necessary to reverse the response value for each of these items before calculating the result. That is, if the respondent gave a 1, it should make it a 5; if he or she gave a 2, then make it a 4; 3=3;
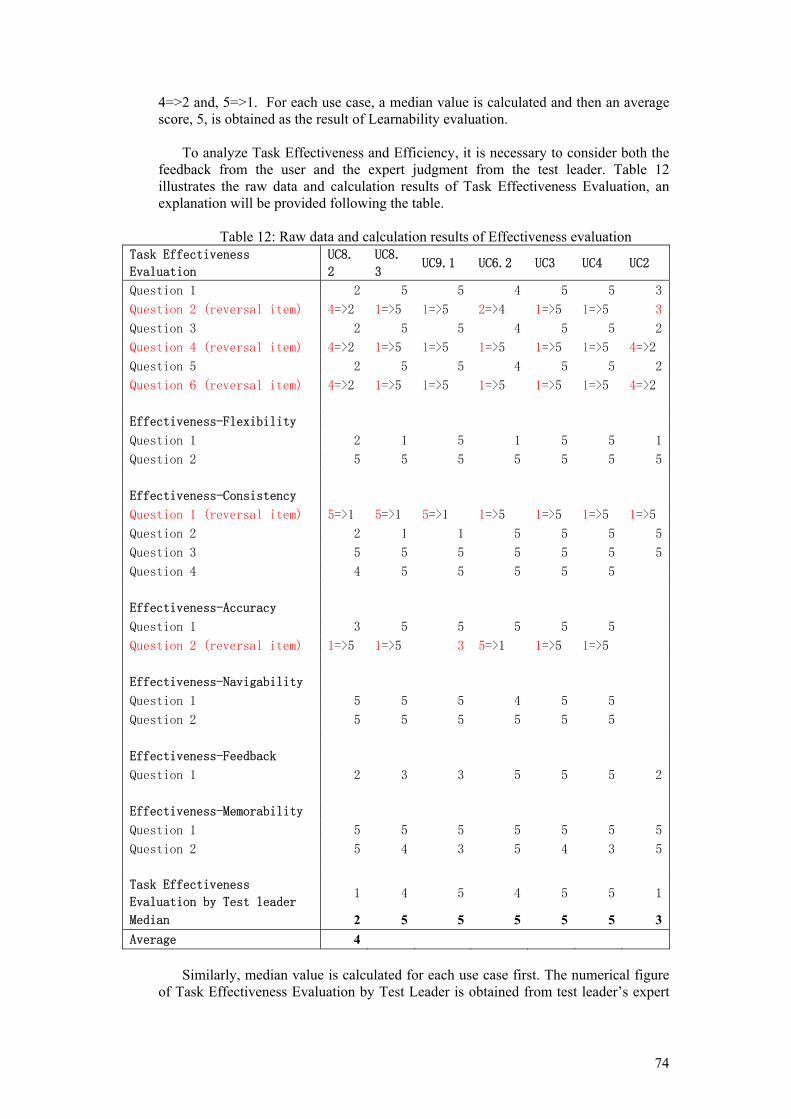
74
4=>2 and, 5=>1. For each use case, a median value is calculated and then an average score, 5, is obtained as the result of Learnability evaluation.
To analyze Task Effectiveness and Efficiency, it is necessary to consider both the
feedback from the user and the expert judgment from the test leader. Table 12 illustrates the raw data and calculation results of Task Effectiveness Evaluation, an explanation will be provided following the table.
Table 12: Raw data and calculation results of Effectiveness evaluation
Task Effectiveness
Evaluation
UC8.
2
UC8.
3 UC9.1 UC6.2 UC3 UC4 UC2
Question 1 2 5 5 4 5 5 3
Question 2 (reversal item) 4=>2 1=>5 1=>5 2=>4 1=>5 1=>5 3
Question 3 2 5 5 4 5 5 2
Question 4 (reversal item) 4=>2 1=>5 1=>5 1=>5 1=>5 1=>5 4=>2
Question 5 2 5 5 4 5 5 2
Question 6 (reversal item) 4=>2 1=>5 1=>5 1=>5 1=>5 1=>5 4=>2
Effectiveness-Flexibility
Question 1 2 1 5 1 5 5 1
Question 2 5 5 5 5 5 5 5
Effectiveness-Consistency
Question 1 (reversal item) 5=>1 5=>1 5=>1 1=>5 1=>5 1=>5 1=>5
Question 2 2 1 1 5 5 5 5
Question 3 5 5 5 5 5 5 5
Question 4 4 5 5 5 5 5
Effectiveness-Accuracy
Question 1 3 5 5 5 5 5
Question 2 (reversal item) 1=>5 1=>5 3 5=>1 1=>5 1=>5
Effectiveness-Navigability
Question 1 5 5 5 4 5 5
Question 2 5 5 5 5 5 5
Effectiveness-Feedback
Question 1 2 3 3 5 5 5 2
Effectiveness-Memorability
Question 1 5 5 5 5 5 5 5
Question 2 5 4 3 5 4 3 5
Task Effectiveness
Evaluation by Test leader 1 4 5 4 5 5 1
Median 2 5 5 5 5 5 3Average 4
Similarly, median value is calculated for each use case first. The numerical figure
of Task Effectiveness Evaluation by Test Leader is obtained from test leader’s expert
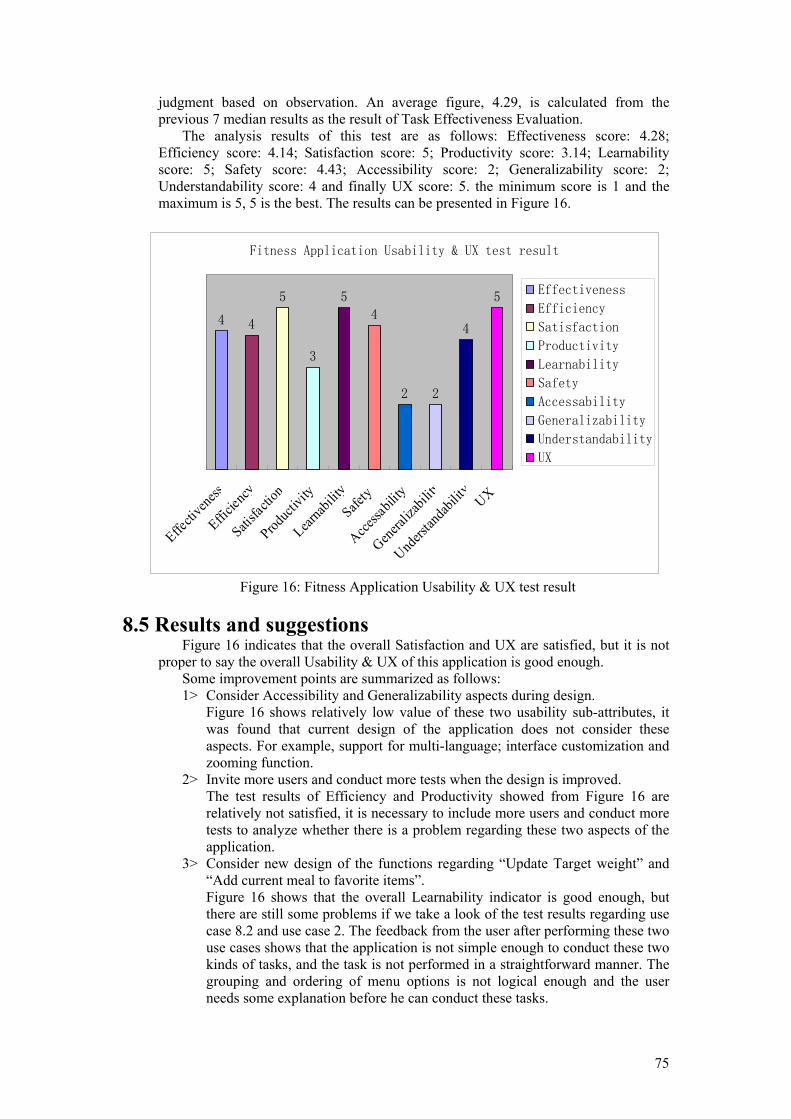
75
judgment based on observation. An average figure, 4.29, is calculated from the previous 7 median results as the result of Task Effectiveness Evaluation.
The analysis results of this test are as follows: Effectiveness score: 4.28; Efficiency score: 4.14; Satisfaction score: 5; Productivity score: 3.14; Learnability score: 5; Safety score: 4.43; Accessibility score: 2; Generalizability score: 2; Understandability score: 4 and finally UX score: 5. the minimum score is 1 and the maximum is 5, 5 is the best. The results can be presented in Figure 16.
Fitness Application Usability & UX test result
4 4
5
3
5
4
2 2
4
5
Effecti
veness
Efficien
cy
Satisfa
ction
Product
ivity
Learnab
ilitySafe
ty
Accessa
bility
General
izabil
ity
Unders
tandab
ility
UX
Effectiveness
Efficiency
Satisfaction
Productivity
Learnability
Safety
Accessability
Generalizability
Understandability
UX
Figure 16: Fitness Application Usability & UX test result
8.5 Results and suggestions
Figure 16 indicates that the overall Satisfaction and UX are satisfied, but it is not proper to say the overall Usability & UX of this application is good enough.
Some improvement points are summarized as follows: 1> Consider Accessibility and Generalizability aspects during design.
Figure 16 shows relatively low value of these two usability sub-attributes, it was found that current design of the application does not consider these aspects. For example, support for multi-language; interface customization and zooming function.
2> Invite more users and conduct more tests when the design is improved. The test results of Efficiency and Productivity showed from Figure 16 are relatively not satisfied, it is necessary to include more users and conduct more tests to analyze whether there is a problem regarding these two aspects of the application.
3> Consider new design of the functions regarding “Update Target weight” and “Add current meal to favorite items”. Figure 16 shows that the overall Learnability indicator is good enough, but there are still some problems if we take a look of the test results regarding use case 8.2 and use case 2. The feedback from the user after performing these two use cases shows that the application is not simple enough to conduct these two kinds of tasks, and the task is not performed in a straightforward manner. The grouping and ordering of menu options is not logical enough and the user needs some explanation before he can conduct these tasks.

76
Use case 8.2 and Use case 2 also shows very low task Effectiveness value, based on test leader’s observation, the main problem related to the failure of conducting these two tasks is related to the design of task flow. It is not clear enough for a user to know how to start at the beginning, and the instruction or warning message does not provide useful suggestions. Feedback of Understandability evaluation regarding these two use cases shows relatively low values as well, the user find that it is not easy to understand how to input data and what will be provided as output by using this application to perform these two tasks, the items and information are not grouped logically, and the information is not presented in a way that matches how the user view solving the problem. The user also feels the sequence of screens is confusing
4> Check calculation accuracy of adding activity function. Figure 16 shows the overall safety factor is acceptable, but test result of Use case 9.1 indicates a necessity to check the calculation accuracy.
5> Consider new presentation methods of the graph “Trend map of current weight versus target weight” and the overview of “Today’s Target and current program status” Though the overall Understandability indicator is acceptable, it is suggested to consider new design as discussed in point 3>. Current presentation of “Trend map of current weight versus target weight” and the overview of “Today’s Target and current program status” is understandable, but the feedback of Use case 8.2, Use case 4 and Use case 2 shows that the presentation is not clear and attractive enough, there is still a room to improve.
6> Consider new design of specific components of the application. The icons of activities are not clear and attractive enough, it might be improved. When conducting Use Case 8.3, test leader find that the user spend some time looking for the food item “cooking oil”, it is currently categorized under “snacks” and this category is not proper enough, it is suggested to add a new category for this kind of items.
7> Consider to add a function regarding “Add favorite activities” for user’s convenience.
Above conclusions and suggestions are described based on the analysis result of
this test session, and it might be helpful for the company to consider during improvement of the design.
The case study itself provides a good chance to apply the FOUUX framework on a specific case, namely, the Fitness application which is being developed by Adduce AB for iPod products.
This practice makes it clear to know how to go through a whole Usability and UX evaluation procedure. From the initial test documents and procedure design, arranging and performing a real test and till the postpone data analysis and presentation methods design.
CEO Mats Hellman suggested to consider both positive and negative manner when writing the evaluation questionnaire and to further consider how to control one single test session within the time frame of one hour. He mentioned that a user can only focus one hour basically, based on his experience.
8.6 Expert evaluation This case study has some weaknesses in the sense that only one usability and user
experience test of the framework was conducted followed up by one expert evaluation. Hence we have a bias and validity threat here for the case study as the results were analyzed and reported based on such limited data collection. On the other hand the

77
study is strong in when it comes to conclusion validity, i.e. the degree to which conclusions we reach about relationships in our data are reasonable among professionals in the domain of Usability and UX.
The focus of the study was to provide overview of the today so widespread area of Usability and UX, and based on that overview produce one coherent collection of relevant attributes and sub-attributes for measurement and evaluation. The user in the performed test has ten years of professional work experience of usability research and test related to the following four different roles: usability researcher, test leader, interaction design manager, and product strategy manager. One of the participants in the expert evaluation have five years of work experience as usability researcher and test leader, and the second has eight years of experience of method cooperation with industry (Dittrich, et al., 2008) focusing usability, which was a substantial part of his associate professorship application. All three have experience of successfully developing a usability test framework that became de facto standard in industry with more than 350 employees (Rönkkö, et al.,2009). One important result from the usability evaluation was the need to further categorize the use cases according to their relationship to the specific aspects of Usability and domain, and that the questions can benefit from being split according to the chosen use cases. This work needs to be done iteratively by applying industry.

78
9 CONCLUSIONS AND FUTURE WORK
This thesis study has contributed in identifying a consistent and consolidated framework for usability and user experience testing (FOUUX) which is aimed for small telecom companies.
This framework has provided unified terminology for usability attributes, sub-attributes and measures, it incorporates different viewpoints on usability and its measurement in a consistent and uniform way, and it is a basis for understanding various usability measures and a common terminology between different stakeholders of software development.
This framework can help developers or testers who may not be already familiar with usability measures to create a concrete usability measurement plan for different types of applications. It serves as a guideline for tracing and interpreting the data collected on usability of products. The collection of data to calculate various usability measures can eventually lead to better decisions by those responsible for software development, whether they are software engineers, team managers or usability engineers.
User Experience is an intriguing notion which has been widely disseminated and is increasingly accepted in the Human-Computer Interaction (HCI) community. But without clearly defined or well understood, this notion is still open and debatable.
This thesis study has contributed in collecting different definitions and evaluation methods through reviewing currently published literature regarding UX issue, the aim is to take a small step towards a shared definition of User Experience.
A brief discussion of the relations between Usability and UX has been provided and usability evaluation methods which are common in literature are summarized based on this thesis study.
The case study provides a chance to apply the FOUUX framework on a specific case, namely, the Fitness application which is being developed by Adduce AB for iPod products. The case study has contributed in developing test procedure and questionnaires for usability and user experience testing regarding this application; finding problems of current design of the application and providing further improvement suggestions for the company. It has also contributed in providing a consolidated framework of usability and user experience for the company to consider when developing and testing software products.
Mobile industry is growing rapidly. The most important goal for mobile industry is to provide consumers with a usable and reliable product which meets their expectations and evokes a satisfying experience. In the experience economy, people no longer buy a brand new fancy mobile phone solely on its great functionality or usability. They buy a product because of different experiences, and these individual experiences are summed up in total as UX that has become crucial for commercial success today. To define a shared notion of User Experience is a work which is remained to be done in the future. UX part is still immature and there are still many factors can be studied in the future. It might be interesting to discover ways to improve adapting the test to UX and using data to show the presence and absence of good UX.
Based on an interview with CEO Mats Hellman and Usability Expert Mårten Ahlberg, it is found that in industry there is a notice of importance of addressing context of use regarding usability measurement. But in most case, usability measurement is still put in the late stage of software product development, how to shift it to the early stage of development life cycle is a work which is remaining to be done in the future.
It is suggested to further categorize the use cases according to their relationship to the specific aspects of Usability, then split questions according to the categorized use

79
cases. The questionnaire can be iterated for further tests in a long run, and the most proper questions can be sorted out in the end. It is good to conduct more tests based on both old and new version of design by another test leader with same six to eight users, it will be helpful to obtain more valuable data to analyze and get unbiased opinions.
To round off this thesis, I would like to thank all of the people who have helped and made this thesis possible.
80
10 REFERENCES
Arhippainen, L., Tähti, M. 2003, Empirical Evaluation of User Experience in Two Adaptive Mobile Application Prototypes. In: Proceedings of the 2nd International Conference on Mobile and Ubiquitous Multimedia, Norrköping, Sweden. Arjan Geven, J. S., Manfred T.,2006. Narrations and Storytelling as methodological key elements for studying user experience. Workshop on User Experience – Towards a Unified View. In conjuction with NordiCHI 2006 conference. Oslo, Norway. pp. 79-83. Ark, W., Dryer,D.C. & Lu, D.J., 1999. The emotion mouse, proceedings of HCI International ’99, Munich Germany. Axup, J., Viller, S., & Bidwell, N.,2005. Usability of a Mobile, Group Communication Prototype While Rendezvousin. CTS'05 International Symposium on Collaborative Technologies and Systems - Special Session on Mobile Collaborative Work, May 15-20. St. Louis, MO, USA. Baber,C., & Stanton,N., 1996. Observation as a technique for usability evaluation, In P.Jordan, B.Thomas, B. Weerdmeester, & I. McClelland (Eds.), Usability evaluation in industry, London: Taylor & Francis, pp. 85-94. Barker, R. T., & Biers, D. W., 1994. Software usability testing: Do user self-consciousness and the laboratory environment make any difference? Proceedings of the Human Factors Society, 38th Annual Meeting. Santa Monica, CA: Human Factors and Ergonomics Society. pp. 1131-1134. Bauersfeld, K., & Halgren, S., 1996. “You’ve got three days!” Case studies in field techniques for the time-challenged. In D. Wixon & J. Ramey (Eds.), Field methods casebook for software design, NY: John Wiley, pp.177-196. Basdogan, C., Ho, C., Srinivasan, M.A., Slater, M., 2000. An experimental study of the role of touch in shared virtual environments. ACM Transactions on Human–Computer Interaction 7 (4), pp. 443–460 Beevis,D., 1992, Analysis techniques for man-machine design, Brussels, Belgium: Defense Research Group. Bevan, Nigel and Macleod, Miles,1994: Usability Measurement in Context. In Behaviour and Information Technology, 13 (1) pp. 132-145 Bevan, Nigel, 1995. Human-Computer Interaction Standards. In: Proceedings of the Sixth International Conference on Human-Computer Interaction. pp. 885-890. Bevan, Nigel, 2001. International standards for HCI and usability. In International Journal of Human-Computer Studies, 55 (4) pp. 533-552. Branaghan, R. 1997, Ten tips for selecting usability test participants, Common Ground,7,3-6. Brickmore, T., Cassell, J., 2001. Relational agents: a model and implementation of building user trust. In: Proceedings of ACM Conference on Human Factors in Computer Systems. ACM Press, New York, NY, pp. 396–403

81
Brooke, J.,1996, SUS-A quick and dirty usability scale, Redhatch Consulting Ltd., UK. Cantani, M.B., & Biers, D.W., 1998, Usability evaluation and prototype fidelity: Users and usability prefessionals. Proceedings of the Human Factors Society, 42nd Annual Meeting, Santa Monica, CA: Human Factors and Ergonomics Society, pp.1331-1335. Card, S.K., Moran, T. P., & Newell, a., 1980, The keystroke-level model for user performance time with interactive systems, Communications of the ACM, 23, 396-410. Chin, J.P., Diehl, V.A., Norman, K.L., 1988. Development of an instrument for measuring user satisfaction of the human–computer interface. In: Proceedings of ACM Conference on Human Factors in Computing Systems. ACM Press, New York, NY, pp. 213–218. Chubb, G.P.,1981. SaINT, a digital simulation language for the study of manned systems, In J.Moraal & K.F.Kraas (Eds.), Manned system design,NY: Plenum, pp.153-179. Cockton, G.,Lavery, D., Woolrych, A., 2003. Inspection-Based Evaluations, In Sears, A., Jacko, Julie A., The human-computer interaction handbook: fundamentals, evolving technologies, and emerging applications, Lawrence Erlbaum Associates, Inc., Publishers, New Jersey. Cockton, G., 2004. From quality in use to value in the world. In Proceedings of the CHI 04 Conference on Human Factors in Computing Systems. Extended abstracts. New York, NY, pp. 1287-1290. Cockton,G., 2006. Valuing user experience, In Proceedings of the NordiCHI2006 Workshop"User Experience: Towards a Unified View", Oslo, Norway, pp.100-105. Creswell W., 2002, “Research Design - Qualitative, Quantitative and Mixed Method Approaches”, ISBN 0-7619-2442-6, Sage Publications. Cribbin, T., Chen, C., 2001. Exploring cognitive issues in visual information retrieval. In Proceedings of IFIP TC,13 International Conference on Human–Computer Interaction. IOS Press, Amsterdam, pp. 166–173 Czerwinski, M., Horvitz, E., Cutrell, E., 2001. Subjective duration assessment: an implicit probe for software usability? In: Proceedings of IHM-HCI 2001 Conference, vol. 2. Ce′ padue` s-Editions, Toulouse, France, pp. 167–170 Czerwinski, M.P., van Dantzich, M., Robertson, G., Hoffman, H., 1999. The contribution of Thumbnail image, mouse-over text and spatial location memory to web page retrieval in 3D. In: Proceedings of IFIP TC.13 International Conference on Human–Computer Interaction. IOS Press, Amsterdam, pp. 163–170 Desmet P.M.A., 2003. Measuring emotion: Development and application of an instrument to measure emotional responses to products. In M.Blythe, C.Overbeeke, A.F.Monk, & P.C. Wright (Eds.), Funology:From Usability to Enjoyment (pp.111-124), Dordrecht: Kluwer. Dittrich, Y., Rönkkö, K., Lindeberg, O., Erickson, J. and Hansson, C., 2008.
Cooperativemethod development: Combining qualitative empirical research with method,
techniqueand process improvement, In the Journal of Empirical Software Engineering, 13(3),
pp.231-260.

82
Dix, A., Finlay, J., Abowd, G., Beale, R., 1993. Human–computer interaction. Prentice-Hall, New York, NY, pp.600. Drucker, S.M., Glatzer, A., De Mar, S., Wong, C., 2002. SmartSkip: consumer level browsing and skipping of digital video content. In: Proceedings of ACM Conference on Human Factors in Computer Systems. ACM Press, New York, NY, pp. 219–226 Dumais, S.T., Cutrell, E., Chen, H., 2001. Bringing order to the web: optimizing search by showing results in context. In: Proceedings of ACM Conference on Human Factors in Computer Systems. ACM Press, New York, NY, pp. 277–283 Dumas, J., & Redish, G., 1999. A practical guide to usability testing (Rev.ed.), London: Intellect Books. Dumas, J., 2003. User-Based Evaluations, In Sears, A., Jacko, Julie A., The human-computer interaction handbook: fundamentals, evolving technologies, and emerging applications, Lawrence Erlbaum Associates, Inc., Publishers, New Jersey. Ekman, P., & Friesen, W.V., 1978. Facial Action Coding System: A technique for the measurement of facial movement. Palo Alto, CA: Consulting Psychologists Press. Ettcoff, N.L., & Magee, J. J., 1992. Categorical perception of facial expressions. Cognition, 44, 227-240. Farnham, S., Zaner, M., Cheng, L., 2000. Designing for sociability in shared browsers. In: Proceedings of IFIP TC.13 International Conference on Human–Computer Interaction. IOS Press, Amsterdam, pp. 115–123 Fenton, N. E., Pfleeger S. L. 1996, Software Metrics - A Rigorous & Practical Approach, 2nd Edition International Thomson Computer Press, ISBN 1-85032-275-9 Forlizzi, J., Ford, S. 2000. The Building Blocks of Experience: An Early Framework for Interaction Designers. Proceedings of Designing Interactive Systems (DIS 2000). New York City, USA. Forlizzi, J. & Battarnee, K.,2004. Understanding experience in interactive systems. In: Proceedings of the 5th conference on Designing interactive systems: processes, practices, methods, and techniques. Cambridge, MA, USA, ACM. Giller, V., Melgher, R., Schrammel, J., Sefelin, R. & Tscheligi, M., 2003. Usability evaluations for multi-device application development three example studies. vol. 2795. pp. 302-316. Human- Computer Interaction with Mobile Devices and Services. Gray, W.D., John,B.E., & Atwood,M.E., 1992. The précis of Project Ernestine, or , an overview of a validation of GOMS. In P. Bauersfeld, J.Bennett, & G.Lynch (Eds.), Proceedings of ACM CHI’92 Conference on Human Factors in Computer Systems NY: ACM Press, pp.307-312. Gulliksen, J. et al., 2004. Making a difference – a survey of the usability profession in Sweden, In Proceedings of the third Nordic conference on Human-computer interaction Finland, Vol 82, ACM, Pages: 207 – 215 Hans-Christian Jetter, J. G., 2006. A Simplified Model of User Experience for Practical Application. The 2nd COST294-MAUSE International Open Workshop, 14 October 2006. Norway.

83
Hassenzahl,M. 2003. The thing and I: understanding the relationship between user and product. In M.Blythe, C.Overbeeke, A.F.Monk, & P.C. Wright (Eds.), Funology:From Usability to Enjoyment (pp.31-42), Dordrecht: Kluwer. Hassenzahl, M., Tractinsky, N., 2006. User Experience – a Research Agenda. Behaviour and Information Technology, Vol. 25, No. 2, March-April 2006, pp. 91- 97. Hassenzahl,M., Law,E., Roto,Vi., Kort,J., Vermeeren,A., 2008. Towards a Shared Definition of User Experience. In Proceedings of the CHI 08 Conference on Special Interest Groups. Florence, Italy, pp. 2395-2398. Hassenzahl, M., Effie Lai-Chong Law, Hvannberg, E.T., 2006. User Experience – Towards a unified view. Workshop on User Experience – Towards a Unified View. In conjuction with NordiCHI 2006 conference. Oslo, Norway. pp. 1-3. Hassenzahl, M. et al., 2008.User Experience Over Time, CHI 2008 Proceedings, ACM, Florence, Italy Hassenzahl,M., Roto,Vi., Mattila, K.V.V., 2008. Now Let’s Do It in Practice: User Experience Evaluation Methods in Product Development. In Proceedings of the CHI 08 Workshops. Florence, Italy, pp. 3961-3964. Hartson, H.R.,Castillo, J.C., Kelso,J.,Kamler, J., & Neale, W. C., 1996. Remote evaluation: The network as as extension of the usability laboratory. Proceedings of Human Factors in Computing Systems, pp. 228-235. Hart, S.G., Staveland, L.E., 1988. Development of NASA-TLX: results of empirial and theoretical research. In: Hancock, P.A., Meshkati, P.(Eds.), Human Mental Workload. Elsevier, Amsterdam, pp. 139–183. Hart, J., Ridely, C., Taher F., Sas,C., Dix,A., 2008. Exploring the Facebook Experience: A New Approach to Usability. NordiCHI 2008, 18-22 October, 2008, Lund, Sweden, ACM ISBN 978-1-59593-704-9.. Hiltunen M., Laukka M., Luomala J. 2002. Mobile User Experience. IT Press, Finland. Hyvarinen, T., Rinen, Kaikkonen, A. & Hiltunen, M., 2005. Placing links in mobile banking application. In Proceedings of the 7th international conference on Human computer interaction with mobile devices and services. ACM. Salzburg, Austria. Isokoski, P., Ka¨ ki, M., 2002. Comparison of two touchpad-based methods for numeric entry. In: Proceedings of ACM Conference on Human Factors in Computing Systems. ACM Press, New York, NY, pp. 25–32 Izard, C.E., 1979, The Maximally Discriminative Facial Movement Coding System (MAX). Newark: Instructional Recourses Centre, University of Delaware. International Standard Information Technology, 1991. ISO/IEC 9126:Software Product Evaluation-Quality Characteristics and Guidance for their use International Organization for Standardization/International Electrotechnical Commission, 2001. ISO/IEC 9126-1 Standard, Software Engineering, Product Quality, Part 1: Quality Model, Geneva: Author.

84
International Organization for Standardization/International Electrotechnical Commission, 2001. ISO/IEC 9126-2 Standard, Software Engineering, Product Quality, Part 2: External Metrics, Geneva: Author. International Organization for Standardization/International Electrotechnical Commission, 2001. ISO/IEC 9126-3 Standard, Software Engineering, Product Quality, Part 3: Internal Metrics, Geneva: Author. International Organization for Standardization/International Electrotechnical Commission, 2005. ISO/IEC 25000 Software engineering — Software product Quality Requirements and Evaluation (SQuaRE) — Guide to SQuaRE International Organization for Standardization/International Electrotechnical Commission, 2004. ISO/IEC 9126-4, Software Engineering, Product Quality, Part 4: Quality in Use Metrics, Geneva:Author. International Organization for Standardization, 1998. ISO 9241-11, Ergonomic Requirements for Office Work with Visual Display Terminals (VDTs), Part 11: Guidance on Usability, Geneva: Author. Jokela, Timo., Koivumaa,J., Pirkola,J., Salminen, P., Kantola, N., 2005. Methods for quantitative usability requirements: a case study on the development of the user interface of a mobile phone, Springer-Verlag London Limited 2005. Jones, M. A. M., G., 2006. Mobile interaction design, John Wiley & Sons. John,B.E., & Kieras, D.E., 1996. Using GOMS for user interface design and evaluation: Which technique? ACM Transactions on Computer-Human Interaction, 3, 287-319. Johnstone, T., & Scherer, K. R., 2001. Vocal communication of emotion. In M. Lewis & J.M. Haviland-Jones (Eds.), Handbook of Emotions (2nd ed.), New York: The Guilford Press, pp. 220-235. Kaiser, S., & Wehrle, T., 2001, Facial expressions as indictor of appraisal processes. In K. Scherer, A.Schorr, & T. Johnstone (Eds.), Appraisal processes in emotion, Oxford: Oxford University Press, pp. 285-300. Kantner,L., 2001. Assessing Web site usability from server log files. In R.Branaghan (Ed.), Design by people for people: Essays on usability, Chicago: Usability Professional’s Association, pp. 245-261. Karat, C.-M., Pinhanez, C., Karat, J., Arora, R., Vergo, J., 2001. Less clicking, more watching: results of the interactive design and evaluation of entertaining web experiences. In: Proceedings of IFIP TC.13 International Conference on Human–Computer Interaction. IOS Press, Amsterdam, pp. 455–463. Kirakowski, J. and Corbett, M., 1993. SUMI: The Software Usability Measurement Inventory, British Journal of Educational Technology 24: 210–212. Kirakowski,J., Corbett, M., 1988. Measuring user satisfaction. In D. Jones & R.Winder (Eds.) People and computers, Cambridge, England: Cambridge University Press, pp. 189-217. Kirakowski, J. and McNamara, Niamh, 2006. Functionality, usability, and user experience: three areas of concern. In Interactions, 13 (6) pp. 26-28.

85
Kieras, D., 2003. Model-Based Evaluation, In Sears, A., Jacko, Julie A., The human-computer interaction handbook: fundamentals, evolving technologies, and emerging applications, Lawrence Erlbaum Associates, Inc., Publishers, New Jersey. Laila Cheikhi; Alain Abran; Witold Suryn, 2006. Harmonization of usability measurements in IS09126 software engineering standards, IEEE ISIE 2006, Canada Lars-Ola Damm; Kennet Henningsson et al., 2005, Software quality attributes and trade-offs, PhD compendium, Blekinge Institute of Technology Ronneby Sweden, Pages 100. Laughery,K.R.,1989. Micro SAINT-A tool for modeling human performance in systems, NY: Plenum Press, pp.219-230. Ledgard, H., 1982, Evaluating text editors. Proceedings of Human Factors in Computer System, 135-156. Lewis, J., 1994. Sample size for usability studies: Additional considerations. Human Factors, 36, 368-378. Lewis,C., & Wharton, C., 1997. Cognitive walkthroughs. In M.Helander, T.K. Landauer, & P.Prabhu (Eds.), Handbook of human-computer interaction, Amsterdam : Elsevier Science, pp.717-732. Lin, H. X., Choong, Y.-Y., and Salvendy, G., 1997. A proposed index of usability: A method for comparing the relative usability of different software systems, Behaviour and Information Technology, 16: 267-277. Lister, M., 2001, Usability testing software for the Internet. Proceedings of Human Factors in Computing Systems, 3, 17-18. MacKenzie, I.S., Kauppinen, T., Silfverberg, M., 2001. Accuracy measures for evaluating computer pointing devices. In: Proceedings of ACM Conference on Human Factors in Computing Systems. ACM Press, New York, NY, pp. 9–16 Macleod, M., and Rengger, R., 1993. The development of DRUM: A software tool for video-assisted usability evaluation. Retrieved July 3, 2005 from http://www.usability.serco.com/papers/drum93.pdf Macleod, M., Bowden, R., Bevan,Nigel. and Curson, I., 1997. The MUSiC Performance Measurement Method. In Behaviour and Information Technology, 16 (4) pp. 279-293 Mäkelä, A., Fulton Suri, J. 2001. Supporting Users’ Creativity: Design to Induce Pleasurable Experiences. Proceedings of the International Conference on Affective Human Factors Design, pp. 387-394. Marshall, D., Foster, J.C., Jack, M.A., 2001. User performance and attitude towards schemes for alphanumeric data entry using restricted input devices, Behaviour & Information Technology 20 (3), pp.167–188 Marc Hassenzahl, Effie Lai-Chong Law, Ebba Thora Hvannberg, “User Experience – Towards a unified view”, UX WS NordiCHI'06: COST294-MAUSE Matarazzo, G., Sellen, A., 2000. The value of video in work at a distance: addition or distraction? Behaviour & Information Technology 19 (5), pp.339–348

86
McCall, J. A., Richards, P. K., and Walters, G. F., 1977. Factors in Software Quality, Springfield, VA: National Technical Information Service. McGee, M.,2004. Master Usability Scaling: Magnitude Estimation and Master Scaling Applied to Usability Measurement, In Proceedings of the SIGCHI conference on Human factors in computing systems, Austria, ACM , Pp 335-342. Mitsopoulos, E.N., Edwards, A.D.N., 1999. A principled design methodology for auditory interaction. In: Proceedings of IFIP TC.13 International Conference on Human–Computer Interaction. IOS Press, Amsterdam, pp. 263–271 Molich, R. User-Friendly Web Design (in Danish). Copenhagen: Teknisk Forlag, 2000 Nyberg, M., Bjo¨ rk, S., Goldstein, M., Redstro¨ m, J., 2001. Handheld applications design: merging information appliances without affecting usability. In: Proceedings of IFIP TC.13 Conference on Human–Computer Interaction. IOS Press, Amsterdam, pp. 391–398 Molish, R.,Bevan,N.,Curson,I.,Butler, S.,Kindlund,E.,Miller,D., & Kirakowski, J., 1998. Comparative evaluation of usability tests. Proceedings of the Usability Professionals’ Association Dallas,TX: Usability Professional’ Association. Pp.1-12. Molich, R., Kindlund, E., Seeley, J., Norman, K., Kaasgaard, K., Karyukina, B.,Schmidt, L.,Ede,M.,van Oel,W., & Kahmann, R., 2002. Comparative usability evaluation. Muller, M.J., McClard., 1995. Validating an extension to participatory heuristic evaluation :Quality of work and quality of life. In I.Katz, R.Mack & L.Marks (Eds.), Proceedings of ACM CHI’95 Conference on Human Factors in Computing Systems, NY:ACM Press, pp.115-116. Nielsen, J., & Molich, R., 1990, Heuristic evaluation of user interfaces, Proceedings of ACM CHI’90,NY: ACM Press, pp.249-256. Newell, A., 1990. Unified theories of cognition, Cambridge, MA: Harvard University Press. Norman, D., 2004. Emotional Design: Why We Love (or Hate) Everyday Things. Basic Books. Polson,P.G., 1992, Cognitive Walkthroughs: A method for theory-based evaluation of user interfaces, International Journal of Man-Machine Studies, 36, 741-773. Philips, B., & Drums, J., 1990. Usability testing: Functional requirements for data logging software, Proceedings of the Human Factors Society, 34th Annual Meeting, Santa Monica, CA: Human Factors and Ergonomics Society, pp.295-299. Preece, J., Rogers, Y., Sharp, H., Benyon, D., Holland, S., and Carey, T. 1994. Human Computer Interaction, Wokingham, UK: Addison-Wesley, pp.775 Preece, J.,Keller,L., 1990. Human-Computer Interaction, Cambridge, UK: University Press, pp.437 Preece, J., Rogers, Y. and Sharp, H., 2002. Interaction Design: Beyond Human-Computer Interaction. New York: John Wiley and Sons.
Rönkkö, K., Winter, J., and Hellman, M. 2009. Inside Information 2, Usability and User Research: Eight years of research and method development cooperation, Technical Report, Blekinge Institute of Technology
87
Rönkkö, K., et al., 2008.Reporting user experience through usability within the telecommunications industry, In Proceedings of the 2008 International Workshop on Cooperative and Human Aspects of Software Engineering (CHASE08), ACM SIGSOFT , pp. 89-92. Roto, V., 2006. User Experience Building Blocks. The 2nd COST294-MAUSE International Open Workshop, 14 October 2006. Norway. Roto, V. & Kaasinen, E., 2008. The second international workshop on mobile internet user experience. In Proceedings of the 10th international conference on Human computer interaction with mobile devices and services, ACM. Amsterdam, The Netherlands. Rubin,J., 1994, Handbook of usability testing, NY: John Wiley. Rui, Y., Gupta, A., Cadiz, J., 2001. Viewing meeting captured by an Omni directional camera. In: Proceedings of ACM Conference on Human Factors in Computing Systems. ACM Press, New York, NY, pp. 450–457 Sears, A., 1997. Heuristic Walkthroughs: Finding the problems without the noise. International Journal of Man-Machine Studies, 9, 213-234. Sears, A., Jacko, Julie A., 2003. The human-computer interaction handbook: fundamentals, evolving technologies, and emerging applications, Lawrence Erlbaum Associates, Inc., Publishers, New Jersey, ISBN 0-8058-4468-6. Seffah, A. et al., 2006. Usability measurement and metrics: A consolidated model, In Software Quality Journal, Springer Science, Volume 14, No 2. Shneiderman, B., 1997, Designing the user interface: Strategies for effective human computer interaction (3rd ed.), MA: Addison-Wesley. Schneiderman, B.,Plaisant,C., 2004. Designing the User Interface: Strategies for Effective Human-Computer Interaction (4th ed.), Reading, MA: Addison-Wesley, pp.652 Shahid Nazir Bhatti, 2005. Why Quality? ISO 9126 Software Quality Metrics (Functionality) Support by UML Suite, ACM SIGSOFT Software Engineering Notes, Volume 30 Issue 2 Slater, M., Sadagic, A., Usoh, M., Schroeder, R., 2000. Small group behaviour in a virtual and real environment. Presence: Teleoperators And Virtual Environments 9 (1), pp. 37–51. Shrestha, S., 2007. Mobile web browsing: usability study. Proceedings of the 4th international conference on mobile technology, applications, and systems and the 1st international symposium on Computer human interaction in mobile technology. Singapore, ACM. Smith, S.L., & Mosier, J.N., 1986, Guidelines for designing user interface software, Bedford, MA: MITRE Corporation. Stage, J., 2006. Defining and Measuring User Experience: Are They Two Sides of the Same Coin? , The 2nd COST294-MAUSE International Open Workshop, 14 October 2006. Norway. Subramanya, S. R. & Yi, B. K., 2007. Enhancing the User Experience in Mobile Phones. Computer, 40, 114-117.
88
Sward,D., 2006. Gaining a competitive advantage through user experience design. Online at: http://www.intel.com/it/pdf/comp-adv-user-exp.pdf Tan, D.E., Robertson, G.G., Czerwinski, M., 2001. Exploring 3D navigation: combining speed-coupled flying with orbiting. In: Proceedings of ACM Conference on Human Factors in Computing Systems. ACM Press, New York, p. NY Vizi,R.A., 1990, Steamlining the design process: Running fewer subjects. Proceedings of the Human Factors Society, 34th Annual Meeting , Santa Monica, CA: Human Factors and Ergonomics Society, pp.291-294. Virzi,R.A., 1992, Refing the test phase of usability evaluation: How many subjects is enough? Human Factors, 34,457-468. Virzi, R.A., Sokolov,J.L., &Karis, D.,1996. Usability problem identification using both low and high fidelity prototypes. Proceedings of Human Factors in Computing System, 236-243. Wang, Q.Y., Shen, M.W., Shui, R., Su, H., 2001. Detectability and comprehensibility study on audio hyper-linking methods. In: Proceedings of IFIP TC.13 International Conference on Human–Computer Interaction. IOS Press, Amsterdam, pp. 310–317 Westerman, S.J., Cribbin, T., 2000. Mapping semantic information in virtual space: dimensions, variance and individual differences. International Journal of Human–Computer Studies 53, pp. 765–787. Wharton, C., Rieman, J., Lewis, C., & Polson, P., 1994. The cognitive Walkthrough : A practitioner’s guide. In J. Nielsen & R. L. Mack (Eds.), Usability inspection methods, NY: John Wiley & sons, pp.105-140.

89
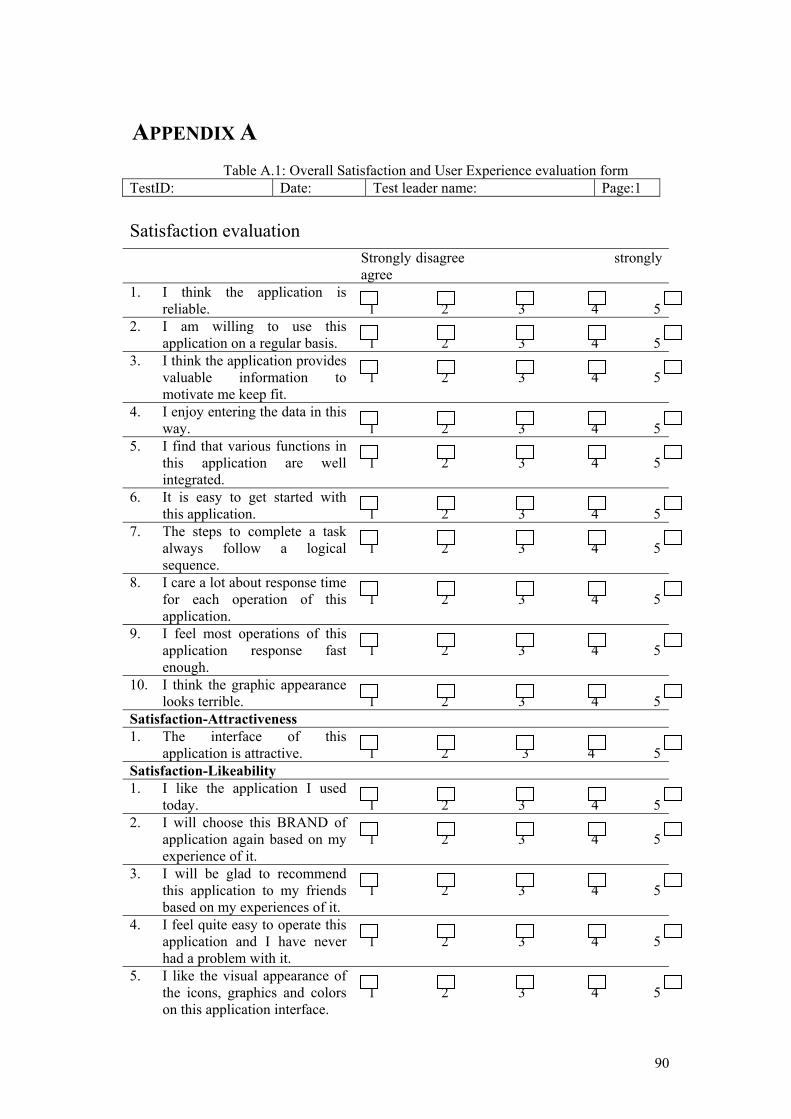
90
APPENDIX A
Table A.1: Overall Satisfaction and User Experience evaluation form TestID: Date: Test leader name: Page:1
Satisfaction evaluation
Strongly disagree strongly agree
1. I think the application is reliable.
1 2 3 4 5
2. I am willing to use this application on a regular basis.
1 2 3 4 5
3. I think the application provides valuable information to motivate me keep fit.
1 2 3 4 5
4. I enjoy entering the data in this way.
1 2 3 4 5
5. I find that various functions in this application are well integrated.
1 2 3 4 5
6. It is easy to get started with this application.
1 2 3 4 5
7. The steps to complete a task always follow a logical sequence.
1 2 3 4 5
8. I care a lot about response time for each operation of this application.
1 2 3 4 5
9. I feel most operations of this application response fast enough.
1 2 3 4 5
10. I think the graphic appearance looks terrible.
1 2 3 4 5
Satisfaction-Attractiveness 1. The interface of this
application is attractive.
1 2 3 4 5 Satisfaction-Likeability 1. I like the application I used
today.
1 2 3 4 5 2. I will choose this BRAND of
application again based on my experience of it.
1 2 3 4 5
3. I will be glad to recommend this application to my friends based on my experiences of it.
1 2 3 4 5
4. I feel quite easy to operate this application and I have never had a problem with it.
1 2 3 4 5
5. I like the visual appearance of the icons, graphics and colors on this application interface.
1 2 3 4 5

91
6. I feel quite comfortable to hold and operate using just one hand.
1 2 3 4 5
Satisfaction-User Guidance 1. It is always easy to get back to
where I want to be, when I make a mistake or go into the wrong place while using this application.
1 2 3 4 5
Satisfaction-Flexibility 1. It is easy to set up shortcuts to
my favorite food and activity using this application.
1 2 3 4 5
User Experience (UX) evaluation
Strongly disagree strongly agree
1. It is quite funny to play around this application.
1 2 3 4 5
2. I enjoy operating this application.
1 2 3 4 5
3. I believe this application will stimulate me to keep controlling my gained calories daily.
1 2 3 4 5
4. I feel quite emotionally fulfilling when I achieve today’s target by using this application.
1 2 3 4 5
5. My expectation of choosing this application is that it can help me to keep fit and healthy by controlling daily calories gaining amount. And my experience of using it achieves my original expectation, I am quite satisfied.
1 2 3 4 5
6. My friends are all surprised to see that I reduced weight by taking regular exercise and controlling calories, and my change is due to this application.
1 2 3 4 5
7. Sometimes I feel sad when I forgot to record the exact amount of activities and meals I took, so that I can not know exactly whether I achieve today’s goal or not. But it motivates me never forgetting to record anything in time from next time.
1 2 3 4 5
8. This application helps me to make a plan to achieve my
1 2 3 4 5
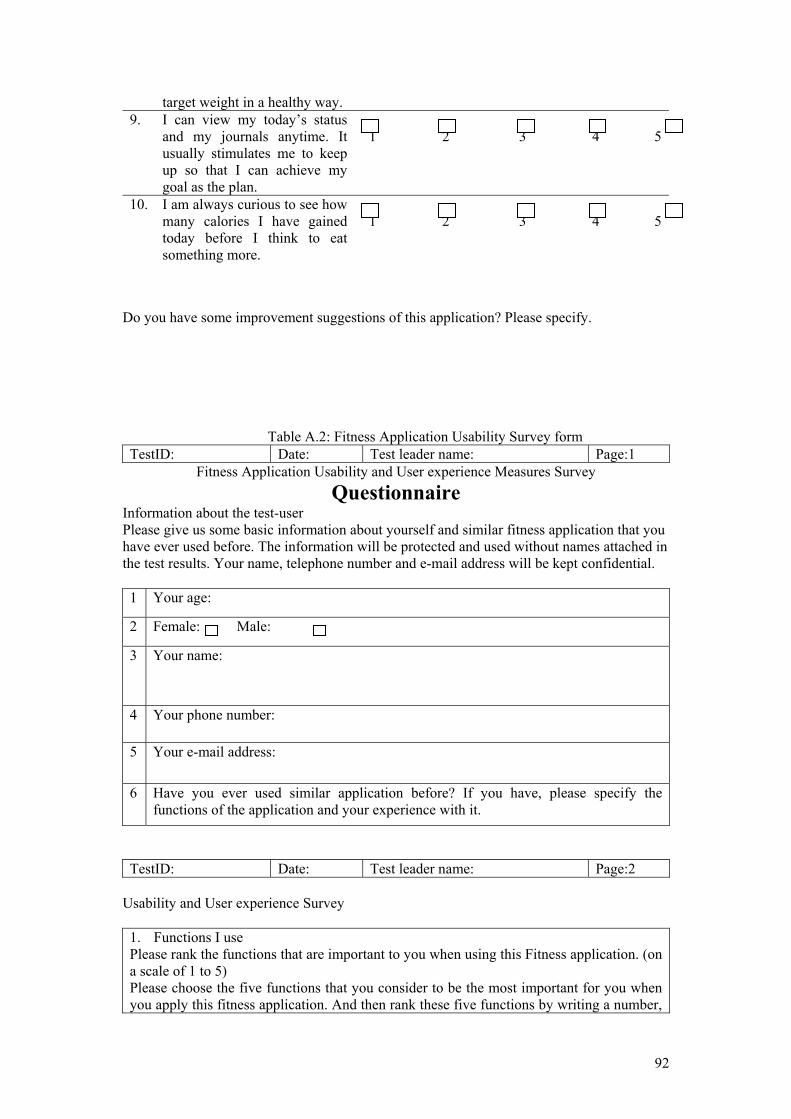
92
target weight in a healthy way. 9. I can view my today’s status
and my journals anytime. It usually stimulates me to keep up so that I can achieve my goal as the plan.
1 2 3 4 5
10. I am always curious to see how many calories I have gained today before I think to eat something more.
1 2 3 4 5
Do you have some improvement suggestions of this application? Please specify.
Table A.2: Fitness Application Usability Survey form
TestID: Date: Test leader name: Page:1 Fitness Application Usability and User experience Measures Survey
Questionnaire Information about the test-user Please give us some basic information about yourself and similar fitness application that you have ever used before. The information will be protected and used without names attached in the test results. Your name, telephone number and e-mail address will be kept confidential. 1 Your age:
2 Female: Male:
3 Your name:
4 Your phone number:
5 Your e-mail address:
6 Have you ever used similar application before? If you have, please specify the functions of the application and your experience with it.
TestID: Date: Test leader name: Page:2
Usability and User experience Survey 1. Functions I use Please rank the functions that are important to you when using this Fitness application. (on a scale of 1 to 5) Please choose the five functions that you consider to be the most important for you when you apply this fitness application. And then rank these five functions by writing a number,

93
1-5, to the left of the function’s name. Write “1” represents that function is most important to you, “2” represents that function is next important, “3” for the next, “4” for the one after that and finally “5” represents that function is the least important one of the five that are most important for you. Use each number once and only once. Leave the remaining functions without a number. Set a new program 1 Update Target weight 2 Update current weight 3 View trend map of current weight versus target weight 4 View Journal records 5 Edit Journal records 6 View Today’s Target and current program status 7 Add a meal 8 Add an activity 9 Change program duration 10 Change Exercise level 11 Other, please specify:
TestID: Date: Test leader name: Page:3
2. How I Edit Journal records Please rank the activities on a scale of 1 to 2. Write “1” represents that method you use most, “2” represents that method is least important for you. Use each number once and only once. Delete a meal or an activity record from today’s journal list 6.1 Delete a meal or an activity record from yesterday’s journal list 6.2
3. How I add a meal Please rank the activities on a scale of 1 to 3. Write “1” represents that method you use most, “2” represents the next important and “3” represents that method is least important for you. Use each number once and only once. Add new favorite item 8.1 Add current meal to favorites 8.2 Select and add foods from options 8.3
Table A.3: Fitness Application Test Protocol
TestID: Date: Test leader name: Page:1 Test Protocol
Used ID Use Case Time 1 Create a new program by using following information: Unit:
Metric. Height: 169cm. Weight: 68kg. Age: 40. Gender: Male. Exercise level: Moderately active.
2 Your current target weight is 63kg, please update into a new target: 62kg.
3 Please update your current weight from 68kg to 67kg. 4 Begin viewing trend map of current weight versus target
weight
5 Begin viewing your journal records 6.1 You just added a meal of 344 calories by mistake. Please
delete the record of “Gained 344 calories” from Today’s
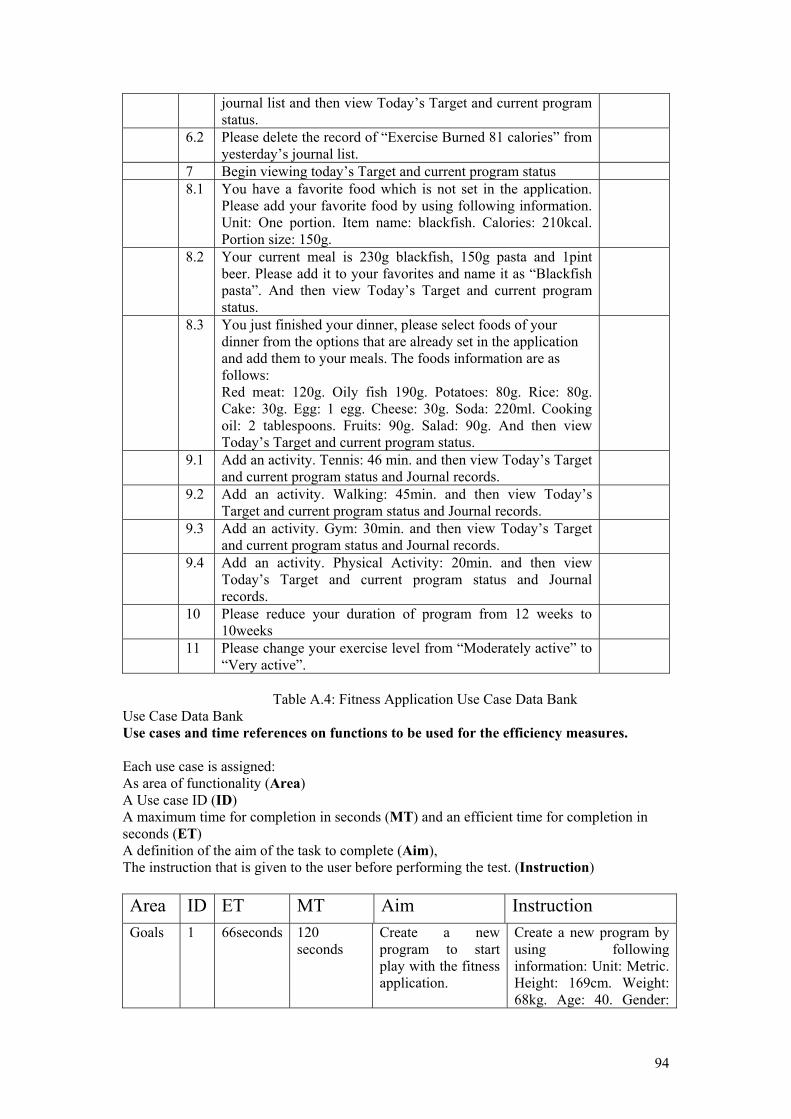
94
journal list and then view Today’s Target and current program status.
6.2 Please delete the record of “Exercise Burned 81 calories” from yesterday’s journal list.
7 Begin viewing today’s Target and current program status 8.1 You have a favorite food which is not set in the application.
Please add your favorite food by using following information. Unit: One portion. Item name: blackfish. Calories: 210kcal. Portion size: 150g.
8.2 Your current meal is 230g blackfish, 150g pasta and 1pint beer. Please add it to your favorites and name it as “Blackfish pasta”. And then view Today’s Target and current program status.
8.3 You just finished your dinner, please select foods of your dinner from the options that are already set in the application and add them to your meals. The foods information are as follows: Red meat: 120g. Oily fish 190g. Potatoes: 80g. Rice: 80g. Cake: 30g. Egg: 1 egg. Cheese: 30g. Soda: 220ml. Cooking oil: 2 tablespoons. Fruits: 90g. Salad: 90g. And then view Today’s Target and current program status.
9.1 Add an activity. Tennis: 46 min. and then view Today’s Target and current program status and Journal records.
9.2 Add an activity. Walking: 45min. and then view Today’s Target and current program status and Journal records.
9.3 Add an activity. Gym: 30min. and then view Today’s Target and current program status and Journal records.
9.4 Add an activity. Physical Activity: 20min. and then view Today’s Target and current program status and Journal records.
10 Please reduce your duration of program from 12 weeks to 10weeks
11 Please change your exercise level from “Moderately active” to “Very active”.
Table A.4: Fitness Application Use Case Data Bank
Use Case Data Bank Use cases and time references on functions to be used for the efficiency measures. Each use case is assigned: As area of functionality (Area) A Use case ID (ID) A maximum time for completion in seconds (MT) and an efficient time for completion in seconds (ET) A definition of the aim of the task to complete (Aim), The instruction that is given to the user before performing the test. (Instruction) Area ID ET MT Aim Instruction Goals 1 66seconds 120
seconds Create a new program to start play with the fitness application.
Create a new program by using following information: Unit: Metric. Height: 169cm. Weight: 68kg. Age: 40. Gender:
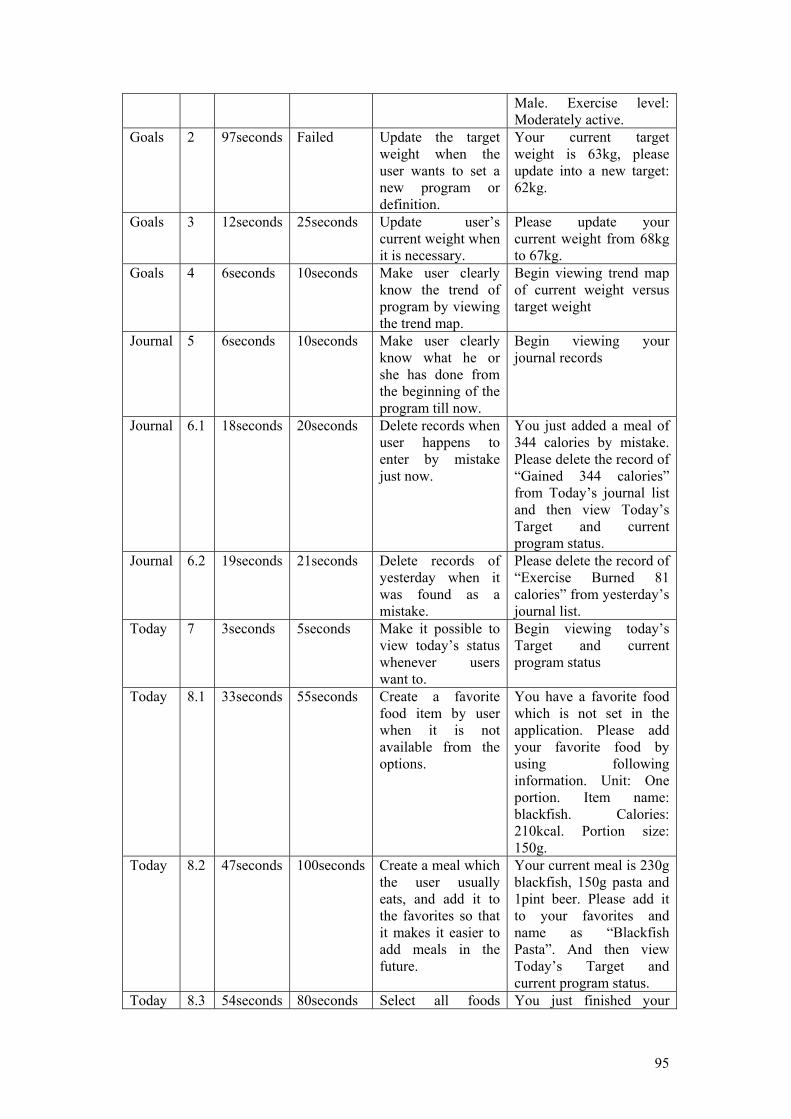
95
Male. Exercise level: Moderately active.
Goals 2 97seconds Failed Update the target weight when the user wants to set a new program or definition.
Your current target weight is 63kg, please update into a new target: 62kg.
Goals 3 12seconds 25seconds Update user’s current weight when it is necessary.
Please update your current weight from 68kg to 67kg.
Goals 4 6seconds 10seconds Make user clearly know the trend of program by viewing the trend map.
Begin viewing trend map of current weight versus target weight
Journal 5 6seconds 10seconds Make user clearly know what he or she has done from the beginning of the program till now.
Begin viewing your journal records
Journal 6.1 18seconds 20seconds Delete records when user happens to enter by mistake just now.
You just added a meal of 344 calories by mistake. Please delete the record of “Gained 344 calories” from Today’s journal list and then view Today’s Target and current program status.
Journal 6.2 19seconds 21seconds Delete records of yesterday when it was found as a mistake.
Please delete the record of “Exercise Burned 81 calories” from yesterday’s journal list.
Today 7 3seconds 5seconds Make it possible to view today’s status whenever users want to.
Begin viewing today’s Target and current program status
Today 8.1 33seconds 55seconds Create a favorite food item by user when it is not available from the options.
You have a favorite food which is not set in the application. Please add your favorite food by using following information. Unit: One portion. Item name: blackfish. Calories: 210kcal. Portion size: 150g.
Today 8.2 47seconds 100seconds Create a meal which the user usually eats, and add it to the favorites so that it makes it easier to add meals in the future.
Your current meal is 230g blackfish, 150g pasta and 1pint beer. Please add it to your favorites and name as “Blackfish Pasta”. And then view Today’s Target and current program status.
Today 8.3 54seconds 80seconds Select all foods You just finished your
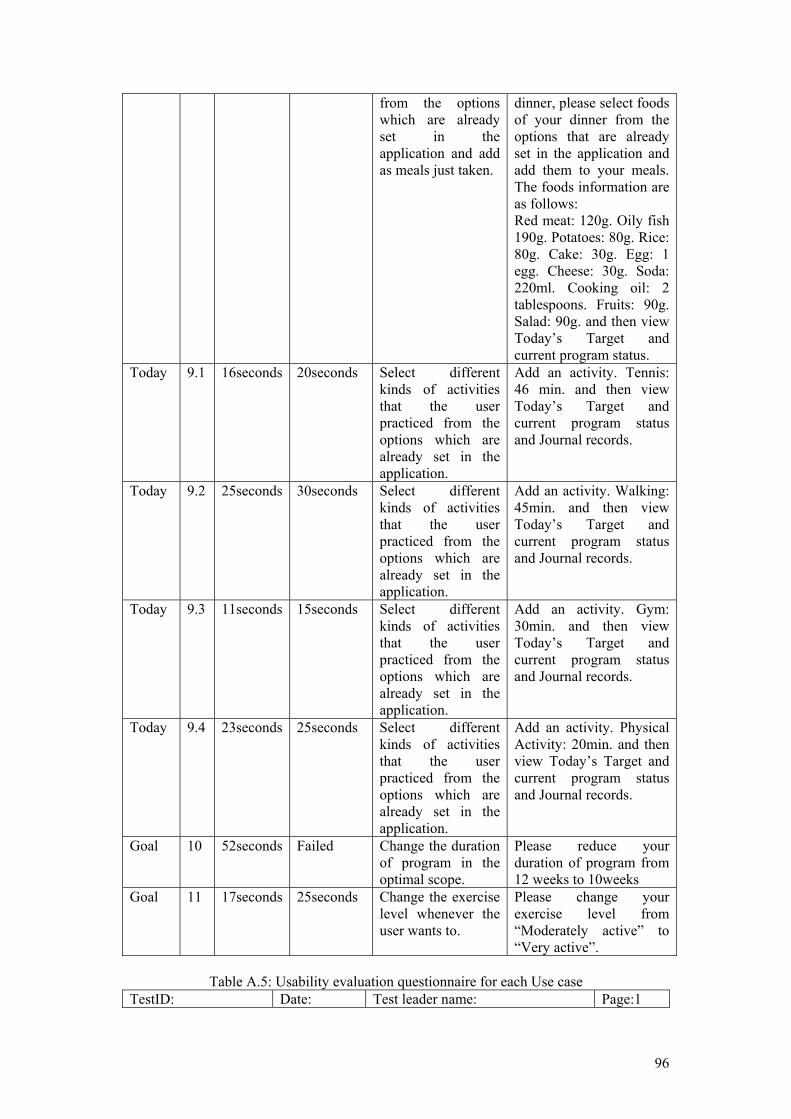
96
from the options which are already set in the application and add as meals just taken.
dinner, please select foods of your dinner from the options that are already set in the application and add them to your meals. The foods information are as follows: Red meat: 120g. Oily fish 190g. Potatoes: 80g. Rice: 80g. Cake: 30g. Egg: 1 egg. Cheese: 30g. Soda: 220ml. Cooking oil: 2 tablespoons. Fruits: 90g. Salad: 90g. and then view Today’s Target and current program status.
Today 9.1 16seconds 20seconds Select different kinds of activities that the user practiced from the options which are already set in the application.
Add an activity. Tennis: 46 min. and then view Today’s Target and current program status and Journal records.
Today 9.2 25seconds 30seconds Select different kinds of activities that the user practiced from the options which are already set in the application.
Add an activity. Walking: 45min. and then view Today’s Target and current program status and Journal records.
Today 9.3 11seconds 15seconds Select different kinds of activities that the user practiced from the options which are already set in the application.
Add an activity. Gym: 30min. and then view Today’s Target and current program status and Journal records.
Today 9.4 23seconds 25seconds Select different kinds of activities that the user practiced from the options which are already set in the application.
Add an activity. Physical Activity: 20min. and then view Today’s Target and current program status and Journal records.
Goal 10 52seconds Failed Change the duration of program in the optimal scope.
Please reduce your duration of program from 12 weeks to 10weeks
Goal 11 17seconds 25seconds Change the exercise level whenever the user wants to.
Please change your exercise level from “Moderately active” to “Very active”.
Table A.5: Usability evaluation questionnaire for each Use case
TestID: Date: Test leader name: Page:1
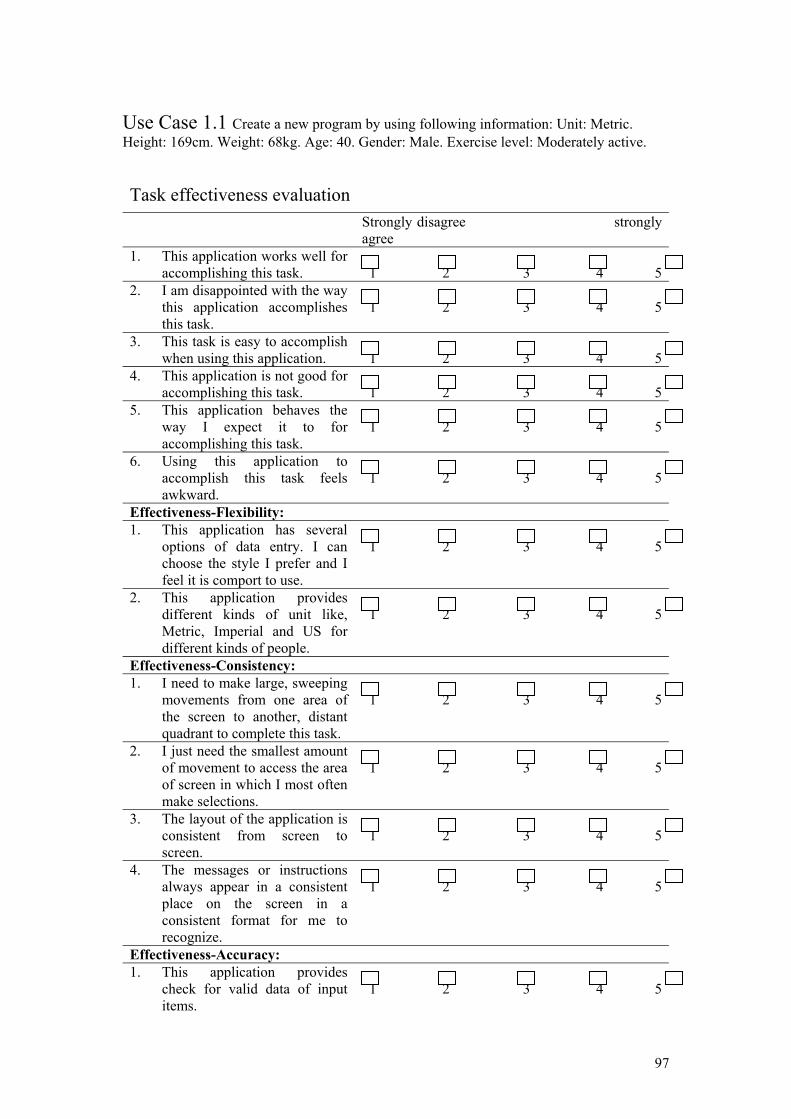
97
Use Case 1.1 Create a new program by using following information: Unit: Metric. Height: 169cm. Weight: 68kg. Age: 40. Gender: Male. Exercise level: Moderately active. Task effectiveness evaluation
Strongly disagree strongly agree
1. This application works well for accomplishing this task.
1 2 3 4 5
2. I am disappointed with the way this application accomplishes this task.
1 2 3 4 5
3. This task is easy to accomplish when using this application.
1 2 3 4 5
4. This application is not good for accomplishing this task.
1 2 3 4 5
5. This application behaves the way I expect it to for accomplishing this task.
1 2 3 4 5
6. Using this application to accomplish this task feels awkward.
1 2 3 4 5
Effectiveness-Flexibility: 1. This application has several
options of data entry. I can choose the style I prefer and I feel it is comport to use.
1 2 3 4 5
2. This application provides different kinds of unit like, Metric, Imperial and US for different kinds of people.
1 2 3 4 5
Effectiveness-Consistency: 1. I need to make large, sweeping
movements from one area of the screen to another, distant quadrant to complete this task.
1 2 3 4 5
2. I just need the smallest amount of movement to access the area of screen in which I most often make selections.
1 2 3 4 5
3. The layout of the application is consistent from screen to screen.
1 2 3 4 5
4. The messages or instructions always appear in a consistent place on the screen in a consistent format for me to recognize.
1 2 3 4 5
Effectiveness-Accuracy: 1. This application provides
check for valid data of input items.
1 2 3 4 5

98
2. I encounter calculation results with inadequate precision several times when conducting this task.
1 2 3 4 5
Effectiveness-Navigability: 1. It is easy for me to go to the
next screen.
1 2 3 4 52. It is easy for me to go back to
the previous screen.
1 2 3 4 5Effectiveness-Feedback: 1. The pop-up text description or
message of certain settings when I select make me always understand what is going on and what might happen.
1 2 3 4 5
Effectiveness-Memorability: 1. I am sure that I can complete
this task after a period of non-use.
1 2 3 4 5
2. I can recall the icon location and information presented on the screen after a period of non-use.
1 2 3 4 5
Efficiency evaluation Efficiency-Minimal action Strongly disagree strongly agree
1. This application provides combined entry of related data?
1 2 3 4 5
Efficiency-Minimal memory load 1. This application indicates my
current position in menu structure.
1 2 3 4 5
Efficiency-Operability 1. If I made some mistakes, it is
always possible to cancel prior to completion.
1 2 3 4 5
2. There is always enough default value for me to use during conducting this task.
1 2 3 4 5
Efficiency-Navigability 1. When performing this task, I
do not need to stop and think about which icon to flick next.
1 2 3 4 5
Following questions originated from NASA’s Task Load Index questionnaire.
1. This application needs high mental demand when conducting this task.
1 2 3 4 5
2. This application needs high physical demand when
1 2 3 4 5

99
conducting this task. 3. I feel very successful in
accomplishing what I was asked to do.
1 2 3 4 5
4. I feel it is hard to have to work to accomplish certain level of performance.
1 2 3 4 5
Learnability evaluation Learnability-Minimal action Strongly disagree strongly agree
1. This application requires only one simple action to return to higher-level menus.
1 2 3 4 5
2. This application requires only one simple action to return to general menu.
1 2 3 4 5
Learnability-Minimal memory load
1. Does this application use abbreviations and acronyms? If it does, I find that it always use standard form.
1 2 3 4 5
2. The selected data is always highlighted.
1 2 3 4 5
Learnability-User Guidance 1. The error and warning message
is very helpful.
1 2 3 4 5Learnability-Self-Descriptiveness 1. I think the application is simple
enough.
1 2 3 4 52. The task is so well-known that
no further explanation is necessary.
1 2 3 4 5
3. I always feel confident that when I flick the icon or navigation key, it will move in the direction I intended and perform the action I want.
1 2 3 4 5
Learnability-Simplicity 1. I feel this application is
unnecessarily complex.
1 2 3 4 52. I feel this application focuses
on its primary functionality.
1 2 3 4 53. The text on screen is always
short and direct so that I can absorb it quickly and easily.
1 2 3 4 5
4. I think the task is performed in a straightforward manner.
1 2 3 4 5
5. I think I need the support of a technical person to be able to conduct this task.
1 2 3 4 5

100
6. I need to learn a lot before I can get start conducting this task.
1 2 3 4 5
Learnability-Navigability 1. The grouping and ordering of
menu options is logical.
1 2 3 4 5Learnability-Memorability 1. I think the names of icons or
labels are meaningful so that I feel easy to remember.
1 2 3 4 5
Accessibility evaluation Accessibility-User Guidance Strongly disagree strongly
agree 1. There is HELP provided for
people with some type of disability.
1 2 3 4 5
Accessibility-Operability 1. There are some functions can
be customized for access by users with physical handicaps.
1 2 3 4 5
Accessibility-Flexibility 1. The display can be easily
zoomed in or zoomed out.
1 2 3 4 52. I can easily use the application
to perform this task when I am driving a car or sitting a cinema.
1 2 3 4 5
Accessibility-Readability 1. The text on the screen is easy
to read even for users who have disabilities.
1 2 3 4 5
Accessibility-Controllability 1. I have never felt out of control
when using this application to perform the task.
1 2 3 4 5
Generalizability evaluation Generalizability- Readability Strongly disagree strongly
agree 1. The color combination used in
BMI graph is readable.
1 2 3 4 52. The color combination used in
Trend chart is readable.
1 2 3 4 5Generalizability-Flexibility 1. I am allowed to customize the
interface.
1 2 3 4 52. This application support for
multi-language.
1 2 3 4 5Generalizability-Simplicity

101
1. It is easy to flick the icons on the screen without accidentally pressing an adjacent one.
1 2 3 4 5
Generalizability-Controllability 1. I think this application can
accommodate older adult users.
1 2 3 4 5 Understandability evaluation
Strongly disagree strongly agree
1. I can easily understand how to input data and what is provided as output by using this application to perform this task.
1 2 3 4 5
2. The items and information on the screen are grouped logically.
1 2 3 4 5
3. I think the terms and abbreviations used throughout this application are understandable and free of jargon.
1 2 3 4 5
4. The information is presented in a way that matches how I view solving the problem.
1 2 3 4 5
5. The application provides understandable status messages to let me know what is taking place during performing the task.
1 2 3 4 5
6. I feel the sequence of screens is confusing.
1 2 3 4 5
7. I think the message on screen which prompt user for input is clear.
1 2 3 4 5
8. The instructions for correcting errors are clear.
1 2 3 4 5
9. I can easily understand what the BMI graph indicates.
1 2 3 4 5
10. I can easily understand what the Trend chart indicates.
1 2 3 4 5
11. The icons of foods options are easy to understand and recognize.
1 2 3 4 5
12. The icons of activity options are easy to understand and recognize.
1 2 3 4 5

102
Safety evaluation Safety-Accuracy Strongly disagree strongly agree 1. I trust the calculation result
provided by this application.
1 2 3 4 5 Table A.6: Usability evaluation form for Test leader's consideration regarding each Use case TestID: Date: Test leader name: Page:1
For Test leader
Use Case 1.1 Create a new program by using following information: Unit: Metric. Height: 169cm. Weight: 68kg. Age: 40. Gender: Male. Exercise level: Moderately active. Task effectiveness evaluation
Notes:
1. What is the percentage of correctly fulfillment of this task?
2. What is the percentage of users who successfully completed this task on first attempt?
Effectiveness-Accuracy: 1. How frequent does user make
errors when conducting this task?
2. What is the number of errors on the way to task completion?
3. What is the number of attempts to correct errors?
Effectiveness-Completeness: 1. Is there any part of task that
users do not completed in the allotted time? And what is it?
Task Effectiveness (Task Effectiveness: How completely and accurately a user achieves the goals of this task) Measure: M1=| 1-∑Ai| Ai=proportional value of each missing or incorrect component in the task output. 0<=M1<=1 The closer to 1.0 the better. Note: Each potential missing or incomplete component is given a weight Ai based on the extent to which it detracts from the value of the output to the business or user.
Efficiency evaluation Notes: 1. What is the time taken to
complete this task?
2. What proportion of time does

103
the user used looking for help? 3. Is there a delay of response
from the application when the user flicks an icon?
4. How long does the user spent on correcting errors?
5. What is the number of questions that user ask during conducting the task? What is the number of accessing to help?
Efficiency-Operability 1. Is there any message which
caused the user a delay in understanding before starting the next action?
2. Can the user operate the application long enough without human error?
3. How frequently does the user successfully correct input errors?
4. Can the user easily recover his/her error during conducting this task?
Note: From a user’s viewpoint, the amount of effort input may be quantified in terms the time spent carrying out the task, or the mental/physical effort required to complete the task. These two types of input produce two different definitions of efficiency which can be stated as User Efficiency and Human Efficiency. User Efficiency Task Effectiveness/Task Time
Human Efficiency Task Effectiveness/ Mental or physical effort
Productivity evaluation Notes: 1. What proportion of the time is
the user performing productive action? (Productive time=task time-help time-error time-search time)
2. What is the relative user efficiency? Measure: Relative user efficiency= Ordinary user’s task efficiency/ expert user’s task efficiency
3. How cost-effective is the user? Measure: Economic productivity= Task effectiveness / Total cost of the task. Note: Costs could for example include the user’s time, the time

104
of others giving assistance, and the cost of computing resources, telephone calls and materials.