fourth york doctoral symposium on computer science · the fourth york doctoral symposium on...
TRANSCRIPT
Proceedings of the
Fourth
York Doctoral Symposiumon Computer Science
Department of Computer Science, The University of York, UK20th October 2011
Editor:Christopher M. Poskitt
Copyright © 2011 by the authors.

Sponsoring Institutions
We are extremely grateful to all of the following institutions for generously spon-soring our symposium this year.
University Sponsorship
Specifically, the Department of Computer Science and the ResearcherDevelopment Team.
Industrial Sponsorship
Preface
The annual York Doctoral Symposiums are aimed at new Computer Science re-searchers undertaking PhDs or Masters-level degrees. For those who contributepapers, talks, or posters, they provide a means of gaining feedback on early workwithin a friendly setting and from an audience representing a wide range of re-search interests. For the students who contribute as Organising and ProgrammeCommittee members, they provide a taste of what is involved in putting togethera conference. For the attendees, they provide academically stimulating days, achance to find out what colleagues in other research groups are doing, and lastbut not least, an excellent social occasion in the evening!
The Fourth York Doctoral Symposium on Computer Science (YDS 2011)was held at the University of York, and for the second time, at our new Hesling-ton East campus. Full-length papers were again invited for submission, but forthe first time, so were extended abstracts and posters. Most submissions werereceived from the Department of Computer Science at York, but we were de-lighted to also receive submissions from York’s Department of Electronics, theUniversity of the West of England, University College London, the Universityof Sunderland, and even the University of Oslo. All papers were reviewed bythree members of the Programme Committee (PC) via EasyChair. PC membersthen met in person to decide on a final programme comprising seven full-lengthpapers and three extended abstracts. Poster authors were invited to producea short abstract for the proceedings; eight authors chose to submit one, eachof which was checked by two PC members. The papers and posters acceptedare a good representation of the wide-ranging research undertaken by ComputerScientists.
We were delighted to have two external keynote speakers this year. ProfessorAlan Winfield (University of the West of England) introduced mobile robots, anddiscussed a method for artificially evolving a robot to optimise its design. LidiaOshlyansky (Google, Inc.) spoke about working in industry as a user experiencedesigner, and also discussed the working life and culture of Google. Myself, thePC, and the organisers are all grateful to our keynote speakers for agreeing tospeak at YDS 2011.
I would like to convey my thanks to the PC, who undertook the task ofreviewing submissions and choosing a programme very thoroughly and profes-sionally. I would also like to thank the Organising Committee members for allof their efforts, too; they are to be credited for a record number of submissions,record sponsorship, excellent coffee breaks and food, and for the fact that allorganisational matters were dealt with quickly and effectively.
October 2011 Christopher M. Poskitt
PC Chair, YDS 2011

Organisation
All YDS 2011 Organising and Programme Committee members are from theUniversity of York, UK.
Organising Commitee
Committee Members: Anna Bramwell-DicksAli Afshar DodsonAmir Kamali SarvestaniChris MarriottGary Plumbridge (co-Chair)Dina SalahFrank SoboczenskiJames R. Williams (co-Chair)
Programme Commitee
Committee Members: Victor BandurMichael BanksAnna Bramwell-DicksAlan BurnsChris Crispin-BaileySam DevlinAlan FrischRasha IbrahimAmir Kamali SarvestaniChris MarriottJohn A. McDermidMatthew NaylorJenny OwenRichard PaigeGary PlumbridgeChris Poskitt (Chair)Siva ReddyJason ReichColin RuncimanDina SalahJan StauntonMalihe TabatabaieJames R. WilliamsRichard Alun WilliamsJim Woodcock
Contents
I Keynote Talks
Let’s get Physical: Robot Bodies and how to Evolve them . . . . . . . . . . . . . . 1
Alan F. T. Winfield
Working at Google — Especially in User Experience . . . . . . . . . . . . . . . . . . . 2
Lidia Oshlyansky
II Full-Length Papers
3D Texture Analysis using Co-occurrence Matrix Feature for Classification 5
Shahzad Anwar, Lyndon N. Smith, Melvyn L. Smith
Confidentiality Annotations for Circus . . . . . . . . . . . . . . . . . . . . . . . . . . . . . . . 15
Michael J. Banks and Jeremy L. Jacob
Dependency Patterns and Timing for Grid Workloads . . . . . . . . . . . . . . . . . 25
Andrew Burkimsher
Interactive cookbooks: how recipe format affects the cooking experience . . 35
Lucy Buykx
Locality in Co-optimisation Problems . . . . . . . . . . . . . . . . . . . . . . . . . . . . . . . . 43
Tom Seaton, Tim Clarke
Generating Models Using Metaheuristic Search . . . . . . . . . . . . . . . . . . . . . . . 53
James R. Williams and Simon Poulding
Digit distributions — What digits are really being used in hospitals? . . . . 61
Sarah Wiseman
III Extended Abstracts
Modeling Workloads, SLAs and their Violations in Cloud Computing . . . . 71
Rafidah Pakir Mohamad, Dimitris Kolovos, Richard Paige
Using Domain-Specific Modelling Languages for RequirementsEngineering in Agile Software Development . . . . . . . . . . . . . . . . . . . . . . . . . . 77
Masoumeh Taromirad
VII
Agent-Based Modelling and Simulation of the NF-κB IntracellularSignalling Pathway . . . . . . . . . . . . . . . . . . . . . . . . . . . . . . . . . . . . . . . . . . . . . . . . 83
Richard Alun Williams
IV Poster Abstracts
Dirt Spot Sweeping Random Strategy . . . . . . . . . . . . . . . . . . . . . . . . . . . . . . . 91Mian Asbat Ahmad and Manuel Oriol
Model-Driven Engineering for Specifying, Analysing and MonitoringCloud Computing SLAs . . . . . . . . . . . . . . . . . . . . . . . . . . . . . . . . . . . . . . . . . . . . 92
Fatima Alkandari, Richard F. Paige, Simon Poulding
Data mining of audiology data for procuring hearing aids and tinnitusmaskers . . . . . . . . . . . . . . . . . . . . . . . . . . . . . . . . . . . . . . . . . . . . . . . . . . . . . . . . . . 94
Muhammad Naveed Anwar and Michael Philip Oakes
Dynamics and Chaos for Worst Case Execution Time Analysis . . . . . . . . . . 95David Griffin and Alan Burns
Self-repairing Robot Swarms . . . . . . . . . . . . . . . . . . . . . . . . . . . . . . . . . . . . . . . 96Alan G. Millard and Jon Timmis
Developing a Simulation and Hardware for a Robot Swarm UsingSound to Communicate . . . . . . . . . . . . . . . . . . . . . . . . . . . . . . . . . . . . . . . . . . . . 98
Jennifer Owen
Trans-DV: A Framework for Developing and Formally Verifying ModelTransformation Specifications . . . . . . . . . . . . . . . . . . . . . . . . . . . . . . . . . . . . . . . 100
Asmiza A. Sani, Fiona A. C. Polack, and Richard F. Paige
Agent-Based Modelling and Simulation of the NF-κB IntracellularSignalling Pathway . . . . . . . . . . . . . . . . . . . . . . . . . . . . . . . . . . . . . . . . . . . . . . . . 102
Richard Alun Williams


Part I
Keynote Talks

Let’s get Physical: Robot Bodies and how toEvolve them
Alan F. T. Winfield
University of the West of England, [email protected]
Abstract
Robots have bodies, and bodies must obey the laws of physics. The behaviour ofa mobile robot is the result of the physical interaction of the robots body and itsworking environment. In this talk I will introduce mobile robots and show howwe design robot bodies. A powerful new approach is called evolutionary robotics.Inspired by Darwinian evolution it is a method for artificially evolving a robotto optimise its design. Illustrated with video clips of robots in action, and somereal robots, I will explain how roboticists are evolving strange new robot bodies.
Biography
Alan Winfield is Professor of Electronic Engineering and Director of the Sci-ence Communication Unit at the University of the West of England, Bristol. Heconducts research in swarm robotics in the Bristol Robotics Laboratory and isespecially interested in robots as working models of life, evolution, intelligenceand culture. Alan is passionate about communicating science and technology.He holds an EPSRC Senior Media Fellowship with the theme Intelligent Robotsin Science and Society, and blogs about robots, open science and related topicsat http://alanwinfield.blogspot.com/.
Working at Google — Especially in UserExperience
Lidia Oshlyansky
Senior User Experience Researcher, Google [email protected]
Abstract
This talk will focus on alternatives to academia, in particular, working in in-dustry (with a focus on industry in the UK). It will explore the types of rolesavailable to engineers, researchers, and “user experience” designers. The focuswill primarily be on the user experience roles available, and the challenges facedby those who undertake them within the context of a large company. The talkwill also reveal some facts about the working life at Google and the company’sculture.
Biography
Lidia began her professional career as a social worker before moving into Com-puter Science. Here, she moved from database programming and computer ar-chitectures to Human Computer Interaction (HCI). Her career in HCI has takenher through various roles and companies. She has worked for dot-com companies(including Orbitz.com and Cars.com), as a consultant in the financial sector, andfor an agency (where clients included WWF.org, Royal Mail, and the UK’s De-partment of Health). More recently she has worked as a user researcher for Nokiaand now Google. At Google, she has worked as a researcher for AdSense, You-Tube, Google Product Search, and also assisted teams investigating emergingmarkets.
Lidia completed her PhD in HCI in the UK, where she has been working andliving for the last eight years.

Part II
Full-Length Papers

3D Texture Analysis using Co-occurrence Matrix Feature for Classification
Shahzad Anwar, Lyndon N. Smith, Melvyn L. Smith
Machine Vision Laboratory, Department of Engineering, Design and Mathematics, University of the West of England, Frenchay campus, Coldharbour Lane, Bristol, BS16 1QY, UK.
Abstract. This article describes the usefulness of employing co-occurrence matrices (CM) as feature extraction and neural network (NN) for classifying 3D texture. The goal is to extract 3D textural features and analyse them for classification. To accomplish this, this research has adopted Photometric stereo (PS) method for capturing images and a CM based approach for modelling the surface normals and a backpropagation NNs for classification. The PS acquired images were processed, slant and tilt angles were calculated as features. The network trained for 20000 epochs and 10 hidden layer neurons were employed for classification. The system overall performance shows a regression of 0.89, which confirms the suitability of the model. We have examined three different textures as case sample for a three class problem. The respective method demonstrates how images are analysed, processed and characterised and how the NN is applied to this imaging problem.
Keywords: 3D imaging, co-occurrence matrix, neural network
1 Introduction
Texture is a term often referring to properties that represent the surface of an object; it is widely refereed in literature, however, has no precise definition due to its wide variability. Here we describe texture a group of pixels repeating in a pattern (a texture primitive or texture element). Texture classification is to assign texture label to unidentified texture according to the training samples and classification rules. Two main subjects are crucial for texture analysis, the feature extraction and classification. The foremost objective of texture classification is to find the best matched category for a given texture among existing textures. There are numerous approaches in the literature for texture analysis where research community have comprehensively discussed statistical, signal processing and model-based techniques [1-3].
Texture analysis via computer vision is a challenging area, attracting much of the research community. The problems encountered are due to the inherent complexity contained in the images. Neural Networks (a biological nerves system) have proved to be very useful in application to complex image understanding as well as within clinical imaging analysis. During the past decade NN’s have become a tool for
6 Shahzad Anwar, Lyndon N. Smith, Melvyn L. Smith
classification. NN applications in Computer Aided Diagnosing (CAD) corresponds to the foremost application of computational intelligence in medical imaging [4-6]. NN contribution are wide-ranging for all medical problems due to the fact that NN’s have the quality of learning from input information and by using an appropriate learning algorithm are capable of adjusting in accordance with the variation in the inputs. NNs have the capability of optimising the input output relation, leading to reliable solutions. The work reported the machine vision laboratory UWE Bristol have appraised NN with great success [7, 8].
Using a computerised model for the detection of melanoma in clinical images, Ding [9] examined skin tilt /skin slant method for feature analysis. Three-layer multilayer perceptron (MLP) NN was employed to classify benign and malignant images. The method use error-back propagation network with two input units corresponding to the skin tilt/skin slant features of each image; with one classifier output (one indicating melanoma and zero benign). Twenty clinical samples (images) were investigated in the experiments.
Many researchers have refereed NNs in literature, incorporating NNs for classification. For instance Cheng [10] suggested NN together with a mathematical model for cluster micro-calcifications with a noisy background. The scheme is based on allowing all mammogram as topographic descriptor where micro-calcification appears as an elevation comprising a regional maximum. Similarly Nagel [11] investigated three methods of feature analysis, rule based, NN and a combined method. The NN scheme employed having three-layer error-back propagation (EBP) network with five input units equivalent to the radiographic description of all micro-calcification and one output unit correspond to the microcalcification. The design was based on two inner layer neurons with a suggestion to increase the hidden neurons for quality performance. This work is based on [12], where CM were incorporated for quantification of the bump map. To implement gradient analysis, the gradient of the bump map was quantised into discrete values. This was achieved by categorising each gradient in terms of its angle from a set vector (slant angle) and the four quadrants of the x/y plane. Four ranges were introduced to quantify the angle, subsequently two four by four matrices were obtained. The CM data was next fed to the NN for classification. There are numerous clinical areas where NNs have successfully been employed [13-16], however, yet to deal with classification needs further research.
To offer helpful insights into our NN techniques for information processing, we organised the article in sections. Section 2 presents materials and methods in understanding the structure followed by a brief description of CM and feature extraction. In section 3, we have presented results followed by discussion. Finally, section 4 concludes the article.
3D Texture Analysis using Co-occurrence Matrix Feature for Classification 7
2 Materials and Methods
2.1 Photometric Stereo (PS)
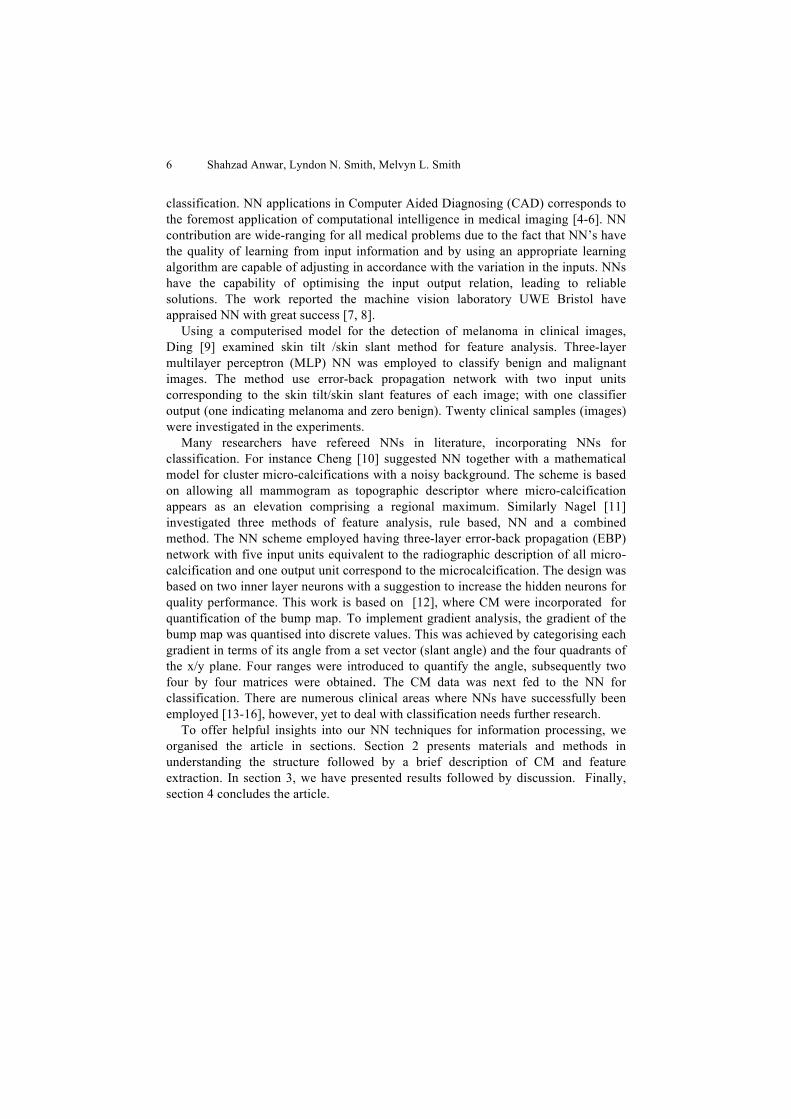
The hypothesis of the PS model is based on 3-light photometric stereo [17] which uses a Lambertian diffuse model to describe the surface reflectance properties by capturing three images, with each under a differently-positioned illumination as illustrated in Fig. 1.These three images are necessary to solve the irradiance equation. This is in contrast to conventional photographs which are susceptible to image artefacts such as shadows and highlights. The PS theory is to use a surface reflectance model to recover the surface’s physical properties (orientations and reflection). At least three images each captured from a fixed point under different illumination are required for dimensional orientation. The next stage is to compute surface normal vectors which are calculated via solving the irradiance equations, thereby generating 3D surface description.
Fig. 1. PS geometry with tilt & slant angle
The light sources are point sources at a distance in different positions. The direction of the light which is a single moveable source is defined by two angles. The slant angle δ is the angle between the illumination vector and the z-axis. The tilt angle τis the angle between the x-axis and the projection of the illumination vector onto the x-y plane. The surface texture to be composed of components each one of which corresponds to a unique image pixel. The orientation of each facet is given by the surface normal n. It is also often represented in terms of the surface gradients p and q. If the texture is described by a height function z(x, y), then surface gradients are given by:
! = !"(!, !)!" & ! = !"(!, !)
!" . (1)
We begin from a hypothetical replica of a solitary neuron followed by introducing a choice of NN to disclose their arrangement, function and training algorithms. Where
...3,2,1, nixX i == represent the inputs to the neuron and Y represents the output. Here each input is multiplied by its weight iw . This is added to a biasb , associated

8 Shahzad Anwar, Lyndon N. Smith, Melvyn L. Smith
with each neuron and their sum goes through a transfer function f. The connection between the inputs and outputs could be described as follows.
! = ! !!!! + !!!!! . (2)
In theory, the fundamental structure of a neuron could be modelled as depicted in Fig. 2.
Fig. 2. A representation of perceptron
There are a range of transfer functions available to process the weights. Three basic transfer functions widely adopted for image processing are illustrated in Fig. 3. The particular output could be achieved via employing suitable transfer function.
Fig. 3. Three commonly employed transfer functions
A MLP is a particular type of feed-forward network utilising three or more layers with nonlinear transfer functions in the hidden layer neurons. The MLP is able to associate training patterns with outputs for nonlinearly separable data. These networks are predominantly appropriate for applications in image processing where inputs/outputs are numerical and pairs of input/output vectors provide an obvious foundation for training in a supervised manner.
The apparatus has been tested in the Machine Vision Laboratory UWE Bristol on three set of textures. The apparatus is composed of an IEEE 1394 digital camera (PIKE F100B) and a high-resolution compact lens (Schneider, 1.4/23 mm). The Pike F-100B is equipped with Kodak KAI-1020 CCD sensor. At full resolution it runs at 60 fps (Mono8/RAW). The camera’s image pre-processing functions include a high signal to noise mode (up to 24 dB better signal-to-noise ratios). The imaging device works with customised software. In practice, the CCD camera is placed with its axis perpendicular to the object (texture) and takes 3 images each under a different LED
3D Texture Analysis using Co-occurrence Matrix Feature for Classification 9
illumination. Once the images are captures next step is to model the surface normals (bump map) and extract the features, this was accomplished via employing Co-occurrence Matrix.
2.2 Co-occurrence Matrix (CM)
The image histogram can provide useful information about the pixel distribution however; it may not provide valuable information about texture (the spatial relationships of pixels in an image). Statistical method that does consider the spatial relationship of pixels is co-occurrence matrix (CM). Whilst CMs are a rich representation of an image at the same time they are too bulky. The CM conveys information concerning the simultaneous occurrence of two grey values in a certain relative position. CM texture considers the relation between two pixels at a time called the reference and the neighbour pixel. The neighbour pixel is chosen to be the one to the east (right) of each reference pixel. This could also be expressed as a (1, 0) relation: 1 pixel in the x direction and 0 pixels in the y direction. Now, given that the levels are discrete this function is defined over pairs of discrete values and so it becomes a discrete function which may be represented by a matrix. These elements of CM have been shown to be good textural descriptors [18].
2.3 Feature Selection
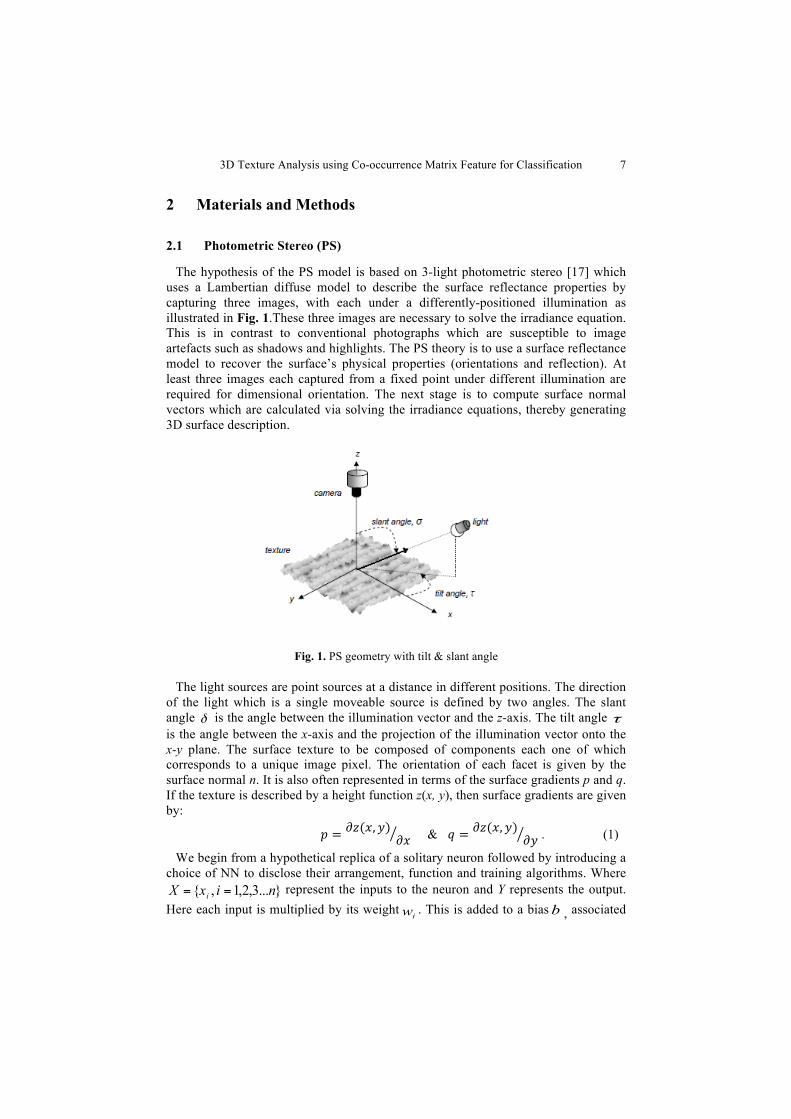
In order to implement the model, the surface normal is quantised into discrete values that correspond to grey levels. This was achieved by splitting each gradient in terms of its angle from a set vector and the four quadrants of the Cartesian plane in which it is situated. Each individual vector makes a horizontal angle between 0 to 360o on the x-y plane which is called the tilt angle and is denoted byτ . The same vector makes a vertical angle between 0-45o, called the slant angle and is denoted byδ . To quantise the CM data, the slant angle was divided into three 15o ranges which is shown in Table 1a and the tilt angle τ into three 120o angles range which is illustrated in Table 1b.
Table 1. Slant and Tilt angle quantisation
10 Shahzad Anwar, Lyndon N. Smith, Melvyn L. Smith
This results in two CMs, which represent the surface gradient at a given location (one for the angle and one for the quadrant location of the gradient vector). A distance (d = 1) and relative angles of 0o, 45o, 90o and 135o were employed for experiments. Three ranges were employed to quantify the angle so two three by three matrices (i.e. nine coefficients) were obtained for the CM at each region analysed. The size of the CM depends upon the number of levels (corresponding to grey levels in 2D image). The intensity variations which characterise the texture are generally due to some physical variation in the scene. These intensity variations are distributed over a region in texture. This model has the ability to capture features depending on grey level in 3D imaging. The dimension of the texture feature space derived from the CM matrices at different pixel distances and directions was very large. It was observed that the presence of ineffective features often degrades classifier performance especially when the training data set is small. Investigators in CAD research have employed different methods for feature selection. Wu [19] suggested features were based on the difference in the average values of the individual features between the two classes. In addition Lo [16] ranked the importance of each feature based on its effect on the classification accuracy and then eliminated the features at a time; from the least important to the most important to determine the smallest set of features that provided the highest classification accuracy in the data set. The procedure in linear analysis is an established method for the selection of features for classification task. Momentarily, a single feature is added to or removed from a selection of feature set. We employed feed-forward backpropagation NN for feature classification. The classification accuracies of different feature sets were subsequently evaluated via regression analysis.
3 Results and Discussion
In the setup, nodes are organised with in an input layer, an output layer and hidden layers as shown in Fig. 4. The learning of the NN is a supervised process where known training set are the input to the NN and the weights are adjusted with an iterative backpropagation procedure in order to accomplish a desired input–output association. To enhance the convergence rate and steadiness a batch processing were implemented where the weight changes obtained from each training set were accumulated and weights were updated after the entire set of training cases. The batch processing method improves the stability with a trade-off in the convergence. The three inputs to the network consist of two inputs from CMs generated and third input indicating the direction and distance of the pixel (as described in section 2.2).
3D Texture Analysis using Co-occurrence Matrix Feature for Classification 11
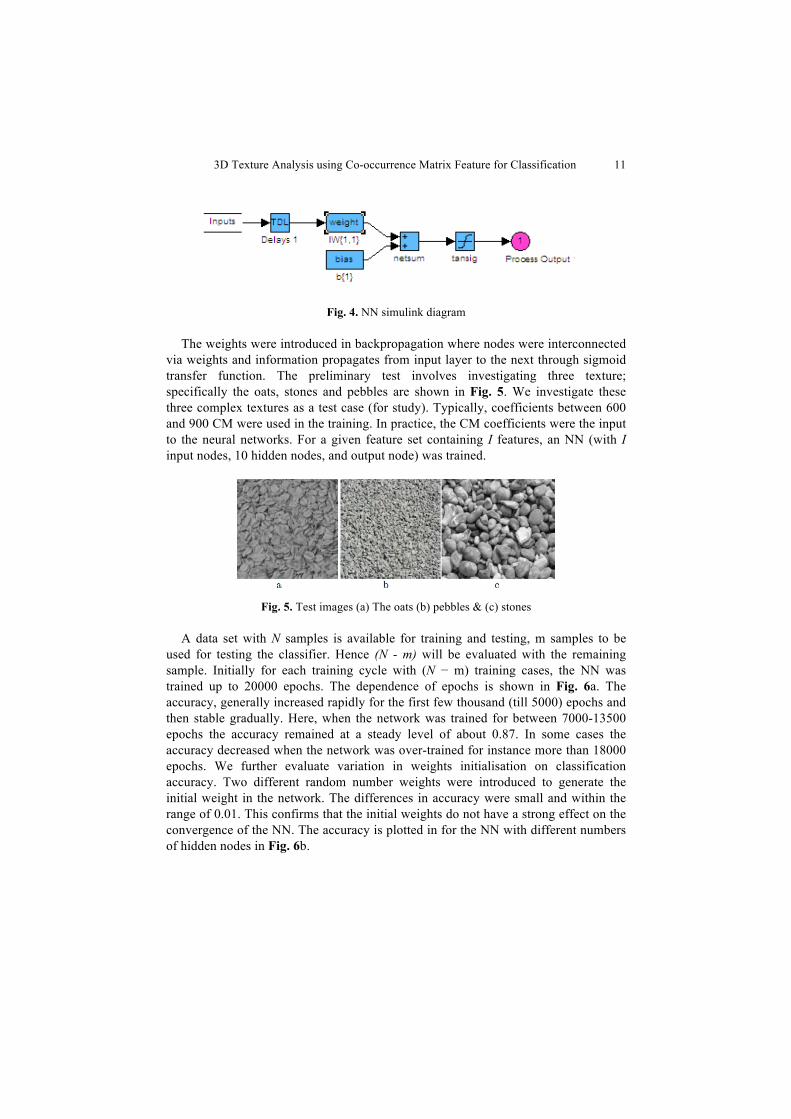
Fig. 4. NN simulink diagram
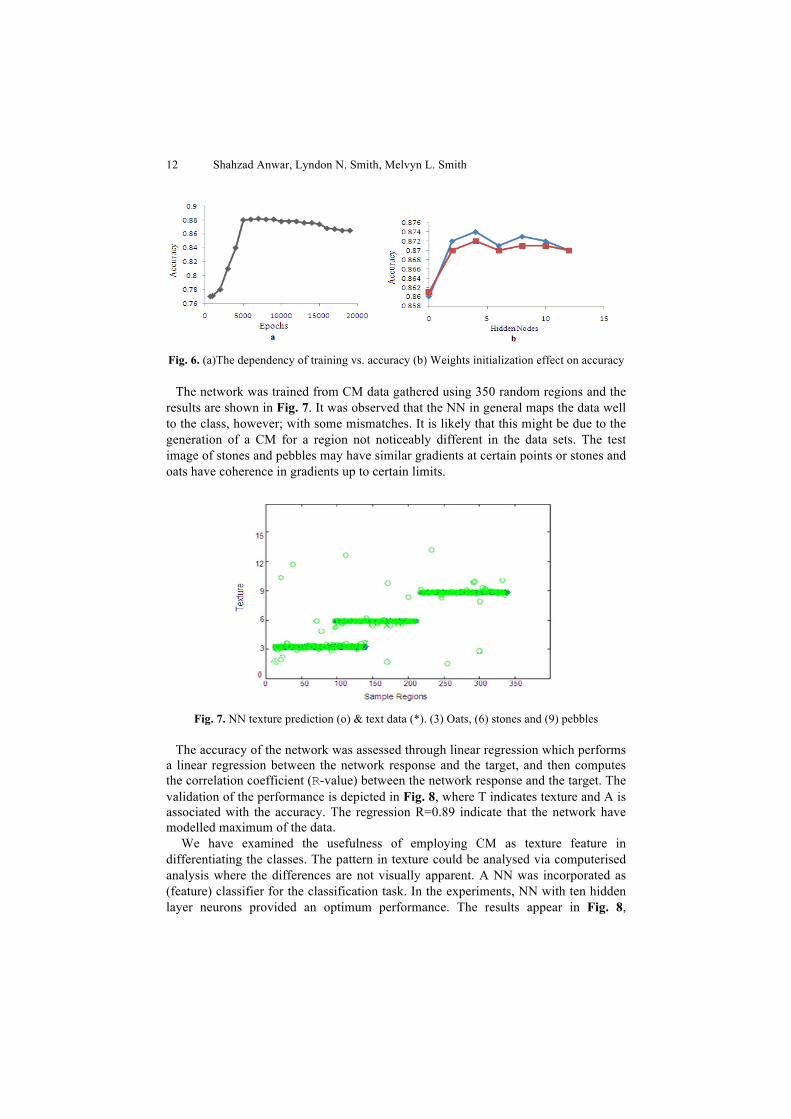
The weights were introduced in backpropagation where nodes were interconnected via weights and information propagates from input layer to the next through sigmoid transfer function. The preliminary test involves investigating three texture; specifically the oats, stones and pebbles are shown in Fig. 5. We investigate these three complex textures as a test case (for study). Typically, coefficients between 600 and 900 CM were used in the training. In practice, the CM coefficients were the input to the neural networks. For a given feature set containing I features, an NN (with I input nodes, 10 hidden nodes, and output node) was trained.
Fig. 5. Test images (a) The oats (b) pebbles & (c) stones
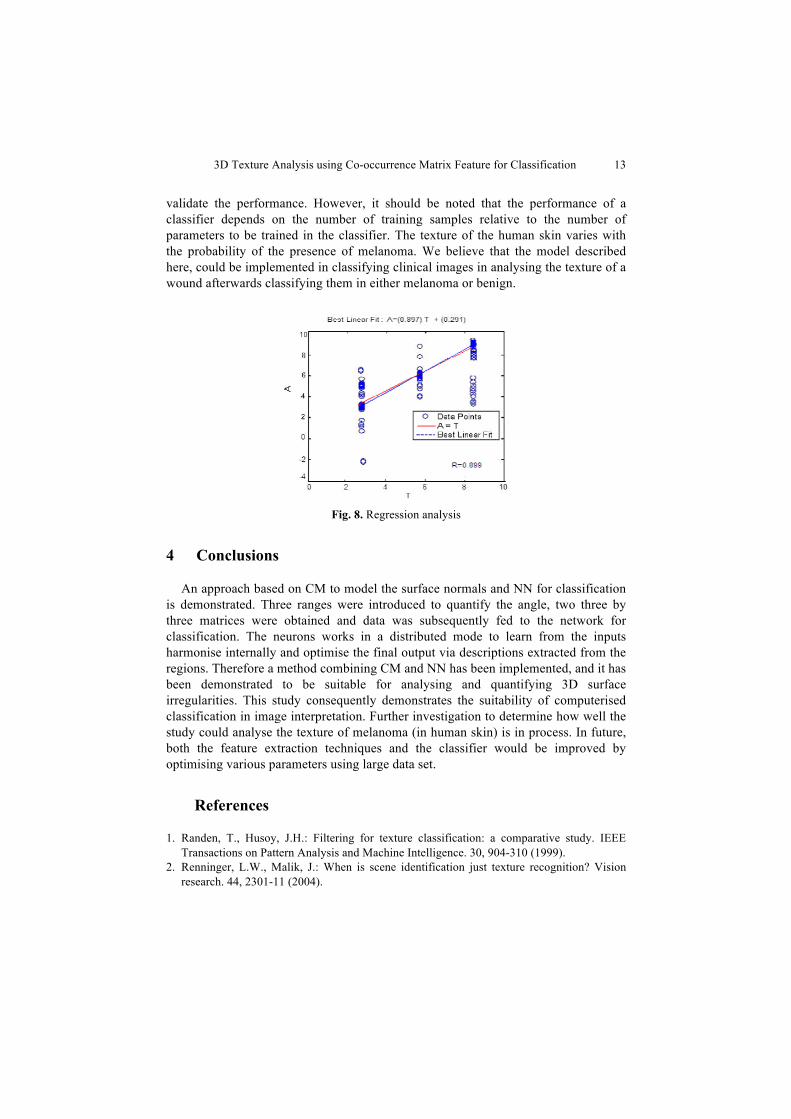
A data set with N samples is available for training and testing, m samples to be used for testing the classifier. Hence (N - m) will be evaluated with the remaining sample. Initially for each training cycle with (N − m) training cases, the NN was trained up to 20000 epochs. The dependence of epochs is shown in Fig. 6a. The accuracy, generally increased rapidly for the first few thousand (till 5000) epochs and then stable gradually. Here, when the network was trained for between 7000-13500 epochs the accuracy remained at a steady level of about 0.87. In some cases the accuracy decreased when the network was over-trained for instance more than 18000 epochs. We further evaluate variation in weights initialisation on classification accuracy. Two different random number weights were introduced to generate the initial weight in the network. The differences in accuracy were small and within the range of 0.01. This confirms that the initial weights do not have a strong effect on the convergence of the NN. The accuracy is plotted in for the NN with different numbers of hidden nodes in Fig. 6b.
12 Shahzad Anwar, Lyndon N. Smith, Melvyn L. Smith
Fig. 6. (a)The dependency of training vs. accuracy (b) Weights initialization effect on accuracy
The network was trained from CM data gathered using 350 random regions and the results are shown in Fig. 7. It was observed that the NN in general maps the data well to the class, however; with some mismatches. It is likely that this might be due to the generation of a CM for a region not noticeably different in the data sets. The test image of stones and pebbles may have similar gradients at certain points or stones and oats have coherence in gradients up to certain limits.
Fig. 7. NN texture prediction (o) & text data (*). (3) Oats, (6) stones and (9) pebbles
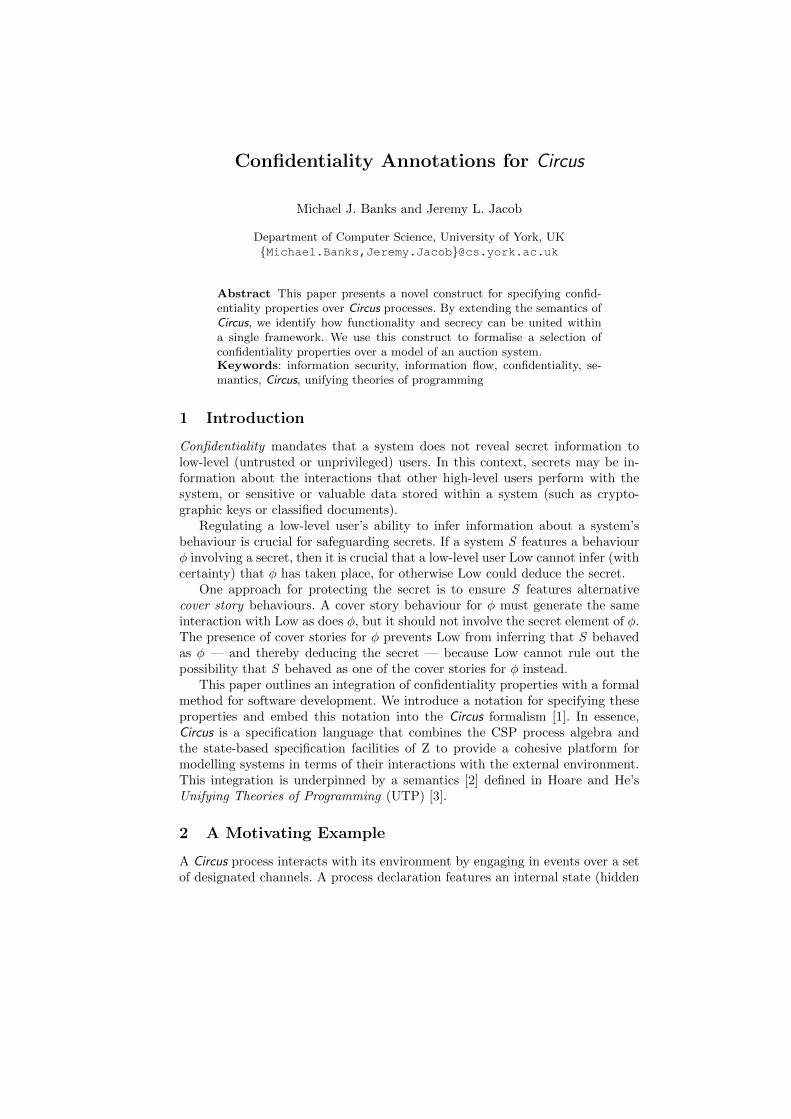
The accuracy of the network was assessed through linear regression which performs a linear regression between the network response and the target, and then computes the correlation coefficient (R-value) between the network response and the target. The validation of the performance is depicted in Fig. 8, where T indicates texture and A is associated with the accuracy. The regression R=0.89 indicate that the network have modelled maximum of the data.
We have examined the usefulness of employing CM as texture feature in differentiating the classes. The pattern in texture could be analysed via computerised analysis where the differences are not visually apparent. A NN was incorporated as (feature) classifier for the classification task. In the experiments, NN with ten hidden layer neurons provided an optimum performance. The results appear in Fig. 8,
3D Texture Analysis using Co-occurrence Matrix Feature for Classification 13
validate the performance. However, it should be noted that the performance of a classifier depends on the number of training samples relative to the number of parameters to be trained in the classifier. The texture of the human skin varies with the probability of the presence of melanoma. We believe that the model described here, could be implemented in classifying clinical images in analysing the texture of a wound afterwards classifying them in either melanoma or benign.
Fig. 8. Regression analysis
4 Conclusions
An approach based on CM to model the surface normals and NN for classification is demonstrated. Three ranges were introduced to quantify the angle, two three by three matrices were obtained and data was subsequently fed to the network for classification. The neurons works in a distributed mode to learn from the inputs harmonise internally and optimise the final output via descriptions extracted from the regions. Therefore a method combining CM and NN has been implemented, and it has been demonstrated to be suitable for analysing and quantifying 3D surface irregularities. This study consequently demonstrates the suitability of computerised classification in image interpretation. Further investigation to determine how well the study could analyse the texture of melanoma (in human skin) is in process. In future, both the feature extraction techniques and the classifier would be improved by optimising various parameters using large data set.
References
1. Randen, T., Husoy, J.H.: Filtering for texture classification: a comparative study. IEEE Transactions on Pattern Analysis and Machine Intelligence. 30, 904-310 (1999).
2. Renninger, L.W., Malik, J.: When is scene identification just texture recognition? Vision research. 44, 2301-11 (2004).

14 Shahzad Anwar, Lyndon N. Smith, Melvyn L. Smith
3. Meng, L., Ping, F., Shenghe, S.: 3D Texture Classification Using 3D Texture Histogram Model and SVM. International conference on Electronic measurement and Instruments. 940-943 (2007).
4. Zhou, Y., Smith, M., Smith, L., Warr, R.: Using 3D differential forms to characterize pigment lesion in vivo. Skin Research and Technology. 16, 77–84 (2010).
5. Arimura, H., Katsuragawa, S., Suzuki, K., Li, F., Shiraishi, J., Sone, S., Doi, K.: Computerized scheme for automated detection of lung nodules in low-dose computed tomography images for lung cancer screening. Academic Radiology. 11, 617–629 (2004).
6. Chiu, J.S., Wang, Y.F., Su, Y.C., Wei, L.H., Liao, J.G., Li, Y.C.: Artificial neural network to predict skeletal metastasis in patients with prostate cancer. Journal of Medical Systems. 33, 91–100 (2009).
7. Ding, Y., Smith, L.N., Smith, M.L., Sun, J.: A computer assisted diagnosis system for malignant melanoma using 3D skin surface texture features and artificial neural network. International Journal of Modelling, Identification and Control. 9, 370-381 (2010).
8. Smith, L.N., Smith, M.L.: Automatic machine vision calibration using statistical and neural network methods. Image and Vision Computing. 23, 887–899 (2005).
9. Ding, Y., Smith, L., Smith, M., Sun, J., Warr, R.: Obtaining malignant melanoma indicators through statistical analysis of 3D skin surface disruptions. Skin Research and Technology. 15, 262-70 (2009).
10. Cheng, H., Shi, X., Min, R., Hu, L., Cai, X., Du, H.: Approaches for automated detection and classification of masses in mammograms. Pattern Recognition. 39, 646–668 (2006).
11. Nagel, R.H., Nishikawa, R., Doi, K.: Analysis of methods for reducing false positives in the automated detection of clustered microcalcifications in mammograms. Medical Physics. 25, 1502-1506 (1998).
12. Smith, L.N., Smith, M.L.: Analysis of Three Dimensional Textures Through use of Photometric Stereo, Co-occurrence Matrices and Neural Networks. International Conference of Computational Methods in Sciences and Engineering, Greece (2009).
13. Zhou, Z.H., Jiang, Y., Yang, Y.B., Chen, S.F.: Lung cancer cell identification based on artificial neural network ensembles. Artificial Intelligence in Medicine. 24, 25–36 (2002).
14. Yamashita, K., Yoshiura, T., Arimura, H., Mihara, F., Noguchi, T., Hiwatashi, A., Togao, O., Yamashita, Y., Shono, T., Kumazawa, S., Higashida, Y., Honda, H.: Performance evaluation of radiologists with artificial neural network for differential diagnosis of intra-axial cerebral tumors on MR images. American journal of neuroradiology. 29, 1153-8 (2008).
15. Guo, D., Qiu, T., Bian, J., Kang, W., Zhang, L.: A computer-aided diagnostic system to discriminate SPIO-enhanced magnetic resonance hepatocellular carcinoma by a neural network classifier. Computerized Medical Imaging and Graphics. 33, 588–592 (2009).
16. Lo, J., Baker, J., Kornguth, P.: Computer-aided diagnosis of breast cancer: artificial neural network approach for optimized merging of mammographic features. Academic Radiology. 187, 81-87 (1995).
17. Woodham, R.J.: Photometric method for determining surface orientation from multiple images. Optical Engineering. 19, 139–144 (1980).
18. Tesar, L., Smutek, D., Shimizu, A., Kobatake, H.: Medical image segmentation using co-occurrence matrix based texture features calculated on weighted region. Advances in Computer Science and Technology. ACTA Press (2007).
19. Wu, Y., Vyborny, J.: Artificial neural networks in mammography: application to decision making in the diagnosis of breast cancer. Radiology. 187, 81–87 (1993).
Confidentiality Annotations for Circus
Michael J. Banks and Jeremy L. Jacob
Department of Computer Science, University of York, UKMichael.Banks,[email protected]
Abstract This paper presents a novel construct for specifying confid-entiality properties over Circus processes. By extending the semantics ofCircus, we identify how functionality and secrecy can be united withina single framework. We use this construct to formalise a selection ofconfidentiality properties over a model of an auction system.Keywords: information security, information flow, confidentiality, se-mantics, Circus, unifying theories of programming
1 Introduction
Confidentiality mandates that a system does not reveal secret information tolow-level (untrusted or unprivileged) users. In this context, secrets may be in-formation about the interactions that other high-level users perform with thesystem, or sensitive or valuable data stored within a system (such as crypto-graphic keys or classified documents).
Regulating a low-level user’s ability to infer information about a system’sbehaviour is crucial for safeguarding secrets. If a system S features a behaviourφ involving a secret, then it is crucial that a low-level user Low cannot infer (withcertainty) that φ has taken place, for otherwise Low could deduce the secret.
One approach for protecting the secret is to ensure S features alternativecover story behaviours. A cover story behaviour for φ must generate the sameinteraction with Low as does φ, but it should not involve the secret element of φ.The presence of cover stories for φ prevents Low from inferring that S behavedas φ — and thereby deducing the secret — because Low cannot rule out thepossibility that S behaved as one of the cover stories for φ instead.
This paper outlines an integration of confidentiality properties with a formalmethod for software development. We introduce a notation for specifying theseproperties and embed this notation into the Circus formalism [1]. In essence,Circus is a specification language that combines the CSP process algebra andthe state-based specification facilities of Z to provide a cohesive platform formodelling systems in terms of their interactions with the external environment.This integration is underpinned by a semantics [2] defined in Hoare and He’sUnifying Theories of Programming (UTP) [3].
2 A Motivating Example
A Circus process interacts with its environment by engaging in events over a setof designated channels. A process declaration features an internal state (hidden
16 Michael J. Banks and Jeremy L. Jacob
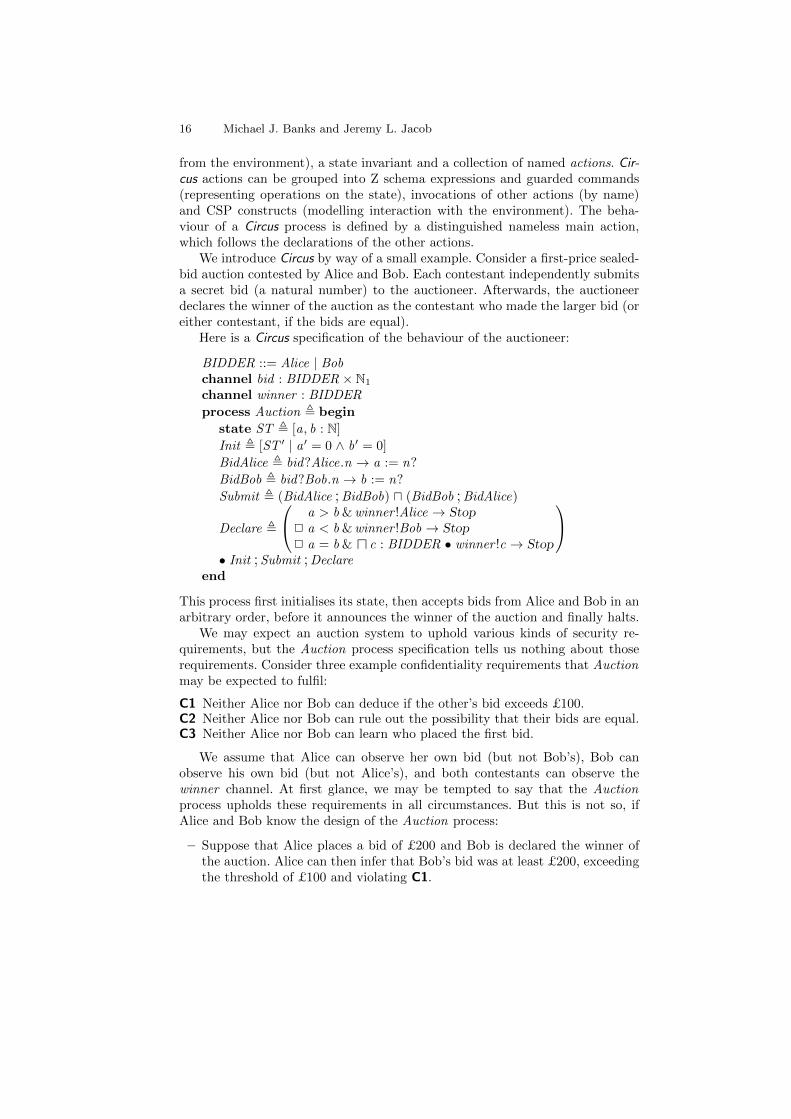
from the environment), a state invariant and a collection of named actions. Cir-cus actions can be grouped into Z schema expressions and guarded commands(representing operations on the state), invocations of other actions (by name)and CSP constructs (modelling interaction with the environment). The beha-viour of a Circus process is defined by a distinguished nameless main action,which follows the declarations of the other actions.
We introduce Circus by way of a small example. Consider a first-price sealed-bid auction contested by Alice and Bob. Each contestant independently submitsa secret bid (a natural number) to the auctioneer. Afterwards, the auctioneerdeclares the winner of the auction as the contestant who made the larger bid (oreither contestant, if the bids are equal).
Here is a Circus specification of the behaviour of the auctioneer:
BIDDER ::= Alice | Bobchannel bid : BIDDER × N1
channel winner : BIDDER
process Auction , begin
state ST , [a, b : N]
Init , [ST ′ | a ′ = 0 ∧ b′ = 0]
BidAlice , bid?Alice.n → a := n?
BidBob , bid?Bob.n → b := n?
Submit , (BidAlice ;BidBob) u (BidBob ;BidAlice)
Declare ,
a > b & winner !Alice → Stop2 a < b & winner !Bob → Stop2 a = b & u c : BIDDER • winner !c → Stop
• Init ;Submit ;Declare
end
This process first initialises its state, then accepts bids from Alice and Bob in anarbitrary order, before it announces the winner of the auction and finally halts.
We may expect an auction system to uphold various kinds of security re-quirements, but the Auction process specification tells us nothing about thoserequirements. Consider three example confidentiality requirements that Auctionmay be expected to fulfil:
C1 Neither Alice nor Bob can deduce if the other’s bid exceeds £100.C2 Neither Alice nor Bob can rule out the possibility that their bids are equal.C3 Neither Alice nor Bob can learn who placed the first bid.
We assume that Alice can observe her own bid (but not Bob’s), Bob canobserve his own bid (but not Alice’s), and both contestants can observe thewinner channel. At first glance, we may be tempted to say that the Auctionprocess upholds these requirements in all circumstances. But this is not so, ifAlice and Bob know the design of the Auction process:
– Suppose that Alice places a bid of £200 and Bob is declared the winner ofthe auction. Alice can then infer that Bob’s bid was at least £200, exceedingthe threshold of £100 and violating C1.
Confidentiality Annotations for Circus 17
– Likewise, C2 may be defeated by specific bids from Alice and Bob. We leavethe task of determining the values of those bids as an exercise to the reader.1
It would be desirable to specify these confidentiality requirements formally, sothey can be accommodated as “first-class citizens” within Circus developments.
3 Specifying Confidentiality Properties
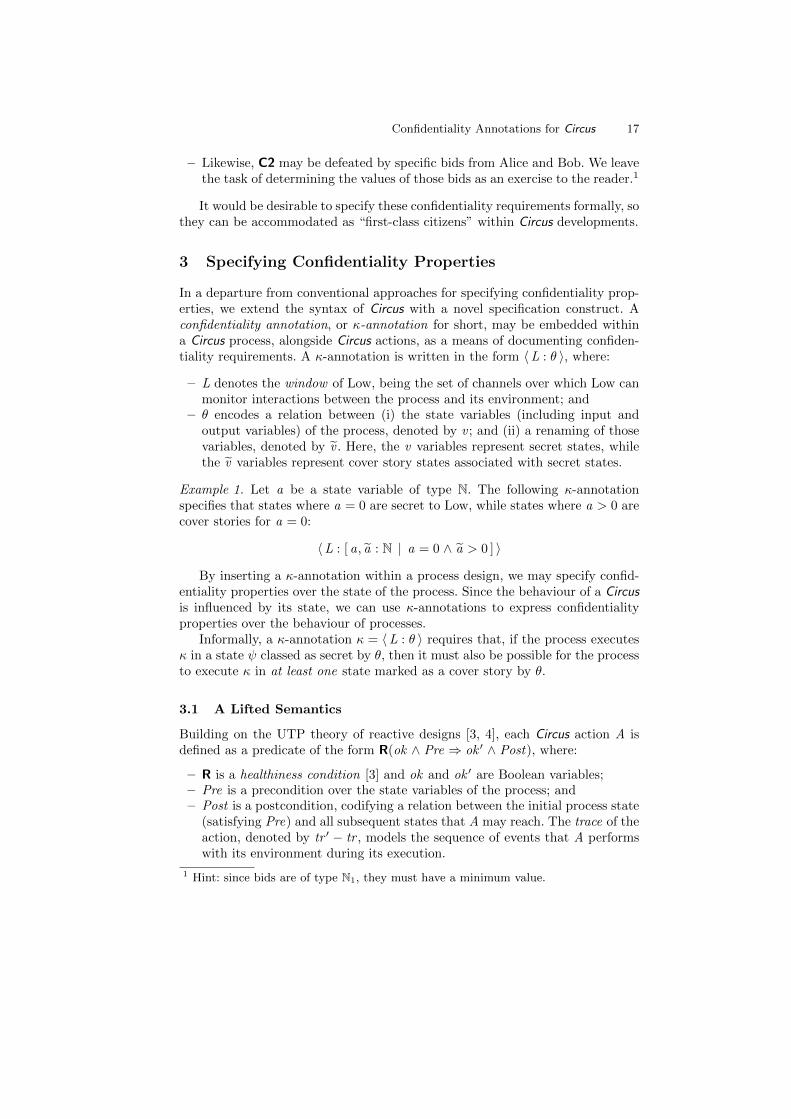
In a departure from conventional approaches for specifying confidentiality prop-erties, we extend the syntax of Circus with a novel specification construct. Aconfidentiality annotation, or κ-annotation for short, may be embedded withina Circus process, alongside Circus actions, as a means of documenting confiden-tiality requirements. A κ-annotation is written in the form 〈L : θ 〉, where:
– L denotes the window of Low, being the set of channels over which Low canmonitor interactions between the process and its environment; and
– θ encodes a relation between (i) the state variables (including input andoutput variables) of the process, denoted by v ; and (ii) a renaming of thosevariables, denoted by v . Here, the v variables represent secret states, whilethe v variables represent cover story states associated with secret states.
Example 1. Let a be a state variable of type N. The following κ-annotationspecifies that states where a = 0 are secret to Low, while states where a > 0 arecover stories for a = 0:
〈L : [ a, a : N | a = 0 ∧ a > 0 ] 〉
By inserting a κ-annotation within a process design, we may specify confid-entiality properties over the state of the process. Since the behaviour of a Circusis influenced by its state, we can use κ-annotations to express confidentialityproperties over the behaviour of processes.
Informally, a κ-annotation κ = 〈L : θ 〉 requires that, if the process executesκ in a state ψ classed as secret by θ, then it must also be possible for the processto execute κ in at least one state marked as a cover story by θ.
3.1 A Lifted Semantics
Building on the UTP theory of reactive designs [3, 4], each Circus action A isdefined as a predicate of the form R(ok ∧ Pre ⇒ ok ′ ∧ Post), where:
– R is a healthiness condition [3] and ok and ok ′ are Boolean variables;– Pre is a precondition over the state variables of the process; and– Post is a postcondition, codifying a relation between the initial process state
(satisfying Pre) and all subsequent states that A may reach. The trace of theaction, denoted by tr ′ − tr , models the sequence of events that A performswith its environment during its execution.
1 Hint: since bids are of type N1, they must have a minimum value.
18 Michael J. Banks and Jeremy L. Jacob
In order to give a semantics to κ-annotations, we need first to lift the se-mantics of Circus actions. This lifting is conservative, in the sense that a Circusspecification without κ-annotations has exactly the same meaning in the liftedsemantics as it does in the original Circus semantics.
Given an action A — where A does not contain a κ-annotation — we define:
U (A) , A ∧ A[x , x ′/x , x ′] (1)
where x denotes the state (variables) when A commences, x ′ denotes the state
that A reaches, and A[x , x ′/x , x ′] denotes A with a renamed state space.The lifted action U (A) behaves as A, but each behaviour of A is related
to every behaviour of A encoded over a renaming (x , x ′) of A’s observationalvariables. We call the latter behaviours the fog of A. Their purpose is to trackwhat Low can infer about the process state at each step in its execution.
In the worst case, Low may possess complete knowledge of a process’s design;therefore, Low may infer all process behaviours that are consistent with its inter-action with the process. We model Low’s inability to distinguish two behavioursof an action by defining a predicate IL, where L denotes Low’s window set:
IL =
(ok = ok ∧ ok ′ = ok ′ ∧ wait = wait ∧ wait ′ = wait ′
∧ (tr ′ − tr) L = (tr ′ − tr) L
)(2)
This predicate maps a behaviour to a fog behaviour if their respective traces— when projected through L — yield the same observation to Low. Hence, ILrestricts the fog associated with each behaviour φ of a lifted action to only thosefog behaviours that are Low-indistinguishable to φ.
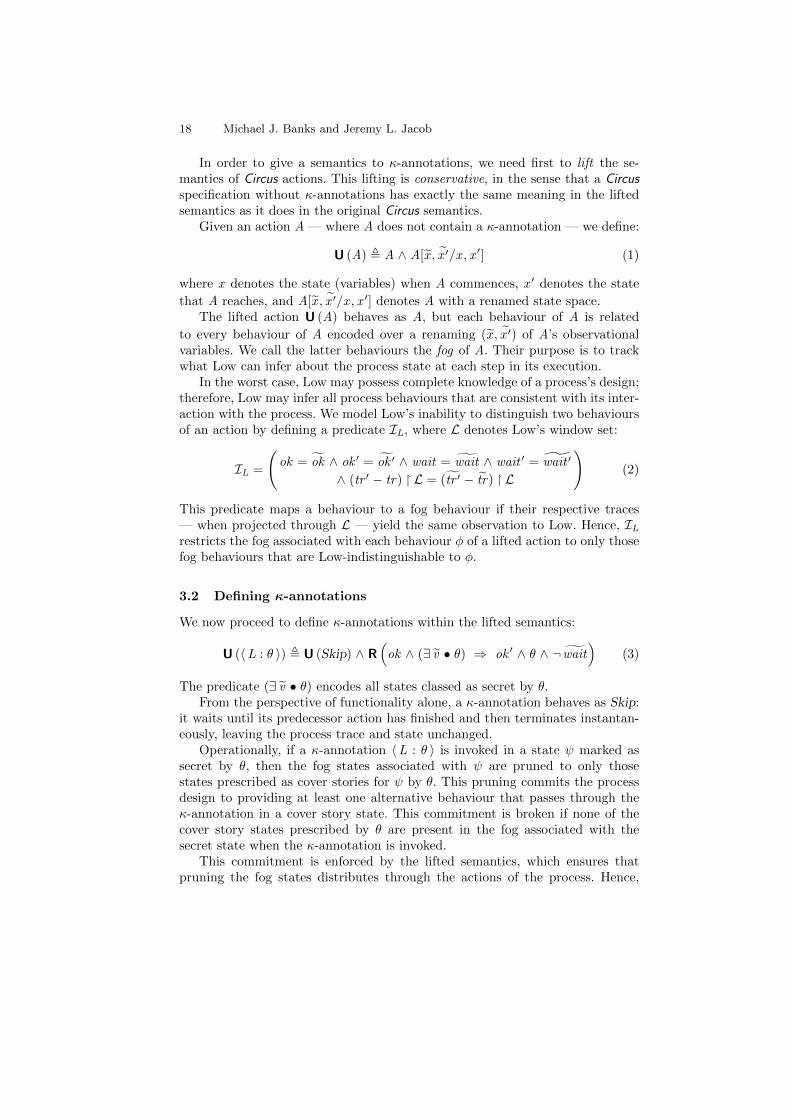
3.2 Defining κ-annotations
We now proceed to define κ-annotations within the lifted semantics:
U (〈L : θ 〉) , U (Skip) ∧ R(
ok ∧ (∃ v • θ) ⇒ ok ′ ∧ θ ∧ ¬ wait)
(3)
The predicate (∃ v • θ) encodes all states classed as secret by θ.From the perspective of functionality alone, a κ-annotation behaves as Skip:
it waits until its predecessor action has finished and then terminates instantan-eously, leaving the process trace and state unchanged.
Operationally, if a κ-annotation 〈L : θ 〉 is invoked in a state ψ marked assecret by θ, then the fog states associated with ψ are pruned to only thosestates prescribed as cover stories for ψ by θ. This pruning commits the processdesign to providing at least one alternative behaviour that passes through theκ-annotation in a cover story state. This commitment is broken if none of thecover story states prescribed by θ are present in the fog associated with thesecret state when the κ-annotation is invoked.
This commitment is enforced by the lifted semantics, which ensures thatpruning the fog states distributes through the actions of the process. Hence,
Confidentiality Annotations for Circus 19
the commitment may be broken after the κ-annotation is invoked, should theprocess’s subsequent behaviour reveal a secret to Low.
The next two examples illustrate the effects of κ-annotations on processes.
Example 2. What is the effect of inserting the κ-annotation from Example 1immediately after an assignment a := 1? We find that:
U (a := 1 ; 〈L : [ a, a : N | a = 0 ∧ a > 0 ] 〉) = U (a := 1)
This result is precisely what we should expect: the secret state a = 0 cannotbe reached by executing a := 1, so this κ-annotation is innocuous and can beremoved without changing the meaning of the specification. (A proof of thisresult is given in the Appendix.)
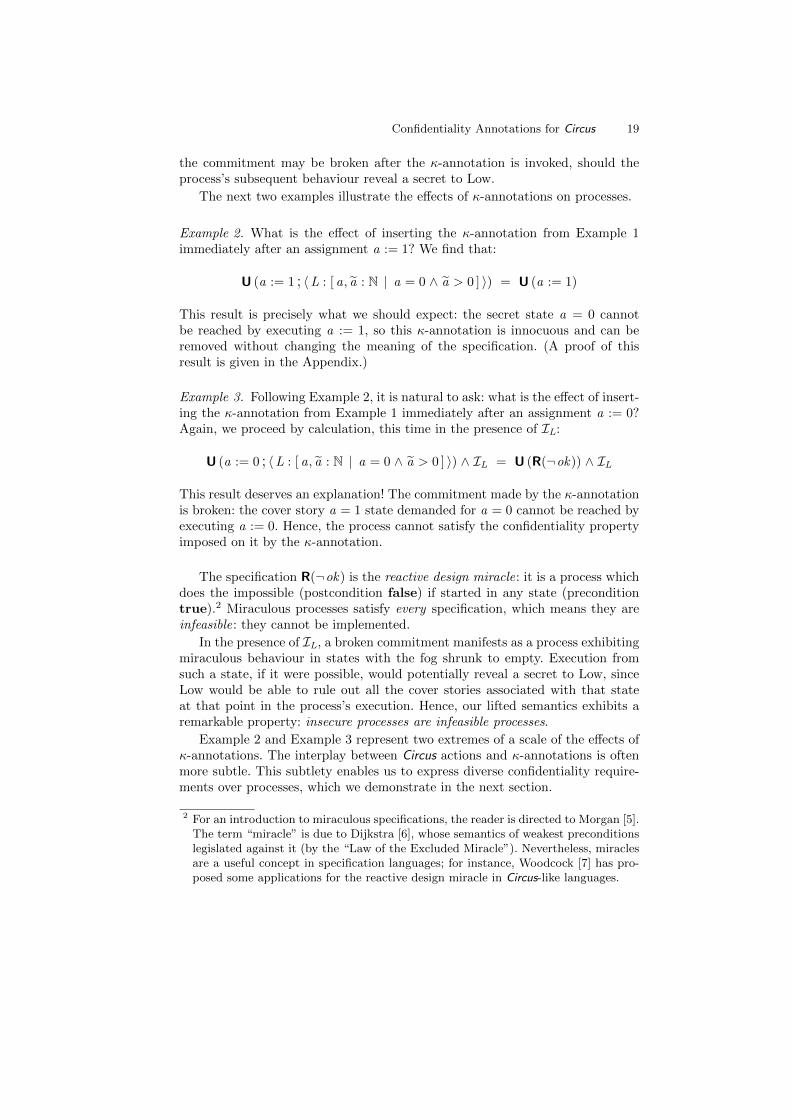
Example 3. Following Example 2, it is natural to ask: what is the effect of insert-ing the κ-annotation from Example 1 immediately after an assignment a := 0?Again, we proceed by calculation, this time in the presence of IL:
U (a := 0 ; 〈L : [ a, a : N | a = 0 ∧ a > 0 ] 〉) ∧ IL = U (R(¬ok)) ∧ IL
This result deserves an explanation! The commitment made by the κ-annotationis broken: the cover story a = 1 state demanded for a = 0 cannot be reached byexecuting a := 0. Hence, the process cannot satisfy the confidentiality propertyimposed on it by the κ-annotation.
The specification R(¬ok) is the reactive design miracle: it is a process whichdoes the impossible (postcondition false) if started in any state (preconditiontrue).2 Miraculous processes satisfy every specification, which means they areinfeasible: they cannot be implemented.
In the presence of IL, a broken commitment manifests as a process exhibitingmiraculous behaviour in states with the fog shrunk to empty. Execution fromsuch a state, if it were possible, would potentially reveal a secret to Low, sinceLow would be able to rule out all the cover stories associated with that stateat that point in the process’s execution. Hence, our lifted semantics exhibits aremarkable property: insecure processes are infeasible processes.
Example 2 and Example 3 represent two extremes of a scale of the effects ofκ-annotations. The interplay between Circus actions and κ-annotations is oftenmore subtle. This subtlety enables us to express diverse confidentiality require-ments over processes, which we demonstrate in the next section.
2 For an introduction to miraculous specifications, the reader is directed to Morgan [5].The term “miracle” is due to Dijkstra [6], whose semantics of weakest preconditionslegislated against it (by the “Law of the Excluded Miracle”). Nevertheless, miraclesare a useful concept in specification languages; for instance, Woodcock [7] has pro-posed some applications for the reactive design miracle in Circus-like languages.
20 Michael J. Banks and Jeremy L. Jacob
4 Formalising the Example
We claim that κ-annotations are capable of expressing a wide range of confid-entiality requirements over the state and behaviour of Circus processes. We offerevidence for this claim by formalising the confidentiality requirements listed inSection 2 as κ-annotations over the Auction process. Of course, these require-ments could be expressed using κ-annotations in many different ways, dependingon how their descriptions are interpreted.
First, we instantiate the Low observer as being either Alice or Bob. We specifyAlice and Bob’s window sets as follows:
A , (bid , (Alice,n)) | n ∈ N1 ∪ (winner , c) | c ∈ BIDDERB , (bid , (Bob,n)) | n ∈ N1 ∪ (winner , c) | c ∈ BIDDER
and associate the windows A and B with the labels A and B respectively. Next,we revise the Auction process to capture C1, C2 and C3 using κ-annotations.Consider the following declarations, which we substitute into the body of Auction:
C 1A , 〈A : [ b, b : N | b > 100 ∧ b ≤ 100 ] 〉C 1B , 〈B : [ a, a : N | a > 100 ∧ a ≤ 100 ] 〉C 2 , 〈A,B : [ a, b, a, b : N | a = b ∧ a 6= b ] 〉C 3 , 〈A,B : [ f , f : BIDDER | f 6= f ] 〉BidAlice , bid?Alice.n → a := n? ;C 1B
BidBob , bid?Bob.n → b := n? ;C 1A
Submit , var f ;(
BidAlice ;BidBob ; f := Aliceu BidBob ;BidAlice ; f := Bob
);C 2 ;C 3 ; end f
The κ-annotations attached to the BidAlice and BidBob actions capture C1.The κ-annotation declared as C 2A specifies that, if Alice’s bid exceeds £100,then it must not be possible for Bob to rule out all values of Alice’s bid that donot exceed £100. This κ-annotation makes the process behave miraculously incircumstances where its normal behaviour would violate C1 by leaking inform-ation to Bob enabling him to rule out all those values. The κ-annotation C 2Bspecifies the complementary constraint on Alice’s inferences about Bob’s bid.
We express C2 by extending Submit . Once both bids are made, C 2 mandatesthat, if the bid values (recorded in a and b) are equal, then the constraint a 6= bis imposed on the fog variables. Again, doing this has the potential to inducemiraculous behaviour in certain circumstances. The system developers wouldneed to consult with the customer to resolve this clash between functionalityand confidentiality.
To express C3, we introduce a local variable f into Submit in order to recordwhich contestant bids first. The κ-annotation C 3 specifies that Bob bidding firstserves as a cover story for Alice bidding first (f = Alice ∧ f = Bob), and vice
versa (f = Bob ∧ f = Alice). The behaviour of Auction reveals no informationabout which contestant bids first, so C 3 induces no miraculous behaviour. How-ever, C 3 cannot be removed from the specification without changing its meaningin the lifted semantics.
Confidentiality Annotations for Circus 21
5 Confidentiality-Preserving Refinement
Refinement is the act of improving a system design, by adding details describinghow aspects of the system are to be implemented by a programmer [5]. Refine-ment of a Circus process entails the reduction of non-determinism (removal ofpossible behaviours) from the process specification [1, 2].
Developing systems to satisfy confidentiality properties is problematic, notleast because standard notions of refinement are not guaranteed to preservethese properties in system designs [8, 9]. In our terminology, this is becausea refinement T of a process S may lack cover story behaviours present in Swhile retaining secret behaviours of S ; hence, Low may be able to infer secretinformation about the behaviour of T that it could not infer about S .
This so-called “refinement paradox” is resolved by our lifted semantics: ifcover stories that are needed to satisfy a κ-annotation are refined away from theprocess, then the κ-annotation will induce miraculous (i.e. unimplementable) be-haviour into the resulting process. Therefore, insecure refinements are infeasiblerefinements, as they lead to miraculous processes that cannot be implemented.
Example 4. Suppose Submit is refined so that Alice invariably bids first:
Submit , var f ;BidAlice ;BidBob ; f := Alice ;C 2 ;C 3 ; end f
Both Alice and Bob can now deduce that, if they have placed a bid, then Alicemust have bid first. Hence, this refinement violates C3. But C 3 now becomesmiraculous, as the cover story f = Bob it demands for f = Alice is absent.
6 Related Work
In previous work [10], we have described a framework for encoding confidentialityproperties in the UTP. This framework is generic and can be applied across therange of specification and programming languages that have a UTP semantics.This paper has presented an approach for specialising that framework to Circus.
Our notion of cover stories is inspired by Mantel’s Modular Framework forInformation Flow Properties (MAKS) [11], where a library of “basic securityproperties” are encoded as closure conditions over a system’s behaviour set.
The idea of embedding κ-annotations within Circus processes has its roots inan earlier YDS paper by the authors [12]. In that paper, a syntactic approach forrewriting a CSP process to uphold a confidentiality property is presented. Theapproach described in this paper involves more detailed manipulation of syntaxand semantics, but its foundations are arguably more solid and it incorporatesa notion of confidentiality-preserving refinement.
The lifted Circus semantics described in this paper has much in common withMorgan’s shadow semantics [13, 14], which extends the refinement calculus forsequential programs [5] to prevent refinement from revealing more informationabout high-level state to Low. In contrast, we have introduced an explicit con-struct to allow specification of exactly which properties of the state or behaviour
22 Michael J. Banks and Jeremy L. Jacob
of processes are secret, which is arguably a more flexible (albeit more involved)philosophy for integrating confidentiality into formal methods. In addition, byvirtue of the UTP semantics of Circus, our approach is also applicable to a widerdomain of programs than sequential programs.
An alternative approach for formulating confidentiality properties over Circusprocesses is described in another paper by the authors [15]. In that paper, confid-entiality properties are not embedded into a Circus specification directly, but areinstead specified separately over the actions that a process performs. To reconcilethese separate specifications, that approach necessitates an extension of the Cir-cus semantics that is considerably more complicated than the lifting proceduredescribed in Section 3. The aforementioned paper also describes a method forverifying that a process satisfies its confidentiality properties, by breaking thatrequirement into a set of proof obligations over localised regions of the process.A similar method can be applied to distribute κ-annotations through a process,justified by laws that follow directly from the lifted semantics.
The authors offer a more thorough account of related work elsewhere [10, 15].
7 Conclusion
In this paper, we have presented an approach for specifying confidentiality prop-erties in Circus. The novelty of this work is a single semantic framework weldingfunctionality and confidentiality together. As we have demonstrated in Section 4,this framework is sufficiently expressive to capture a wide range of confidentialityrequirements over Circus processes.
There is much work needed to make the framework appropriate for use inindustrial software development. We are currently evaluating its suitability byapplying it to a number of case study developments in Circus. There are othertopics worthy of investigation, such as identifying a semantics for declassifyingsecret information once that information need no longer be kept confidential.Furthermore, we conjecture the framework can be adapted to variants of Circusthat incorporate timing or probabilistic behaviour in their semantic models.
Mechanisms for automatically analysing whether a process satisfies its κ-annotations are a prerequisite for supporting the framework with effective tools.We have not investigated such mechanisms in depth, but we believe that modelchecking techniques would be a fruitful line of inquiry, based on existing workin the field [16–18]. However, it would be necessary to revise the semantics ofκ-annotations in order to work with existing model checkers, which is likely tobe a challenging task.
Acknowledgements. Michael Banks is supported by a UK Engineering andPhysical Sciences Research Council DTA studentship.
Thanks to the anonymous referees for their helpful comments on the technicaldetails on this paper and for identifying omissions in an earlier draft. Thanks alsoto Chris Poskitt, Jason Reich and Lesley Wevers for their advice on presentingthe material within this paper at a recent conference and thesis seminar.

Confidentiality Annotations for Circus 23
References
1. Woodcock, J., Cavalcanti, A.: The semantics of Circus. In: ZB 2002: Formal Spe-cification and Development in Z and B. Volume 2272 of Lecture Notes in ComputerScience. Springer Berlin / Heidelberg (2002) 184–203
2. Oliveira, M., Cavalcanti, A., Woodcock, J.: A UTP semantics for Circus. FormalAspects of Computing 21(1) (February 2009) 3–32
3. Hoare, C.A.R., He, J.: Unifying Theories of Programming. Prentice Hall Interna-tional Series in Computer Science. Prentice Hall Inc. (1998)
4. Cavalcanti, A., Woodcock, J.: A tutorial introduction to CSP in unifying theories ofprogramming. In: Refinement Techniques in Software Engineering. Volume 3167 ofLecture Notes in Computer Science., Springer Berlin / Heidelberg (2006) 220–268
5. Morgan, C.: Programming from Specifications. Second edn. Prentice Hall Inter-national Series in Computer Science. Prentice Hall Inc., Hertfordshire, UK (1994)
6. Dijkstra, E.W.: A Discipline of Programming. Prentice-Hall Series in AutomaticComputation. Prentice-Hall, Inc., Englewood Cliffs, New Jersey (October 1976)
7. Woodcock, J.: The miracle of reactive programming. In Butterfield, A., ed.: Unify-ing Theories of Programming. Volume 5713 of Lecture Notes in Computer Science.Springer Berlin / Heidelberg, Berlin, Heidelberg (2010) 202–217
8. Jacob, J.L.: On the derivation of secure components. In: Proceedings of the 1989IEEE Symposium on Security and Privacy, IEEE Computer Society (1989) 242–247
9. Roscoe, A.W.: CSP and determinism in security modelling. In: Proceedings of the1995 IEEE Symposium on Security and Privacy, IEEE Computer Society (1995)114–127
10. Banks, M.J., Jacob, J.L.: Unifying theories of confidentiality. In Qin, S., ed.:3rd International Symposium on Unifying Theories of Programming (UTP 2010).Volume 6445 of Lecture Notes in Computer Science., Springer Berlin / Heidelberg(2010) 120–136
11. Mantel, H.: A Uniform Framework for the Formal Specification and Verificationof Information Flow Security. PhD thesis, Universitat Saarbrucken (July 2003)
12. Banks, M.J., Jacob, J.L.: Calculated secure processes. In Miyazawa, A., ed.:Proceedings of the Third York Doctoral Symposium on Computing (YDS 2010),Department of Computer Science, University of York, UK (November 2010) 19–28
13. Morgan, C.: The shadow knows: Refinement and security in sequential programs.Science of Computer Programming 74(8) (June 2009) 629–653
14. Morgan, C.: Compositional noninterference from first principles. Formal Aspectsof Computing (November 2010)
15. Banks, M.J., Jacob, J.L.: Specifying confidentiality in Circus. In: FM 2011: FormalMethods. Volume 6664 of Lecture Notes in Computer Science., Springer Berlin /Heidelberg (2011) 215–230
16. Roscoe, A.W., Woodcock, J.C.P., Wulf, L.: Non-Interference through determinism.In: ESORICS ’94: Proceedings of the Third European Symposium on Research inComputer Security. Volume 875 of Lecture Notes in Computer Science., SpringerBerlin / Heidelberg (1994) 33–53
17. Cerny, P.: Software Model Checking for Confidentiality. PhD thesis, Departmentof Computer and Information Science, University of Pennsylvania (2009)
18. D’Souza, D., Holla, R., Kulkarni, J., Ramesh, R.K., Sprick, B.: On the decidabilityof Model-Checking information flow properties. In Sekar, R., Pujari, A.K., eds.:Information Systems Security. Volume 5352 of Lecture Notes in Computer Science.,Berlin, Heidelberg, Springer Berlin Heidelberg (2008) 26–40

24 Michael J. Banks and Jeremy L. Jacob
Appendix
There are laws for lifting the Circus operators, but we omit them here for brevity.Rather, we identify just one law concerned with the sequential composition ofCircus actions and κ-annotations in the lifted semantics:
U (A ; 〈L : θ 〉) = U (A) ∧ R
(ok ∧ (∃ v • θ)[v ′/v ] ∧ ¬wait ′
⇒ ok ′ ∧ θ[v ′, v ′/v , v ] ∧ ¬ wait ′
)(4)
The result given in Example 2 is derived as follows:
U (a := 1 ; 〈L : [ a, a : N | a = 0 ∧ a > 0 ] 〉)⇔ law of sequential composition (Equation 4)
U (a := 1) ∧ R(
ok ∧ a ′ = 0 ∧ ¬wait ′ ⇒ ok ′ ∧ a ′ = 0 ∧ a ′ > 0 ∧ ¬ wait ′)
⇔ semantics of assignment and IL
U (a := 1) ∧ R(
ok ∧ a ′ = 0⇒ ok ′ ∧ a ′ = 0 ∧ a ′ > 0)
⇔ contradiction: U (a := 1) demands a ′ = 1
U (a := 1) ∧ R(false⇒ ok ′ ∧ a ′ = 0 ∧ a ′ > 0
)⇔ propositional calculus U (a := 1) ∧ U (R(true))
⇔ property of R and U U (a := 1)
The result given in Example 3 is derived as follows:
U (a := 0 ; 〈L : [ a, a : N | a = 0 ∧ a > 0 ] 〉) ∧ IL⇔ law of sequential composition
U (a := 0) ∧ R(
ok ∧ a ′ = 0 ∧ ¬wait ′ ⇒ ok ′ ∧ a ′ = 0 ∧ a ′ > 0 ∧ ¬ wait ′)∧ IL
⇔ semantics of assignment and IL
U (a := 0) ∧ R(
ok ⇒ ok ′ ∧ a ′ = 0 ∧ a ′ > 0)∧ IL
⇔
contradiction: U (a := 0) demands a ′ = 0
U (a := 0) ∧ R (ok ⇒ false) ∧ IL⇔ propositional calculus U (a := 0) ∧ R (¬ok) ∧ IL⇔ definition of IL U (R(¬ok)) ∧ IL
Dependency Patterns and Timing for GridWorkloads
Andrew Burkimsher
Department of Computer Science, University of York
Abstract
This paper presents a set of patterns of dependencies for grid computing work-loads abstracted from an industrial case study. In addition, algorithms are presen-ted that generate task execution times and arrival times to match desired statist-ical properties. This is as a part of the research performed by the author on thecreation of a simulation environment with which to compare and evaluate theperformance of different schedulers on a grid system. The ultimate aim of thisresearch is to improve throughput and reduce response times of work submittedto a grid using improved scheduling algorithms.
1 Introduction
Computing power has become ever cheaper over the past half-century followingan observed pattern known as Moore’s Law [14]. However, many kinds of aca-demic and industrial endeavour benefit from as much computing power as pos-sible. In recent years, increases in computing power have been gained throughincreasing parallelism [5].
Where there is sufficient demand for compute power, datacentres have beencreated to house these parallel computing nodes [13]. Unfortunately, datacentersare limited in size by the availability of electrical power and cooling in a singlelocation [15]. Therefore, networks of geographically distributed datacenters havebeen created in order to provide the computing capacity required [11]. Thesenetworks are known as grids. In the model considered by this paper, many work-loads may execute concurrently on a grid. In order to ensure good performanceof a grid, the work done must be carefully scheduled.
It has been shown that finding an optimal schedule is NP-complete in thegeneral case [9]. Therefore in any system of realistic scale, heuristic schedulingpolicies have to be used. Where dependencies are present in the workload, some‘simple’ scheduling policies such as First In First Out (FIFO) exhibit undesirableemergent effects known as ‘anomalies’ [10, 17]. [10] showed that reducing thenumber of dependencies, reducing task execution time and increasing the numberof processors can all lead to an increase in total workload execution time whenusing a FIFO scheduler. [17]showed that network delays can mean that executinga workload on a multiprocessor would take longer than on a uniprocessor.
26 Andrew Burkimsher
A wide variety of scheduling heuristics have been proposed [2]. The ultimateaim of this research is to develop a framework with which to simulate grids inorder to compare the performance of schedulers. The simulation will be com-posed of three fundamental models: an application model, a platform model anda scheduling model. In this structure, the grid hardware is represented by theplatform model. The workload executed by the grid is represented by the ap-plication model. The scheduling algorithm is captured in the scheduling model.
This paper is about the creation of workloads as part of the applicationmodel. Pertinent literature will be summarised. The DAG shape patterns usedin taskset generation, along with algorithms to generate them will be presented.Algorithms to generate workloads where both jobs and task execution timesfollow desired statistical distributions will be proposed. Finally, algorithms willbe proposed to adjust the arrival rate of the work in reference to the ability of agrid to service the work (stability ratio), while keeping the workload otherwiseequal. Limitations of the work along with future research directions will be noted.
2 Literature Review
To utilise the computational power afforded by grids, the work must be parallel-ised. Some kinds of computational work scale naturally to being run in a highlyparallel way. However, real-world grid workloads are not like this. They tend tohave sections that can be parallelised but others that must run in sequence.
Some nomenclature will now be introduced, following the scheme of [4]. In-dependent packages of work are known as jobs. Within a job, the sections ofwork are known as tasks. Each task runs on a single processor and consumessome input and produces some output. Where one task’s input includes anothertask’s output, a dependency is defined.
There has been much study of the scheduling of dependent task sets in theliterature; notable examples include [10, 12, 16]. The general notion of depend-encies in the literature is to consider the dependencies to be representable by aDirected Acyclic Graph (DAG) structure. The acyclic nature of the dependen-cies means that the computation time of each workload is bounded. The nodesin a DAG represent tasks and edges represent dependencies between tasks.
Although many authors have mentioned the use of a DAG structure for work-loads [12], there is scant mention in the literature of the actual structure of theseDAGs and how to generate them [7]. This paper will elaborate several classesof DAG structure in Section 3. These structures are abstractions of patternsobserved in an industrial case study.
The dependency structure alone, however, does not define a grid workloadas the execution times of tasks must also be defined. When generating largenumbers of workloads to use in the comparison of schedulers, it is importantthat the workloads generated have certain statistical properties, so that theyform a fair comparison [7]. Algorithms to generate workloads with appropriatestatistical distributions of both job and task execution times will be describedin Section 4.
Dependency Patterns and Timing for Grid Workloads 27
3 DAG shape classes
The exact parameters of real-world workloads are unlikely to be known in ad-vance. Therefore, a successful grid scheduling policy should be able to performwell across a wide range of workloads. To evaluate schedulers, therefore, a widerange of workloads must be generated. However, the workloads generated shouldalso contain a fair representation on the kinds of workload likely to be en-countered by the scheduler in production use.
The workload DAG patterns presented in this section were developed froman industrial case study. The industrial case study was of a production systemthat takes CAD models and performs computational fluid dynamic calculationswith them in order to produce predictions of aerodynamic characteristics. Work-flows are specified in advance, and these workflow task graphs can be inspected.After inspection, general patterns were observed by the author and are presentedbelow. To the best of the author’s knowledge, all the patterns except the linearchains pattern are novel and have not been previously described in the literature.Pseudocode algorithms for generating these DAG shapes are also specified.
3.1 Linear Dependencies
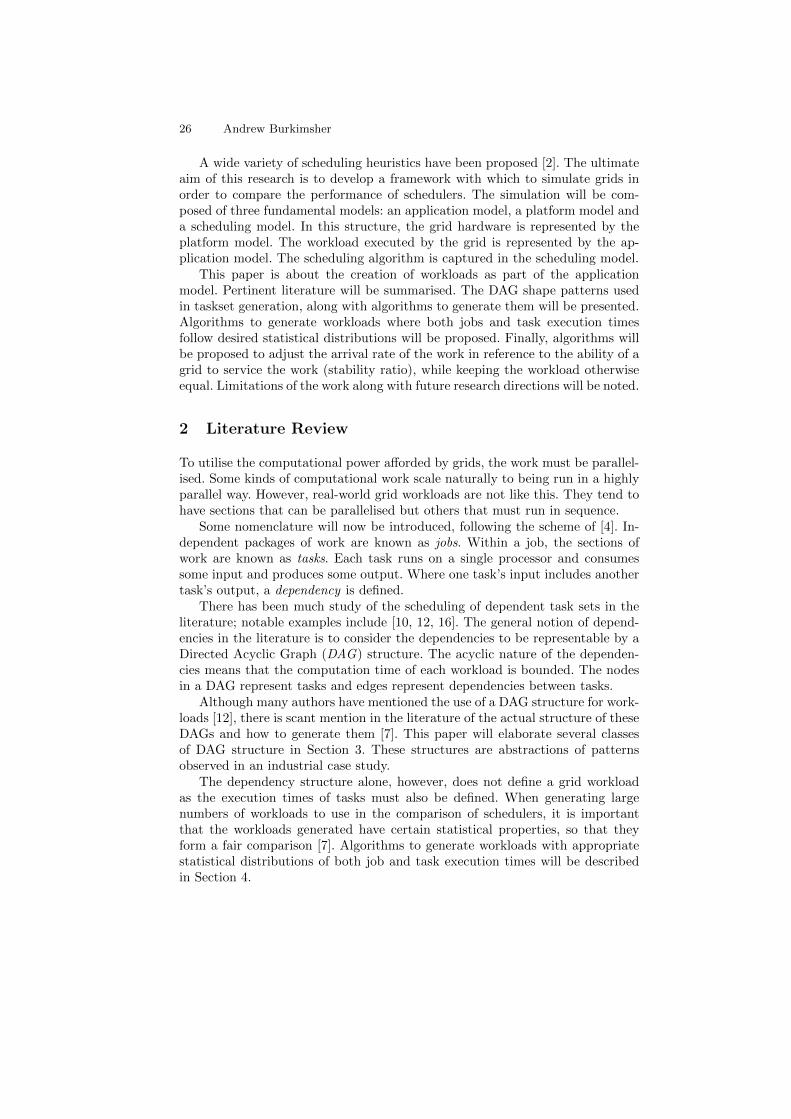
The most basic DAG dependency pattern is that of linear dependencies. This iswhen there is a single chain of purely sequential tasks with dependencies betweenthem, as shown in Figure 1a. However, this pattern could well be consideredunrealistic for a grid workload. This is because grids tend to perform best onparallel workloads, so it is highly unlikely that a substantial part of any real gridworkload would be composed of linear dependent chains of work. Nevertheless, ifit were, an appropriate scheduling policy could be a pipeline arrangement. Thepseudocode to set up dependencies like this is shown in Algorithm 4.1.
3.2 Probabilistic dependencies
Sometimes it is desired to have a certain proportion of the possible dependenciespresent in a workload. If it is desired that these dependencies are randomlysampled from the set of possible dependencies, the probabilistic dependenciesmethod can be used. The pseudocode algorithm for this is shown in Algorithm4.2. Two sample task graphs are shown in Figure 1d.
This algorithm has the advantage that the shape of the dependency graphcan vary significantly, and given enough samples should provide a wide variety ofshapes with which to exercise a scheduler. However, there is a strong likelihoodwhen low probabilities are used that the dependency graph for each job canhave disconnected sections. By the definition given earlier, disjoint dependencygraphs should really be represented as separate jobs.
Although the job could be split into two separate jobs, or have the disjointsections connected with additional dependencies, this may interfere with thestatistical properties desired in the workload. It could be possible to simply dis-card jobs that where the graph has disjoint parts. However, as the probability
28 Andrew Burkimsher
is decreased then an increasing number of jobs may be discarded, to the pointwhere it may become impractical to generate workloads this way because toomany jobs are being discarded. As the probability is increased, this methodapproximates the linear dependencies model (if transitive dependencies are re-moved). For all these reasons, this method is only really suited to probabilityvalues in the middle of the probability range.
3.3 Independent Chains
Many workloads are parallelised by applying the same sequence of operationsto different chunks of data. Each chain is one following the linear dependenciespattern. This is inspired by the MIMD (Multiple Instruction Multiple Data)parallelism pattern. As observed in an industrial case study, these chains need tobe spawned by an initial setup task. Their results are then collected up by a finaltask. A diagram showing this arrangement is shown in Figure 1b. Pseudocodefor generating such a configuration is shown in Algorithm 4.3.
3.4 Diamond
The diamond pattern as shown in Figure 1c is similar to the independent chainsmodel, but where the spawn-out of independent chains does not take place allat once, but requires several stages to perform. It could also be considered like acomplete binary tree branching out to the maximum width, and then condensingdown again to collect up the data. Pseudocode for defining these dependenciesis given in Algorithm 4.4.
3.5 Dependencies over blocks
A single generation of the independent chains or diamond pattern can be con-sidered as a block. A block is a subset of the tasks in a job with a single startingand a single finishing task. Workloads can be composed of dependencies betweenblocks. The existing patterns shown can then be extended to also cover blocks.The first and last tasks of each block are given the incoming and outgoing de-pendencies of the whole block. These blocks then become building blocks formore complex DAGs. Where a compositional approach is used with blocks, itbecomes possible to represent arbitrary DAGs.
A prevalent shape of workload observed in the industrial case study was thatof linear chains of blocks, where the blocks followed the independent chains pat-tern ( Figure 1e). This is observed where each stage of the workload can beparallelised, but the data between each stage may need to be collated and trans-mitted before the next stage of execution can commence. These patterns canbe particularly challenging to schedule efficiently because of the multiple bottle-necks between the blocks. However, they are important to study when comparingschedulers, because they represent a significant fraction of the workload observedon some industrial grids.

Dependency Patterns and Timing for Grid Workloads 29
Algorithm 4.1 Pseudocode for the Linear Dependencies pattern
n = number o f ta sk stask [ 1 ] . dependenc ies = f o r t a sk id in [ 2 to n ]
task [ t a sk id ] . dependenc ies = task [ task id −1]
Algorithm 4.2 Pseudocode for the Probabilistic Dependencies pattern
n = number o f tasksp = dependency probab i l i tyf o r t a sk id in 1 . . n :
f o r p o s s i b l e d e p i d in ta sk id . . n :i f p <= random ( ) :
t a sk s [ t a sk id ] . dependenc ies . add (ta sk s [ p o s s i b l e d e p i d ] )
Algorithm 4.3 Pseudocode for the Independent Chains pattern
a l l t a s k s = empty l i s t o f t a sk st a s k i n n e r m a t r i x = 2−d matrix o f ta sk s o f shape
( num chains by cha in l eng th )f o r x in 1 . . num chains :
f o r y in 2 . . cha in l eng th :t a s k i n n e r m a t r i x [ x ] [ y ] . dependenc ies . add (
t a s k i n n e r m a t r i x [ x ] [ y−1])a l l t a s k s . add ( t a s k i n n e r m a t r i x [ x ] [ y ] )
f o r x in 1 . . num chains :t a s k i n n e r m a t r i x [ x ] [ 1 ] . dependenc ies . add ( i n i t i a l t a s k )f i n a l t a s k . dependenc ies . add (
t a s k i n n e r m a t r i x [ x ] [ cha in l eng th ] )a l l t a s k s . add ( i n i t i a l t a s k )a l l t a s k s . add ( f i n a l t a s k )re turn a l l t a s k s
Algorithm 4.4 Pseudocode for the Diamond pattern
d = diamond edge lengthtask matr ix = 2−d matrix o f ta sk s with dimensions d ∗ df o r x in 1 . . d :
f o r y in 1 . . d :i f x > 1 :
ta sk matr ix [ x ] [ y ] . dependenc ies . add (task matr ix [ x−1] [ y ] )
i f y > 1 :ta sk matr ix [ x ] [ y ] . dependenc ies . add (
task matr ix [ x ] [ y−1])
30 Andrew Burkimsher
1
2
4
3
5
(a) LinearDependencies
...Chain
Length
Numberof chains
(b) Independent Chains (c) Diamond
0 1 2 3 5
4 6
879
01 2 3 6
7 4
8
5
9
(d) Probabilistic Dependencies(T = 10,P = 0.3)
(e) Chain of Blocks
Figure 1: Dependency DAG shapes
Dependency Patterns and Timing for Grid Workloads 31
4 Execution Times and Stability
Section 3 describes the shape of the DAG of a workload’s dependencies. However,the execution times of each task within the workload must also be specified, asmust the arrival time of each job. The scheduler must know this information inorder to be able to make appropriate scheduling decisions. This section will firstlydescribe ways of generating workloads with task and job execution times thatconform to a desired statistical distribution. Secondly, an algorithm is describedto set the arrival time for each job to ensure a given stability ratio.
4.1 Distribution of Execution Times
According to the model defined above, each task has a specified execution time.These task execution times need to be generated in such a way that the workloadhas statistically robust properties [8].
The simplest method of assigning execution times to all the tasks in theworkload is simply to generate a random number in a given range for each task.However, this means that where jobs are composed of a similar number of tasks,they will also have a similar total execution time [1].
When generating many workloads that are comparable, it is highly desirableto be able to create them with the same total workload sum of execution times.In order to create job execution times that all sum to a given value, the UUnifastalgorithm as originally described by [1] is appropriate. In the UUnifast algorithm,n−1 execution times are sampled from a logarithmic distribution. The final valueis then the difference between the sum of all previous values and the target value.
In the industrial case study it was observed that job execution times followeda logarithmic distribution, whereas task execution times followed a normal distri-bution. Yet in order to satisfy the job execution time distribution, the executiontime of the tasks in a job must sum to a particular value. This distribution iscreated using a similar approach to UUnifast where n − 1 values are sampled,but from a normal instead of a logarithmic distribution. The last task executiontime value is calculated, as before, to achieve the specified job execution time.
4.2 Stability
Stability can be measured by the percentage rate at which work is arriving intoa grid compared to the maximum rate that the grid can process this work. Thearrival rate is said to be stable if the arrival rate is less than the maximumprocessing rate (<100%), and unstable if the arrival rate is faster than the rateat which work can be processed (>100%) [3].
Grids are virtually always run at close to 100% stability ratio. Because theprocurement and operational cost of a grid is very high, the operator is highlyunlikely to over-buy resources for a grid. In addition, many computational loadscan occupy as much computing power as is available. In many industrial grids,the stability ratio fluctuates around 100%. There may even be extended periods
32 Andrew Burkimsher
where the rate is over 100%, and the extra work must be queued. Therefore, itis necessary to be able to compare schedulers over a range of stability ratios.
A stability ratio for a workload can only ever be defined with relation to aplatform, yet it is desirable to be able to adjust the stability ratio independentlyof the workload and platform. This can be achieved by adjusting the arrivaltimes of jobs. The algorithm for calculating the arrival times of each job for agiven platform and workload is given in Algorithm 4.5.
Algorithm 4.5 Pseudocode to define job arrival time with varying stabilityratio
n = number o f p r o c e s s o r s in systemjobcount = number o f j obs in workloadsumj ( i ) = the sum of a l l task execut ion t imes in job ip = d e s i r e d s t a b i l i t y r a t i o as percentages t a r t ( i ) = s e t the s t a r t time o f job i
s t a r t (1 ) = 0f o r j in 2 . . jobcount :
s ing l eprocworkt ime = sumj ( j − 1) / ndecimalp = p / 100s t a r t ( j ) = s t a r t ( j−1) + ( s ing l eprocworkt ime / decimalp )
An alternative method for generating a workload is by specifying a dura-tion of time for which the specified platform would be at 100% utilisation. Thetime slots on each processor are then divided up using the UUnifast-Discard al-gorithm, as presented by [6]. Each time slice on each processor then correspondsto a task. Each task is then randomly assigned a job to belong to. To vary thestability ratio for this method, the requested and actual finish time of the wholeworkload can be adjusted accordingly.
5 Conclusion
A summary of the issues surrounding Grid Scheduling were described, along withthe background that motivates the work of this paper. Classes of Directed AcyclicGraph shapes and patterns that could be useful for evaluating the performanceof schedulers were described, and algorithms for generating these patterns wereshown. Algorithms for creating workloads with realistic distributions of taskand job execution times were presented. The issue of stability was described, aswere two methods of creating workloads with a given stability level for givenplatforms.
Several areas of future extensions to this work are possible. There may bemore possible patterns of DAG that could be deduced from further case studies.
Dependency Patterns and Timing for Grid Workloads 33
Other workloads may demonstrate distributions of job and task execution timesother than logarithmic and normal, respectively.
The performance of the implementation of these algorithms should be evalu-ated. The algorithms presented here for generating workloads can struggle with ahigh rate of discarding when certain parameters are set to extremes. Investigationinto algorithms that still produce tasks and jobs with the desired distributionsbut eliminate or minimise the discard rate would also be valuable to increase theefficiency of workload generation. From a scheduling aspect, determining whichschedulers are best suited to working with each kind of task graph shape is anongoing topic of research.
The work presented in this paper is intended to demonstrate the algorithmsused in the creation of an application model. This application model, when com-bined with a future platform model, will be used to compare different schedulingpolicies as to their effectiveness on a variety of grid workloads.
References
1. E. Bini and G. C. Buttazzo. Measuring the performance of schedulability tests.Real-time Systems, 30:129–154, 2005.
2. P. Brucker. Scheduling Algorithms. SpringerVerlag, 2004. ISBN 3540205241.3. S. J. Chapin. Distributed and multiprocessor scheduling. ACM Comput. Surv.,
28(1):233–235, 1996. ISSN 0360-0300.4. D. E. Collins and A. D. George. Parallel and sequential job scheduling in het-
erogeneous clusters: A simulation study using software in the loop. Simulation,77(5-6):169–184, 2001.
5. B. Dally. Life after moore’s law. Forbes.com, April 2010.6. R. I. Davis and A. Burns. Priority assignment for global fixed priority pre-emptive
scheduling in multiprocessor real-time systems. Real-Time Systems Symposium,IEEE International, 0:398–409, 2009. ISSN 1052-8725.
7. P. Emberson. Searching For Flexible Solutions To Task Allocation Problems. Ph.D.thesis, University of York, UK, 2009.
8. P. Emberson, R. Stafford, et al. Techniques for the synthesis of multiprocessortasksets. In 1st International Workshop on Analysis Tools and Methodologies forEmbedded and Real-time Systems (WATERS), pp. 6–11. Jul. 2010.
9. M. R. Garey and D. S. Johnson. Computers and Intractability; A Guide to theTheory of NP-Completeness. W. H. Freeman & Co., New York, NY, USA, 1990.
10. R. L. Graham. Bounds on multiprocessing timing anomalies. SIAM Journal onApplied Mathematics, 17:416–429, 1969.
11. C. Kesselman and I. Foster. The Grid: Blueprint for a New Computing Infrastruc-ture. Morgan Kaufmann Publishers, Nov. 1998. ISBN 1558604758.
12. M. Maheswaran and H. J. Siegel. A dynamic matching and scheduling algorithmfor heterogeneous computing systems. In HCW ’98: Proceedings of the SeventhHeterogeneous Computing Workshop, p. 57. IEEE Computer Society, Washington,DC, USA, 1998. ISBN 0-8186-8365-1.
13. R. Miller. Special report: The world’s largest data centers. April 2010.14. G. E. Moore. Cramming more components onto integrated circuits. Electronics,
38(8):114–117, Apr. 1965.15. V. Salapura. Next generation supercomputers. IBM.com, October 2007.

34 Andrew Burkimsher
16. A. Schoneveld, J. F. de Ronde, et al. On the complexity of task allocation. Com-plex., 3(2):52–60, 1997. ISSN 1076-2787.
17. S. Selvakumar and C. S. R. Murthy. A list scheduling anomaly. Microprocessorsand Microsystems, 17(8):471 – 474, 1993. ISSN 0141-9331.
Interactive cookbooks : how recipe format affects the cooking experience
Lucy Buykx
Department of Computer Science University of York, UK
Abstract. Interactive cookbooks have been developed to assist novice cooks follow recipes. Where printed recipes usually contain several paragraphs of textual instruction, interactive cookbook recipes are presented in step-by-step format, with clearly written steps, and accompanied by photographs and videos to illustrate ingredients and cooking techniques. Few studies have evaluated the relative benefits to the cook of step-by-step format, good writing and multimedia individually or in combination. This study compared the time taken to complete and user ratings of recipes presented in three different textual formats: original published format, simple step-by-step format and edited step-by-step format. Initial results indicate that transformation of a recipe to step-by-step format and including ingredient quantities improves ease of use ratings and may increase mean time efficiency.
Keywords: Human-computer interaction, interactive cookbooks, recipes
1 Introduction
Several interactive cookbook systems have been developed to assist cooks to use recipes in the kitchen. CounterActive [1] projected the recipe onto the worksurface one step at a time and enhanced the recipe with videos and images. The Augmented Reality Kitchen [2] built on CounterActive, projecting recipe instructions where they anticipated the cook’s attention would be and highlighting the location of utensils as they were needed. With the Happy Cooking system Hamada et al [3] presented recipes as a series of simple steps to help cooks prepare multiple dishes to all be ready to go to the table at the same time. The Personal Chef system [4] presented recipes in step-by-step format with illustrations of all the utensils and ingredients needed and videos of all the techniques taken from two angles. These enhancements were designed to increase the confidence of cooks preparing more complex dishes.
The researchers did not describe the transformation processes they used for recipes for their interactive cookbooks but from screen shots we can see several transformations at play. They (a) performed task analysis on the recipe procedure to create a step-by-step process, (b) wrote clear text to describe the task(s) within each
36 Lucy Buykx
step, (c) added photographs of ingredients and utensils and (d) added video to illustrate task(s) within each step. Little user research was reported with these studies so it is not clear what problems, encountered by cooks, these interactive cookbooks sought to resolve. Further, the measures of success are unclear because researchers did not report evaluations of their interactive cookbook against control recipes.
The transformation process described above depended on human expertise so was time consuming and resource heavy. Such media rich and well presented recipes can be found from professional publishing houses but many of the recipes available online on websites such as allrecipes.com and cookpad.com are written and published from members of the public. They vary in accuracy, structure, clarity of instruction and completeness. It is the nature of recipes to contain instructions on many levels of abstraction [5], and anaphora [6] that may further catch the unwary. Within a recipe, day to day words may convey a different meaning so a recipe “simply cannot be understood unless one is of the subculture who knows how to cook.” [7]. Further complications arise when recipes are read outside their country of origin; measures (e.g. cups and pints), processed ingredients (e.g. flour), brand names and even the meaning of cooking techniques (e.g. grilling) vary between countries.
The sheer volume of recipes available online presents an opportunity for automated transformation. Attempts thus far to automate the process of recipe task analysis [3] and adding multimedia video clips [8][9] have shown limited technical success and little user evaluation has been reported. A clear understanding of the problems experienced by cooks and an evaluation of how recipe transformations affect the cook will contribute to the development of automated algorithms for recipe transformation and to the development of interactive cookbooks.
This study focuses on textual and structural aspects of recipe transformation performed through (a) task analysis to create a step-by-step recipe and (b) writing of clear task instructions for each step. Sixteen cooks prepared three recipes presented on a commercial recipe application on the Apple iPad [10]. The simple experimental design enabled evaluation of the contribution of textual alterations to a recipe in isolation from multimedia enhancements. Observations of the participant cooks provided a body of data of how cooks interact with recipes, in context, while they are cooking. If the textual alterations to the recipe do benefit the cook and make it easier to understand and follow the recipe this will reduce the overall time it takes to prepare the dish and increase the post task ease of use score.
2 Method
2.1 Participants
16 participants (mean=20.0 years, std dev=1.6, male=8, female=8) were recruited through University of York online notice boards and student newsletters. They were randomly allocated an ID within one of six experimental groups.
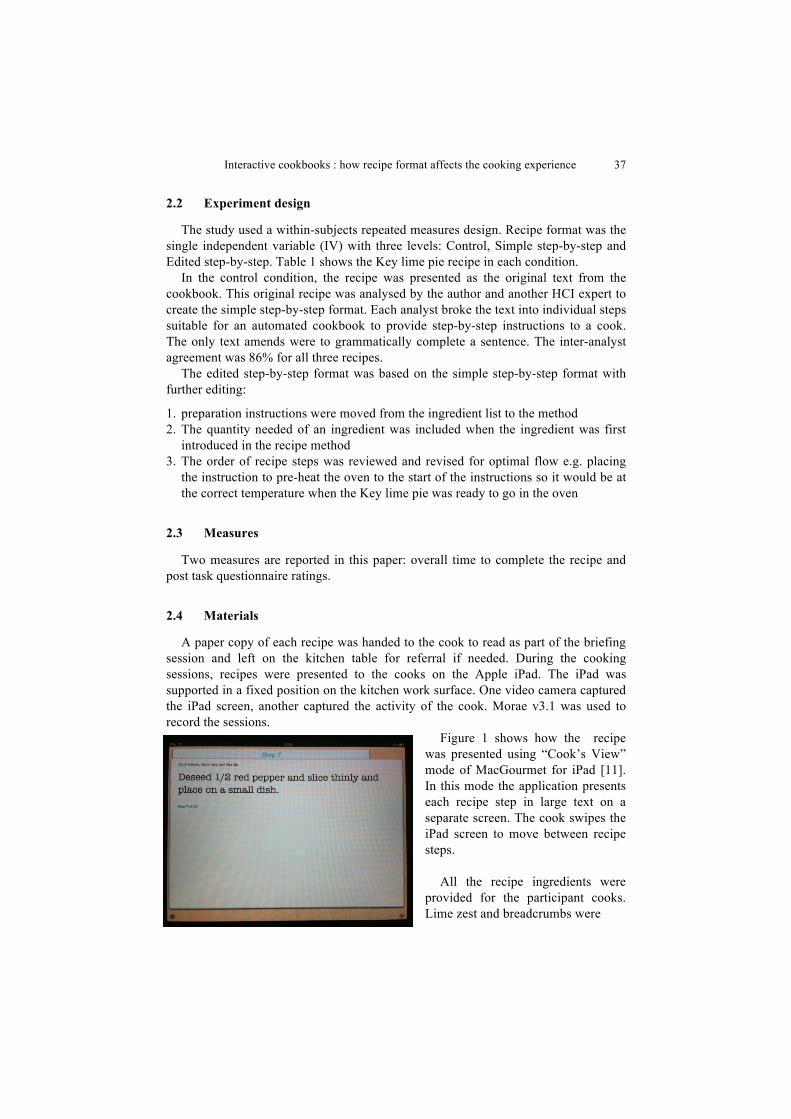
Interactive cookbooks : how recipe format affects the cooking experience 37
2.2 Experiment design
The study used a within-subjects repeated measures design. Recipe format was the single independent variable (IV) with three levels: Control, Simple step-by-step and Edited step-by-step. Table 1 shows the Key lime pie recipe in each condition.
In the control condition, the recipe was presented as the original text from the cookbook. This original recipe was analysed by the author and another HCI expert to create the simple step-by-step format. Each analyst broke the text into individual steps suitable for an automated cookbook to provide step-by-step instructions to a cook. The only text amends were to grammatically complete a sentence. The inter-analyst agreement was 86% for all three recipes.
The edited step-by-step format was based on the simple step-by-step format with further editing:
1. preparation instructions were moved from the ingredient list to the method 2. The quantity needed of an ingredient was included when the ingredient was first
introduced in the recipe method 3. The order of recipe steps was reviewed and revised for optimal flow e.g. placing
the instruction to pre-heat the oven to the start of the instructions so it would be at the correct temperature when the Key lime pie was ready to go in the oven
2.3 Measures
Two measures are reported in this paper: overall time to complete the recipe and post task questionnaire ratings.
2.4 Materials
A paper copy of each recipe was handed to the cook to read as part of the briefing session and left on the kitchen table for referral if needed. During the cooking sessions, recipes were presented to the cooks on the Apple iPad. The iPad was supported in a fixed position on the kitchen work surface. One video camera captured the iPad screen, another captured the activity of the cook. Morae v3.1 was used to record the sessions.
Figure 1 shows how the recipe was presented using “Cook’s View” mode of MacGourmet for iPad [11]. In this mode the application presents each recipe step in large text on a separate screen. The cook swipes the iPad screen to move between recipe steps.
All the recipe ingredients were
provided for the participant cooks. Lime zest and breadcrumbs were Figure 1: MacGourmet Cook's View
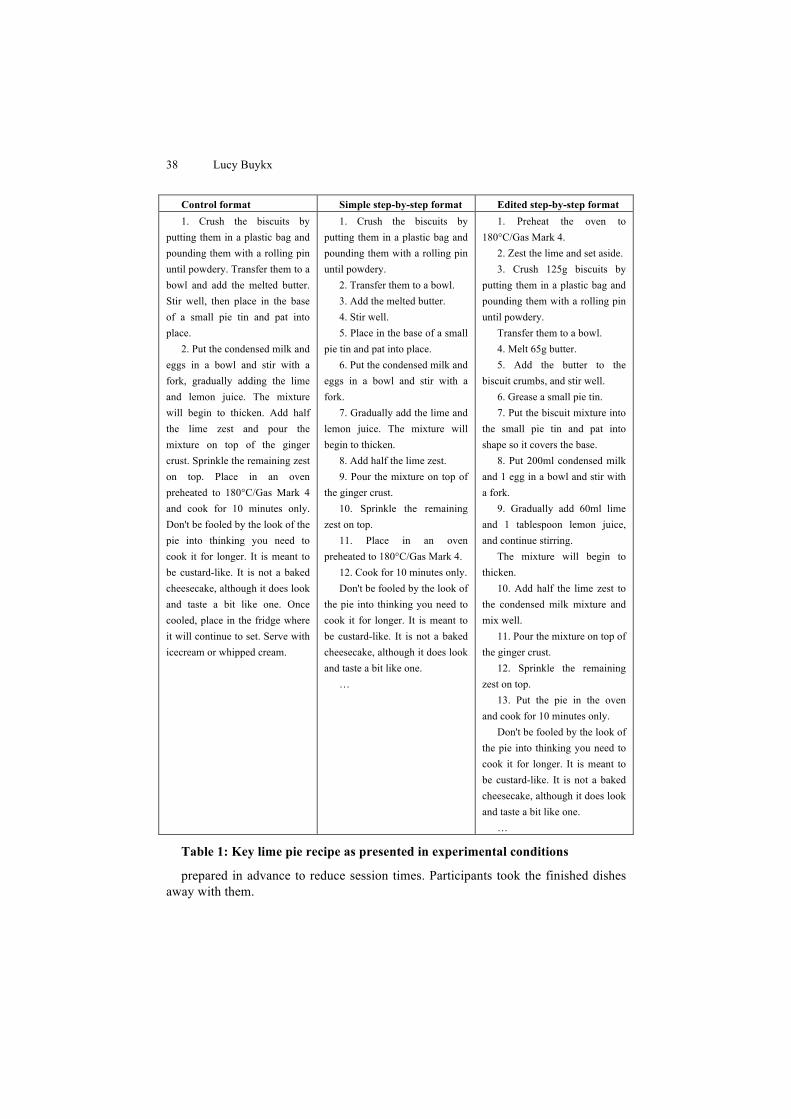
38 Lucy Buykx
Control format Simple step-by-step format Edited step-by-step format 1. Crush the biscuits by
putting them in a plastic bag and pounding them with a rolling pin until powdery. Transfer them to a bowl and add the melted butter. Stir well, then place in the base of a small pie tin and pat into place.
2. Put the condensed milk and eggs in a bowl and stir with a fork, gradually adding the lime and lemon juice. The mixture will begin to thicken. Add half the lime zest and pour the mixture on top of the ginger crust. Sprinkle the remaining zest on top. Place in an oven preheated to 180°C/Gas Mark 4 and cook for 10 minutes only. Don't be fooled by the look of the pie into thinking you need to cook it for longer. It is meant to be custard-like. It is not a baked cheesecake, although it does look and taste a bit like one. Once cooled, place in the fridge where it will continue to set. Serve with icecream or whipped cream.
1. Crush the biscuits by putting them in a plastic bag and pounding them with a rolling pin until powdery.
2. Transfer them to a bowl. 3. Add the melted butter. 4. Stir well. 5. Place in the base of a small
pie tin and pat into place. 6. Put the condensed milk and
eggs in a bowl and stir with a fork.
7. Gradually add the lime and lemon juice. The mixture will begin to thicken.
8. Add half the lime zest. 9. Pour the mixture on top of
the ginger crust. 10. Sprinkle the remaining
zest on top. 11. Place in an oven
preheated to 180°C/Gas Mark 4. 12. Cook for 10 minutes only. Don't be fooled by the look of
the pie into thinking you need to cook it for longer. It is meant to be custard-like. It is not a baked cheesecake, although it does look and taste a bit like one.
…
1. Preheat the oven to 180°C/Gas Mark 4.
2. Zest the lime and set aside. 3. Crush 125g biscuits by
putting them in a plastic bag and pounding them with a rolling pin until powdery.
Transfer them to a bowl. 4. Melt 65g butter. 5. Add the butter to the
biscuit crumbs, and stir well. 6. Grease a small pie tin. 7. Put the biscuit mixture into
the small pie tin and pat into shape so it covers the base.
8. Put 200ml condensed milk and 1 egg in a bowl and stir with a fork.
9. Gradually add 60ml lime and 1 tablespoon lemon juice, and continue stirring.
The mixture will begin to thicken.
10. Add half the lime zest to the condensed milk mixture and mix well.
11. Pour the mixture on top of the ginger crust.
12. Sprinkle the remaining zest on top.
13. Put the pie in the oven and cook for 10 minutes only.
Don't be fooled by the look of the pie into thinking you need to cook it for longer. It is meant to be custard-like. It is not a baked cheesecake, although it does look and taste a bit like one.
…
Table 1: Key lime pie recipe as presented in experimental conditions
prepared in advance to reduce session times. Participants took the finished dishes away with them.

Interactive cookbooks : how recipe format affects the cooking experience 39
After each recipe was prepared, the cooks were asked to complete a post-task questionnaire. They were asked to rate two statements: “Were the instructions clear?” and “Were the instructions easy to follow?” on a scale of 1 to 5 where 1 was “very unclear/hard” and 5 was “very clear/easy”. A free form text box was provided for additional comments about the recipe and cooking experience.
2.5 Protocol
Each cook prepared three dishes in this order: Key lime pie, Chicken burger, Tomato dip. The author set up the iPad for each dish to display the recipe using the “Cook’s Mode” of MacGourmet. At the end of each dish the cook completed a questionnaire about the recipe.
3 Early results
3.1 Current state of the study
The study is in progress. Results from 16 of the planned 24 participants are reported.
Table 2: Number of cooks who have taken part, by recipe and condition
Condition Tomato dip Chicken burgers
Key lime pie
Control 6 4 6 Simple step-by-step 5 7 4 Edited step-by-step 5 5 6
Table 2 shows the numbers of cooks preparing each recipe by condition to date. When the study is complete, 8 cooks will have prepared each recipe in each condition.
3.2 Post task questionnaire
After each recipe cooks were asked to complete a short questionnaire.
Table 3: Were the instructions clear?
Condition Tomato dip Chicken burgers
Key lime pie
Control 3.67 4.00 4.33 Simple step-by-step 4.20 4.00 4.75 Edited step-by-step 4.40 4.40 4.83
40 Lucy Buykx
Table 3 shows the cooks’ rating of the clarity of instruction by recipe and condition. Cooks were asked to score the recipe on a scale of 1-5 where 1 was “very unclear” and 5 was “very clear”.
Table 4: Were the instructions easy to follow?
Condition Tomato dip Chicken burgers
Key lime pie
Control 3.80 3.75 4.17 Simple step-by-step 3.80 3.86 5.00 Edited step-by-step 4.60 4.20 4.67
Table 4 shows the cooks’ rating of the ease of use of the instructions by recipe and condition. Cooks were asked to score the recipe on a scale of 1-5 where 1 was “very hard” and 5 was “very easy”.
3.3 Time to complete the recipe
Table 5: Mean time to complete recipe, mm:ss (SD)
Condition Tomato dip
Chicken burger
Key Lime pie
Control 44:05 (6.6) 36:06 (6.6) 32:16 (6.6) Simple step-by-step 46:04 (14.5) 26:01 (3.5) 26:35 (4.0) Edited step-by-step 47:09 (10.5) 24:01 (4.9) 26:11 (5.3)
Table 5 shows the total time taken by cooks to complete each recipe. The tomato dip was marked as complete when the dip was placed in a flameproof dish. The chicken burgers were marked as complete when they were placed in the fridge to chill. The key lime pie was marked as complete when it was placed in the oven.
4 Discussion
Initial results indicate that the clarity of instructions in the recipe and the ease of use vary between conditions. Table 3 shows that cooks rated “were the instructions clear?” highest for all recipes in edited step-by-step format and lowest for recipes in control condition, the original published format. Table 4 shows that cooks rated “were the instructions easy to follow?” highest for chicken burger and tomato dip recipes in edited step-by-step format and lowest for all recipes in the control format. The study is in progress so no statistical analysis has yet been performed on the cook’s scores, but these initial results indicate that transforming an original recipe into step-by-step format followed by careful editing improves the clarity and ease of use of the recipe.
The mean time taken to complete recipes is reported in Table 5. Initial results suggest that cooks may be more time efficient using the edited step-by-step format
Interactive cookbooks : how recipe format affects the cooking experience 41
however in this study the effect is overwhelmed because the variation between cooks is greater than variation between recipe formats.
Observations of the cooks activity and comments made during the cooking provide additional insight into the benefits and problems of recipe presentation.
The simple and edited step-by-step formats were preferred over lengthy paragraphs presented in recipes in the control condition. Of this condition cooks said:
“There was a lot of information on a single slide which I had to read multiple times.” (Cook 10)
“The vast amount of text cluttered the screen and made it seem more complex than it actually was.” (Cook 23)
However the fine grain step-by-step nature frustrates some cooks who prefer to scan ahead and plan their next actions. Further analysis of the activity path will provide insight into how cooks interact with sequential recipe steps, whether and by how much they prefer to look ahead.
The tomato dip recipe will provide interesting case study for activity path analysis. It requires 3 stages of cooking, with new ingredients added at each stage. In the control condition, all the preparation was indicated in the ingredients section and the cooks could chose when to prepare the ingredients. In the control condition, cooks were observed to prepare only the two ingredients needed for the first stage of cooking (red pepper and onion) before setting it to cook for 8 minutes. While the pepper and onion were cooking they prepared the rest of the ingredients. In the edited step-by-step condition of this recipe, the ingredient preparation was described in early recipe steps before instructions to start cooking. Cooks who followed steps in sequential order were not free to optimise the recipe and in this case the edited step-by-step format was less time efficient than an ad-hoc optimisation of the original recipe.
Time efficiency optimisation was performed for recipes presented using Happy Cooking [3]. The researchers reported some cooks were unhappy performing certain tasks in parallel and planned to review their algorithm. Further analysis of the activity paths and comments from cooks in this study will provide insight into optimisation strategies that can be incorporated into future interactive cookbook designs.
The most common frustration mentioned by cooks was that, for recipes in the control and simple step-by-step conditions, quantities of ingredients were only available on the ingredient page. This forced the cooks to scroll back to the ingredients list every time a new ingredient was introduced to the recipe. This is the common format of recipes in cookbooks and websites and is recommended as best practice for printed recipes [12] and it persists in recipes imported to commercial recipe applications such as MacGourmet used in this study. These initial results suggest this simple transformation may be one of the most important to cooks for future researchers to address.
4.1 Summary
Initial results indicate that cooks prefer recipes to be decomposed into smaller individual steps with the quantity of ingredients included in the step. These results

42 Lucy Buykx
support the form of transformations performed on recipes by earlier researchers and when all results have been analysed, will provide rich and detailed data from which to improve transformation algorithms and the designs of interactive cookbooks.
5 References
1. W. Ju, R. Hurwitz, T. Judd and B. Lee, "CounterActive: an interactive cookbook for the kitchen counter", CHI '01: CHI '01 extended abstracts on Human factors in computing systems, 2001, p. 269-270.
2. L. Bonanni, C. Lee and T. Selker, "Attention-based design of augmented reality interfaces", CHI '05: CHI '05 extended abstracts on Human factors in computing systems, 2005, p. 1228-1231.
3. R. Hamada, J. Okabe, I. Ide, S. Satoh, S. Sakai and H. Tanaka, "Cooking navi: assistant for daily cooking in kitchen", MULTIMEDIA '05: Proceedings of the 13th annual ACM international conference on Multimedia, 2005, p. 371-374.
4. S. Mennicken, T. Karrer, P. Russell and J. Borchers, "First-person cooking: a dual-perspective interactive kitchen counter", Proceedings of the 28th of the international conference extended abstracts on Human factors in computing systems, 2010, p. 3403-3408.
5. G. Tomlinson, "Thought for food : A study of written instructions", Symbolic Interaction, vol. 9, 1986, p. 201-216.
6. R. Dale, "Cooking up referring expressions", Proceedings of the 27th annual meeting on Association for Computational Linguistics, 1989, p. 68-75.
7. C. Cotter, "Claiming a piece of the pie: How the language of recipes defines community", Recipes for Reading: Community Cookbooks, Stories, Histories, A. Bower, ed., University of Massachusetts Press, 1992, p. 51-71.
8. R. Hamada, K. Miura, I. Ide, S. Satoh, S. Sakai and H. Tanaka, "Multimedia integration for cooking video indexing", Lecture Notes in Computer Science, 2004, p. 657- 664.
9. K. Doman, C. Kuai, T. Takahashi, I. Ide and H. Murase, "Video CooKing: Towards the Synthesis of Multimedia Cooking Recipes", Advances in Multimedia Modeling, vol. 6524, 2011, p. 135-145.
10. http://www.apple.com/ipad/ 11. http://macgourmet.com/ios/ipad 12. B. Gibbs Ostmann and J. Baker, The Recipe Writer’s Handbook, Wiley, 2001
Locality in Co-optimisation Problems
Tom Seaton, Tim Clarke
Univeristy of York, YO10 5DD, UK
Abstract Test-based co-optimisation is a challenging problem in thefield of evolutionary computation. We analyse the effect of genotype-to-phenotype locality in the application of coevolutionary algorithms(CoEA) to test-based problems. A normalised definition for locality isestablished in terms of metric spaces and preliminary results presentedon a standard benchmark. Strong correlation is observed between map-ping locality and expected performance. The implications for furtherwork on representations and coevolutionary search are discussed.
1 Introduction
A commonly encountered problem in engineering is the aim of optimising asolution against a large collection of tests. For example, the design of a novelsystem component may require tests in many different environmental contexts,typically too many to allow for an exhaustive set of trials. Co-optimisation [7] isan extension of the mathematical concept of optimisation to interactive problemdomains, where no objective function describing solution quality is available.
Coevolutionary algorithms (CoEA) are a popular heuristic search techniquein Evolutionary Computation (EC) which have been successfully applied to arange of co-optimisation problems [5, 8, 9]. This paper examines the effect ofa particular property of CoEA, solution locality, on performance of CoEA oncompetitive, test-based problems. Locality in EC is an attribute of the mappingfunction which links the syntactic and semantic values of solutions, referredto as the genotype to phenotype map. Locality has been shown experimentallyto be beneficial for classes of EC problem and is a widely applied heuristic inthe design of evolutionary algorithms [10, 11, 13]. Recently, concepts of how toformally measure complex maps have been gaining greater attention [4].
The structure of this paper is as follows. Section 2 introduces basic EC ter-minology and the genotype to phenotype map. We then briefly summarise ne-cessary background on co-optimisation, test-based problems and coevolutionaryalgorithms. Section 3 states formal definitions of locality and refines an appro-priate measure. Section 4 details our inital experimental approach, including abenchmark problem and preliminary results. Section 5 concludes with a discus-sion of the significance of locality in coevolutionary algorithm design.
44 Tom Seaton, Tim Clarke
2 Background and Definitions
2.1 Terms in Evolutionary Computation
In the field of Evolutionary Computation (EC), the biological term genotyperefers to a collection of primitive data. The genotype representation is the ab-stract data structure in which this is stored for computation (such as a tree). Aphenotype is the decoded expression of a genotype. For example, in the contextof a genetic algorithm, the genotype is typically a fixed length binary string andthe phenotype the problem specific interpretation, such as a set of parameters.A population is a collection of (not necessarily distinct) genotypes. Phenotypesare determined from genotypes by a surjective function or genotype to phenotypemap. In general, the genotype to phenotype map is non-injective, that is theremay be many genotypes which map to the same phenotype.
2.2 Co-optimisation, Test-based Problems and Pareto-Optimality
In a classical optimisation problem, the goal is to maximise or minimise a func-tion which applies over a set of potential solutions. Co-optimisation addresses thecase where no explicit objective function is available. Informally, co-optimisationproblems arise when it is not possible to directly evaluate an individual elementof the solution space. This situation is referred to as an interactive problemdomain, a term developed in Popovici et. al. [7],
Definition 1. (Popovici. et. al. 2009) An interactive problem domain con-sists of one or more functions, of the form f : X1 × X2 × ... × Xn → R.The sets Xi are domain roles. R is an ordered tuple of outcomes. A tuple(x1, x2...xn) ∈ X1,X2...Xn is an interaction.
Test-based co-optimisation problems are a specific case of interactive domain,where the domain roles are a set of candidates C and set of tests T . There existsa single function f : C×T → <n which maps each candidate-test pair to a vectorof real numbers. A binary outcome problem is an instance of this in which a testhas a single outcome, a pass or failure such that f : C × T → 1, 0. The goalof a test-based problem is to attain a set of candidates such that they satisfy aparticular solution concept or definition of optimality 1. For example, for binaryoutcomes, a simple solution concept is the set of candidates which pass thelargest number of tests. In general more complex solution concepts are oftenrequired. We may be interested in finding candidates which maximise outcomesover a unique range of tests, or minimise losses.
Our analysis focuses on the well-established solution concept of pareto- op-timality, as applied to test-based problems [2]. A pareto-optimal solution concept
1 The term solution concept originates in game theory. A more complete discussion ofsolution concepts in test-based problems can be found in [3].
Locality in Co-optimisation Problems 45
is defined on test-based problems by considering each test as a separate object-ive. The solution concept applies a strong dominance relation between eachpair of candidates (c, c′) ∈ C ×C , with respect to each subset of tests Ts ⊆ T :
c c′ | ∀ t ∈ Ts , f (c, t) ≥ f (c′, t) ∧ (1)
∃ t ∈ Ts , f (c, t) > f (c′, t)
From Equation (1) we can say with reference to the whole test set T , thereis a dominating subset of candidates (the pareto-optimal set). Removing thesecond condition gives the corresponding weak relation ,
c c | ∀ t ∈ Ts , f (c′, t) ≥ f (c′, t) (2)
Hence, Equation (2) induces a partial order on the candidate set. Informally,this dominance relation orders candidates into layers or pareto fronts. Membersof each pareto-front are non-dominated c 6 c′ with respect to each other, overall tests.
2.3 Coevolutionary Algorithms
Evolutionary algorithms carry out heuristic search through the principles of se-lection, variation and reproduction through successive generations. One or morepopulations of genotypes are maintained which represent semantic elements ofthe problem domain by means of the genotype to phenotype map. Selectionoccurs by comparison using a known, objective fitness function against one ormore other genotypes. Variational operators act to mutate or recombine success-ful genotypes into ‘offspring’, giving rise to subsequent populations.
Distinct from evolutionary algorithms, coevolutionary algorithms lack an ex-plicit guiding objective function for single individuals. Selection is instead carriedout on the basis of evaluation of functions from the interactive problem domain.Thus, a coevolutionary algorithm explores a space of interactions, across poten-tially multiple populations, rather than a space of individual fitness values.
The absence of an individual objective function (notion of fitness) in CoEAcan lead to coevolutionary pathologies. Examples have included issues such ascycling behaviour between states or loss of gradient (disengagement). To ensureconvergence towards a particular solution concept, practitioners have introducedcoevolutionary archives [1, 2, 6, 9]. An archive maintains a record of historicallysuccessful genotypes, which are then used to bias the current evolutionary pro-cess. In this model, the CoEA can be considered to be composed of two high levelelements - a generator, which delivers novel genotypes through the evolutionaryheuristic and a (set of) archives which act as an accumulator.
Test-based co-optimisation problems are addressed in this fashion by com-petitive or adversarial coevolutionary algorithms. Analogous to competitive co-evolution in nature, the intention is to generate genotypes which represent suc-cessively more capable candidates and more challenging tests. Generators featuretwo distinct populations of candidates and tests, which are co-evolved simultan-eously. Efficient archives have been proposed for test-based problems using the
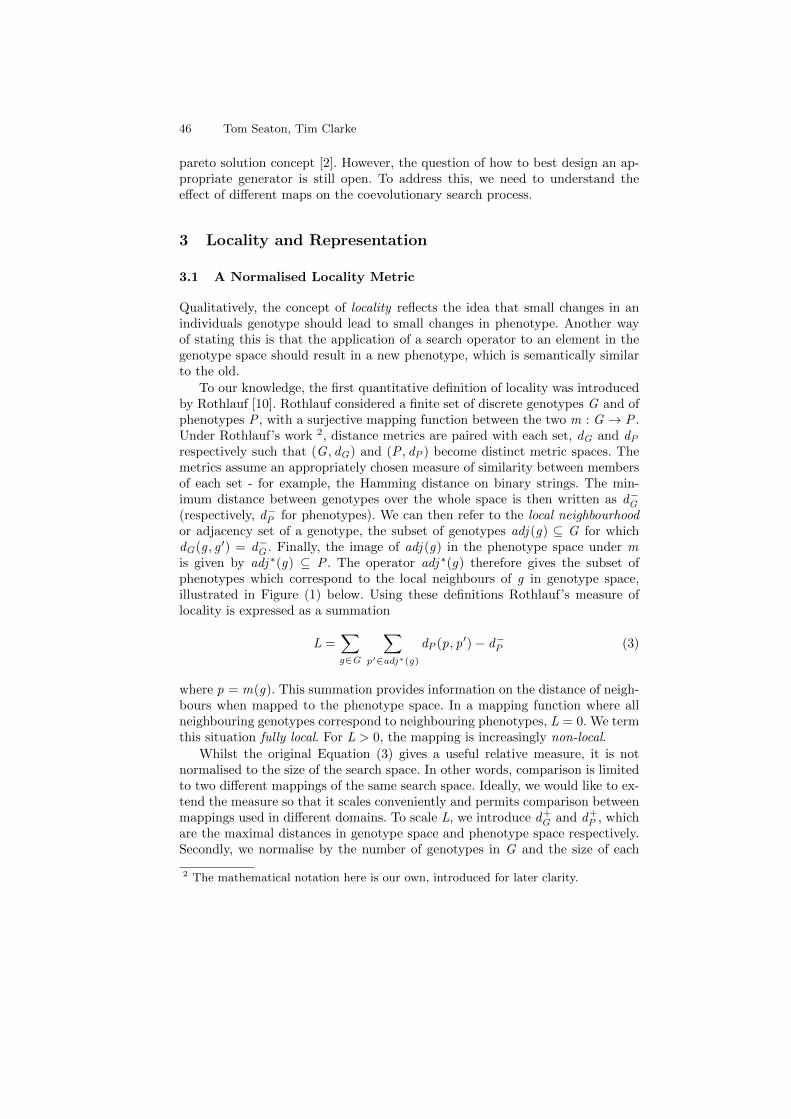
46 Tom Seaton, Tim Clarke
pareto solution concept [2]. However, the question of how to best design an ap-propriate generator is still open. To address this, we need to understand theeffect of different maps on the coevolutionary search process.
3 Locality and Representation
3.1 A Normalised Locality Metric
Qualitatively, the concept of locality reflects the idea that small changes in anindividuals genotype should lead to small changes in phenotype. Another wayof stating this is that the application of a search operator to an element in thegenotype space should result in a new phenotype, which is semantically similarto the old.
To our knowledge, the first quantitative definition of locality was introducedby Rothlauf [10]. Rothlauf considered a finite set of discrete genotypes G and ofphenotypes P , with a surjective mapping function between the two m : G → P .Under Rothlauf’s work 2, distance metrics are paired with each set, dG and dP
respectively such that (G , dG) and (P , dP ) become distinct metric spaces. Themetrics assume an appropriately chosen measure of similarity between membersof each set - for example, the Hamming distance on binary strings. The min-imum distance between genotypes over the whole space is then written as d−G(respectively, d−P for phenotypes). We can then refer to the local neighbourhoodor adjacency set of a genotype, the subset of genotypes adj (g) ⊆ G for whichdG(g , g ′) = d−G . Finally, the image of adj (g) in the phenotype space under mis given by adj ∗(g) ⊆ P . The operator adj ∗(g) therefore gives the subset ofphenotypes which correspond to the local neighbours of g in genotype space,illustrated in Figure (1) below. Using these definitions Rothlauf’s measure oflocality is expressed as a summation
L =∑g∈G
∑p′∈adj∗(g)
dP (p, p′)− d−P (3)
where p = m(g). This summation provides information on the distance of neigh-bours when mapped to the phenotype space. In a mapping function where allneighbouring genotypes correspond to neighbouring phenotypes, L = 0. We termthis situation fully local. For L > 0, the mapping is increasingly non-local.
Whilst the original Equation (3) gives a useful relative measure, it is notnormalised to the size of the search space. In other words, comparison is limitedto two different mappings of the same search space. Ideally, we would like to ex-tend the measure so that it scales conveniently and permits comparison betweenmappings used in different domains. To scale L, we introduce d+
G and d+P , which
are the maximal distances in genotype space and phenotype space respectively.Secondly, we normalise by the number of genotypes in G and the size of each
2 The mathematical notation here is our own, introduced for later clarity.
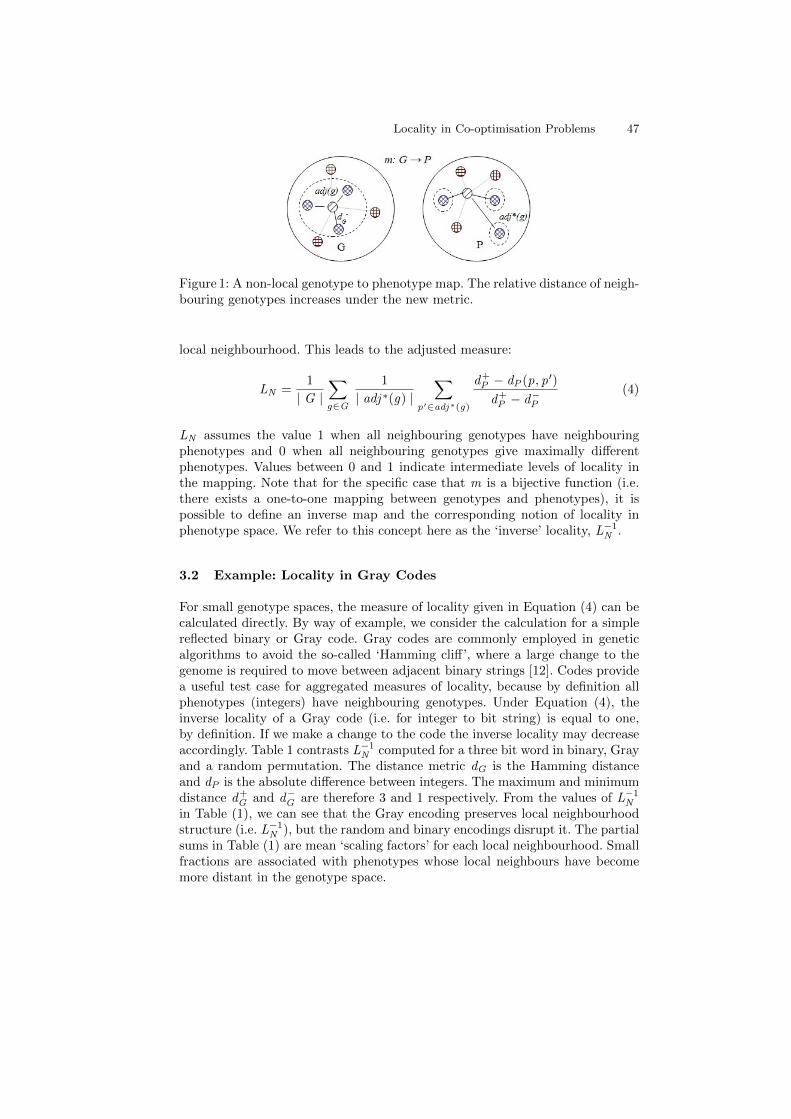
Locality in Co-optimisation Problems 47
Figure 1: A non-local genotype to phenotype map. The relative distance of neigh-bouring genotypes increases under the new metric.
local neighbourhood. This leads to the adjusted measure:
LN =1
| G |∑g∈G
1
| adj ∗(g) |∑
p′∈adj∗(g)
d+P − dP (p, p′)
d+P − d−P
(4)
LN assumes the value 1 when all neighbouring genotypes have neighbouringphenotypes and 0 when all neighbouring genotypes give maximally differentphenotypes. Values between 0 and 1 indicate intermediate levels of locality inthe mapping. Note that for the specific case that m is a bijective function (i.e.there exists a one-to-one mapping between genotypes and phenotypes), it ispossible to define an inverse map and the corresponding notion of locality inphenotype space. We refer to this concept here as the ‘inverse’ locality, L−1N .
3.2 Example: Locality in Gray Codes
For small genotype spaces, the measure of locality given in Equation (4) can becalculated directly. By way of example, we consider the calculation for a simplereflected binary or Gray code. Gray codes are commonly employed in geneticalgorithms to avoid the so-called ‘Hamming cliff’, where a large change to thegenome is required to move between adjacent binary strings [12]. Codes providea useful test case for aggregated measures of locality, because by definition allphenotypes (integers) have neighbouring genotypes. Under Equation (4), theinverse locality of a Gray code (i.e. for integer to bit string) is equal to one,by definition. If we make a change to the code the inverse locality may decreaseaccordingly. Table 1 contrasts L−1N computed for a three bit word in binary, Grayand a random permutation. The distance metric dG is the Hamming distanceand dP is the absolute difference between integers. The maximum and minimumdistance d+
G and d−G are therefore 3 and 1 respectively. From the values of L−1N
in Table (1), we can see that the Gray encoding preserves local neighbourhoodstructure (i.e. L−1N ), but the random and binary encodings disrupt it. The partialsums in Table (1) are mean ‘scaling factors’ for each local neighbourhood. Smallfractions are associated with phenotypes whose local neighbours have becomemore distant in the genotype space.
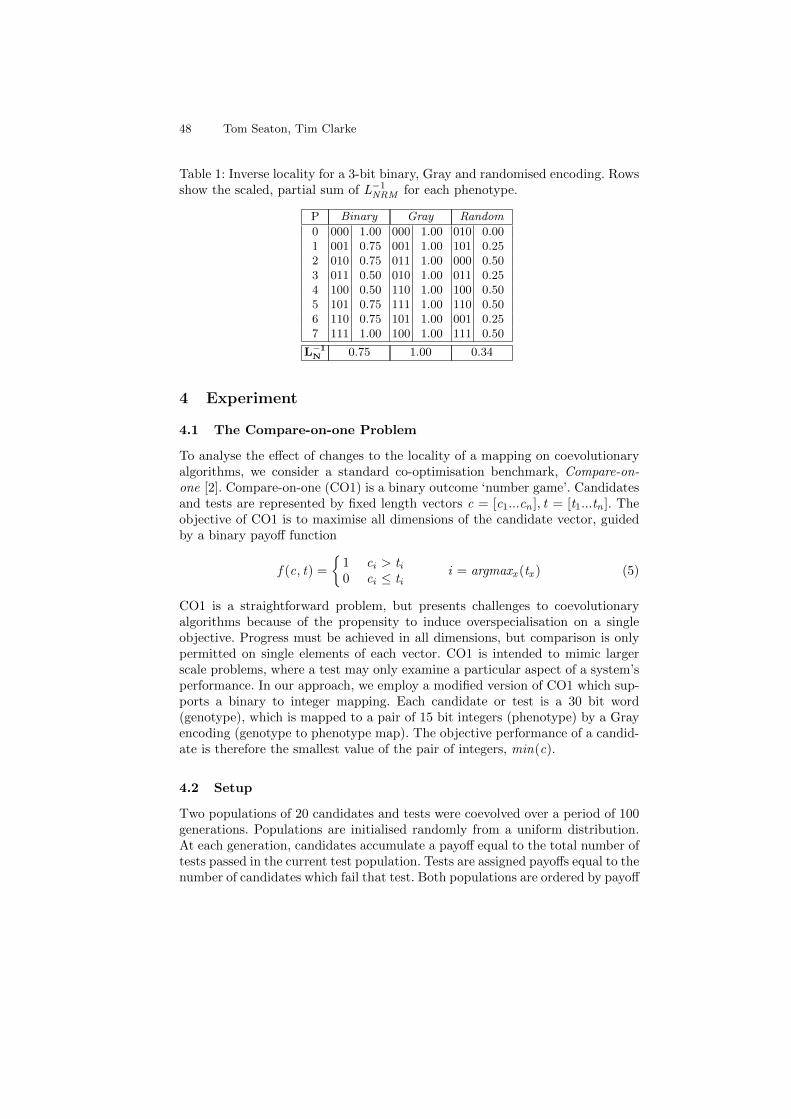
48 Tom Seaton, Tim Clarke
Table 1: Inverse locality for a 3-bit binary, Gray and randomised encoding. Rowsshow the scaled, partial sum of L−1NRM for each phenotype.
P Binary Gray Random
0 000 1.00 000 1.00 010 0.001 001 0.75 001 1.00 101 0.252 010 0.75 011 1.00 000 0.503 011 0.50 010 1.00 011 0.254 100 0.50 110 1.00 100 0.505 101 0.75 111 1.00 110 0.506 110 0.75 101 1.00 001 0.257 111 1.00 100 1.00 111 0.50
L−1N 0.75 1.00 0.34
4 Experiment
4.1 The Compare-on-one Problem
To analyse the effect of changes to the locality of a mapping on coevolutionaryalgorithms, we consider a standard co-optimisation benchmark, Compare-on-one [2]. Compare-on-one (CO1) is a binary outcome ‘number game’. Candidatesand tests are represented by fixed length vectors c = [c1...cn ], t = [t1...tn ]. Theobjective of CO1 is to maximise all dimensions of the candidate vector, guidedby a binary payoff function
f (c, t) =
1 ci > ti0 ci ≤ ti
i = argmaxx (tx ) (5)
CO1 is a straightforward problem, but presents challenges to coevolutionaryalgorithms because of the propensity to induce overspecialisation on a singleobjective. Progress must be achieved in all dimensions, but comparison is onlypermitted on single elements of each vector. CO1 is intended to mimic largerscale problems, where a test may only examine a particular aspect of a system’sperformance. In our approach, we employ a modified version of CO1 which sup-ports a binary to integer mapping. Each candidate or test is a 30 bit word(genotype), which is mapped to a pair of 15 bit integers (phenotype) by a Grayencoding (genotype to phenotype map). The objective performance of a candid-ate is therefore the smallest value of the pair of integers, min(c).
4.2 Setup
Two populations of 20 candidates and tests were coevolved over a period of 100generations. Populations are initialised randomly from a uniform distribution.At each generation, candidates accumulate a payoff equal to the total number oftests passed in the current test population. Tests are assigned payoffs equal to thenumber of candidates which fail that test. Both populations are ordered by payoff
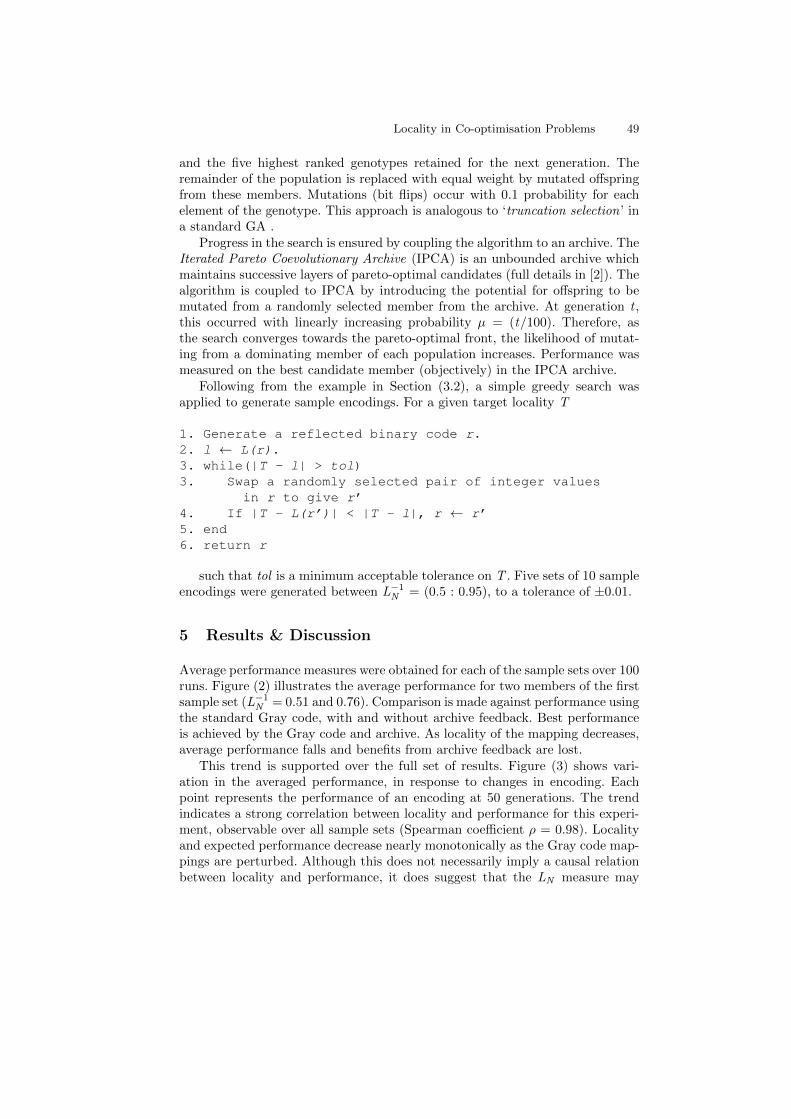
Locality in Co-optimisation Problems 49
and the five highest ranked genotypes retained for the next generation. Theremainder of the population is replaced with equal weight by mutated offspringfrom these members. Mutations (bit flips) occur with 0.1 probability for eachelement of the genotype. This approach is analogous to ‘truncation selection’ ina standard GA .
Progress in the search is ensured by coupling the algorithm to an archive. TheIterated Pareto Coevolutionary Archive (IPCA) is an unbounded archive whichmaintains successive layers of pareto-optimal candidates (full details in [2]). Thealgorithm is coupled to IPCA by introducing the potential for offspring to bemutated from a randomly selected member from the archive. At generation t ,this occurred with linearly increasing probability µ = (t/100). Therefore, asthe search converges towards the pareto-optimal front, the likelihood of mutat-ing from a dominating member of each population increases. Performance wasmeasured on the best candidate member (objectively) in the IPCA archive.
Following from the example in Section (3.2), a simple greedy search wasapplied to generate sample encodings. For a given target locality T
1. Generate a reflected binary code r.2. l ← L(r).3. while(|T - l| > tol)3. Swap a randomly selected pair of integer values
in r to give r’4. If |T - L(r’)| < |T - l|, r ← r’5. end6. return r
such that tol is a minimum acceptable tolerance on T . Five sets of 10 sampleencodings were generated between L−1N = (0.5 : 0.95), to a tolerance of ±0.01.
5 Results & Discussion
Average performance measures were obtained for each of the sample sets over 100runs. Figure (2) illustrates the average performance for two members of the firstsample set (L−1N = 0.51 and 0.76). Comparison is made against performance usingthe standard Gray code, with and without archive feedback. Best performanceis achieved by the Gray code and archive. As locality of the mapping decreases,average performance falls and benefits from archive feedback are lost.
This trend is supported over the full set of results. Figure (3) shows vari-ation in the averaged performance, in response to changes in encoding. Eachpoint represents the performance of an encoding at 50 generations. The trendindicates a strong correlation between locality and performance for this experi-ment, observable over all sample sets (Spearman coefficient ρ = 0.98). Localityand expected performance decrease nearly monotonically as the Gray code map-pings are perturbed. Although this does not necessarily imply a causal relationbetween locality and performance, it does suggest that the LN measure may
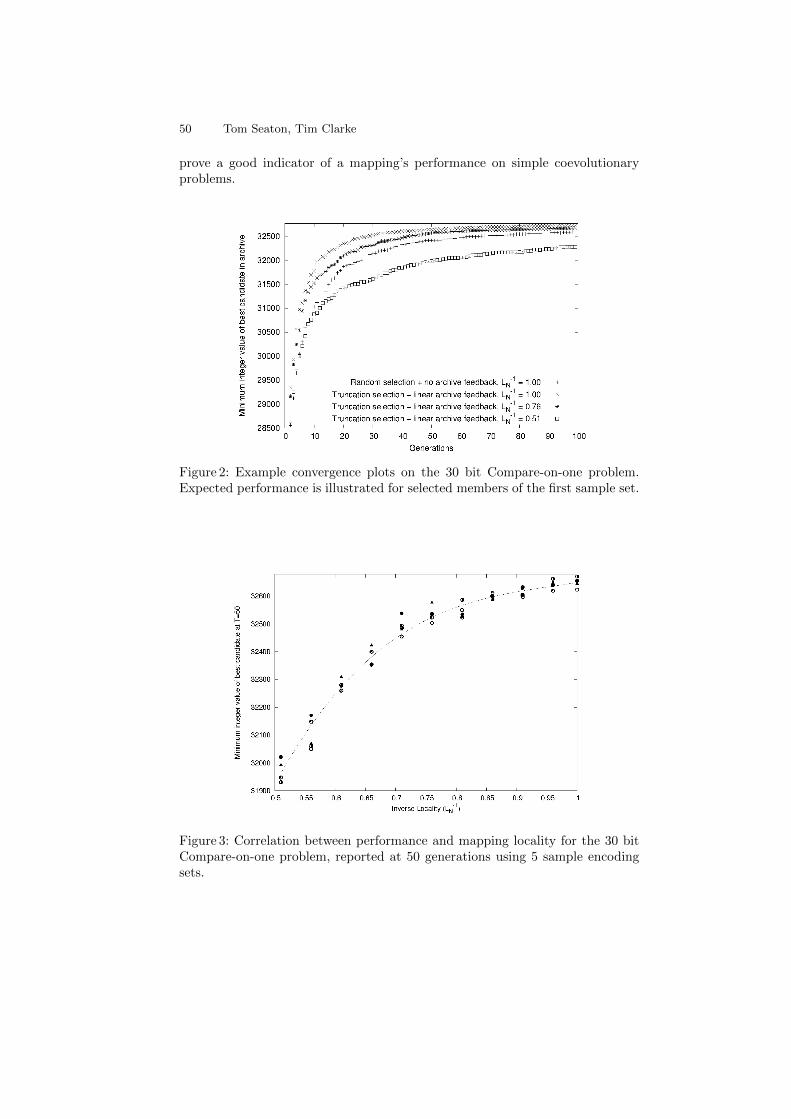
50 Tom Seaton, Tim Clarke
prove a good indicator of a mapping’s performance on simple coevolutionaryproblems.
Figure 2: Example convergence plots on the 30 bit Compare-on-one problem.Expected performance is illustrated for selected members of the first sample set.
Figure 3: Correlation between performance and mapping locality for the 30 bitCompare-on-one problem, reported at 50 generations using 5 sample encodingsets.
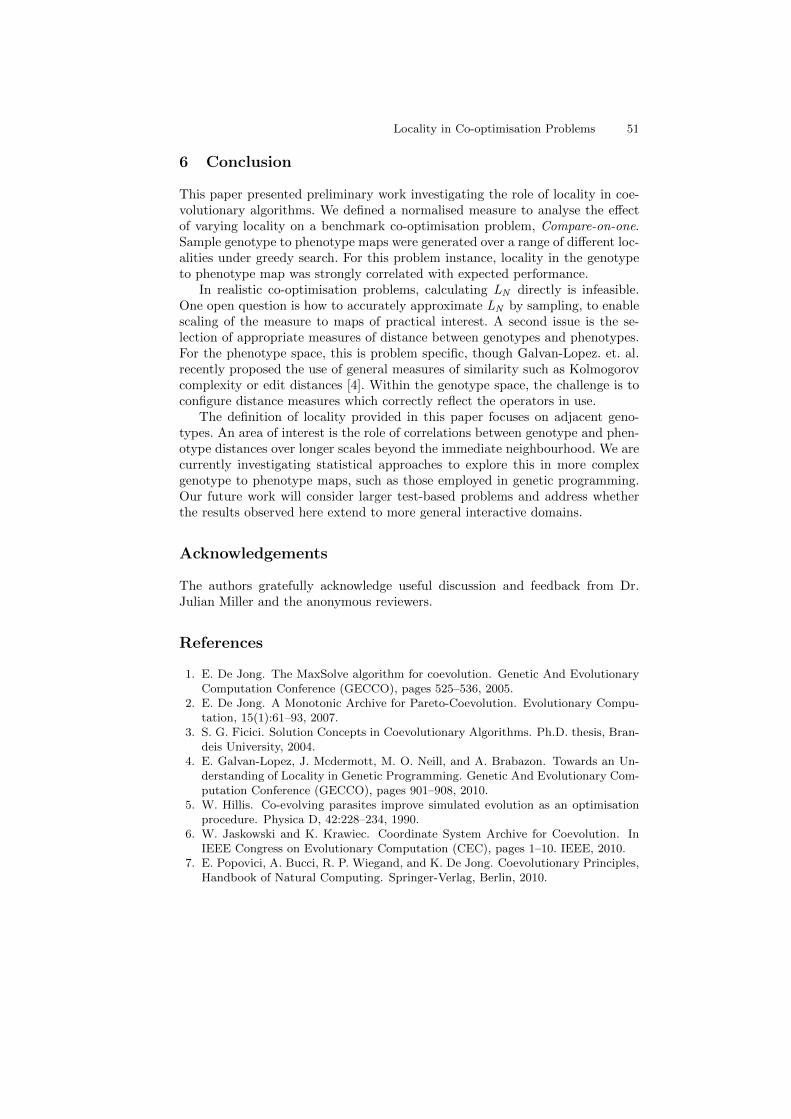
Locality in Co-optimisation Problems 51
6 Conclusion
This paper presented preliminary work investigating the role of locality in coe-volutionary algorithms. We defined a normalised measure to analyse the effectof varying locality on a benchmark co-optimisation problem, Compare-on-one.Sample genotype to phenotype maps were generated over a range of different loc-alities under greedy search. For this problem instance, locality in the genotypeto phenotype map was strongly correlated with expected performance.
In realistic co-optimisation problems, calculating LN directly is infeasible.One open question is how to accurately approximate LN by sampling, to enablescaling of the measure to maps of practical interest. A second issue is the se-lection of appropriate measures of distance between genotypes and phenotypes.For the phenotype space, this is problem specific, though Galvan-Lopez. et. al.recently proposed the use of general measures of similarity such as Kolmogorovcomplexity or edit distances [4]. Within the genotype space, the challenge is toconfigure distance measures which correctly reflect the operators in use.
The definition of locality provided in this paper focuses on adjacent geno-types. An area of interest is the role of correlations between genotype and phen-otype distances over longer scales beyond the immediate neighbourhood. We arecurrently investigating statistical approaches to explore this in more complexgenotype to phenotype maps, such as those employed in genetic programming.Our future work will consider larger test-based problems and address whetherthe results observed here extend to more general interactive domains.
Acknowledgements
The authors gratefully acknowledge useful discussion and feedback from Dr.Julian Miller and the anonymous reviewers.
References
1. E. De Jong. The MaxSolve algorithm for coevolution. Genetic And EvolutionaryComputation Conference (GECCO), pages 525–536, 2005.
2. E. De Jong. A Monotonic Archive for Pareto-Coevolution. Evolutionary Compu-tation, 15(1):61–93, 2007.
3. S. G. Ficici. Solution Concepts in Coevolutionary Algorithms. Ph.D. thesis, Bran-deis University, 2004.
4. E. Galvan-Lopez, J. Mcdermott, M. O. Neill, and A. Brabazon. Towards an Un-derstanding of Locality in Genetic Programming. Genetic And Evolutionary Com-putation Conference (GECCO), pages 901–908, 2010.
5. W. Hillis. Co-evolving parasites improve simulated evolution as an optimisationprocedure. Physica D, 42:228–234, 1990.
6. W. Jaskowski and K. Krawiec. Coordinate System Archive for Coevolution. InIEEE Congress on Evolutionary Computation (CEC), pages 1–10. IEEE, 2010.
7. E. Popovici, A. Bucci, R. P. Wiegand, and K. De Jong. Coevolutionary Principles,Handbook of Natural Computing. Springer-Verlag, Berlin, 2010.

52 Tom Seaton, Tim Clarke
8. M. A. Potter and K. A. De Jong. A Cooperative Coevolutionary Approach toFunction Optimization. In Parallel Problem Solving from Nature (PPSN-’94),pages 249–257. Springer-Verlag, 1994.
9. C. Rosin. Coevolutionary Search Among Adversaries. Ph.D. thesis, San Diego,California, 1997.
10. F. Rothlauf. Representations for Genetic and Evolutionary Algorithms, pages 33–96. Springer Berlin Heidelberg, Berlin, Heidelberg, 2006. ISBN 978-3-540-25059-3.
11. F. Rothlauf and M. Oetzel. On the Locality of Grammatical Evolution. In Proceed-ings of the 9th European Conference on Genetic Programming (Euro GP 2006),pages 320–330. 2006.
12. J. Rowe, D. Whitley, L. Barbulescu, and J.-P. Watson. Properties of gray andbinary representations. Evolutionary computation, 12(1):47–76, 2004.
13. N. Uy, N. Hoai, M. ONeill, and B. McKay. The role of syntactic and semanticlocality of crossover in genetic programming. Parallel Problem Solving from Nature(PPSN-’11), pages 533–542, 2011.
Generating Models Using Metaheuristic Search
James R. Williams and Simon Poulding
Department of Computer Science,University of York, [email protected]
Abstract Model driven engineering is a software development practicethat treats models as first-class artefacts in the development lifecycle.Automatically generating models is useful for tasks such as for testingmodel transformations. Our previous work utilises metaheuristic searchtechniques to automatically discover models with certain properties. Thispaper presents work in progress that extends our previous work to themore general problem of generating models that satisfy certain criteria.
1 Introduction
A model, in general terms, can be thought of as an abstraction of the problemunder scrutiny. Model driven engineering (MDE) treats models as the primarydevelopment artefact. The focus of MDE is to model the system at the levelof the application domain and, through a series of automatic transformations,generate code [11]. Modelling at the application domain level allows domain ex-perts to specify the system. Models in an MDE context conform to a metamodel– another model which describes the model’s concepts and semantics. Modeltransformations are the processes which move models from abstract represent-ations of the system to more concrete, platform-specific, representations andeventually to code.
Automatically generating models that conform to some metamodel is usefulfor a number of reasons, in particular, for testing model transformations. Creat-ing many models by hand is tedious, and so automation is desirable. Automatedgeneration, however, needs to ensure that the set of generated models will suffi-ciently test the transformation (or be adequate for the task in hand). The testset should be an accurate representation of the kinds of models that will betransformed in practice, should have good coverage of both the transformationand the metamodel, and should limit similarities between models in order tokeep the test set small, and not lead to superfluous testing.
A different approach to software engineering is search-based software engin-eering (SBSE). This approach is based on the observation that it is easier todetermine whether one solution to a problem is better than another, than it isto construct an optimal solution to that problem [4]. Metaheuristic search al-gorithms focus on identifying (near) optimal solutions to a problem by searchingover the space of all possible solutions to the problem. Arguably the most prom-inent type of metaheuristic search technique is the genetic algorithm (GA) [6].
54 James R. Williams and Simon Poulding
GAs act upon a population of solutions, each of which has a fitness – a measureof how “good” that solution is. GAs then apply evolutionary concepts (mutationand crossover) to the population in an attempt to improve the overall fitness ofthe population. Each solution in a GA’s population is commonly representedas strings of integers or bits (known as the genotype). These integer/bit stringsneed to be decoded into concrete representations of solutions (known as thephenotype) in order to calculate their fitness, and thus perform the evolution.
Our previous work [15] uses metaheuristic search to discover “interesting”characters in a fighting game. Characters in the game are described using abespoke language, which conforms to a grammar that was defined using anMDE tool called Xtext1. Xtext creates a metamodel for the language, enablingany instances of the language to be treated as models, and thus be susceptibleto MDE tasks (e.g. transformation). We use a metaheuristic search techniquecalled grammatical evolution (GE) to try to evolve “good” characters. GE isa method for automatically deriving programs and works in the same way asa GA, but the mapping from genotype to phenotype uses the grammar of thetarget language. Each integer in the string is used in turn to select the nextgrammar rule to instantiate, and thus outputs a string conforming to the gram-mar. Our transformation from genotype (integer string) to phenotype (characterdefinition) is achieved using a model transformation that acts upon the Xtextdefinition of the grammar. This transformation is applicable to any languagewhose grammar has been defined with Xtext, although the approach does notsupport cross-referencing other parts of the model.
This paper presents work in progress that extends our previous work in threeways. Firstly, the approach is not limited to Xtext models, and now supportsEcore2 – arguably the most widely used metamodelling language. Secondly, wenow support cross referencing other parts of the model. Finally, whereas ourprevious approach looked for a single, optimal model (the best character), we nowfocus on the more general problem of generating models. The paper is structuredas follows. Section 2 briefly examines related work on model generation. Section3 overviews our approach to utilising metaheuristic search to generate models.Finally, section 4 summarises our work and looks at future improvements thatcould be made.
2 Related Work
This section examines related work in the area of model generation. We first lookat other approaches to model generation, before briefly examining an alternativeapproach to testing model transformations. We conclude with an overview ofother research that combines model driven engineering and search based softwareengineering.
1 Xtext website: http://www.eclipse.org/Xtext2 Ecore is part of the Eclipse Modeling Framework: http://www.eclipse.org/emf
Generating Models Using Metaheuristic Search 55
2.1 Model Generation
Model generation is a relatively understudied field, compared to other MDEprocesses such as model transformation, model validation and model comparison.Brottier et al [3] present an algorithm for automatically generating models froma metamodel. The algorithm takes two forms of input: firstly, the metamodelto which the generated models should conform, and secondly, a set of modelfragments – specific elements that must appear in the set of generated models.The size of the set of generated models is strictly limited by the specified modelfragments, and as Mougenot et al [10] points out, forcing the generated modelsto have particular elements will produce models with lots of similarities.
Ehrig et al [5] devised an approach to generating model instances by cre-ating a graph grammar from the metamodel and using the grammar to createinstances. The authors note that this method suffers from not considering con-straints on the metamodel, and does not consider which classes would be morelikely to be instantiated often. Furthermore, they do not consider generatingattribute values, which can have a great impact on the generated models. Theysuggest a post-processing approach to allocate attributes to the generated mod-els, but this is not enough as it is the combination of object structure andattribute values that make models distinct, not just their structure (i.e. struc-tural equivalence versus semantic equivalence). A similar approach is taken byMougenot et al [10], but uses a special grammar called a tree specification. Thisapproach also fails to consider constraints on the metamodel, and requires a com-plex transformation to create the set of procedures used to generate the trees.Furthermore, the trees then need to be mapped back into models that conformto the metamodel.
Sen et al [12] propose a way to generate models for testing model transform-ations by exploiting the constraint modelling of the Alloy language3. Their toolcreates an Alloy specification from a set of input sources (including the sourcemetamodel and the pre-conditions to the transformation). The specification isexecuted and the solutions returned by Alloy are converted into MDE models.This approach cannot handle infinite data types, such as strings or real numbers.Furthermore, Alloy is known not to scale well and so may struggle with largeand complex metamodels [1].
2.2 Verification of Model Transformations
Complementary research to generating models for testing model transformationsis the verification of model transformations. Anastasakis et al [1] utilise Alloyto analyse model transformations. Their approach captures both the source andtarget metamodels, and the transformation mappings, as an Alloy specificationand then the Alloy Analyzer searches for inconsistencies in the transformation.Asztalos et al [2] have developed an approach that maps model transforma-tion definitions into their Assertion Description Language, and then verifies thetransformation using an automated reasoning system developed in Prolog.
3 Alloy website: http://alloy.mit.edu
56 James R. Williams and Simon Poulding
2.3 SBSE and MDE
The application of metaheuristic search techniques to solving MDE problemsis very limited. Kessentini et al [8] present a search based approach that usesexample source and target models to learn model transformations (this idea isknown as model transformation by example [13]). Their approach applies meta-heuristic search to “transformation fragments” – mappings between elements inexample source and target models – in an attempt to match the best fragment(or mapping) to each construct in a given source model. The set of matchedmappings then creates the target model. Goldsby et al [7] present work thatextends an existing tool for evolutionary computation to generate UML statediagrams from class diagrams. Finally, Li et al [9] use metaheuristic search toanalyse non-functional properties of architectures described using MDE.
3 Search Based Model Generation
To reformulate a software engineering problem as a search problem, we need todo two things [4]: firstly, we are required to find a characterisation of solutions –a description of the solution space or a type for the representation of solutions.Secondly, we need to define an objective function that can determine the fitnessof candidate solutions – i.e. a measure of how close a solution is to solvingthe problem. This section explains how we address the reformulation of modelgeneration as a search problem.
3.1 Encoding the Solution Space
As with our previous work [15], each solution (represented as an integer string)in the solution space represents a single model. We extend our previous work sothat instead of generating strings from a grammar to create a program, we gener-ate objects from a metamodel to create a model. In order to calculate the fitnessof a solution, the objective function transforms the integer string (genotype) intoa model (phenotype). Our transformation has been adapted to support Ecoremodels – arguably the most widely used metamodelling language. The trans-formation requires that the metamodel be treated as a grammar (similar to theapproaches in [5] and [10]), and as such, the transformation demands that thereis a starting rule in the grammar. Ecore metamodels enforce a container class– a class that all other objects in the model reside in (think UML composi-tion). In order to apply our grammatical transformation, the user is requiredto annotate this container class as the starting node in the grammar (annota-tions are commonly used in Ecore to aid automation, and so are not unfamiliarto Ecore users). The transformation initially looks for this annotation and ifit is non-existent, informs the user and exits. If the annotation is found, thetransformation continues as follows:
1. Create an instance of the container class.
Generating Models Using Metaheuristic Search 57
2. For every reference defined for the container class, keep creating objects ofthe reference type and adding them to the reference. To control the numberof objects created, each referenced object is created with a 50% probability,based on the next value in the integer string: if the next integer is even, wecreate a new referenced object and try again. Otherwise, the process movesonto the next reference.
3. Examine all created objects (i.e. all children of the container class) For eachchild class that also possesses containment references, go to step 2. Repeatuntil all objects with containment references have been considered.
4. Populate all non-containment references from existing elements in the model.Objects are selected from the set of applicable objects for that referenceusing the next value in the integer string, and extra objects are added to thereference with a 50% probability.
The current implementation (explained above) does not consider setting thevalues of any attributes in each object – section 4 explains how we will imple-ment this in the future. It is also our intention to allow the user to specify theprobability with which referenced objects should be created.
3.2 The Objective Function
The transformation explained above is used for every kind of model generation.The body of the objective function, the fitness calculation, controls the kind ofgeneration obtained. The types of generation that might be desired, and howdifferent objective functions could be defined to achieve that generation, areexplained below.
Random The user may desire the generation to be entirely random, ignoringconstraints of any kind. This could be achieved by using the objective functionto transform the population into models and save each model to disk. Settingthe population’s mutation rate to 100% and ignoring the notion of fitness, theGA can be executed for an arbitrary number of generations, randomising thepopulation in each generation, until the desired number of random models isobtained.
Constrained The user may wish the generated models to satisfy certain con-straints. To achieve this, the fitness of a solution relates to how closely it sat-isfies the constraints. To avoid population convergence, the objective functioncould save to disk any individual that satisfies the constraints, and the GA couldbe executed for a specified number of generations until the desired number ofconstrained models is obtained. Alternatively, the fitness function could aim toproduce a population of constrained models, which are all saved to disk in thefinal generation.
58 James R. Williams and Simon Poulding
Distinct Randomly generating models may result in a number of similar models,and thus the artefact under test is not satisfactorily tested. To generate distinctmodels, the objective function can compare the current model against thosepreviously generated, and store models whose matching score is low. This scored-matching idea could be achieved using our proposed extensions to an existingmodel comparison language [14].
Example driven The user may wish the generated model set to be variations andmutations of a given model. This could be achieved by comparing each model tothe example in the objective function and rewarding solutions that score well.Alternatively, annotations on the metamodel could be used to specify particularmetaclasses that should be instantiated, and with what frequency.
These functions could be combined in order to further control the generation.For example, one might wish to created a set of constrained, distinct models. Itis our hope that we can provide these functions to the user as part of an easy-to-configure tool integrated into the Eclipse IDE (the most widely used modellingenvironment). This tool would mean that the user needs to spend minimal effortto generate their models.
4 Conclusion and Future Work
In this paper we have overviewed work in progress on a new technique to gener-ate MDE models. We have presented a powerful transformation from a simplestring of integers to a model conforming to a given metamodel. This transforma-tion is exploited in a genetic algorithm, with which different objective functionsdetermine the kind of models generated. Our transformation targets Ecore mod-els, but the underlying idea is generic and is applicable to any metamodellinglanguage.
We have implemented the initial prototype transformation and are currentlyimplementing the objective functions. As previously mentioned, we also planto integrate our tool into the Eclipse IDE – the most widely used modellingenvironment. We plan on running an extensive experimentation phase in orderto determine the validity and quality of the generation. For example, can wegenerate all distinct models up to a certain scope? Is our approach able togenerate all possible models? Are there some models that, due to the nature ofthe transformation, can never be discovered? Does our approach lend itself to asimple way of achieving the desired coverage of the metamodel/transformation?Finally, how does our approach compare to the existing approaches discussed insection 2, in terms of performance and quality of the generated model set?
There are a number of challenges in the transformation that still need tobe addressed. Firstly, our current implementation does not account for settingattribute values. To achieve this, we will look for inspiration from research intotest-data generation. One possible solution would be to allow users to add an-notations to their metamodels that express a number of “default” values fordifferent attributes. The search can then pick one of the defaults using the in-teger string.

Generating Models Using Metaheuristic Search 59
Another challenge to consider is the notion of cross-model referencing. Ecoremodels are allowed to reference objects in other models (including those withdifferent metamodels). Presently, we only map one integer string to one modelconforming to a single metamodel. In order to create references to other models,these models would need to exist and we would need to have knowledge of theirexistence. One possible solution would be to allow the user to specify a set ofmodels that could be referenced and, during the mapping stage, use the integersto firstly select a target model, and then to select the specific element in thatmodel to reference.
One final idea that we would like to pursue, is meeting with MDE practition-ers and discussing their requirements for model generation. This would allow usto develop our toolset to be as usable and as useful to the community as possible.
References
1. K. Anastasakis, B. Bordbar, and J. M. Kuster. Analysis of model transformationsvia alloy. In 4th MoDeVVa workshop, 2007.
2. M. Asztalos, L. Lengyel, and T. Levendovszky. A formalism for describing modelingtransformations for verification. In Model-Driven Engineering, Verification andValidation Workshop, October 2009.
3. E. Brottier, F. Fleurey, J. Steel, B. Baudry, and Y. Le Traon. Metamodel-based testgeneration for model transformations: an algorithm and a tool. 17th InternationlSymposium on Software Reliability Engineering, 2006.
4. J. Clark, J. J. Dolado, et al. Reformulating software engineering as a search prob-lem. In IEEE Software, volume 150, pages 161–175, 2003.
5. K. Ehrig, J. M. Kuster, Taentzer G., and J. Winkelmann. Generating instancemodels from meta models. In Formal Methods for Open Object-Based Distrib-uted Systems, volume 4037 of Lecture Notes in Computer Science, pages 156–170.Springer-Verlag Berlin Heidelberg, 2006.
6. D. E. Goldberg. Genetic Algorithms in Search, Optimization and Machine Learn-ing. Addison-Wesley Longman Publishing Co., Inc., 1st edition, 1989.
7. H. J. Goldsby and B. H.C. Cheng. Avida-MDE: a digital evolution approach togenerating models of adaptive software behavior. In Proc. Genetic and Evolution-ary Computation Conf., GECCO ’08, pages 1751–1758, 2008.
8. M. Kessentini, H. Sahraoui, M. Boukadoum, and O. Omar. Search-based modeltransformation by example. Software and Systems Modeling, pages 1–18, 2010.
9. R. Li, M. R. V. Chaudron, and R. C. Ladan. Towards automated software ar-chitectures design using model transformations and evolutionary algorithms. InProc. Genetic and Evolutionary Computation Conf. (GECCO’10), pages 1333–1340, 2010.
10. A. Mougenot, A. Darrasse, X. Blanc, and M. Soria. Uniform random generation ofhuge metamodel instances. In Proceedings of the 5th European Conference on ModelDriven Architecture - Foundations and Applications, volume 5562 of Lecture Notesin Computer Science, pages 130–145. Springer-Verlag Berlin Heidelberg, 2009.
11. B. Selic. The pragmatics of model-driven development. IEEE Software, 20(5):19–25, 2003.
12. S. Sen, B. Baudry, and J-M. Mottu. On combining multi-formalism knowledgeto select models for model transformation testing. International Conference onSoftware Testing, Verification and Validation, pages 328–337, 2008.

60 James R. Williams and Simon Poulding
13. D. Varro. Model transformation by example. In Oscar Nierstrasz, Jon Whittle,David Harel, and Gianna Reggio, editors, Model Driven Engineering Languagesand Systems, volume 4199 of Lecture Notes in Computer Science, pages 410–424.Springer Berlin / Heidelberg, 2006.
14. James R. Williams, Dimitrios S. Kolovos, Fiona A. C. Polack, and Richard F.Paige. Requirements for a model comparison language. In Proceedings of the 2ndInternational Workshop on Model Comparison in Practice, IWMCP ’11, pages 26–29, New York, NY, USA, 2011. ACM.
15. James R. Williams, Simon Poulding, et al. Identifying desirable game characterbehaviours through the application of evolutionary algorithms to model-drivenengineering metamodels. In Proc. 3rd International Symposium on Search BasedSoftware Engineering (to appear), September 2011.
Digit distributions — What digits are reallybeing used in hospitals?
Sarah Wiseman
UCL Interaction Centre, MPEB, Gower Street, London, WC1E [email protected]
Abstract Typing studies have shown that common letters and bigramshave different error probabilities from less common ones. It is unknownas to whether the same effect can be seen when typing numbers. Thispaper presents an investigation into the distribution of digits being typedinto hospital infusion pumps and shows that, as with letters in writtenEnglish, there are common and uncommon characters being used. Thenumber 0 is the most commonly typed digit, with 1 and 5 being thenext most common. Digits such as 3, 4, 6, 7 and 8 are relatively rare.This information supports the study of the effect of number frequency onerror rate. These results additionally provide more realistic data for use ininfusions pump programming studies and also suggest design alterationsand validations that are tailored to the numbers being entered on thesedevices with the aim of reducing error.
1 Motivation
The field of Human Computer Interaction (HCI) in the medical domain is agrowing one. The number of cases of medical error caused by poor device designhas spurred a large amount of investigation into this area. The aim of this workis to reduce blame on the medical worker when these medical errors occur, andhighlight what work can be done to increase the quality of user centred designused by medical device manufacturers.
There are many examples of number entry error leading to serious medicalerrors. Be it from recording the height of a donor wrongly [1], calculating thewrong dosage amounts [5] or typing the wrong magnitude of number into aninfusion pump [12]. A large amount of research for this field is completed inlaboratory settings due to ethical constraints on testing within hospitals. It isimperative that lab based experiments mirror hospital settings as closely aspossible if they are to be generalised in any way to a real life setting. Thiscan range from creating realistic narratives within an experiment, to holdingexperiments in rooms set out to mimic the hospital environment. Currently,the data being used in the experiments has not been considered — that is thenumbers being used in experiments in which participants are required to programdevices or enter digits are being randomly generated [10, 14], thus ignoring anyinfluence that digit frequency may play in our ability to enter numbers.
62 Sarah Wiseman
Early research into typing shows that the error rate associated with lessfrequent letters and letter combinations is different to that of more common in-stances. MacNeilage [8] notes that the least frequent letters (according to Bad-deley’s [2] analysis of printed English) are more likely to be typed in error oraccidentally omitted than the more common ones. The opposite effect has beenshown by Logan [7] in that when typists transcribe work from outside their do-main of expertise, the newer and therefore less common words are more likelyto be spelt correctly due to extra care and attention. It in unknown if a similarphenomenon exists with number entry.
There are examples of interfaces being designed with character frequency inmind outside of the medical domain. One example is the “.com” button thatappears on certain touchscreen phones when the user is typing in the addressbar. The “.com” URL suffix is the most common of all top level domains anddesigners of these interfaces have clearly taken this on board. Similarly, on manytills and financial calculators there will be a “.00” button to make entering roundmonetary amounts into the system quicker and easier. These shortcuts are basedupon the frequency of digits and letters being entered in these particular set-tings. Context is important when designing these shortcuts: if the “.com” buttonappeared every time we wanted to send a text message, this would be considereda waste of screen space as, for that task, the occurrence of the characters in thatorder would not necessarily be significantly greater than other strings.
Domain specific knowledge is important in both the shortcut examples andthe studies of typing. There are many examples of letter frequency analysis [2, 9]but the same attention has not been paid to number distribution. One famousexample of digit analysis at this level is Benford’s Law [3]. This law states that innaturally occurring numbers, the probability that the leading significant digit is1 is close to 30% — greater than the expectation of around 11% if we assume alldigits bar zero have an equal possibility of being the leading digit in a number.This trend continues with 2 being more likely than 3, which is in turn morelikely than 4 and so on. This phenomena is noted in many datasets includingstock market prices [6], fraud detection [4], country populations [11] to name afew. This distribution could be used to generate more realistic numbers for usewithin experiments however, it is unclear at the moment as to whether this lawwill apply to numbers used in hospitals for administering drugs.
Doctors’ natural bias when choosing how to record blood pressure readingscontributes towards the digit distribution literature. In a study by Wen et al. [13]it was shown that human preference has an effect upon which digit a bloodpressure reading is likely to end in. 78% of the time the reading will end in 0, 5%will end in 5, 15% in an even digit and 2% of the time will end in an odd numberother than 5. The volume and rate of drug infusions are ultimately also basedupon human decision, be it as a result of a calculation or a set value used incertain treatments. These figures will therefore also be subject to human biases.
It can be seen from the literature that the frequency of a letter or numbermay have an effect upon the likelihood it will be typed in error. We cannothowever, generalise these findings directly to the task of number entry so easily.
Digit distributions — What digits are really being used in hospitals? 63
The processes involved in transcribing digits and numbers are not the same astyping letters and words. We are able to remember thousands of strings of lettersin the form of words whereas the we may only be able to remember a few stringsof digits in the form of, for example, a few phone numbers, our PIN and certaindates. Research therefore, needs to focus on the possible effects of digit frequencyon error rate when typing numbers. For this to be possible, more needs to beknown about the digit distributions occurring in the medical domain. In thisstudy I present an analysis of numbers used when programming infusion pumpswithin a hospital with an aim to ascertain whether the digit distributions showthat there are differences between the rate of occurrence of different digits.
2 Method
Information about what numbers are being entered into infusion pumps is notreadily accessible. Hospitals do not keep records of dosage information separatelyto patient information, thus making the dosage data private information. Theleast intrusive method for collecting data on the numbers being entered intohospital infusion pumps therefore was to gather logs from machines currentlyin use. A total of 58 log files were collected from 32 pumps. The pumps had anumeric keypad to enter numbers with. On average, each log covered a periodof 7 days, with the longest log lasting for 40 days and the shortest coveringjust a single day. The pumps used in this study were located in different wardsthroughout the hospital including oncology, surgery, paediatrics and midwifery.
The log files contained a large amount of information and recorded at anevent level. An event could be anything from starting and stopping the machine,to an alarm going off if an infusion finished. At each stage, information about therate of infusion, the volume of drug to be administered or “volume to be infused”(VTBI) and volume already infused was logged. For this study, the informationneeded included all numbers that a medical worker would have had to press toprogram the pump for a particular infusion. The pump being used required therate and VTBI to be entered in order to start an infusion. The rate and VTBIwere collected from the logs every time a new infusion was started. The rate isentered into the pump as the amount per hour to be infused. For example, arate of 550 mL/hour would be entered simply as the number 550.
The log collected data to two decimal places. Trailing zeros after the decimalplace were therefore ignored as they did not represent digits that a medicalworker would have explicitly entered into the pump. The decimal point was alsoignored if it was followed by zeros.
In the following text, ‘number’ refers to what was entered into the infusionpump, for example a VTBI of 500ml and ‘digit’ refers to the digits within thatnumber, in the example case this is 5, 0 and 0.

64 Sarah Wiseman
3 Results
A total of 2442 numbers were gathered from the logs, 1051 of which includeddecimal places. This resulted in 6877 digits being collected.
Digit Distribution in the Hospital
Figure 1 shows that the most commonly used digit was 0, occurring over threetimes as often as the next most common digit, 1. Three digits in total occurredmore frequently than expected: 0,1, and 5 (expected value based on each digithaving an equal likelihood of being used). If 0 is treated as a special case andremoved from the data set, due to its much higher frequency, and we then com-pare the other digits to one another, 2 and 9 also occur more frequently thanthe average distribution.
0 1 2 3 4 5 6 7 8 9 .
Digit
Frequency
0500
1000
1500
2000
2500
Figure 1: The frequency of all digits typed into infusion pumps across multiplehospital departments. This represents all data gathered for this study.
Figure 2 shows that the numbers initially adhere to a Benford distributionwhich is quickly disrupted by infrequent 3s and 4s and overly frequent 5s. Thisresult is perhaps unsurprising as rate and VTBI are not strictly naturally oc-curring numbers, but come from a set of numbers chosen by humans whose
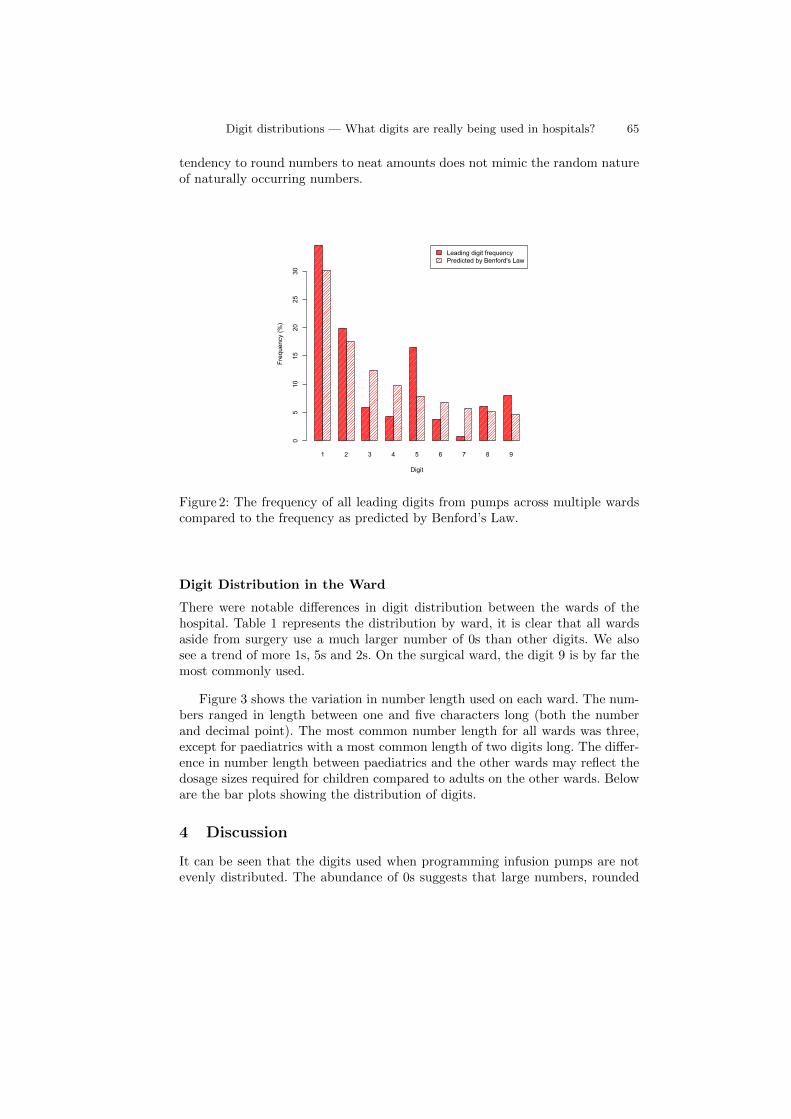
Digit distributions — What digits are really being used in hospitals? 65
tendency to round numbers to neat amounts does not mimic the random natureof naturally occurring numbers.
1 2 3 4 5 6 7 8 9
Digit
Freq
uenc
y (%
)
05
1015
2025
30
Leading digit frequencyPredicted by Benford's Law
Figure 2: The frequency of all leading digits from pumps across multiple wardscompared to the frequency as predicted by Benford’s Law.
Digit Distribution in the Ward
There were notable differences in digit distribution between the wards of thehospital. Table 1 represents the distribution by ward, it is clear that all wardsaside from surgery use a much larger number of 0s than other digits. We alsosee a trend of more 1s, 5s and 2s. On the surgical ward, the digit 9 is by far themost commonly used.
Figure 3 shows the variation in number length used on each ward. The num-bers ranged in length between one and five characters long (both the numberand decimal point). The most common number length for all wards was three,except for paediatrics with a most common length of two digits long. The differ-ence in number length between paediatrics and the other wards may reflect thedosage sizes required for children compared to adults on the other wards. Beloware the bar plots showing the distribution of digits.
4 Discussion
It can be seen that the digits used when programming infusion pumps are notevenly distributed. The abundance of 0s suggests that large numbers, rounded
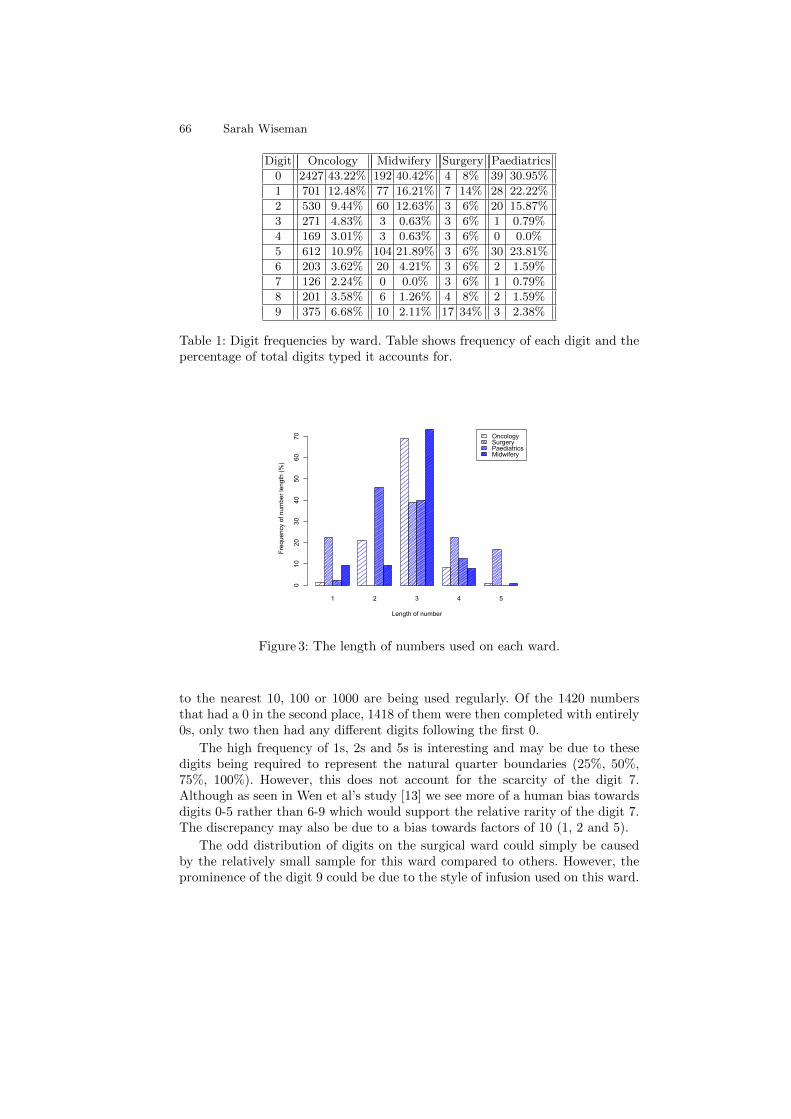
66 Sarah Wiseman
Digit Oncology Midwifery Surgery Paediatrics
0 2427 43.22% 192 40.42% 4 8% 39 30.95%
1 701 12.48% 77 16.21% 7 14% 28 22.22%
2 530 9.44% 60 12.63% 3 6% 20 15.87%
3 271 4.83% 3 0.63% 3 6% 1 0.79%
4 169 3.01% 3 0.63% 3 6% 0 0.0%
5 612 10.9% 104 21.89% 3 6% 30 23.81%
6 203 3.62% 20 4.21% 3 6% 2 1.59%
7 126 2.24% 0 0.0% 3 6% 1 0.79%
8 201 3.58% 6 1.26% 4 8% 2 1.59%
9 375 6.68% 10 2.11% 17 34% 3 2.38%
Table 1: Digit frequencies by ward. Table shows frequency of each digit and thepercentage of total digits typed it accounts for.
1 2 3 4 5
Length of number
Freq
uenc
y of
num
ber l
engt
h (%
)
010
2030
4050
6070 Oncology
SurgeryPaediatricsMidwifery
Figure 3: The length of numbers used on each ward.
to the nearest 10, 100 or 1000 are being used regularly. Of the 1420 numbersthat had a 0 in the second place, 1418 of them were then completed with entirely0s, only two then had any different digits following the first 0.
The high frequency of 1s, 2s and 5s is interesting and may be due to thesedigits being required to represent the natural quarter boundaries (25%, 50%,75%, 100%). However, this does not account for the scarcity of the digit 7.Although as seen in Wen et al’s study [13] we see more of a human bias towardsdigits 0-5 rather than 6-9 which would support the relative rarity of the digit 7.The discrepancy may also be due to a bias towards factors of 10 (1, 2 and 5).
The odd distribution of digits on the surgical ward could simply be causedby the relatively small sample for this ward compared to others. However, theprominence of the digit 9 could be due to the style of infusion used on this ward.
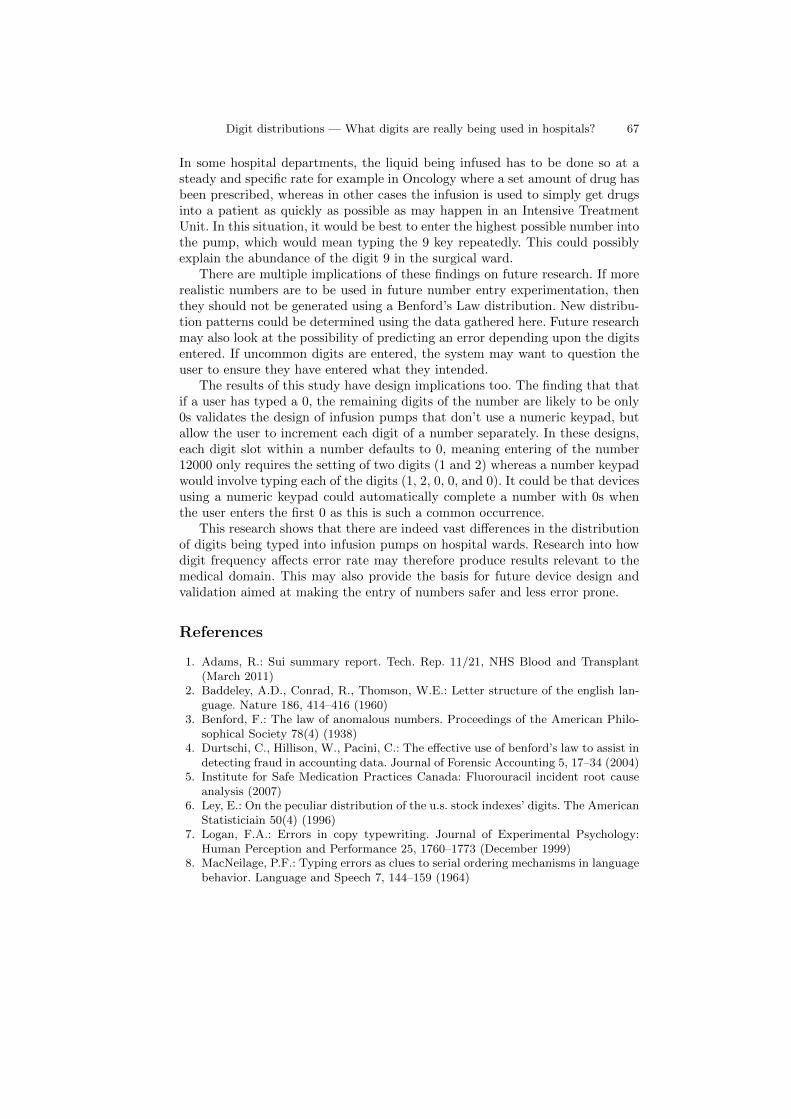
Digit distributions — What digits are really being used in hospitals? 67
In some hospital departments, the liquid being infused has to be done so at asteady and specific rate for example in Oncology where a set amount of drug hasbeen prescribed, whereas in other cases the infusion is used to simply get drugsinto a patient as quickly as possible as may happen in an Intensive TreatmentUnit. In this situation, it would be best to enter the highest possible number intothe pump, which would mean typing the 9 key repeatedly. This could possiblyexplain the abundance of the digit 9 in the surgical ward.
There are multiple implications of these findings on future research. If morerealistic numbers are to be used in future number entry experimentation, thenthey should not be generated using a Benford’s Law distribution. New distribu-tion patterns could be determined using the data gathered here. Future researchmay also look at the possibility of predicting an error depending upon the digitsentered. If uncommon digits are entered, the system may want to question theuser to ensure they have entered what they intended.
The results of this study have design implications too. The finding that thatif a user has typed a 0, the remaining digits of the number are likely to be only0s validates the design of infusion pumps that don’t use a numeric keypad, butallow the user to increment each digit of a number separately. In these designs,each digit slot within a number defaults to 0, meaning entering of the number12000 only requires the setting of two digits (1 and 2) whereas a number keypadwould involve typing each of the digits (1, 2, 0, 0, and 0). It could be that devicesusing a numeric keypad could automatically complete a number with 0s whenthe user enters the first 0 as this is such a common occurrence.
This research shows that there are indeed vast differences in the distributionof digits being typed into infusion pumps on hospital wards. Research into howdigit frequency affects error rate may therefore produce results relevant to themedical domain. This may also provide the basis for future device design andvalidation aimed at making the entry of numbers safer and less error prone.
References
1. Adams, R.: Sui summary report. Tech. Rep. 11/21, NHS Blood and Transplant(March 2011)
2. Baddeley, A.D., Conrad, R., Thomson, W.E.: Letter structure of the english lan-guage. Nature 186, 414–416 (1960)
3. Benford, F.: The law of anomalous numbers. Proceedings of the American Philo-sophical Society 78(4) (1938)
4. Durtschi, C., Hillison, W., Pacini, C.: The effective use of benford’s law to assist indetecting fraud in accounting data. Journal of Forensic Accounting 5, 17–34 (2004)
5. Institute for Safe Medication Practices Canada: Fluorouracil incident root causeanalysis (2007)
6. Ley, E.: On the peculiar distribution of the u.s. stock indexes’ digits. The AmericanStatisticiain 50(4) (1996)
7. Logan, F.A.: Errors in copy typewriting. Journal of Experimental Psychology:Human Perception and Performance 25, 1760–1773 (December 1999)
8. MacNeilage, P.F.: Typing errors as clues to serial ordering mechanisms in languagebehavior. Language and Speech 7, 144–159 (1964)

68 Sarah Wiseman
9. Mayzner, M.S., Tresselt, M.E.: Tables of single-letter and digram frequency countsfor various word-length and letter-position combinations (1965)
10. Oladimeji, P., Thimbleby, H., Cox, A.: Number entry interfaces and their effectson error detection. In: Interact (2011)
11. Sandron, F.: Do populations conform to the law of anomalous numbers? Population57(4), 755–761 (2002)
12. Vicente, K.J., Kada-Bekhaled, K., Hillel, G., Cassano, A., Orser, B.A.: Program-ming errors contribute to death from patient-controlled analgesia: case report andestimate of probability. Canadian journal of anaesthesia 50(4), 328–332 (2003)
13. Wen, S.W., Kramer, M.S., Hoey, J., Hanley, J.A., Usher, R.H.: Terminal digit pref-erence, random error, and bias in routine clinical measurement of blood pressure.Journal of Clinical Epidemiology 46(10), 1187 – 1193 (1993)
14. Wiseman, S., Cairns, P., Cox, A.: A taxonomy of number entry error. In: BCSConference on Human Computer Interaction (2011)

Part III
Extended Abstracts

Modeling Workloads, SLAs and their Violationsin Cloud Computing
Rafidah Pakir Mohamad, Dimitris Kolovos, Richard Paige
Department of Computer Science,University of York, UK
rafidah, dkolovos, paige @cs.york.ac.uk
Abstract Cloud computing is an evolution of data centres with a conceptof utility computing. In utility computing, the service provider providesresources and infrastructure accessible to the customers and chargesthem in a pay-per-use base. Although this concept has been around forsome time, it has become widely employed lately under the term “CloudComputing”. One of the challenges in the field of Cloud Computing is re-source management, which includes capacity management with regard toSLAs (Service Level Agreements). This paper analyses the roadmap forachieving a solution to the problem of breaching server workload agreedin SLAs between service providers and customers by utilising domainspecific modelling and model analysis techniques.
1 Introduction
Resource management in any computing environment is very important to avoidfailure and maintain the performance of applications that run on it. In the cloudcomputing paradigm, infinite resources are possible in principle by creating vir-tual machines on top of physical machines. Cloud computing service providersneed to allocate sufficient physical resources by performing capacity managementbased on workload [11]. This paper presents a literature survey with the aim todevelop a resource and capacity management model for the service provider toperform costing and to estimate the resources required based on the actual work-load with regard to SLAs using Domain Specific Modelling and model analysistechniques.
2 Background
Cloud computing technology is the latest paradigm in computing where servicesare accessed through the internet (cloud) by sharing hardware, software and/orapplications remotely. Data Centres are dedicated places which contain serversand facilities for computing and most of these have cooling facilities and raisedfloors. Cloud Computing enables anyone to own their virtual data centre withpools of virtualised resources in a pay-per-use model. For primarily security-related reasons, some organisations prefer to own their own private cloud rather
72 Rafidah Pakir Mohamad, Dimitris Kolovos, Richard Paige
than using public clouds. This private cloud can be hosted in their own datacentre or a third-party service provider based on SLAs. The existing conventionaldata centre is mostly utilised by implementing cloud computing with supportedby virtualisation technology. However, managing actual physical resources thatsupport these scalable virtualised resources is a significant challenge [5].
Resource and capacity management at the data centre owned by the serviceproviders are very crucial and complex in order to maintain the Quality of Ser-vice (QoS) stated on the SLAs between both parties. Resources are allocatedbased on predicted and agreed workload patterns and resource demand statedin SLAs. However, the actual resource demand needed by the customers to sup-port their businesses might differ from what was stated in the SLAs. As a cloudcomputing service provider, it is essential to provide resource demand to thecustomer with support for auto scaling and recalculating the costing when theinitial SLAs are violated. The computation for the cost for pay-per-use modelin cloud computing is different from other utilities bill calculation. Electricity ismeasured by Watts used, water and gas by volume. In Infrastructure as Service(IaaS), cloud customers are charged based on instances(virtual machines) usedper unit of time. Furthermore, charges would differ based on instances specific-ation because the instances will use physical resources in service provider’s datacentre based on its specifications such as CPU and storage size.
2.1 Data Centres
A data centre is a place which houses servers and facilities for computing ina special area with access controls and cooling facilities. There are four typesof tiers of data centres based on selected criteria explained in TIA-942 [1]. Asper TIA-942, the evolution of data centres was started with the creation offirst computer UNIVAC in 1940s. Later in 1960s, IBM introduced its mainframecomputer. The first distributed computing started with airline reservation sys-tem which went into full operation with two powerful IBM mainframes, sixteendata storage devises and 1,000 terminals in 1965 [6]. The mainframes were verypowerful machines and also were very expensive to operate and to maintain. Thenext generation of computing involved microcomputers, which initially were fo-cused on office usage. Microcomputers replaced terminals which were connectedto mainframes. Then the technology moved on to grid computing, commodityclusters, virtualised clusters, and more recently to cloud computing [9]. Clustercomputing focuses on traditional non-service applications, whereas clouds areservice oriented and grid computing features are utilised by both technologies,but still there are differences between cloud and grid [9].
Cloud Computing The term cloud refers to hardware, software and/or applic-ations remotely accessed via the internet under the principles of utility comput-ing. The National Institute of Standards and Technology provides the followingdefinition: “Cloud Computing is a model for enabling convenient, on-demand net-work access to a shared pool of configurable computing resources (e.g., networks,
Modeling Workloads, SLAs and their Violations in Cloud Computing 73
servers, storage, applications, and services) that can be rapidly provisioned andreleased with minimal management effort or service provider interaction”. Soft-ware as a Services (SaaS), Platform as a Service (PaaS), Infrastructure as a Ser-vice (IaaS) are the three types of services provided by cloud computing [3, 20].Utility computing [16] started receiving wide attention under the new name ofcloud computing - when Amazon1 introduced EC2 (Elastic Compute Cloud) in2006. Today, with facility provided by Amazon, anyone can own a virtual data-center at a minimum cost. However, it is a big challenge for the service providersto manage and provide physical resources to support in principle infinite virtualmachines.
Server Utilization Studies show that server utilization in real world datacentre is estimated between 5% and 20% [3, 4]. Furthermore, an observationfor 5000 servers over 6 months showed that the servers are rarely completelyidle and these servers operate between 10% to 50% of their maximum utilisa-tion level [14]. This shows that servers in real data centres are under-utilised.However, these under-utilised servers still consume a lot of electricity to stayon [2, 18]. Additional energy is also needed for cooling the heat produced by theunderutilize servers. Managing a big data centre is very costly and cloud comput-ing service provider need to take all necessary actions to achieve cost-efficiencyin data centre. Virtualisation and server consolidation have been proposed assolutions for maximising server utilisation [18]. The number of physical serverscan be reduced, by having several virtual machines running on a single server.Intelligent resource management will reduce power consumption in data centresby having fewer servers and as such requiring less cooling.
Resource Management Resources in a data centre can be separated intophysical and virtual resources. Virtual resources are completely isolated serverinstallations within a normal physical server which work like real standaloneservers while in reality they still share physical resources of the hosting server.The main advantage of virtual machine is that it can be migrated to anotherphysical server and mirrored as much as needed for multi-processing. Virtualmachines are typically called instances. To optimise physical server utilisation,virtual machines are allocated to physical servers based on the workload patternstated in SLAs. Even though virtual machines are scalable, they need to bemanaged properly to minimise failure on physical machine [11]. On the otherhand, customer’s business demands might violate SLAs workload pattern andeventually increase the cost of operation for the service provider. The serviceprovider needs to charge the customer and in this scenario a penalty calculationprocess is needed. Simultaneously, the service provider will have to find the actualresource demand based on real workload pattern by their customer for capacitymanagement. We anticipate that capturing resource and capacity managementmodels with Model Driven Engineering techniques will facilitate more intelligent
1 http://aws.amazon.com/releasenotes/Amazon-EC2/532
74 Rafidah Pakir Mohamad, Dimitris Kolovos, Richard Paige
resource and capacity management and enable more accurate costing. Kalman-filtering [12] is of the methods used to predict the need for additional resourcedemand before failure occurs in a server due to huge workload. Besides that,open source tools such as Ganglia [15] are widely used for resource monitoringand cloud federation [10] is one of the techniques that address the the issue oflimited resources.
2.2 Model-Driven Engineering(MDE)
The use of models to capture information at a high level of abstraction reducesthe complexity of understanding a domain or field of interest [17]. MDE is a wellknown approach in software engineering which advocates constructing rigorousmodels – often using Domain Specific Modelling Languages(DSMLs), and man-aging these models using automated tools such as transformation, analysis andvalidation engines, and model-to-text generators [17]. Domain Specific Modellingis principally known as the idea of creating models for a specific domain with aDSML suitable for that domain as an area of interest [19]. A DSML consist of fivefundamental components [7]: abstract syntax, concrete syntax, syntactic map-ping, semantic domain and semantic mapping. These components are used toformally represent a specific set of structure, behaviour and requirement featuresof a particular domain in the form of a meta-model which is also called model-ware [8]. MDE focuses on exploiting as well as creating domain-specific modelsthat capture information about the problem at hand at a suitable level of ab-straction, instead of focusing on algorithmic or low-level computing concepts.MDE relies on automated model management and in particular on automatedsupport for model transformation. Model transformation is divided into model-to-model (M2M), and model-to-text (M2T) transformation. In the former, inputmodels are transformed to other models – possibly expressed in a different mod-elling language, and in the latter, models are transformed to textual artefactssuch as code, documentation and human-readable reports.
3 Proposed work
Epsilon [13] is a platform for building consistent and interoperable task-specificlanguages for model management tasks such as model transformation, code gen-eration, model comparison, merging, refactoring and validation [13]. In this work,Epsilon will be used to develop resource management models and then analyseand transform these models to other representations of interest. Test data foranalysis will be attained by setting-up a cloud environment using Eucalyptus2
private cloud. The server workloads will be observed by workload monitoringtools such as Ganglia [15]. Workloads will be simulated using scripts to generateworkload patterns as stated in the SLAs case study. Again, workload simulationwill be used to violate the expected patterns. Initially, resource monitoring data
2 http://www.eucalyptus.com/

Modeling Workloads, SLAs and their Violations in Cloud Computing 75
will be captured in the form of domain specific models and reports will be pro-duced by transforming these model to text, but later on more types of analysisand model transformation are envisioned.
References
1. Tia-942: Data centre standards overview. White Paper, 2007.2. Energy-Efficient Management of Data Center Resources for Cloud Computing: A
Vision, Architectural Elements, and Open Challenges. International Conference onParallel and Distributed Processing Techniques and Applications (PDPTA 2010),July 2010.
3. Michael Armbrust, Armando Fox, Rean Griffith, Anthony D. Joseph, Randy Katz,Andy Konwinski, Gunho Lee, David Patterson, Ariel Rabkin, Ion Stoica, and MateiZaharia. A view of cloud computing. Commun. ACM, 53:50–58, April 2010.
4. Michael Armbrust, Armando Fox, Rean Griffith, Anthony D. Joseph, Randy H.Katz, Andrew Konwinski, Gunho Lee, David A. Patterson, Ariel Rabkin, IonStoica, and Matei Zaharia. Above the clouds: A berkeley view of cloud comput-ing. Technical report, Electrical Engineering and Computer Sciences, Universityof California at Berkeley, February 2009.
5. Rajkumar Buyya, James Broberg, and Andrzej M. Goscinski, editors. Cloud Com-puting Principles and Paradigms, 2011. John Wiley & Sons, 2011.
6. Nicholas Carr. The Big Switch: Rewiring the World from Edison to Google. W.W. NORTON & COMPAN, 2008.
7. Tony Clark, Andy Evans, Stuart Kent, and Paul Sammut. The mmf approach toengineering object-oriented design languages. In Proceedings of the Workshop onLanguage Descriptions, Tools and Applications, April 2001.
8. Jean-Marie Favre. Towards a basic theory to model model driven engineering. InProceedings of the 3rd Workshop in Software Model Engineering (WiSME), 2004.
9. Ian Foster, Yong Zhao, Ioan Raicu, and Shiyong Lu. Cloud computing and gridcomputing 360-degree compared. In Proceedings of the Grid Computing Environ-ments Workshop, pages 1–10, 2008.
10. Anshul Gandhi, Yuan Chen, Daniel Gmach, Martin Arlitt, and Manish Marwah.Minimizing data center sla violations and power consumption via hybrid resourceprovisioning. In Proceedings of the 2nd International Green Computing Conference,2011.
11. Daniel Gmach, Jerry Rolia, Ludmila Cherkasova, and Alfons Kemper. Capacitymanagement and demand prediction for next generation data centers. In Proceed-ings of the IEEE International Conference on Web Services. IEEE, 2007.
12. Evangelia Kalyvianaki, Themistoklis Charalambous, and Steven Hand. Self-adaptive and self-configured cpu resource provisioning for virtualized servers usingkalman filters. In Proceedings of the 6th international conference on Autonomiccomputing, ICAC ’09, pages 117–126, New York, NY, USA, 2009. ACM.
13. Dimitrios Kolovos, Louis Rose, and Richard Paige. The Epsilon Book. 2011.14. Barroso L.A. and Holzle U. The case for energy-proportional computing. IEEE
Computer, 40(12):33–37, December 2007.15. Matthew L. Massie, Brent N. Chun, and David E. Culler. The ganglia distributed
monitoring system: design, implementation, and experience. Parallel Computing,30(7):817–840, July 2004.
16. Freeman Parkhill. The Challenge of the Computing Utility. Addison-Wesley, 1966.

76 Rafidah Pakir Mohamad, Dimitris Kolovos, Richard Paige
17. Douglas C. Schmidt. Guest editor’s introduction: Model-driven engineering. Com-puter, 39:25–31, February 2006.
18. Shekhar Srikantaiah, Aman Kansal, and Feng Zhao. Energy aware consolidationfor cloud computing. In Proceedings of the 2008 conference on Power aware com-puting and systems, HotPower’08, pages 10–10, Berkeley, CA, USA, 2008. USENIXAssociation.
19. Thomas Stahl, Markus Vølter, Jorn Bettin, Arno Haase, and Simon Helsen. Model-Driven Software Development: Technology, Engineering, Managementb. Wiley,2006.
20. Luis M. Vaquero, Luis Rodero-Merino, Juan Caceres, and Maik Lindner. A breakin the clouds: towards a cloud definition. SIGCOMM Comput. Commun. Rev.,39:50–55, December 2008.
Using Domain-Specific Modelling Languages forRequirements Engineering in Agile Software
Development
Masoumeh Taromirad
Department of Computer Science, University of York, [email protected]
Abstract In this short paper we argue for greater integration of AgileSoftware Development techniques with techniques for Requirements En-gineering; we argue that this is a promising development style that mayallow enhanced delivery of software solutions even in the face of rapidlychanging requirements. We also argue for the use of Domain-SpecificModelling Languages as a promising mechanism for addressing the per-ceived incompatibilities between Requirements Engineering and AgileSoftware Development.
1 Introduction
Change is an accepted fact of software development projects; during a project’slifecycle, its business context, system requirements, project schedule, develop-ment artefacts and even the development process may change [1]. In addition tothis, reducing the development time to reduce time-to-value plays an essentialrole in being successful in the competitive business world [2]. On the other hand,recent studies show that eliciting, specifying and managing requirements is stilla considerable challenge in developing a software system; errors in requirementslead to consistent project failure rate (about 50%) [3, 4]. Therefore, introducingappropriate practices and techniques for identification and specification of re-quirements that consider change and short time-to-delivery as critical concernsis essential.
Agile Software Development is considered to be an appropriate developmentstyle to effectively deal with changes during the project life cycle [5]. In thispaper, we focus on Requirements Engineering (RE) practices in the context ofagile development, considering current challenges in order to improve softwaredevelopment. We suggest to employ Domain-Specific Modeling (DSM) for re-quirements engineering, which may provide better understanding, validation &verification, and faster development.
In the rest of the paper, we are going to introduce Agile Software Develop-ment (Section 2), Requirements Engineering (Section 3) and Domain-SpecificModeling (Section 4) and briefly talk about their challenges and interactions.Finally, in Section 5, the problem and the proposed idea will be discussed inmore detail.
78 Masoumeh Taromirad
2 Agile Software Development
Agile Software Development, formally introduced in 2001, is basically specifiedby Agile Manifesto [6] and Agile Principles [7], which contain four core valuesof agile development and 12 detailed statements supporting the core values.Agile Manifesto and Principles have been written by a group of practitionersof development methodologies dealing with modern software development needsand challenges: rapid changes and faster time-to-value. So, at the high-level, agilestyle of development directly addresses the problems of rapid changes and aimsto effectively respond to changes within the project time frame and budget [1],which consequently leads to better time-to-delivery of software solutions.
Accordingly, in this short paper, we consider agile development as a way ofthinking about software development taking into account two main concerns ofthe Agile Manifesto and Agile Principles (change and time-to-value) [8]. As well,there are some well-known agile development methodologies (XP, Scrum, ASD,DSDM, dX, Crystal Clear, and FDD). Studying their definitions and experi-mental reports will help in achieving better understanding of agile developmentand its current practices.
Although agile development initially targeted small projects (regarding pro-ject scope and team size) and experimental reports confirm this [9], agility isa concept that should be taken into account in any software development pro-ject (even large and critical projects) in order to maintain successful and satisfycustomers’ expectations [10]. Hence, these may arise the need to revise currentassumptions and practices or introduce new ones for using agile in large andcritical projects.
Communication complexity, which grows exponentially as project becomeslarger, and complex and large solution domains are two aspects of the largeprojects which have not been properly addressed by Agile Manifesto or AgilePrinciples. In such cases, effective documentation, at least as a complementarypractice, would be helpful to overcome these issues. This is because it providesknowledge transfer and is used to align common goals and achieve greater un-derstanding of the problem and the solution [11, 12]. In spite of the general mis-understanding about agile development, documentation (requirements, design,and code documents) should be considered very carefully in agile development.Because lack of enough documentation might cause long-term problems for agiledevelopment when software needs to be maintained in the long run [13]. So, light-but-sufficient documentation to produce effective documents for requirements,design, and code is important, specially in large projects, to achieve the overallgoal of agile development such as producing working software [14]. Consequently,in this text, we have focused on documentation in agile development specificallyrequirements documentation regarding the critical role of requirements in soft-ware development. The next section will introduce Requirements Engineeringand existing difficulties.
Using DSMLs for Requirements Engineering in Agile Development 79
3 Requirements Engineering
Requirements Engineering (RE) is the process by which the requirements aredetermined and generally includes requirements understanding, elicitation, eval-uation, specification and documentation, and consolidation [15], which may beperformed in different ways. Any project needs some forms of RE activitieswhatever its type, size, the way used for handling these activities, and how mucheach activity should be covered [16]. But, there are limited practical RE prac-tices in terms of efforts, technologies, and supporting tools which subsequentlydefect the software development projects [17].
A RE process deals with requirements at different levels of abstraction: fromearly requirements to low-level technical ones. It usually begins with identifyinghigh-level user-oriented requirements including business goals and user require-ments, normally explained in natural languages, and ends in a RequirementsDocument (RD) containing lower level specification of the system (system re-quirements), described by a specification language to provide effective commu-nication between users and developers about the problem and the solution (com-mon understanding) [15]. RD, the formal output of RE activities which will behanded to developers, is the baseline for later activities (e.g. planning, design,test, and evaluation) and downstream artefacts [4, 13]. Thus, in this short paper,we focus on system requirements and RD which also comply with our concernabout agile development.
Although not well-defined requirements and conflicting ideas for a proposedsystem are some of the difficulties in RE, requirements specification practicesand techniques are more challenging. Requirements are usually explained in theproblem domain terms while software needs to be explained in the softwareterms. So, producing a practical requirements specification document providinga common understanding to all stakeholders and easy to use, is critical. In ad-dition, the requirements document should not be too big and complex, since itwould be outdated during the project, and should not be far from executablecode in order to be easily verified and implemented [4]. Existing RE processes,practices, techniques, and supporting tools are also too heavyweight and are notwell-defined to integrate into coherent development processes, such as integrat-ing with other development models and producing downstream artefacts fromRE artefacts. These difficulties and problems still exist and somehow are moresever in the context of agile development. On the other hand, an agile style ofdevelopment could help in addressing some of the difficulties of RE, such asdealing with conflicting ideas about the system. This is becuase it implementsrequirements in short iterations resulting in quick feedback to identify conflicts,incompleteness, errors, etc [13].
4 Domain-Specific Modeling
Domain-Specific Modeling (DSM) is a model driven development approach [18]which mainly aims at raising the level of abstraction, by using domain-specific
80 Masoumeh Taromirad
modeling languages for modeling, and fully automatic generation of final output.DSM has main three parts:
1. Domain-Specific Modeling Language (DSML): A modeling language ded-icated to the specific problem domain which closely maps to the problemdomain concepts
2. Code Generator: A domain-specific automatic code generator which generatefinal output in the target programming language or any other format
3. Framework Code: Common areas of all application in the domain
By using DSM, models, specified with domain problem terms, should beeasier to understand, read, and remember, and they are more usable for therequirements specification and documentation. Moreover, full code generationprovides quick response and feedback and changes are faster and easier to makeat a higher level of abstraction (any changes are made within domain conceptsnot in generated codes).
DSMs are defined to focus on narrow problem domain and narrow solutiondomain to raise the level of abstraction. So, applying DSM in larger projectswould arise questions about scalability and change management such as tech-niques to deal with various changes in different parts and their effects on theexisting codes.
5 Problem and Future Work
According to the previous sections, agile is a suitable development style to ad-dress some of main issues in modern software development projects. It effectivelydeals with changes during project life cycle and supports customers’ businessgoals in a better way (competitive time-to-value). On the other hand, difficultieswith RE activities hinder projects’ success remarkably. To improve software de-velopment, agility should be considered as the high-level characteristic of thedevelopment process, addressing changes and time-to-delivery, while softwaredevelopment still needs more effective and practical RE practices regarding theircurrent weaknesses.
As explained before, there are some challenges about using agile in largeand critical projects. One of those is about sufficient documentation. Moreover,we explained that considering RD is very important due to the importance ofrequirements in the project and their changing nature. In Section 3, we showedthat there are some obstacles in RE and existing RE practices and techniques arenot suitable for agile development. This is because, traditionally, RE is a heavyand documentation-oriented process while agile development processes are light,in comparison with RE processes, and emphasize on face-to-face communication[13]. But, as mentioned in Section 3, agile development style would be useful toovercome some of the problems of RE. So, introducing appropriate requirementspecification practices and techniques compatible with agile style of developmentis very challenging regarding current problems and shortcomings of RE whichwould be more serious in integration with agile concerns.
Using DSMLs for Requirements Engineering in Agile Development 81
In this paper, we focus on practices and techniques for developing RD in thecontext of agile development and so we more emphasize on system requirementsas they are more similar to the initial definition of requirements in existing agiledevelopment methodologies and, more important, they are closer to the solutiondomain and working software.
Requirements Specification and Documentation play an essential role in RE.Since their immediate output, Requirements Document (RD), covers the re-quirements (the main concerns of any project) and will be the first output ofprojects which shapes and affects other activities and artefacts along the devel-opment process. Regarding the current problem and existing characteristics forRD [4, 13, 15], an effective and practical RD should
– be understandable to all stakeholders while supporting software develop-ment.
– support inevitable changes in requirements and consequents changes/up-dates on existing artefacts.
– be light-but-sufficiet in order to be updated during the project life cycle.– be close to the working software.– support traditional RD characteristics and features such as traceability,
smoothness, and seamlessness.
As mentioned in Section 2.3, DSM and Domain-Specific Modelling Languagesaim to address many of the limitations of requirements documents, and someof the concerns of RE in general. At the same time, DSMLs appear to indir-ectly consider (or, at least, do not contradict) key agile concerns of managingchange and time-to-delivery. Thus, a promising idea for future work is to con-sider DSMLs and DSM as an effective approach for requirements specificationin the context of agile development. Modeling, especially graphical modelingcarried out using DSMLs and in an iterative and incremental style may be asuitable approach for specifying requirements, and it will offer greater potentialfor analysis, validation and downstream activities through using DSMLs andtheir automated tools for describing and manipulating models. In particular, weenvision using DSMLs and automated tools (such as Epsilon1) for automaticgeneration of consequent artefacts (e.g., architectural models, design models),impact analysis, change propagation, and production of better documentation.
Therefore, the proposed idea is to use DSML to introduced effective andpractical RE practices for requirements specification, in a development processrespecting agility in software development.
References
1. Cockburn, A., Highsmith, J.: Agile software development: The people factor. Com-puter 34 (November 2001) 131–133
2. Sommerville, I.: Software engineering challenges for the 21st century. [Accessed 22June 2011] Available at: http://www.cs.st-andrews.ac.uk/˜ifs/Talks/IEEInaugural.pdf (2000)
1 http://www.eclipse.org/gmt/epsilon

82 Masoumeh Taromirad
3. Marasco, J.: Software development productivity and project success rates: Arewe attacking the right problem? [Accessed 22 June 2011] Available at: http://www.cs.st-andrews.ac.uk/˜ifs/Talks/IEEInaugural.pdf (2006)
4. Cheng, B., Atlee, J.: Current and future research directions in requirements en-gineering. In Aalst, W., Mylopoulos, J., Sadeh, N.M., Shaw, M.J., Szyperski,C., Lyytinen, K., Loucopoulos, P., Mylopoulos, J., Robinson, B., eds.: Design Re-quirements Engineering: A Ten-Year Perspective. Volume 14 of Lecture Notes inBusiness Information Processing. Springer Berlin Heidelberg (2009) 11–43
5. Highsmith, J., Cockburn, A.: Agile software development: The business of innov-ation. Computer 34 (September 2001) 120–122
6. Alliance, A.: Agile manifesto. [Accessed 22 June 2011] Available at: http://www.agilealliance.org/the-alliance/the-agile-manifesto/ (2001)
7. Alliance, A.: Agile principles. [Accessed 22 June 2011] Available at: http://www.agilealliance.org/the-alliance/the-agile-manifesto/the-twelve-principles-of-agile-software/ (2001)
8. Shore, J., Warden, S.: The Art of Agile Development. 1nd edn. Oreilly (2007)9. VersionOne: State of agile survey (2009)
10. Boehm, B., Turner, R.: Balancing Agility and Discipline: A Guide for the Per-plexed. Addison-Wesley Longman Publishing Co., Inc., Boston, MA, USA (2003)
11. Eckstein, J.: Agile Software Development in The Large: Diving into the Deep. 1ndedn. Dorset House Publishing (2004)
12. Cockburn, A.: Agile Software Development. Addison-Wesley (2001)13. Paetsch, F., Eberlein, A., Maurer, F.: Requirements engineering and agile software
development. In: Proceedings of the Twelfth International Workshop on EnablingTechnologies: Infrastructure for Collaborative Enterprises. WETICE ’03, Washing-ton, DC, USA, IEEE Computer Society (2003) 308–
14. Rping, A.: Agile documentation: a pattern guide to producing lightweight docu-ments for software projects. 1nd edn. Wiley (2003)
15. Lamsweerde, A.V.: Requirements Engineering - From System Goals to UML Mod-els to Software Specifications. Wiley (2009)
16. Jones, C.: Variations in software development practices. IEEE Softw. 20 (Novem-ber 2003) 22–27
17. Neill, C.J., Laplante, P.A.: Requirements engineering: The state of the practice.IEEE Software 20 (November 2003) 40–45
18. Kelly, S., Tolvanen, J.P.: Domain-Specific Modeling: Enabling Full Code Genera-tion. Wiley-IEEE Computer Society Pr (March 2008)
Agent-Based Modelling and Simulation of theNF-κB Intracellular Signalling Pathway
Richard Alun Williams
Department of Computer Science and York Centre for Complex Systems Analysis,University of York, UK
Introduction
Cells receive information from their environment through extracellular signalsinteracting with a class of proteins located on their surfaces that are known asreceptors. Signal transduction1 involves the binding of these extracellular sig-nalling molecules to the cell-surface receptors and the triggering of a cascade ofintracellular signalling events inside the cell. This intracellular signalling formspart of a complex system of communication that acts to regulate cell activityand action relative to changes in the external environment [6]. The ability of cellsto perceive and correctly respond to their environment is of particular import-ance for the immune system and the combating of infection. Gene activationsand alterations to metabolism are examples of cellular responses to extracel-lular stimulation that require signal transduction. Errors in the processing ofextracellular signals are responsible for the onset of many cancers and autoim-mune diseases. The Nuclear Factor-κB (NF-κB) signalling pathway2 is one ofthe key signal transduction pathways involved in control and regulation of theimmune system [5]. It is hoped that through an increased understanding of cellsignalling pathways, such as NF-κB, diseases may be treated more effectively, oreven eradicated entirely through prevention of pathway dysregulation.
The systems that biologists wish to analyse and model show an increasingnumber of interdependencies and relationships, meaning that traditional model-ling tools are no longer as appropriate as they once were. Computational biolo-gists and computer scientists are beginning to take a more realistic view of thesesystems through recent advances in computational modelling techniques, suchas agent-based modelling and simulation. Furthermore, computational power isadvancing rapidly, providing the ability to run large-scale computer simulationsof biological systems, which was not plausible in the last century [7]. We believethat computational modelling and simulation of the NF-κB signalling pathwaywill complement wet-lab experimental approaches, and will facilitate a morecomprehensive understanding of this example of a complex biological system.
1 Signal transduction is the process by which an extracellular stimuli (signalling mo-lecule) activates a cell membrane receptor, which in turn initiates a cascade of in-ternal biochemical reactions to generate a cell-level response.
2 A signalling pathway is a network of intracellular biochemical reactions that link thereceiving of an extracellular signal at the cell membrane to the cell response at themolecular level.
84 Richard Alun Williams
Project Objectives
The overall objective of this PhD research project is to use an agent-based model-ling approach to further our understanding of the intracellular NF-κB signallingpathway. This incredibly general aim will be achieved through a principled ap-proach to design and development of the computational model, based upon theiterative nature of the CoSMoS framework [1]. In particular we will be developingthree fully working iterations of the computational model, which will incorporateincreasing levels of detail regarding the biological knowledge that they are basedupon. The first version will replicate the functionality of an existing agent-basedmodel developed in Matlab [9], but will be developed using the FLAME sim-ulation framework3 to allow large-scale simulations run over high-performanceclusters. The second version will incorporate increased intracellular signallingcomponents, and will be scaled up to much larger numbers of agents. The scopeof the third and final version is yet to be confirmed, and will be decided, subjectto time constraints later on in the PhD; we currently have two options whichrelate to (i) development of a corresponding model using another developmentframework, such as Java and MASON4, to investigate any differences in simula-tion results across platforms; or (ii) continue with the FLAME model and furtheraugment for massively parallel simulations, using numbers of agents within theorder of those found in biology, to investigate whether an increase in resolution(with respect to numbers of agents) leads to enhanced predictive capacity ofcomputational models.
Preliminary Results
We have been given access to the code of an NF-κB model that was writtenin 2004 by Mark Pogson and Simon Coakley and served as a Proof of Concept(POC) during the development of the FLAME agent-based simulation frame-work [4]. Simon Coakley developed FLAME for his PhD [3], which was sub-mitted in 2007, therefore this NF-κB model developed in 2004 was very mucha work in progress model. We initially encountered a large number of issues ingetting the FLAME framework to parse and compile the NF-κB POC model.The code (XML and C) was updated to reflect the latest syntax for the currentversion (0.16.2) of the parser which was stored on ccpforge and maintained bythe EURACE project5. Additional teething problems were encountered regard-ing software compatibility and hardware drivers, which have been resolved on acase-by-case basis, and we have recently successfully run our first set of initialsimulations using the POC.
The reverse engineering exercise through a systematic code walkthrough andgeneration of UML diagrams is virtually complete, with just the UML state
3 www.flame.ac.uk4 http://cs.gmu.edu/ eclab/projects/mason/5 The EURACE Project is a FP6 European Project involving a collaboration of re-
searchers from various backgrounds (computer scientists and economists) to worktogether to derive a simulated model of the European economy.
ABMS of the NF-κB Intracellular Signalling Pathway 85
diagram outstanding. The time-course data generated through the initial simu-lations has also furthered our understanding of the POC model, and in particularhas highlighted that there is no biochemical dissociation reaction of NF-κB fromit’s inhibitor IκBα (termed the NF-κB-IκBα complex), degradation of IκBα, orindeed transcription6 and translation7 of the inhibitor IκBα. Analysis of thecode has highlighted that the POC model does have some very elegant featuresregarding the 3D spatial environment of the cell, and the 3D Brownian motiondynamics of individual NF-κB and IκBα molecules. We propose to harness thisfunctionality in our future agent-based models.
Experimental data for use within this PhD research programme has beenprovided by the Qwarnstrom lab, within the Department of Cardiovascular Sci-ence, at the University of Sheffield Medical School. We have been given access tosome of the experimental data generated by single-cell analysis of NF-κB-IκBαdynamics. This data relates to the degradation of inhibitor of IκBα over time,which is the key biochemical reaction for activation of the signalling pathway.The wet-lab experimentation observes the degradation of IκBα through use offluorescent protein tags which are linked to the inhibitor; the decrease in fluor-escence directly correlates to the degradation of the IκBα inhibitor protein, andthus activiation of NF-κB. Of particular interest is the data from: Yang et al,who in 2001 examined IL-18 mediated IκBα degradation [11]; Yang et al, whoin 2003 identified the RelA9 control of IκBα phosphorylation [12]; and Zhang etal, who looked at the novel interleukin1 receptor (IL-1R) co-receptor TILRR10
within amplification of NF-κB activation [13].
A number of statistical techniques have been used on the data to under-stand the biological domain related to this project. Linear statistical analysisadvised that the distribution of the data closely resembled a negative binomialdistribution, and therefore non-parametric techniques are required to summarisethe data. Box-whisker diagrams were used to visually compare the differencesin fluorescence between control and IL-1 stimulated experiments with variouscomponents (e.g. IκBα, IκBα-RelA, and IκBα-RelA-p50). The addition of RelAor RelA-p50 showed a marked decrease in fluorescence, signifying a decrease inIκBα.
6 Transcription is the first step of the process known as gene expression and is wherea DNA sequence is read and a corresponding sequence of RNA is produced.
7 Translation is the process were the RNA sequence produced during transcription isread and a corresponding sequence of amino acids is produced, thus resulting in aprotein being generated from the initial DNA sequence.
8 Interleukin1 (IL-1) is a cytokine (chemical messenger developed by a cell to commu-nicate with other cells) and one of the key extracellular stimuli which activates theNF-κB signalling pathway.
9 The term NF-κB actually relates to a family of five different proteins (RelA, RelB,cRel, p50 and p52), with RelA being the most prevalent.
10 A novel IL-1R co-receptor has recently been discovered and has been named ’Tolland Interleukin like Receptor Regulator’ (TILRR), which amplifies IL-1 inducedactivation of the NF-κB signalling pathway.
86 Richard Alun Williams
Multivariate statistical techniques were also used to analyse the data. Pre-liminary analysis used scatterplot matrix and hierarchical clustering, with moredetailed analysis being performed using principal component analysis. The fluor-escence data was consistently shown to consist of three clusters with regards tothe fluorescence at time 0min. We believe that the large variability within theobservations is consistent with a negative binomial distribution and is due tothe stochasticity inherent to biological populations (from cells to organisms).We also believe that a certain degree of variability may be due to the overex-pression of fluorescent protein constructs used with the single-cell analysis work,e.g. the work of Carlotti et al [2] and Yang et al [11, 12] have optimal functionallevels of RelA at 7-fold endogenous level and of IκBα at 3.5-fold endogenouslevel. We therefore propose that in the short term, data used for calibration ofthe resulting NF-κB FLAME Model and subsequent validation and simulationshould be confined to that which has an initial fluorescence less than 1.5 units.We also believe that in order to get rational results, each cell needs to form it’sown control (which was also the approach taken for the Pogson et al model [10]),which would eliminate the wide variations observed when averaging dynamicsover multiple cells, and by implication simulations. Furthermore, it is believedthat such an approach would yield more consistent results as cell time-coursedynamics would be expressed as a percentage of initial fluorescence for each cell.
Future Work
Areas of future work within the immediate timeline are to complete the mul-tivariate statistical analysis for the single-cell data that we have been providedwith, namely the Zhang et al [13] data regarding the TILRR co-receptor. Fol-lowing this data analysis exercise, we will develop a domain model to formallydocument which aspects of the biology of the NF-κB signalling pathway we willlook at. We will then reverse engineer the Pogson model [8, 9], which has beendeveloped in Matlab, and replicate this functionality within the platform modelthat will correspond to our NF-κB FLAME model. This work, will then be com-pleted through development of the associated simulation platform, calibrationagainst the subset of wet-lab single-cell data highlighted above, and validatedand verified through in silico experimentation to generate a baseline simulatorwhich may be used in the future within a predictive capacity. We would liketo stress here that in silico models should not be considered as definitive de-scriptions of networks within the cell, but should instead be considered as oneapproach that allows us to understand the capabilities of complex systems, anddevise wet-lab experiments to test these capabilities.
It is our intent to use the previously generated single-cell analysis data fromYang et al [11, 12] and Zhang et al [13], and re-interpret in the context of agent-based modelling and in silico experimentation. We hope that this approach willfurther our understanding of the NF-κB signalling pathway, and potentially makean incremental step towards understanding and controlling the transcriptionfactors role in inflammatory disease.

ABMS of the NF-κB Intracellular Signalling Pathway 87
References
1. Andrews, P.S., Polack, F.A.C., Sampson, A.T., Stepney, S., Timmis, J.: The cosmosprocess, version 0.1: A process for the modelling and simulation of complex systems.Tech. Rep. YCS-2010-453, University of York (2010)
2. Carlotti, F., Dower, S.K., Qwarnstrom, E.E.: Dynamic shuttling of nuclear factorκB between the nucleus and cytoplasm as a consequence of inhibitor dissociation.Journal of Biological Chemistry 275, 41028–41034 (2000)
3. Coakley, S.: Formal Software Architecture for Agent-Based Modelling in Biology.Ph.D. thesis, University of Sheffield (2007)
4. Coakley, S., Pogson, M.: NF-κB proof of concept using FLAME (2004)5. Ghosh, S., May, M.J., Kopp, E.B.: NF-κB and Rel proteins: Evolutionarily con-
served mediators of immune response. Annual Review of Immunology 16, 225–260(1998)
6. Hancock, J.T.: Cell Signalling. Prentice Hall, first edition edn. (1997)7. Macal, C.M., North, M.J.: Tutorial on agent-based modeling and simulation. In:
Kuhl, M.E., Steiger, N.M., Armstrong, F.B., Jones, J.A. (eds.) Winter SimulationConference. pp. 2–15. Orlando, Florida (2005)
8. Pogson, M., Holcombe, M., Smallwood, R., Qwarnstrom, E.E.: Introducing spatialinformation into predictive NF-κB modelling - an agent-based approach. PLoSONE 3, e2367 (2008)
9. Pogson, M., Smallwood, R., Qwarnstrom, E.E., Holcombe, M.: Formal agent-basedmodelling of intracellular chemical interactions. BioSystems 85, 37–45 (2006)
10. Qwarnstrom, E.E.: Personal Communication (2011)11. Yang, L., Chen, H., Qwarnstrom, E.: Degradation of IκBα is limited by a postphos-
phorylation/ubiquitination event. Biocehmical and Biophysical Research Commu-nications 285, 603–608 (2001)
12. Yang, L., Ross, K., Qwarnstrom, E.E.: RelA control of IκBα phosphorylation.Journal of Biological Chemistry 278, 30881–30888 (2003)
13. Zhang, X., Shephard, F., Kim, H.B., Palmer, I.R., McHarg, S., Fowler, G.J.S.,O’Neill, L.A.J., Kiss-Toth, E., Qwarnstrom, E.E.: TILRR, a novel IL-1RI co-receptor, potentiates MyD88 recruitment to control Ras-dependent amplificationof NF-κB. Journal of Biological Chemistry 285, 7222–7232 (2010)


Part IV
Poster Abstracts


Dirt Spot Sweeping Random Strategy
Mian Asbat Ahmad and Manuel Oriol
Department of Computer ScienceUniversity of York, UK
In this poster, an enhanced and improved form of automated random testingcalled Dirt Spot Sweeping Random (DSSR) strategy is introduced. DSSR is anew strategy that not only combines ordinary random strategy and random plusstrategy to achieve their combined benefits but additionally sweeps the dirt spotsin the program code for faults. It is based on two intuitions, first is that valuesfrom the boundaries of equivalence partition have interesting values and usingthese values in isolation can locate many faults which can produce high impacton test results while second is that faults reside in block and strip pattern of theprogram and when a fault is found it is most likely that it lies on this patterntherefore using neighbour values of the fault finding value can reveal more faultsquickly which will consequently increase the test performance. DSSR is imple-mented in an open source automated random testing tool called York ExtensibleTesting Infrastructure (YETI). After implementation several experiments wereperformed on two groups of classes. First group contain error seeded programswritten specifically for performance evaluation of DSSR while the second groupcontain classes from Java Development Toolkit (JDK). Experimental results ofboth groups showed that DSSR perform up to 30 % better than pure randomtesting.
Model-Driven Engineering for Specifying,Analysing and Monitoring Cloud Computing
SLAs
Fatima Alkandari, Richard F. Paige, Simon Poulding
Department of Computer Science,University of York, UK
fatma, paige, [email protected]
Cloud computing is a paradigm for the development and deployment ofservice-based applications on shared infrastructure. It focuses on delivering IT re-sources (hardware and software) on-demand, and on a pay-as-you-go basis [3, 8].Cloud computing has different deployment models: public clouds, private cloudsand hybrid clouds [5]. There are many commercial offerings that differ in techno-logy maturity level, service level and system architecture, as well as service-levelagreements and other features. One key challenge associated with cloud comput-ing is contracting for the cloud : how are cloud service-level agreements (SLAs)– which are effectively contracts between cloud consumer and provider – bestdefined, negotiated, monitored and managed? [1, 2]
Model Driven Engineering (MDE) is an approach to software engineering thatutilizes models as first-class artifacts. The aim of using models is to raise thelevel of abstraction and increase the potential for automation in the softwaredevelopment process [4]. Models may be constructed using general modellinglanguages (UML) or Domain Specific Languages (DSLs), which have specialistconcepts and logic for capturing domain knowledge. DSLs may be easier to usefor domain experts to understand, validate and modify programs [6, 7].
My research investigates the use of MDE for enabling cloud computing. Theuse of MDE in cloud computing may help to provide easier development of cloud-based applications, in particular making it easier to take into account concerns ofdifferent stakeholders. Specifically, I am investigating the use of MDE principlesfor capturing and analysing cloud SLAs, so that inconsistencies, incompleteness,inaccuracies, and desirable properties in SLAs can be analysed and checkedbefore they are deployed on a cloud platform. Additionally, I am investigatingways of making cloud SLAs easier to write and use by domain experts (whomay not be cloud computing experts), and to make it easier for non-expertsto take decisions by comparing different cloud SLAs. For example, when twoSLA providers promise a specific up-time and one of the SLA providers includethe scheduled maintenance time while other provider excludes it, I would liketo be able to notify consumers of this in a domain-specific and contextuallyrelevant way (i.e., in their own vocabulary, and in terms of the cloud SLA, notthe infrastructure that triggered the violation).

MDE for Specifying, Analysing and Monitoring Cloud Computing SLAs 93
References
1. Cloud computing use cases. http://opencloudmanifesto.org.2. Michael Armbrust, Armando Fox, Rean Griffith, Anthony D. Joseph, Randy Katz,
Andy Konwinski, Gunho Lee, David Patterson, Ariel Rabkin, Ion Stoica, and MateiZaharia. A view of cloud computing. Commun. ACM, 53:50–58, April 2010.
3. Rajkumar Buyya, Chee Shin Yeo, Srikumar Venugopal, James Broberg, and IvonaBrandic. Cloud computing and emerging it platforms: Vision, hype, and realityfor delivering computing as the 5th utility. Future Generation Computer Systems,25(6):599 – 616, 2009.
4. Brent Hailpern and Peri Tarr. Model-driven development: The good, the bad, andthe ugly. IBM Systems Journal, 45:451–462, 2006.
5. Peter Mell and Tim Grance. The NIST definition of Cloud computing. NationalInstitute of Standards and Technology, 53(6):50, 2009.
6. Marjan Mernik, Jan Heering, and Anthony M. Sloane. When and how to developdomain-specific languages. ACM Comput. Surv., 37:316–344, December 2005.
7. Arie van Deursen, Paul Klint, and Joost Visser. Domain-specific languages: anannotated bibliography. SIGPLAN Not., 35:26–36, June 2000.
8. Luis M. Vaquero, Luis Rodero-Merino, Juan Caceres, and Maik Lindner. A breakin the clouds: towards a cloud definition. SIGCOMM Comput. Commun. Rev.,39:50–55, 2008.
Data mining of audiology data for procuringhearing aids and tinnitus maskers
Muhammad Naveed Anwar and Michael Philip Oakes
Department of Computing, Engineering & Technology, University of Sunderland, St.Peters Way, Sunderland SR6 0DD, England
Naveed.Anwar,[email protected]
This poster describes the data mining of a large set of patient records from thehearing aid clinic at James Cook University Hospital in Middlesbrough, UK. Asis typical of medical data in general, these audiology records are heterogeneous,containing the following three different types of data:
– Audiograms (graphs of hearing ability at different frequencies)
– Structured tabular data (such as gender, date of birth and diagnosis)
– Unstructured text (specific observations made about each patient in a freetext comments field)
There are two research questions for this research:
– To find factors influencing the selection of ITE (in the ear) opposed to BTE(behind the ear) hearing aids. James Cook University Hospital is unique inthat it supplies ITE hearing aids on the National Health Service
– Among those patients diagnosed with tinnitus (ringing in the ear), to findthe factors influencing the decision whether or not to prescribe a tinnitusmasker (a gentle sound source, worn like a hearing aid, designed to drownout tinnitus)
A range of statistical techniques, including clustering, the chi-squared test,principal component analysis, a Naıve Bayesian approach and multiple logisticregression have been used on this set of audiology data. These enabled us todiscover candidate variables (including individual words in the free text fields)which may influence the dichotomies identified above. The findings of this re-search are compared with the experience of the professional audiologist at JamesCook Hospital. The candidate variables are combined using both a Naıve Bayesianapproach and multiple logistic regression to produce decision support systems,where unseen patient records are presented to the system, and the relative prob-ability that the patient should be fitted with an ITE as opposed to a BTE aidor a tinnitus masker as opposed to no tinnitus masker will be returned. The ad-vantage of these techniques for the combination of evidence is that it is easy tosee which variables contributed to the final decision, facilitating the productionof explanation facilities for decision support systems to be used in the real world.
Dynamics and Chaos for Worst Case ExecutionTime Analysis
David Griffin and Alan Burns
University of York
One of the problems to overcome in Worst Case Execution Time (WCET)analysis is that the complexity of modern computer systems means that a smallchange in the initial conditions of the system can lead to a large change in theexecution time of the system. The leads to static analysis techniques which at-tempt to explore the entire state space of the system, thus becoming intractable,or measured analysis techniques which struggle to give absolute guarantees.
An alternative method to existing techniques is to directly examine the un-predicatabilitiy within the system. Recent advances in mathematics allow theuse of dynamical systems to describe the WCET problem. In turn, the use ofdynamical systems enables the use of chaos theory, a branch of mathematicsspecialised to the analysis of a class of systems which have the property thattwo initial states which are similar diverge significantly with the progression oftime. As chaos theory is already used in safety critical systems, it provides avalid set of techniques to apply to the WCET problem.
This work introduces a dynamical system which describes the WCET prob-lem, and presents both theoretical results and empirical evidence that somecommon computer components, such as a cache, may behave chaotically. Ap-plications of the use of chaos theory to the WCET problem are introduced, toeither identify and limit chaotic behaviour or to embrace chaos and gain confid-ence bounds that the system will not exceed a certain execution time.
Self-repairing Robot Swarms
Alan G. Millard and Jon Timmis
Department of Computer ScienceThe University of York, UK
It has long been assumed that swarm systems are robust, in the sense that thefailure of individual robots will have little detrimental effect on a swarm’s overallcollective behaviour. However, a recent study by Bjerknes [1] has shown that thisis not always the case. The task of emergent beacon taxis was used as a casestudy, which requires an aggregated swarm of homogeneous autonomous robots,with limited sensing abilities, to traverse an empty arena towards an infraredbeacon. The failure mode found to have the most damaging effect upon theswarm’s emergent beacon taxis behaviour, was motor failure. This fault rendersa robot stationary, but does not affect its other electronic systems, allowing therobot to continue to contribute to the emergent behaviour of aggregation. Whenthe swarm is required to physically translate its position during beacon taxis, arobot experiencing motor failure will anchor the swarm, impeding (or at worst,preventing) the swarm’s progress towards the beacon [2].
In our previous work [3] we investigated whether the anchoring issues ob-served by Bjerknes [1] could be alleviated through the development of self-repairmechanisms that enable a swarm to take some form of corrective action in re-sponse to the failure of individual robots1. Extending the work of Ismail et al. [4],an equivalent failure mode was considered, whereby a fault in a robot’s powerunit causes a sudden loss of stored energy. The amount of remaining energyis sufficient to allow for simple signalling, but insufficient to power the robot’smotors, resulting in a loss of mobility. A robot experiencing this type of failuremay be ‘repaired’ by having its battery recharged by functional robots. The spe-cialised hardware required to implement such self-repair mechanisms has onlyrecently become available, in the form of the Symbricator robot — a new roboticplatform designed for the SYMBRION/REPLICATOR projects [5] — whichfacilitates the sharing of energy between physically connected robots.
We have developed a novel decentralised self-repair algorithm for the Sym-bricator robotic platform, inspired by the emergent aggregation behaviour of cel-lular slime moulds, using software available from the Player/Stage Project [6]. Asimulated swarm of robots executing this algorithm is observed to self-organiseto form a physically connected ad hoc robotic ‘organism’ around a faulty robot,which serves as a conduit for energy transfer. The swarm’s collective energy isthen evenly redistributed throughout the organism, and once the faulty robothas been repaired, the robots simply disperse to resume beacon taxis. Experi-mental results have shown that our algorithm enables a simulated swarm of tenrobots to recover from up to five simultaneously injected faults, thus affordingthe swarm a high degree of fault-tolerance [3].
1 Abandoning faulty robots is not a scalable strategy in the long term.

Self-repairing Robot Swarms 97
References
1. Bjerknes, J.D.: Scaling and Fault Tolerance in Self-organized Swarms of MobileRobots. Ph.D. thesis, University of the West of England, Bristol, UK (2009)
2. Winfield, A.F.T., Nembrini, J.: Safety in numbers: fault-tolerance in robot swarms.In: International Journal of Modelling, Identification and Control (IJMIC), vol. 1(1),pp. 30–37 (2006)
3. Millard, A.G.: Self-repairing Collective Robotic Systems. Master’s thesis, The Uni-versity of York, UK (2011)
4. Ismail, A.R., Timmis, J., Bjerknes, J.D., Winfield, A.F.T.: An Immune-InspiredSwarm Aggregation Algorithm for Self-Healing Swarm Robotic Systems. In prepar-ation.
5. SYMBRION REPLICATOR : HomePage, http://www.symbrion.eu/6. Gerkey, B.P., Vaughan, R.T. Howard, A.: The Player/Stage Project: Tools for Multi-
Robot and Distributed Sensor Systems. In: Proceedings of the 11th InternationalConference on Advanced Robotics (ICAR), pp. 317–323 (2003)
Developing a Simulation and Hardware for aRobot Swarm Using Sound to Communicate
Jennifer Owen
Department of Computer Science, University of York, York, [email protected]
In our research we are interested in getting a swarm of E-Puck [1] robots tocommunicate and cooperate with each other using audio messages. To performthese experiments we need a simulation of our robot swarm, as well as a hard-ware extension to the E-Pucks that is capable of detecting an audio signal anddetermining its frequency and the direction it came from. Robotic swarm ex-periments are enormously time consuming, so a simulation is needed to predictwhich experimental parameters are worth testing on a real robotic swarm.
1 Simulation
Our simulation was made following the CoSMoS process [2], which is an iterativedesign process for developing simulations of complex systems. CoSMoS consistsof four deliverables. First there is the Domain Model. In simulation, the Domainis the thing we wish to model. In our simulation, the domain is E-Pucks withhardware that is still under construction. The Domain Model is an aggregationof everything we know about the domain. In our simulation this is the specific-ation of the E-Pucks and the requirements for our custom hardware, everythingelse about the domain is still unknown. Second is the Platform Model which iseverything we will use in our simulation from the domain model. We will simu-late ideal E-Pucks with ideal custom hardware without attempting to add noiseto their actions, this may need to be modified later if our simulation proves tobe too innaccurate. Next there is the Simulation which is the implementationof the platform model. We will use Player/Stage, which is an open-source robotsimulator [3]. The final deliverable is an Analysis Model which is the testingand verification of the model as it compares with the original domain. Since ourdomain involves robot hardware that has ot yet been built, we cannot yet verifyour simulation against reality.
2 Hardware
To detect audio and the direction it came from, in the real robots, we will be usinga phased array of microphones. Three or more microphones are evenly spacedalong a plane, an approaching sound will reach each microphone at slightlydifferent times. This delay is dependent on the angle the sound came from. If asound originates from directly in front of the robot, it will hit the microphonesat the same time. If it comes from 90 to the side there is the most delay between
Developing Simulation and Hardware for a Robot Swarm 99
microphones receiving the sound. In a phased array we use this principle, but theprocess is reversed. We can effectively point the phased array of microphones inany direction by applying a delay to each microphone. This delay is calculatedsuch that all the microphones will receive the sound at the same time only ifthe sound originates from the desired angle. If the delayed data from all themicrophones is summed, this will give us a peak if the sound originates from thedesired angle.
Our hardware records sound entering each microphone, the data is delayedand summed for 5 different angles. A Fourier transform is performed on eachresulting waveform to give us a measure of which frequencies came from eachangle.
3 Future Work
The next stage in our research is to finalise the hardware and test its limitations.Specifically we need to know its maximum range, the maximum frequency it candetect, its ability to measure a sound’s direction and the minimum duration asound can have for it to be detected. This information will be fed back into oursimulation to improve its accuracy. Finally we will verify the simulation againsta real robotic system performing basic audio communication.
References
1. Mondada, F., Bonani, M., Raemy, X., Pugh, J., Cianci, C., Klaptocz, A., Magnenat,S., Zufferey, J.C., Floreano, D., Martinoli, A.: The e-puck, a robot designed foreducation in engineering. In: 9th Conference on Autonomous Robot Systems andCompetitions. Volume 1. (2009) 59–65
2. Andrews, P.S., Polack, F.A.C., Sampson, A.T., Stepney, S., Timmis, J.: The CoS-MoS process version 0.1: A process for the modelling and simulation of complexsystems. Technical Report YCS-2010-453, Department of Computer Science, Uni-versity of York (2010)
3. Vaughan, R.: Massively multi-robot simulation in Stage. Swarm Intelligence 2(December 2008) 189–208
Trans-DV: A Framework for Developing andFormally Verifying Model Transformation
Specifications
Asmiza A. Sani, Fiona A. C. Polack, and Richard F. Paige
Department of Computer ScienceUniversity of York
Deramore Lane, York, YO10 5GH, UKasmiza,fiona,[email protected]
Abstract The Trans-DV framework proposes a set of languages for spe-cifying model transformations with attached verification properties. Thelanguages are based on a corpus of transformation patterns, which sup-port automatically generating a formal specification using templates thatare amenable to simulation and analysis. Trans-DV also provides severalphases for capturing transformation requirements, structural and beha-vioural features and finally simulate and formally verify the transform-ation specification using model checkers. Currently, Trans-DV supportsautomated verification via the Alloy Analyzer.
Keywords: Model transformation, verification, formal methods
1 Introduction
Model Driven Engineering is defined by two basic principles; conformation of amodel to a domain model and representation of a model for a real world sys-tem [2]. Transformation is the core mechanism at the basis of any model manip-ulation process in Model Driven Engineering (MDE). A transformation definesa relationship between models; a transformation specification enables a processof transforming source models automatically into target models. Specificationsare read, analysed and implemented by transformation tools [3].
Though typically developed following an ad-hoc process, transformations areengineering artefacts and can be developed in a disciplined way, like other soft-ware artefacts. As such, typical software engineering practices and techniquescan and should be applied to them. In particular, formally verifying transforma-tion implementations against specifications may be valuable, in identifying flaws,omissions or errors, and in promoting a more disciplined approach to engineer-ing transformations. Formally verifying a model transformation can be complex,but introducing patterns and templates as part of this process may enable alight-weight and pragmatic verification approach [7].
Trans-DV 101
2 Motivation
Often transformation adopts testing for verification [4] [6] and formal methodsis less considered due to common perception regarding its difficulty. Trans-DVis a framework that provides a systematic process for specifying and verifyingtransformations, using a language for capturing both structural and behaviouralpatterns in a model. The motivation of Trans-DV is two fold; one is to provide away to visually specifying transformation and the other is to do it, particularly,for supporting automatic formal analysis and simulation of the specification.Trans-DV uses templates which, when instantiated, automatically produce anequivalent formal specification from a transformation, attached with assertionsthat are tractable and amenable to formal analysis and simulation, hence, hidingthe rigour of formal methods from transformation engineers. For now, Trans-DVsupports verification via Alloy [5] and Alloy Analyzer [1].
References
1. Alloy analyzer website. http://alloy.mit.edu/.2. Jean Bezivin, Mikael Barbero, and Frederic Jouault. On the applicability scope
of Model Driven Engineering. In Model-Based Methodologies for Pervasive andEmbedded Software, pages 3–7. IEEE, 2007.
3. Krzysztof Czarnecki and Simon Helsen. Feature-based survey of model transform-ation approaches. IBM System Journal, 45(3), 2006.
4. Franck Fleurey, Benoit Baudry, Pierre-Alain Muller, and Yves Le Traon. Qualify-ing Input Test Data for Model Transformations. Journal of Software and SystemsModeling, 2007.
5. Daniel Jackson. Alloy: A lightweight object modelling notation. ACM Transactionson Software Engineering and Methodology, 2002.
6. Jean-Marie Mottu, Benoit Baudry, and Yves Le Traon. Reusable mda components:A testing-for-trust approach. In Model Driven Engineering Languages and Systems,volume 4199/2006 of LNCS, pages 589–603. Springer, 2006.
7. Asmiza Abdul Sani, Fiona A. C. Polack, and Richard F. Paige. Generating FormalModel Transformation Using a Template-based Approach. In York Doctoral Sym-posium 2010, 2010.
Agent-Based Modelling and Simulation of theNF-κB Intracellular Signalling Pathway
Richard Alun Williams
Department of Computer Science and York Centre for Complex Systems Analysis,University of York, UK
Poster Abstract
The ability of cells to perceive and correctly respond to their environment is ofparticular importance for the immune system and the combating of infection.Errors in the processing of extracellular signals are responsible for the onset ofmany cancers and autoimmune diseases. The NF-κB signalling pathway is one ofthe key signalling pathways involved in the control and regulation of the immunesystem [4]. Computational biologists and computer scientists are beginning totake a more realistic view of these systems through recent advances in compu-tational modelling techniques, such as agent-based modelling and simulation.Furthermore, computational power is advancing rapidly, providing the abilityto run large-scale computer simulations of biological systems, which was notplausible in the last century. It is hoped that through an increased understand-ing of cell signalling pathways, such as NF-κB, diseases may be treated moreeffectively, or even eradicated entirely through prevention of pathway dysregu-lation. We believe that computational modelling and simulation of the NF-κBsignalling pathway will complement wet-lab experimental approaches, and willfacilitate a more comprehensive understanding of this example of a complexbiological system.
We will be developing an agent-based model and simulation of NF-κB usingthe FLAME simulation framework [3]. FLAME was developed for the simula-tion of large-scale agent-based models over high-performance computer clusters.The agents are designed and modelled as communicating X-machines, which al-low them to communicate with each other through a centralised message board.Experimental data [2, 6–8] for use within model development, calibration and ul-timate simulation has been provided by the Qwarnstrom lab, within the Depart-ment of Cardiovascular Science, at the University of Sheffield Medical School.This data relates to the degradation of inhibitor of NF-κB (IκBα) over time,which is the key biochemical reaction for activation of the signalling pathway.The wet-lab experimentation observes the degradation of IκBα through use offluorescent protein tags which are linked to the inhibitor; the decrease in fluor-escence directly correlates to the degradation of the IκBα inhibitor protein, andthus activiation of NF-κB.
A number of statistical techniques have been used on the data to under-stand the biological domain related to this project. Linear statistical analysisadvised that the distribution of the data closely resembled a negative bino-mial distribution, and therefore non-parametric techniques are required to sum-

ABMS of the NF-κB Intracellular Signalling Pathway 103
marise the data. Negative binomial distributions are widely seen throughoutbiology due to the inherent stochasticity within biological processes. As such,these processes generate large variation, due to the compound effects of scale(DNA-RNA-Protein-Cell), and result in large variability of observations withindatasets [1, 5]. Multivariate statistical techniques were also used to analyse thedata. Preliminary analysis used scatterplot matrix and hierarchical clustering,with more detailed analysis being performed using principal component analysis.The data was consistently shown to consist of three clusters with regards to thefluorescence at time 0min.
It is difficult to calibrate an agent-based model with data that shows suchlarge variability, which is inherent to a negative binomial distribution. We there-fore propose that in the short term, data used for calibration of the resultingNF-κB FLAME Model and subsequent validation and simulation should be con-fined to the first cluster from multivariate statistical analysis, which has an initialfluorescence less than 1.5 units. Further iterations will then incorporate the ad-ditional data, and we intend to perform in silico experimentation to predictdifferences in system dynamics due to the amount of IκBα inhibitor (degree ofinitial fluorescence).
References
1. Bliss, C.I., Fisher, R.A.: Fitting the negative binomial distribution to biologicaldata. Biometrics 9, 176–200 (1953)
2. Carlotti, F., Chapman, R., Dower, S.K., Qwarnstrom, E.E.: Activation of nuclearfactor κB in single living cells. Journal of Biological Chemistry 274, 37941–37949(1999)
3. Coakley, S.: Formal Software Architecture for Agent-Based Modelling in Biology.Ph.D. thesis, University of Sheffield (2007)
4. Ghosh, S., May, M.J., Kopp, E.B.: NF-κB and Rel proteins: Evolutionarily conservedmediators of immune response. Annual Review of Immunology 16, 225–260 (1998)
5. White, G.C., Bennetts, R.E.: Analysis of frequency count data using the negativebinomial distribution. Ecology 77, 2549–2557 (1996)
6. Yang, L., Chen, H., Qwarnstrom, E.: Degradation of IκBα is limited by a postphos-phorylation/ubiquitination event. Biocehmical and Biophysical Research Commu-nications 285, 603–608 (2001)
7. Yang, L., Ross, K., Qwarnstrom, E.E.: RelA control of IκBα phosphorylation.Journal of Biological Chemistry 278, 30881–30888 (2003)
8. Zhang, X., Shephard, F., Kim, H.B., Palmer, I.R., McHarg, S., Fowler, G.J.S.,O’Neill, L.A.J., Kiss-Toth, E., Qwarnstrom, E.E.: TILRR, a novel IL-1RI co-receptor, potentiates MyD88 recruitment to control Ras-dependent amplificationof NF-κB. Journal of Biological Chemistry 285, 7222–7232 (2010)