fourth quarter and full year results 2017 investor...loans & mortgages deposits country based...
TRANSCRIPT
Fourth quarter and
full year results 2017Debt investor presentation
Disclaimer
2
This presentation contains forward-looking statements that reflect management’s current views with respect to certain
future events and potential financial performance. Although Nordea believes that the expectations reflected in such
forward-looking statements are reasonable, no assurance can be given that such expectations will prove to have been
correct. Accordingly, results could differ materially from those set out in the forward-looking statements as a result of
various factors.
Important factors that may cause such a difference for Nordea include, but are not limited to: (i) the macroeconomic
development, (ii) change in the competitive climate, (iii) change in the regulatory environment and other government
actions and (iv) change in interest rate and foreign exchange rate levels.
This presentation does not imply that Nordea has undertaken to revise these forward-looking statements, beyond what is
required by applicable law or applicable stock exchange regulations if and when circumstances arise that will lead to
changes compared to the date when these statements were provided.
3
Table of contents
1. Nordea in brief
2. Financial results highlights
3. Group transformation
4. Capital
5. Macro
6. Funding
4
10
21
25
28
32
1. Nordea in brief
4
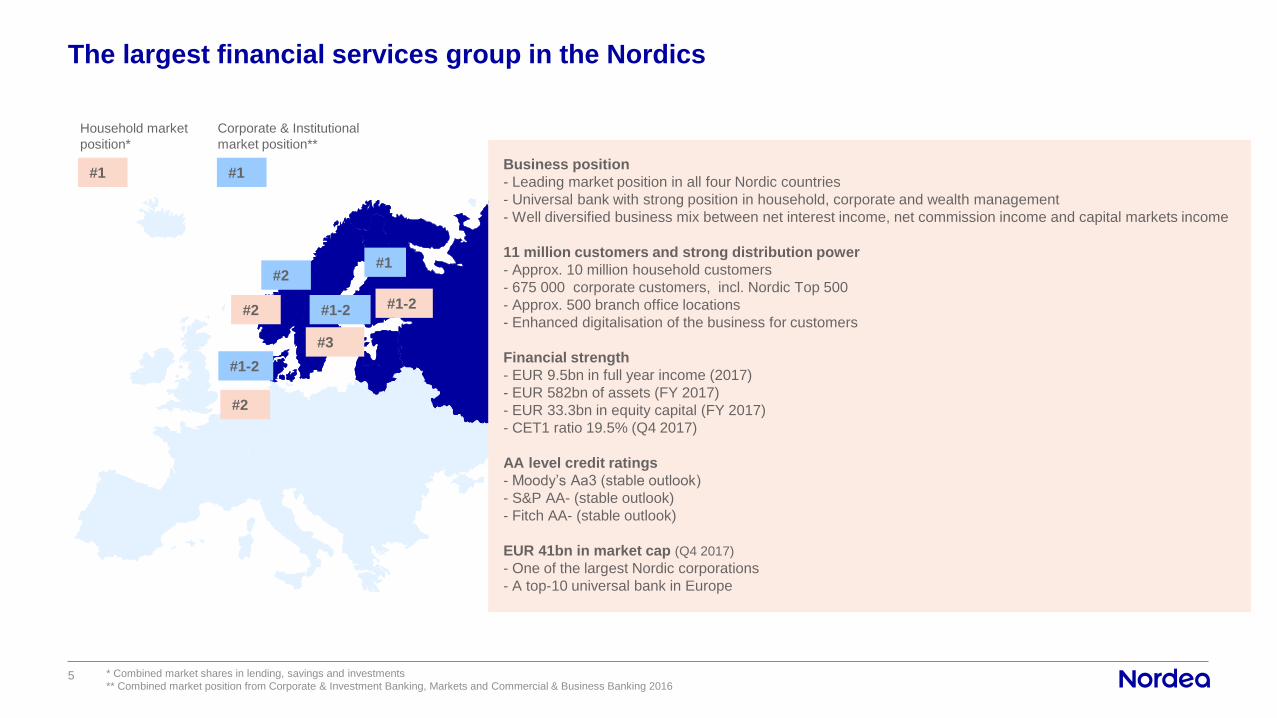
The largest financial services group in the Nordics
5
Business position
- Leading market position in all four Nordic countries
- Universal bank with strong position in household, corporate and wealth management
- Well diversified business mix between net interest income, net commission income and capital markets income
11 million customers and strong distribution power
- Approx. 10 million household customers
- 675 000 corporate customers, incl. Nordic Top 500
- Approx. 500 branch office locations
- Enhanced digitalisation of the business for customers
Financial strength
- EUR 9.5bn in full year income (2017)
- EUR 582bn of assets (FY 2017)
- EUR 33.3bn in equity capital (FY 2017)
- CET1 ratio 19.5% (Q4 2017)
AA level credit ratings
- Moody’s Aa3 (stable outlook)
- S&P AA- (stable outlook)
- Fitch AA- (stable outlook)
EUR 41bn in market cap (Q4 2017)
- One of the largest Nordic corporations
- A top-10 universal bank in Europe
#2
#2
#2
#3
#1-2
#1-2
#1-2
#1
#1#1
Household market
position*
Corporate & Institutional
market position**
* Combined market shares in lending, savings and investments
** Combined market position from Corporate & Investment Banking, Markets and Commercial & Business Banking 2016
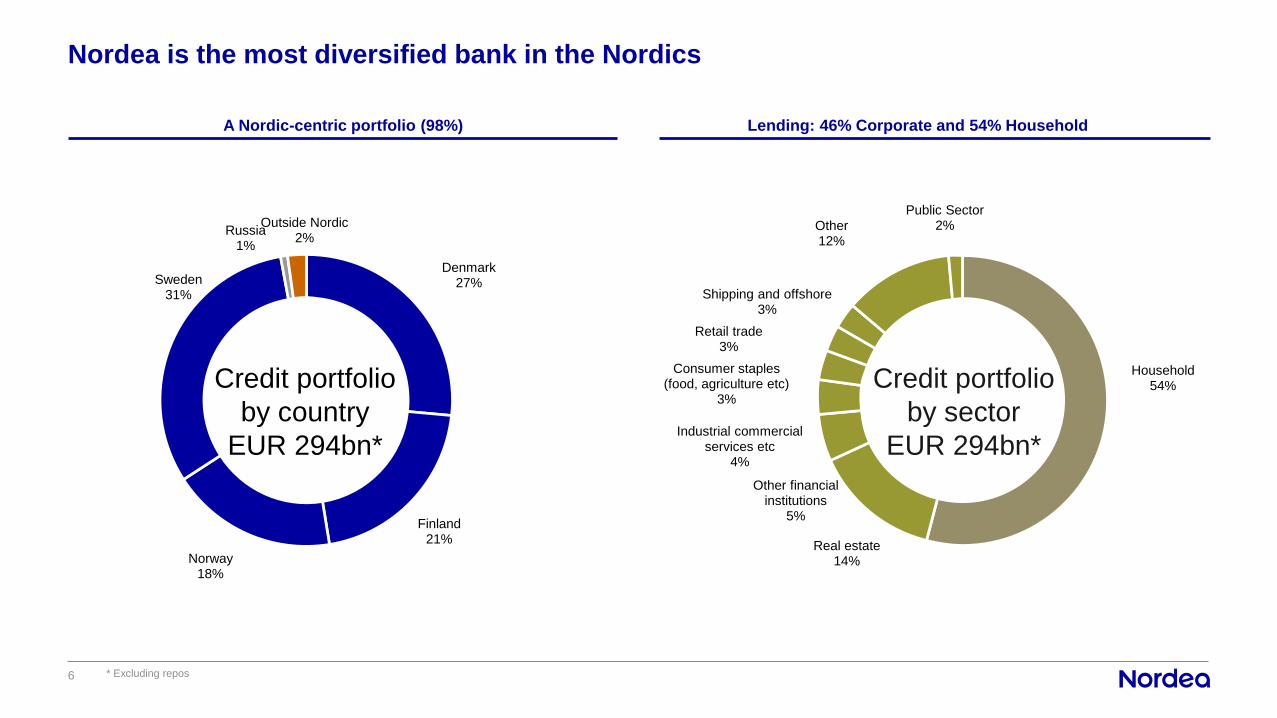
Denmark 27%
Finland21%
Norway18%
Sweden31%
Russia1%
Outside Nordic2%
Household54%
Real estate14%
Other financial institutions
5%
Industrial commercial services etc
4%
Consumer staples (food, agriculture etc)
3%
Retail trade3%
Shipping and offshore3%
Other12%
Public Sector2%
Credit portfolio
by country
EUR 294bn*
Credit portfolio
by sector
EUR 294bn*
A Nordic-centric portfolio (98%) Lending: 46% Corporate and 54% Household
Nordea is the most diversified bank in the Nordics
6 * Excluding repos
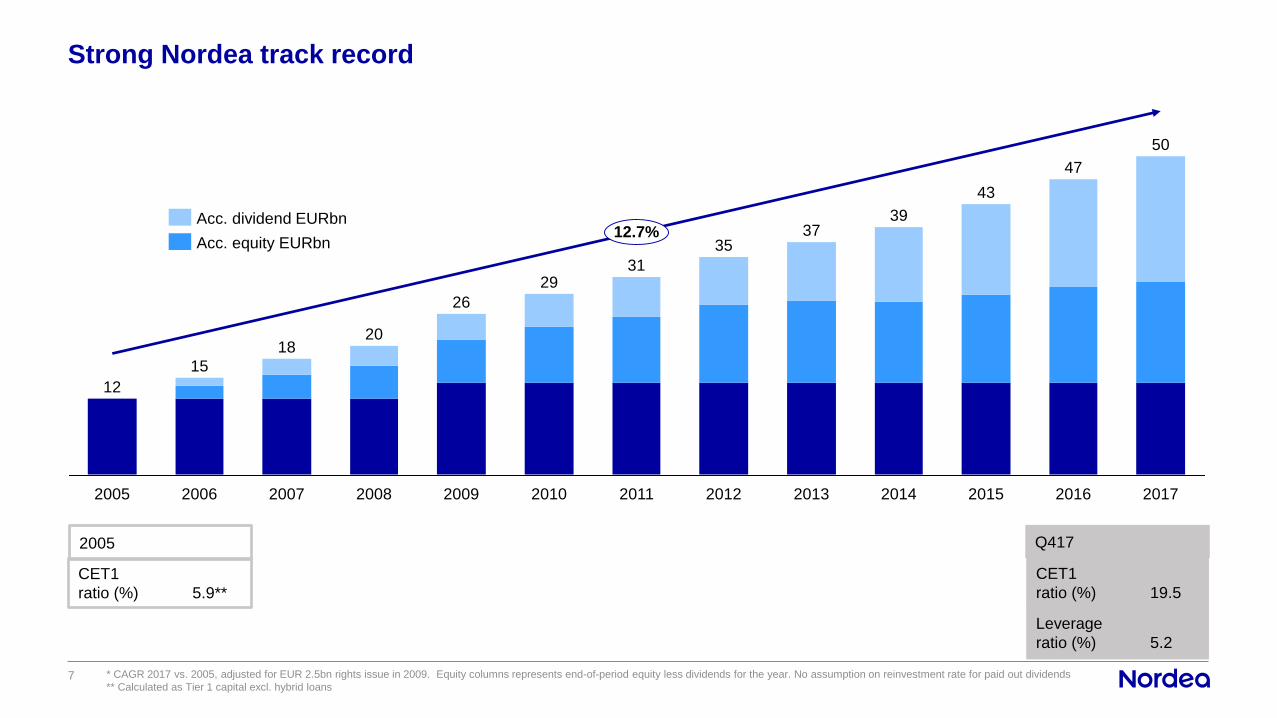
Strong Nordea track record
7 * CAGR 2017 vs. 2005, adjusted for EUR 2.5bn rights issue in 2009. Equity columns represents end-of-period equity less dividends for the year. No assumption on reinvestment rate for paid out dividends
** Calculated as Tier 1 capital excl. hybrid loans
20
2007
18
2006
15
2005
12
2017
50
12.7%
2016
47
2015
43
2014
39
2013
37
2012
35
2011
31
2010
29
2009
26
2008
Acc. dividend EURbn
Acc. equity EURbn
CET1
ratio (%) 19.5
Leverage
ratio (%) 5.2
Q417
CET1
ratio (%) 5.9**
2005
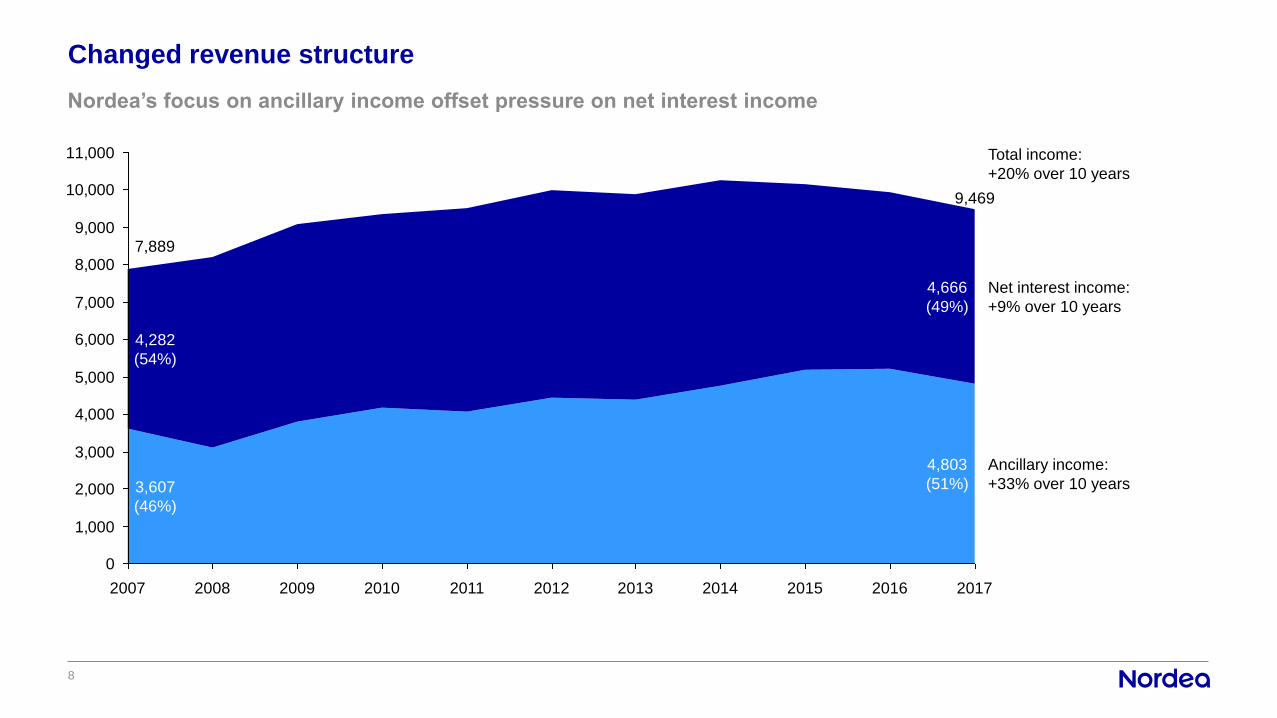
Changed revenue structure
8
Nordea’s focus on ancillary income offset pressure on net interest income
Total income:
+20% over 10 years
0
1,000
2,000
3,000
4,000
5,000
6,000
7,000
8,000
9,000
10,000
11,000
3,607
(46%)
7,889
2007 2008 20132009 2010 2011 2012 2014 2015 20172016
Net interest income:
+9% over 10 years
Ancillary income:
+33% over 10 years
4,282
(54%)
9,469
4,803
(51%)
4,666
(49%)
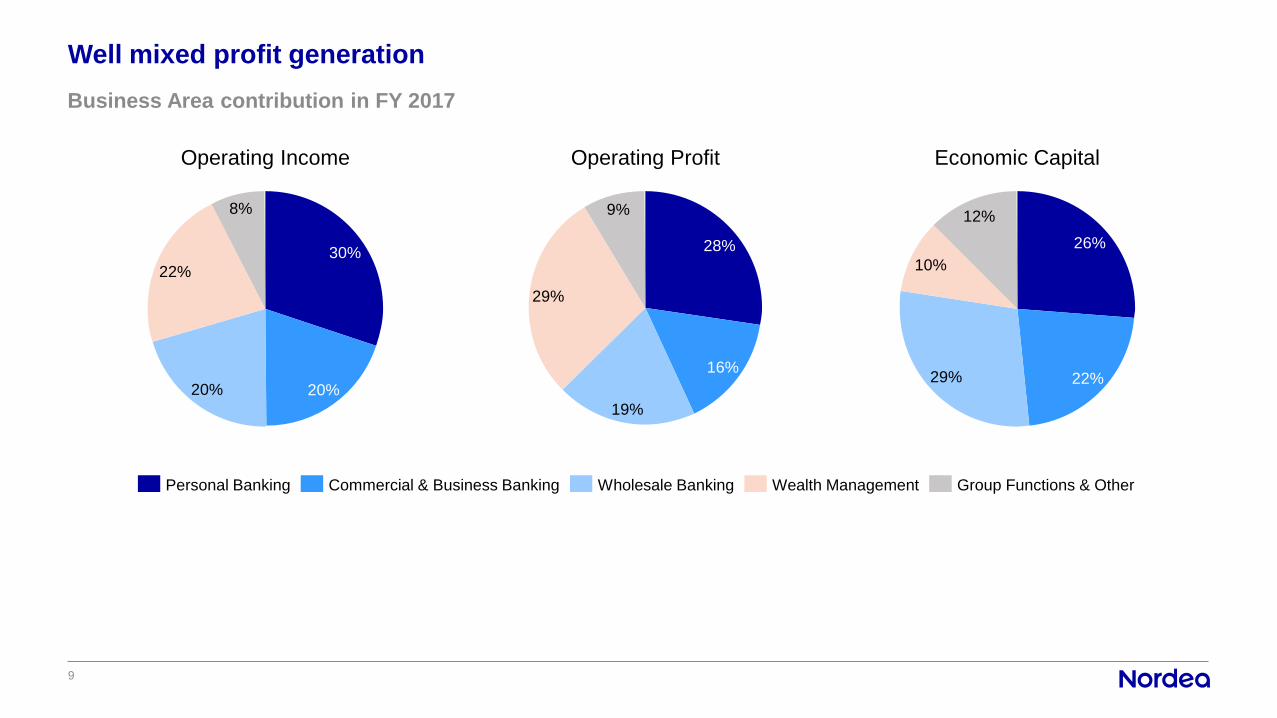
Well mixed profit generation
9
Business Area contribution in FY 2017
20%
22%
20%
30%
8% 9%
29%
19%
16%
28%
22%
12%
29%
10%
26%
Wholesale BankingCommercial & Business BankingPersonal Banking Wealth Management Group Functions & Other
Operating Income Operating Profit Economic Capital
2. Financial results highlights
10
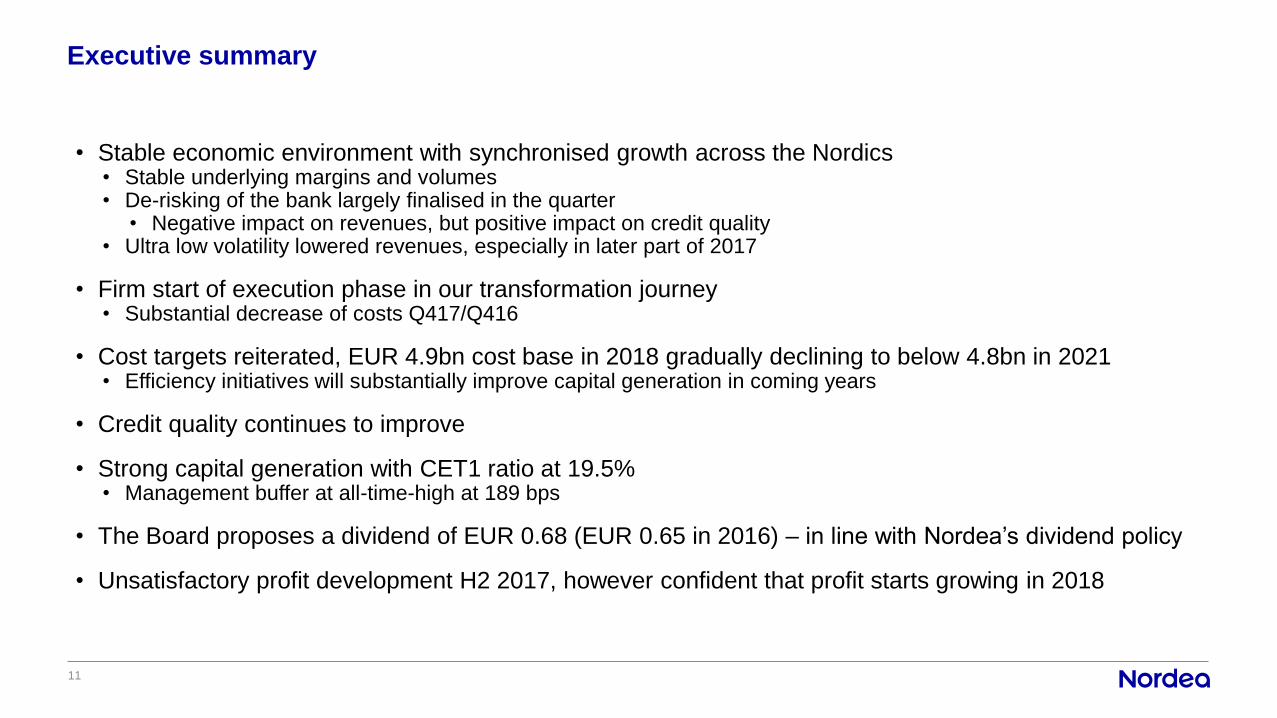
Executive summary
• Stable economic environment with synchronised growth across the Nordics• Stable underlying margins and volumes• De-risking of the bank largely finalised in the quarter
• Negative impact on revenues, but positive impact on credit quality• Ultra low volatility lowered revenues, especially in later part of 2017
• Firm start of execution phase in our transformation journey • Substantial decrease of costs Q417/Q416
• Cost targets reiterated, EUR 4.9bn cost base in 2018 gradually declining to below 4.8bn in 2021• Efficiency initiatives will substantially improve capital generation in coming years
• Credit quality continues to improve
• Strong capital generation with CET1 ratio at 19.5%• Management buffer at all-time-high at 189 bps
• The Board proposes a dividend of EUR 0.68 (EUR 0.65 in 2016) – in line with Nordea’s dividend policy
• Unsatisfactory profit development H2 2017, however confident that profit starts growing in 2018
11
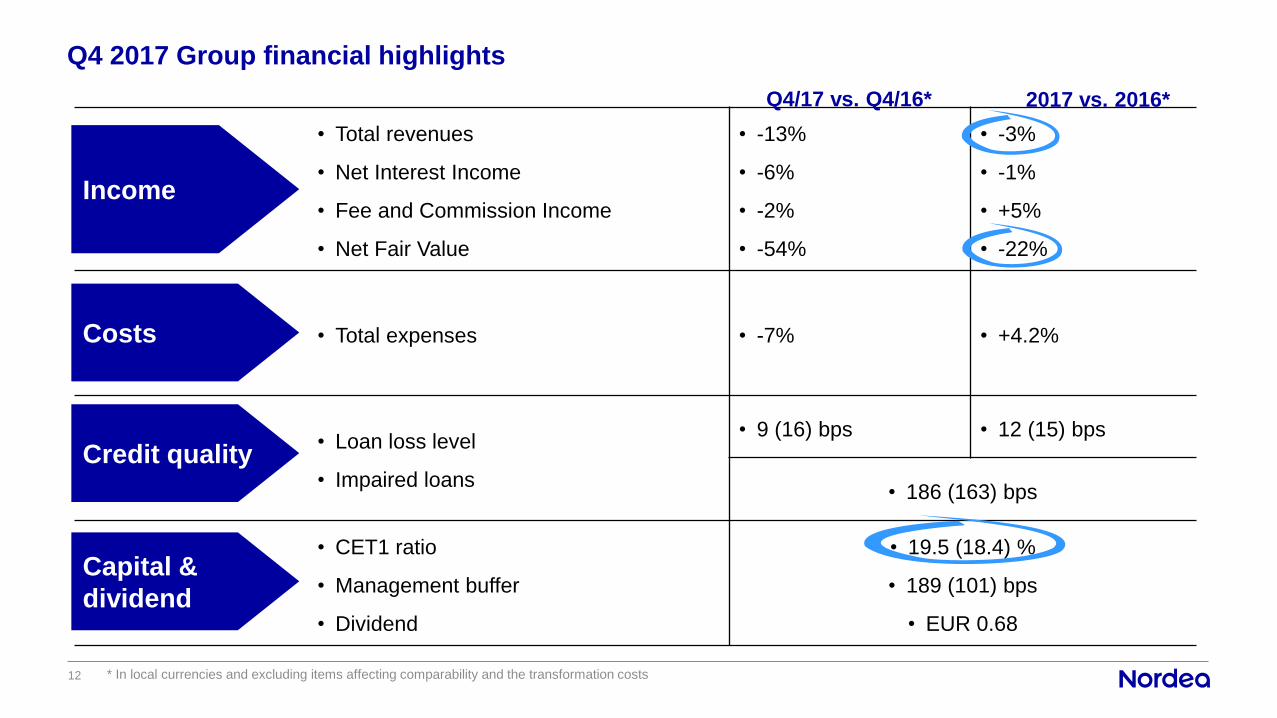
Q4 2017 Group financial highlights
12 * In local currencies and excluding items affecting comparability and the transformation costs
• Total revenues
• Net Interest Income
• Fee and Commission Income
• Net Fair Value
• -13%
• -6%
• -2%
• -54%
• -3%
• -1%
• +5%
• -22%
• Total expenses • -7% • +4.2%
• Loan loss level
• Impaired loans
• 9 (16) bps • 12 (15) bps
• 186 (163) bps
• CET1 ratio
• Management buffer
• Dividend
• 19.5 (18.4) %
• 189 (101) bps
• EUR 0.68
Income
Costs
Credit quality
Capital &
dividend
Q4/17 vs. Q4/16* 2017 vs. 2016*
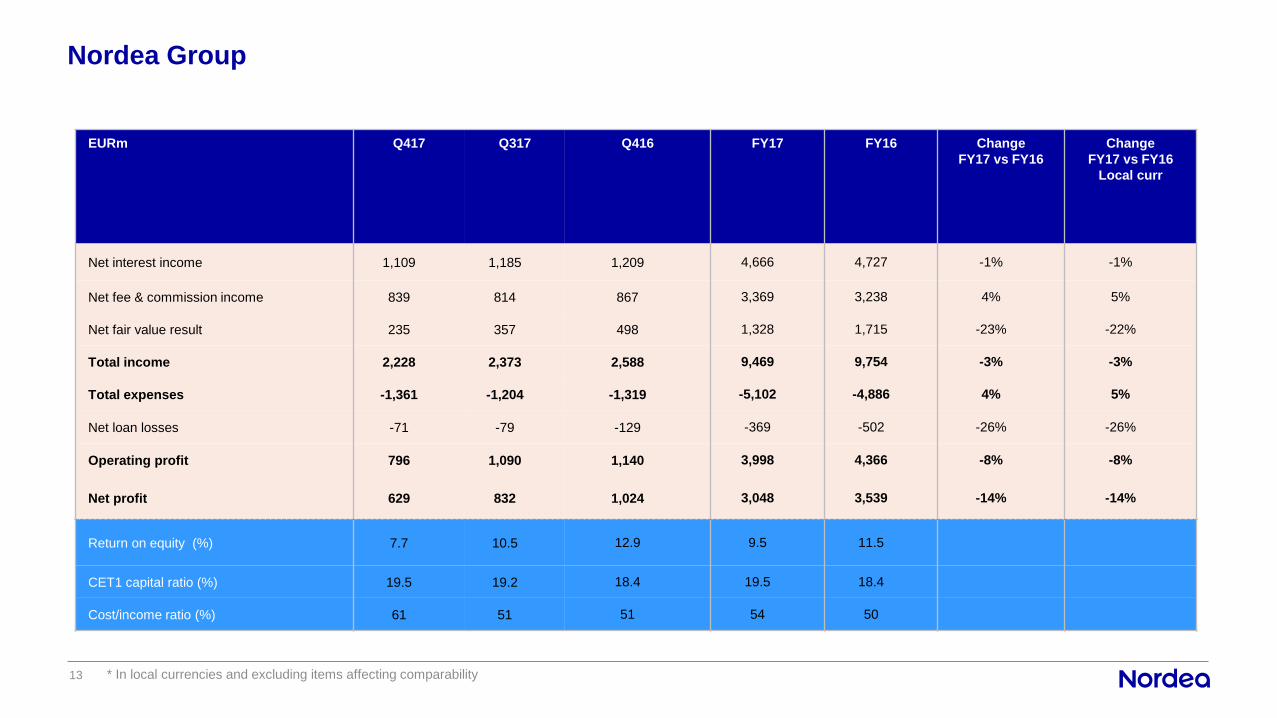
Nordea Group
EURm Q417 Q317 Q416 FY17 FY16 Change
FY17 vs FY16
Change
FY17 vs FY16
Local curr
Net interest income 1,109 1,185 1,209 4,666 4,727 -1% -1%
Net fee & commission income 839 814 867 3,369 3,238 4% 5%
Net fair value result 235 357 498 1,328 1,715 -23% -22%
Total income 2,228 2,373 2,588 9,469 9,754 -3% -3%
Total expenses -1,361 -1,204 -1,319 -5,102 -4,886 4% 5%
Net loan losses -71 -79 -129 -369 -502 -26% -26%
Operating profit 796 1,090 1,140 3,998 4,366 -8% -8%
Net profit 629 832 1,024 3,048 3,539 -14% -14%
Return on equity (%) 7.7 10.5 12.9 9.5 11.5
CET1 capital ratio (%) 19.5 19.2 18.4 19.5 18.4
Cost/income ratio (%) 61 51 51 54 50
13 * In local currencies and excluding items affecting comparability
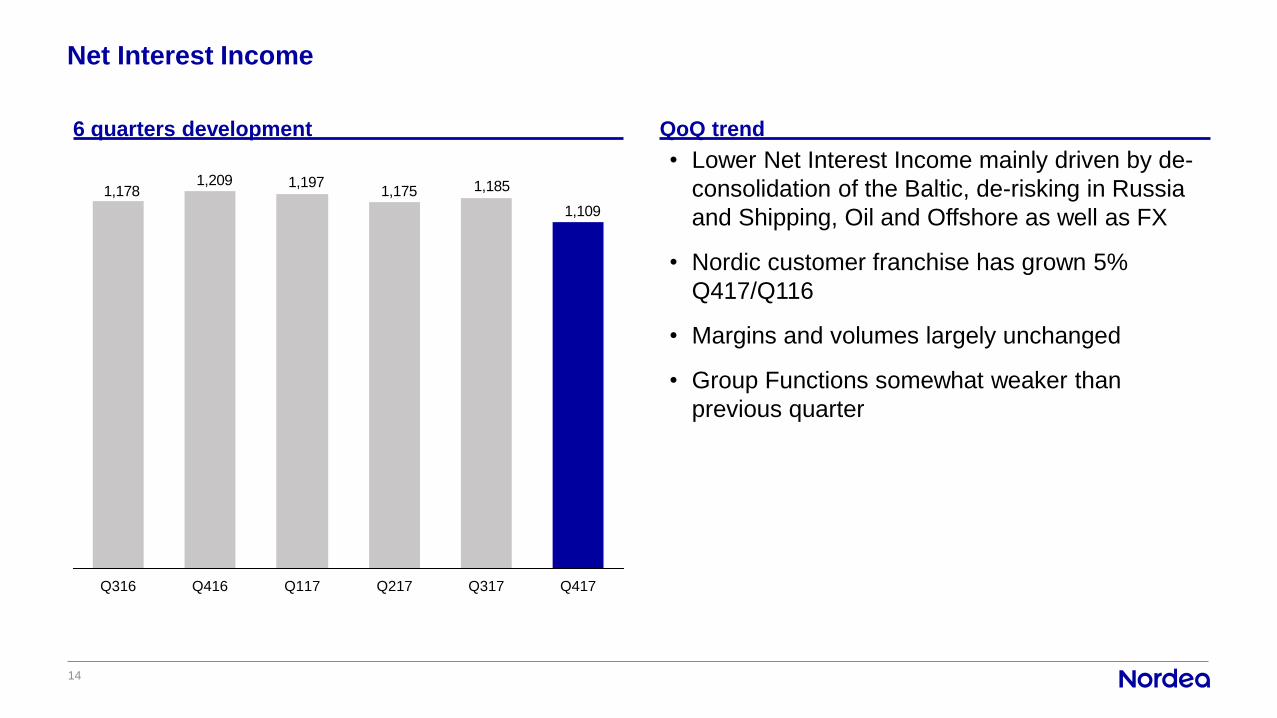
Net Interest Income
14
1,109
1,1851,1751,1971,209
1,178
Q417Q317Q217Q117Q416Q316
6 quarters development QoQ trend
• Lower Net Interest Income mainly driven by de-
consolidation of the Baltic, de-risking in Russia
and Shipping, Oil and Offshore as well as FX
• Nordic customer franchise has grown 5%
Q417/Q116
• Margins and volumes largely unchanged
• Group Functions somewhat weaker than
previous quarter
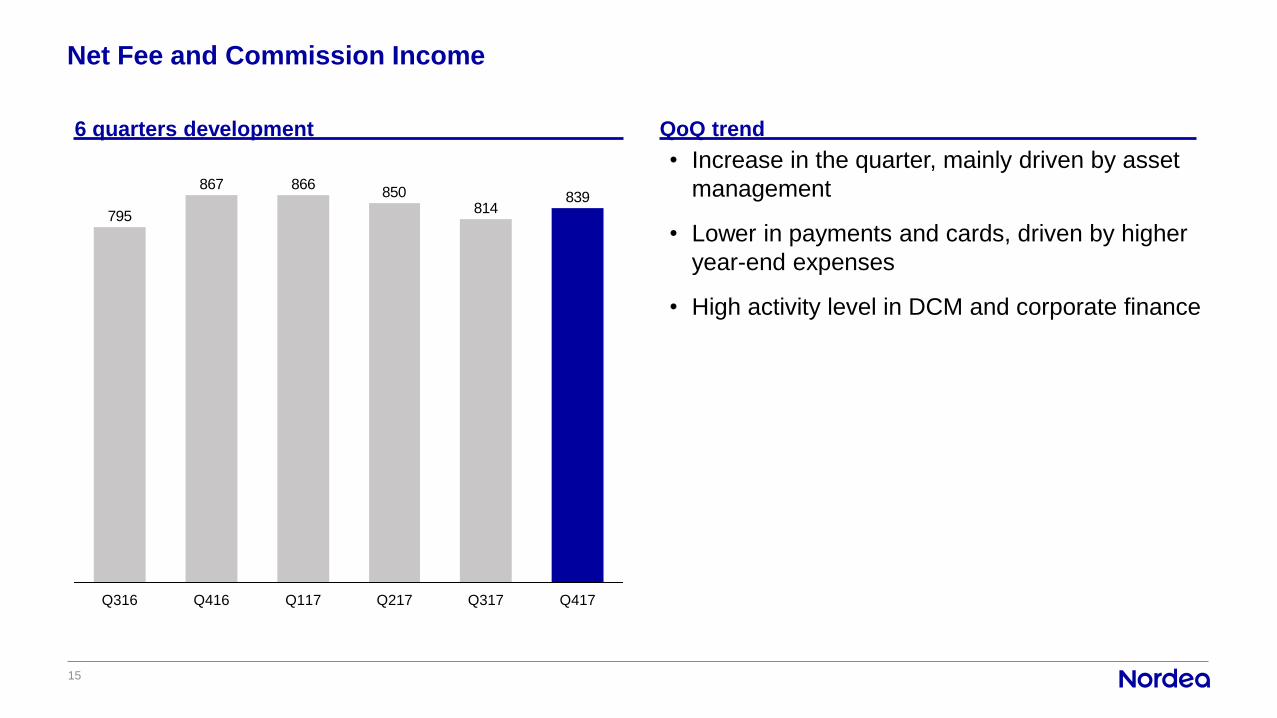
Net Fee and Commission Income
15
• Increase in the quarter, mainly driven by asset
management
• Lower in payments and cards, driven by higher
year-end expenses
• High activity level in DCM and corporate finance
6 quarters development QoQ trend
839814
850866867
795
Q417Q317Q217Q117Q416Q316
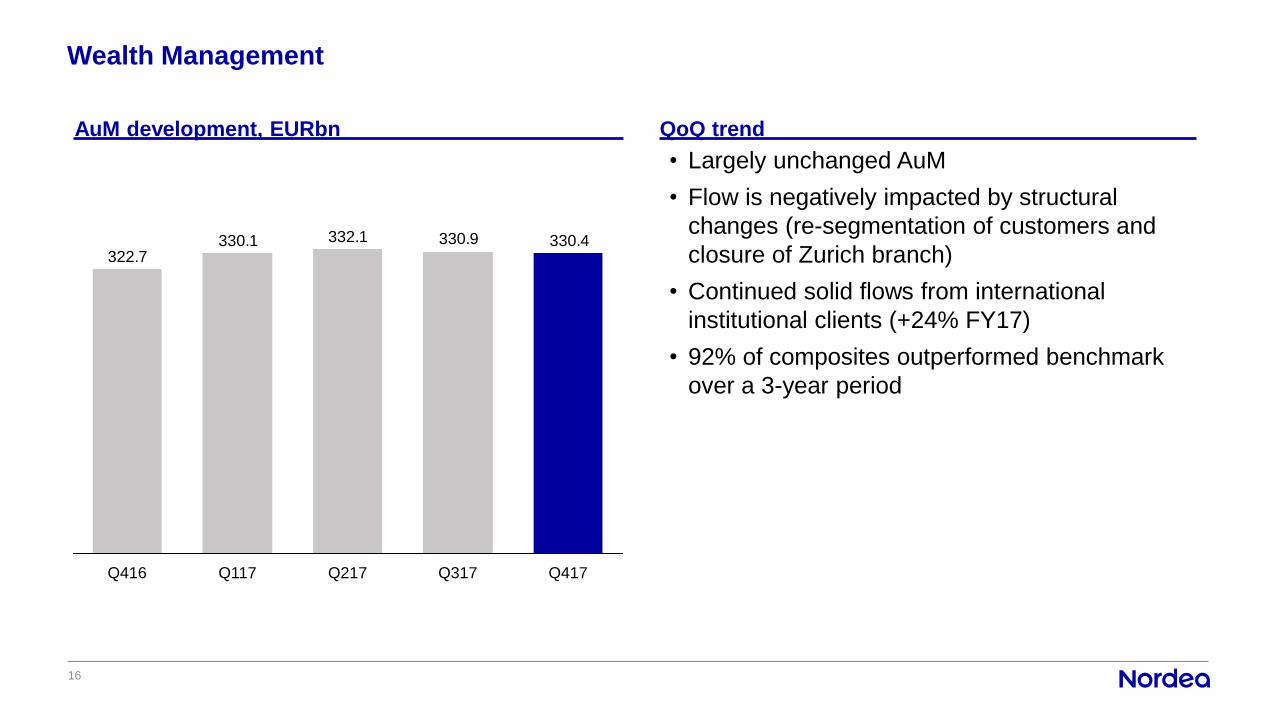
Wealth Management
16
330.4330.9332.1330.1322.7
Q417Q317Q217Q117Q416
• Largely unchanged AuM
• Flow is negatively impacted by structural
changes (re-segmentation of customers and
closure of Zurich branch)
• Continued solid flows from international
institutional clients (+24% FY17)
• 92% of composites outperformed benchmark
over a 3-year period
AuM development, EURbn QoQ trend
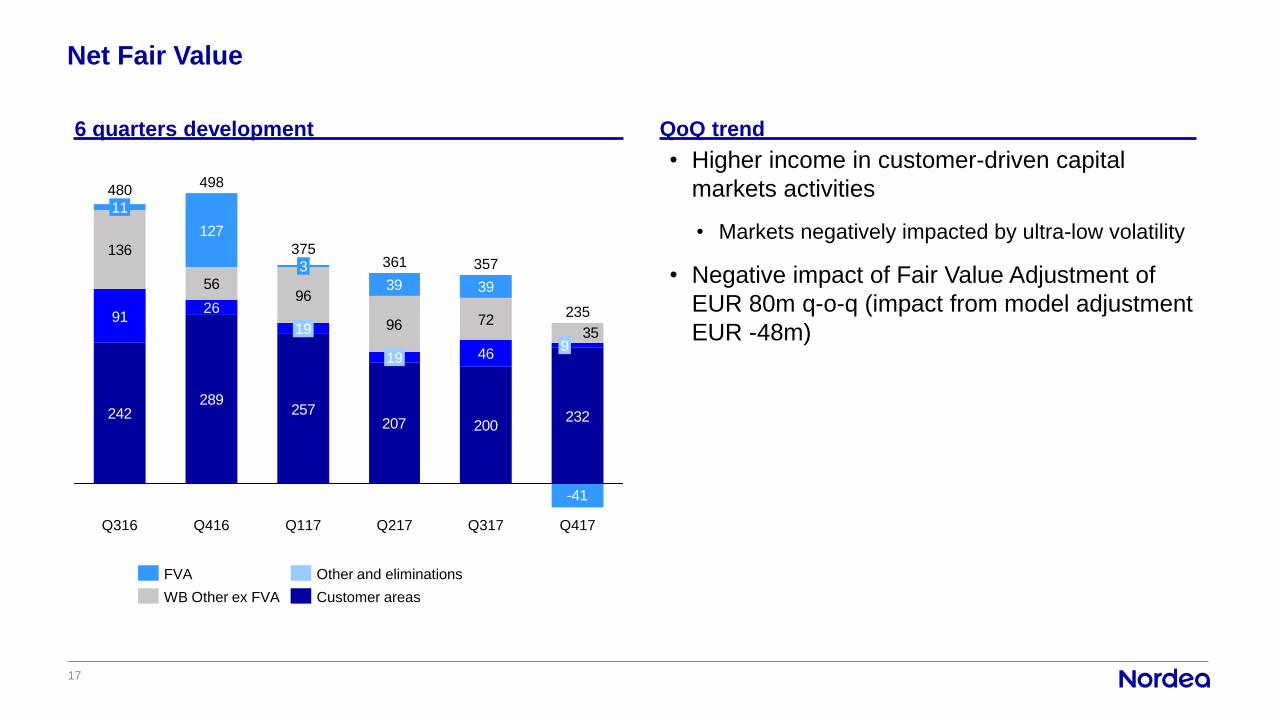
Net Fair Value
17
242289
257207 200
91
46
232
136
5696
96 72
127
39 39
-41
35
Q417Q317
357
Q217
361
19
Q117
375
19
3
Q416
498
26
Q316
480
11
9
235
Customer areas
Other and eliminations
WB Other ex FVA
FVA
• Higher income in customer-driven capital
markets activities
• Markets negatively impacted by ultra-low volatility
• Negative impact of Fair Value Adjustment of
EUR 80m q-o-q (impact from model adjustment
EUR -48m)
6 quarters development QoQ trend
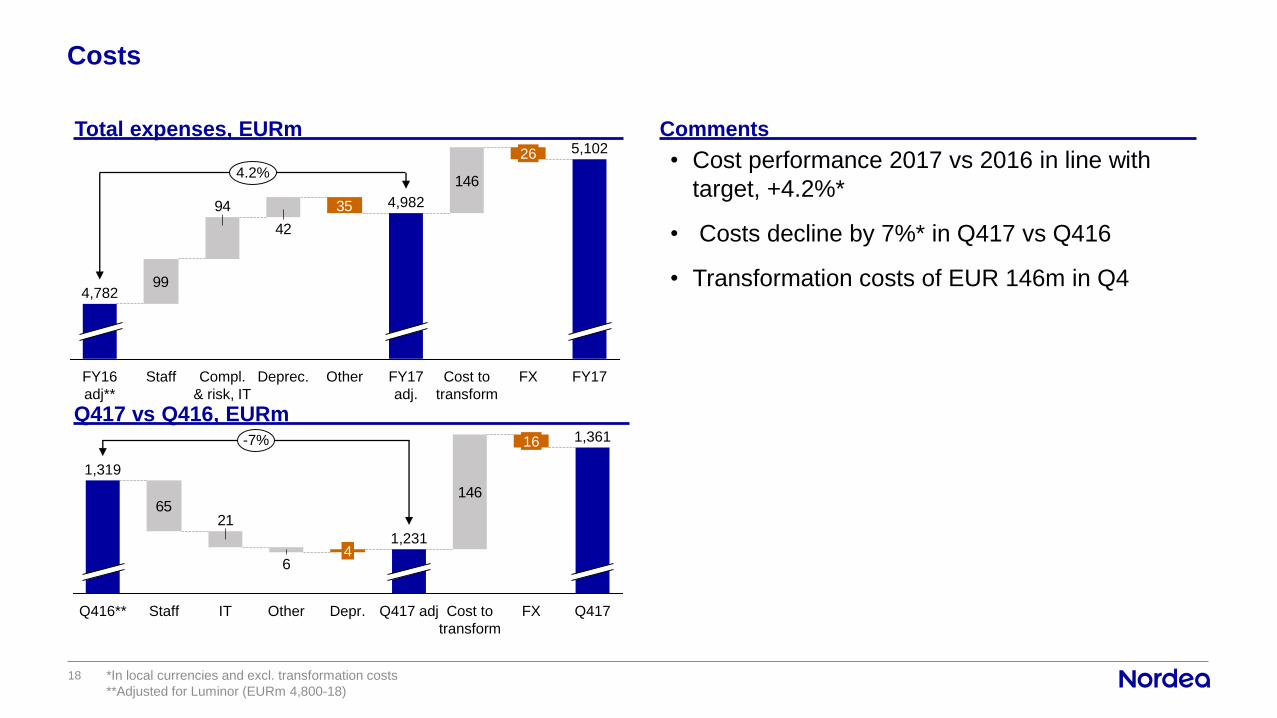
Costs
18
• Cost performance 2017 vs 2016 in line with
target, +4.2%*
• Costs decline by 7%* in Q417 vs Q416
• Transformation costs of EUR 146m in Q499
146
42
94 35
Compl.
& risk, IT
StaffFY16
adj**
4,782
Deprec.
4,982
FY17
adj.
Cost to
transform
Other
4.2%
26
FY17
5,102
FX
Total expenses, EURm Comments
*In local currencies and excl. transformation costs
**Adjusted for Luminor (EURm 4,800-18)
146
6
2165
Cost to
transform
1,361
Q417 adj FX
-7%
Q417Staff ITQ416** Other
4
1,319
Depr.
1,231
16
Q417 vs Q416, EURm
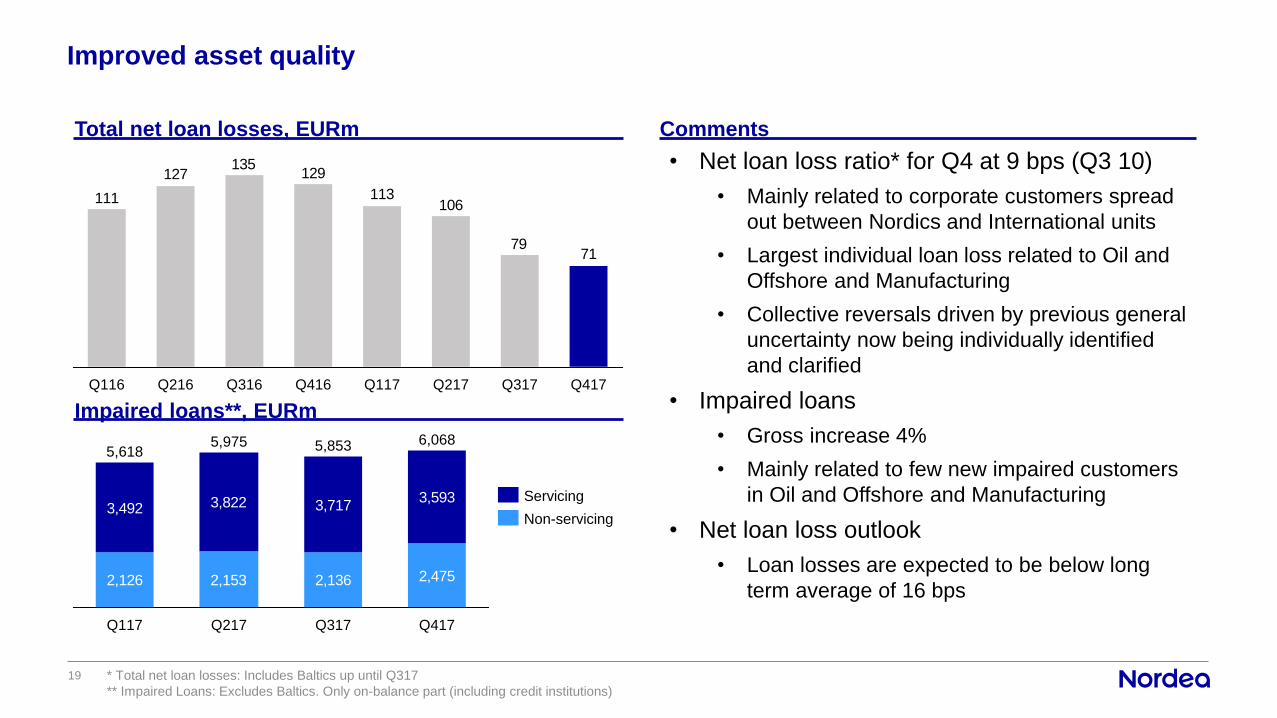
Improved asset quality
19
• Net loan loss ratio* for Q4 at 9 bps (Q3 10)
• Mainly related to corporate customers spread
out between Nordics and International units
• Largest individual loan loss related to Oil and
Offshore and Manufacturing
• Collective reversals driven by previous general
uncertainty now being individually identified
and clarified
• Impaired loans
• Gross increase 4%
• Mainly related to few new impaired customers
in Oil and Offshore and Manufacturing
• Net loan loss outlook
• Loan losses are expected to be below long
term average of 16 bps
* Total net loan losses: Includes Baltics up until Q317
** Impaired Loans: Excludes Baltics. Only on-balance part (including credit institutions)
Total net loan losses, EURm Comments
Impaired loans**, EURm
7179
106113
129135
111
127
Q417Q116 Q216 Q416 Q317Q117 Q217Q316
2,126 2,153 2,136 2,475
3,492 3,822 3,7173,593
Q217
5,975
Q117
5,618 5,853 6,068
Q417Q317
Non-servicing
Servicing
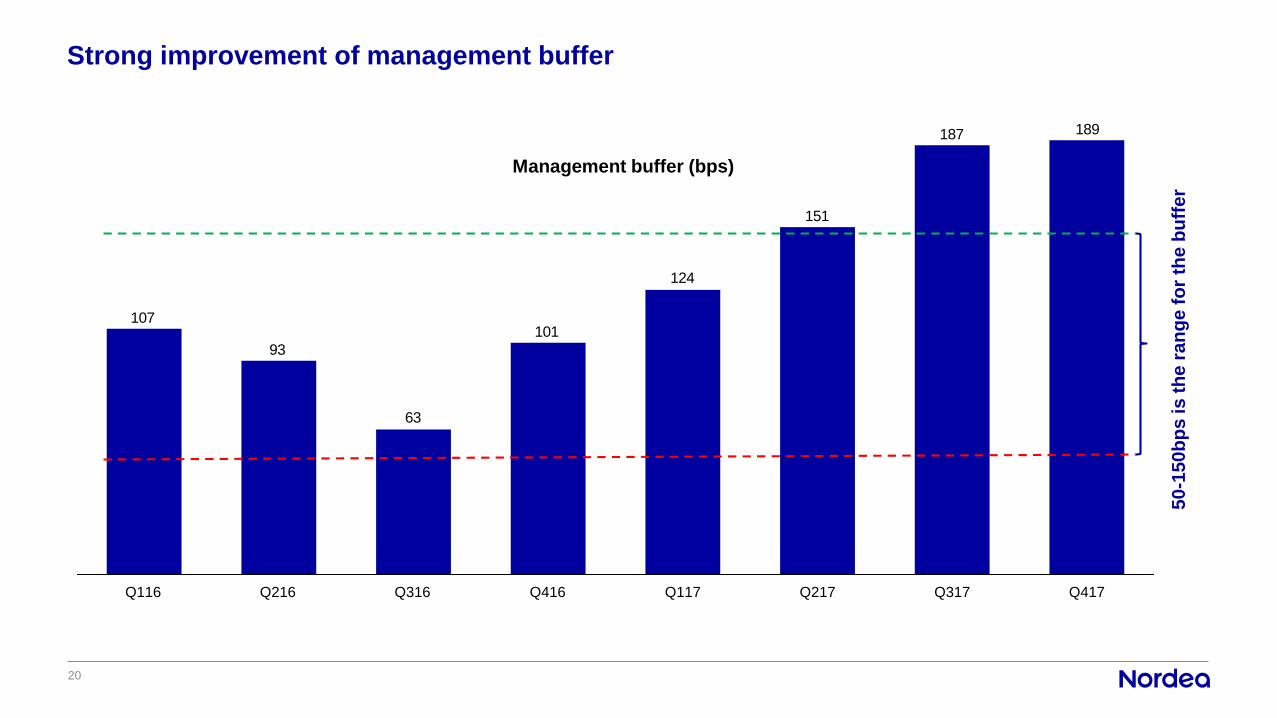
Strong improvement of management buffer
20
189187
151
124
101
63
93
107
Q416Q216 Q217 Q417Q317Q316Q116 Q117
Management buffer (bps)
50-1
50
bp
s is
th
e r
an
ge
fo
r th
e b
uff
er
3. Group transformation
21
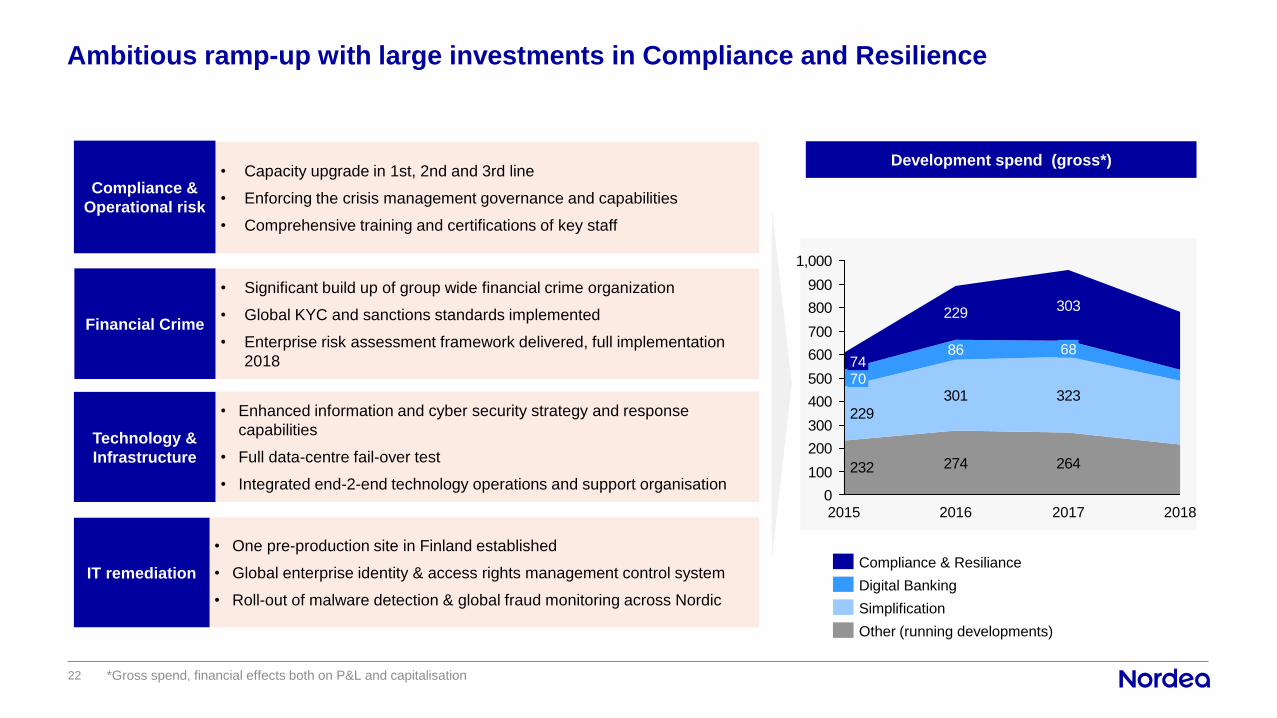
Ambitious ramp-up with large investments in Compliance and Resilience
22
22
Development spend (gross*)• Capacity upgrade in 1st, 2nd and 3rd line
• Enforcing the crisis management governance and capabilities
• Comprehensive training and certifications of key staff
Compliance &
Operational risk
• Significant build up of group wide financial crime organization
• Global KYC and sanctions standards implemented
• Enterprise risk assessment framework delivered, full implementation
2018
Financial Crime
• Enhanced information and cyber security strategy and response
capabilities
• Full data-centre fail-over test
• Integrated end-2-end technology operations and support organisation
Technology &
Infrastructure
• One pre-production site in Finland established
• Global enterprise identity & access rights management control system
• Roll-out of malware detection & global fraud monitoring across Nordic
IT remediation
274
323
264232
301
229
86
303229
0
100
200
300
400
500
600
700
800
900
1,000
7074
20182017
68
20162015
Other (running developments)
Simplification
Digital Banking
Compliance & Resiliance
*Gross spend, financial effects both on P&L and capitalisation
23
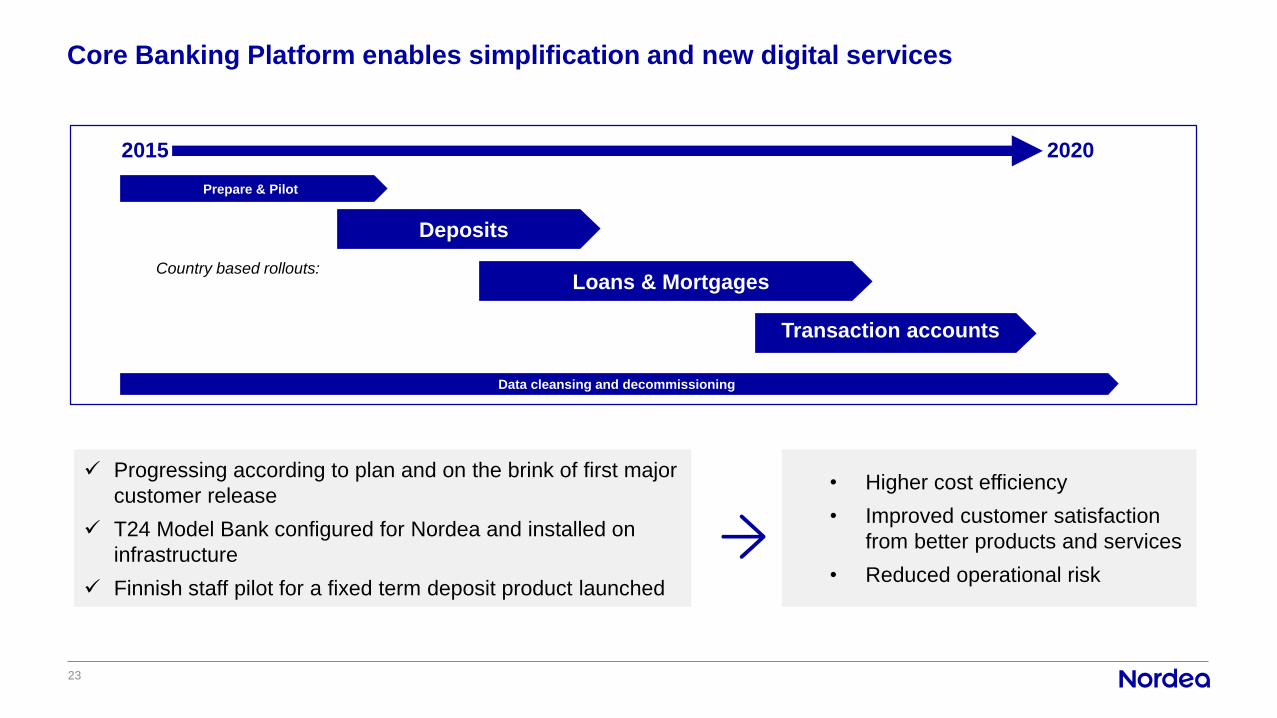
Core Banking Platform enables simplification and new digital services
2015 2020
Prepare & Pilot
Data cleansing and decommissioning
Loans & Mortgages
Deposits
Country based rollouts:
Transaction accounts
✓ Progressing according to plan and on the brink of first major
customer release
✓ T24 Model Bank configured for Nordea and installed on
infrastructure
✓ Finnish staff pilot for a fixed term deposit product launched
• Higher cost efficiency
• Improved customer satisfaction
from better products and services
• Reduced operational risk
Increased roll-out frequency and improved products to our customers
.
Nordea Ventures
Nordic bank
collaborationChat, chatbots, face-to-
face online meetings
Wallets
Mobile FX trading for
corporate segment
New mobile bank (beta)
Open banking –
platform for financial
services
Nordea Investor – new
savings platform
24
4. Capital
25
Common Equity Tier 1 ratio development Q417 vs Q317
26
19.50.20.30.20.019.2
Q317 Credit qualityFX effect Q417OtherVolumes
incl.
derivatives
Quarterly development Comments
• CET1 ratio continued to strengthen to 19.5% in Q4
• REA inflation of EUR 1.5bn due to Finnish
mortgage floors (Article III buffer)
• Tier 1 ratio increased to 22.3% (21.4% in Q3)
• Nordea issued a EUR 750m Additional Tier 1
instrument at 3.5%, the lowest coupon ever
• Global Capital awarded Nordea “Additional Tier
One Capital Deal of the Year”
Nordea estimated CET1 and own funds requirement Q4 2017*
27 * The Swedish FSA is expected to disclose the actual capital requirement for Q4 2017 on Feb 23rd
Pill
ar
2P
illa
r 1
MDA
Restrictions
189 bps
5. Macro
28
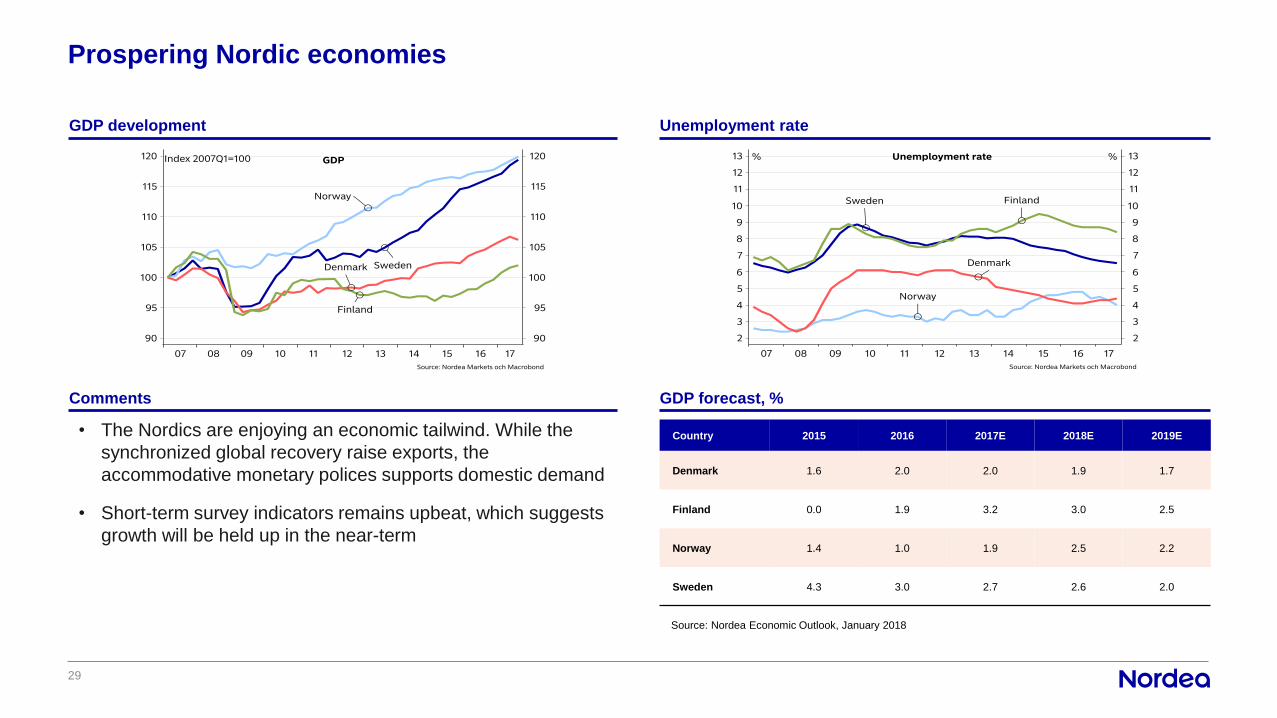
Prospering Nordic economies
29
Source: Nordea Economic Outlook, January 2018
• The Nordics are enjoying an economic tailwind. While the
synchronized global recovery raise exports, the
accommodative monetary polices supports domestic demand
• Short-term survey indicators remains upbeat, which suggests
growth will be held up in the near-term
Country 2015 2016 2017E 2018E 2019E
Denmark 1.6 2.0 2.0 1.9 1.7
Finland 0.0 1.9 3.2 3.0 2.5
Norway 1.4 1.0 1.9 2.5 2.2
Sweden 4.3 3.0 2.7 2.6 2.0
GDP development Unemployment rate
Comments GDP forecast, %
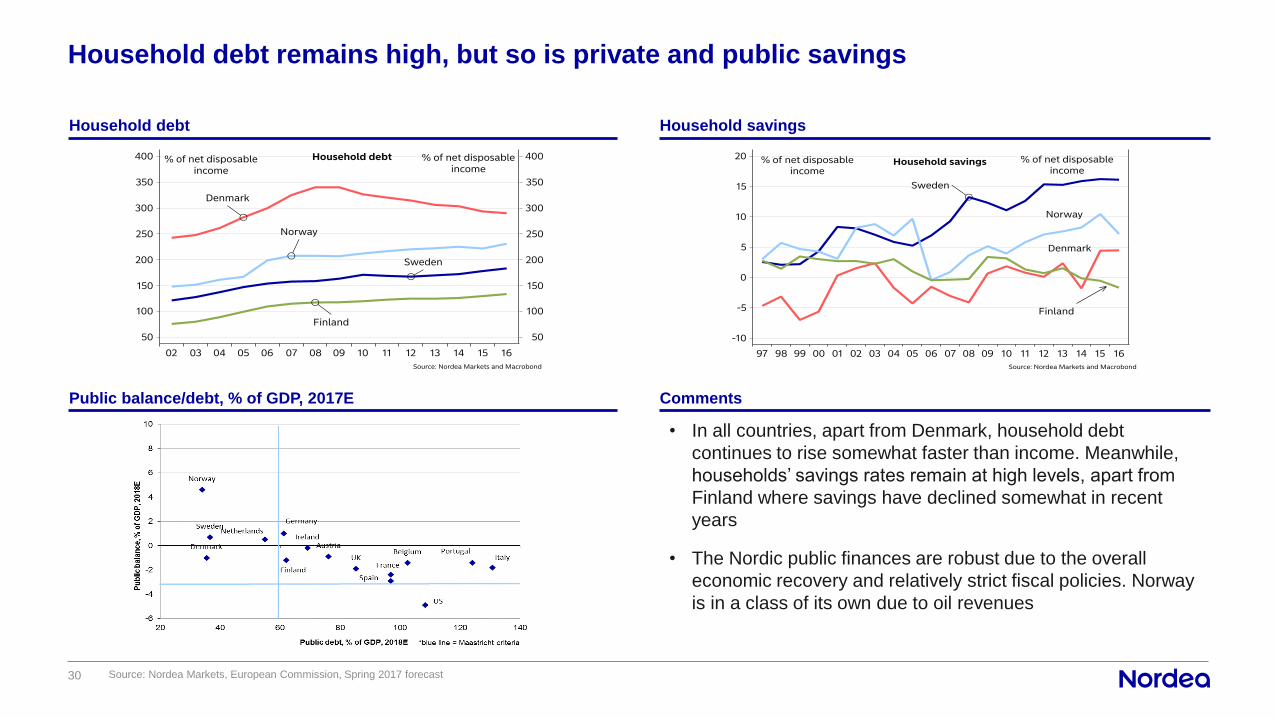
Household debt remains high, but so is private and public savings
30 Source: Nordea Markets, European Commission, Spring 2017 forecast
• In all countries, apart from Denmark, household debt
continues to rise somewhat faster than income. Meanwhile,
households’ savings rates remain at high levels, apart from
Finland where savings have declined somewhat in recent
years
• The Nordic public finances are robust due to the overall
economic recovery and relatively strict fiscal policies. Norway
is in a class of its own due to oil revenues
Household debt Household savings
Public balance/debt, % of GDP, 2017E Comments
House price development in the Nordics
31
• Recent months have shown some weaknesses in the Swedish and Norwegian housing markets, while prices continue to rise in
Denmark and Finland
• In Sweden house prices declined in H2 2017, most pronounced in Stockholm where prices have fallen by 10% since the peak in the
spring of 2017. The price correction is probably caused by the marked rise in buildings seen in recent years. Going forward, we expect
largely stagnant prices as mortgage rates, the most important determinant for prices, are expected to stay low
• In Norway, primarily in Oslo, house prices have been on a downward trend since the spring of 2017. The development is primarily
driven by stricter lending requirements introduced January 1st 2017. We expect prices on national level to stabilise, although prices in
Oslo may decline somewhat further
House prices Household’s credit growth
Comments

6. Funding
32
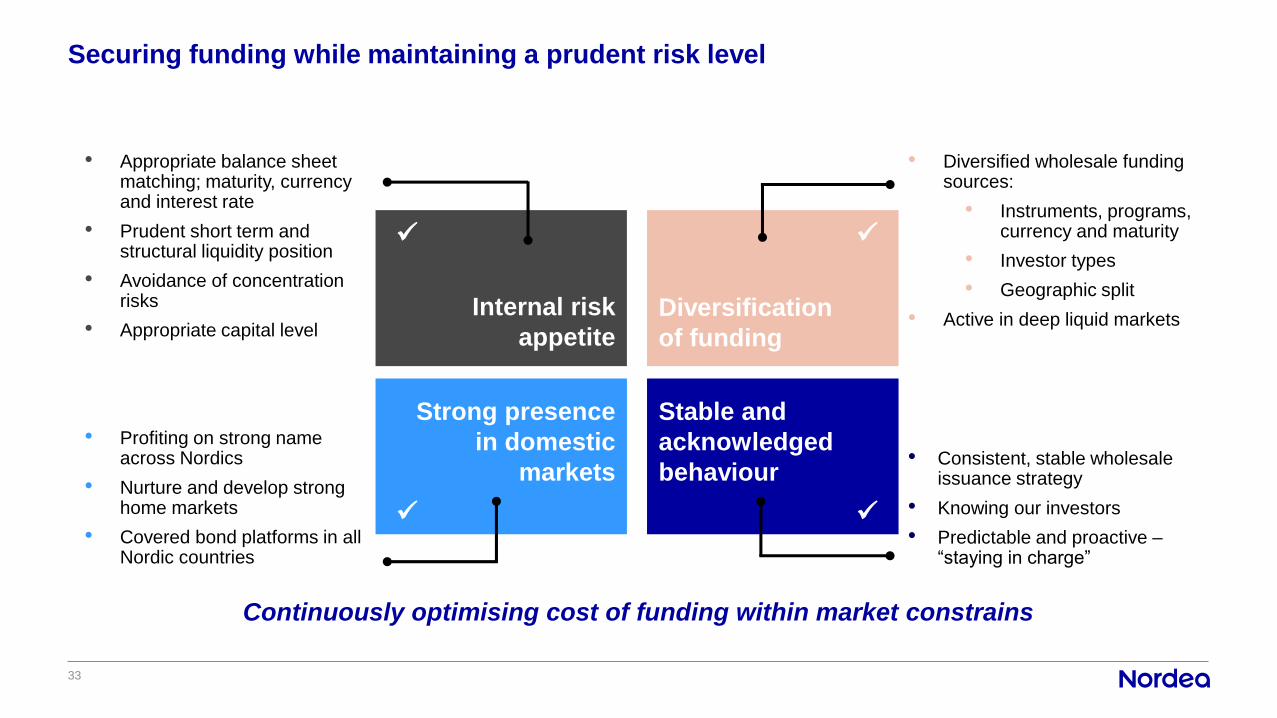
Securing funding while maintaining a prudent risk level
33
Internal risk
appetite
• Appropriate balance sheet matching; maturity, currency and interest rate
• Prudent short term and structural liquidity position
• Avoidance of concentration risks
• Appropriate capital level
Strong presence
in domestic
markets
• Profiting on strong name across Nordics
• Nurture and develop strong home markets
• Covered bond platforms in all Nordic countries
Diversification
of funding
• Diversified wholesale funding sources:
• Instruments, programs, currency and maturity
• Investor types
• Geographic split
• Active in deep liquid markets
Stable and
acknowledged
behaviour• Consistent, stable wholesale
issuance strategy
• Knowing our investors
• Predictable and proactive –“staying in charge”
✓✓
✓✓
Continuously optimising cost of funding within market constrains
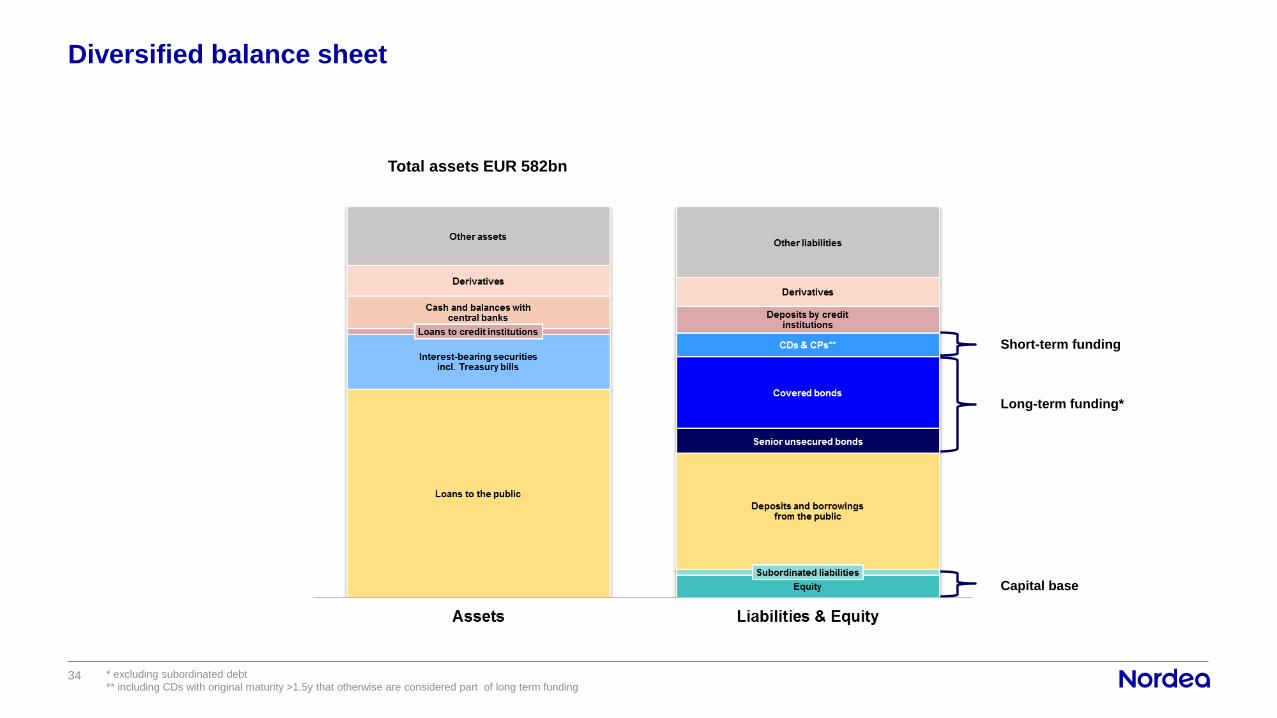
Diversified balance sheet
34
Short-term funding
Long-term funding*
Capital base
* excluding subordinated debt
** including CDs with original maturity >1.5y that otherwise are considered part of long term funding
Total assets EUR 582bn
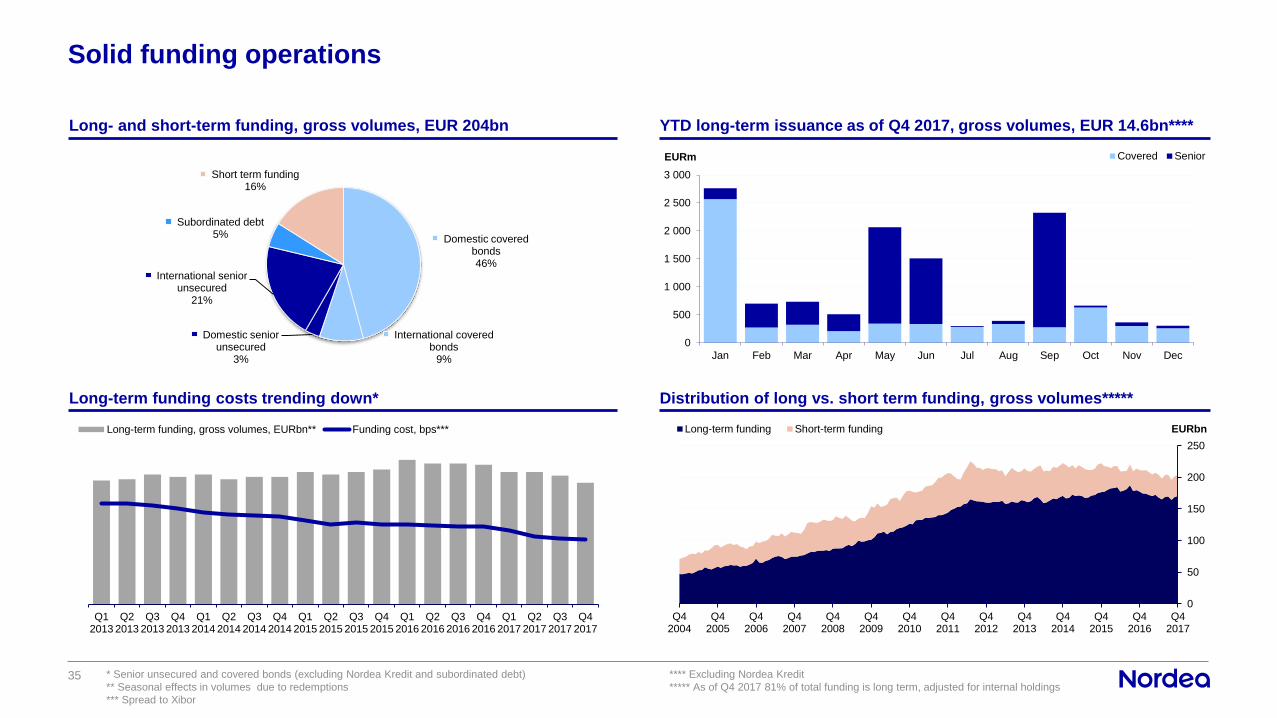
Solid funding operations
35 * Senior unsecured and covered bonds (excluding Nordea Kredit and subordinated debt)
** Seasonal effects in volumes due to redemptions
*** Spread to Xibor
Q12013
Q22013
Q32013
Q42013
Q12014
Q22014
Q32014
Q42014
Q12015
Q22015
Q32015
Q42015
Q12016
Q22016
Q32016
Q42016
Q12017
Q22017
Q32017
Q42017
Long-term funding, gross volumes, EURbn** Funding cost, bps***
Domestic covered bonds46%
International covered bonds
9%
Domestic senior unsecured
3%
International senior unsecured
21%
Subordinated debt5%
Short term funding16%
Q42004
Q42005
Q42006
Q42007
Q42008
Q42009
Q42010
Q42011
Q42012
Q42013
Q42014
Q42015
Q42016
Q42017
0
50
100
150
200
250
EURbnLong-term funding Short-term funding
Long- and short-term funding, gross volumes, EUR 204bn YTD long-term issuance as of Q4 2017, gross volumes, EUR 14.6bn****
Long-term funding costs trending down* Distribution of long vs. short term funding, gross volumes*****
**** Excluding Nordea Kredit
***** As of Q4 2017 81% of total funding is long term, adjusted for internal holdings
0
500
1 000
1 500
2 000
2 500
3 000
Jan Feb Mar Apr May Jun Jul Aug Sep Oct Nov Dec
EURm Covered Senior
Short-term funding – prudent and active management
36
• Nordea maintains its good reputation amongst investors
• A well diversified investor base is tapped from Asia to USA
• Each program has its niche contribution
• Nordea has been able to maintain the volume and duration of
its short dated programs both in the US and the European
market
• Total outstanding short-term funding has ranged between
EUR 30-35bn during 2017
• Short dated issuance remains an attractive funding
component for the group at the current levels
Comments Short-term issuance
Split between programs
Q42004
Q42005
Q42006
Q42007
Q42008
Q42009
Q42010
Q42011
Q42012
Q42013
Q42014
Q42015
Q42016
Q42017
0
10 000
20 000
30 000
40 000
50 000
60 000
70 000
EURm
0
2
4
6
8
10
12
14
ECP US CP London CD NY CD French CP
EURbn
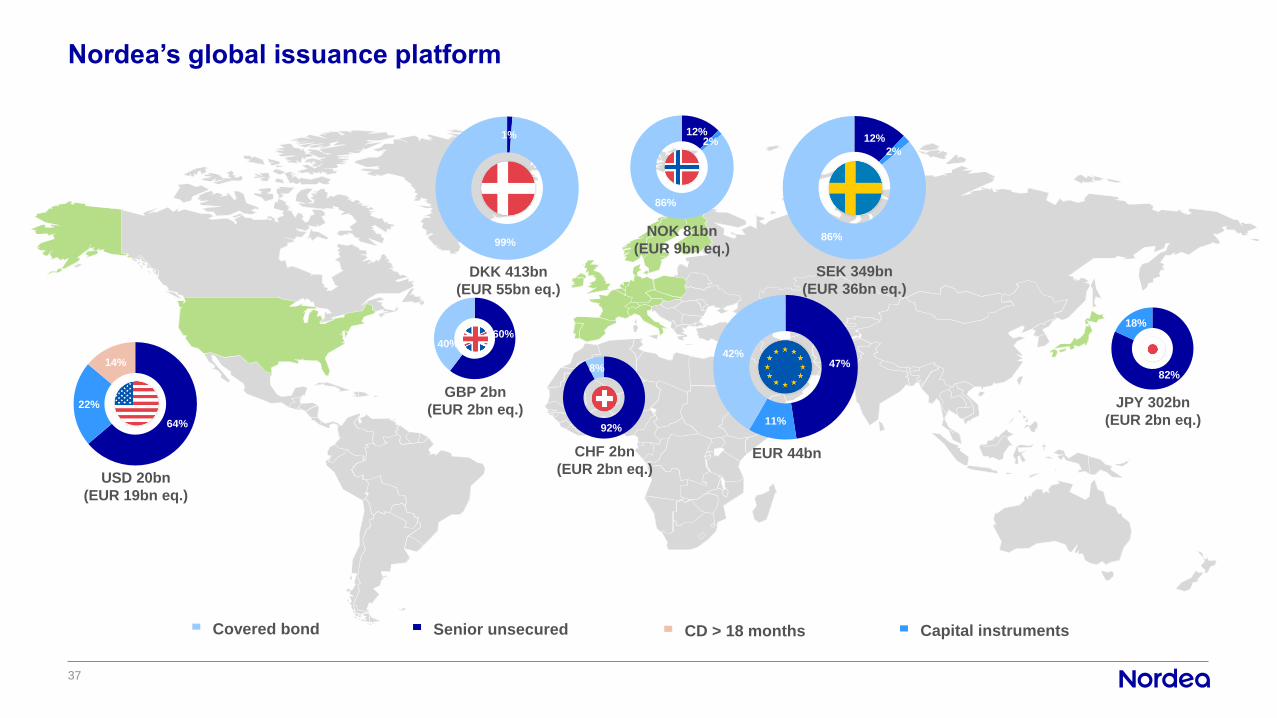
Nordea’s global issuance platform
37
82%
18%
64%
22%
14%
12%
2%
86%
1%
99%
12%2%
86%
47%
11%
42%
60%40%
USD 20bn
(EUR 19bn eq.)
Covered bond Senior unsecured CD > 18 months Capital instruments
DKK 413bn
(EUR 55bn eq.)
CHF 2bn
(EUR 2bn eq.)EUR 44bn
JPY 302bn
(EUR 2bn eq.)
NOK 81bn
(EUR 9bn eq.)
SEK 349bn
(EUR 36bn eq.)
GBP 2bn
(EUR 2bn eq.)92%
8%
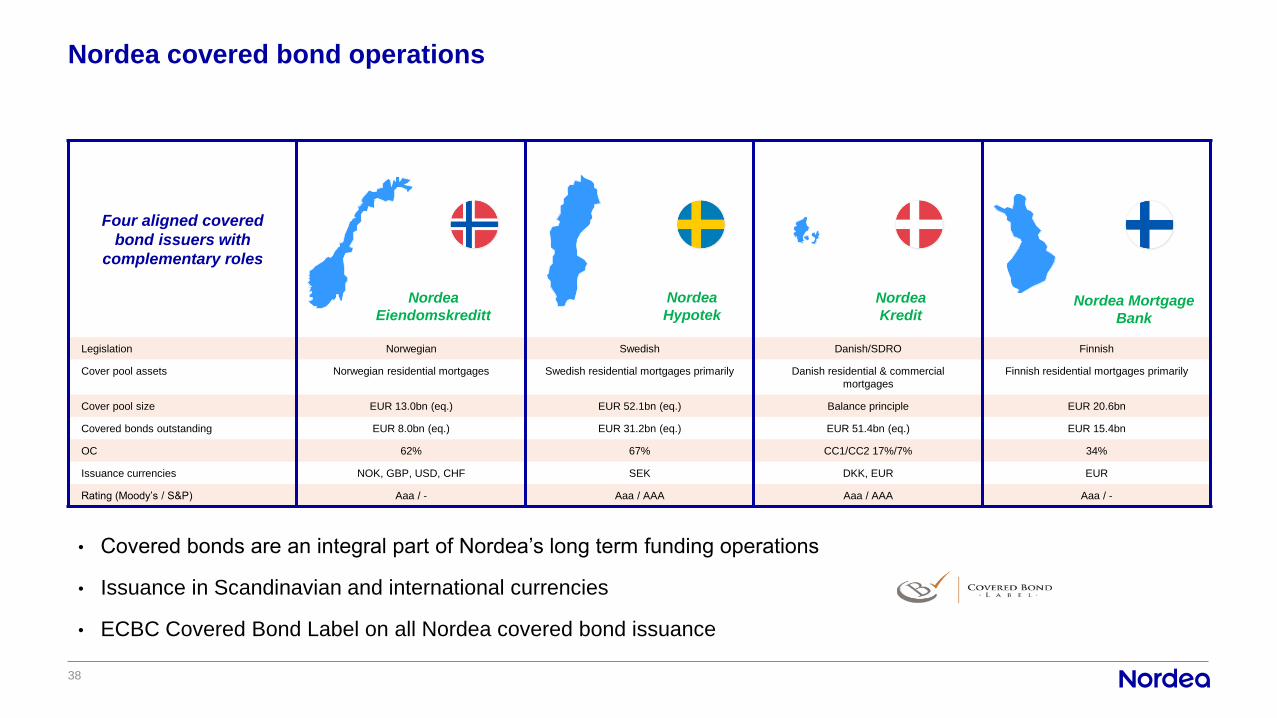
Nordea covered bond operations
38
• Covered bonds are an integral part of Nordea’s long term funding operations
• Issuance in Scandinavian and international currencies
• ECBC Covered Bond Label on all Nordea covered bond issuance
Four aligned covered
bond issuers with
complementary roles
Legislation Norwegian Swedish Danish/SDRO Finnish
Cover pool assets Norwegian residential mortgages Swedish residential mortgages primarily Danish residential & commercial
mortgages
Finnish residential mortgages primarily
Cover pool size EUR 13.0bn (eq.) EUR 52.1bn (eq.) Balance principle EUR 20.6bn
Covered bonds outstanding EUR 8.0bn (eq.) EUR 31.2bn (eq.) EUR 51.4bn (eq.) EUR 15.4bn
OC 62% 67% CC1/CC2 17%/7% 34%
Issuance currencies NOK, GBP, USD, CHF SEK DKK, EUR EUR
Rating (Moody’s / S&P) Aaa / - Aaa / AAA Aaa / AAA Aaa / -
Nordea Mortgage
Bank
Nordea
Kredit
Nordea
Hypotek
Nordea
Eiendomskreditt
Nordea benchmark transactions 2017
39
Issuer Type CurrencyAmount
(m)
Issue
date
Maturity
dateFRN / Fixed
Nordea Mortgage Bank Covered EUR 1 500 24 Jan 2017 24 Jan 2022 Fixed
Nordea Bank AB Senior USD1 000
750
31 May 2017
31 May 2017
29 May 2020
29 May 2020
Fixed
FRN
Nordea Bank AB Senior SEK3 250
750
16 Jun 2017
16 Jun 2017
16 Jun 2020
16 Jun 2020
Fixed
FRN
Nordea Bank AB Senior* EUR 500 30 Jun 2017 30 Jun 2022 Fixed
Nordea Bank AB SeniorEUR
EUR
1 000
1 000
27 Sep 2017
27 Sep 2017
27 Sep 2027
27 Sep 2021
Fixed
FRN
Nordea Hypotek AB Covered** SEK 5000 18 Oct 2017 20 Sep 2023 Fixed
Nordea Bank AB AT1 EUR 750 28 Nov 2017 12 Mar 2025 Fixed
* Green bond
** Tap issuance
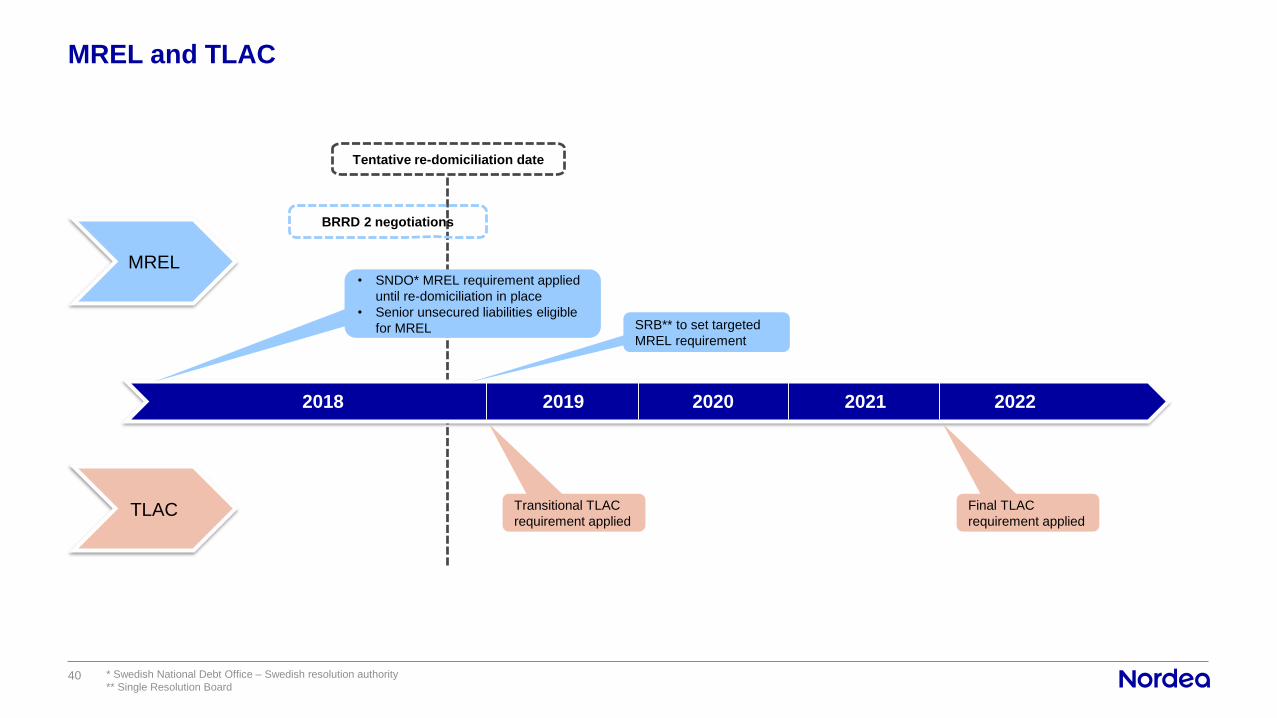
MREL and TLAC
40
Transitional TLAC
requirement applied
SRB** to set targeted
MREL requirement
2018 2019 2022
* Swedish National Debt Office – Swedish resolution authority
** Single Resolution Board
MREL
TLAC
• SNDO* MREL requirement applied
until re-domiciliation in place
• Senior unsecured liabilities eligible
for MREL
Tentative re-domiciliation date
2020 2021
Final TLAC
requirement applied
BRRD 2 negotiations
MREL
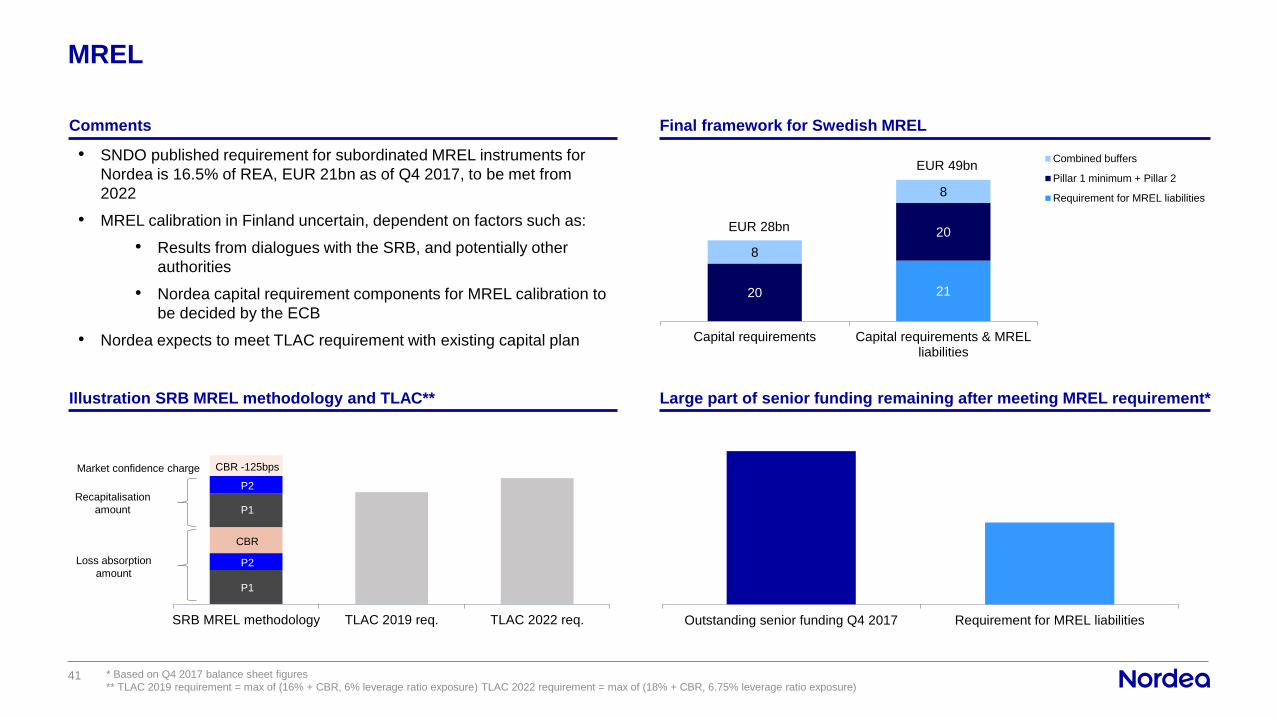
41
Comments Final framework for Swedish MREL
Illustration SRB MREL methodology and TLAC** Large part of senior funding remaining after meeting MREL requirement*
* Based on Q4 2017 balance sheet figures
** TLAC 2019 requirement = max of (16% + CBR, 6% leverage ratio exposure) TLAC 2022 requirement = max of (18% + CBR, 6.75% leverage ratio exposure)
SRB MREL methodology TLAC 2019 req. TLAC 2022 req.
• SNDO published requirement for subordinated MREL instruments for
Nordea is 16.5% of REA, EUR 21bn as of Q4 2017, to be met from
2022
• MREL calibration in Finland uncertain, dependent on factors such as:
• Results from dialogues with the SRB, and potentially other
authorities
• Nordea capital requirement components for MREL calibration to
be decided by the ECB
• Nordea expects to meet TLAC requirement with existing capital plan
P1
P1
P2
P2
CBR
CBR -125bps
Outstanding senior funding Q4 2017 Requirement for MREL liabilities
2120
20
8
8
Capital requirements Capital requirements & MRELliabilities
Combined buffers
Pillar 1 minimum + Pillar 2
Requirement for MREL liabilities
EUR 49bn
EUR 28bn
Loss absorption
amount
Recapitalisation
amount
Market confidence charge
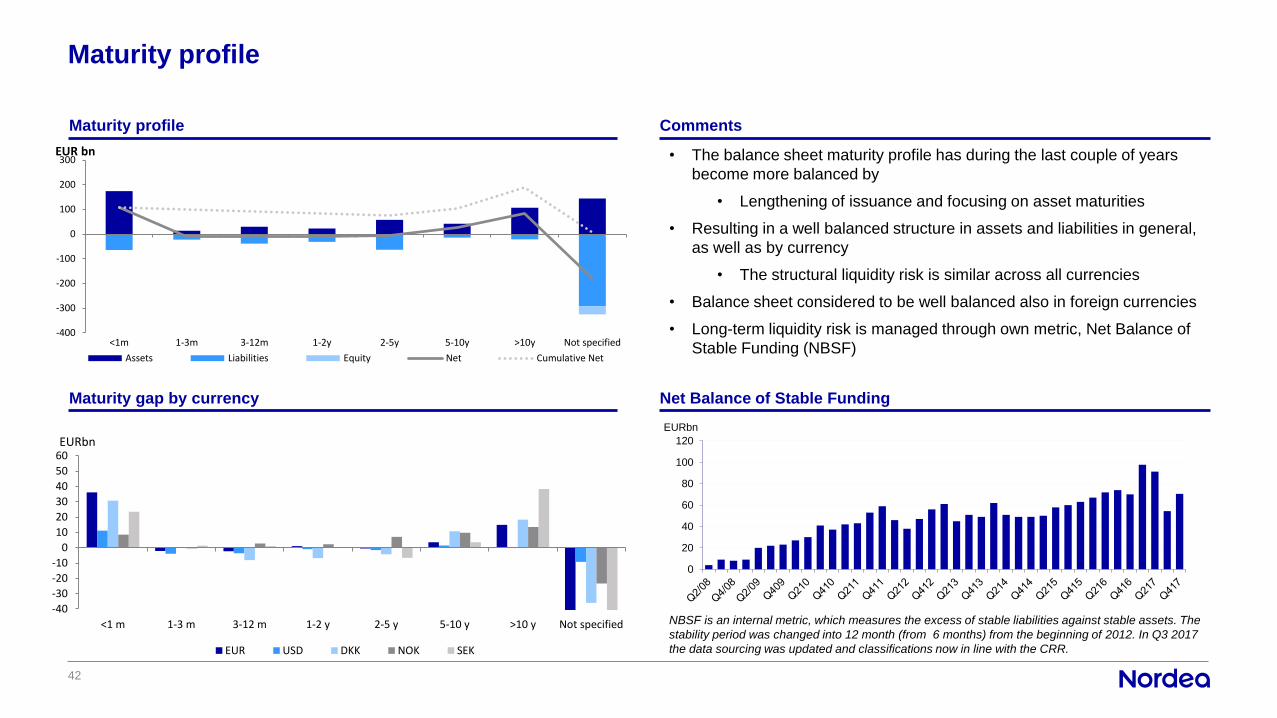
Maturity profile
42
• The balance sheet maturity profile has during the last couple of years
become more balanced by
• Lengthening of issuance and focusing on asset maturities
• Resulting in a well balanced structure in assets and liabilities in general,
as well as by currency
• The structural liquidity risk is similar across all currencies
• Balance sheet considered to be well balanced also in foreign currencies
• Long-term liquidity risk is managed through own metric, Net Balance of
Stable Funding (NBSF)
NBSF is an internal metric, which measures the excess of stable liabilities against stable assets. The
stability period was changed into 12 month (from 6 months) from the beginning of 2012. In Q3 2017
the data sourcing was updated and classifications now in line with the CRR.
0
20
40
60
80
100
120
EURbn
Maturity profile Comments
Maturity gap by currency Net Balance of Stable Funding
-40
-30
-20
-10
0
10
20
30
40
50
60
<1 m 1-3 m 3-12 m 1-2 y 2-5 y 5-10 y >10 y Not specified
EUR USD DKK NOK SEK
EURbn
-400
-300
-200
-100
0
100
200
300
<1m 1-3m 3-12m 1-2y 2-5y 5-10y >10y Not specified
EUR bn
Assets Liabilities Equity Net Cumulative Net
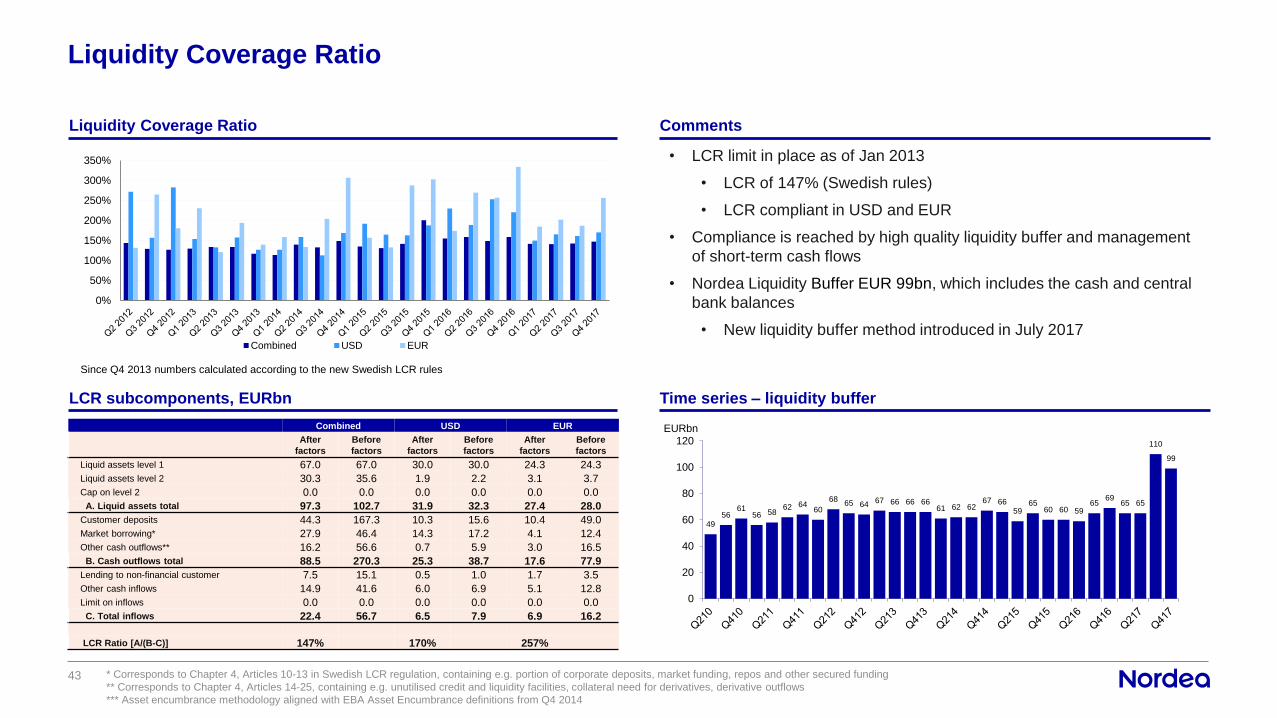
Liquidity Coverage Ratio
43
0%
50%
100%
150%
200%
250%
300%
350%
Combined USD EUR
Since Q4 2013 numbers calculated according to the new Swedish LCR rules
• LCR limit in place as of Jan 2013
• LCR of 147% (Swedish rules)
• LCR compliant in USD and EUR
• Compliance is reached by high quality liquidity buffer and management
of short-term cash flows
• Nordea Liquidity Buffer EUR 99bn, which includes the cash and central
bank balances
• New liquidity buffer method introduced in July 2017
4956
6156 58
62 6460
6865 64
67 66 66 6661 62 62
67 6659
6560 60 59
6569
65 65
110
99
0
20
40
60
80
100
120EURbnCombined USD EUR
After
factors
Before
factors
After
factors
Before
factors
After
factors
Before
factors
Liquid assets level 1 67.0 67.0 30.0 30.0 24.3 24.3
Liquid assets level 2 30.3 35.6 1.9 2.2 3.1 3.7
Cap on level 2 0.0 0.0 0.0 0.0 0.0 0.0
A. Liquid assets total 97.3 102.7 31.9 32.3 27.4 28.0
Customer deposits 44.3 167.3 10.3 15.6 10.4 49.0
Market borrowing* 27.9 46.4 14.3 17.2 4.1 12.4
Other cash outflows** 16.2 56.6 0.7 5.9 3.0 16.5
B. Cash outflows total 88.5 270.3 25.3 38.7 17.6 77.9
Lending to non-financial customer 7.5 15.1 0.5 1.0 1.7 3.5
Other cash inflows 14.9 41.6 6.0 6.9 5.1 12.8
Limit on inflows 0.0 0.0 0.0 0.0 0.0 0.0
C. Total inflows 22.4 56.7 6.5 7.9 6.9 16.2
LCR Ratio [A/(B-C)] 147% 170% 257%
* Corresponds to Chapter 4, Articles 10-13 in Swedish LCR regulation, containing e.g. portion of corporate deposits, market funding, repos and other secured funding
** Corresponds to Chapter 4, Articles 14-25, containing e.g. unutilised credit and liquidity facilities, collateral need for derivatives, derivative outflows
*** Asset encumbrance methodology aligned with EBA Asset Encumbrance definitions from Q4 2014
Liquidity Coverage Ratio Comments
LCR subcomponents, EURbn Time series – liquidity buffer
Contacts
44
Investor Relations
Rodney Alfvén
Head of Investor Relations
Nordea Bank AB
Mobile: +46 722 35 05 15
Tel: +46 10 156 29 60
Andreas Larsson
Head of Debt IR
Nordea Bank AB
Mobile: +46 709 70 75 55
Tel: +46 10 156 29 61
Maria Caneman
Debt IR Officer
Nordea Bank AB
Mobile: +46 768 24 92 18
Tel: +46 10 156 50 19
Carolina Brikho
Roadshow Coordinator
Nordea Bank AB
Mobile: +46 761 34 75 30
Tel: +46 10 156 29 62
Group Treasury & ALM
Mark Kandborg
Head of Group Treasury & ALM
Tel: +45 33 33 19 09
Mobile: +45 29 25 85 82
Ola Littorin
Head of Long Term Funding
Tel: +46 8 407 9005
Mobile: +46 708 400 149
Jaana Sulin
Head of Short Term Funding
Tel: +358 9 369 50510
Mobile: +358 50 68503
Maria Härdling
Head of Capital Structuring
Tel: +46 10 156 58 70
Mobile: +46 705 594 843