fostering inclusive growth; imf staff notes prepared … · inclusive growth is a priority that...
TRANSCRIPT
G R O U P O F T W E N T Y
FOSTERING INCLUSIVE GROWTH
G-20 Leaders' Summit, July 7-8, 2017 Hamburg, Germany
Prepared by Staff of the
I N T E R N A T I O N A L M O N E T A R Y F U N D*
* The background note does not necessarily reflect the views of the IMF Executive Board.
FOSTERING INCLUSIVE GROWTH
INTERNATIONAL MONETARY FUND 3
Glossary __________________________________________________________________________________________ 4
I. INTRODUCTION _____________________________________________________________________________ 8
II. THE FACTS ON INCLUSIVE GROWTH _______________________________________________________ 9
A. Why Inclusive Growth Matters ____________________________________________________________ 9
B. Trends __________________________________________________________________________________ 11
III. INEQUALITY IN A MACROECONOMIC CONTEXT—THE ROLE OF TECHNOLOGY,
ECONOMIC INTEGRATION AND DOMESTIC POLICIES _______________________________________ 21
IV. POLICIES TO ADDRESS INEQUALITY AND MITIGATE GROWTH-EQUALITY
TRADE-OFFS ____________________________________________________________________________________ 23
V. THE IMF’S SUPPORT FOR COUNTRIES IN ENHANCING INCLUSIVE GROWTH __________ 27
References _______________________________________________________________________________________ 31
BOX
1. Operationalizing the IMF’s Work on Inclusion _________________________________________________ 29
FIGURES
1. Growth and Inequality, 1960–2010 ___________________________________________________________ 11
2. Global Inequality, 1988–2013 _________________________________________________________________ 11
3. Global Growth Incidence Curve, 1988–2008 ___________________________________________________ 12
4. Within Country Income Inequality, Market and Net Gini, 1990–2012 _____________________________ 13
5. Top Income Shares: G20, 1980–2010 ____________________________________________________________ 14
6. Labor Share Evolutions and Labor Force Composition by Skill Level in G20 Countries, 1995–2009 _ 15
7. Disconnect between Real Median Wage and Economic Growth ______________________________ 15
8. Labor Shares and Income Inequality , 1995–2009 _____________________________________________ 16
9. Wealth and Income Inequality for G20 Countries, 2000 __________________________________________ 16
10. Income Inequality and Social Mobility _______________________________________________________ 17
11. Development in World Employment, 2007–2014 ____________________________________________ 17
12. Gender Gaps in Labor Force Participation Rates, 1990–2010 ____________________________________ 18
13. Inequalities in Health Outcomes _____________________________________________________________ 19
14. Education Gini and Outcomes by Income Decile _____________________________________________ 20
15. Financial Inclusion in Advanced and Developing Countries __________________________________ 20
16. Contributions to Aggregate Labor Share Change by Skill, 1995–2009 _______________________ 21
17. Safe Inclusion , 1980–2014 ___________________________________________________________________ 25
ANNEX
I. Completed Pilots under the Initiatives on Inclusion ____________________________________________ 30
FOSTERING INCLUSIVE GROWTH
4 INTERNATIONAL MONETARY FUND
Glossary
AE
DC
EM
EMDE
FDI
GVC
ILO
LIC
LIDC
OECD
PPP
UN
WB
WTO
Advanced economy
Developing country
Emerging market economy
Emerging market and developing economy
Foreign direct investment
Global value chain
International Labor Organization
Low-income country
Low-income developing country
Organization for Economic Cooperation and Development
Public-private partnership
United Nations
World Bank
World Trade Organization
FOSTERING INCLUSIVE GROWTH
INTERNATIONAL MONETARY FUND 5
EXECUTIVE SUMMARY
The Context
Inclusive growth is a priority that resonates globally today. It relates to a broad sharing of the benefits
of, and the opportunities for, economic growth, and reflects growth that is robust and broad-based across
sectors, promotes productive employment across the labor force, embodies equal opportunities in access
to markets and resources, and protects the vulnerable.
The G20 has emphasized the need for inclusive growth. In this regard, the Hangzhou G20
leaders’ Summit in September 2016 renewed the emphasis on inclusive growth called for the forging
of both a narrative for strong, sustainable, balanced and inclusive growth and for adopting a
package of policies to make this possible. The communique stated that the G20 would “work to
ensure that our economic growth serves the needs of everyone and benefits all countries and all
people including in particular women, youth and disadvantaged groups, generating more quality
jobs, addressing inequalities and eradicating poverty so that no one is left behind.” G20 Ministers
returned to this in March 2017 in Baden-Baden noting that: “We reiterate our determination to use
all policy tools––monetary, fiscal and structural––individually and collectively to achieve our goal of
strong, sustainable, balanced and inclusive growth, while enhancing economic and financial
resilience.”
Economic growth and inequality, the two sides of inclusion, have a complex nexus that can
generate tradeoffs. Growth is the basis for generating inclusion. Across countries, growth has been
instrumental in narrowing income gaps; within countries, growth has reduced poverty and made
possible higher living standards and job opportunities. But policies driven by an exclusive growth
focus can also set back inclusion in certain circumstances. While some inequality is integral to a
market economy, high and persistent inequality can undermine the sustainability of growth itself.
The Facts
Across countries, inequality has declined, with the global Gini index dropping from nearly 70 in
1988 to 62.5 in 2013, driven by strong growth in many emerging and developing economies. But,
the convergence process is incomplete and wide cross-country per-capita income gaps still prevail.
Within countries. Inequality has risen in most advanced economies (AEs) since the 1990s until the
mid-2000s, whereas in emerging market and developing economies (EMDEs), inequality remains
high even as it has declined in recent decades in many of them. The top 1 percent in AEs now
accounts for around 10 percent of total income, with shares even higher for some AEs. In EMDEs,
income inequality is typically higher than in AEs, reflecting in part the more supportive role of fiscal
policies (through design of taxes and transfers) to cushion net income in AEs. This differential
pattern is also typical to the advanced and emerging economies within the G20, although income
inequality has stayed broadly flat for most G20 economies since the global financial crisis.
FOSTERING INCLUSIVE GROWTH
6 INTERNATIONAL MONETARY FUND
Lack of inclusion manifests in different forms. The share of labor income has been falling across
AEs and EMDEs for over two decades, with the decline more pronounced among low- and
middle-skilled workers. The cumulative effect of persistent income differences, movements in asset
prices, and the lower propensity to save by middle- and lower-income workers has also led to even
wider gaps in wealth inequality. The bottom 50 percent of the global population has near-zero
wealth and almost half of global wealth is held by the top 1 percent. Low inclusion also reflects
unequal opportunities of access to markets (labor) and services (health, education, finance) from an
early childhood. Some countries are acutely afflicted with wide gender gaps in these economic and
social opportunities that also determine gender gaps in income earnings.
The Factors
Technology and economic integration. Technology, trade and financial integration have brought
large benefits to many economies by driving productivity and growth and lifting millions out of
poverty. Moreover, trade has lowered consumer prices to benefit low-income households, which
spend a higher share of their incomes on traded goods. However, technology and, to a lesser extent,
participation in global value chains (GVCs) and financial integration have also led to lower labor
income shares in AEs. Similarly, in EMDEs, higher participation in GVCs has induced a reallocation of
resources into more capital-intensive sectors, lowering labor income.
Domestic factors. Macrostructural and economic policies can affect inequality differently
depending on the design of policies and the structure of the economy. For example, policies geared
at boosting productivity could widen inequality if accompanied by an attendant displacement of the
poor or low-skilled labor. In contrast, reforms targeted to help raise income and productivity of the
poor or of low-skilled labor, if designed well, could boost growth while reducing inequality.
The Remedies
Domestic policies are key for translating strong growth to inclusive growth. A prerequisite is to
adopt policy frameworks that maintain sustainable growth with macroeconomic stability. It is also
important to identify the channels through which domestic policies affect growth and distribution in
different ways and the measures that can limit growth-inequality tradeoffs; but also, recognize the
limitations of policy responses when underlying causes of inequality are persistent in nature.
Against this backdrop, a general takeaway is that fostering inclusive growth requires a
continuous effort to boost productivity and measures to mitigate growth-inequality tradeoffs:
Measures that boost productivity and economic opportunities: (i) productive infrastructure
investment to raise demand and job creation in the short term and labor productivity in the long
term; (ii) financial inclusion combined with financial stability that support long-term growth
while helping people and firms to smooth income fluctuations and investment; (iii) education
and health opportunities that raise human capital and offset polarization in skills and incomes;
(iv) labor market and structural policies that improve labor market efficiency while increasing
inclusion; (vi) measures that foster women’s participation in labor activities; and (v) measures that
FOSTERING INCLUSIVE GROWTH
INTERNATIONAL MONETARY FUND 7
support labor market flexibility by removing rigidities in other markets, such as well-targeted
housing or regional policies aimed at restoring hard-hit communities.
Policies that reduce growth-inequity tradeoffs: (i) well-designed fiscal policy with more reliance on
progressive taxes, better targeting social safety nets, and reducing tax expenditures in AEs;
stronger revenue mobilization to meet development needs and targeted cash transfers in
EMDEs; and (ii) trampoline policies, such as job counseling and retraining that help people adjust
faster to economic shocks and reduce unemployment spells and skill depreciations.
With growing evidence that growth and its inclusion do not always go together and that lack
of inclusion can be macroeconomically harmful, the IMF has scaled up its work in this area.
These efforts will continue, particularly in: (i) deepening its policy diagnosis to better understand the
channels and mechanisms through which policies affect growth and inequality, (ii) integrating the
analysis into Fund policy dialogue with member countries, and (iii) providing customized technical
assistance on designing tax and expenditure policies to support inclusive growth.
FOSTERING INCLUSIVE GROWTH
8 INTERNATIONAL MONETARY FUND
I. INTRODUCTION
1. Inclusive growth is an objective that resonates globally today: in all economies—small
or large, developing or advanced, resource-rich or diversified. In a nutshell, inclusive growth is a
broad sharing of the benefits of, and the opportunities for, economic growth. Clearly, the means of
achieving this imperative depend on country-specific circumstances, but overall relate to growth
that is robust and broad-based across sectors, promotes productive employment across the labor
force, embodies equal opportunities in terms of access to markets and resources, and protects the
vulnerable segments of the population.
2. The G20 likewise has emphasized the importance of strong, sustainable, balanced and
inclusive growth. In this regard, leaders noted in the 2016 Hangzhou communique that: “Our
growth, to be strong, sustainable and balanced, must also be inclusive. We are committed to
ensuring the benefits of our growth reach all people and maximize the growth potential of
developing and low-income countries.” These messages were reiterated by Ministers in March
2017 in Baden-Baden who added that: “We will strive to reduce excessive global imbalances,
promote greater inclusiveness and fairness and reduce inequality in our pursuit of economic
growth.”
3. Over the decades before the global financial crisis, important progress was made in
achieving fast growth, lifting millions out of extreme poverty, but much remains to be done
to foster inclusion. Sustained and strong growth in many economies has helped reduce global
poverty and narrow income gaps between countries. Nevertheless, inequality around the world
remains high. Moreover, even within many countries, the gains from strong growth have not always
been broadly shared and inequality has worsened within many countries. While some inequality is
inevitable in a market-based economy, persistently high levels of inequality can pose a threat to
long-term growth by hindering social cohesion and people’s ability to invest in skills and assets.
4. The challenges of growth, job creation, and inclusion are closely inter-linked. Strong
economic growth is an essential prerequisite (but not always sufficient) for job creation and social
cohesion. In turn, strong job growth and increased labor force participation, including among
women, are important to foster inclusive growth and reduce income inequality; and increases in
social cohesion and job creation can also support sustained growth. Conversely, policies motivated
by an exclusive growth focus may not always generate inclusion, and similarly, measures to solely
meet distributional objectives may not be efficient. The ability to generate both strong and inclusive
growth, therefore, depends crucially on policy design customized to country-specific circumstances.
5. There is no single definition of “inclusive growth,” but the policy dialogue on inclusion
is supported by broadly similar concepts. Some international financial institutions and
development partners place greater emphasis on productive and broad-based employment, others
on the availability of social protection, and still others on a wider access to socioeconomic
opportunities (see Box 2 in IMF, 2013 for details). While the IMF’s work also relates to many broad
FOSTERING INCLUSIVE GROWTH
INTERNATIONAL MONETARY FUND 9
aspects of inclusion, for the purposes of this paper, the concept of inclusion is narrowly confined to areas
concerning inequality in economic outcomes and opportunities. 1
6. This paper examines trends in inclusive growth and drivers of the linkages between
growth and inequality, and offers some policy lessons for greater inclusiveness. It starts with a
discussion of why inclusion is key to achieving sustainable growth and then documents trends in
different aspects of inequality, including inequality of outcomes (income and wealth) and of
opportunities (access to the labor market and to basic services). It ends with broad policy lessons to
support inclusive growth, recognizing that solutions will need to respond to country-specific needs,
could be weakened when forces inducing inequality are persistent and entrenched, and may face
social or political constraints and, therefore, take time to implement.
7. The rest of the paper is organized as follows: Section II provides an overview of trends in
inequality of outcomes and opportunities. Section III discusses how global trends and domestic
policies affect inclusive growth. Section IV provides policy recommendations for more inclusive
growth, and section V discusses how the IMF supports countries in achieving inclusive growth.
II. THE FACTS ON INCLUSIVE GROWTH
A. Why Inclusive Growth Matters
8. Inclusive growth is important for sustained growth and social cohesion. Some
inequality is integral to a market economy and the incentives needed for investment and growth.
But policies driven by an exclusive growth focus can result in high or pervasive levels of inequality
in some circumstances, particularly if there is no attention on their distributional consequences
(Fabrizio and others, 2017). And high inequality can be destructive to the level and durability of
growth itself (Berg and Ostry, 2011; Ostry, Berg, and Tsangarides, 2014), weaken support for
growth-enhancing reforms and spur governments to adopt populistic policies, threatening
economic and political stability (Rodrik, 1999).
9. High and persistent inequality can have significant negative implications for both
longer-term growth and macroeconomic stability.
High inequality can yield a less efficient allocation of resources: Thus, the poor may be unable to
invest in human capital or engage in productive activities if financial market imperfections constrain
their ability to borrow (Banerjee, 2004). Limitations to financial access and investment in turn may
also slow social mobility, reduce incentives to work and, in turn, contribute to lower growth.
Inequality resulting from high unemployment can impose large economic costs:
o Long unemployment spells may cause a loss in skills, limit employability of individuals, shrink
1 For example, inclusion also requires ensuring that wealth is not captured by a few through corruption and rent seeking,
hence the importance of good governance (see IMF, 2016a), and that the benefits of growth do not unduly strain the
physical environment—undermining economic prospects for future generation—hence the importance of building resilience
to climate change (see IMF, 2016b).
FOSTERING INCLUSIVE GROWTH
10 INTERNATIONAL MONETARY FUND
the pool of savings available for investment and reduce potential output (Bean and Pissarides,
1993). The decline in human capital accumulation through learning-by-doing among the
employed will, in turn, have adverse effects on potential growth.
o Labor utilization influences income distribution. The longer the unemployment duration, the
higher could be the income inequality (Morsy, 2012). In countries with sizable youth
unemployment, inequality can be exacerbated due to scarring effects of slow growth in labor
earnings or job-related dissatisfaction (Bell and Blanchflower, 2015).
o The misallocation of women’s labor because of discrimination, social norms, or inequality in
opportunity can induce economic losses in AEs and developing countries (DCs) (Stotsky, 2006).
Inequality can also cause social conflicts, which manifest themselves through political struggles for
public resources and have adverse macroeconomic outcomes. Different interests of different social
groups, and the political processes through which those interests are reconciled, can lower growth,
result in unproductive government spending (Alesina and Rodrik, 1994), favor a few (Bourguignon,
Ferreira, and Menéndez, 2007), or induce disruption and social conflict (World Bank, 2011).
Inequality and unemployment can impair individuals’ ability to cope with risk and thus increase
macroeconomic instability. In highly unequal societies, insurance mechanisms to smooth the effect
of shocks on consumption are typically limited to a few, imposing large welfare costs. Also, the
fragile segments of the labor market—young, low-skilled, and temporary workers—are more
exposed to economic shocks, making them vulnerable to job instability. High inequality can also
lead to high financial fragility and macroeconomic instability (Rajan, 2010; Reich, 2010; Kumhof and
Ranciere, 2010) and amplify the effect of negative external shocks (Rodrik, 1999).
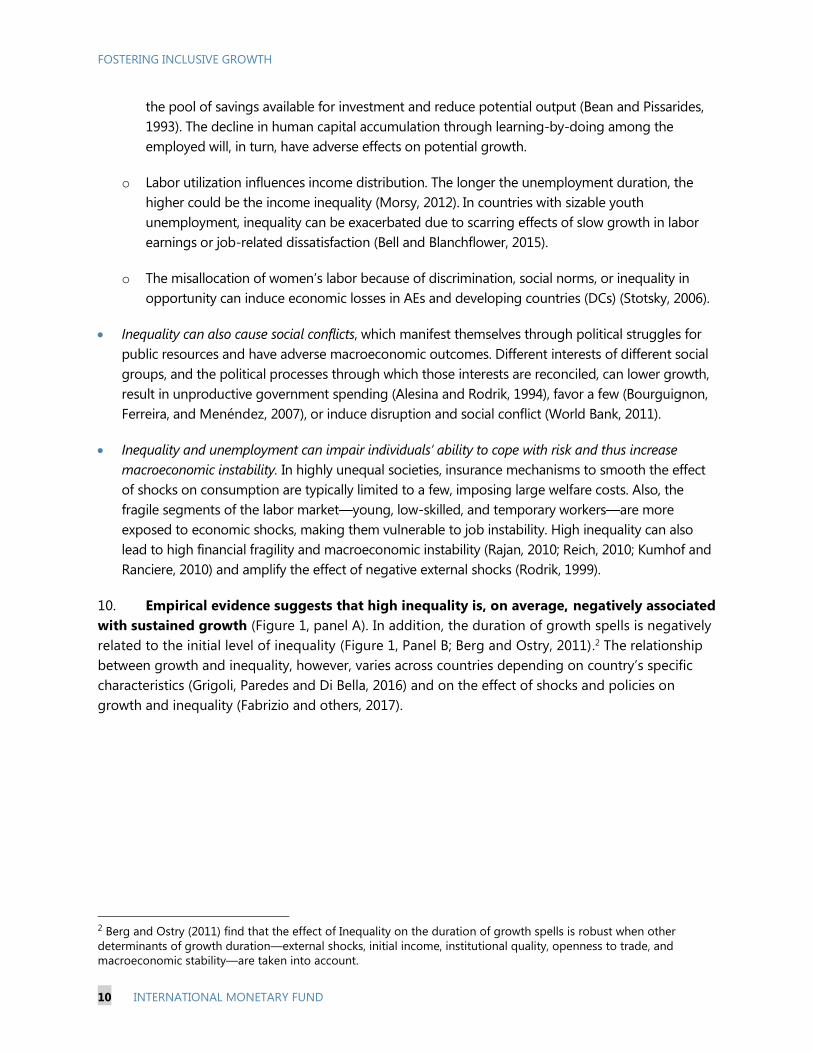
10. Empirical evidence suggests that high inequality is, on average, negatively associated
with sustained growth (Figure 1, panel A). In addition, the duration of growth spells is negatively
related to the initial level of inequality (Figure 1, Panel B; Berg and Ostry, 2011).2 The relationship
between growth and inequality, however, varies across countries depending on country’s specific
characteristics (Grigoli, Paredes and Di Bella, 2016) and on the effect of shocks and policies on
growth and inequality (Fabrizio and others, 2017).
2 Berg and Ostry (2011) find that the effect of Inequality on the duration of growth spells is robust when other
determinants of growth duration—external shocks, initial income, institutional quality, openness to trade, and
macroeconomic stability—are taken into account.
FOSTERING INCLUSIVE GROWTH
INTERNATIONAL MONETARY FUND 11
Figure 1. Growth and Inequality, 1960–2010
Panel A: Medium-term growth and inequality Panel B: Duration of growth spells and Inequality
Source: Ostry, Berg, and Tsangarides (2014), using data
from Penn World Tables version 7.1, SWIID 3.1, and authors'
calculations
Source: Ostry, Berg, and Tsangarides (2014), using data from Penn
World Tables version 7.1, SWIID 3.1, and authors' calculations.
Note: Simple correlation between length of growth spells, and the
average net income inequality and transfers during the spell. Spells
that end in-sample are included; minimum spell length is 5 years.
B. Trends3
11. An important distinction when discussing distributional inequality is that between
inequality of outcomes (ex post) and inequality of opportunity (ex ante). The most widely cited
measure of inequality of outcomes is income inequality, typically measured by the market (gross)
and net (after tax and transfers from social insurance programs) Gini coefficient and by income
shares of the population (by deciles or quintiles). Information on the assets held by the wealthiest
offers a complementary perspective on financial inequality. Inequality of opportunity relates to
differences in opportunities to access basic services (e.g., health, education, and infrastructure) and
to financial and labor markets, which ultimately
lead to inequality in outcomes as seen in
differences in income and wealth and lower
economic mobility across generations.
Inequality of outcomes
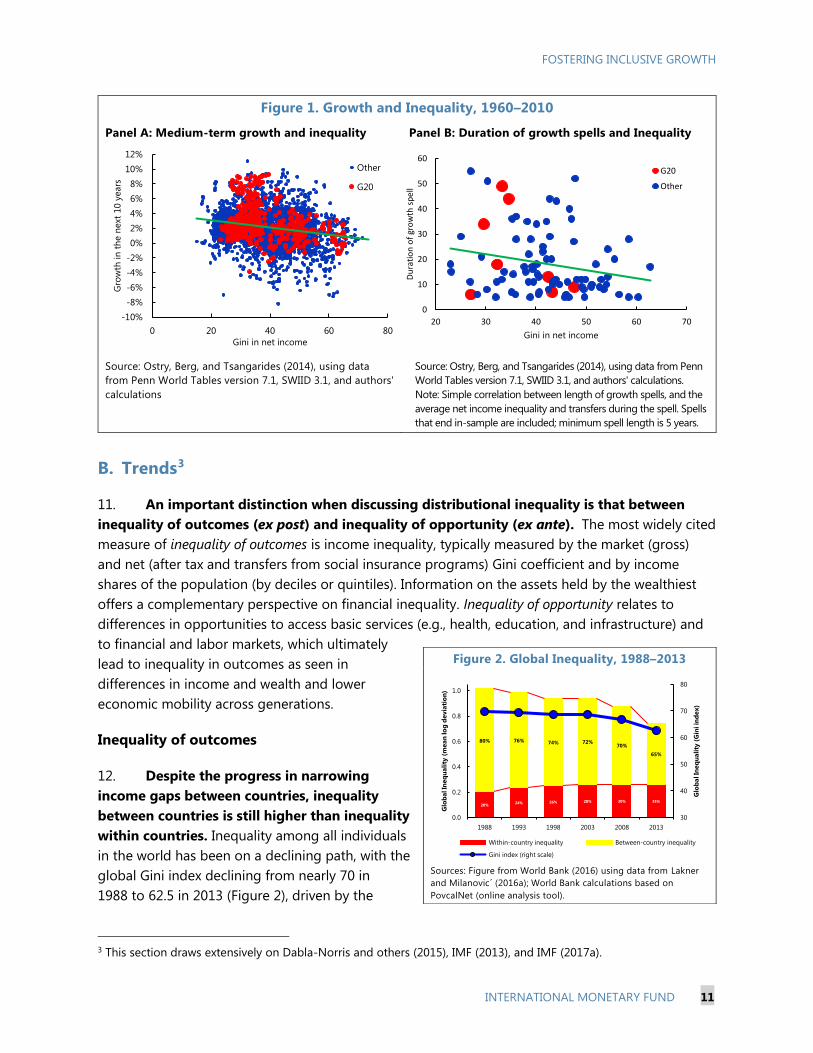
12. Despite the progress in narrowing
income gaps between countries, inequality
between countries is still higher than inequality
within countries. Inequality among all individuals
in the world has been on a declining path, with the
global Gini index declining from nearly 70 in
1988 to 62.5 in 2013 (Figure 2), driven by the
3 This section draws extensively on Dabla-Norris and others (2015), IMF (2013), and IMF (2017a).
Figure 2. Global Inequality, 1988–2013
Sources: Figure from World Bank (2016) using data from Lakner
and Milanovic´ (2016a); World Bank calculations based on
PovcalNet (online analysis tool).
20%24% 26% 28% 30% 35%
80% 76% 74% 72%70%
65%
30
40
50
60
70
80
0.0
0.2
0.4
0.6
0.8
1.0
1988 1993 1998 2003 2008 2013
Glo
bal In
eq
uali
ty (
Gin
i in
dex)
Glo
bal In
eq
uali
ty (
mean
lo
g d
evia
tio
n)
Within-country inequality Between-country inequality
Gini index (right scale)
-10%
-8%
-6%
-4%
-2%
0%
2%
4%
6%
8%
10%
12%
0 20 40 60 80
Gro
wth
in
th
e n
ext
10 y
ears
Gini in net income
Other
G20
0
10
20
30
40
50
60
20 30 40 50 60 70
Du
rati
on
of
gro
wth
sp
ell
Gini in net income
G20
Other
FOSTERING INCLUSIVE GROWTH
12 INTERNATIONAL MONETARY FUND
strong pace of growth in many DCs. That said, as Figure 2 demonstrates, almost two-thirds of global
inequality is still attributable to per-capita income gaps between countries.4
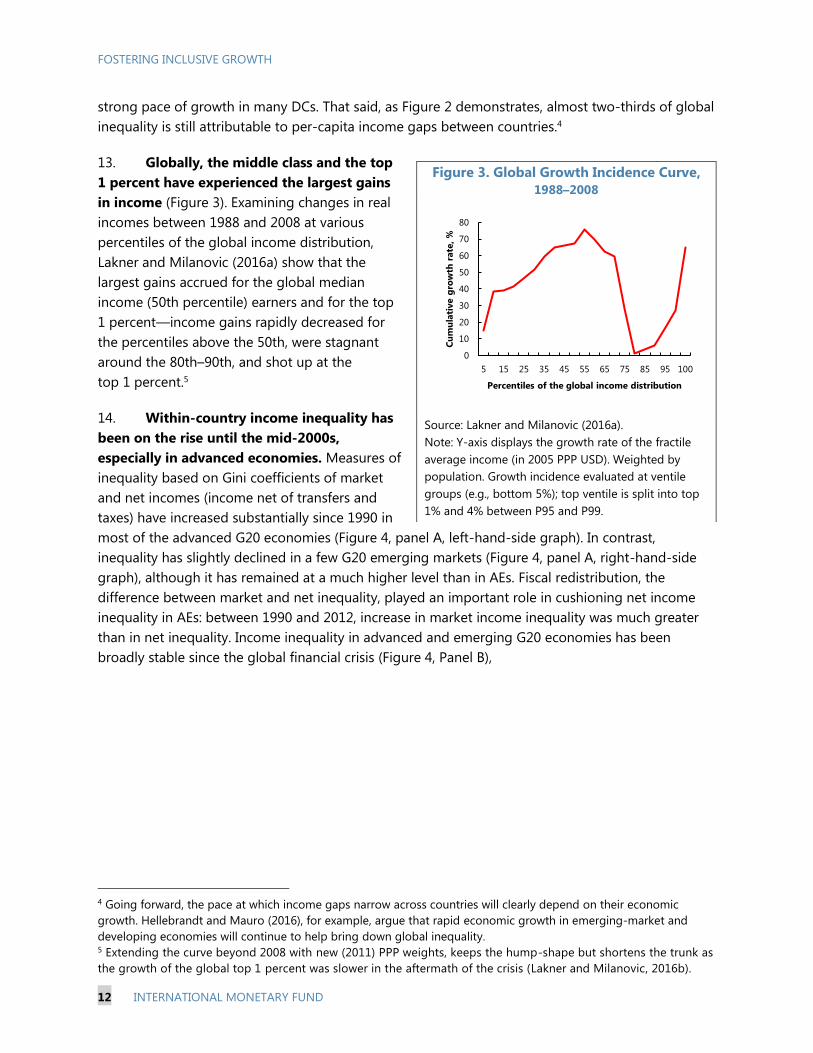
13. Globally, the middle class and the top
1 percent have experienced the largest gains
in income (Figure 3). Examining changes in real
incomes between 1988 and 2008 at various
percentiles of the global income distribution,
Lakner and Milanovic (2016a) show that the
largest gains accrued for the global median
income (50th percentile) earners and for the top
1 percent—income gains rapidly decreased for
the percentiles above the 50th, were stagnant
around the 80th–90th, and shot up at the
top 1 percent.5
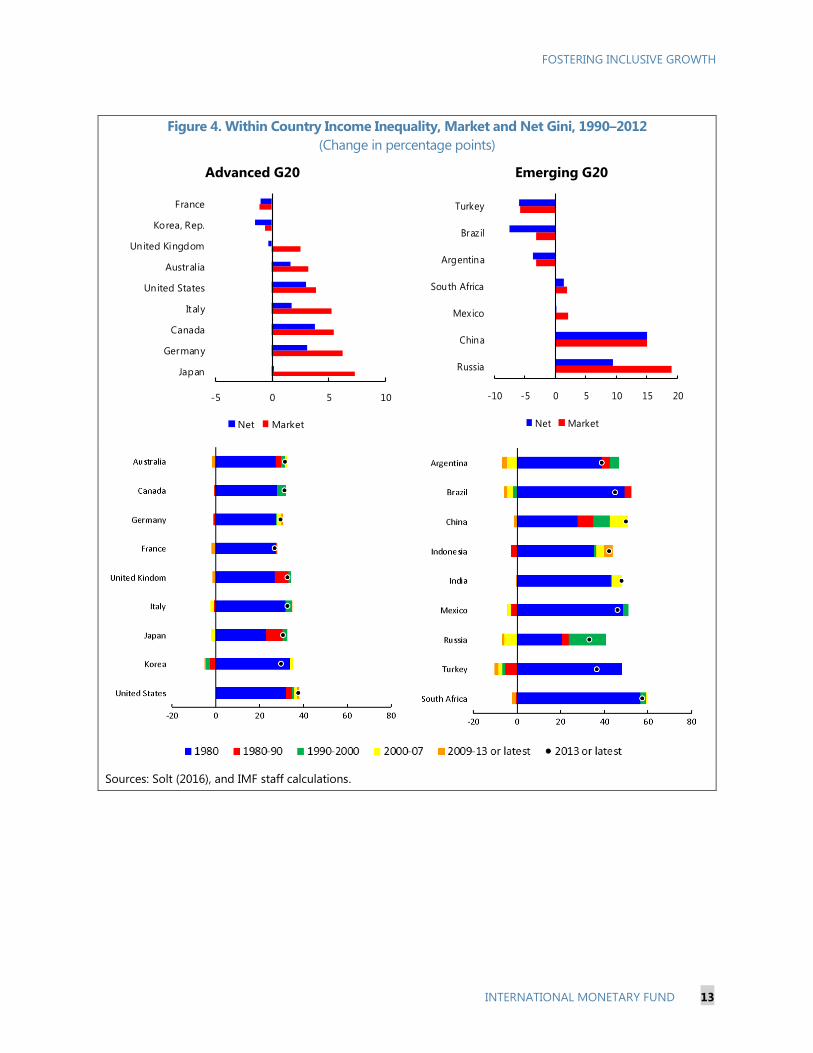
14. Within-country income inequality has
been on the rise until the mid-2000s,
especially in advanced economies. Measures of
inequality based on Gini coefficients of market
and net incomes (income net of transfers and
taxes) have increased substantially since 1990 in
most of the advanced G20 economies (Figure 4, panel A, left-hand-side graph). In contrast,
inequality has slightly declined in a few G20 emerging markets (Figure 4, panel A, right-hand-side
graph), although it has remained at a much higher level than in AEs. Fiscal redistribution, the
difference between market and net inequality, played an important role in cushioning net income
inequality in AEs: between 1990 and 2012, increase in market income inequality was much greater
than in net inequality. Income inequality in advanced and emerging G20 economies has been
broadly stable since the global financial crisis (Figure 4, Panel B),
4 Going forward, the pace at which income gaps narrow across countries will clearly depend on their economic
growth. Hellebrandt and Mauro (2016), for example, argue that rapid economic growth in emerging-market and
developing economies will continue to help bring down global inequality. 5 Extending the curve beyond 2008 with new (2011) PPP weights, keeps the hump-shape but shortens the trunk as
the growth of the global top 1 percent was slower in the aftermath of the crisis (Lakner and Milanovic, 2016b).
Figure 3. Global Growth Incidence Curve,
1988–2008
Source: Lakner and Milanovic (2016a).
Note: Y-axis displays the growth rate of the fractile
average income (in 2005 PPP USD). Weighted by
population. Growth incidence evaluated at ventile
groups (e.g., bottom 5%); top ventile is split into top
1% and 4% between P95 and P99.
0
10
20
30
40
50
60
70
80
5 15 25 35 45 55 65 75 85 95 100
Cu
mu
lati
ve g
row
th r
ate
, %
Percentiles of the global income distribution
FOSTERING INCLUSIVE GROWTH
INTERNATIONAL MONETARY FUND 13
Figure 4. Within Country Income Inequality, Market and Net Gini, 1990–2012
(Change in percentage points)
Advanced G20 Emerging G20
Sources: Solt (2016), and IMF staff calculations.
-5 0 5 10
Japan
Germany
Canada
Italy
United States
Austral ia
United Kingdom
Korea, Rep.
France
Net Market
-10 -5 0 5 10 15 20
Russia
China
Mexico
South Africa
Argentina
Brazil
Turkey
Net Market
FOSTERING INCLUSIVE GROWTH
14 INTERNATIONAL MONETARY FUND
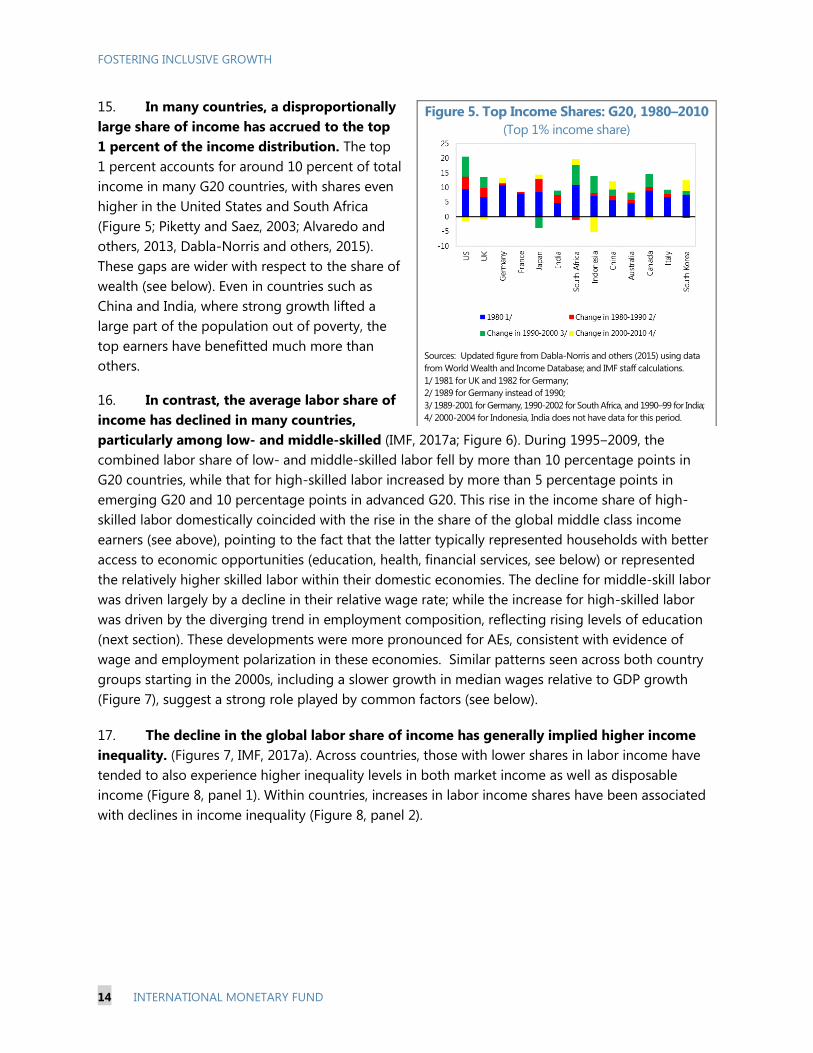
15. In many countries, a disproportionally
large share of income has accrued to the top
1 percent of the income distribution. The top
1 percent accounts for around 10 percent of total
income in many G20 countries, with shares even
higher in the United States and South Africa
(Figure 5; Piketty and Saez, 2003; Alvaredo and
others, 2013, Dabla-Norris and others, 2015).
These gaps are wider with respect to the share of
wealth (see below). Even in countries such as
China and India, where strong growth lifted a
large part of the population out of poverty, the
top earners have benefitted much more than
others.
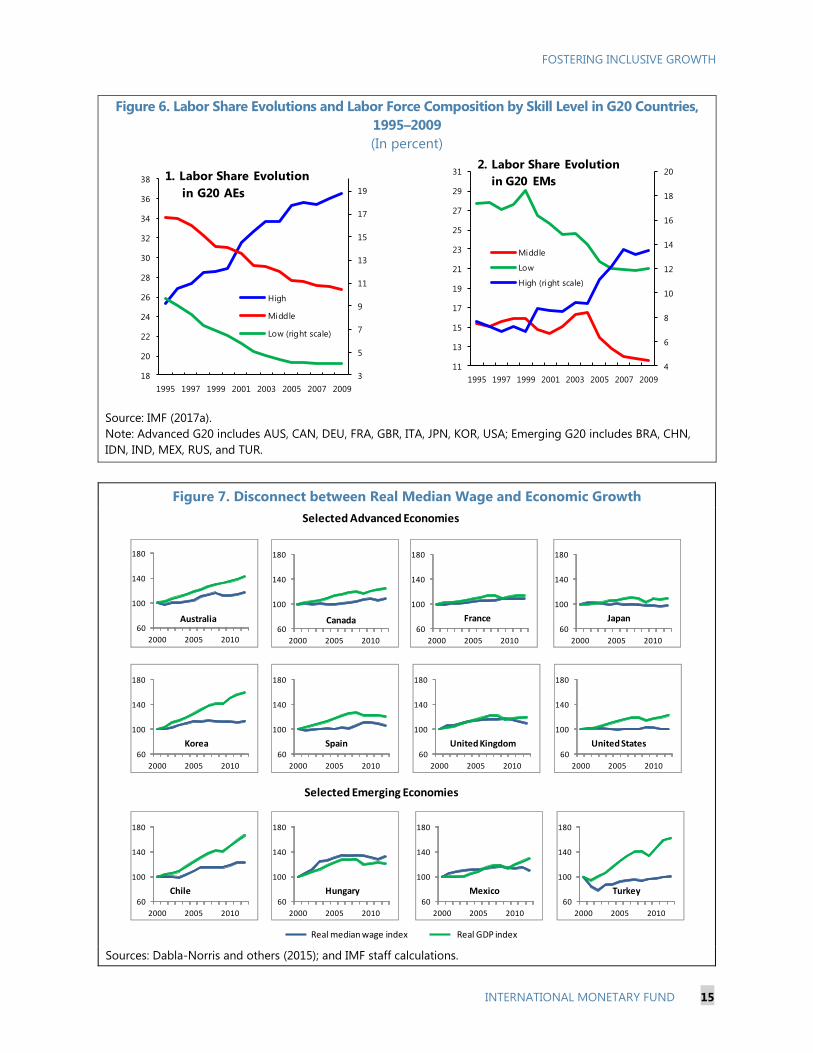
16. In contrast, the average labor share of
income has declined in many countries,
particularly among low- and middle-skilled (IMF, 2017a; Figure 6). During 1995‒2009, the
combined labor share of low- and middle-skilled labor fell by more than 10 percentage points in
G20 countries, while that for high-skilled labor increased by more than 5 percentage points in
emerging G20 and 10 percentage points in advanced G20. This rise in the income share of high-
skilled labor domestically coincided with the rise in the share of the global middle class income
earners (see above), pointing to the fact that the latter typically represented households with better
access to economic opportunities (education, health, financial services, see below) or represented
the relatively higher skilled labor within their domestic economies. The decline for middle-skill labor
was driven largely by a decline in their relative wage rate; while the increase for high-skilled labor
was driven by the diverging trend in employment composition, reflecting rising levels of education
(next section). These developments were more pronounced for AEs, consistent with evidence of
wage and employment polarization in these economies. Similar patterns seen across both country
groups starting in the 2000s, including a slower growth in median wages relative to GDP growth
(Figure 7), suggest a strong role played by common factors (see below).
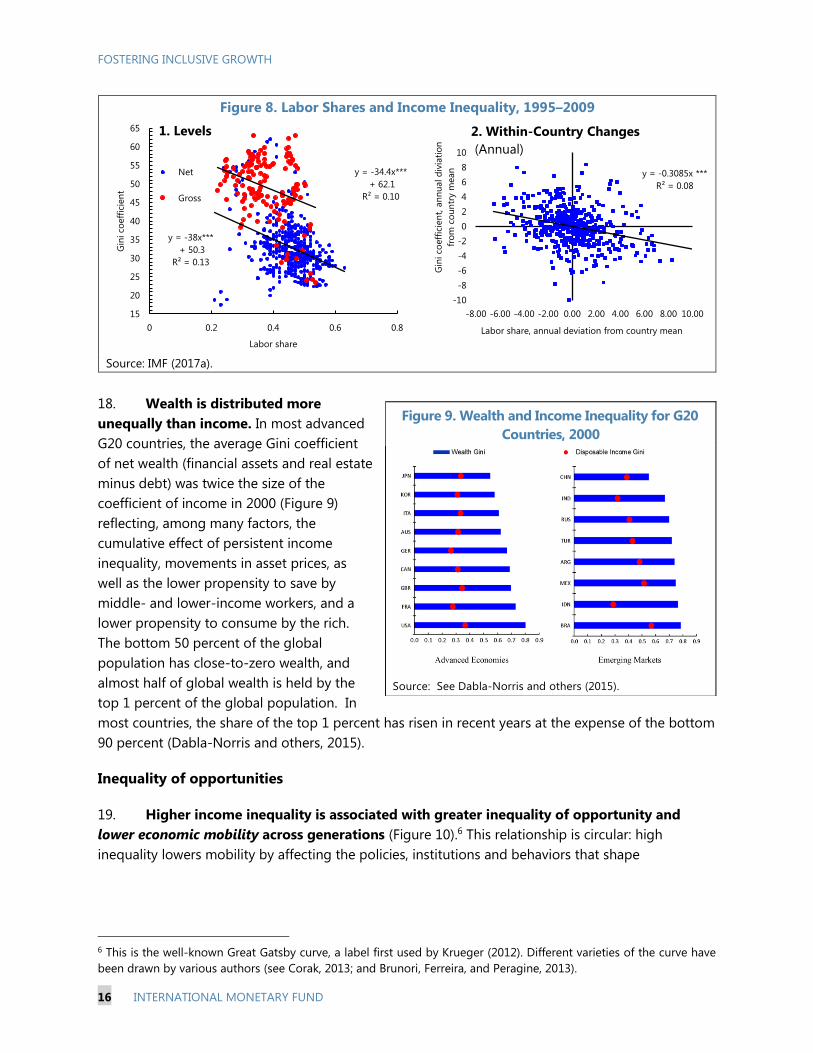
17. The decline in the global labor share of income has generally implied higher income
inequality. (Figures 7, IMF, 2017a). Across countries, those with lower shares in labor income have
tended to also experience higher inequality levels in both market income as well as disposable
income (Figure 8, panel 1). Within countries, increases in labor income shares have been associated
with declines in income inequality (Figure 8, panel 2).
Figure 5. Top Income Shares: G20, 1980–2010
(Top 1% income share)
Sources: Updated figure from Dabla-Norris and others (2015) using data
from World Wealth and Income Database; and IMF staff calculations.
1/ 1981 for UK and 1982 for Germany;
2/ 1989 for Germany instead of 1990;
3/ 1989-2001 for Germany, 1990-2002 for South Africa, and 1990–99 for India;
4/ 2000-2004 for Indonesia, India does not have data for this period.
FOSTERING INCLUSIVE GROWTH
INTERNATIONAL MONETARY FUND 15
Figure 6. Labor Share Evolutions and Labor Force Composition by Skill Level in G20 Countries,
1995–2009
(In percent)
Source: IMF (2017a).
Note: Advanced G20 includes AUS, CAN, DEU, FRA, GBR, ITA, JPN, KOR, USA; Emerging G20 includes BRA, CHN,
IDN, IND, MEX, RUS, and TUR.
Figure 7. Disconnect between Real Median Wage and Economic Growth
Sources: Dabla-Norris and others (2015); and IMF staff calculations.
3
5
7
9
11
13
15
17
19
18
20
22
24
26
28
30
32
34
36
38
1995 1997 1999 2001 2003 2005 2007 2009
1. Labor Share Evolution
in G20 AEs
High
Middle
Low (right scale)
4
6
8
10
12
14
16
18
20
11
13
15
17
19
21
23
25
27
29
31
1995 1997 1999 2001 2003 2005 2007 2009
2. Labor Share Evolution
in G20 EMs
Middle
Low
High (right scale)
60
100
140
180
2000 2005 2010
Canada
60
100
140
180
2000 2005 2010
Chile
60
100
140
180
2000 2005 2010
France
60
100
140
180
2000 2005 2010
Hungary
60
100
140
180
2000 2005 2010
Japan
60
100
140
180
2000 2005 2010
Korea
60
100
140
180
2000 2005 2010
Mexico
60
100
140
180
2000 2005 2010
Spain
60
100
140
180
2000 2005 2010
Turkey
60
100
140
180
2000 2005 2010
United Kingdom60
100
140
180
2000 2005 2010
United States
60
100
140
180
2000 2005 2010
Australia
Real median wage index Real GDP index
Selected Emerging Economies
Selected Advanced Economies
FOSTERING INCLUSIVE GROWTH
16 INTERNATIONAL MONETARY FUND
Figure 8. Labor Shares and Income Inequality, 1995–2009
Source: IMF (2017a).
18. Wealth is distributed more
unequally than income. In most advanced
G20 countries, the average Gini coefficient
of net wealth (financial assets and real estate
minus debt) was twice the size of the
coefficient of income in 2000 (Figure 9)
reflecting, among many factors, the
cumulative effect of persistent income
inequality, movements in asset prices, as
well as the lower propensity to save by
middle- and lower-income workers, and a
lower propensity to consume by the rich.
The bottom 50 percent of the global
population has close-to-zero wealth, and
almost half of global wealth is held by the
top 1 percent of the global population. In
most countries, the share of the top 1 percent has risen in recent years at the expense of the bottom
90 percent (Dabla-Norris and others, 2015).
Inequality of opportunities
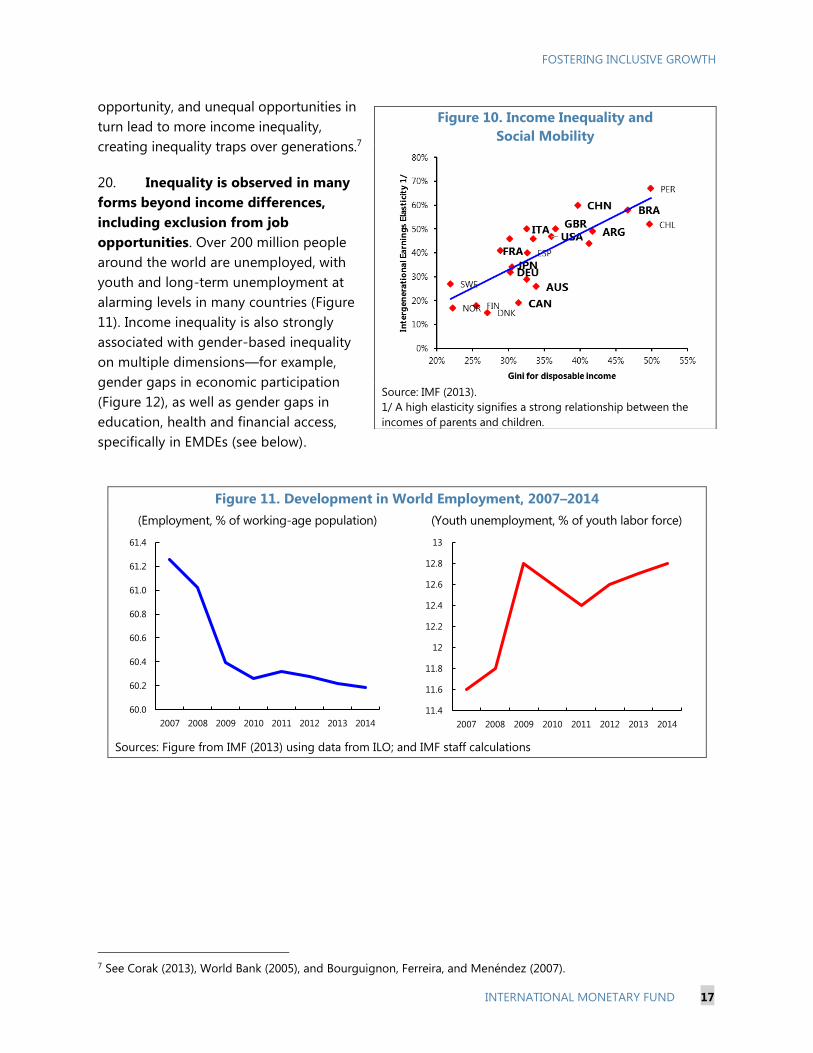
19. Higher income inequality is associated with greater inequality of opportunity and
lower economic mobility across generations (Figure 10).6 This relationship is circular: high
inequality lowers mobility by affecting the policies, institutions and behaviors that shape
6 This is the well-known Great Gatsby curve, a label first used by Krueger (2012). Different varieties of the curve have
been drawn by various authors (see Corak, 2013; and Brunori, Ferreira, and Peragine, 2013).
y = -38x***
+ 50.3
R² = 0.13
y = -34.4x***
+ 62.1
R² = 0.10
15
20
25
30
35
40
45
50
55
60
65
0 0.2 0.4 0.6 0.8
Gin
i co
eff
icie
nt
Labor share
1. Levels
Net
Gross
y = -0.3085x ***
R² = 0.08
-10
-8
-6
-4
-2
0
2
4
6
8
10
-8.00 -6.00 -4.00 -2.00 0.00 2.00 4.00 6.00 8.00 10.00
Gin
i co
eff
icie
nt,
an
nu
al d
ivia
tio
n
fro
m c
ou
ntr
y m
ean
Labor share, annual deviation from country mean
2. Within-Country Changes
(Annual)
Figure 9. Wealth and Income Inequality for G20
Countries, 2000
Source: See Dabla-Norris and others (2015).
FOSTERING INCLUSIVE GROWTH
INTERNATIONAL MONETARY FUND 17
opportunity, and unequal opportunities in
turn lead to more income inequality,
creating inequality traps over generations.7
20. Inequality is observed in many
forms beyond income differences,
including exclusion from job
opportunities. Over 200 million people
around the world are unemployed, with
youth and long-term unemployment at
alarming levels in many countries (Figure
11). Income inequality is also strongly
associated with gender-based inequality
on multiple dimensions—for example,
gender gaps in economic participation
(Figure 12), as well as gender gaps in
education, health and financial access,
specifically in EMDEs (see below).
Figure 11. Development in World Employment, 2007–2014
(Employment, % of working-age population) (Youth unemployment, % of youth labor force)
Sources: Figure from IMF (2013) using data from ILO; and IMF staff calculations
7 See Corak (2013), World Bank (2005), and Bourguignon, Ferreira, and Menéndez (2007).
60.0
60.2
60.4
60.6
60.8
61.0
61.2
61.4
2007 2008 2009 2010 2011 2012 2013 2014
11.4
11.6
11.8
12
12.2
12.4
12.6
12.8
13
2007 2008 2009 2010 2011 2012 2013 2014
Figure 10. Income Inequality and
Social Mobility
Source: IMF (2013).
1/ A high elasticity signifies a strong relationship between the
incomes of parents and children.
FOSTERING INCLUSIVE GROWTH
18 INTERNATIONAL MONETARY FUND
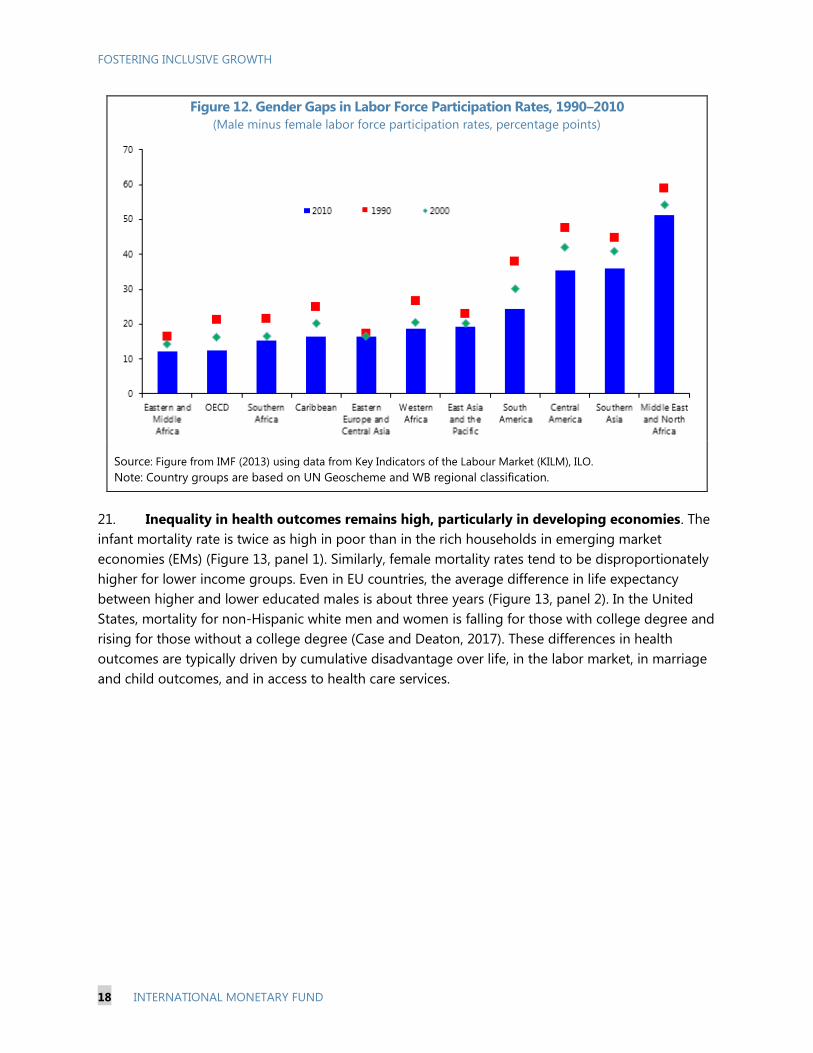
Figure 12. Gender Gaps in Labor Force Participation Rates, 1990–2010
(Male minus female labor force participation rates, percentage points)
Source: Figure from IMF (2013) using data from Key Indicators of the Labour Market (KILM), ILO.
Note: Country groups are based on UN Geoscheme and WB regional classification.
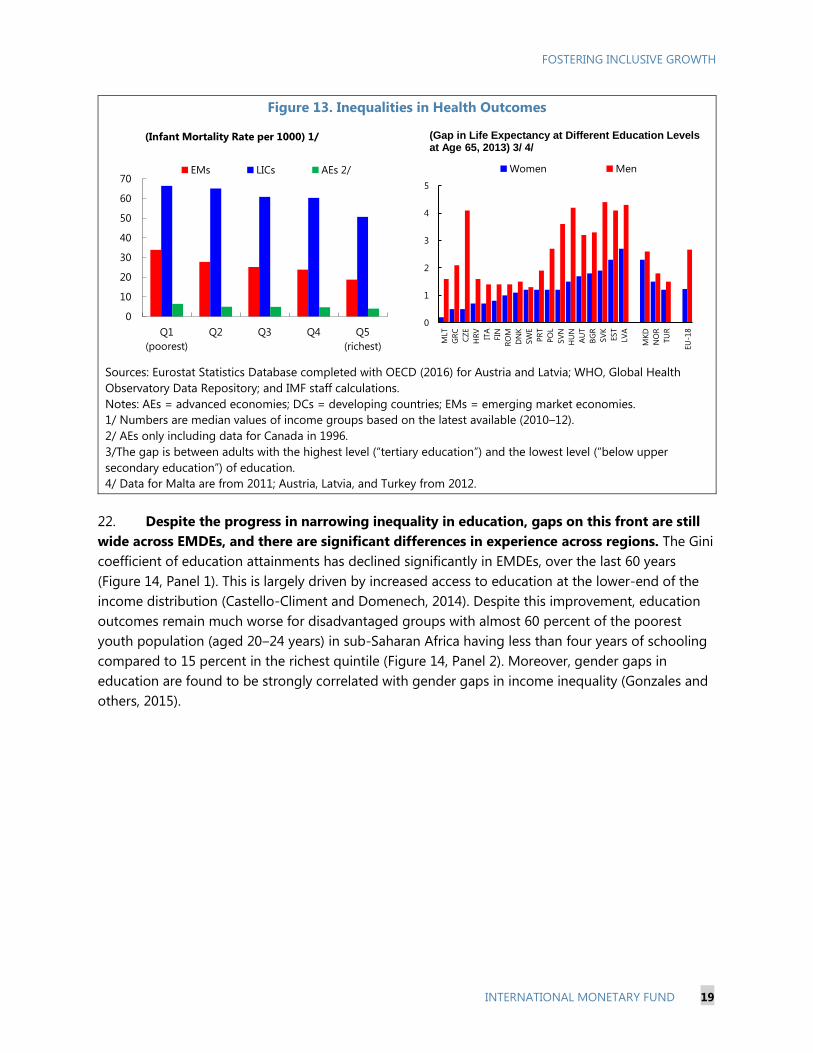
21. Inequality in health outcomes remains high, particularly in developing economies. The
infant mortality rate is twice as high in poor than in the rich households in emerging market
economies (EMs) (Figure 13, panel 1). Similarly, female mortality rates tend to be disproportionately
higher for lower income groups. Even in EU countries, the average difference in life expectancy
between higher and lower educated males is about three years (Figure 13, panel 2). In the United
States, mortality for non-Hispanic white men and women is falling for those with college degree and
rising for those without a college degree (Case and Deaton, 2017). These differences in health
outcomes are typically driven by cumulative disadvantage over life, in the labor market, in marriage
and child outcomes, and in access to health care services.
FOSTERING INCLUSIVE GROWTH
INTERNATIONAL MONETARY FUND 19
Figure 13. Inequalities in Health Outcomes
Sources: Eurostat Statistics Database completed with OECD (2016) for Austria and Latvia; WHO, Global Health
Observatory Data Repository; and IMF staff calculations.
Notes: AEs = advanced economies; DCs = developing countries; EMs = emerging market economies.
1/ Numbers are median values of income groups based on the latest available (2010–12).
2/ AEs only including data for Canada in 1996.
3/The gap is between adults with the highest level (“tertiary education”) and the lowest level (“below upper
secondary education”) of education.
4/ Data for Malta are from 2011; Austria, Latvia, and Turkey from 2012.
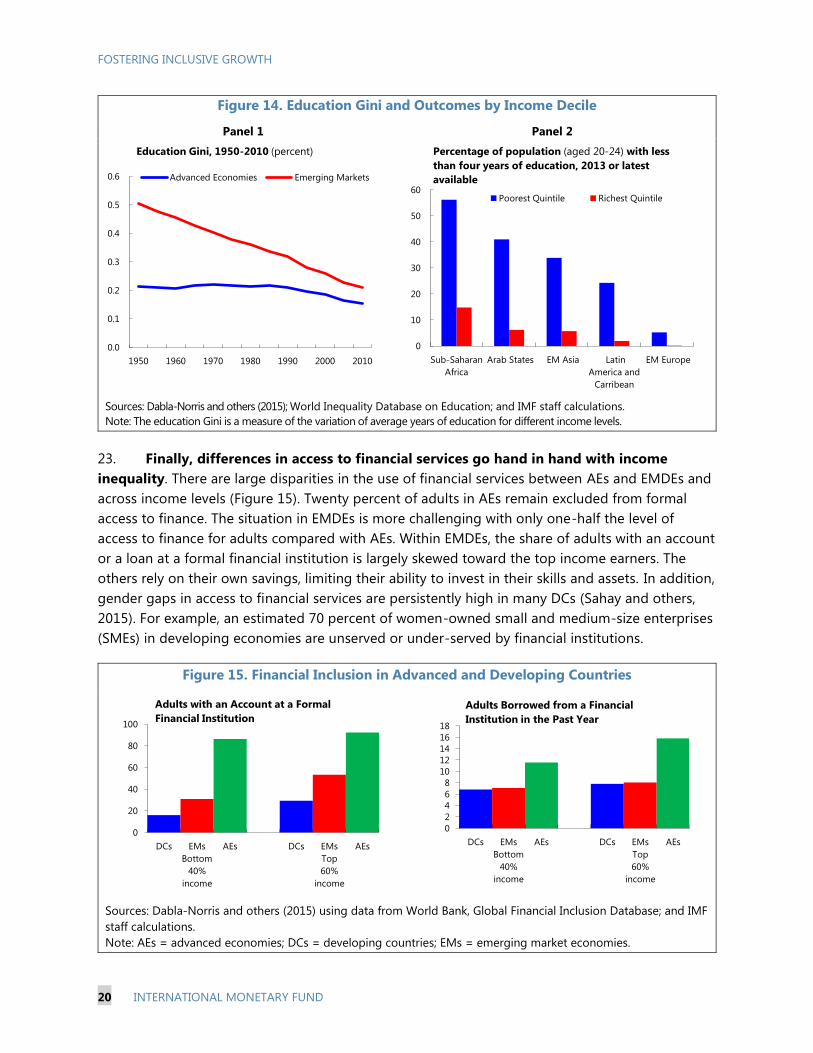
22. Despite the progress in narrowing inequality in education, gaps on this front are still
wide across EMDEs, and there are significant differences in experience across regions. The Gini
coefficient of education attainments has declined significantly in EMDEs, over the last 60 years
(Figure 14, Panel 1). This is largely driven by increased access to education at the lower-end of the
income distribution (Castello-Climent and Domenech, 2014). Despite this improvement, education
outcomes remain much worse for disadvantaged groups with almost 60 percent of the poorest
youth population (aged 20‒24 years) in sub-Saharan Africa having less than four years of schooling
compared to 15 percent in the richest quintile (Figure 14, Panel 2). Moreover, gender gaps in
education are found to be strongly correlated with gender gaps in income inequality (Gonzales and
others, 2015).
0
10
20
30
40
50
60
70
Q1
(poorest)
Q2 Q3 Q4 Q5
(richest)
EMs LICs AEs 2/
(Infant Mortality Rate per 1000) 1/
0
1
2
3
4
5
MLT
GR
C
CZ
E
HR
V
ITA
FIN
RO
M
DN
K
SW
E
PR
T
PO
L
SV
N
HU
N
AU
T
BG
R
SV
K
EST
LV
A
MK
D
NO
R
TU
R
EU
-18
Women Men
(Gap in Life Expectancy at Different Education Levelsat Age 65, 2013) 3/ 4/
FOSTERING INCLUSIVE GROWTH
20 INTERNATIONAL MONETARY FUND
Figure 14. Education Gini and Outcomes by Income Decile
Panel 1 Panel 2
Sources: Dabla-Norris and others (2015); World Inequality Database on Education; and IMF staff calculations.
Note: The education Gini is a measure of the variation of average years of education for different income levels.
23. Finally, differences in access to financial services go hand in hand with income
inequality. There are large disparities in the use of financial services between AEs and EMDEs and
across income levels (Figure 15). Twenty percent of adults in AEs remain excluded from formal
access to finance. The situation in EMDEs is more challenging with only one-half the level of
access to finance for adults compared with AEs. Within EMDEs, the share of adults with an account
or a loan at a formal financial institution is largely skewed toward the top income earners. The
others rely on their own savings, limiting their ability to invest in their skills and assets. In addition,
gender gaps in access to financial services are persistently high in many DCs (Sahay and others,
2015). For example, an estimated 70 percent of women-owned small and medium-size enterprises
(SMEs) in developing economies are unserved or under-served by financial institutions.
Figure 15. Financial Inclusion in Advanced and Developing Countries
Sources: Dabla-Norris and others (2015) using data from World Bank, Global Financial Inclusion Database; and IMF
staff calculations.
Note: AEs = advanced economies; DCs = developing countries; EMs = emerging market economies.
0.0
0.1
0.2
0.3
0.4
0.5
0.6
1950 1960 1970 1980 1990 2000 2010
Advanced Economies Emerging Markets
Education Gini, 1950-2010 (percent)
0
10
20
30
40
50
60
Sub-Saharan
Africa
Arab States EM Asia Latin
America and
Carribean
EM Europe
Poorest Quintile Richest Quintile
Percentage of population (aged 20-24) with less
than four years of education, 2013 or latest
available
0
20
40
60
80
100
DCs EMs
Bottom
40%
income
AEs DCs EMs
Top
60%
income
AEs
Adults with an Account at a Formal
Financial Institution
0
2
4
6
8
10
12
14
16
18
DCs EMs
Bottom
40%
income
AEs DCs EMs
Top
60%
income
AEs
Adults Borrowed from a Financial
Institution in the Past Year
FOSTERING INCLUSIVE GROWTH
INTERNATIONAL MONETARY FUND 21
III. INEQUALITY IN A MACROECONOMIC CONTEXT—
THE ROLE OF TECHNOLOGY, ECONOMIC
INTEGRATION AND DOMESTIC POLICIES
24. The relationship between growth and inequality is complex, and depends on a host of
underlying factors and their interlinkages that are sometimes difficult to disentangle. Some
inequality is expected in a market-based economy. However, structural factors that tend to be
associated with the level of economic development also play an important role in explaining the
underlying variation in inequality across countries.8 These include: the value-added shares of
agriculture, industry and services, the urban share of population, education levels, and demographic
patterns determined by fertility and mortality rates. Among other factors, technological growth can
generate significant payoffs to productivity but also induce higher income inequality if, for example,
improvements in technology drive up the skill premium (see below). Trends in global forces, which
go beyond country’s structural characteristics, have also mattered. Finally, the role of domestic
policies is crucially important: depending on policy design, domestic policies can aggravate or
alleviate the effects of other factors and ultimately determine whether growth is inclusive.
Technological change
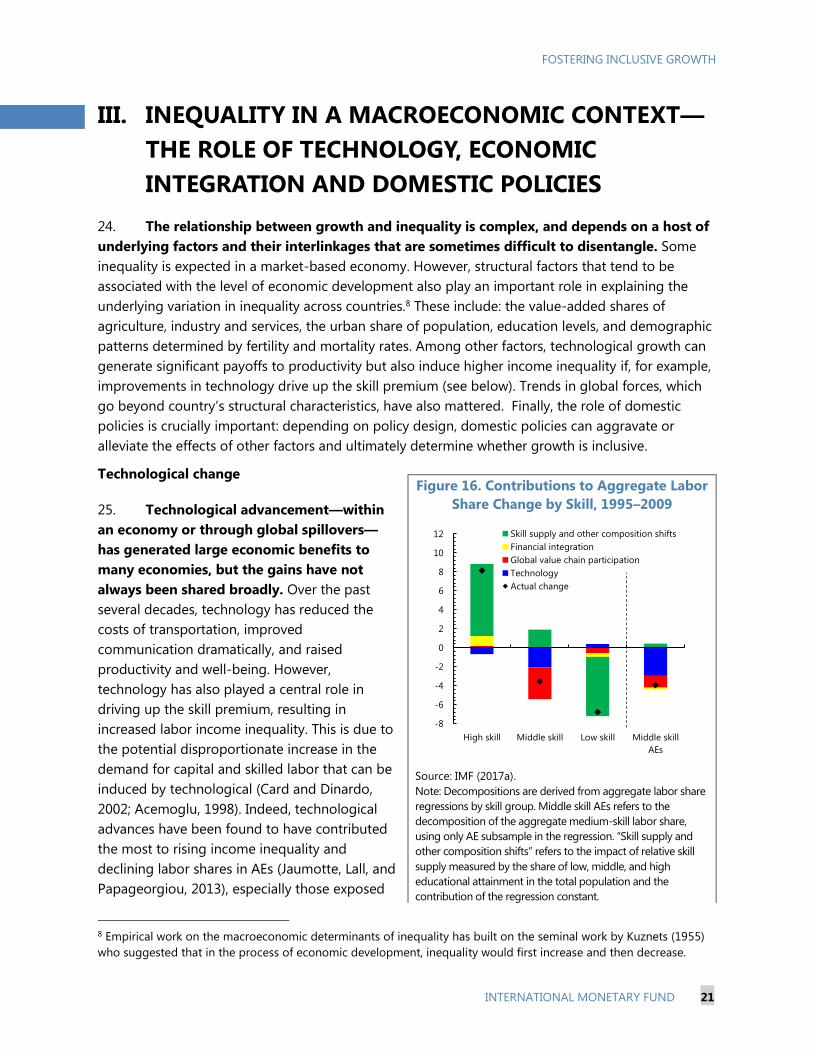
25. Technological advancement—within
an economy or through global spillovers—
has generated large economic benefits to
many economies, but the gains have not
always been shared broadly. Over the past
several decades, technology has reduced the
costs of transportation, improved
communication dramatically, and raised
productivity and well-being. However,
technology has also played a central role in
driving up the skill premium, resulting in
increased labor income inequality. This is due to
the potential disproportionate increase in the
demand for capital and skilled labor that can be
induced by technological (Card and Dinardo,
2002; Acemoglu, 1998). Indeed, technological
advances have been found to have contributed
the most to rising income inequality and
declining labor shares in AEs (Jaumotte, Lall, and
Papageorgiou, 2013), especially those exposed
8 Empirical work on the macroeconomic determinants of inequality has built on the seminal work by Kuznets (1955)
who suggested that in the process of economic development, inequality would first increase and then decrease.
Figure 16. Contributions to Aggregate Labor
Share Change by Skill, 1995–2009
Source: IMF (2017a).
Note: Decompositions are derived from aggregate labor share
regressions by skill group. Middle skill AEs refers to the
decomposition of the aggregate medium-skill labor share,
using only AE subsample in the regression. “Skill supply and
other composition shifts” refers to the impact of relative skill
supply measured by the share of low, middle, and high
educational attainment in the total population and the
contribution of the regression constant.
-8
-6
-4
-2
0
2
4
6
8
10
12
High skill Middle skill Low skill Middle skill
AEs
Skill supply and other composition shifts
Financial integration
Global value chain participation
Technology
Actual change
FOSTERING INCLUSIVE GROWTH
22 INTERNATIONAL MONETARY FUND
to a high degree of routinization in jobs, particularly middle-skilled workers (OECD, 2011; IMF,
2017a; Figure 16).9 Technology has also played a role in lowering labor income shares in some EMs
(Dabla-Norris and others, 2015; IMF, 2017a), but overall to a lesser extent than in AEs, reflecting a
smaller decline in the relative price of investment goods than in AEs, as well as a lower exposure to
routinization, which has limited labor displacement arising from routine-biased technology (see IMF,
2017a).
Economic Integration
26. The growth opportunities from global economic integration are well established, but
integration has also negatively impacted some groups of workers or communities. More
specifically:
Trade integration. By promoting competitiveness and enhancing efficiency, trade has been a
central engine of growth and poverty alleviation for many countries (IMF-WB-WTO, 2017) and
has contributed to reduce gender wage gaps (Black and Brainerd, 2004; Council of Economic
Advisers, 2015). Faijgelbaum and Khandelwal (2016) estimate a pro-poor bias of trade through
lowering prices of tradable goods such as food and beverages. Helpman (2016) finds that while
trade has not contributed substantially to within-country inequality, it has resulted in job losses
and displacements in AEs. IMF (2017a) finds for AEs, overall trade in goods and services has not
significantly affected labor shares, but participation in GVCs has. The ability of firms to adopt
labor-saving technologies and outsourcing—by moving low-skill-intensive activities abroad—
may have also played a role (Feenstra and Hanson, 1996, 1999, 2003; Elsby, Hobijn, and Sahin,
2013). Similarly, for EMDEs, increased trade flows helped increase demand and wages for the
lower-skilled workers with which they are abundantly endowed. At the same time, higher
participation in GVCs induced a reallocation of resources into more capital-intensive sectors
within EMDEs, lowering the labor share of income (Dabla-Norris and others, 2015; IMF, 2017a).
Financial integration. International financial integration can facilitate efficient international
allocation of capital and promote risk sharing, but increased capital mobility—combined with
weak macroeconomic institutions and financial supervision—can also raise vulnerability to
financial crises (Ghosh, Ostry, and Qureshi, 2016), which tend to hurt the poor disproportionately
(de Haan and Sturm, 2016). More generally, financial globalization has been found to increase
inequality in many AEs and EMDEs, particularly where financial institutions are weak and access
to credit is not inclusive (Furceri and Loungani, 2015), or where financial openness has seen an
attendant increase in the profit-wage ratio (Harrison, 2002; Furceri and Loungani, 2015; Ostry,
Berg, and Kothari, 2016; Jaumotte, Lall, and Papageorgiou, 2013). That said, financial integration
has also led to higher labor income shares in emerging markets, conceivably helped by lowering
9 Relative skill supply is measured by the share of low, middle, and high educational attainment in the total
population. The “skill supply and other composition shifts” category given by the gray bars—is the combined effect
of the impact of relative skill supply and the constant term—and therefore cannot fully identify all the idiosyncratic
factors behind trends in each group’s labor share (see IMF, 2017a for details).
FOSTERING INCLUSIVE GROWTH
INTERNATIONAL MONETARY FUND 23
the cost of capital in the context of limited substitutability between labor and capital in these
economies (IMF, 2017a).
Domestic policies
27. The relationship between domestic policies and inclusive growth depends on several
factors, such as countries’ structural characteristics, exposure to global markets, and policy
design. Thus, for example, sound and strong domestic institutions that support the rule of law,
reduce policy uncertainty and create an enabling environment for businesses can raise productivity
and the means to inclusive growth. Similarly, policies that increase competitiveness and economies’
access to global markets raise growth prospects and the basis for higher living standards. However,
inequality can still increase if growth-inducing policies do not support broad-based employment or
they displace the vulnerable. The impact is stronger for an economy with a larger share of
low-income households or with a large share of a low-productivity sector, such as agriculture.
28. Thus, carefully designed domestic policies can benefit growth and inclusion, or
otherwise generate tradeoffs. For example, generalized price controls or fuel subsidies to protect
the poor are costly and untargeted, and less conducive to efficiency and growth. On the contrary,
reforms that eliminate generalized price support boost efficiency and growth but can raise poverty
and inequality if the original measures shielded the poor to some extent. Combining the removal of
fuel subsidies with well-targeted measures to protect the poor (cash transfers, specific measures to
improve the productivity of the disadvantaged sector) can help generate more fiscal resources and
reduce inequality (Fabrizio and others, 2017). Similarly, monetary policy frameworks that support
low and stable inflation, are clearly supportive of inclusive growth because high inflation tends to
hurt the poor more (Albanesi, 2007). In addition, monetary policy that responds to economic cycles
can also have implications for income and wealth inequality depending on the quantitative
importance of different transmission channels and the structural characteristics of the economy
(Coibion and others 2012; Furceri, Loungani, and Zdzienicka, 2016). Other considerations of
domestic policy measures to foster inclusive growth are discussed in the next section.
IV. POLICIES TO ADDRESS INEQUALITY AND
MITIGATE GROWTH-EQUALITY TRADE-OFFS
29. Sustained growth is a precondition to support higher living standards and job
creation, but policies should also allow for the broad sharing of growth without affecting
economic efficiency. Macroeconomic policy frameworks that support strong growth and
macroeconomic stability are prerequisites for inclusive growth and should remain a key policy
priority. In this context, some tradeoffs in the growth-distribution nexus may be the consequence of
an efficiently functioning market economy. Indeed, some reforms may boost growth and welfare for
all with distributional consequences that may not be undesirable from an economic and/or social
point of view, while others may only benefit some and hurt others (Ostry, Berg, and Kothari, 2016;
Fabrizio and others, 2017). While the acceptable level of inequality in a country depends on such
social preferences and structural characteristics, governments concerned about the distributional
FOSTERING INCLUSIVE GROWTH
24 INTERNATIONAL MONETARY FUND
impact of reforms can adjust specific features of reform design and/or introduce targeted
accompanying measures to make pro-growth reforms more inclusive, without generating
inefficiencies that endanger growth itself.
30. That said, it is important to recognize the limitations of policy response. One obvious
constraint reflects the availability of resources or fiscal space for adequate policy response.
Alternatively, policy design may be unable to address all forms of inequality, especially when they
are triggered by persistent shocks that are concentrated in specific regions, sectors, or skills. When
distributional effects are persistent, direct fiscal policy measures may well be needed to support the
displaced to the extent possible (unemployment benefits and other basic income support). While
there is clearly no “one-size-fits-all” solution, two broad policy lessons can be offered.
31. First, implementing policies to improve economic opportunity could boost both
productivity and competitiveness, and support a broader sharing of the benefits of growth.
But it is important to recognize that payoffs from such policies will depend on not just on access but
also on the quality of underlying services (for example, health and education access or wage
subsidies to the low-income workers), and how they affect incentives, and therefore may not always
pay for themselves. Some priorities include:
Education. Reforms that promote broad-based access to education can raise productivity at all
levels and thereby occupational opportunities, access to jobs, and the level of pay (Mincer, 1958;
Becker and Chiswick, 1966). The observed polarization of jobs away from middle-skilled workers
underscores the critical role of long-term investment in education and upgrading of workers’
skills throughout their careers (IMF, 2017a). Eliminating financial barriers to higher education,
but also supporting retraining programs that allow reallocation of workers displaced by
routinization or automation of tasks are key priorities, which can also improve the income
prospects of future generations. In AEs, this implies measures to improve the quality of upper
secondary or tertiary education, and in many DCs, to promote affordable access to basic
education, but also improve the quality of education.
Health. Expanding access to health opportunities for disadvantaged groups and low-income
households allow individuals to raise their productivity, contribute to higher economic growth,
and reduced inequality (de Mello and Tiongson, 2006). Improved health care can also relieve
worker’s anxiety and improve labor market flexibility and economic efficiency (Curie 1999).
Infrastructure investment. Productive infrastructure investment boosts demand and job
creation in the short term and capital and labor productivity in the longer term. Specifically,
investment that is well targeted to support the disadvantaged (for example, specific investments
that improve the productivity of the agricultural sector in developing countries, or those that
improve the prospects for higher labor force participation of women) also helps ensure that the
benefits are more broadly shared. In this context, empirical evidence suggests that an increase in
public investment of 1 percent of GDP leads to a medium-term increase in output of about
1½ percent in AEs and ½ percent in EMDEs, and to a reduction in income inequality—measured
by the Gini coefficient—of 2½ percentage points in EMDEs (Furceri and Li, forthcoming).
Investment efficiency also matters—public investment may not help reduce income inequality
FOSTERING INCLUSIVE GROWTH
INTERNATIONAL MONETARY FUND 25
where public investment efficiency is weak (see Fabrizio and others, 2017 for LIDCs).
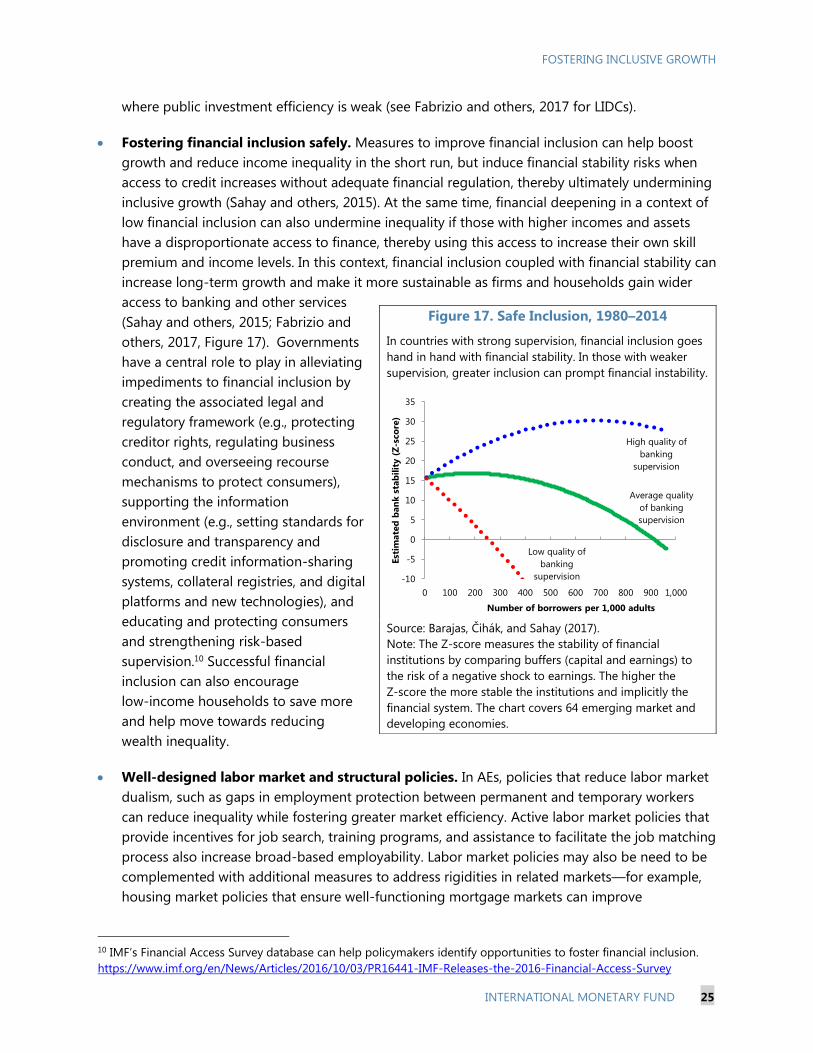
Fostering financial inclusion safely. Measures to improve financial inclusion can help boost
growth and reduce income inequality in the short run, but induce financial stability risks when
access to credit increases without adequate financial regulation, thereby ultimately undermining
inclusive growth (Sahay and others, 2015). At the same time, financial deepening in a context of
low financial inclusion can also undermine inequality if those with higher incomes and assets
have a disproportionate access to finance, thereby using this access to increase their own skill
premium and income levels. In this context, financial inclusion coupled with financial stability can
increase long-term growth and make it more sustainable as firms and households gain wider
access to banking and other services
(Sahay and others, 2015; Fabrizio and
others, 2017, Figure 17). Governments
have a central role to play in alleviating
impediments to financial inclusion by
creating the associated legal and
regulatory framework (e.g., protecting
creditor rights, regulating business
conduct, and overseeing recourse
mechanisms to protect consumers),
supporting the information
environment (e.g., setting standards for
disclosure and transparency and
promoting credit information-sharing
systems, collateral registries, and digital
platforms and new technologies), and
educating and protecting consumers
and strengthening risk-based
supervision.10 Successful financial
inclusion can also encourage
low-income households to save more
and help move towards reducing
wealth inequality.
Well-designed labor market and structural policies. In AEs, policies that reduce labor market
dualism, such as gaps in employment protection between permanent and temporary workers
can reduce inequality while fostering greater market efficiency. Active labor market policies that
provide incentives for job search, training programs, and assistance to facilitate the job matching
process also increase broad-based employability. Labor market policies may also be need to be
complemented with additional measures to address rigidities in related markets—for example,
housing market policies that ensure well-functioning mortgage markets can improve
10 IMF’s Financial Access Survey database can help policymakers identify opportunities to foster financial inclusion.
https://www.imf.org/en/News/Articles/2016/10/03/PR16441-IMF-Releases-the-2016-Financial-Access-Survey
Figure 17. Safe Inclusion, 1980–2014
In countries with strong supervision, financial inclusion goes
hand in hand with financial stability. In those with weaker
supervision, greater inclusion can prompt financial instability.
Source: Barajas, Čihák, and Sahay (2017).
Note: The Z-score measures the stability of financial
institutions by comparing buffers (capital and earnings) to
the risk of a negative shock to earnings. The higher the
Z-score the more stable the institutions and implicitly the
financial system. The chart covers 64 emerging market and
developing economies.
-10
-5
0
5
10
15
20
25
30
35
0 100 200 300 400 500 600 700 800 900 1,000
Est
imate
d b
an
k s
tab
ilit
y (
Z-s
co
re)
Number of borrowers per 1,000 adults
High quality of
banking
supervision
Low quality of
banking
supervision
Average quality
of banking
supervision
FOSTERING INCLUSIVE GROWTH
26 INTERNATIONAL MONETARY FUND
geographical mobility; similarly, well-targeted regional policies can cushion specific regions that
are adversely hit by changes in the economy (see IMF-WB-WTO, 2017). Hiring and wage
subsidies can also be effective in boosting employment, particularly when targeted to low-wage
workers or to youth (IMF, 2012). However, these and other measures such as unemployment
benefits and income support need to be carefully designed to limit moral hazard and induce
lifelong learning. Indeed, the evidence on the effectiveness of wage subsidies in improving
labor market outcomes is mixed and points to the risks of such programs becoming net costs
(IMF-WB-WTO, 2017). In many DCs, policies that lower informality are key. Measures to improve
legal and property rights that give more security to households and individuals encourage labor
mobility, reduce informality and support inclusive growth (Fabrizio and others, 2017).
Fostering women’s participation in economic activities. Inequality in opportunities also has
a gender dimension, and solutions therefore require addressing these gender gaps. Depending
on countries’ development levels, policy measures include: (i) removing tax provisions that
discriminate against secondary earners, a regular feature in many AEs; (ii) increasing access to
flexible work arrangements, and facilitating transition from part-time work to full-time work;
(iii) fostering gender parity in access to health services, school education, vocational training, as
well as finance including digital financial inclusion (Aslan and others, forthcoming); (iv) better
child care; and (v) promoting equal rights for women to participate in property ownership and
entrepreneurship, possibly through changes in family law and inheritance legislation.
32. Second, when there are implicit tradeoffs in efficiency-increasing economic reforms,
the focus needs to be on identifying the tradeoffs and bolstering reforms with accompanying
measures that improve the inclusiveness of the overall policy package. In this context, the
design of fiscal policy is crucial. All outlays to improve access to economic opportunities (education,
health), and direct support to those displaced (for example, wage subsidies) have a direct short-term
fiscal cost, which can be partly offset by higher revenue through higher potential growth when
policies also help boost productivity or improve economic efficiency, but may not always pay for
themselves. Similarly, policy packages that improve the efficiency of public spending while
protecting the low-productivity sector (for example tax reform to raise domestic revenues combined
with infrastructure spending in the agricultural sector to raise agricultural productivity) can also have
upfront costs and need to be recognized in the budgetary process. Fiscal policy also plays a role
through other well designed safety net programs or specific measures to address demographic
challenges including aging (Clements and others, 2015; Ostry, Berg, and Tsangarides, 2014; Obstfeld,
2016; IMF, 2017c). Similarly, trampoline policies, such as job counseling and retraining can help
people adjust faster to structural transformation of the economy and reduce unemployment spells
and skill depreciations.
33. Fiscal policy design can be further strengthened to improve the growth-inclusion
relationship and mitigate tradeoffs. In many AEs, the already strong role of fiscal policy can be
reinforced by greater reliance on wealth and property taxes, more progressive income taxation, and
better targeting of social benefits (Bastagli, Coady, and Gupta, 2012; Clements and others, 2015). In
addition, reducing tax expenditures that benefit high-income groups would reduce inequality and
free budget resources for productive spending or cuts in marginal labor income taxes (OECD, 2015).
FOSTERING INCLUSIVE GROWTH
INTERNATIONAL MONETARY FUND 27
For EMDEs, improved revenue mobilization is a key priority for financing pro-growth reforms and
development spending (Bastagli, Coady, and Gupta, 2012; Fabrizio and others, 2017).
V. THE IMF’S SUPPORT FOR COUNTRIES IN ENHANCING
INCLUSIVE GROWTH
34. A key objective under the Fund’s mandate is to promote sustainable growth, which
can be achieved by fostering inclusiveness. The IMF supports a cooperative and mutually
reinforcing multilateral framework that helps ensure that countries operate in a level playing field
and policy actions support a balanced and robust growth in global trade. Working within the
multilateral framework, countries should strive for strong and more balanced growth and to provide
economic opportunities for all (see IMF, 2017d). To this end, countries need to anticipate the effects
of economic reforms, technological progress and economic integration, equip their populations with
tools to reap the benefits, and put in place domestic policies to share them more broadly. The Fund
will continue to assist members through carefully tailored policy advice, lending to smooth
adjustment, and capacity development that supports economic growth and poverty reduction with
economic and financial stability such that growth is sustained for present and future generations.
35. In this context, understanding the drivers of inequality and how they relate to
sustained and inclusive growth, has been an important focus of the IMF’s work. Poverty
reduction and inclusive growth are key foci of the Fund’s engagement with all its country members.
The attention to inclusive growth has been enforced by the evidence of feedback from income
inequality to the strength and sustainability of growth. The IMF’s work on inclusion involves not only
deeper analysis on inclusive growth issues, but also efforts to bring the analysis closer to Fund
surveillance and operational work.
36. The Fund’s analytical work has examined the causes and consequences of inequality,
as well better approaches to designing policies, including redistributive fiscal policies, to limit
inferior tradeoffs between growth and income distribution.11 Recent work focuses on the factors
underlying the declining trends in labor income shares, and policies to enable the gains from trade
integration to be more broadly shared (IMF, 2017a, 2017b). Several country-specific or cross-country
and regional studies also focus on structural reforms and options for strengthening inclusive growth
(Aiyar and others, 2013, Aoyagi and Ganelli, 2015, and Aoyagi, Ganelli, and Murayama, 2015). Policy
analysis has also been deepened on other aspects of inclusive growth such as gender and financial
inclusion, given their strong links with income inequality. Ongoing Fund work examining the effects
of financial technology and trends and implications of correspondent banking relationships (see
IMF, forthcoming (a), and IMF, 2017e) aims to better understand how member countries can best
11 The Fund’s interest in understanding inequality is long-standing (IMF, 2007). Some studies have examined the
adverse consequences of high inequality on the pace and sustainability of growth and macroeconomic stability
(Ostry, Berg, and Tsangarides, 2014; Dabla-Norris and others, 2015), and the importance of redistributive fiscal
policies to address growth-inequality tradeoffs (Clements and others, 2015). Fabrizio and others (2017) highlight the
channels through which pro-growth policies can give rise to higher inequality and the design of reform packages to
reduce growth-equality trade-offs in developing countries.
FOSTERING INCLUSIVE GROWTH
28 INTERNATIONAL MONETARY FUND
take advantage of correspondent banking relationships, and promote greater resilience to their
withdrawal (where this is an issue) through legal and supervisory measures that can ensure both
financial stability and inclusion.
37. The analysis on inclusive growth issues is also informing the Fund’s policy dialogue
with member countries where they are of macroeconomic relevance. In a pilot initiative that
started in 2015, inequality issues were addressed as one element of the Fund’s operational policy
advice for several countries; a second wave of pilots is now underway (Box 1; Annex I). For many of
these countries, the focus is on better designing macroeconomic, macro-financial and
macrostructural reform packages that can be attractive from both growth and distribution
perspectives. The IMF is also reviewing the experience with social safeguards to support the poor
and vulnerable under PRGT and PSI-supported Fund programs with low income countries with a
view to drawing lessons on best practices (IMF, forthcoming (b)). The IMF’s guiding framework for
identifying and prioritizing structural reforms (IMF, 2016c, 2017f) is now being applied to 33 case
studies where macrostructural issues will be fully operationalized in surveillance. The IMF has also
been active in operationalizing its work on financial inclusion into surveillance and policy work.
38. The IMF’s capacity building and technical assistance work to achieve more inclusive
growth has also expanded. In collaboration with member countries to foster correspondent
banking relationships the Fund is working to promote financial access along with efforts to improve
financial risk mitigation and strengthen financial stability (IMF, 2017e). A key component of the
Fund’s technical assistance on fiscal policy is on the design of expenditure policies that support
inclusive growth. More recently the Fund staff has proposed a framework—drawing on several
preexisting and new technical tools—that can better inform assessments of fiscal space in member
countries (IMF, 2017g), and therefore shed light on the ability of countries to mobilize the resources
needed to catalyze more inclusive growth. The IMF has also strengthened surveillance on issues
related to financial inclusion. The IMF Financial Access Survey, launched in 2009, is a key source of
data on access to and use of financial services around the world, providing insights on the
availability and use of financial products such as deposit accounts, loans, and insurance policies by
individuals and firms across the globe.
39. Going forward, the Fund will deepen these efforts. With growing evidence underscoring
that inclusion and growth do not always automatically go together, the IMF will seek to strengthen
its understanding of the channels through which policies impact growth and its inclusiveness,
whether the growth-inclusion trade-off becomes less favorable under specific conditions, and how
to better design policy packages that can catalyze strong and sustained growth while mitigating
adjustment costs as much as possible.
FOSTERING INCLUSIVE GROWTH
INTERNATIONAL MONETARY FUND 29
Box 1. Operationalizing the IMF’s Work on Inclusion
To support surveillance and program discussions, the IMF has stepped up efforts to operationalize its work on
inclusive growth. As part of a pilot initiative on inequality and gender that started in 2015, inequality and gender inclusion
issues have been systematically included in policy discussions in countries where these issues are seen to be
macroeconomically relevant. Following the completion of a first wave of pilots with 22 countries, a second wave of 31 pilots is
now underway.
On income inequality, the pilot studies focus on issues such as the growth-inequality tradeoffs in reform packages and
options to increase the traction of reforms from both growth and distributional perspectives; regional income inequality; and
comparative analysis of inequality and poverty outcomes. Some country examples include:
United States (2016 Article IV consultation). The decline in the labor share of income, which began to accelerate in
2000, coupled with skill-biased technological progress in both services and manufacturing, has contributed to a
shrinking of the share of the population in middle-income jobs and a broader polarization of the income distribution. In
parallel, there has been a steady increase in poverty in the United States. Thus, staff recommended raising productivity
and bridging the skill divide, including through prioritizing spending for vocational and early childhood education.
Poland (2016 Article IV consultation). The analysis showed that despite strong growth and steady income convergence
with the EU in the last two decades, income disparities persist at the regional level, which could be reduced by boosting
economic performance in lagging regions. Policy advice focused on measures that supported structural transformation in
the east, facilitated labor mobility, and attracted foreign direct investment (FDI) to less productive regions.
Ethiopia (2015 Article IV consultation). Using a model-based framework, staff analysis showed that fiscal and financial
sector reforms for increasing private sector participation and developing the manufacturing sector could have regressive
outcomes from a distributional standpoint even as growth would strengthen. Thus, staff recommended adjusting the
design of reform package to increase financial service access and complementing it with measures to increase labor
mobility and advance economic transformation. An expansion of the cash transfers was recommended for immediate
support to the most vulnerable.
For many of the inequality pilots, staff has developed a micro-founded analytical framework, customized to countries’
key macroeconomic features and micro characteristics to better understand the economic and distributional impacts of
reform packages and the transmission channels. The framework has been applied to inform policy discussions in many
low-income countries (LICs) (Malawi, Myanmar, Uganda), and is being customized for other types of economies (e.g., Brazil,
United States).
On gender, analyses have examined potential barriers to female labor force participation in countries at different levels of
development and the impact of specific reforms and policies on gender inequality. Examples include:
Austria (2016 Article IV consultation). Staff analysis suggest that increasing female labor force participation could help
cushion the impact of demographic change. It showed that a decline in female part-time work to a level in line with
other OECD advanced economies (with male part-time work unchanged) and a corresponding increase in full-time
employment would raise full-time equivalent employment in Austria by almost 3 percent, ceteris paribus. Staff
recommended increasing child care and elder care availability.
India (2017 Article IV consultation). Staff analysis suggested that improving access to sanitation is essential for raising
gender equality and economic growth. Key recommendations to increase female labor force participation and
employment in the formal sector included investing in infrastructure and gender-targeted skills training, strengthening
various gender-specific labor laws, and enhancing the implementation and awareness of females’ land inheritance rights
and financial literacy programs.
Mali (2016 Article IV consultation). Staff highlighted gaps in education and changing demographics as the main
constraints to female labor force participation. Recommendation included expanding education spending and training
programs for girls and women, as well as closing the gap between the demand for and the provision of contraception
To help enhance the role of fiscal policy in addressing gender inequality, the IMF has recently completed a study on
gender budgeting efforts in 23 countries with significant initiatives. It identified several countries with legally mandated
gender budgeting efforts (e.g. Austria, Iceland, India, Korea, and Mexico). Main lessons suggest that, to boost female labor
force participation, advanced countries could use individual taxation, increased parental leave and child care, and, in public
employment, encourage equal employment opportunities/wages and possibly introduce quotas. Concerning LIDCs, gender
budgeting efforts should focus on education, health, and infrastructure spending to reduce gender inequality. Details of this
work are provided in a series of working papers and a publicly available toolkit.
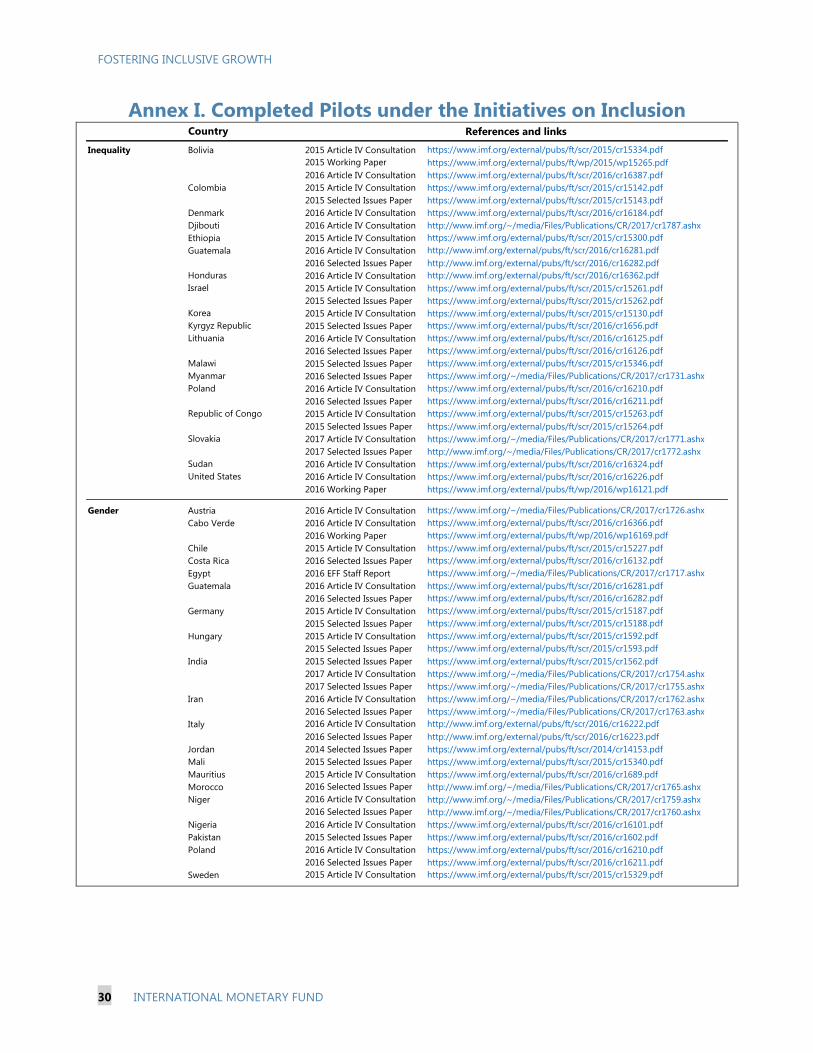
FOSTERING INCLUSIVE GROWTH
30 INTERNATIONAL MONETARY FUND
Annex I. Completed Pilots under the Initiatives on Inclusion
Country
Inequality Bolivia 2015 Article IV Consultation https://www.imf.org/external/pubs/ft/scr/2015/cr15334.pdf
2015 Working Paper https://www.imf.org/external/pubs/ft/wp/2015/wp15265.pdf
2016 Article IV Consultation https://www.imf.org/external/pubs/ft/scr/2016/cr16387.pdf
Colombia 2015 Article IV Consultation https://www.imf.org/external/pubs/ft/scr/2015/cr15142.pdf
2015 Selected Issues Paper https://www.imf.org/external/pubs/ft/scr/2015/cr15143.pdf
Denmark 2016 Article IV Consultation https://www.imf.org/external/pubs/ft/scr/2016/cr16184.pdf
Djibouti 2016 Article IV Consultation http://www.imf.org/~/media/Files/Publications/CR/2017/cr1787.ashx
Ethiopia 2015 Article IV Consultation https://www.imf.org/external/pubs/ft/scr/2015/cr15300.pdf
Guatemala 2016 Article IV Consultation http://www.imf.org/external/pubs/ft/scr/2016/cr16281.pdf
2016 Selected Issues Paper http://www.imf.org/external/pubs/ft/scr/2016/cr16282.pdf
Honduras 2016 Article IV Consultation http://www.imf.org/external/pubs/ft/scr/2016/cr16362.pdf
Israel 2015 Article IV Consultation https://www.imf.org/external/pubs/ft/scr/2015/cr15261.pdf
2015 Selected Issues Paper https://www.imf.org/external/pubs/ft/scr/2015/cr15262.pdf
Korea 2015 Article IV Consultation https://www.imf.org/external/pubs/ft/scr/2015/cr15130.pdf
Kyrgyz Republic 2015 Selected Issues Paper https://www.imf.org/external/pubs/ft/scr/2016/cr1656.pdf
Lithuania 2016 Article IV Consultation https://www.imf.org/external/pubs/ft/scr/2016/cr16125.pdf
2016 Selected Issues Paper https://www.imf.org/external/pubs/ft/scr/2016/cr16126.pdf
Malawi 2015 Selected Issues Paper https://www.imf.org/external/pubs/ft/scr/2015/cr15346.pdf
Myanmar 2016 Selected Issues Paper https://www.imf.org/~/media/Files/Publications/CR/2017/cr1731.ashx
Poland 2016 Article IV Consultation https://www.imf.org/external/pubs/ft/scr/2016/cr16210.pdf
2016 Selected Issues Paper https://www.imf.org/external/pubs/ft/scr/2016/cr16211.pdf
Republic of Congo 2015 Article IV Consultation https://www.imf.org/external/pubs/ft/scr/2015/cr15263.pdf
2015 Selected Issues Paper https://www.imf.org/external/pubs/ft/scr/2015/cr15264.pdf
Slovakia 2017 Article IV Consultation https://www.imf.org/~/media/Files/Publications/CR/2017/cr1771.ashx
2017 Selected Issues Paper http://www.imf.org/~/media/Files/Publications/CR/2017/cr1772.ashx
Sudan 2016 Article IV Consultation https://www.imf.org/external/pubs/ft/scr/2016/cr16324.pdf
United States 2016 Article IV Consultation https://www.imf.org/external/pubs/ft/scr/2016/cr16226.pdf
2016 Working Paper https://www.imf.org/external/pubs/ft/wp/2016/wp16121.pdf
Gender Austria 2016 Article IV Consultation https://www.imf.org/~/media/Files/Publications/CR/2017/cr1726.ashx
Cabo Verde 2016 Article IV Consultation https://www.imf.org/external/pubs/ft/scr/2016/cr16366.pdf
2016 Working Paper https://www.imf.org/external/pubs/ft/wp/2016/wp16169.pdf
Chile 2015 Article IV Consultation https://www.imf.org/external/pubs/ft/scr/2015/cr15227.pdf
Costa Rica 2016 Selected Issues Paper https://www.imf.org/external/pubs/ft/scr/2016/cr16132.pdf
Egypt 2016 EFF Staff Report https://www.imf.org/~/media/Files/Publications/CR/2017/cr1717.ashx
Guatemala 2016 Article IV Consultation https://www.imf.org/external/pubs/ft/scr/2016/cr16281.pdf
2016 Selected Issues Paper https://www.imf.org/external/pubs/ft/scr/2016/cr16282.pdf
Germany 2015 Article IV Consultation https://www.imf.org/external/pubs/ft/scr/2015/cr15187.pdf
2015 Selected Issues Paper https://www.imf.org/external/pubs/ft/scr/2015/cr15188.pdf
Hungary 2015 Article IV Consultation https://www.imf.org/external/pubs/ft/scr/2015/cr1592.pdf
2015 Selected Issues Paper https://www.imf.org/external/pubs/ft/scr/2015/cr1593.pdf
India 2015 Selected Issues Paper https://www.imf.org/external/pubs/ft/scr/2015/cr1562.pdf
2017 Article IV Consultation https://www.imf.org/~/media/Files/Publications/CR/2017/cr1754.ashx
2017 Selected Issues Paper https://www.imf.org/~/media/Files/Publications/CR/2017/cr1755.ashx
Iran 2016 Article IV Consultation https://www.imf.org/~/media/Files/Publications/CR/2017/cr1762.ashx
2016 Selected Issues Paper https://www.imf.org/~/media/Files/Publications/CR/2017/cr1763.ashx
Italy 2016 Article IV Consultation http://www.imf.org/external/pubs/ft/scr/2016/cr16222.pdf
2016 Selected Issues Paper http://www.imf.org/external/pubs/ft/scr/2016/cr16223.pdf
Jordan 2014 Selected Issues Paper https://www.imf.org/external/pubs/ft/scr/2014/cr14153.pdf
Mali 2015 Selected Issues Paper https://www.imf.org/external/pubs/ft/scr/2015/cr15340.pdf
Mauritius 2015 Article IV Consultation https://www.imf.org/external/pubs/ft/scr/2016/cr1689.pdf
Morocco 2016 Selected Issues Paper http://www.imf.org/~/media/Files/Publications/CR/2017/cr1765.ashx
Niger 2016 Article IV Consultation http://www.imf.org/~/media/Files/Publications/CR/2017/cr1759.ashx
2016 Selected Issues Paper http://www.imf.org/~/media/Files/Publications/CR/2017/cr1760.ashx
Nigeria 2016 Article IV Consultation https://www.imf.org/external/pubs/ft/scr/2016/cr16101.pdf
Pakistan 2015 Selected Issues Paper https://www.imf.org/external/pubs/ft/scr/2016/cr1602.pdf
Poland 2016 Article IV Consultation https://www.imf.org/external/pubs/ft/scr/2016/cr16210.pdf
2016 Selected Issues Paper https://www.imf.org/external/pubs/ft/scr/2016/cr16211.pdf
Sweden 2015 Article IV Consultation https://www.imf.org/external/pubs/ft/scr/2015/cr15329.pdf
References and links
FOSTERING INCLUSIVE GROWTH
INTERNATIONAL MONETARY FUND 31
References
Acemoglu, D., 1998, “Why Do New Technologies Complement Skills? Directed Technical Change and
Wage Inequality,” Quarterly Journal of Economics, Vol. 113, No. 4, pp. 1055–89,
doi:10.1162/003355398555838.
Aiyar, S., R. Duval, D. Puy, Y. Wu, and L. Zhang, 2013, “Growth Slowdowns and the Middle-Income
Trap,” IMF Working Paper 13/71 (Washington: International Monetary Fund).
Albanesi, S., 2007, "Inflation and Inequality," Journal of Monetary Economics, Vol. 54, No. 4,
pp. 1088-1114.
Alesina, A., and D. Rodrik, 1994, “Distributive Politics and Economic Growth,” Quarterly Journal of
Economics, Vol. 109, No. 2, pp. 465–90, doi:10.2307/2118470.
Alvaredo, F., A. B. Atkinson, T. Piketty, and E. Saez, 2013, “The Top 1 Percent in International and
Historical Perspective,” Journal of Economic Perspectives, Vol. 27, No. 3, pp. 3-20,
doi:10.1257/jep.27.3.3.
Aslan G., C. Delechat, M. Newiak, and F. Yang, forthcoming, “Inequality in Financial Inclusion, Gender
Gaps, and Income Inequality,” IMF Working Paper (Washington: International Monetary Fund).
Aoyagi, C., G. Ganelli, 2015, “Asia’s Quest for Inclusive Growth Revisited,” IMF Working Paper. No.
15/42, also published in Journal of Asian Economics, October 2015, Vol. 40(C), pp. 29-46.
––––––––––, C., G. Ganelli, and K. Murayama, 2015, “How Inclusive is Abenomics,” IMF Working
Paper. No. 15/54, also published in Journal of International Commerce, Economics and Policy,
Vol. 07, Issue 01, February (2016)).
Banerjee, A., 2004, “Inequality and Investment.” Available on the internet at
economics.mit.edu/files/514 (Cambridge: MIT Press).
Barajas, A., M. Čihák, and R. Sahay, 2017, “A Broader Reach,” IMF Finance and Development, Vol. 54, No. 1.
Bastagli, F., D. Coady, and S. Gupta., 2012, “Income Inequality and Fiscal Policy,” IMF Staff Discussion
Note 12/08 (Washington: International Monetary Fund).
Bean, C, and C. Pissarides, 1993, “Unemployment, Consumption and Growth,” European Economic
Review, Vol. 37, No. 4, 837-854, doi:10.1016/0014-2921(93)90093-p.
Becker, G. S., and B. R. Chiswick, 1966, “Education and the Distribution of Earnings,” American
Economic Review, 56 (1/2): 358–69.
Bell, D., and D. Blanchflower, 2015, “Youth Unemployment in Greece: Measuring the Challenge,” IZA
Journal of European Labor Studies, Vol. 4, No. 1, pp. 1–25, doi:10.1186/2193-9012-4-1.
Berg, A., and J. Ostry, 2011, “Inequality and Unsustainable Growth: Two Sides of the Same Coin?”
FOSTERING INCLUSIVE GROWTH
32 INTERNATIONAL MONETARY FUND
IMF Staff Discussion Note 11/08 (Washington: International Monetary Fund).
Black, S. E., and Brainerd, E., 2004, “Importing Equality? The Impact of Globalization on Gender
Discrimination,” Industrial and Labor Review, Vol. 57.
Bourguignon, F., F. Ferreira, and M. Menéndez, 2007, “Inequality of Opportunity in Brazil,” Review of
Income and Wealth, Vol. 53, pp. 585–618.
Brunori, P., F., Ferreira, and V., Peragine, 2013, “Inequality of Opportunity, Income Inequality, and
Economic Mobility” Some International Comparisons,” Institute of the Study of Labor (IZA)
Discussion Paper No. 7155 (Bonn, Germany).
Card, D., and J. E. DiNardo, 2002, “Skill Biased Technological Change and Rising Wage Inequality:
Some Problems and Puzzles,” NBER Working Paper No. 8769 (Cambridge, Massachusetts:
National Bureau of Economic Research).
Case, A., and A., Deaton, 2017, “Mortality and Morbidity in the 21st Century,” Paper presented at the
Brookings Papers on Economic Activity Conference, March 23-24, 2017.
Castello-Climent, A. and R. Domenech, 2014, “Capital and Income Inequality: Some Facts and Some
Puzzles,” update of WP 12/28 published in October 2012, BBVA Bank Working Paper 1228.
(Madrid, Spain: BBVA Bank).
Clements, B., R. de Mooij, S. Gupta, and M. Keen, 2015, Inequality and Fiscal Policy (Washington:
International Monetary Fund).
Coibion, O., Y. Gorodnichenko, L. Kueng and J. Silvia, 2012, “Innocent Bystanders? Monetary Policy
and Inequality in the U.S.,” NBER Working Paper 18170 (Cambridge, Massachusetts: National
Bureau of Economic Research).
Council of Economic Advisers (CEA), 2015, Economic Report of the President, 2015. United States.
Corak, M., 2013, “Income Inequality, Equality of Opportunity, and Intergenerational Mobility,” Journal
of Economic Perspectives, Vol. 27, No. 3, pp. 79–102.
Curie, J., 1999, “Health, Health Insurance and the Labor Market” Chapter 50, in Handbook of Labor
Economics (Elsevier).
Dabla-Norris, E., K. Kochhar, N. Suphaphiphat, F. Ricka, and E. Tsounta, 2015, “Causes and
Consequences of Income Inequality: A Global Perspective,” IMF Staff Discussion Note 15/13
(Washington: International Monetary Fund).
de Haan, J., and J. Sturm, 2016, “Finance and Income Inequality: A Review and New Evidence,” CESifo
Working Paper Series No. 6079.
de Mello, L., and E. R. Tiongson, 2006, “Income Inequality and Redistributive Government Spending,”
FOSTERING INCLUSIVE GROWTH
INTERNATIONAL MONETARY FUND 33
Public Finance Review, Vol. 34, No. 3, pp. 282–305.
Elsby, M., B. Hobijn, and A. Sahin, 2013, “The Decline of the U.S. Labor Share,” Working Paper Series
2013-27 (San Francisco: Federal Reserve Bank of San Francisco).
Fabrizio, S., D. Furceri, R. Garcia-Verdu, B. Li, S. V. Lizarazo, M. Mendes Tavares, F. Narita, and
A. Peralta-Alva, 2017, “Macro-Structural Policies and Income Inequality in Low-Income
Developing Countries,” IMF Staff Discussion Note 17/01 (Washington: International Monetary
Fund).
Faijgelbaum, P. and A. Khandelwal, 2016. “Measuring the Unequal Gains from Trade,” Quarterly
Journal of Economics, Vol. 131.
Feenstra, R. C., and G. H. Hanson, 1996, “Foreign Investment, Outsourcing and Relative Wages,” in
The Political Economy of Trade Policy: Papers in Honor of Jagdish Bhagwati, ed. by R.C. Feenstra,
G.M. Grossman, and D.A. Irwin, pp. 89-127 (Cambridge: MIT Press).
––––––––––––, 1999, “Productivity Measurement and the Impact of Trade and Technology on Wages:
Estimates for the U.S., 1972-1990,” Quarterly Journal of Economics, Vol. 114, No. 3, pp. 907-940.
––––––––––––, 2003, “Global Production Sharing and Rising Inequality: A Survey of Trade and
Wages,” in Handbook of International Trade, ed. by K. Choi and J. Harrigan (Oxford: Blackwell
Publishing).
Furceri, D., and P. Loungani, 2015, “Capital Account Liberalization and Inequality,” IMF Working
Paper 15/243 (Washington: International Monetary Fund).
__________, P. Loungani and A. Zdzienicka, 2016, “The Effects of Monetary Policy Shocks on
Inequality,” IMF Working Paper 16/245 (Washington: International Monetary Fund).
__________, and G. Li., forthcoming, “The Macroeconomic (and Distributional) Effects of Public
Investment in Developing Economies,” IMF Working Paper (Washington: International Monetary
Fund).
Ghosh, A. R., J. Ostry, and M. S. Qureshi, 2016, “When Do Capital Inflow Surges End in
Tears?” American Economic Review, Vol. 106, No. 5, pp. 581–85. doi:10.1257/aer.p20161015.
Gonzales, C., S. Jain-Chandra, K. Kochhar, and M. Newiak, 2015, “Fair Play: More Equal Laws Boost
Female Labor Force Participation,” Staff Discussion Note 15/02, (Washington: International
Monetary Fund).
Grigoli, F., E. Paredes, and G. Di Bella, 2016, “Inequality and Growth: A Heterogeneous Approach,”
IMF Working Paper 16/244 (Washington: International Monetary Fund).
FOSTERING INCLUSIVE GROWTH
34 INTERNATIONAL MONETARY FUND
Harrison, A. E., 2002, “Has Globalization Eroded Labour’s Share,” mimeo (Berkeley: University of
California).
Hellebrandt, T., and P. Mauro, 2016, World on the Move: Consumption Patterns in a More Equal
Global Economy (Washington: Peterson Institute of International Economics).
Helpman, E., 2016, “Globalization and Wage Inequality,” NBER Working Paper No. 22944
(Cambridge, Massachusetts: National Bureau of Economic Research).
International Monetary Fund, 2007, “Globalization and Inequality,” World Economic Outlook,
October. (Washington)
_______________,2012, “Fiscal Policy and Employment in Advanced and Emerging Economies,” Fiscal
Affairs Department Policy Paper (Washington).
––––––––––––, 2013, “Jobs and Growth: Analytical and Operational Considerations for the Fund,” IMF
Policy Paper, March (Washington).
––––––––––––, 2016a, “Corruption: Costs and Mitigating Strategies,” IMF Staff Discussion Note 16/05
(Washington).
––––––––––––,2016b. Small States’ Resilience to Natural Disasters and Climate Change—Role for the
IMF,” IMF Policy Paper, December (Washington).
_____________, 2016c, “Priorities for Structural Reforms in G-20 Countries,” Staff Background Paper for
G-20 Surveillance Note, July (Washington).
––––––––––––, 2017a, “Understanding the Downward Trend in Labor Income Shares,” World
Economic Outlook: Chapter 3 (Washington).
––––––––––––,2017b, “Getting Global Economic Integration Right,” unpublished paper (Washington).
––––––––––––,2017c, Asia and Pacific: Regional Economic Outlook, October (Washington).
––––––––––––,2017d, “The Managing Director’s Global Policy Agenda: A More Inclusive and Resilient
Global Economy,” April (Washington)
––––––––––––,2017e, “Recent Trends in Correspondent Banking Relationships—Further
Considerations” (Washington).
______________, 2017f, “Enhancing the Focus on Macrostructural Issues in Surveillance, February
(Washington).
––––––––––––,2017g, “Assessing Fiscal Space—An Initial Consistent Set of Considerations”
(Washington).
––––––––––––, forthcoming (a), “Fintech and the Organization of Financial Services: Initial
FOSTERING INCLUSIVE GROWTH
INTERNATIONAL MONETARY FUND 35
Considerations for Cross-Border Payments,” IMF Staff Discussion Note (Washington).
––––––––––––, forthcoming (b), “Social Safeguards and Program Design in PRGT and PSI-Supported
Programs”
IMF-WB-WTO, 2017, “Making Trade an Engine of Growth for All: The Case for Trade and Policies to
Facilitate Adjustment,” IMF Policy Paper, April (Washington).
Jaumotte, F., S. Lall, and C. Papageorgiou, 2013, “Rising Income Inequality: Technology, or Trade and
Financial Globalization?” IMF Economic Review, Vol. 61, No. 2, pp. 271–309.
Krueger, A.B., 2012, “The Rise and Consequences of Inequality,” Presentation at the Center for
American Progress (Washington: Center for American Progress).
Kumhof, M., and R. Rancière, 2010, “Inequality, Leverage, and Crises,” IMF Working Paper 10/268
(Washington: International Monetary Fund).
Kuznets, S., 1955, “Economic Growth and Income Inequality,” The American Economic Review,
Vol. XLV, No. 1, pp. 1–28.
Lakner, C. and B. Milanovic, 2016a, “Global Income Distribution: From the Fall of the Berlin Wall to
the Great Recession,” World Bank Economic Review, Vol. 30, No. 2, pp. 203-232.
––––––––––––– ,2016b, “Response to Adam Corlett’s Examining the Elephant: Globalization and the
Middle Class of the Rich World,” Mimeo (New York: City University of New York).
Mincer, J., 1958, “Investment in Human Capital and Personal Income Distribution, Journal of Political
Economy, Vol. 66, Vol. 2, pp. 281–302.
Morsy, H., 2012, “Scarred Generation,” Finance & Development, Vol. 49, No. 1, pp. 15–17.
Obstfeld, M., 2016, “Get on Track with Trade,” Finance & Development, Vol. 53, No. 4, pp. 12–16.
Organization for Economic Co-operation and Development, 2011, “Divided We Stand: Why
Inequality Keeps Rising,” (Paris: OECD Publishing).
––––––––––––, 2015, “The Effect of Pro-Growth Structural Reforms on Income Inequality,” Economic
Policy Reform ‘Going for Growth,’ (Paris: OECD Publishing).
––––––––––––, 2016, “Health at a Glance: Europe 2016; State of Health in the EU Cycle,” (Paris: OECD
Publishing).
Ostry, J., A. Berg, and C. Tsangarides, 2014, “Redistribution, Inequality, and Growth,” Staff Discussion
Notes 14/02 (Washington: International Monetary Fund).
––––––––––––, and S. Kothari, 2016, “Growth-Equity Trade-offs in Structural Reforms,” unpublished
paper.
FOSTERING INCLUSIVE GROWTH
36 INTERNATIONAL MONETARY FUND
Piketty, T., and E. Saez, 2003, “Income Inequality in the United States, 1913–1998” Quarterly Journal
of Economics, Vol. 118, No. 1, pp. 1–39.
Rajan, R., 2010, Fault Lines: How Hidden Fractures Still Threaten the World Economy (Princeton:
Princeton University Press).
Reich, R., 2010, Aftershock: The Next Economy and America’s Future (New York: Random House).
Rodrik, D., 1999, “Where Did All the Growth Go? External Shocks, Social Conflict, and Growth
Collapses,” Journal of Economic Growth, Vol. 4, No. 4, pp. 385–412.
Sahay, R., M. Čihák, P. N’Diaye, A. Barajas, S. Mitra, A. Kyobe, Y. N. Mooi, and S. R. Yousefi, 2015,
“Financial Inclusion: Can It Meet Multiple Macroeconomic Goals?” IMF Staff Discussion Note
15/27 (Washington: International Monetary Fund).
Solt, F., 2016, “The Standardized World Income Inequality Database,” Social Science Quarterly,
Vol. 97, No. 5, pp. 1267-81.
Stotsky, J., 2006, “Gender and Its Relevance to Macroeconomic Policy: A Survey,” IMF Working Paper
06/233 (Washington: International Monetary Fund).
World Bank, 2005, World Development Report 2006: Equity and Development (Washington).
––––––––––,2011, World Development Report 2012: Gender Equality and Development (Washington).
–––––––––––,2016, Poverty and Shared Prosperity Report: Taking on Inequality (Washington).