forty-five years of oceanographic and meteorological ... · cipitation, atmospheric pressure and...
TRANSCRIPT
Forty-five years of oceanographic and meteorological observationsat a coastal station in the NW Mediterranean: a ground truthfor satellite observations
Jordi Salat1 & Josep Pascual1 & Mar Flexas2 & Toshio Michael Chin3& Jorge Vazquez-Cuervo3
Received: 1 November 2018 /Accepted: 20 June 2019 /Published online: 9 August 2019# The Author(s) 2019
AbstractMarine and atmospheric parameters, including temperature observations from surface to 80 m (at 6 depths) are measured sinceSeptember 1973 on a higher-than-weekly frequency, at a coastal station 4 km offshore L’Estartit (Costa Brava; NWMediterranean). This constitutes the longest available uninterrupted oceanographic time series in the Mediterranean Sea. Thepresent contribution focuses on observed climatic trends in temperature (°C/year) of air (AT; 0.05), sea surface (SST; 0.03), sea at80 m depth (S80T; 0.02) and sea level (SL; 3.1 mm/year) as well as comparison with trends estimated from coincident high-resolution satellite data. The trending evolution is not uniform across seasons, being significantly higher in spring for both ATandSST, while in autumn for S80T. Other climatological results are a stratification increase (0.02 °C/year in summer temperaturedifference between 20 m (S20T) and S80T), trends in summer conditions at sea (when S20T > 18 °C), estimated as 0.5 and0.9 days/year for the starting day and period respectively, and a decreasing trend of nearly 2 days/year in the period of conditionsfavourable for marine evaporation (when AT < SST). This last trend may be related to the observed decrease of coastalprecipitation in spring. The long-term consistency in the in situ SST measurements presents an opportunity to validate themulti-decadal trends. The good agreement for 2013–2018 (RMS 0.5–0.6, bias − 0.1 to − 0.2; trends of 0.09 °C/year in situ vs.0.06 to 0.08 °C/year from satellite) allows considering this observational site as ground truth for satellite observations and amonitoring site for climate change.
Keywords Oceanographic time series . Climate trends . Satellite ground truth . Stratification . Seasonality . Mediterranean Sea
1 Introduction
Long-term monitoring sites are scarce in the world ocean.Most of the financial sources have been traditionally ad-dressed to achieve short-term oceanographic objectives. In
comparison with weather stations, that were required to pro-duce weather forecasts, there was absence of equivalentoceanographic forecasts. There was a general lack of ac-knowledgement that an oceanographic equivalent was neces-sary, possibly because the sea state depends essentially onwinds, and marine traffic does not directly depend upon oceantemperature or salinity. Oceanographic information wasknown to be useful for fisheries, but does not have an imme-diate impact as to require high-frequency monitoring. Indeed,ocean motion is slow, and it was a widespread perception thatocean properties change smoothly. There was also clear evi-dence that ocean data acquisition costs were much higher thantheir atmospheric counterpart. Thus, early oceanographic ef-forts focused on producing maps of oceanic circulation andwater masses. The underlying idea was that these propertiescould be considered as a permanent background, with somedegree of variability (that is, a mean value with more or lessvariance).
Two of the first parameters that were regularly monitoredwere sea level and sea state, essentially because of their impact
This article is part of the Topical Collection on the 50th InternationalLiège Colloquium on Ocean Dynamics, Liège, Belgium, 28 May to 1June 2018
Responsible Editor: Michael J. McPhaden
* Jordi [email protected]
1 Institut de Ciencies del Mar, ICM/CSIC, Passeig Marítim de laBarceloneta, 37-49, 08003 Barcelona, Spain
2 California Institute of Technology, 1200 E. California Boulevard,Pasadena, CA 91125, USA
3 Jet Propulsion Laboratory, California Institute of Technology, 4800Oak Grove Dr., Pasadena, CA 91109, USA
Ocean Dynamics (2019) 69:1067–1084https://doi.org/10.1007/s10236-019-01285-z
on shores, coastal equipment and harbours. Reconstructionsof the oceanic history were derived from the comparison ofdata obtained from different oceanographic cruises. Althoughdata was collected under diverse projects, comparisons evi-denced that changes at sea were more rapid and much lesssmooth than foreseen. In most cases, such cruises had nocommon purpose nor belonged to any monitoring program.
By the end of the last century, the concept of OperationalOceanography emerged as an equivalent to the weather re-ports, with the associated requirement of regular monitoring.Other drivers fostering oceanographic monitoring have beenthe need to evaluate anthropogenic contributions to climatechange. Although the relation between the ocean and climateis not new, it is recently vindicated in many papers with aclassical introduction justifying the interest of ocean monitor-ing, satellite observations, modelling exercises or altogether.During the 1980s, when signs of a heating trend on climatestarted to be evident, international programs such as theWorldOcean Circulation Experiment (WOCE 1988) started to fosterlong-term oceanographic studies. It was recognized “that suc-cessful simulation of the broad evolution of global climatebeyond a few years will require the inclusion of the worldoceans through their full depth”. For the first time, a globalpattern of oceanographic observations was established, withcommon methodologies that could be repeated—most ofthem have indeed been repeated several times—enabling in-teresting comparisons related to the impact ocean circulationon climate and vice-versa (e.g. Bryden et al. 2005; Ganachaudet al. 2000).
Nowadays, it is widely accepted that monitoring the oceanproperties provides valuable information on climatological(long-term) mean values, variability ranges and long-termchanges or trends. The recent growth of technological inno-vations fostered oceanic monitoring to unprecedented levels:from sea surface to ocean floor, from coast to open seas, bymeans of satellite, drifters, gliders, moorings, buoys, Argoprofilers, ships of opportunity, as well as the classical ocean-ographic cruises. These networks are producing massiveamounts of data that are then used, in near real-time or indata-assimilative models, to produce ocean state estimationsand oceanic forecasts, and to give estimates of climate trends.This is, however, a very recent situation in terms of climateevolution, involving not more than the last 20–30 years.Forecasts and predictions face strong data constraints andchallenges, including uncertainty quantification, due to thelack of long oceanic time series.
Indeed, long time series of ocean properties are rare in thesurface ocean, and even rarer in the deep ocean. In days past,most of these initiatives took advantage of the presence ofcoastal laboratories that promoted fixed oceanographic sta-tions easily reachable from their onshore installations. Oneexample of fixed oceanographic stations is the CaliforniaCooperative Oceanic Fisheries Investigations (CalCOFI),
formed in 1949 to study the ecological aspects of the sardinepopulation collapse off California. Today, their focus hasshifted to the study of the marine environment off the coastof California, the management of its living resources andmon-itoring the indicators of El Niño and climate change. CalCOFIconducts quarterly cruises off southern and central California,collecting a suite of hydrographic and biological data on sta-tion and while underway (Bograd et al. 2003). The NorthAtlantic region is an unusual example of long-term monitor-ing. It has a relatively large number of locations at whichoceanographic data have been collected repeatedly for manyyears or decades; the longest records go back more than acentury (e.g. ICES data sets). In theMediterranean Sea, ocean-ographic data series during the last century are more scarceand unevenly distributed. One of the oldest fixed oceano-graphic stations is the observing point B in the Villefranchesur Mer bay (Ligurian Sea; France) that started weekly ocean-ographic data collection in May 1957 (Bougis and Carré1960). Observations in this point have been maintained upto now although with several interruptions.
Likely due to the financial restrictions mentioned earlier,many of the atmosphere and oceanic long time series initia-tives started (or were in part maintained) as a non-governmen-tal, non-profit, voluntary initiative. One famous example is theoldest climate time series, the Mauna-Loa station, whose datawas used as evidence for anthropogenic increase of the CO2
concentration in the atmosphere. Similar origin had many ini-tiatives collecting relevant oceanographic data. For example,the Oceanographic Society of Gipuzkoa has recorded sea sur-face temperature (SST) measurements in Donostia (southeast-ern Bay of Biscay; Spain), on a nearly daily basis sinceJuly 1946, providing more than 70 years of SST measure-ments to analyse local hydrographic trends and anomalies(Goikoetxea et al. 2009). The present paper refers to anotherof these voluntary initiatives: the Meteorological andOceanographic coastal station at L’Estartit (Costa Brava,NWMediterranean; Spain) that is carrying out weekly ocean-ographic observations uninterruptedly since September 1973.These data provide a unique opportunity for comparisons withsatellite-derived SST in coastal regions. This paper aims to benot only a tribute to its origins and its scientific value, but alsoa wake-up call to start, today, similar initiatives and to insuretheir continuity through time.
The paper is outlined as follows. In section 2, we presentthe history of the L’Estartit station and the data sets produced,detailing the methods used to record each type of observation.In section 3, the methods to calculate climatic trends for theselected variables such as air, sea surface and sub-surface tem-peratures, changes in stratification, estimates of favourableconditions for evaporation (from the number of days duringwhich sea surface temperature is higher than air temperature),sea level and precipitation. Methodology for Satellite SSTproducts is also presented in this section. In section 4, we
1068 Ocean Dynamics (2019) 69:1067–1084
present the results obtained from the L’Estartit data. Section 5places our results in a general context and are compared withprevious works in the region and those based on L’Estartit datasets and compares the observed in situ SSTwith the availablesatellite products and their trends. Some general conclusionsare outlined in section 6.
2 L’Estartit data set
2.1 History and environmental considerations
As early as in 1969, Josep Pascual started a series of dailymeteorological observations, measuring precipitation, air tem-perature and atmospheric pressure at L’Estartit, a small coastaltown in the Catalan Costa Brava (NW Mediterranean). Lateron, in September 1973, the inland meteorological observa-tions were complemented with sea temperature observationsat an ocean point located a few miles offshore (Fig. 1).L’Estartit is located at the north side of a small bay. It has asmall harbour open to the SE and there are several smallislands closing the bay. A hill, 228 m high, dominates thecoastal cliff.
Ocean observations at a fixed point (AA) at about 4 kmoffshore L’Estartit, away from the bay and the islands,were obtained using calibrated reversing thermometers at4 to 7 fixed levels, from surface to 80 m depth, with anaverage frequency of at least once per week, weather per-mitting, resulting in 60 to 80 visits per year, uninterrupteduntil today. The station, although quite close to shore, islocated at the southern limit of the relatively narrow con-tinental shelf, at the coastal side of the main along-slopecurrent in the NW Mediterranean, the Northern Current,that flows in SW direction from the Ligurian Sea to nearthe Alboran Sea. Oceanographic conditions at this site arerepresentative of those found upstream, at the southernlimit of the continental shelf of the Gulf of Lions (Fontet al. 1988).
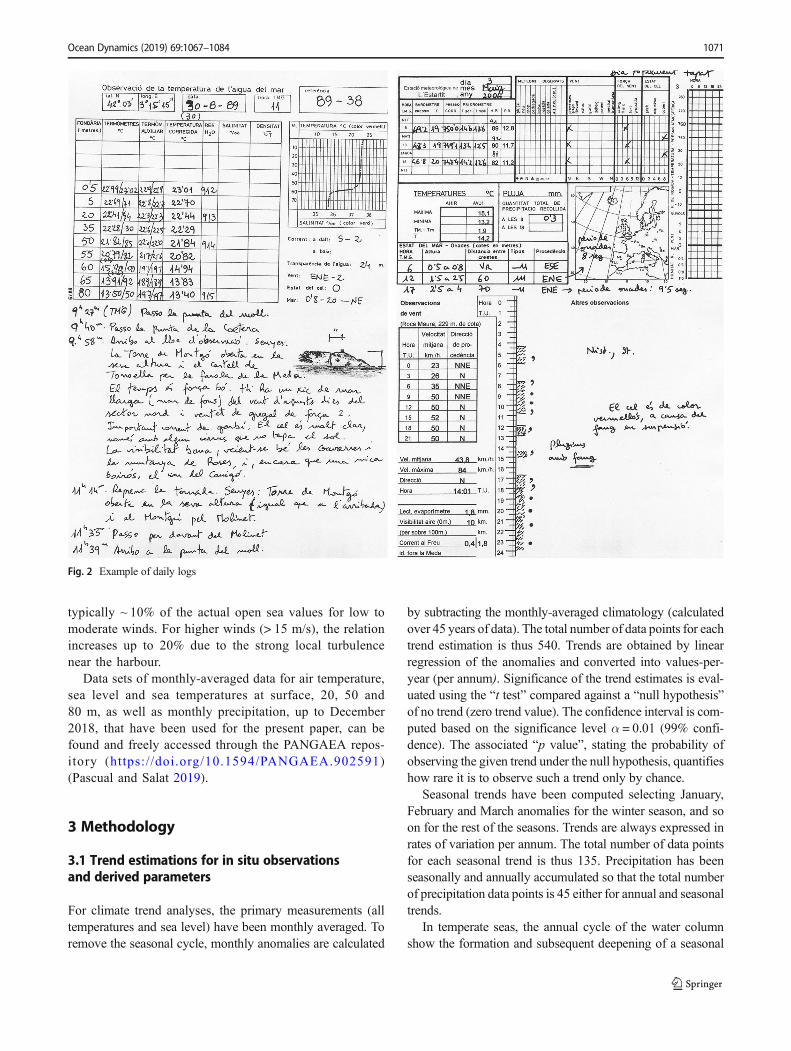
Additional observations (mostly still on paper, not yetconverted onto digital format) on marine environmentalconditions at sight, such as water transparency (Secchidisc), clouds, sea-state, presence of birds, medusae or ma-rine mammals and surface roughness and visual surfacecurrents at several points along the track across the islandsto reach the point AA were also recorded (Fig. 2). Inlandmeteorological observations of daily air temperature, pre-cipitation, atmospheric pressure and humidity started in1969. With time, these have been progressivelycomplemented with potential daily evaporation (Piché)since 1976, and with sea state, wind speed and directionmeasurements since 1988. Since 1990, continuous analog-ic sea level data has been collected by a tide gaugeinstalled inside the harbour (Fig. 3). Finally, since early
1990s, conductivity-temperature-depth (CTD) profilesalong the track across the islands, and water samples forsalinity analysis were also occasionally collected.
The zone near the station was declared marine-protectedarea (MPA) in 1990 (within the Parc Natural del Montgrí,les Illes Medes i el Baix Ter). The station is still maintainedby Josep Pascual, as a voluntary observer, with the collabora-tion of the Institut de Ciències del Mar (CSIC) and the author-ity of the MPA. The series of observations is the longest un-interrupted within the Mediterranean Sea. Data (detailed inTable 1) are free and digitised data can be accessed upondemand (http://meteolestartit.cat/).
2.2 Data set
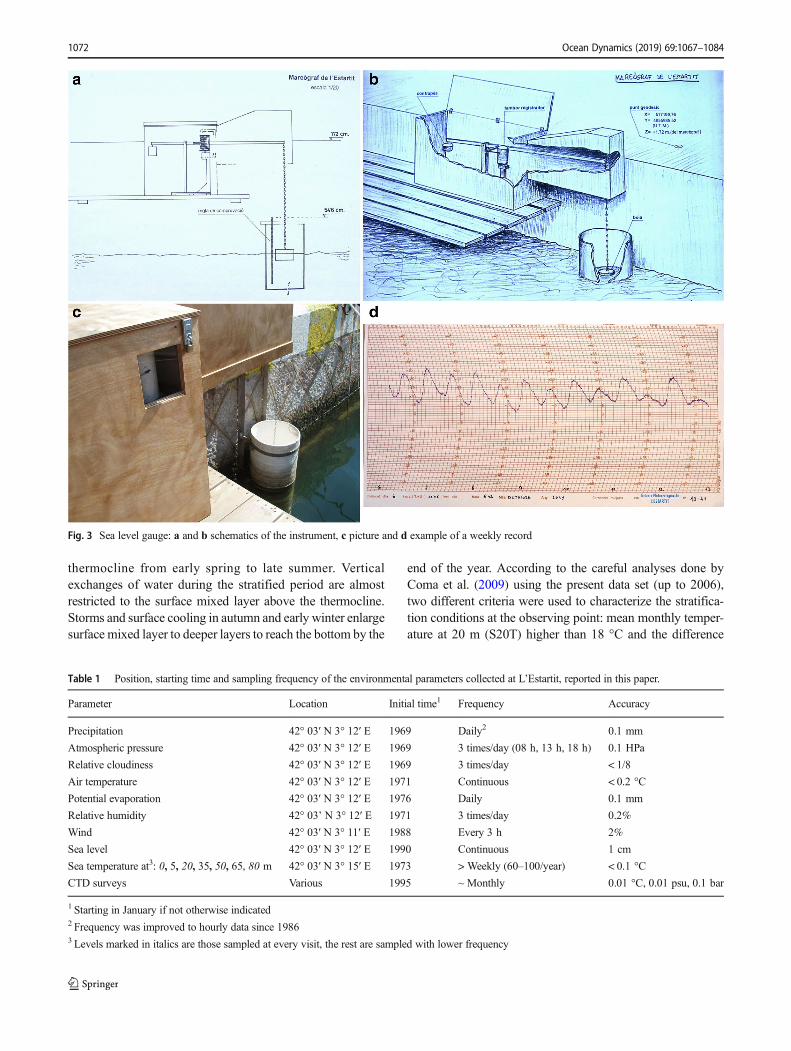
The main station (AA) is 90 m deep and located at ~ 42°03′ N, 3° 15′ E (Fig. 1). The average frequency of obser-vations is higher than once per week (~ 60 to + 100 visitsper year). Sea temperatures have been obtained using twoRichter and Wiese protected reversing thermometersmounted on a Nansen bottle. Temperature readings, aftercorrection according to the thermometer’s calibration cer-tificates, are averaged if the temperature difference amongthermometers is lower than 0.2 °C and repeated other-wise, so that the accuracy can be set to be lower than0.2 °C. Thermometers are periodically controlled at facil-ities of the Marine Research Institute (ICM) in Barcelonaagainst a high-precision Pt100. which, in turn, is annuallycontrolled using Ga and pure H2O melting points. Sealevel gauge is a mechanical device attached to a continu-ous graphical recorder (Fig. 3). The record is digitized at2-h interval and the originals preserved for detailed anal-yses i f necessary. The pos i t ion is per iodical lygeoreferenced by the Catalan Cartographic Institute(ICC) every 5 years and data is backwards linearlycorrected for each period.
Atmospheric parameters (air temperature, pressure, rel-ative humidity, precipitation and potential evaporation,Piché) have been measured in a meteorological box withstandard instruments certified and regularly checked bythe Spanish Meteorological Office (AEMET). These ob-servations have been included in the official AEMETweather observation network. The meteorological box islocated in front of the harbour at the sea level. Windmeasurements at this location are not representative ofthe coastal zone because of the shelter from buildingsand the coastal hills. For that reason, an anemometer islocated on top of the hill, free of any sheltering. Theanemometer is also controlled and certified by theMeteorological Office. Wind velocities and direction ontop of the hill are very similar with those regularly mea-sured offshore at the station AA (std error < 0.4 m/s).Wind velocities measured at the harbour station are
Ocean Dynamics (2019) 69:1067–1084 1069
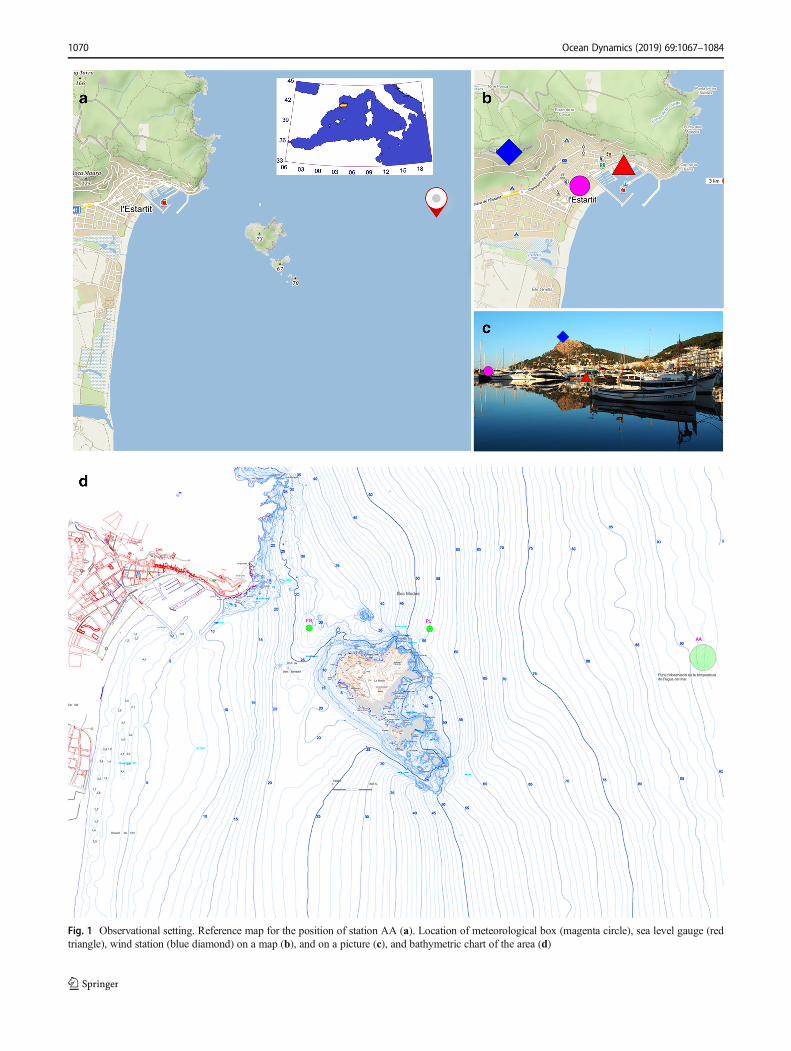
Fig. 1 Observational setting. Reference map for the position of station AA (a). Location of meteorological box (magenta circle), sea level gauge (redtriangle), wind station (blue diamond) on a map (b), and on a picture (c), and bathymetric chart of the area (d)
1070 Ocean Dynamics (2019) 69:1067–1084
typically ~ 10% of the actual open sea values for low tomoderate winds. For higher winds (> 15 m/s), the relationincreases up to 20% due to the strong local turbulencenear the harbour.
Data sets of monthly-averaged data for air temperature,sea level and sea temperatures at surface, 20, 50 and80 m, as well as monthly precipitation, up to December2018, that have been used for the present paper, can befound and freely accessed through the PANGAEA repos-itory (https://doi.org/10.1594/PANGAEA.902591)(Pascual and Salat 2019).
3 Methodology
3.1 Trend estimations for in situ observationsand derived parameters
For climate trend analyses, the primary measurements (alltemperatures and sea level) have been monthly averaged. Toremove the seasonal cycle, monthly anomalies are calculated
by subtracting the monthly-averaged climatology (calculatedover 45 years of data). The total number of data points for eachtrend estimation is thus 540. Trends are obtained by linearregression of the anomalies and converted into values-per-year (per annum). Significance of the trend estimates is eval-uated using the “t test” compared against a “null hypothesis”of no trend (zero trend value). The confidence interval is com-puted based on the significance level α = 0.01 (99% confi-dence). The associated “p value”, stating the probability ofobserving the given trend under the null hypothesis, quantifieshow rare it is to observe such a trend only by chance.
Seasonal trends have been computed selecting January,February and March anomalies for the winter season, and soon for the rest of the seasons. Trends are always expressed inrates of variation per annum. The total number of data pointsfor each seasonal trend is thus 135. Precipitation has beenseasonally and annually accumulated so that the total numberof precipitation data points is 45 either for annual and seasonaltrends.
In temperate seas, the annual cycle of the water columnshow the formation and subsequent deepening of a seasonal
Fig. 2 Example of daily logs
Ocean Dynamics (2019) 69:1067–1084 1071
thermocline from early spring to late summer. Verticalexchanges of water during the stratified period are almostrestricted to the surface mixed layer above the thermocline.Storms and surface cooling in autumn and early winter enlargesurface mixed layer to deeper layers to reach the bottom by the
end of the year. According to the careful analyses done byComa et al. (2009) using the present data set (up to 2006),two different criteria were used to characterize the stratifica-tion conditions at the observing point: mean monthly temper-ature at 20 m (S20T) higher than 18 °C and the difference
Fig. 3 Sea level gauge: a and b schematics of the instrument, c picture and d example of a weekly record
Table 1 Position, starting time and sampling frequency of the environmental parameters collected at L’Estartit, reported in this paper.
Parameter Location Initial time1 Frequency Accuracy
Precipitation 42° 03′ N 3° 12′ E 1969 Daily2 0.1 mm
Atmospheric pressure 42° 03′ N 3° 12′ E 1969 3 times/day (08 h, 13 h, 18 h) 0.1 HPa
Relative cloudiness 42° 03′ N 3° 12′ E 1969 3 times/day < 1/8
Air temperature 42° 03′ N 3° 12′ E 1971 Continuous < 0.2 °C
Potential evaporation 42° 03′ N 3° 12′ E 1976 Daily 0.1 mm
Relative humidity 42° 03’ N 3° 12′ E 1971 3 times/day 0.2%
Wind 42° 03′ N 3° 11′ E 1988 Every 3 h 2%
Sea level 42° 03′ N 3° 12′ E 1990 Continuous 1 cm
Sea temperature at3: 0, 5, 20, 35, 50, 65, 80 m 42° 03′ N 3° 15′ E 1973 > Weekly (60–100/year) < 0.1 °C
CTD surveys Various 1995 ~ Monthly 0.01 °C, 0.01 psu, 0.1 bar
1 Starting in January if not otherwise indicated2 Frequency was improved to hourly data since 19863 Levels marked in italics are those sampled at every visit, the rest are sampled with lower frequency
1072 Ocean Dynamics (2019) 69:1067–1084
between S20T and mean monthly temperatures at 80 m(S80T) is higher than 4.7 °C. It is assumed that in spring, whenthe S20T reaches 18 °C, stratification is consolidated and can-not be reversed until the autumn cooling. Similarly, limitedvertical water exchanges will be reflected when higher than athreshold temperature difference is between 20 and 80 m. Inthe present paper, since there were almost no differences in thebehaviour of these two criteria, we used only the first one forthe duration of the stratified period, also referred to as summerconditions. The evolution of S20T-S80T will be used for cli-mate trends.
Evaporation over the sea cannot be easily measured and,in many cases, especially in modelling, bulk formulae havebeen used to get reasonable estimates of the evaporationrates. These estimates are essentially based on the capacityof an air mass to absorb water vapour assuming that air incontact with the sea surface will get the same temperatureas the sea surface and reach the water saturation (Jacobs1942). Although our data sets would provide informationto have estimates of the sea evaporation, they would not beas consistent as other data reported here, so we decided notto include them in the results and consider only the evolu-tion of the conditions favourable to an effective evapora-tion. As observed by Sverdrup et al. (1942, p 117-119), seasurface temperature higher than air temperature will favourevaporation while in the opposite case it will be greatlylimited. Accordingly, within the annual cycle, there is aperiod favourable to sea evaporation, when SST is higherthan air temperature (AT). In this paper, we used themonthly AT-SST to estimate the evaporation favourableconditions.
To estimate the duration of annual periods for a given con-dition such as that favourable to evaporation or the above-mentioned stratification, linear interpolation between monthlydata is used, assuming that the actual monthly mean valuecorresponded to the mid-month day (14 to 15.5 according tothe month). Trends for these periods are obtained by linearregression with the same treatment as monthly or seasonaldata but with only 45 data points, one per year.
Heat content within the upper 80 m of the water column(not shown) can also be calculated using the sea temperaturesobtained at surface, 20 m, 50 m and 80 m, assuming these tobe representative of temperatures at 0—10 m, 10—35 m,35—65 m and 65—80 m, respectively.
3.2 Satellite products
Several satellite-based sea surface temperature (SST)analysis data sets were used for comparisons. These datasets are daily compositions of multiple satellite SST mea-surements of various horizontal resolutions ranging from1 to 25 km, and they differ in selection of the input datasets as well as in how the input data are interpolated on to
a grid whose resolution also varies from 1 to 25 km. Theyare the Multi-scale Ultra-high Resolution (MUR) analysisfrom NASA Jet Propulsion Laboratory (Chin et al. 2017),Italian Institute of Atmospheric Sciences and ClimateG r uppo d i Oc e a nog r a f i a d a S a t e l l i t e (GOS )Mediterranean analysis (Buongiorno Nardelli et al.2013), the Canadian Meteorological Centre (CMC) anal-ysis (Brasnett 2008), UK Met Office Operational SeaSurface Temperature and Sea Ice Analysis (OSTIA)(Donlon et a l . 2012) , and Nat ional Center forEnvironmental Information (NCEI) optimal interpolationanalysis (Reynolds et al. 2007). All these data sets may beacce s sed th rough reg i s t r a t i on a t t he Phys i c a lOceanography Distributed Active Archive Center(PO.DAAC) and use of the PO:DAAC drive at https://podaac-tools.jpl.nasa.gov/drive/. For comparison, an SSTtime series coincident with the in situ counterpart isobtained from each of these analysis data sets bybilinear interpolation to the L’Estartit sampling locationon the sampling dates. Since the earliest satellite SSTmeasurements are from 1980s and some of the satelliteanalyses go back in t ime much less , we makecomparison only for the recent years, from 2013 to 2018.
4 Results
4.1 Annual cycles
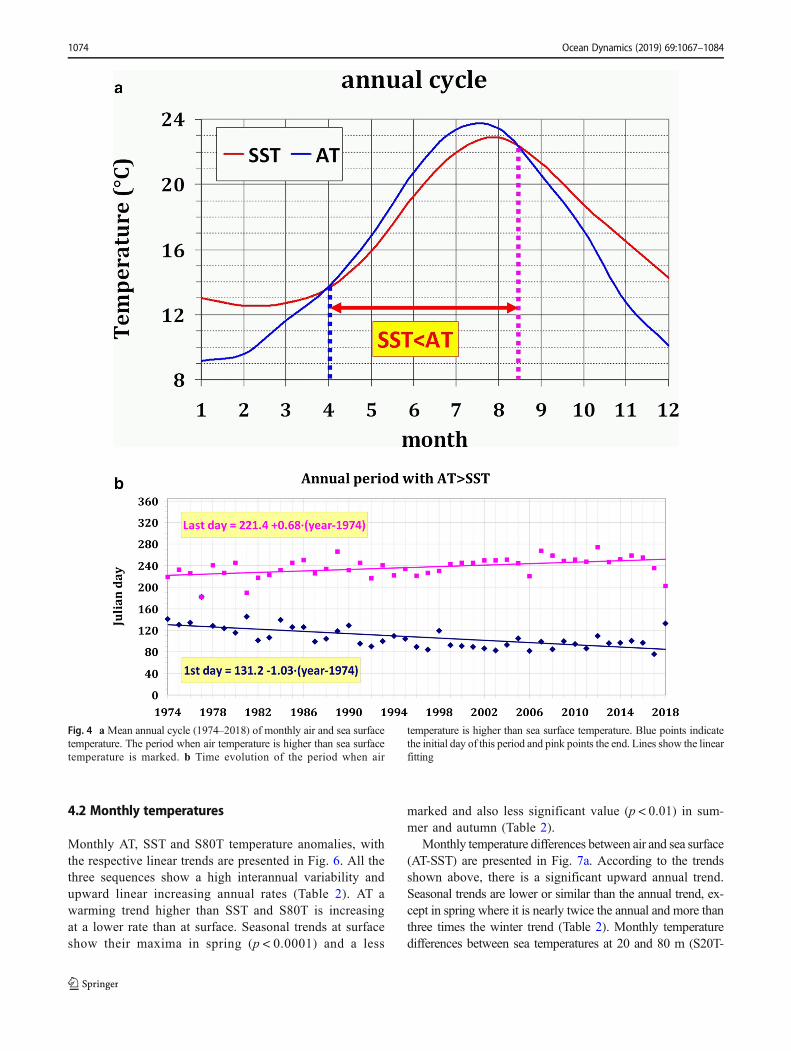
The average annual cycle of air and SST (Fig. 4a) shows thatfrom late winter-early spring to mid-summer, SST is lowerthan air temperature while during the rest of the year, thesituation is reversed. The initial and ending days for the periodwhen SST are colder than air temperature is presented in Fig.4b and the corresponding annual trend in Table 2. There is asuccessive advancement of the starting point of the period(p < 0.0001) while the delay in ending point is less significant(p < 0.01, i.e., still within the 99% of confidence). Such abehaviour has a relevant role in the air-sea interaction, in par-ticular concerning sea water evaporation/condensation, andthus in the local water cycle.
The annual cycle of S20T is presented in Fig. 5a toindicate the initial and ending points of the stratified pe-riod. The evolution of these points is presented in Fig. 5band the corresponding annual trends in Table 2. The evo-lution shows an enlargement of the period associated toboth an advancement of the starting point and delay of theending point. Although there are strong interannual differ-ences in this process, from cold years when stratified pe-riod is short to hot waves with long periods of stratifica-tion, all these situations have significant biological impli-cations that may affect local fisheries.
Ocean Dynamics (2019) 69:1067–1084 1073
4.2 Monthly temperatures
Monthly AT, SST and S80T temperature anomalies, withthe respective linear trends are presented in Fig. 6. All thethree sequences show a high interannual variability andupward linear increasing annual rates (Table 2). AT awarming trend higher than SST and S80T is increasingat a lower rate than at surface. Seasonal trends at surfaceshow their maxima in spring (p < 0.0001) and a less
marked and also less significant value (p < 0.01) in sum-mer and autumn (Table 2).
Monthly temperature differences between air and sea surface(AT-SST) are presented in Fig. 7a. According to the trendsshown above, there is a significant upward annual trend.Seasonal trends are lower or similar than the annual trend, ex-cept in spring where it is nearly twice the annual and more thanthree times the winter trend (Table 2). Monthly temperaturedifferences between sea temperatures at 20 and 80 m (S20T-
Fig. 4 aMean annual cycle (1974–2018) of monthly air and sea surfacetemperature. The period when air temperature is higher than sea surfacetemperature is marked. b Time evolution of the period when air
temperature is higher than sea surface temperature. Blue points indicatethe initial day of this period and pink points the end. Lines show the linearfitting
1074 Ocean Dynamics (2019) 69:1067–1084
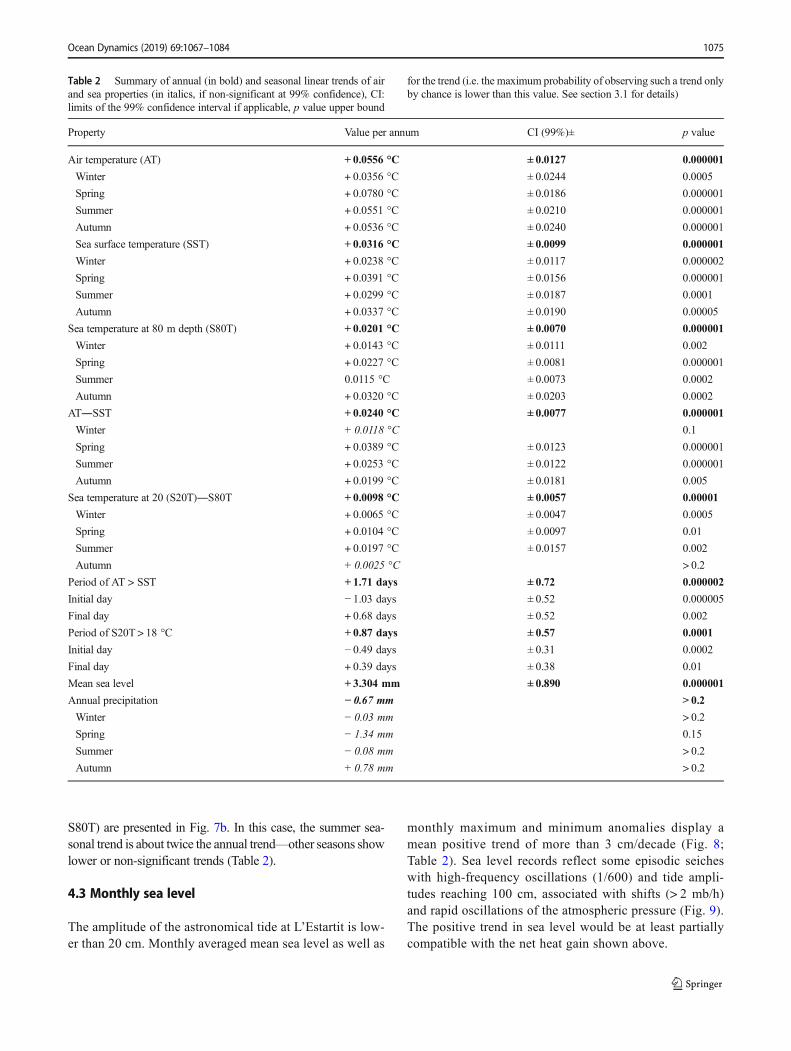
S80T) are presented in Fig. 7b. In this case, the summer sea-sonal trend is about twice the annual trend—other seasons showlower or non-significant trends (Table 2).
4.3 Monthly sea level
The amplitude of the astronomical tide at L’Estartit is low-er than 20 cm. Monthly averaged mean sea level as well as
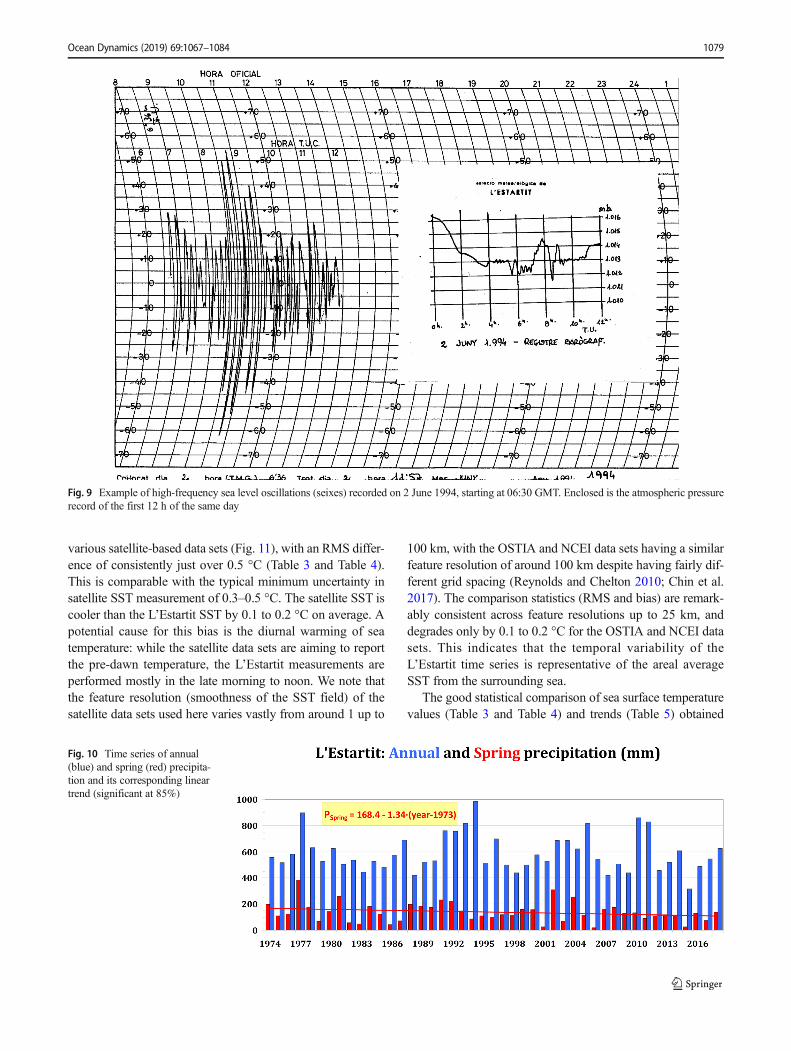
monthly maximum and minimum anomalies display amean positive trend of more than 3 cm/decade (Fig. 8;Table 2). Sea level records reflect some episodic seicheswith high-frequency oscillations (1/600) and tide ampli-tudes reaching 100 cm, associated with shifts (> 2 mb/h)and rapid oscillations of the atmospheric pressure (Fig. 9).The positive trend in sea level would be at least partiallycompatible with the net heat gain shown above.
Table 2 Summary of annual (in bold) and seasonal linear trends of airand sea properties (in italics, if non-significant at 99% confidence), CI:limits of the 99% confidence interval if applicable, p value upper bound
for the trend (i.e. the maximum probability of observing such a trend onlyby chance is lower than this value. See section 3.1 for details)
Property Value per annum CI (99%)± p value
Air temperature (AT) + 0.0556 °C ± 0.0127 0.000001
Winter + 0.0356 °C ± 0.0244 0.0005
Spring + 0.0780 °C ± 0.0186 0.000001
Summer + 0.0551 °C ± 0.0210 0.000001
Autumn + 0.0536 °C ± 0.0240 0.000001
Sea surface temperature (SST) + 0.0316 °C ± 0.0099 0.000001
Winter + 0.0238 °C ± 0.0117 0.000002
Spring + 0.0391 °C ± 0.0156 0.000001
Summer + 0.0299 °C ± 0.0187 0.0001
Autumn + 0.0337 °C ± 0.0190 0.00005
Sea temperature at 80 m depth (S80T) + 0.0201 °C ± 0.0070 0.000001
Winter + 0.0143 °C ± 0.0111 0.002
Spring + 0.0227 °C ± 0.0081 0.000001
Summer 0.0115 °C ± 0.0073 0.0002
Autumn + 0.0320 °C ± 0.0203 0.0002
AT―SST + 0.0240 °C ± 0.0077 0.000001
Winter + 0.0118 °C 0.1
Spring + 0.0389 °C ± 0.0123 0.000001
Summer + 0.0253 °C ± 0.0122 0.000001
Autumn + 0.0199 °C ± 0.0181 0.005
Sea temperature at 20 (S20T)―S80T + 0.0098 °C ± 0.0057 0.00001
Winter + 0.0065 °C ± 0.0047 0.0005
Spring + 0.0104 °C ± 0.0097 0.01
Summer + 0.0197 °C ± 0.0157 0.002
Autumn + 0.0025 °C > 0.2
Period of AT > SST + 1.71 days ± 0.72 0.000002
Initial day − 1.03 days ± 0.52 0.000005
Final day + 0.68 days ± 0.52 0.002
Period of S20T > 18 °C + 0.87 days ± 0.57 0.0001
Initial day − 0.49 days ± 0.31 0.0002
Final day + 0.39 days ± 0.38 0.01
Mean sea level + 3.304 mm ± 0.890 0.000001
Annual precipitation − 0.67 mm > 0.2
Winter − 0.03 mm > 0.2
Spring − 1.34 mm 0.15
Summer − 0.08 mm > 0.2
Autumn + 0.78 mm > 0.2
Ocean Dynamics (2019) 69:1067–1084 1075
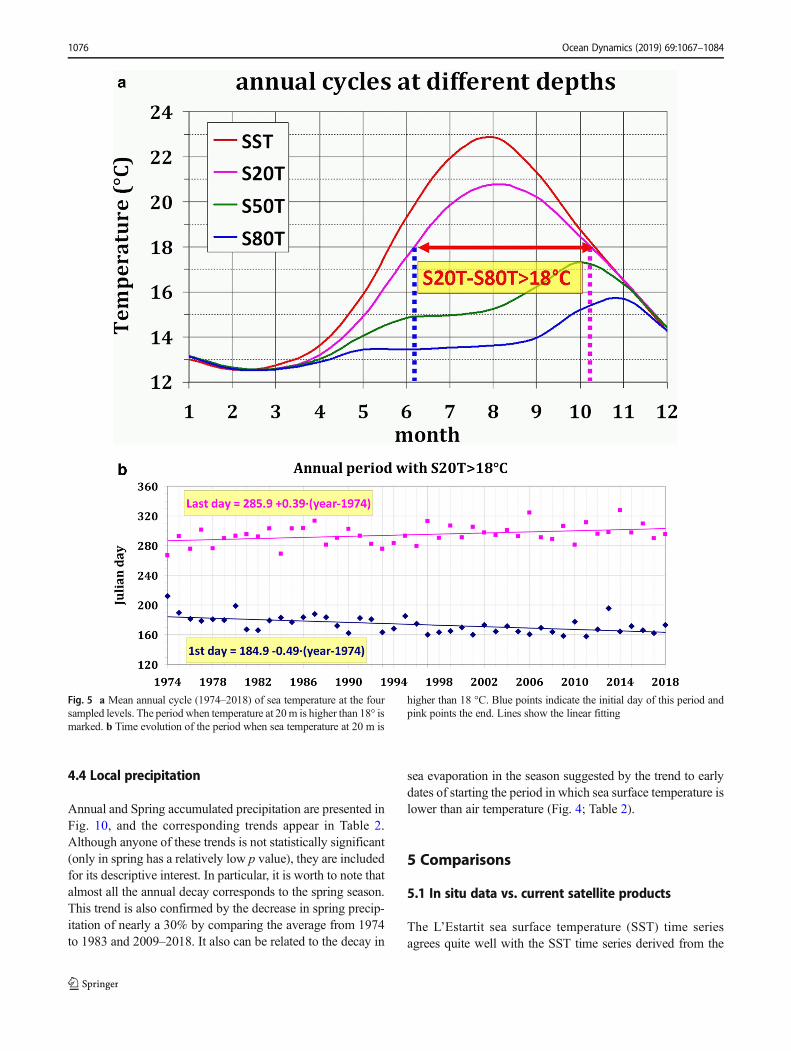
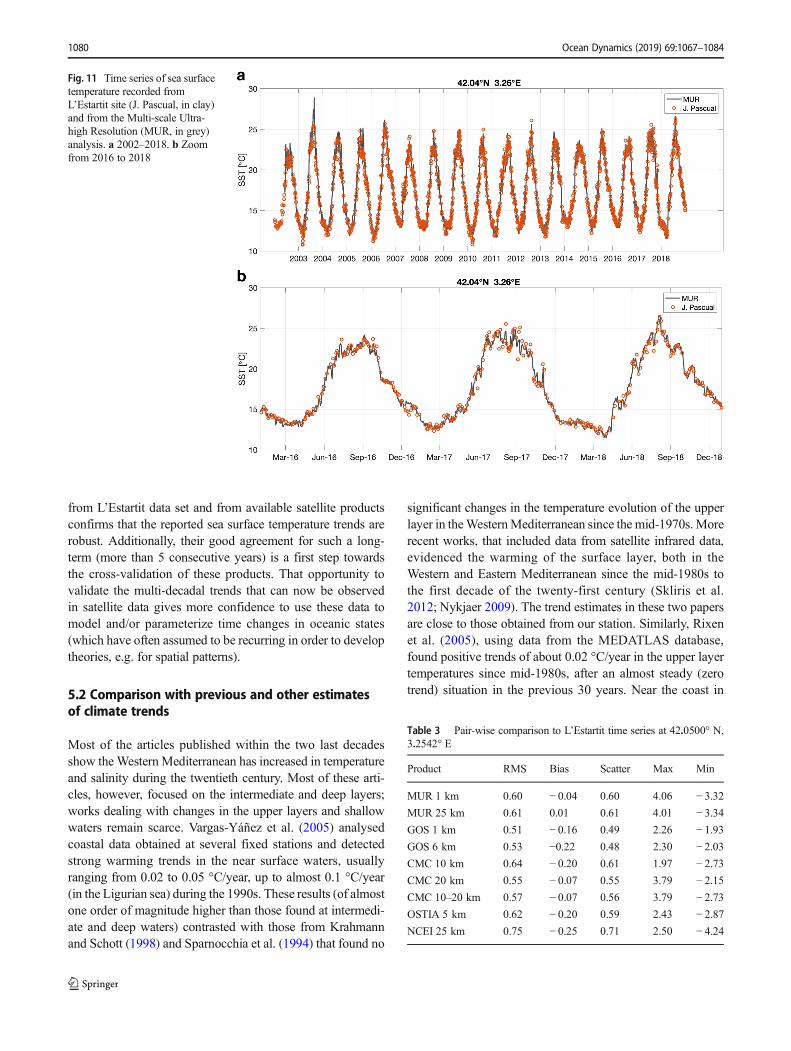
4.4 Local precipitation
Annual and Spring accumulated precipitation are presented inFig. 10, and the corresponding trends appear in Table 2.Although anyone of these trends is not statistically significant(only in spring has a relatively low p value), they are includedfor its descriptive interest. In particular, it is worth to note thatalmost all the annual decay corresponds to the spring season.This trend is also confirmed by the decrease in spring precip-itation of nearly a 30% by comparing the average from 1974to 1983 and 2009–2018. It also can be related to the decay in
sea evaporation in the season suggested by the trend to earlydates of starting the period in which sea surface temperature islower than air temperature (Fig. 4; Table 2).
5 Comparisons
5.1 In situ data vs. current satellite products
The L’Estartit sea surface temperature (SST) time seriesagrees quite well with the SST time series derived from the
Fig. 5 a Mean annual cycle (1974–2018) of sea temperature at the foursampled levels. The period when temperature at 20m is higher than 18° ismarked. b Time evolution of the period when sea temperature at 20 m is
higher than 18 °C. Blue points indicate the initial day of this period andpink points the end. Lines show the linear fitting
1076 Ocean Dynamics (2019) 69:1067–1084
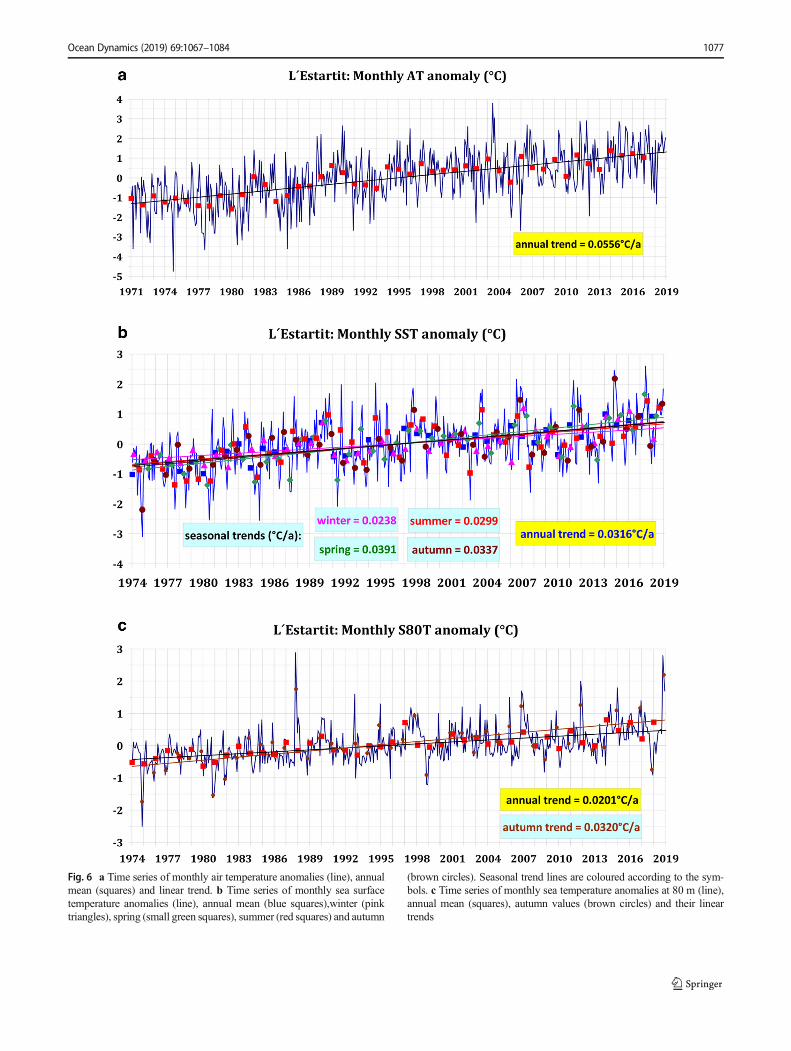
Fig. 6 a Time series of monthly air temperature anomalies (line), annualmean (squares) and linear trend. b Time series of monthly sea surfacetemperature anomalies (line), annual mean (blue squares),winter (pinktriangles), spring (small green squares), summer (red squares) and autumn
(brown circles). Seasonal trend lines are coloured according to the sym-bols. c Time series of monthly sea temperature anomalies at 80 m (line),annual mean (squares), autumn values (brown circles) and their lineartrends
Ocean Dynamics (2019) 69:1067–1084 1077
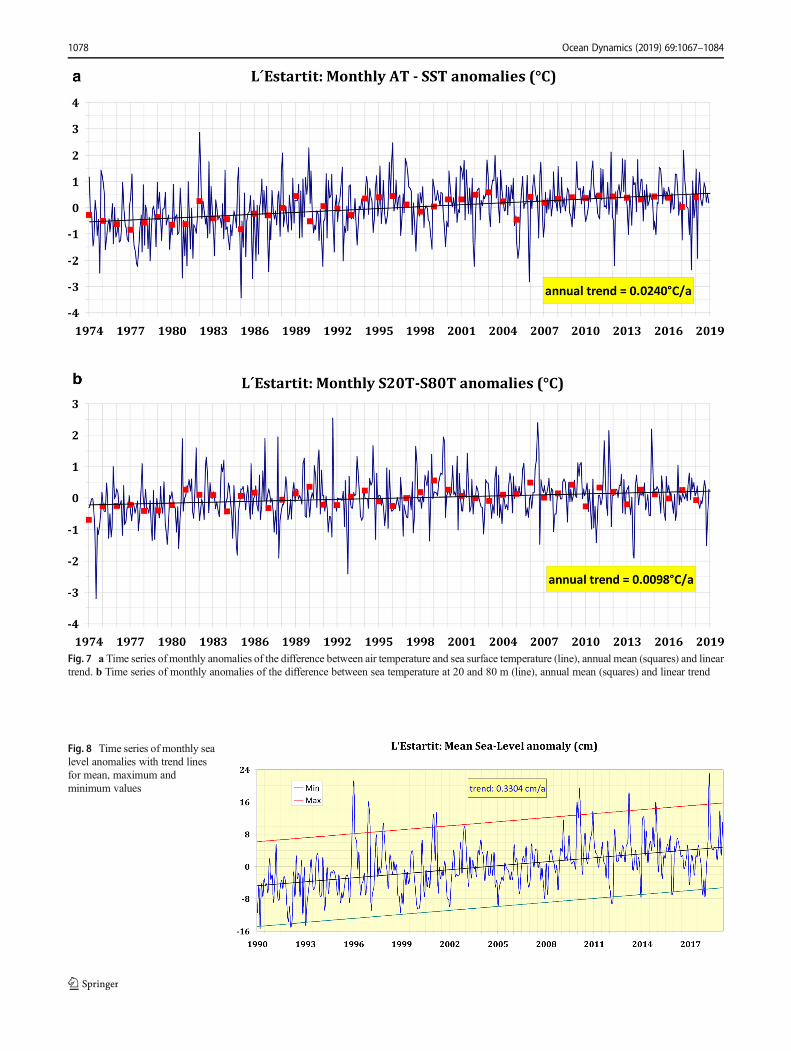
Fig. 8 Time series of monthly sealevel anomalies with trend linesfor mean, maximum andminimum values
Fig. 7 a Time series of monthly anomalies of the difference between air temperature and sea surface temperature (line), annual mean (squares) and lineartrend. b Time series of monthly anomalies of the difference between sea temperature at 20 and 80 m (line), annual mean (squares) and linear trend
1078 Ocean Dynamics (2019) 69:1067–1084
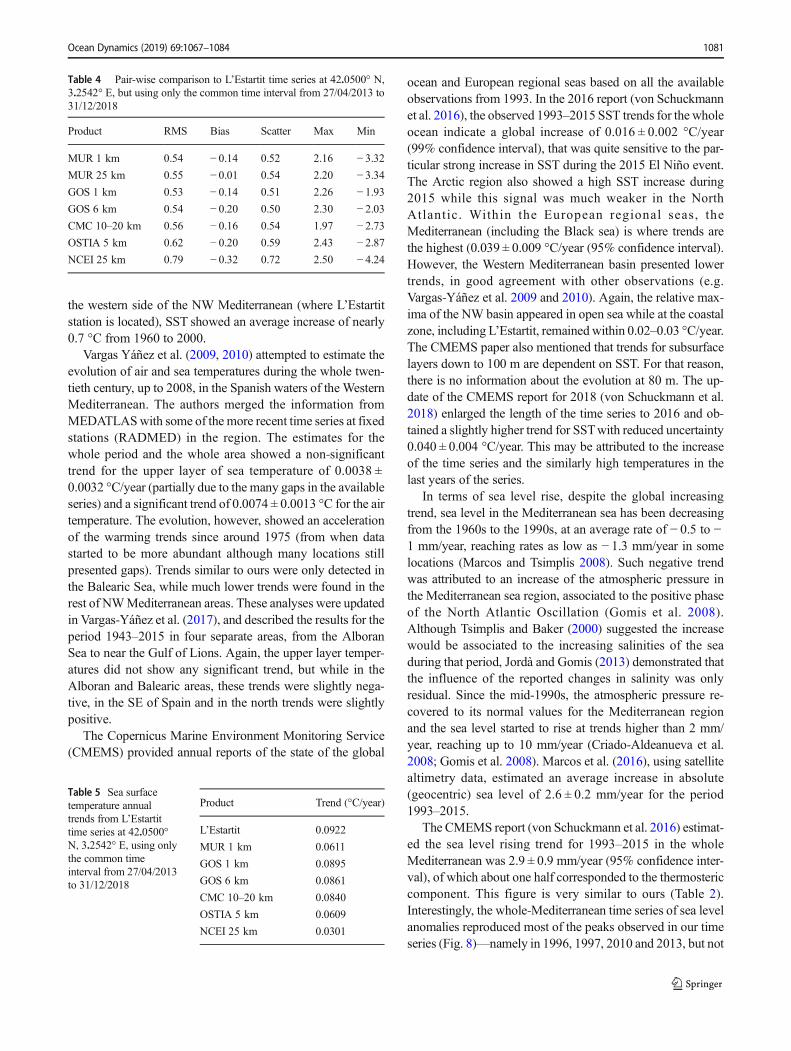
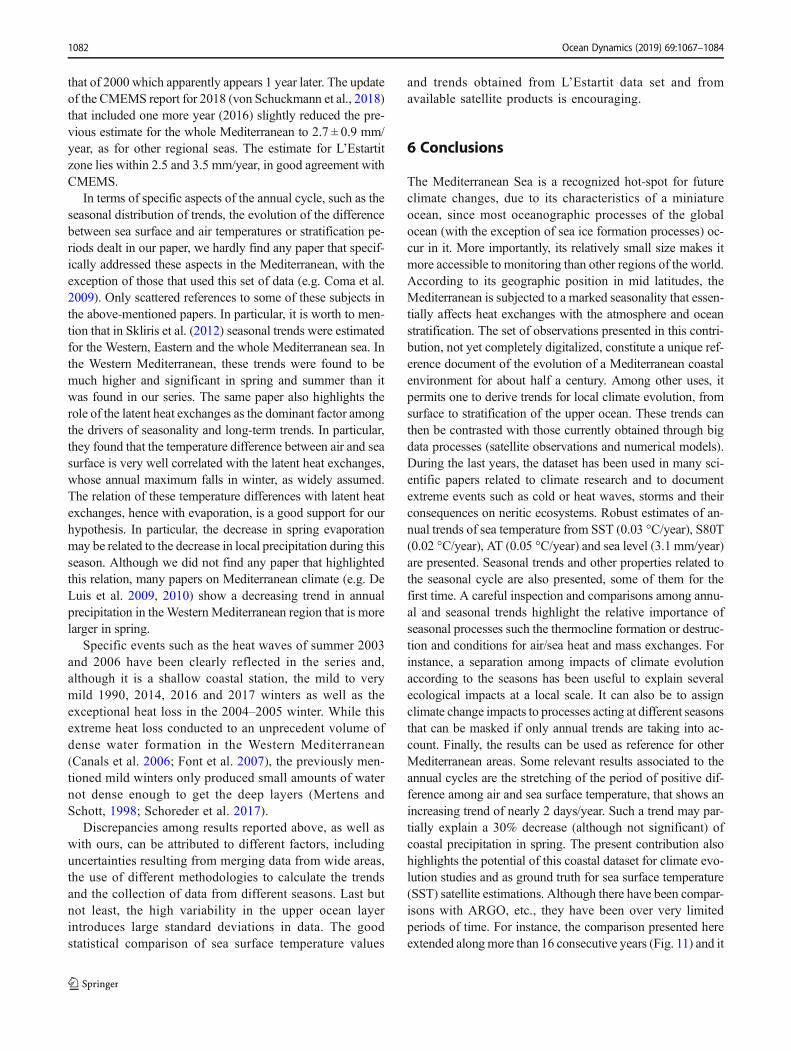
various satellite-based data sets (Fig. 11), with an RMS differ-ence of consistently just over 0.5 °C (Table 3 and Table 4).This is comparable with the typical minimum uncertainty insatellite SST measurement of 0.3–0.5 °C. The satellite SST iscooler than the L’Estartit SST by 0.1 to 0.2 °C on average. Apotential cause for this bias is the diurnal warming of seatemperature: while the satellite data sets are aiming to reportthe pre-dawn temperature, the L’Estartit measurements areperformed mostly in the late morning to noon. We note thatthe feature resolution (smoothness of the SST field) of thesatellite data sets used here varies vastly from around 1 up to
100 km, with the OSTIA and NCEI data sets having a similarfeature resolution of around 100 km despite having fairly dif-ferent grid spacing (Reynolds and Chelton 2010; Chin et al.2017). The comparison statistics (RMS and bias) are remark-ably consistent across feature resolutions up to 25 km, anddegrades only by 0.1 to 0.2 °C for the OSTIA and NCEI datasets. This indicates that the temporal variability of theL’Estartit time series is representative of the areal averageSST from the surrounding sea.
The good statistical comparison of sea surface temperaturevalues (Table 3 and Table 4) and trends (Table 5) obtained
Fig. 10 Time series of annual(blue) and spring (red) precipita-tion and its corresponding lineartrend (significant at 85%)
Fig. 9 Example of high-frequency sea level oscillations (seixes) recorded on 2 June 1994, starting at 06:30 GMT. Enclosed is the atmospheric pressurerecord of the first 12 h of the same day
Ocean Dynamics (2019) 69:1067–1084 1079
from L’Estartit data set and from available satellite productsconfirms that the reported sea surface temperature trends arerobust. Additionally, their good agreement for such a long-term (more than 5 consecutive years) is a first step towardsthe cross-validation of these products. That opportunity tovalidate the multi-decadal trends that can now be observedin satellite data gives more confidence to use these data tomodel and/or parameterize time changes in oceanic states(which have often assumed to be recurring in order to developtheories, e.g. for spatial patterns).
5.2 Comparison with previous and other estimatesof climate trends
Most of the articles published within the two last decadesshow the Western Mediterranean has increased in temperatureand salinity during the twentieth century. Most of these arti-cles, however, focused on the intermediate and deep layers;works dealing with changes in the upper layers and shallowwaters remain scarce. Vargas-Yáñez et al. (2005) analysedcoastal data obtained at several fixed stations and detectedstrong warming trends in the near surface waters, usuallyranging from 0.02 to 0.05 °C/year, up to almost 0.1 °C/year(in the Ligurian sea) during the 1990s. These results (of almostone order of magnitude higher than those found at intermedi-ate and deep waters) contrasted with those from Krahmannand Schott (1998) and Sparnocchia et al. (1994) that found no
significant changes in the temperature evolution of the upperlayer in theWesternMediterranean since the mid-1970s.Morerecent works, that included data from satellite infrared data,evidenced the warming of the surface layer, both in theWestern and Eastern Mediterranean since the mid-1980s tothe first decade of the twenty-first century (Skliris et al.2012; Nykjaer 2009). The trend estimates in these two papersare close to those obtained from our station. Similarly, Rixenet al. (2005), using data from the MEDATLAS database,found positive trends of about 0.02 °C/year in the upper layertemperatures since mid-1980s, after an almost steady (zerotrend) situation in the previous 30 years. Near the coast in
Fig. 11 Time series of sea surfacetemperature recorded fromL’Estartit site (J. Pascual, in clay)and from the Multi-scale Ultra-high Resolution (MUR, in grey)analysis. a 2002–2018. b Zoomfrom 2016 to 2018
Table 3 Pair-wise comparison to L’Estartit time series at 42.0500° N,3.2542° E
Product RMS Bias Scatter Max Min
MUR 1 km 0.60 − 0.04 0.60 4.06 − 3.32MUR 25 km 0.61 0.01 0.61 4.01 − 3.34GOS 1 km 0.51 − 0.16 0.49 2.26 − 1.93GOS 6 km 0.53 −0.22 0.48 2.30 − 2.03CMC 10 km 0.64 − 0.20 0.61 1.97 − 2.73CMC 20 km 0.55 − 0.07 0.55 3.79 − 2.15CMC 10–20 km 0.57 − 0.07 0.56 3.79 − 2.73OSTIA 5 km 0.62 − 0.20 0.59 2.43 − 2.87NCEI 25 km 0.75 − 0.25 0.71 2.50 − 4.24
1080 Ocean Dynamics (2019) 69:1067–1084
the western side of the NW Mediterranean (where L’Estartitstation is located), SST showed an average increase of nearly0.7 °C from 1960 to 2000.
Vargas Yáñez et al. (2009, 2010) attempted to estimate theevolution of air and sea temperatures during the whole twen-tieth century, up to 2008, in the Spanish waters of the WesternMediterranean. The authors merged the information fromMEDATLASwith some of the more recent time series at fixedstations (RADMED) in the region. The estimates for thewhole period and the whole area showed a non-significanttrend for the upper layer of sea temperature of 0.0038 ±0.0032 °C/year (partially due to the many gaps in the availableseries) and a significant trend of 0.0074 ± 0.0013 °C for the airtemperature. The evolution, however, showed an accelerationof the warming trends since around 1975 (from when datastarted to be more abundant although many locations stillpresented gaps). Trends similar to ours were only detected inthe Balearic Sea, while much lower trends were found in therest of NWMediterranean areas. These analyses were updatedin Vargas-Yáñez et al. (2017), and described the results for theperiod 1943–2015 in four separate areas, from the AlboranSea to near the Gulf of Lions. Again, the upper layer temper-atures did not show any significant trend, but while in theAlboran and Balearic areas, these trends were slightly nega-tive, in the SE of Spain and in the north trends were slightlypositive.
The Copernicus Marine Environment Monitoring Service(CMEMS) provided annual reports of the state of the global
ocean and European regional seas based on all the availableobservations from 1993. In the 2016 report (von Schuckmannet al. 2016), the observed 1993–2015 SST trends for the wholeocean indicate a global increase of 0.016 ± 0.002 °C/year(99% confidence interval), that was quite sensitive to the par-ticular strong increase in SST during the 2015 El Niño event.The Arctic region also showed a high SST increase during2015 while this signal was much weaker in the NorthAtlantic. Within the European regional seas, theMediterranean (including the Black sea) is where trends arethe highest (0.039 ± 0.009 °C/year (95% confidence interval).However, the Western Mediterranean basin presented lowertrends, in good agreement with other observations (e.g.Vargas-Yáñez et al. 2009 and 2010). Again, the relative max-ima of the NW basin appeared in open sea while at the coastalzone, including L’Estartit, remainedwithin 0.02–0.03 °C/year.The CMEMS paper also mentioned that trends for subsurfacelayers down to 100 m are dependent on SST. For that reason,there is no information about the evolution at 80 m. The up-date of the CMEMS report for 2018 (von Schuckmann et al.2018) enlarged the length of the time series to 2016 and ob-tained a slightly higher trend for SSTwith reduced uncertainty0.040 ± 0.004 °C/year. This may be attributed to the increaseof the time series and the similarly high temperatures in thelast years of the series.
In terms of sea level rise, despite the global increasingtrend, sea level in the Mediterranean sea has been decreasingfrom the 1960s to the 1990s, at an average rate of − 0.5 to −1 mm/year, reaching rates as low as − 1.3 mm/year in somelocations (Marcos and Tsimplis 2008). Such negative trendwas attributed to an increase of the atmospheric pressure inthe Mediterranean sea region, associated to the positive phaseof the North Atlantic Oscillation (Gomis et al. 2008).Although Tsimplis and Baker (2000) suggested the increasewould be associated to the increasing salinities of the seaduring that period, Jordà and Gomis (2013) demonstrated thatthe influence of the reported changes in salinity was onlyresidual. Since the mid-1990s, the atmospheric pressure re-covered to its normal values for the Mediterranean regionand the sea level started to rise at trends higher than 2 mm/year, reaching up to 10 mm/year (Criado-Aldeanueva et al.2008; Gomis et al. 2008). Marcos et al. (2016), using satellitealtimetry data, estimated an average increase in absolute(geocentric) sea level of 2.6 ± 0.2 mm/year for the period1993–2015.
The CMEMS report (von Schuckmann et al. 2016) estimat-ed the sea level rising trend for 1993–2015 in the wholeMediterranean was 2.9 ± 0.9 mm/year (95% confidence inter-val), of which about one half corresponded to the thermostericcomponent. This figure is very similar to ours (Table 2).Interestingly, the whole-Mediterranean time series of sea levelanomalies reproduced most of the peaks observed in our timeseries (Fig. 8)—namely in 1996, 1997, 2010 and 2013, but not
Table 4 Pair-wise comparison to L’Estartit time series at 42.0500° N,3.2542° E, but using only the common time interval from 27/04/2013 to31/12/2018
Product RMS Bias Scatter Max Min
MUR 1 km 0.54 − 0.14 0.52 2.16 − 3.32MUR 25 km 0.55 − 0.01 0.54 2.20 − 3.34GOS 1 km 0.53 − 0.14 0.51 2.26 − 1.93GOS 6 km 0.54 − 0.20 0.50 2.30 − 2.03CMC 10–20 km 0.56 − 0.16 0.54 1.97 − 2.73OSTIA 5 km 0.62 − 0.20 0.59 2.43 − 2.87NCEI 25 km 0.79 − 0.32 0.72 2.50 − 4.24
Table 5 Sea surfacetemperature annualtrends from L’Estartittime series at 42.0500°N, 3.2542° E, using onlythe common timeinterval from 27/04/2013to 31/12/2018
Product Trend (°C/year)
L’Estartit 0.0922
MUR 1 km 0.0611
GOS 1 km 0.0895
GOS 6 km 0.0861
CMC 10–20 km 0.0840
OSTIA 5 km 0.0609
NCEI 25 km 0.0301
Ocean Dynamics (2019) 69:1067–1084 1081
that of 2000 which apparently appears 1 year later. The updateof the CMEMS report for 2018 (von Schuckmann et al., 2018)that included one more year (2016) slightly reduced the pre-vious estimate for the whole Mediterranean to 2.7 ± 0.9 mm/year, as for other regional seas. The estimate for L’Estartitzone lies within 2.5 and 3.5 mm/year, in good agreement withCMEMS.
In terms of specific aspects of the annual cycle, such as theseasonal distribution of trends, the evolution of the differencebetween sea surface and air temperatures or stratification pe-riods dealt in our paper, we hardly find any paper that specif-ically addressed these aspects in the Mediterranean, with theexception of those that used this set of data (e.g. Coma et al.2009). Only scattered references to some of these subjects inthe above-mentioned papers. In particular, it is worth to men-tion that in Skliris et al. (2012) seasonal trends were estimatedfor the Western, Eastern and the whole Mediterranean sea. Inthe Western Mediterranean, these trends were found to bemuch higher and significant in spring and summer than itwas found in our series. The same paper also highlights therole of the latent heat exchanges as the dominant factor amongthe drivers of seasonality and long-term trends. In particular,they found that the temperature difference between air and seasurface is very well correlated with the latent heat exchanges,whose annual maximum falls in winter, as widely assumed.The relation of these temperature differences with latent heatexchanges, hence with evaporation, is a good support for ourhypothesis. In particular, the decrease in spring evaporationmay be related to the decrease in local precipitation during thisseason. Although we did not find any paper that highlightedthis relation, many papers on Mediterranean climate (e.g. DeLuis et al. 2009, 2010) show a decreasing trend in annualprecipitation in the Western Mediterranean region that is morelarger in spring.
Specific events such as the heat waves of summer 2003and 2006 have been clearly reflected in the series and,although it is a shallow coastal station, the mild to verymild 1990, 2014, 2016 and 2017 winters as well as theexceptional heat loss in the 2004–2005 winter. While thisextreme heat loss conducted to an unprecedent volume ofdense water formation in the Western Mediterranean(Canals et al. 2006; Font et al. 2007), the previously men-tioned mild winters only produced small amounts of waternot dense enough to get the deep layers (Mertens andSchott, 1998; Schoreder et al. 2017).
Discrepancies among results reported above, as well aswith ours, can be attributed to different factors, includinguncertainties resulting from merging data from wide areas,the use of different methodologies to calculate the trendsand the collection of data from different seasons. Last butnot least, the high variability in the upper ocean layerintroduces large standard deviations in data. The goodstatistical comparison of sea surface temperature values
and trends obtained from L’Estartit data set and fromavailable satellite products is encouraging.
6 Conclusions
The Mediterranean Sea is a recognized hot-spot for futureclimate changes, due to its characteristics of a miniatureocean, since most oceanographic processes of the globalocean (with the exception of sea ice formation processes) oc-cur in it. More importantly, its relatively small size makes itmore accessible to monitoring than other regions of the world.According to its geographic position in mid latitudes, theMediterranean is subjected to a marked seasonality that essen-tially affects heat exchanges with the atmosphere and oceanstratification. The set of observations presented in this contri-bution, not yet completely digitalized, constitute a unique ref-erence document of the evolution of a Mediterranean coastalenvironment for about half a century. Among other uses, itpermits one to derive trends for local climate evolution, fromsurface to stratification of the upper ocean. These trends canthen be contrasted with those currently obtained through bigdata processes (satellite observations and numerical models).During the last years, the dataset has been used in many sci-entific papers related to climate research and to documentextreme events such as cold or heat waves, storms and theirconsequences on neritic ecosystems. Robust estimates of an-nual trends of sea temperature from SST (0.03 °C/year), S80T(0.02 °C/year), AT (0.05 °C/year) and sea level (3.1 mm/year)are presented. Seasonal trends and other properties related tothe seasonal cycle are also presented, some of them for thefirst time. A careful inspection and comparisons among annu-al and seasonal trends highlight the relative importance ofseasonal processes such the thermocline formation or destruc-tion and conditions for air/sea heat and mass exchanges. Forinstance, a separation among impacts of climate evolutionaccording to the seasons has been useful to explain severalecological impacts at a local scale. It can also be to assignclimate change impacts to processes acting at different seasonsthat can be masked if only annual trends are taking into ac-count. Finally, the results can be used as reference for otherMediterranean areas. Some relevant results associated to theannual cycles are the stretching of the period of positive dif-ference among air and sea surface temperature, that shows anincreasing trend of nearly 2 days/year. Such a trend may par-tially explain a 30% decrease (although not significant) ofcoastal precipitation in spring. The present contribution alsohighlights the potential of this coastal dataset for climate evo-lution studies and as ground truth for sea surface temperature(SST) satellite estimations. Although there have been compar-isons with ARGO, etc., they have been over very limitedperiods of time. For instance, the comparison presented hereextended alongmore than 16 consecutive years (Fig. 11) and it
1082 Ocean Dynamics (2019) 69:1067–1084
is up to our knowledge the longest ever done. The good sta-tistical agreement between on-site SST measurements andSSTobtained from satellite observations confirms the reportedpositive trends are robust. In views of the results presentedhere, we propose L’Estartit observational site should becomea long-term ground truth for satellite observations and a re-gional monitoring site for climate change.
Acknowledgements The authors acknowledge technical support fromthe Institut de Ciències del Mar (ICM/CSIC) to maintain the time seriesof L’Estartit. MF acknowledges support from the National Aeronauticsand Space Administrat ion (NASA) through grant numberNNX15AG42G. The work by TMC and JV was performed at the JetPropulsion Laboratory, California Institute of Technology, under contractwith the NASA. The authors also thank the always warm atmospherefound in the Liège Colloquium and the suggestions received from theparticipants. The advice from the Editor and the reviews from three anon-ymous referees have greatly contributed to improve the original manu-script to reach the final version of this paper. The help of Dr. C. Behrensfrom PANGAEA was crucial to facilitate data publication in thatrepository.
Open Access This article is distributed under the terms of the CreativeCommons At t r ibut ion 4 .0 In te rna t ional License (h t tp : / /creativecommons.org/licenses/by/4.0/), which permits unrestricted use,distribution, and reproduction in any medium, provided you give appro-priate credit to the original author(s) and the source, provide a link to theCreative Commons license, and indicate if changes were made.
References
Bograd SJ, Checkley DA Jr, WoosterWS (2003) CalCOFI: a half centuryof physical, chemical, and biological research in the CaliforniaCurrent System. Deep-sea Res Part II-Topical Studies inOceanography 50:2349–2353. https://doi.org/10.1016/S0967-0645(03)00122-X
Bougis P, Carré C (1960) Conditions hydrologiques à Villefranche surMer pendant les années 1957 et 1958. Cahiers Océanographiques12(6):392–408
Brasnett B (2008) The impact of satellite retrievals in a global sea-surface-temperature analysis. QJR Meteorol Soc 134:1745–1760.https://doi.org/10.1002/qj.319
Bryden HL, Longworth HR, Cunningham SA (2005) Slowing of theAtlantic meridional overturning circulation at 25°N. Nature 438:655–657. https://doi.org/10.1038/nature04385
Buongiorno-Nardelli B, Tronconi C, Pisano A, Santoleri R (2013) Highand ultra-high resolution processing of satellite sea surface temper-ature data over southern European seas in the framework ofMyOcean project. Remote Sens Environ 129(1–16):1–16
Canals M, Puig P, Durrieu de Madron X, Heussner S, Palanques A,Fabres J (2006) Flushing submarine canyons. Nature 444:354–357
Chin TM, Vazquez-Cuervo J, Armstrong E (2017) A multi-scale high-resolution analysis of global sea surface temperature. Remote SensEnviron 200:154–169
Coma R, Ribes M, Serrano E, Jiménez E, Salat J, Pascual J (2009) Globalwarming-enhanced stratification and mass mortality events in theMediterranean. PNAS 106:6176–6181. https://doi.org/10.1073/pnas.0805801106
Criado-Aldeanueva F, Vera JDR, García-Lafuente J (2008) Steric andmass-induced Mediterranean Sea level trends from 14 years of
altimetry data. Glob Planet Chang 60:563–575. https://doi.org/10.1016/j.gloplacha.2007.07.003
De Luis M, González-Hidalgo JC, Longares LA, Štepánek P (2009)Seasonal precipitation trends in the Mediterranean IberianPeninsula in second half of 20th century. Int J Climatol 29:1312–1323. https://doi.org/10.1002/joc.1778
De Luis M, Brunetti M, González-Hidalgo JC, Longares LA, Martin-Vide J (2010) Changes in seasonal precipitation in the IberianPeninsula during 1946-2005. Glob Planet Chang 74:27–33. https://doi.org/10.1016/j.gloplacha.2010.06.006
Donlon CJ, Martin M, Stark JD, Roberts-Jones J, Fiedler E, Wimmer W(2012) The operational sea surface temperature and sea ice analysis(OSTIA) system. Remote Sens Environ 116:140–158
Font J, Salat J, Tintoré J (1988) In: Minas HJ, Nival P (eds) Permanentfeatures of the circulation in the Catalan Sea, vol 9. PelagicMediterranean Oceanography; Oceanologica Acta, pp 51–57
Font J, Puig P, Salat J, Palanques A, Emelianov M (2007) Sequence ofhydrographic changes in NW Mediterranean deep water due to theexceptional winter of 2005. Sci Mar 71(2):339–346
Ganachaud A, Wunsch C, Marotzke J, Toole J (2000) Meridionaloverturning and large-scale circulation of the Indian Ocean. JGeophys Res: Oceans 105(C11):26117–26134. https://doi.org/10.1029/2000JC900122
Goikoetxea N, Borja A, Fontán A, González M, Valencia V (2009)Trends and anomalies in sea-surface temperature, observed overthe last 60 years, within the southeastern Bay of Biscay. ContinShelf Res 29:1060–1069
Gomis D, Ruiz S, Sotillo MG, Álvarez-Fanjul E, Terradas J (2008) Lowfrequency Mediterranean Sea level variability: the contribution ofatmospheric pressure and wind. Glob Planet Chang 63:215–229.https://doi.org/10.1016/j.gloplacha.2008.06.005
JacobsWC (1942) On the energy exchange between sea and atmosphere.J Mar Res 5:37–66
JordàG, Gomis D (2013) Reliability of the steric andmass components ofMediterranean Sea level as estimated from hydrographic griddedproducts. Geophys Res Lett 40:3655–3660. https://doi.org/10.1002/grl.50718
Krahmann G, Schott F (1998) Longterm increases in westernMediterranean salinities and temperatures: anthropogenic and cli-matic sources. Geophys Res Lett 25:4209–4212. https://doi.org/10.1029/1998GL900143
Marcos M, Tsimplis MN (2008) Coastal Sea level trends in SouthernEurope. Geophys J Int 175:70–82. https://doi.org/10.1111/j.1365-246X.2008.03892.x
Marcos M., Jordà G., Le Cozannett G. (2016). Sea level rise and itsimpacts on the Mediterranean. In: All Envi (ed) TheMediterranean region under climate change. A scientific update.IRD Éditions, Marseille: 265–275
Mertens C, Schott F (1998) Interannual variability of deep-water forma-tion in the northwestern Mediterranean. J Phys Oceanogr 28:1410–1424
Nykjaer L (2009) Mediterranean Sea surface warming 1985-2006. ClimRes 39:11–17. https://doi.org/10.3354/cr00794
Pascual J, Salat J (2019) Oceanographic and meteorological observationsfrom L’Estartit meteorological and oceanographical station in theNW Mediterranean. PANGAEA, https://doi.org/10.1594/PANGAEA.902591
Reynolds RW, Chelton DB (2010) Comparisons of daily sea surfacetemperature analyses for 2007-08. J Clim 23:3545–3562
Reynolds RW, Smith TM, Liu C, Chelton DB, Casey KS, Schlax MG(2007) Daily high-resolution-blended analyses for sea surface tem-perature. J Clim 20:5473–5496
Rixen M, Beckers JM, Levitus S, Antonov J, Boyer T, Maillard C,Fichaut M, Balopoulos E, Iona S, Dooley H, Garcia MJ, Manca B,Giorgetti A, Manzella GMR, Mikhailov N, Pinardi N, Zavatarelli M(2005) The Western Mediterranean DeepWater: a proxy for climate
Ocean Dynamics (2019) 69:1067–1084 1083
change. Geophys Res Lett 32:L12608. https://doi.org/10.1029/2005GL022702
Schoreder K, Chiggiato J, Josey SA, BorghiniM, Aracri S, Sparnocchia S(2017) Rapid response to climate change in a marginal sea. Sci Rep7:4065. https://doi.org/10.1038/s41598-017-04455-5
Skliris N, Sofianos SS, Gkanasos A, Mantziafou A, Versatis V,Axaopoulos P, Lascaratos A (2012) Decadal scale variability ofsea surface temperatura in the Mediterranean Sea in relation to at-mospheric variability. Ocean Dyn 62:13–30. https://doi.org/10.1007/s10236-011-0493-5
Sparnocchia S., Manzella G.M.R., La Violette P.E. (1994) The interan-nual and seasonal variability of the MAW and LIW core propertiesin the Western Mediterranean Sea. In: seasonal and interannual var-iability of the Western Mediterranean Sea. P.E. La Viollette (Ed.).Coast Estuar Stud, 46: 177–194
Sverdrup HU, Johnson MW, Fleming RH (1942) The oceans, their phys-ics, chemistry and general biology. Prentice-Hall, New York
Tsimplis MN, Baker TF (2000) Sea level drop in the Mediterranean Sea:an indicator of deep water salinity and temperature changes?Geophys Res Lett 27:1731–1734. https://doi.org/10.1029/1999GL007004
Vargas-Yáñez M, Salat J, Fernández de Puelles ML, López-Jurado JL,Pascual J, Ramírez T, Cortés D, Franco I (2005) Trends and timevariability in the northern continental shelf of the westernMediterranean. J Geophys Res 110:C10019. https://doi.org/10.1029/2004JC002799
Vargas-Yáñez M, Moya F, Tel E, García-Martínez MC, Guerber E,Bourgeon M (2009) Warming and salting of the WesternMediterranean during the second half of the XX century: inconsis-tencies, unknowns and the effect of data processing. Sci Mar 73:7–28. https://doi.org/10.3989/scimar.2009.73n1007
Vargas-YáñezM,Moya F, García-MartínezMC, Tel E, Zunino P, Plaza F,Salat J, Pascual J, López-Jurado JL, Serra M (2010) Climate changein the Western Mediterranean Sea 1900–2008. J Mar Syst 82:171–176. https://doi.org/10.1016/j.jmarsys.2010.04.013
Vargas-Yáñez M, García-Martínez MC, Moya F, Balbin R, López-JuradoJL, Serra M, Zunino P, Pascual J, Salat J (2017) Updating tempera-ture and salinity mean values and trends in the WesternMediterranean: RADMED project. Prog Oceanog 157:27–46.https://doi.org/10.1016/j.pocean.2017.09.004
von Schuckmann K, Le Traon PY, Álvarez-Fanjul E et al (2016) TheCopernicus marine environment monitoring service ocean state re-port. J Operational Oceanography 9(sup2):s235–s320. https://doi.org/10.1080/1755876X.2016.1273446
von Schuckmann K. Le Traon P.Y., Smith N., Pascual A., Brasseur P.,Fennel K., Djavidnia S. (Eds) (2018). Copernicus marine serviceocean state report, J. Operational Oceanography, 11: sup1, S1-S142, doi: https://doi.org/10.1080/1755876X.2018.1489208
WOCE (1988) WOCE implementation plan. Detailed requirements andscientific background. WCRP Series, 11, Geneva (Switzerland),317p
1084 Ocean Dynamics (2019) 69:1067–1084