fortune favours the gold · 2 except for the statements of historical fact contained herein, the...
TRANSCRIPT
TSX: SSL
FORTUNE FAVOURS THE GOLD
MAY 2018
NYSE AMERICAN: SAND
2
Except for the statements of historical fact contained herein, the information presented constitutes "forward-looking statements", within the meaning of the U.S. Securities Act of 1933, the U.S. Securities Exchange Act of 1934, the Private Securities Litigation Reform Act of 1995 and applicable Canadian securities legislation, concerning the business, operations and financial performance and condition of Sandstorm GoldLtd. (“Sandstorm”). Forward-looking statements include, but are not limited to, statements with respect to the future price of gold, the estimation of mineral reserves and resources, realization of mineral reserve estimates, the timing and amount of estimated future production.
Forward-looking statements are made based upon certain assumptions and other important factors that, if untrue, could cause the actual results, performances or achievements of Sandstorm to be materially different from future results, performances or achievements expressed or implied by such statements. Such statements and information are based on numerous assumptions regarding present and future business strategies and the environment in which Sandstorm will operate in the future, including the price of gold and anticipated costs. Certain important factors that could cause actual results, performances or achievements to differ materially from those in the forward-looking statements include, amongst others, gold and other commodity price volatility, discrepancies between actual and estimated production, mineral reserves and resources and metallurgical recoveries, mining operational and development risks relating to the parties which produce the gold Sandstorm will purchase, regulatory restrictions, activities by governmental authorities (including changes in taxation), currency fluctuations, the global economic climate, dilution, share price volatility and competition.
Forward-looking statements are subject to known and unknown risks, uncertainties and other important factors that may cause the actual results, level of activity, performance or achievements of Sandstorm to be materially different from those expressed or implied by such forward-looking statements, including but not limited to: the impact of general business and economic conditions, the absence of control over mining operations from which Sandstorm will purchase gold, other commodities or receive royalties from, and risks related to those mining operations, including risks related to international operations, government and environmental regulation, actual results of current exploration activities, conclusions of economic evaluations and changes in project parameters as plans continue to be refined, risks in the marketability of minerals, fluctuations in the price of gold and other commodities, fluctuation in foreign exchange rates and interest rates, stock market volatility, as well as those factors discussed in the section entitled “Risks to Sandstorm” in Sandstorm’s annual report for the financial year ended December 31, 2017 and the Company’s annual information form dated March 29, 2018 available at www.sedar.com. Although Sandstorm has attempted to identify important factors that could cause actual results to differ materially from those contained in forward-looking statements, there may be other factors that cause results not to be as anticipated, estimated or intended. There can be no assurance that such statements will prove to be accurate, as actual results and future events could differ materially from those anticipated in such statements. Accordingly, readers should not place undue reliance on forward-looking statements. Sandstorm does not undertake to update any forward looking statements that are contained or incorporated by reference, except in accordance with applicable securities laws.
CAUTIONARY NOTE REGARDINGFORWARD-LOOKING INFORMATION
3
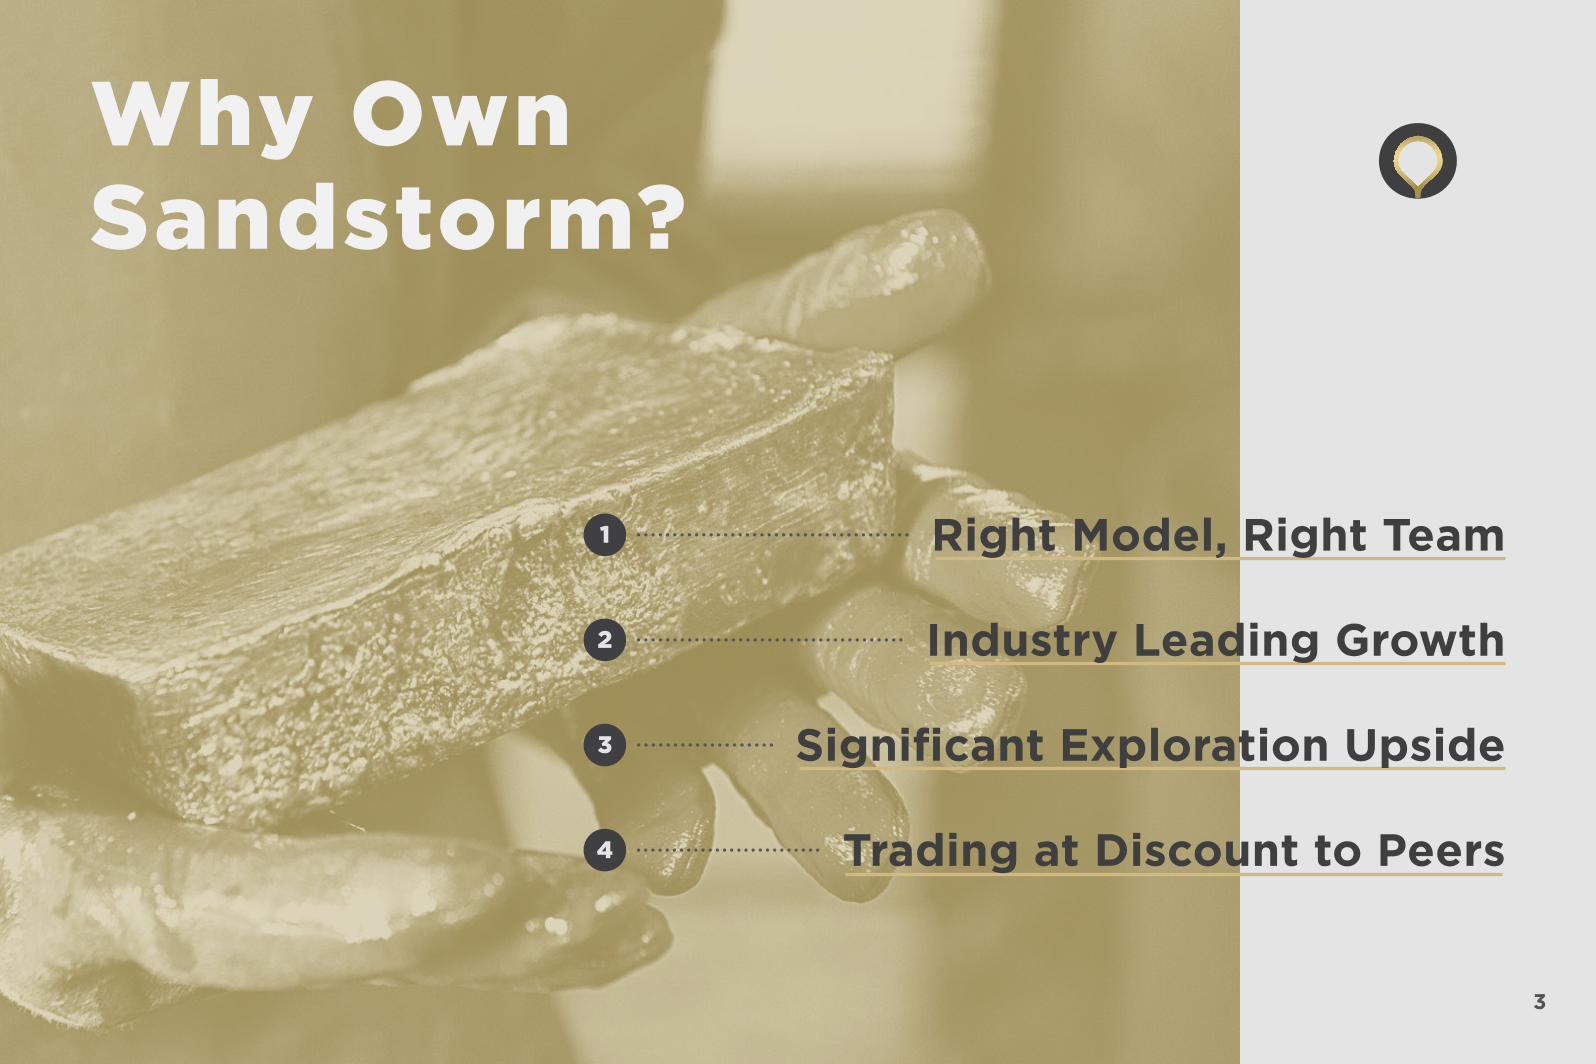
Why OwnSandstorm?
Right Model, Right Team
Industry Leading Growth
Significant Exploration Upside
Trading at Discount to Peers
1
2
3
4

4
The RightTechnical Team
Our technical team average 40 years experience in the mining industry

5
Transaction experience includes more than$3 billion in royalty financings
The RightManagement
Team
6
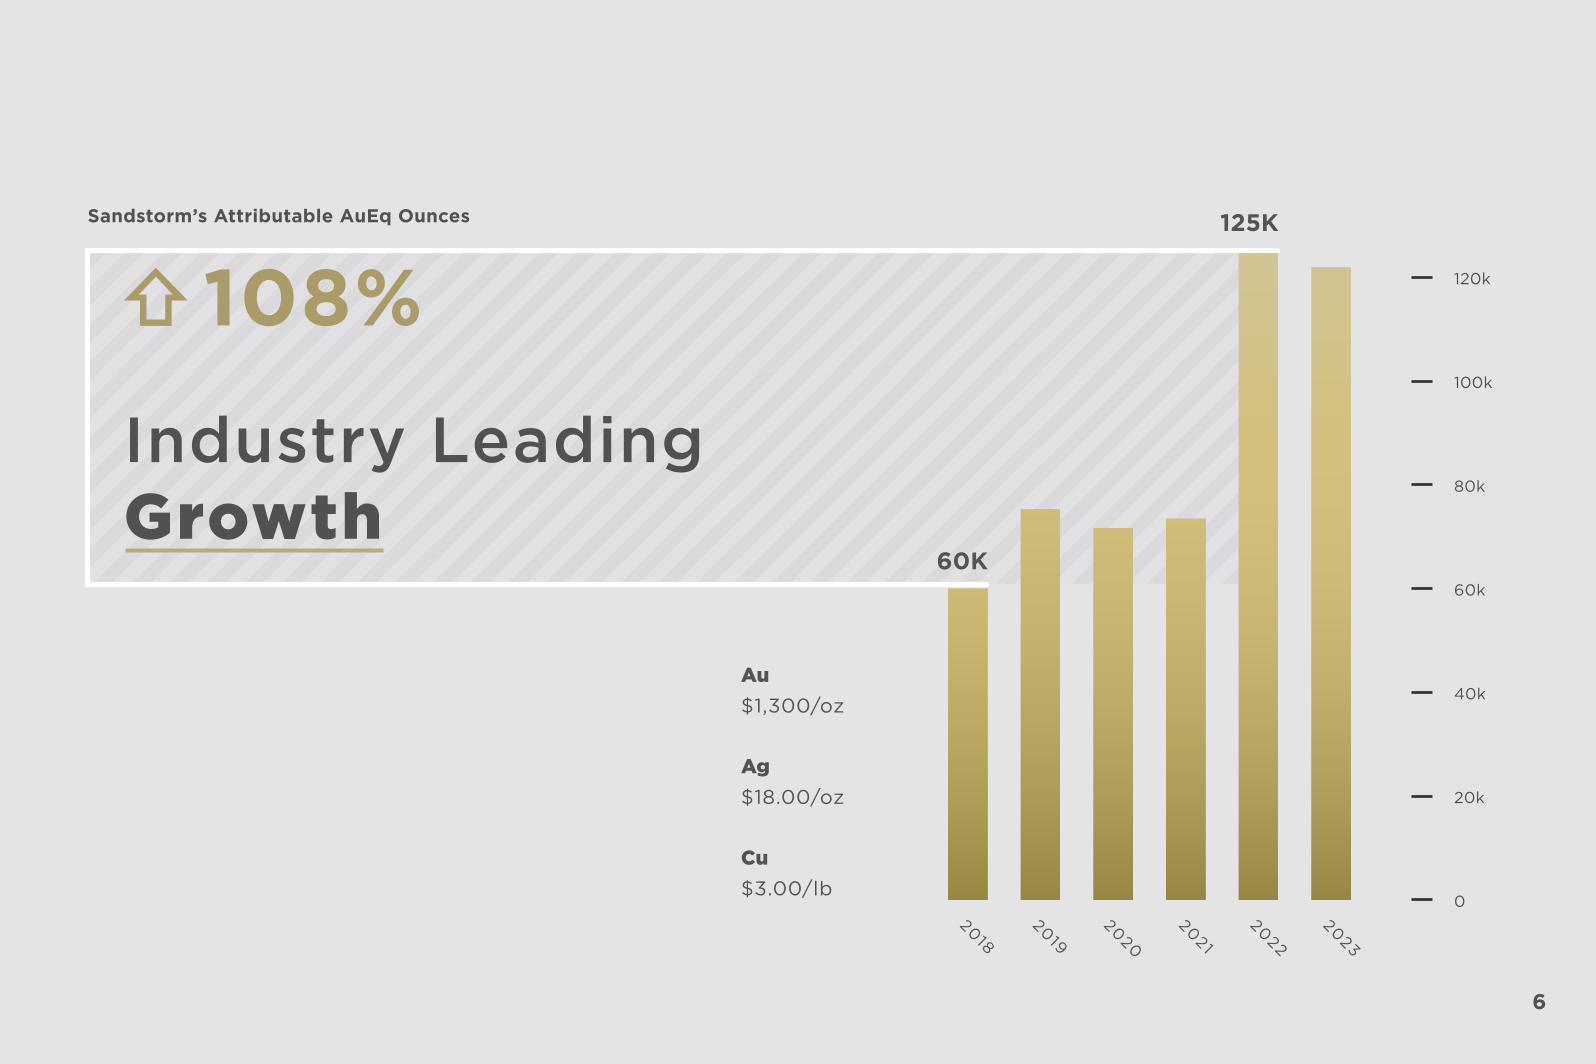
Sandstorm’s Attributable AuEq Ounces
Industry LeadingGrowth
108%
40k
20k
0
60k
80k
100k
120k
20182021
20222023
20192020
60K
125K
Au$1,300/oz
Ag$18.00/oz
Cu$3.00/lb
7
INDUSTRY LEADING GROWTH
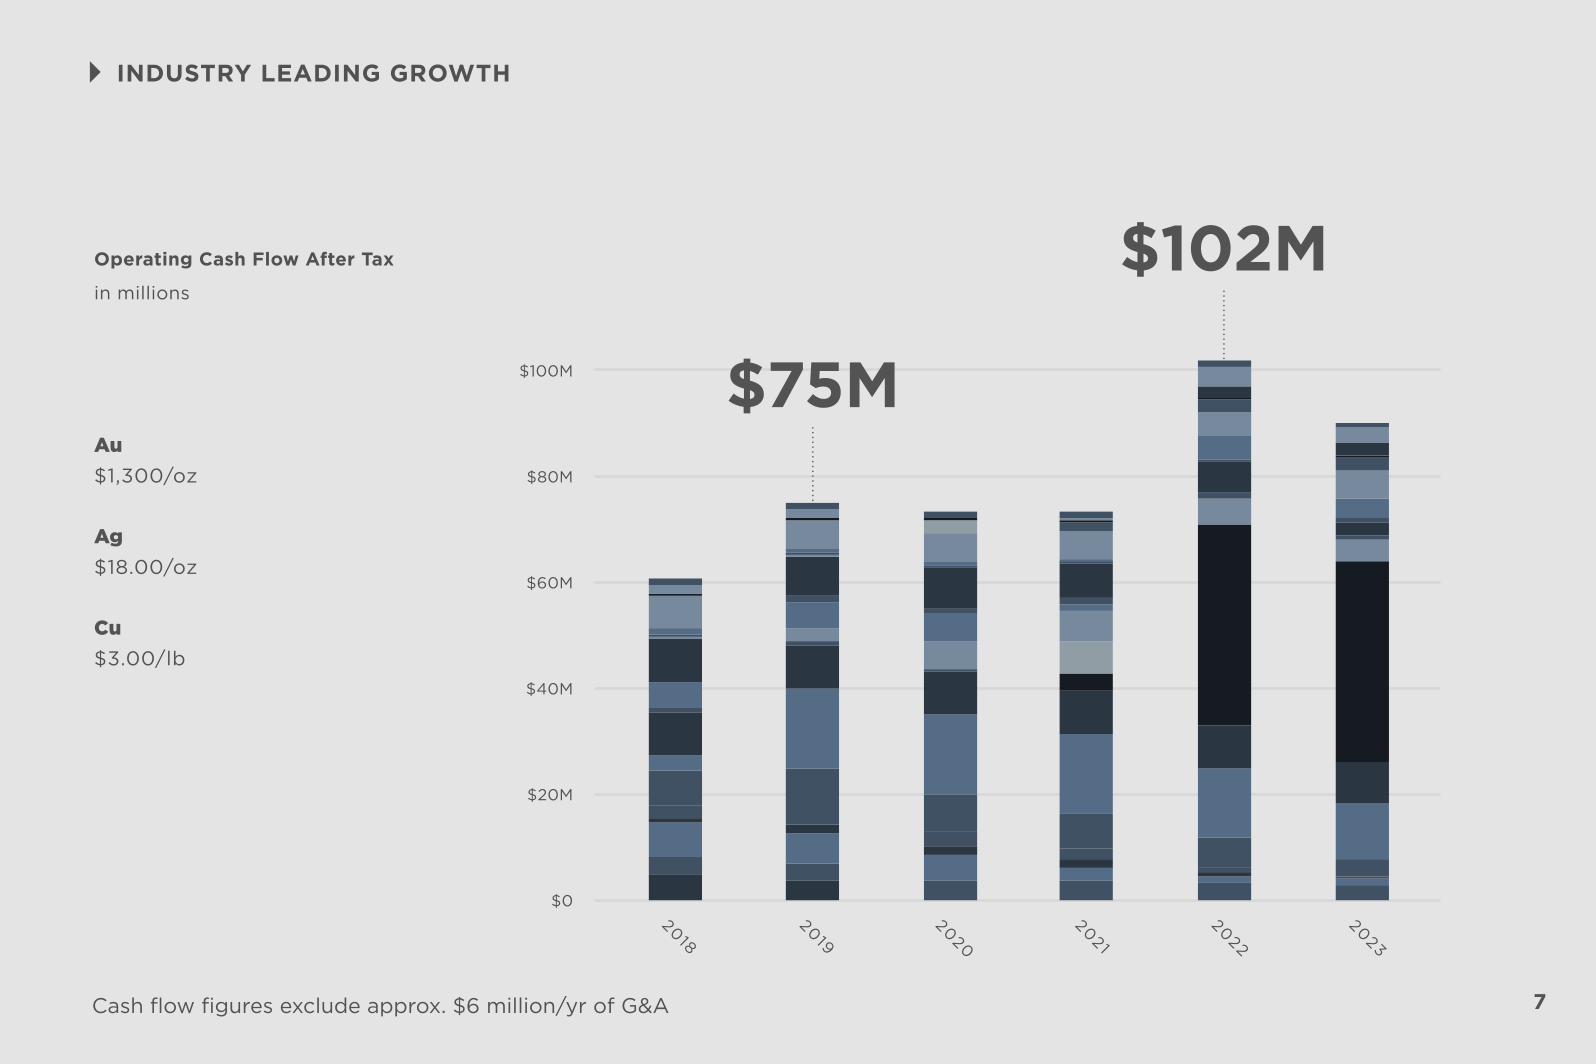
Operating Cash Flow After Tax
in millions
20182021
20222023
$20M
$0
$40M
$60M
$100M
$80M
20192020
Au$1,300/oz
Ag$18.00/oz
Cu$3.00/lb
$102M
$75M
Cash flow figures exclude approx. $6 million/yr of G&A
8
INDUSTRY LEADING GROWTH
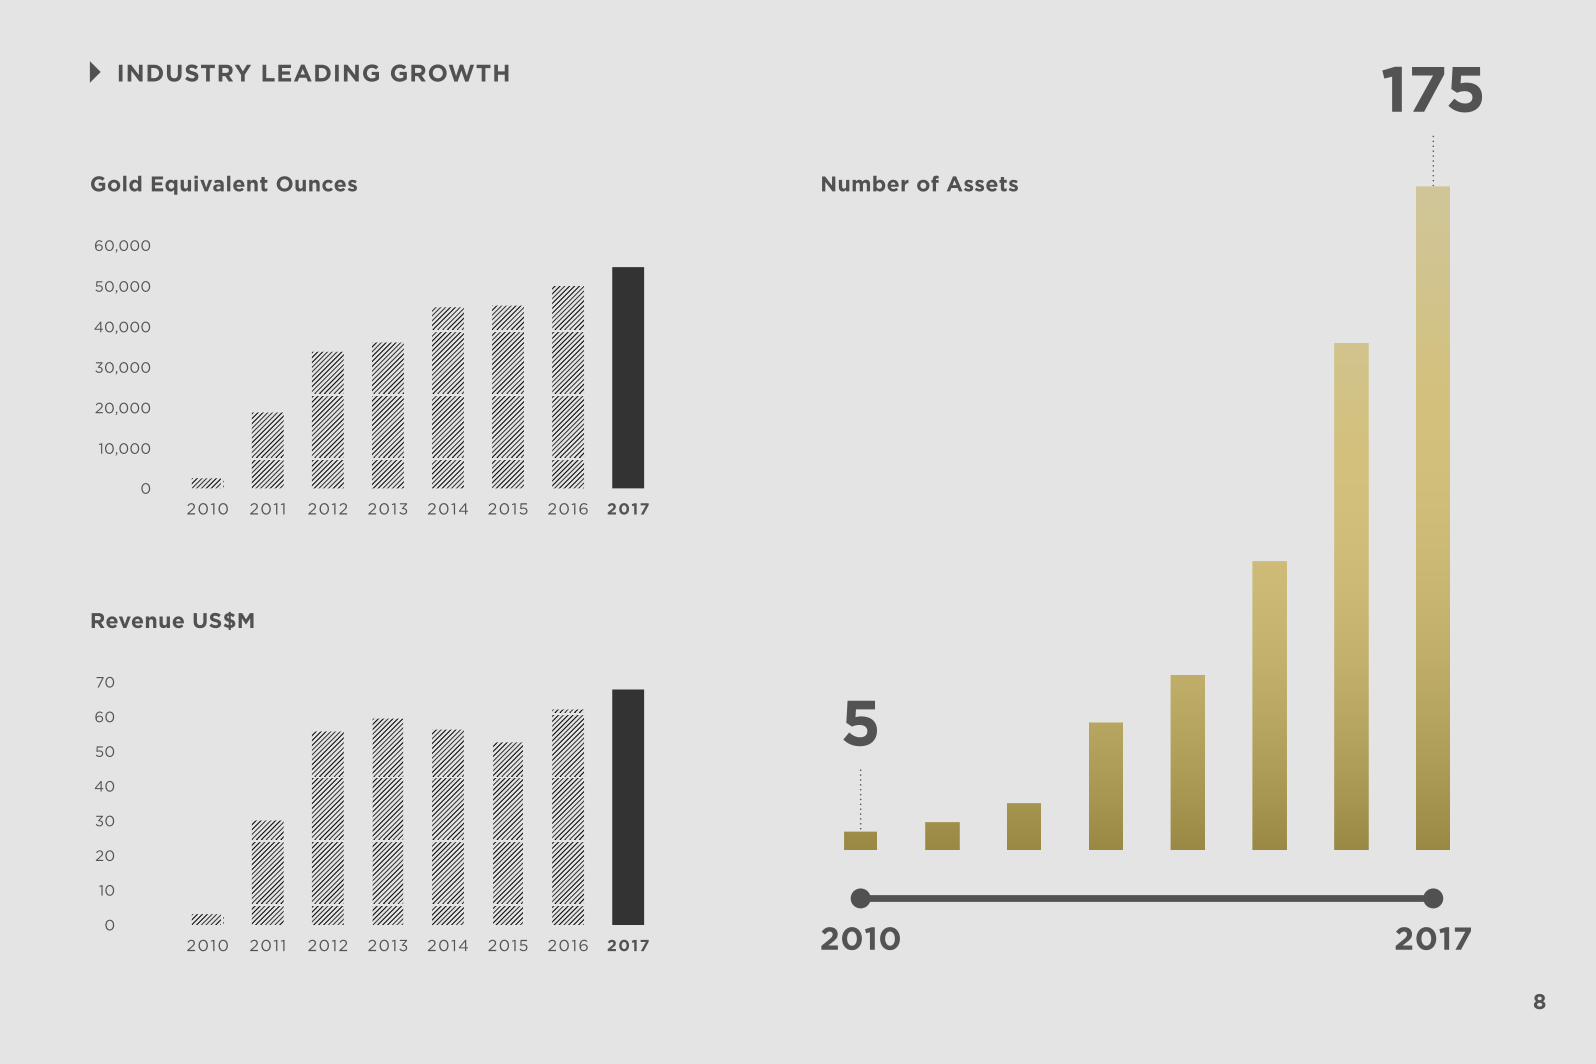
Gold Equivalent Ounces
2010 2011 2012 2013 2014 2015 201720160
10,000
20,000
30,000
40,000
50,000
60,000
Revenue US$M
2010 2011 2012 2013 2014 2015 201720160
10
20
30
40
50
70
60
175
5
Number of Assets
2010 2017
9
100%
2010
2018
INDUSTRY LEADING GROWTH
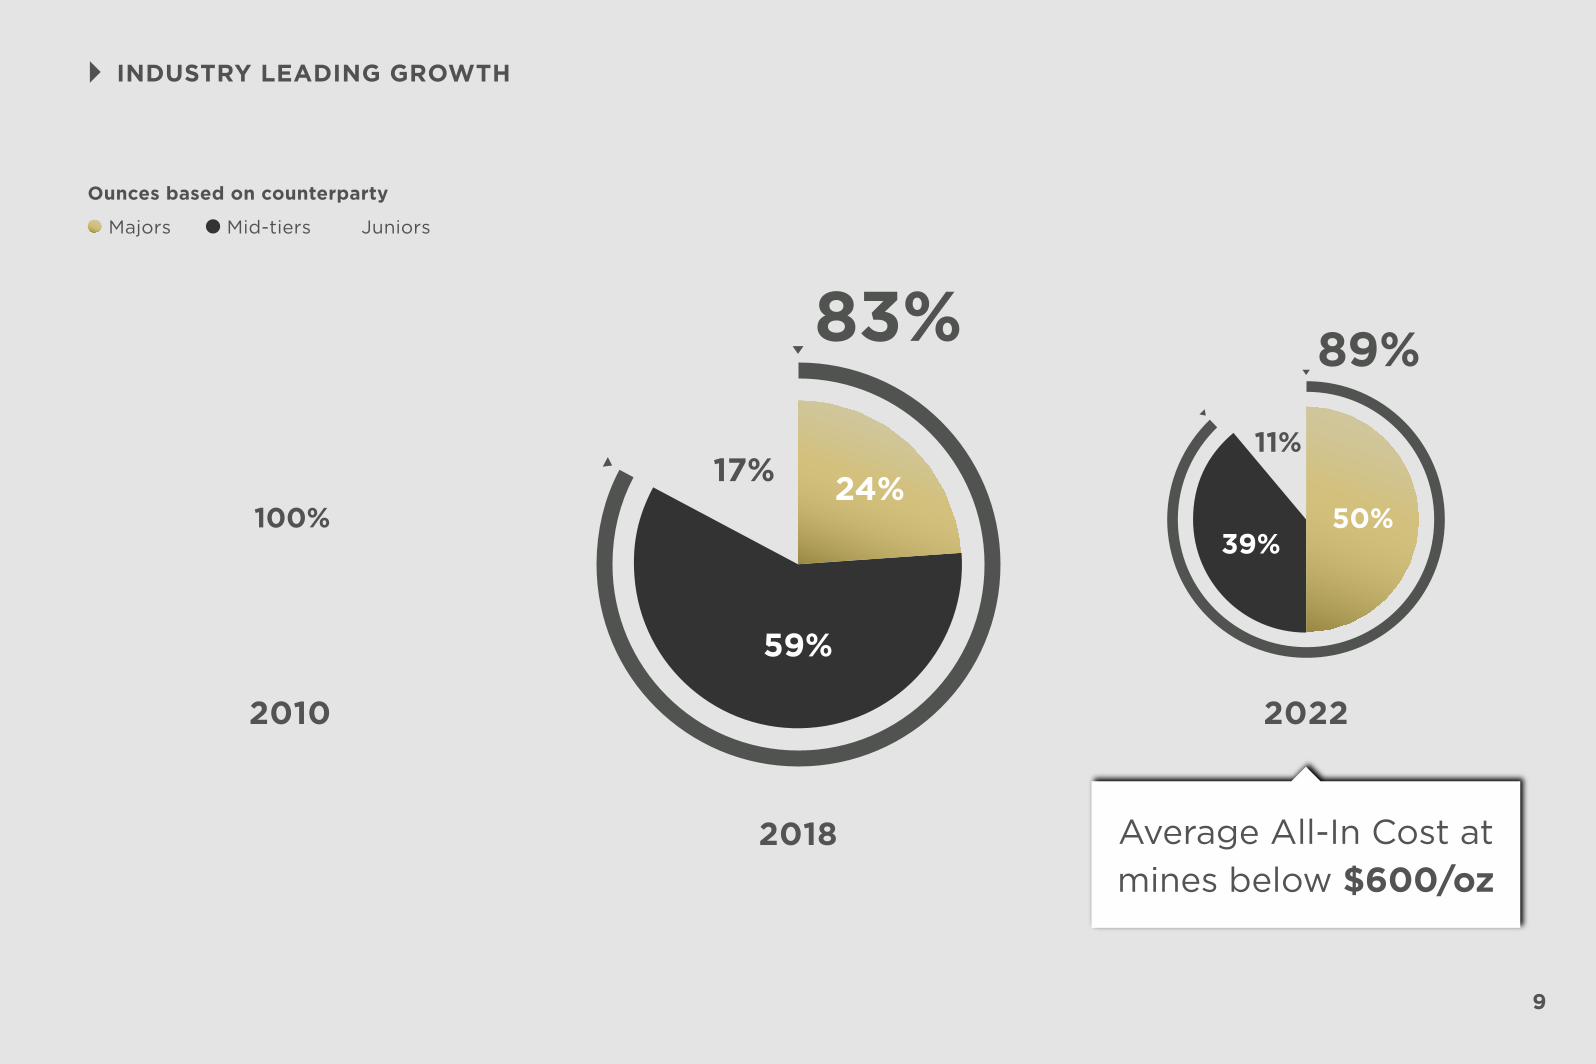
Ounces based on counterparty
Majors JuniorsMid-tiers
Average All-In Cost atmines below $600/oz
83%
24%
59%
17%
2022
89%
50%39%
11%
10
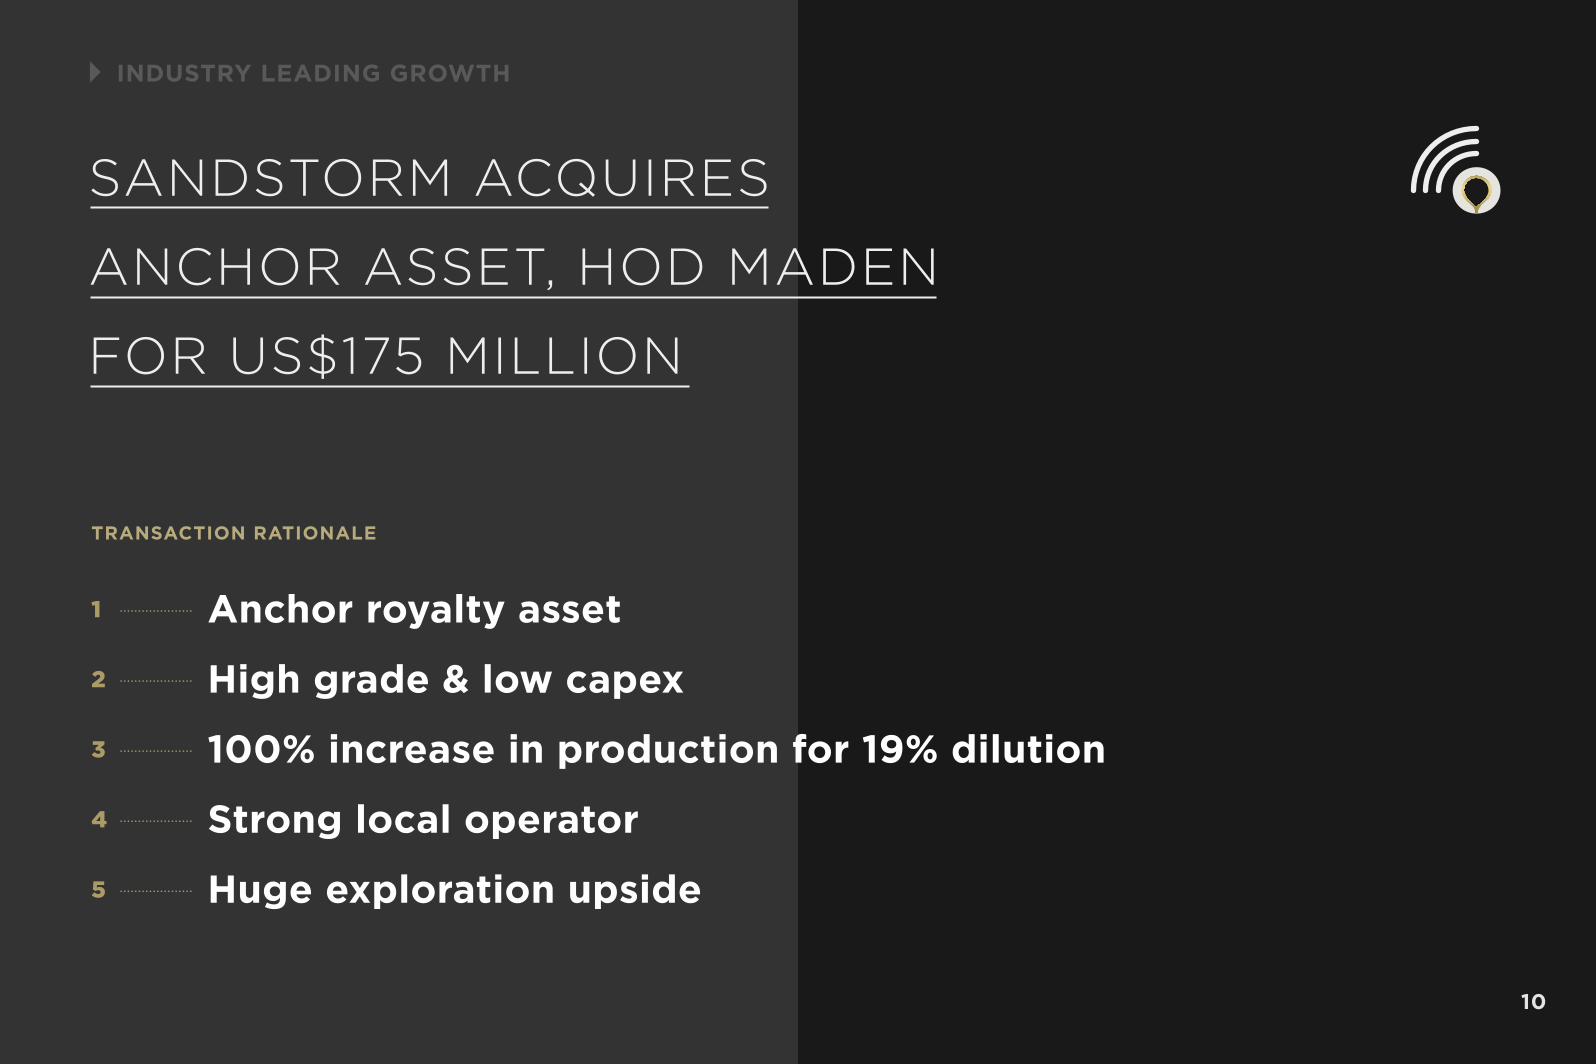
TRANSACTION RATIONALE
SANDSTORM ACQUIRES
ANCHOR ASSET, HOD MADEN
FOR US$175 MILLION
INDUSTRY LEADING GROWTH
1
High grade & low capex
Anchor royalty asset
100% increase in production for 19% dilution
Strong local operator
Huge exploration upside
2
3
4
5
11
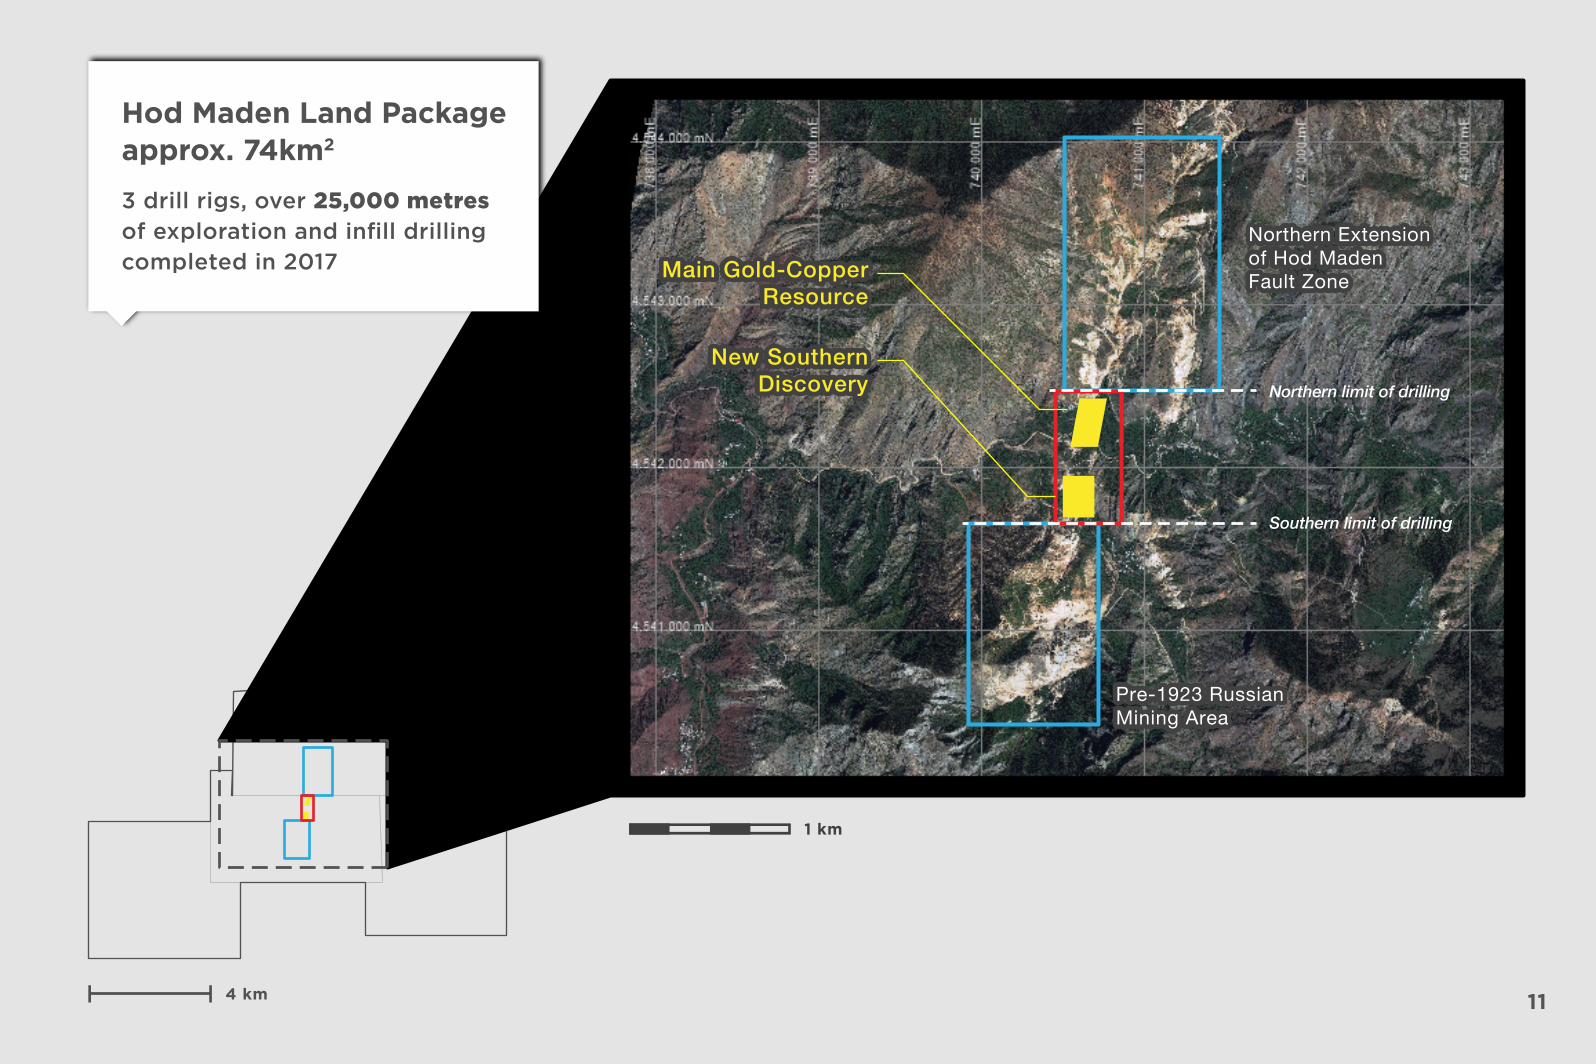
Southern limit of drilling
Northern limit of drilling
Main Gold-CopperResource
New SouthernDiscovery
Pre-1923 RussianMining Area
4 km
Main Gold-CopperResource
New SouthernDiscovery
Pre-1923 RussianMining Area
Northern Extensionof Hod MadenFault Zone
Northern Extensionof Hod MadenFault Zone
1 km
3 drill rigs, over 25,000 metres of exploration and infill drilling completed in 2017
Hod Maden Land Packageapprox. 74km2
12
HTD-90
HTD-72
HTD-62
HTD-60HTD-15
HTD-18
HTD-77
HTD-65
600m
500m
400m
700m
800m
750m
650m
550m
450m
HTD-88
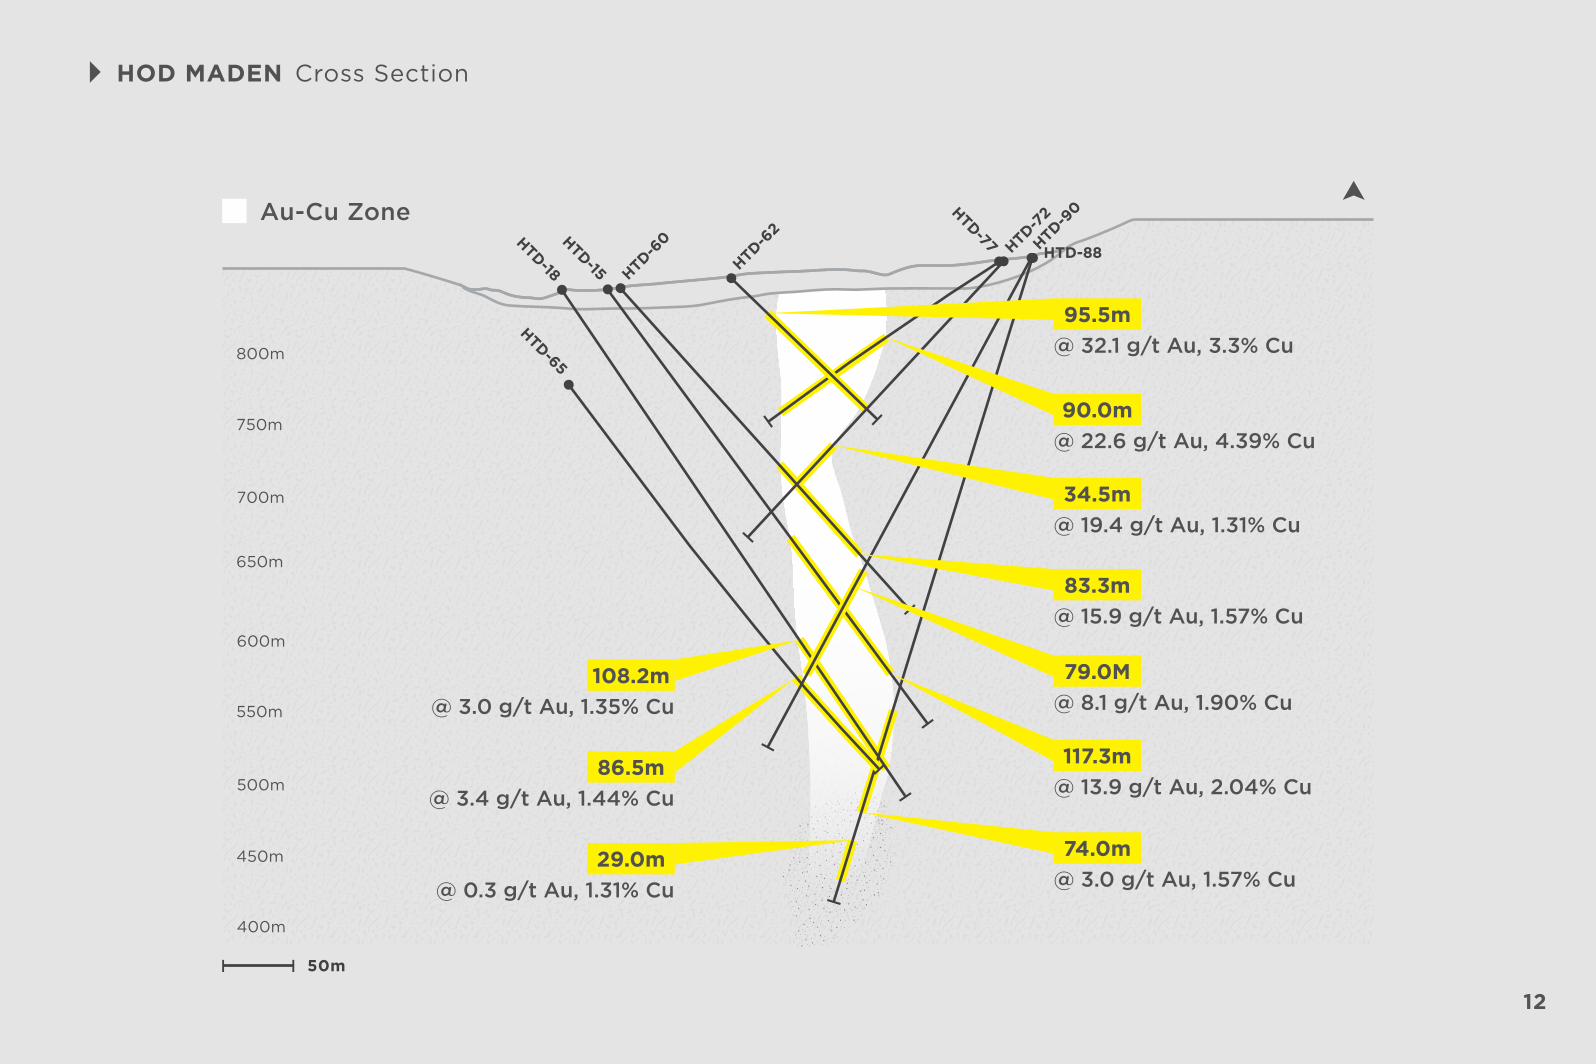
Au-Cu Zone
95.5m@ 32.1 g/t Au, 3.3% Cu
90.0m@ 22.6 g/t Au, 4.39% Cu
34.5m@ 19.4 g/t Au, 1.31% Cu
83.3m@ 15.9 g/t Au, 1.57% Cu
79.0M@ 8.1 g/t Au, 1.90% Cu
117.3m@ 13.9 g/t Au, 2.04% Cu
74.0m@ 3.0 g/t Au, 1.57% Cu
86.5m@ 3.4 g/t Au, 1.44% Cu
29.0m@ 0.3 g/t Au, 1.31% Cu
108.2m@ 3.0 g/t Au, 1.35% Cu
HOD MADEN Cross Section
50m
13
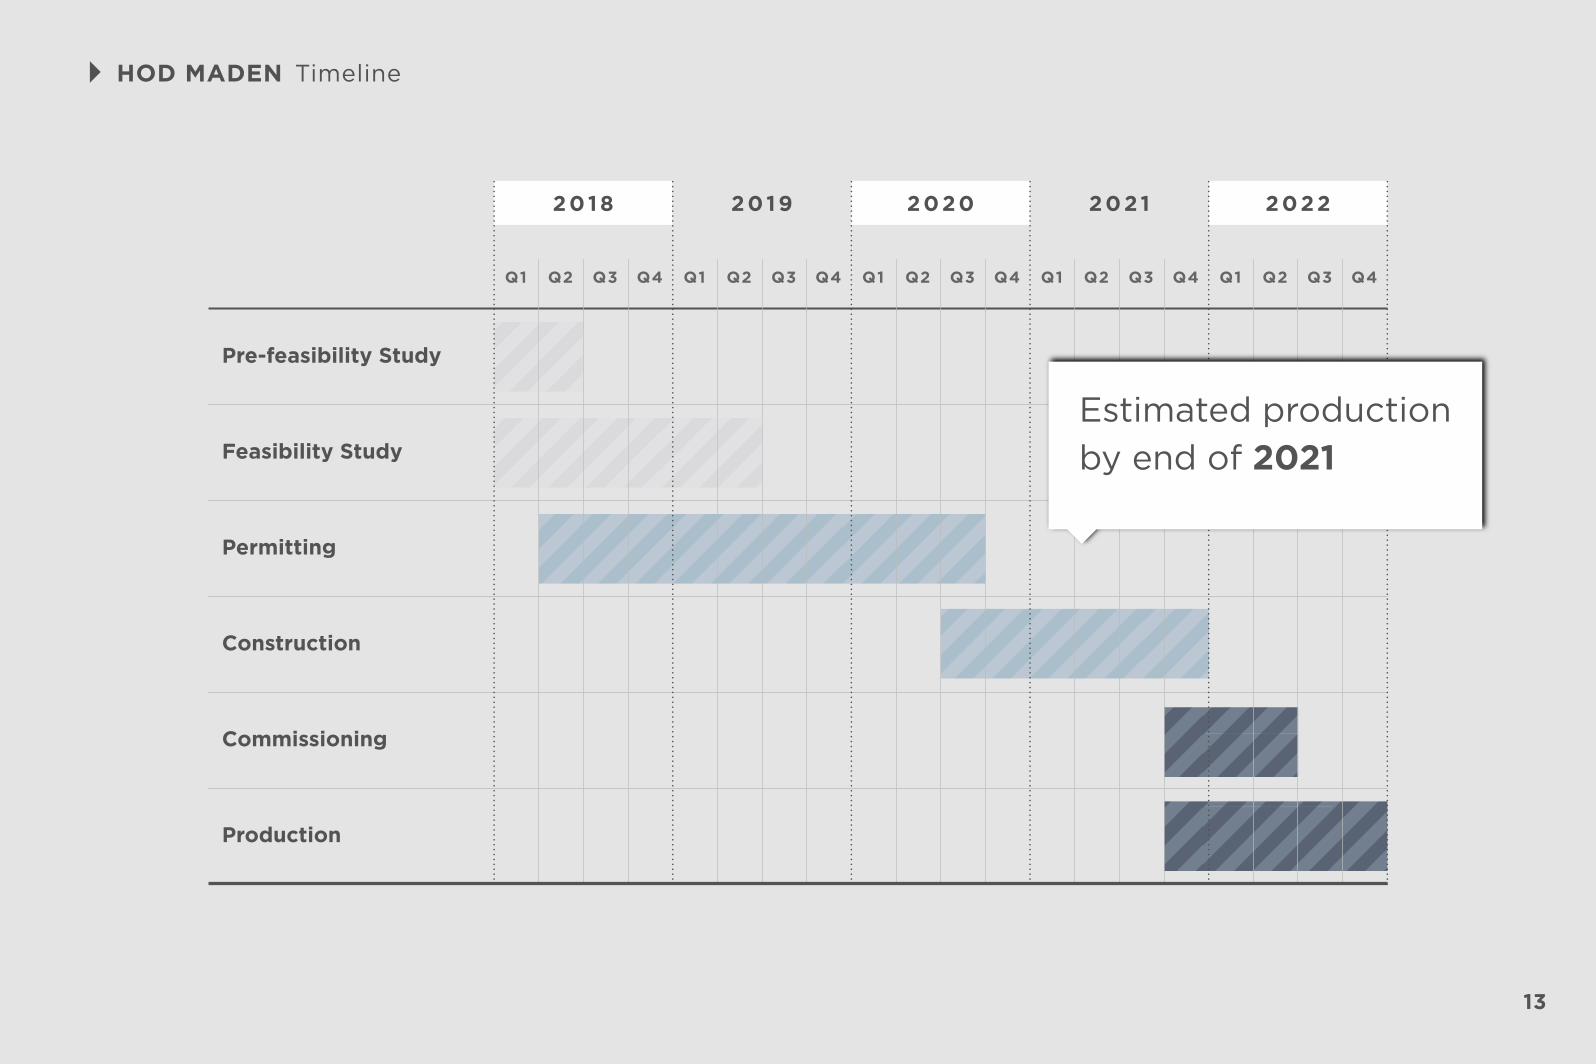
Q1 Q2 Q3 Q4 Q1 Q2 Q3 Q4 Q1 Q2 Q3 Q4 Q1 Q2 Q3 Q4 Q1 Q2 Q3 Q4
2 018 2019 2020 2021 2022
Pre-feasibility Study
Feasibility Study
Permitting
Construction
Commissioning
Production
Estimated productionby end of 2021
TimelineHOD MADEN
14
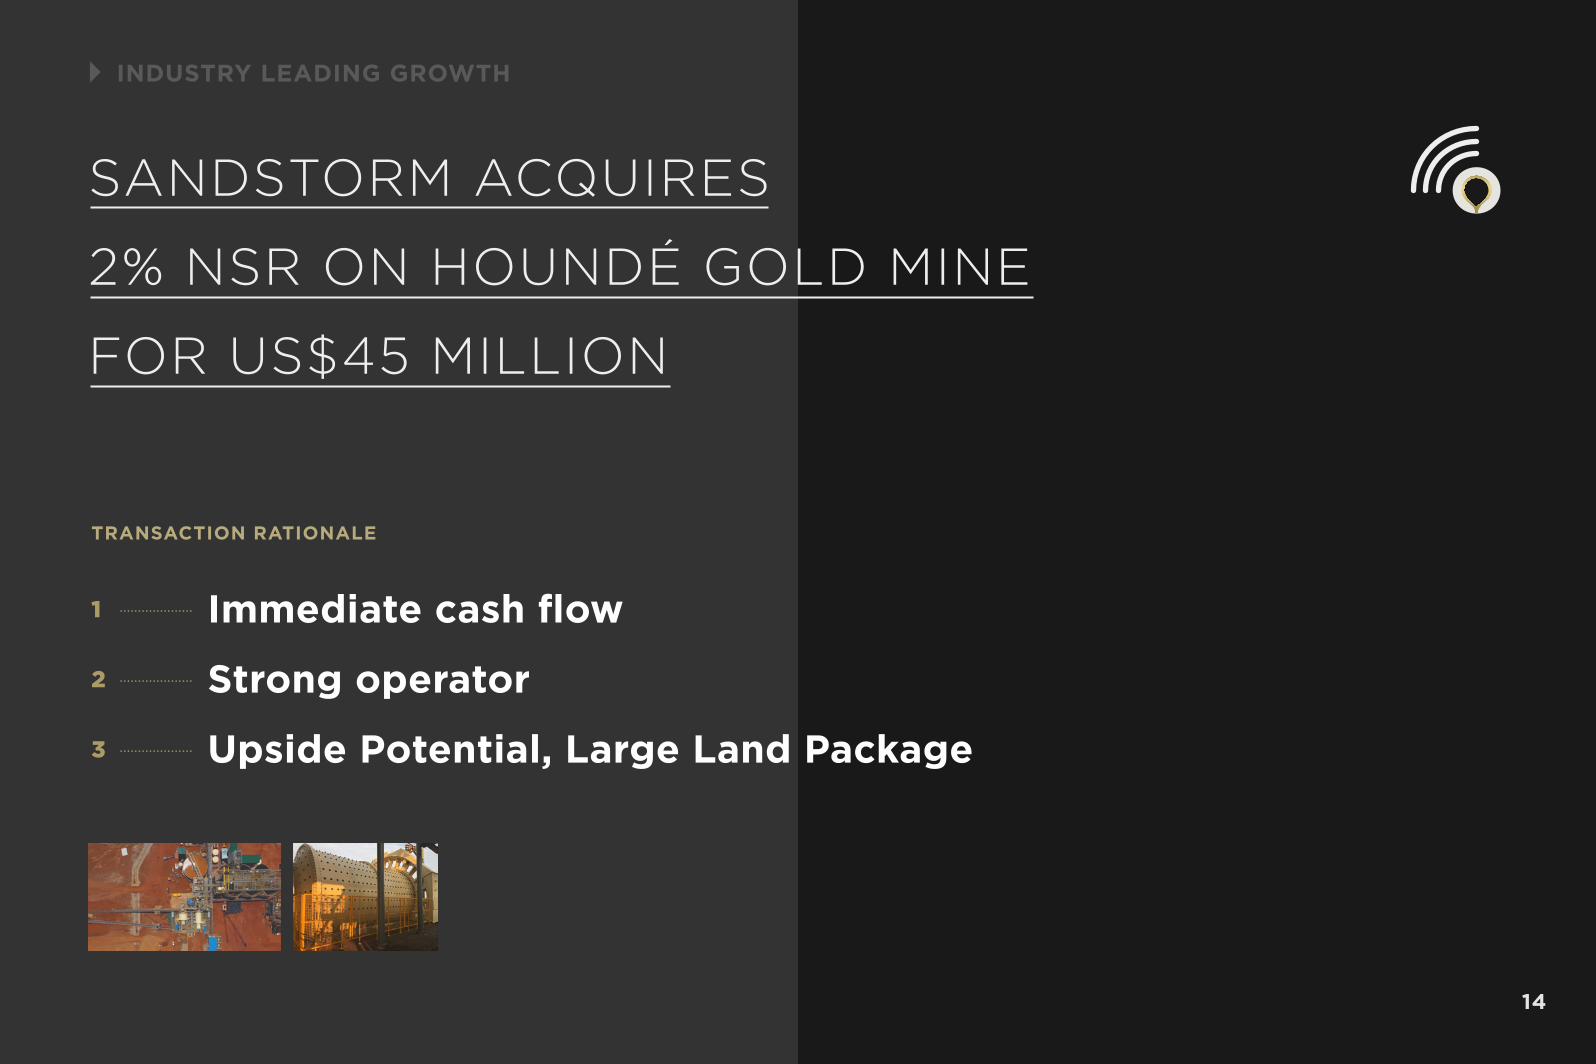
TRANSACTION RATIONALE
SANDSTORM ACQUIRES
2% NSR ON HOUNDÉ GOLD MINE
FOR US$45 MILLION
INDUSTRY LEADING GROWTH
1
Strong operator
Immediate cash flow
Upside Potential, Large Land Package
2
3
151 Findings based on internal study by Sandstorm1 Findings based on internal study by Sandstorm
SignificantExplorationUpside
40k
60k
100k
80k
2016 2017
20k
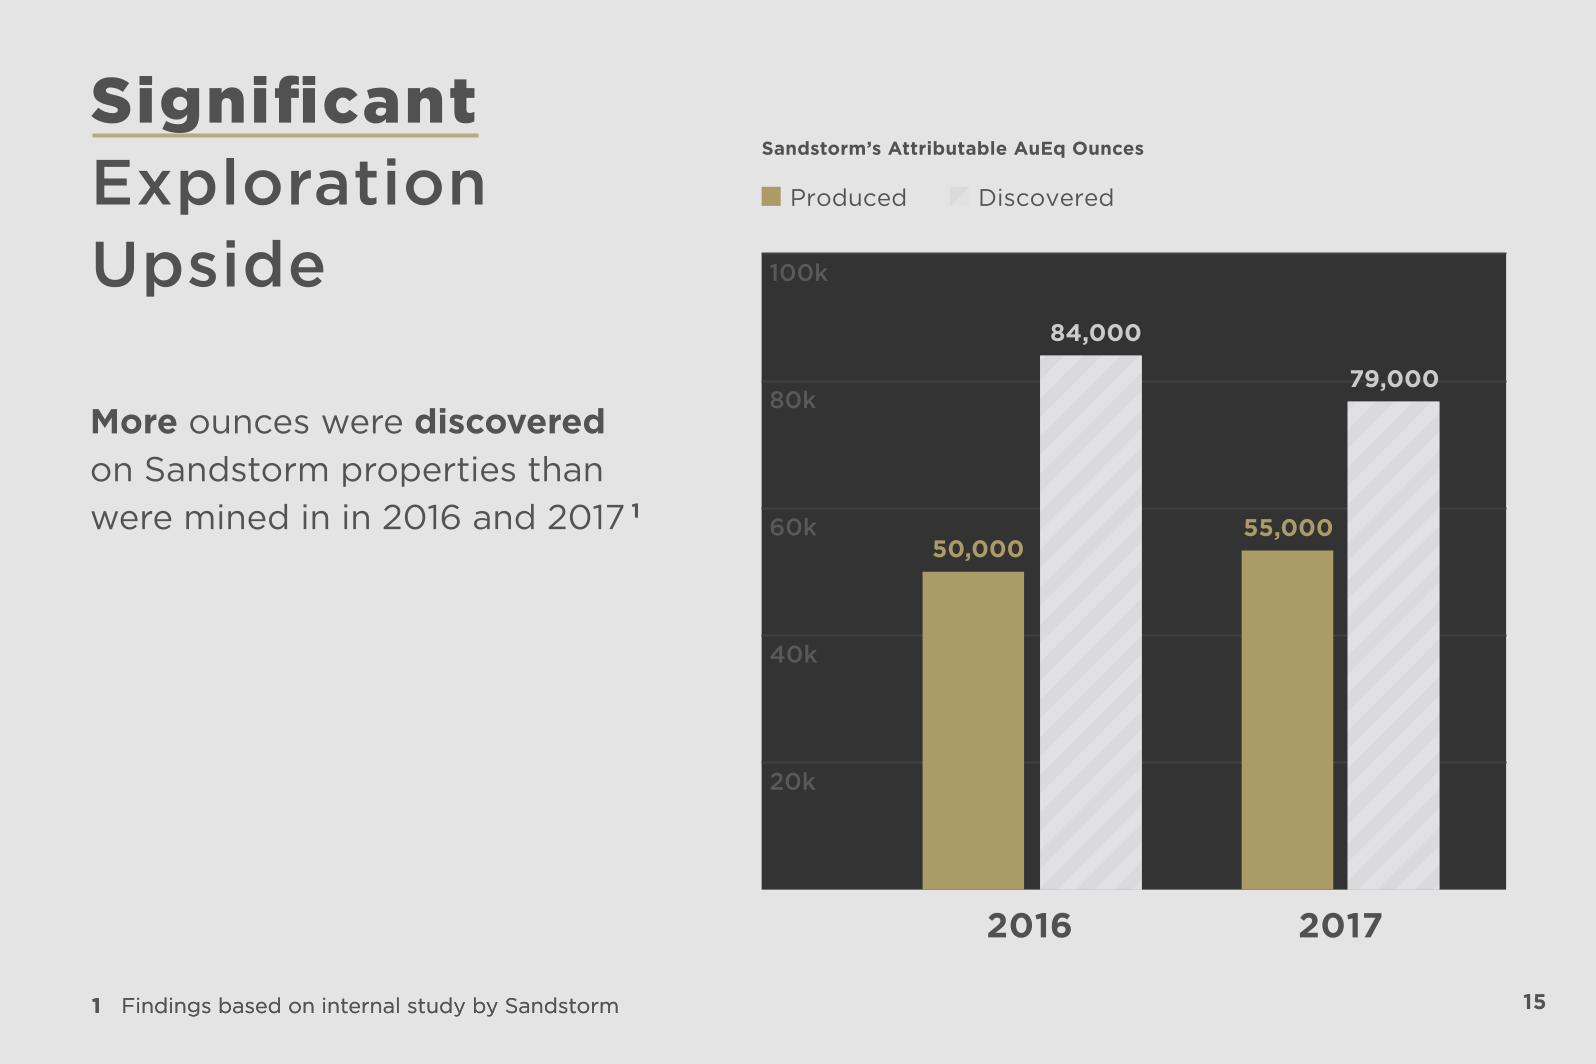
More ounces were discovered on Sandstorm properties than were mined in in 2016 and 2017 1
84,000
79,000
50,00055,000
Sandstorm’s Attributable AuEq Ounces
Produced Discovered
16
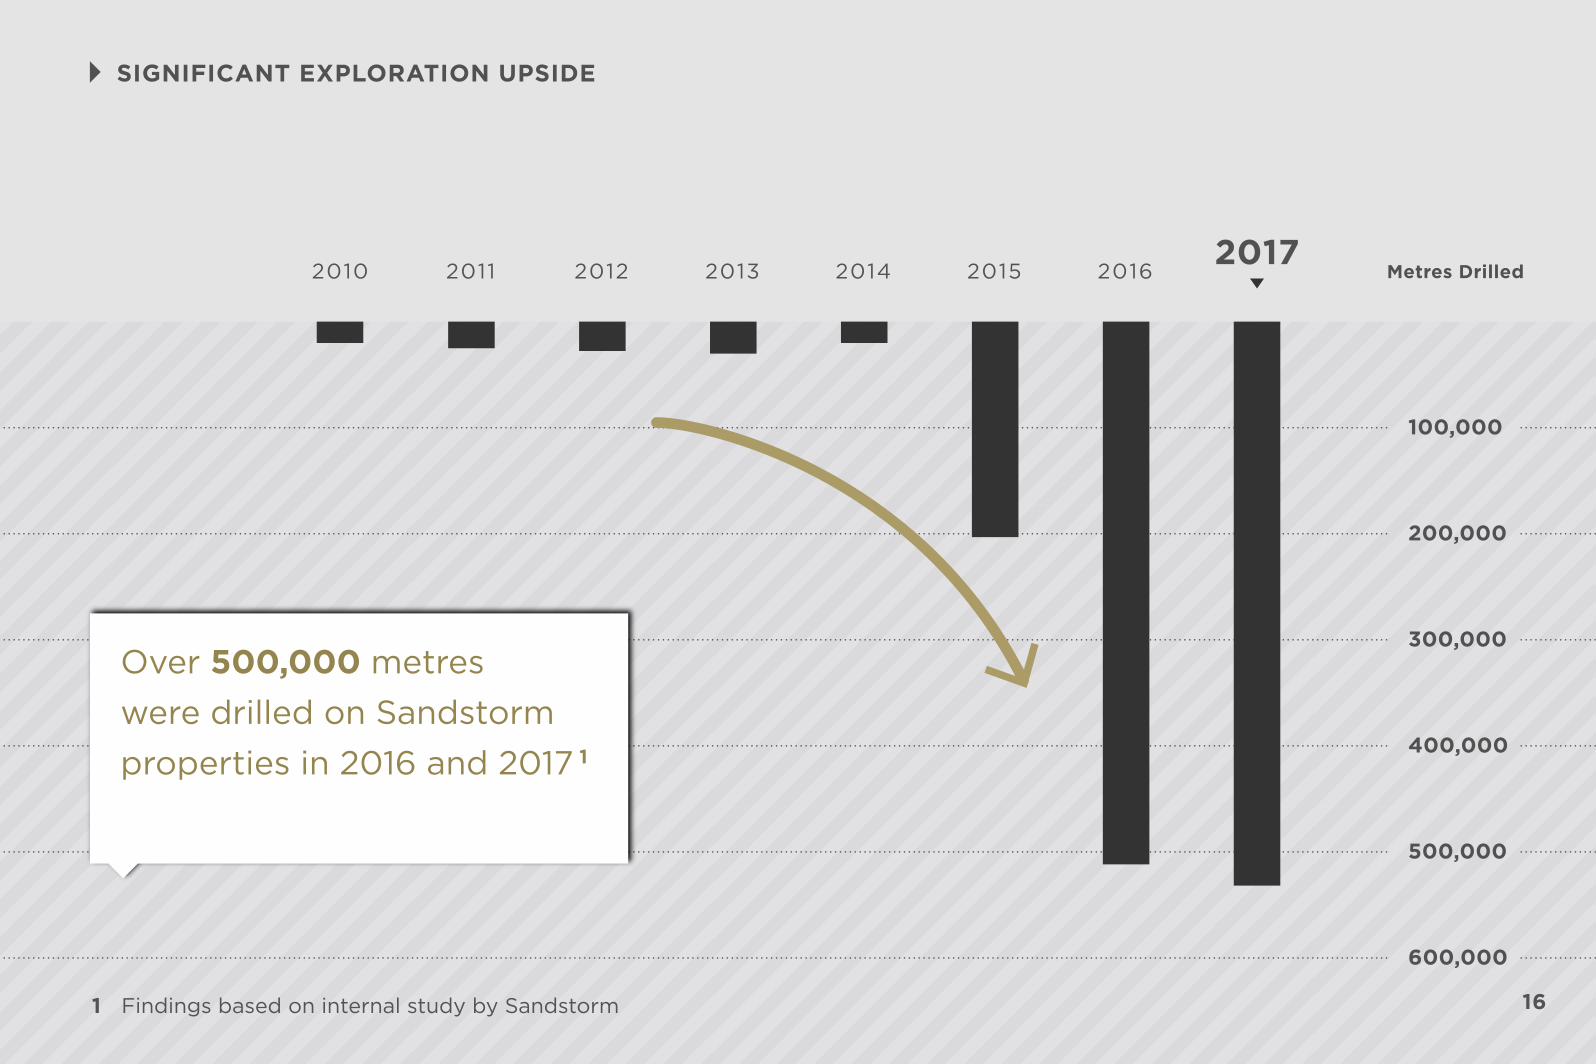
SIGNIFICANT EXPLORATION UPSIDE
Over 500,000 metreswere drilled on Sandstormproperties in 2016 and 2017 1
1 Findings based on internal study by Sandstorm
400,000
500,000
600,000
300,000
200,000
100,000
Metres Drilled2017
2010 2011 2012 2013 2014 2015 2016
17
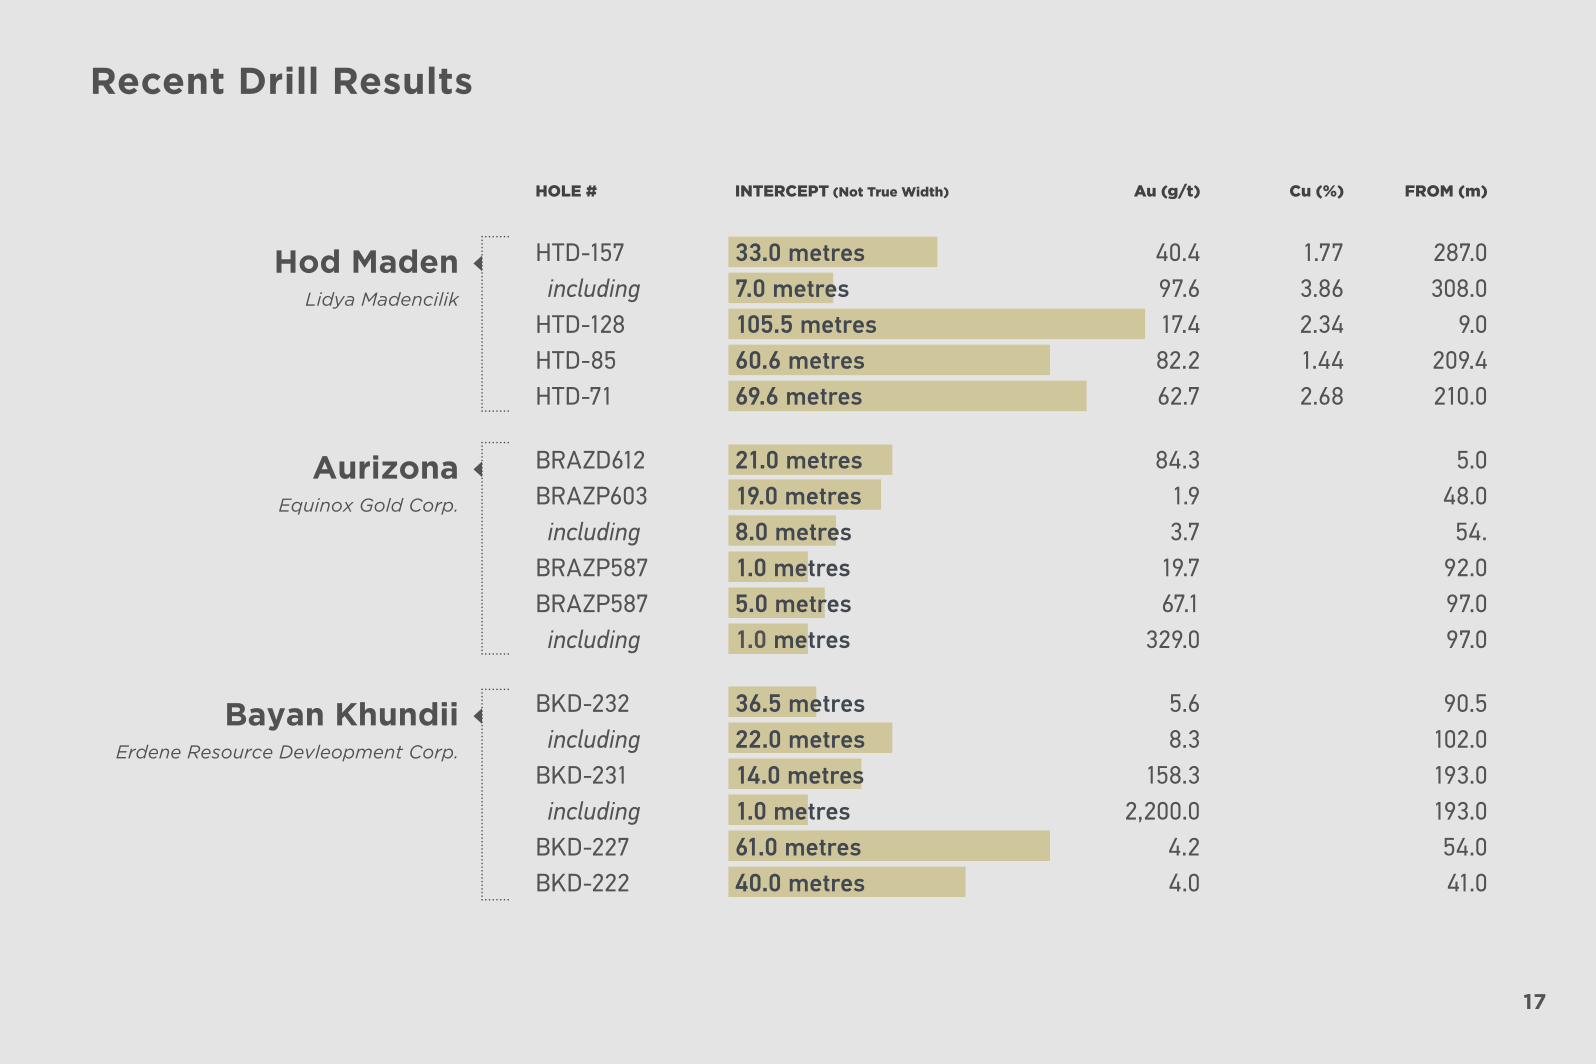
HOLE # INTERCEPT (Not True Width) Au (g/t) Cu (%) FROM (m)
Hod MadenLidya Madencilik
AurizonaEquinox Gold Corp.
Bayan KhundiiErdene Resource Devleopment Corp.
HTD-157 33.0 metres 40.4 1.77 287.0 including 7.0 metres 97.6 3.86 308.0HTD-128 105.5 metres 17.4 2.34 9.0HTD-85 60.6 metres 82.2 1.44 209.4HTD-71 69.6 metres 62.7 2.68 210.0
BRAZD612 21.0 metres 84.3 5.0BRAZP603 19.0 metres 1.9 48.0 including 8.0 metres 3.7 54.BRAZP587 1.0 metres 19.7 92.0BRAZP587 5.0 metres 67.1 97.0 including 1.0 metres 329.0 97.0
BKD-232 36.5 metres 5.6 90.5 including 22.0 metres 8.3 102.0BKD-231 14.0 metres 158.3 193.0 including 1.0 metres 2,200.0 193.0BKD-227 61.0 metres 4.2 54.0BKD-222 40.0 metres 4.0 41.0
Recent Drill Results
18
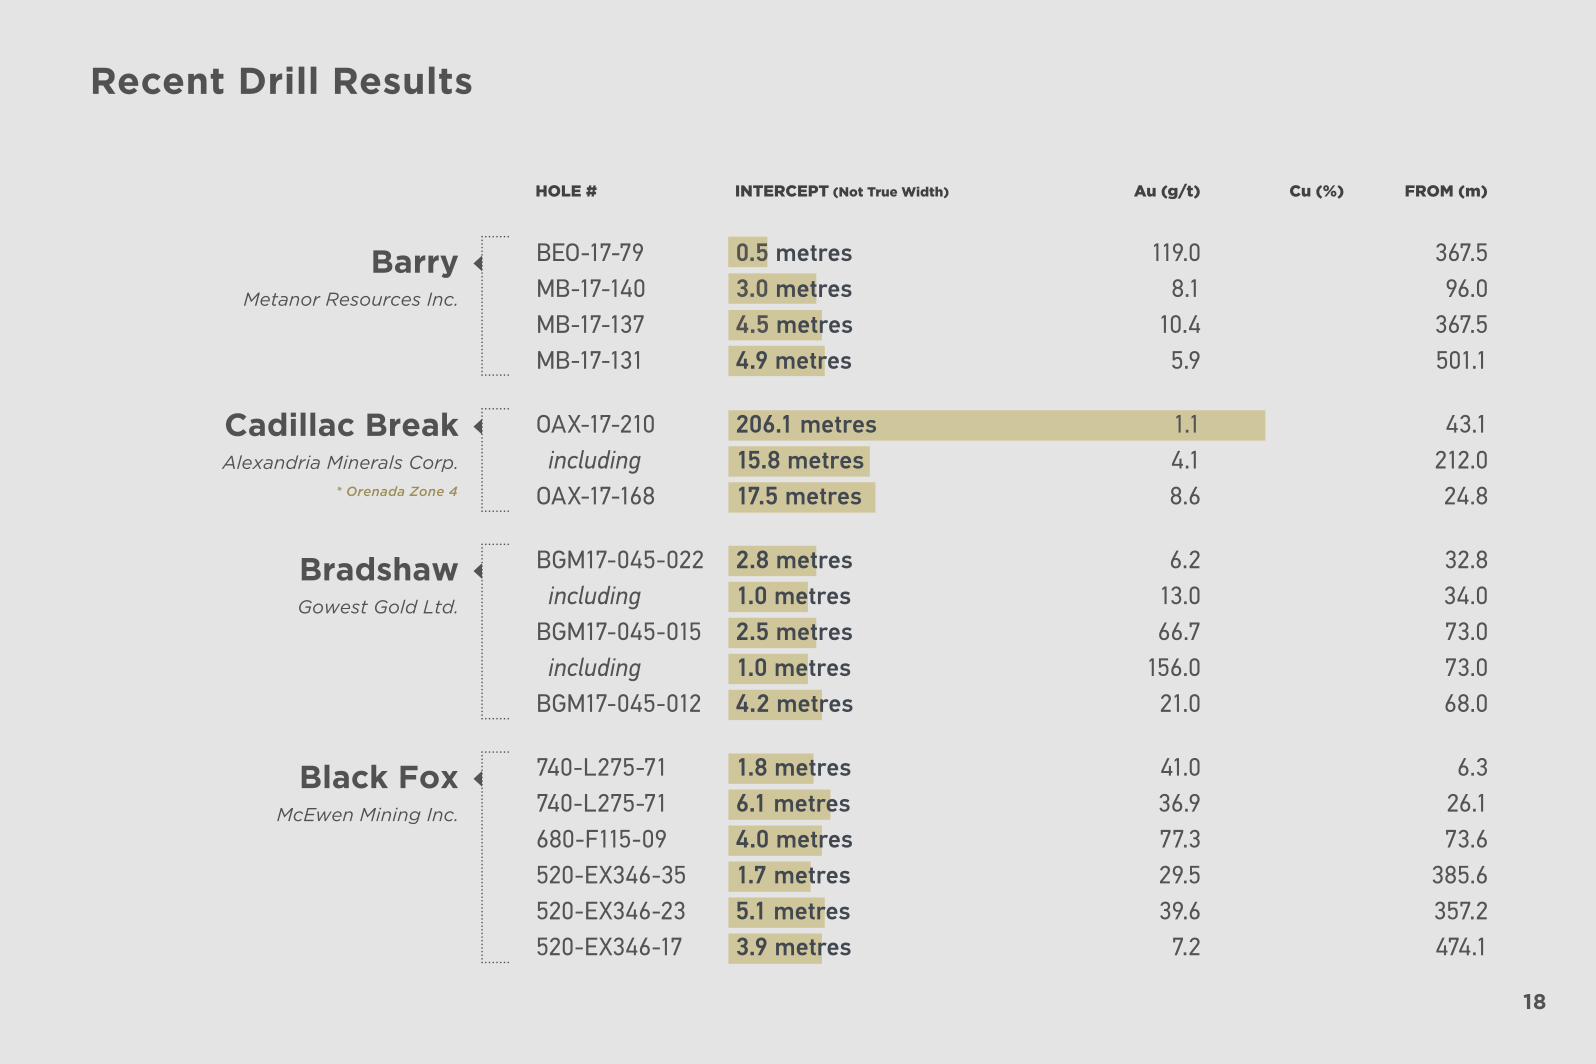
BEO-17-79 0.5 metres 119.0 367.5MB-17-140 3.0 metres 8.1 96.0MB-17-137 4.5 metres 10.4 367.5MB-17-131 4.9 metres 5.9 501.1
OAX-17-210 206.1 metres 1.1 43.1 including 15.8 metres 4.1 212.0OAX-17-168 17.5 metres 8.6 24.8
BGM17-045-022 2.8 metres 6.2 32.8 including 1.0 metres 13.0 34.0BGM17-045-015 2.5 metres 66.7 73.0 including 1.0 metres 156.0 73.0BGM17-045-012 4.2 metres 21.0 68.0
740-L275-71 1.8 metres 41.0 6.3740-L275-71 6.1 metres 36.9 26.1680-F115-09 4.0 metres 77.3 73.6520-EX346-35 1.7 metres 29.5 385.6520-EX346-23 5.1 metres 39.6 357.2520-EX346-17 3.9 metres 7.2 474.1
HOLE # INTERCEPT (Not True Width) Au (g/t) Cu (%) FROM (m)
BarryMetanor Resources Inc.
Cadillac BreakAlexandria Minerals Corp.
BradshawGowest Gold Ltd.
Black FoxMcEwen Mining Inc.
* Orenada Zone 4
Recent Drill Results
19
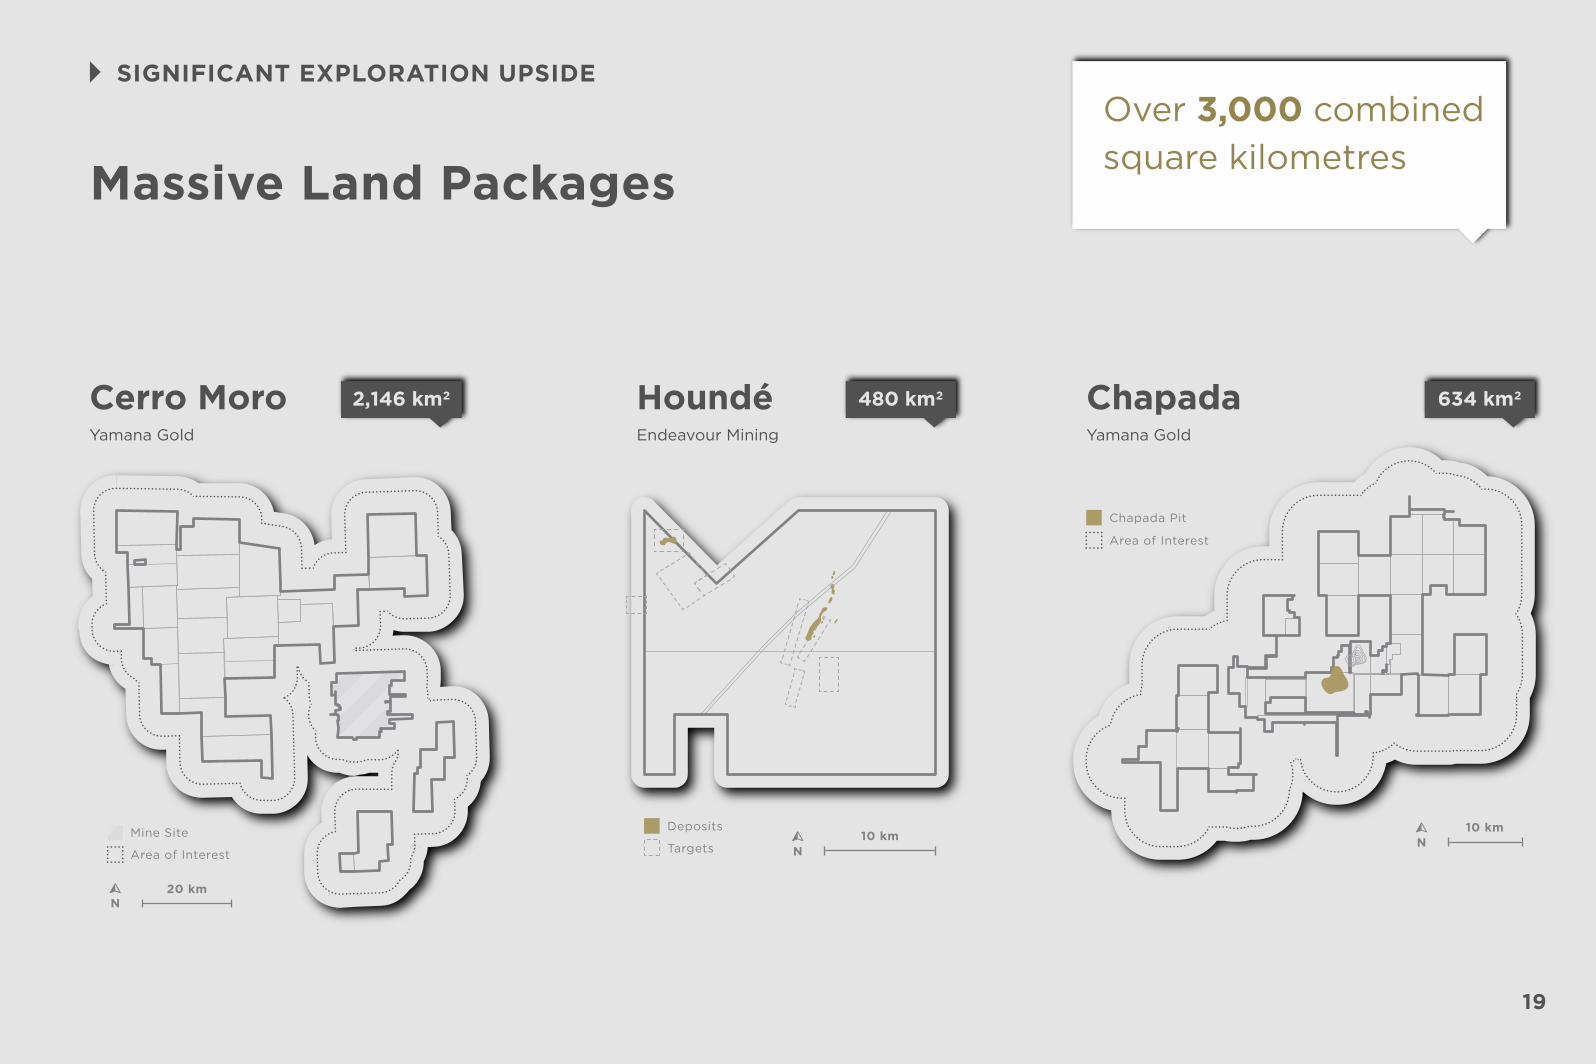
2,146 km2 480 km2 634 km2Cerro MoroYamana Gold
ChapadaYamana Gold
HoundéEndeavour Mining
SIGNIFICANT EXPLORATION UPSIDE
Massive Land Packages
20 km
Area of Interest
Mine Site
N
10 kmTargets
Deposits
N
10 km
Area of Interest
Chapada Pit
N
Over 3,000 combinedsquare kilometres
20
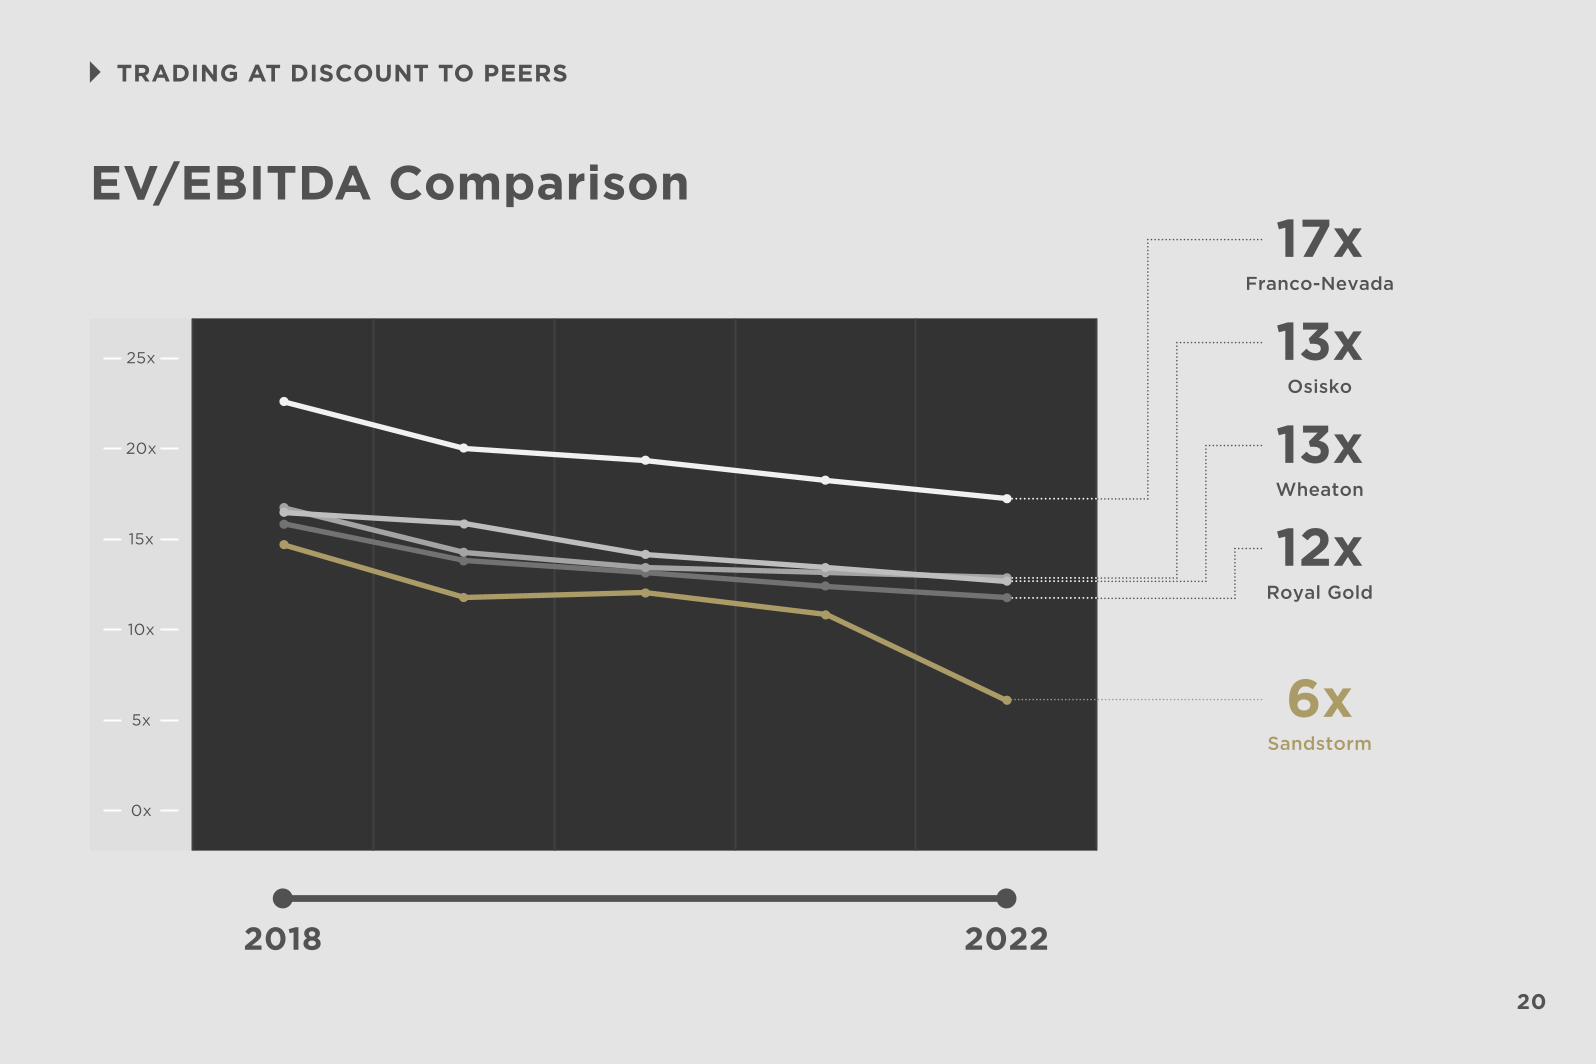
EV/EBITDA Comparison
2018 2022
TRADING AT DISCOUNT TO PEERS
12xRoyal Gold
13xWheaton
13xOsisko
17xFranco-Nevada
6xSandstorm
5x
10x
15x
20x
25x
0x
21
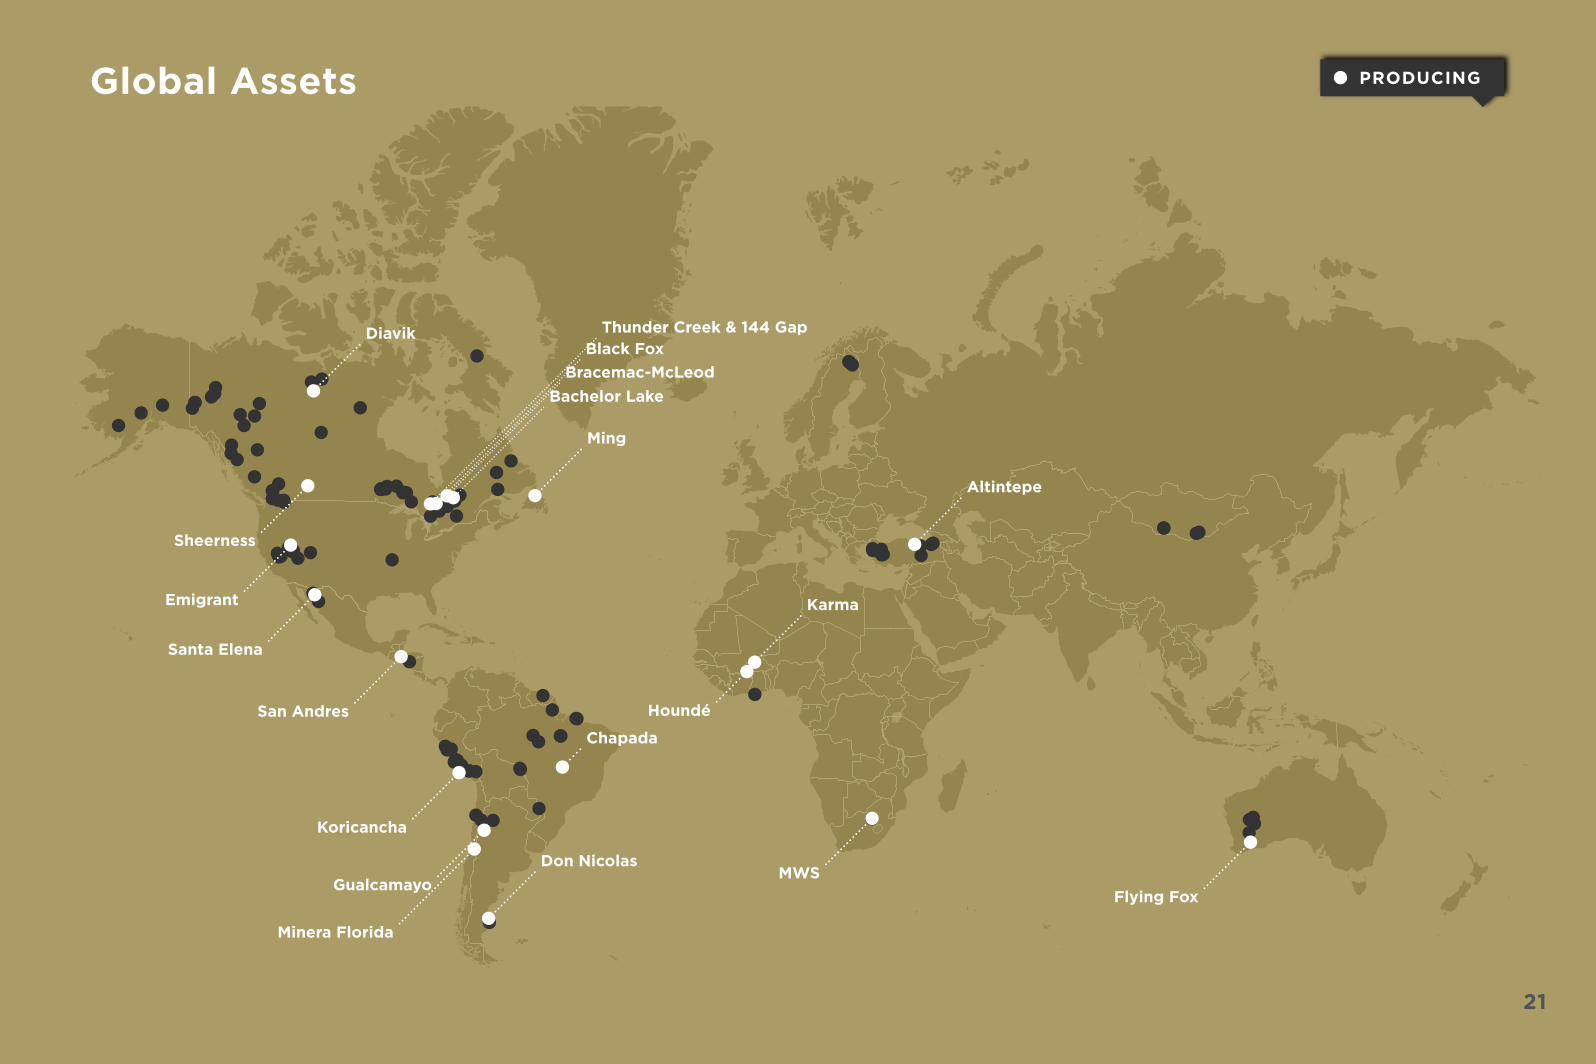
Diavik
Don Nicolas
Karma
Altintepe
Chapada
Ming
Sheerness
Bachelor LakeBracemac-McLeod
Black FoxThunder Creek & 144 Gap
MWS
Houndé
Flying Fox
Emigrant
Santa Elena
San Andres
Koricancha
Minera Florida
Gualcamayo
PRODUCINGGlobal Assets
22
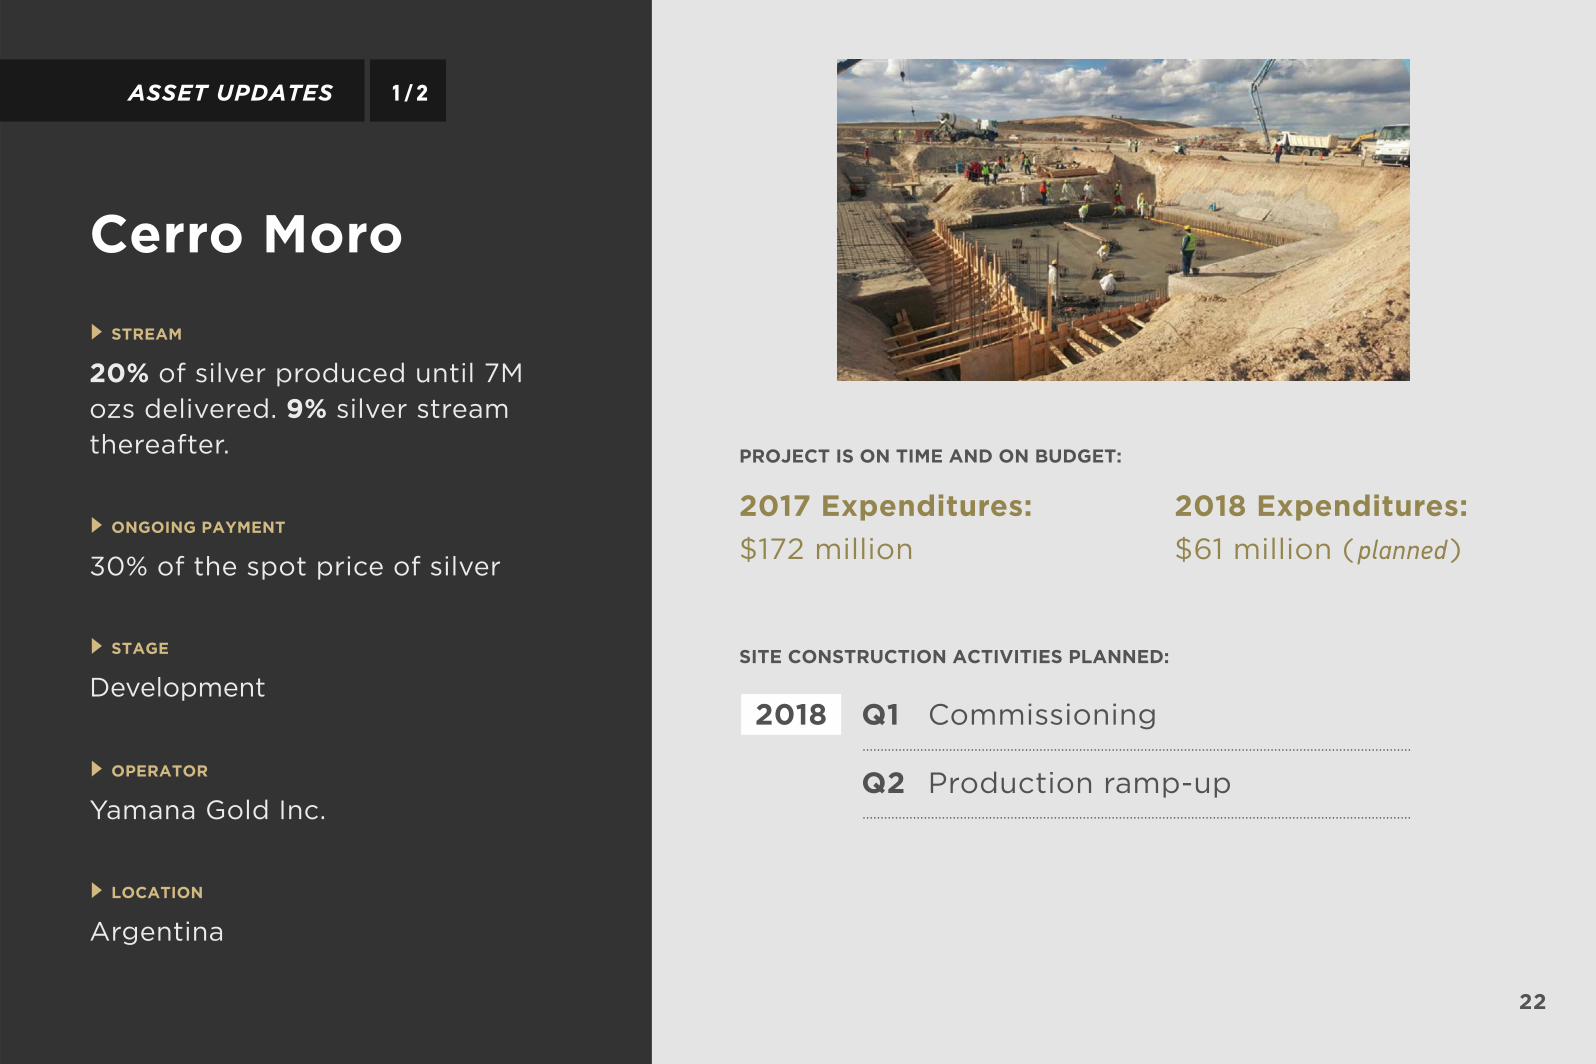
Cerro Moro STREAM
20% of silver produced until 7Mozs delivered. 9% silver streamthereafter.
ONGOING PAYMENT
30% of the spot price of silver
OPERATOR
Yamana Gold Inc.
LOCATION
Argentina
STAGE
Development
ASSET UPDATES 1/2
SITE CONSTRUCTION ACTIVITIES PLANNED:
PROJECT IS ON TIME AND ON BUDGET:
2018 Q1 Commissioning
Q2 Production ramp-up
2017 Expenditures:$172 million
2018 Expenditures:$61 million (planned)
23
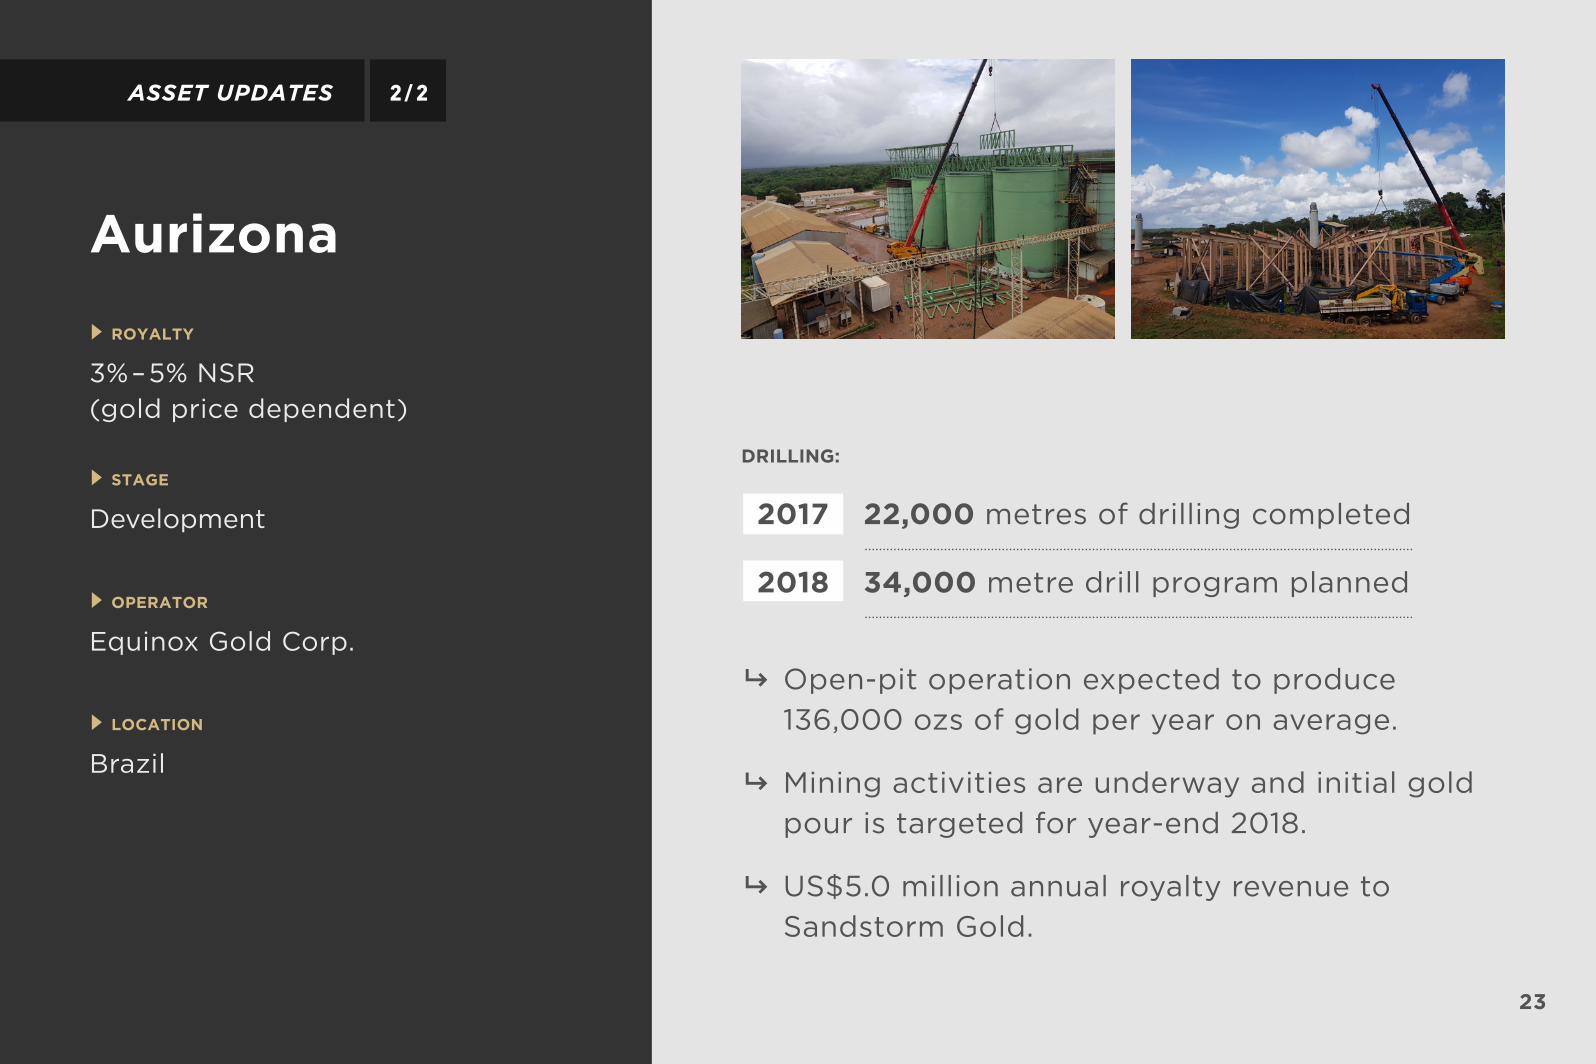
AurizonaROYALTY
3%–5% NSR(gold price dependent)
OPERATOR
Equinox Gold Corp.
LOCATION
Brazil
STAGE
Development
ASSET UPDATES 2/2
� Open-pit operation expected to produce 136,000 ozs of gold per year on average.
� Mining activities are underway and initial gold pour is targeted for year-end 2018.
� US$5.0 million annual royalty revenue toSandstorm Gold.
DRILLING:
2017 22,000 metres of drilling completed
2018 34,000 metre drill program planned
24
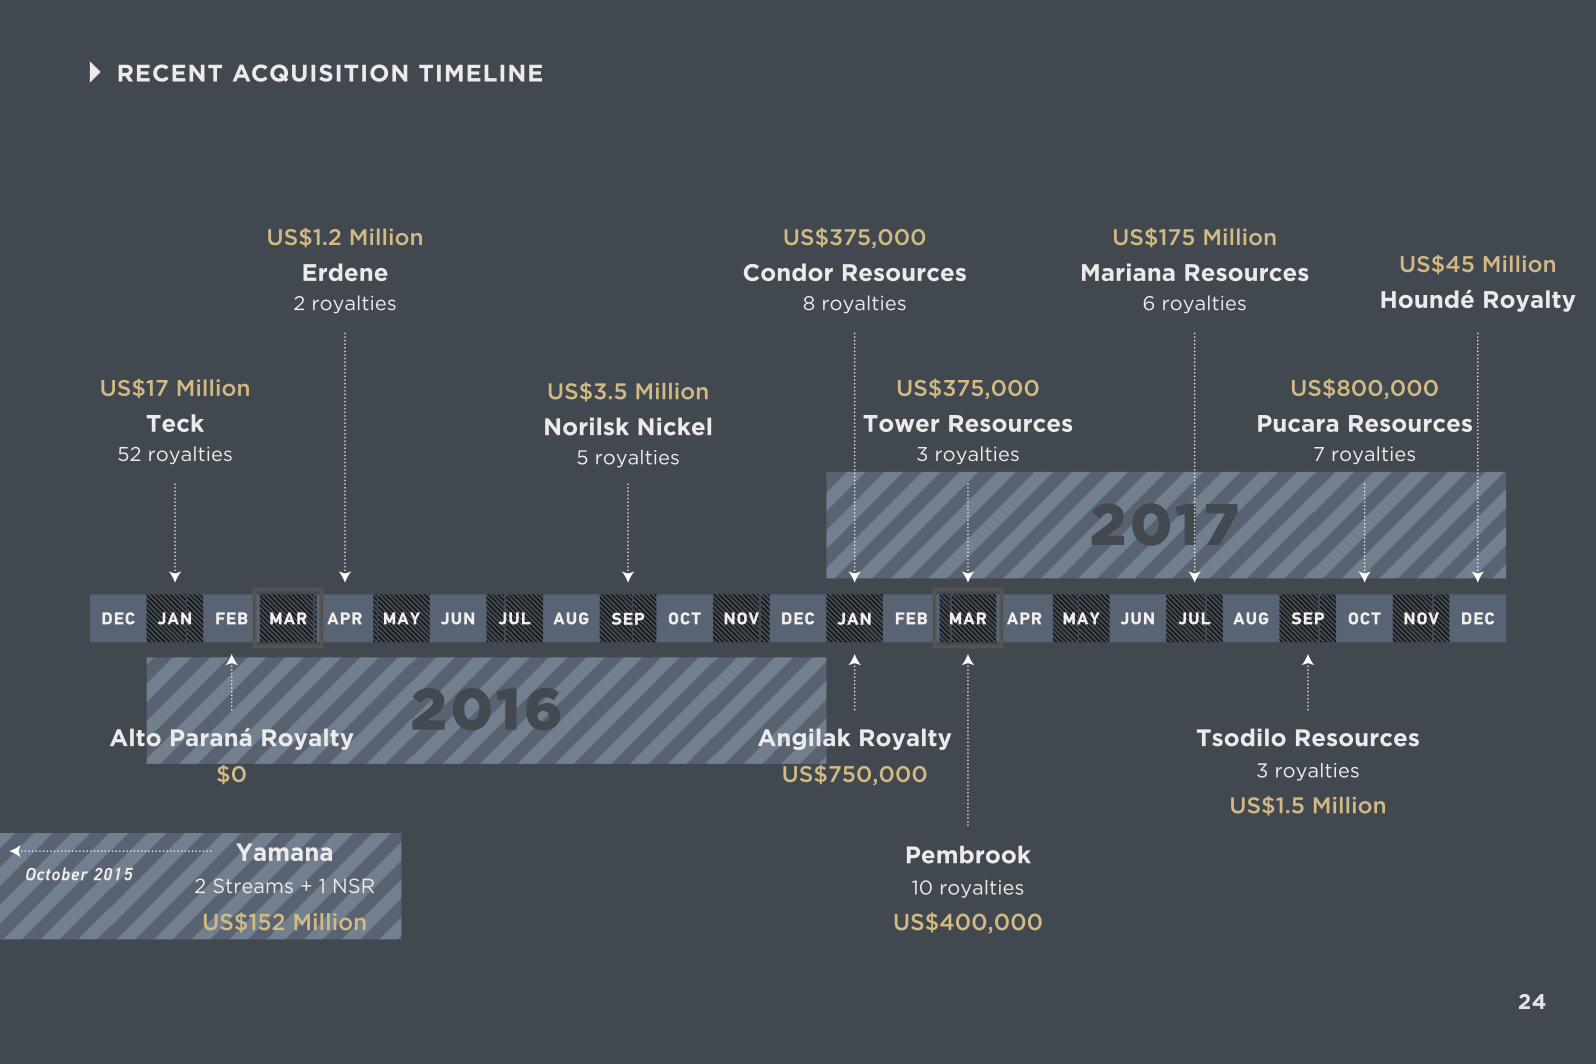
2016
2017FEB MAR APR MAY JUN JUL AUG OCTJAN SEP NOV DEC JAN
US$17 Million
52 royaltiesTeck
US$375,000
8 royaltiesCondor Resources
US$1.2 Million
2 royaltiesErdene
Alto Paraná Royalty$0
US$3.5 Million
5 royaltiesNorilsk Nickel
US$750,000Angilak Royalty
US$175 Million
6 royaltiesMariana Resources US$45 Million
Houndé Royalty
US$375,000
3 royaltiesTower Resources
US$800,000
7 royaltiesPucara Resources
Pembrook10 royalties
US$400,000
Tsodilo Resources3 royalties
US$1.5 Million
FEB MAR APR MAY JUN JUL AUG SEP OCT
RECENT ACQUISITION TIMELINE
NOVDEC
US$152 Million2 Streams + 1 NSR
YamanaOctober 2015
DEC

25
Ca
shC
red
it
2018 2019 2020 2021 2022 2023 Non-Core Investments
$300M
$100M
0
$400M
$500M
$600M
$700M
$200M
Available Capital
FUTURE GROWTH
$32M
$17MDebtInvestments
EquityInvestments
$49M
Au$1,300/oz
Ag$18.00/oz
Cu$3.00/lb
Million$457
Million$626
Million$250
Our goal is to continuebuilding a highlydiversified, world classprecious metals royaltycompany.
Appendix
APRIL 2018
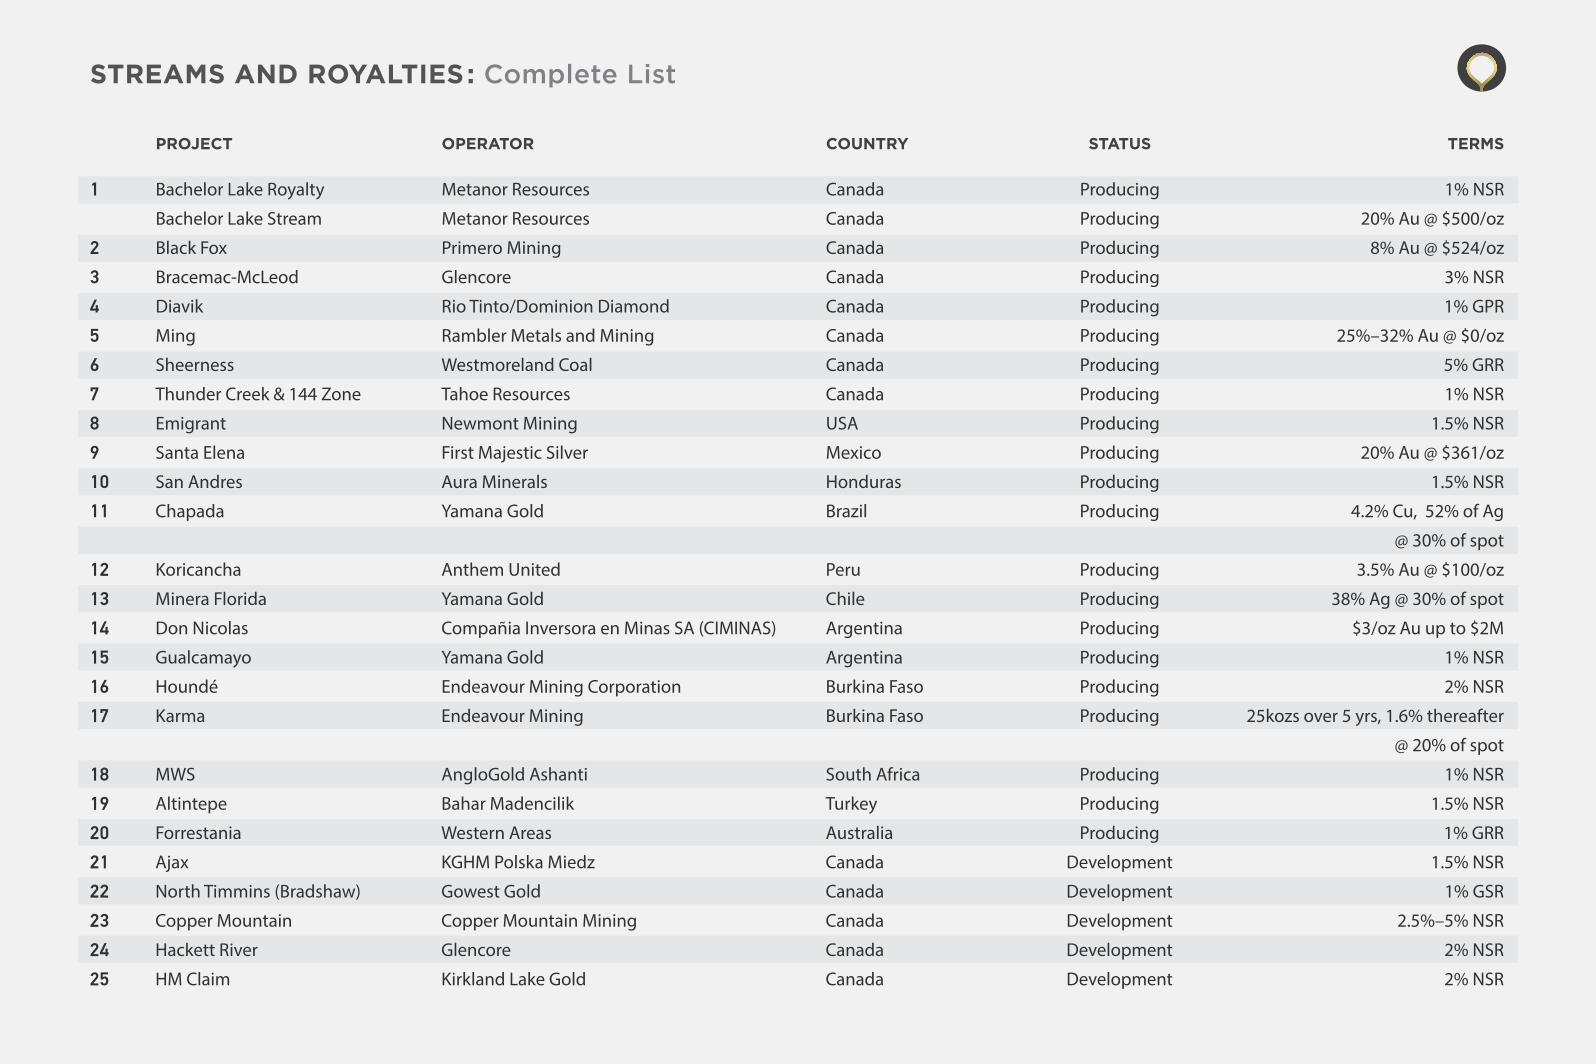
Bachelor Lake Royalty Metanor Resources Canada Producing 1% NSR
Bachelor Lake Stream Metanor Resources Canada Producing 20% Au @ $500/oz
Black Fox Primero Mining Canada Producing 8% Au @ $524/oz
Bracemac-McLeod Glencore Canada Producing 3% NSR
Diavik Rio Tinto/Dominion Diamond Canada Producing 1% GPR
Ming Rambler Metals and Mining Canada Producing 25%–32% Au @ $0/oz
Sheerness Westmoreland Coal Canada Producing 5% GRR
Thunder Creek & 144 Zone Tahoe Resources Canada Producing 1% NSR
Emigrant Newmont Mining USA Producing 1.5% NSR
Santa Elena First Majestic Silver Mexico Producing 20% Au @ $361/oz
San Andres Aura Minerals Honduras Producing 1.5% NSR
Chapada Yamana Gold Brazil Producing 4.2% Cu, 52% of Ag
@ 30% of spot
Koricancha Anthem United Peru Producing 3.5% Au @ $100/oz
Minera Florida Yamana Gold Chile Producing 38% Ag @ 30% of spot
Don Nicolas Compañia Inversora en Minas SA (CIMINAS) Argentina Producing $3/oz Au up to $2M
Gualcamayo Yamana Gold Argentina Producing 1% NSR
Houndé Endeavour Mining Corporation Burkina Faso Producing 2% NSR
Karma Endeavour Mining Burkina Faso Producing 25kozs over 5 yrs, 1.6% thereafter
@ 20% of spot
MWS AngloGold Ashanti South Africa Producing 1% NSR
Altintepe Bahar Madencilik Turkey Producing 1.5% NSR
Forrestania Western Areas Australia Producing 1% GRR
Ajax KGHM Polska Miedz Canada Development 1.5% NSR
North Timmins (Bradshaw) Gowest Gold Canada Development 1% GSR
Copper Mountain Copper Mountain Mining Canada Development 2.5%–5% NSR
Hackett River Glencore Canada Development 2% NSR
HM Claim Kirkland Lake Gold Canada Development 2% NSR
1
2
3
4
5
6
7
8
9
10
11
12
13
14
15
16
17
18
19
20
21
22
23
24
25
STREAMS AND ROYALTIES: Complete List
PROJECT OPERATOR COUNTRY STATUS TERMS
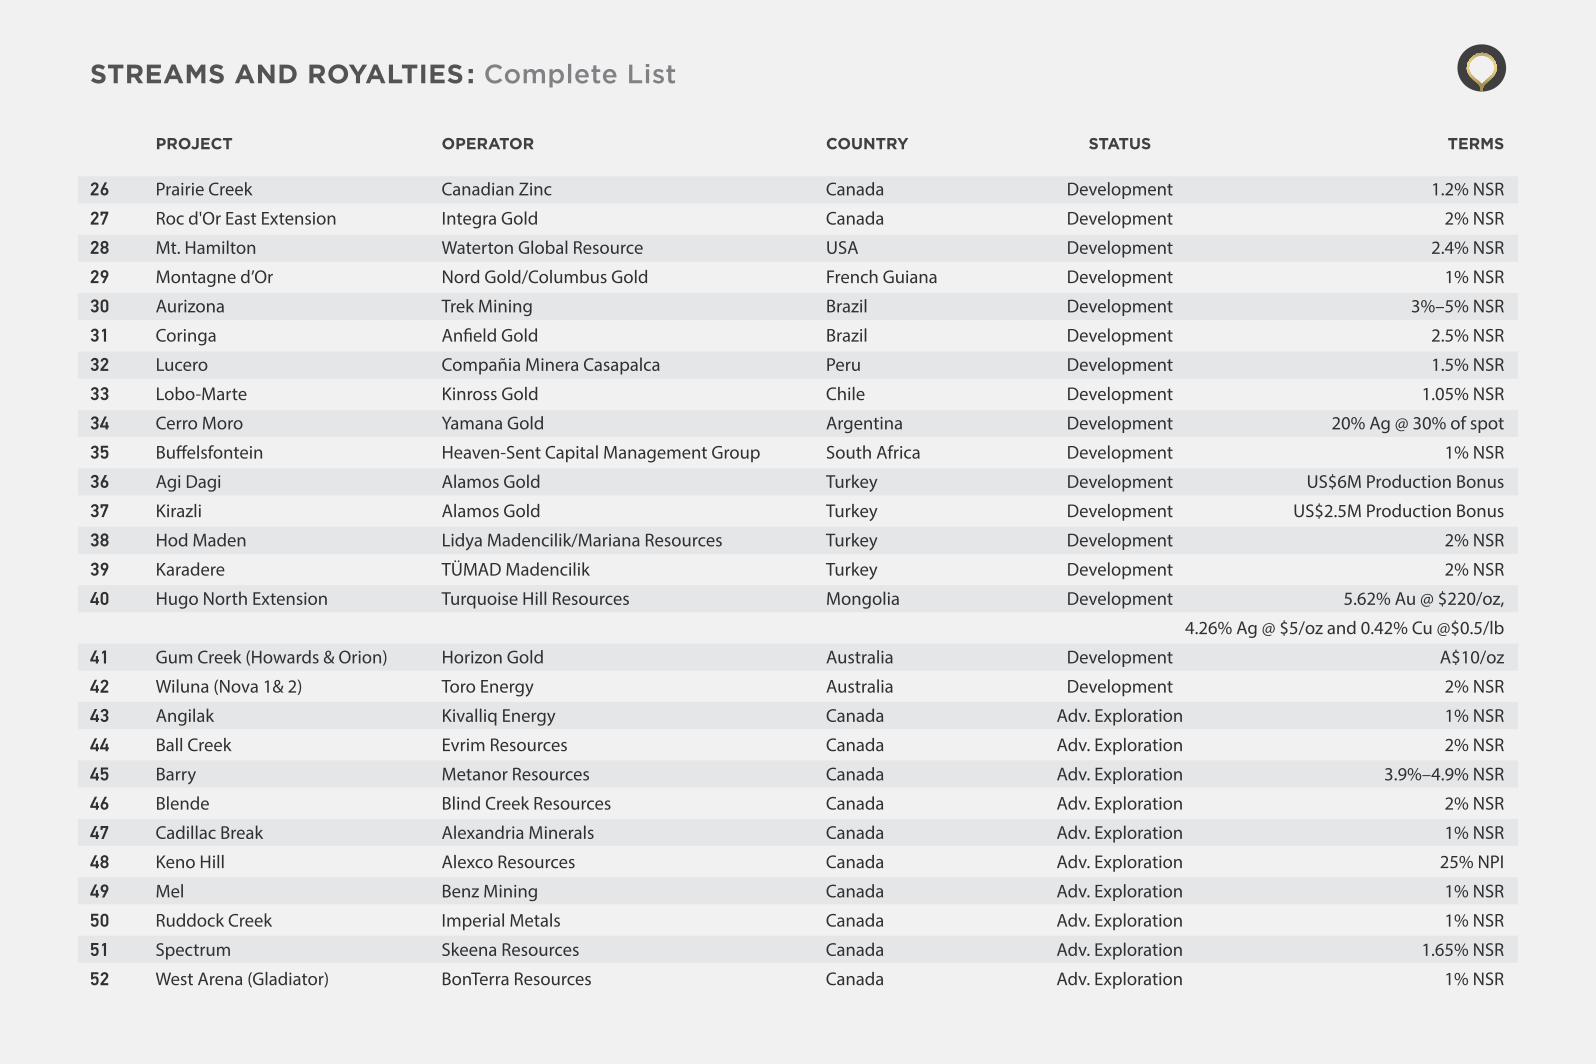
Prairie Creek Canadian Zinc Canada Development 1.2% NSR
Roc d'Or East Extension Integra Gold Canada Development 2% NSR
Mt. Hamilton Waterton Global Resource USA Development 2.4% NSR
Montagne d’Or Nord Gold/Columbus Gold French Guiana Development 1% NSR
Aurizona Trek Mining Brazil Development 3%–5% NSR
Coringa An�eld Gold Brazil Development 2.5% NSR
Lucero Compañia Minera Casapalca Peru Development 1.5% NSR
Lobo-Marte Kinross Gold Chile Development 1.05% NSR
Cerro Moro Yamana Gold Argentina Development 20% Ag @ 30% of spot
Bu�elsfontein Heaven-Sent Capital Management Group South Africa Development 1% NSR
Agi Dagi Alamos Gold Turkey Development US$6M Production Bonus
Kirazli Alamos Gold Turkey Development US$2.5M Production Bonus
Hod Maden Lidya Madencilik/Mariana Resources Turkey Development 2% NSR
Karadere TÜMAD Madencilik Turkey Development 2% NSR
Hugo North Extension Turquoise Hill Resources Mongolia Development 5.62% Au @ $220/oz,
4.26% Ag @ $5/oz and 0.42% Cu @$0.5/lb
Gum Creek (Howards & Orion) Horizon Gold Australia Development A$10/oz
Wiluna (Nova 1& 2) Toro Energy Australia Development 2% NSR
Angilak Kivalliq Energy Canada Adv. Exploration 1% NSR
Ball Creek Evrim Resources Canada Adv. Exploration 2% NSR
Barry Metanor Resources Canada Adv. Exploration 3.9%–4.9% NSR
Blende Blind Creek Resources Canada Adv. Exploration 2% NSR
Cadillac Break Alexandria Minerals Canada Adv. Exploration 1% NSR
Keno Hill Alexco Resources Canada Adv. Exploration 25% NPI
Mel Benz Mining Canada Adv. Exploration 1% NSR
Ruddock Creek Imperial Metals Canada Adv. Exploration 1% NSR
Spectrum Skeena Resources Canada Adv. Exploration 1.65% NSR
West Arena (Gladiator) BonTerra Resources Canada Adv. Exploration 1% NSR
26
27
28
29
30
31
32
33
34
35
36
37
38
39
40
41
42
43
44
45
46
47
48
49
50
51
52
STREAMS AND ROYALTIES: Complete List
PROJECT OPERATOR COUNTRY STATUS TERMS
53
54
55
56
57
58
59
60
61
62
63
64
65
66
67
68
69
70
71
72
73
74
75
76
77
78
79
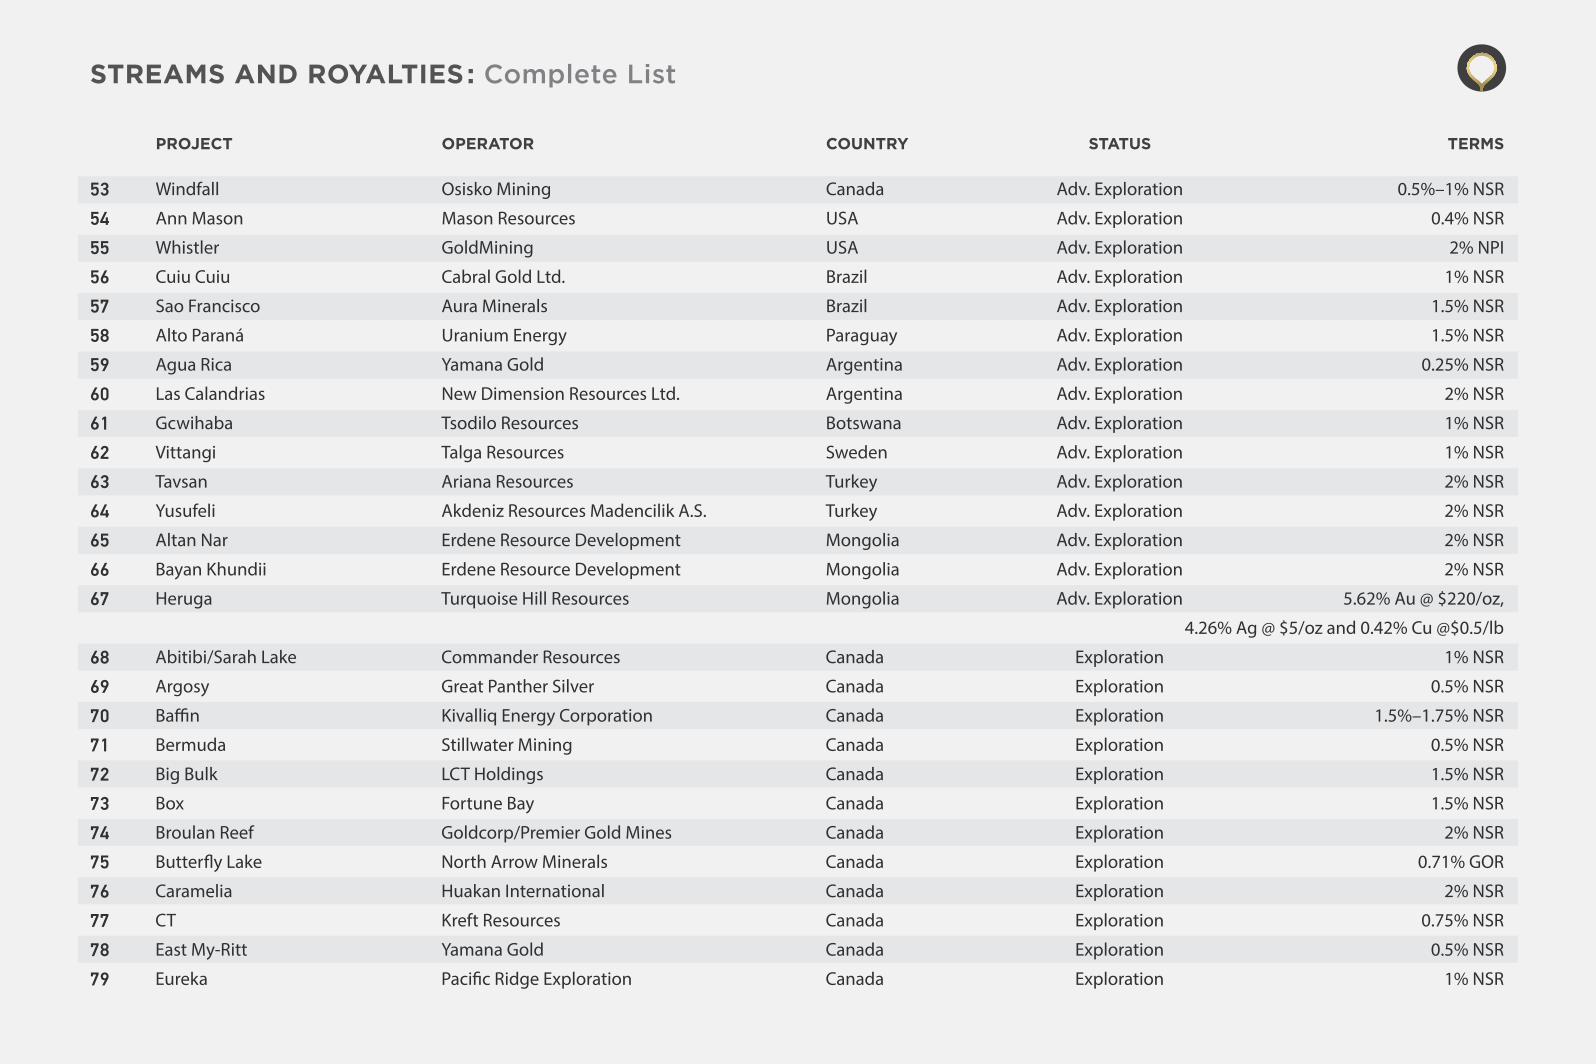
Windfall Osisko Mining Canada Adv. Exploration 0.5%–1% NSR
Ann Mason Mason Resources USA Adv. Exploration 0.4% NSR
Whistler GoldMining USA Adv. Exploration 2% NPI
Cuiu Cuiu Cabral Gold Ltd. Brazil Adv. Exploration 1% NSR
Sao Francisco Aura Minerals Brazil Adv. Exploration 1.5% NSR
Alto Paraná Uranium Energy Paraguay Adv. Exploration 1.5% NSR
Agua Rica Yamana Gold Argentina Adv. Exploration 0.25% NSR
Las Calandrias New Dimension Resources Ltd. Argentina Adv. Exploration 2% NSR
Gcwihaba Tsodilo Resources Botswana Adv. Exploration 1% NSR
Vittangi Talga Resources Sweden Adv. Exploration 1% NSR
Tavsan Ariana Resources Turkey Adv. Exploration 2% NSR
Yusufeli Akdeniz Resources Madencilik A.S. Turkey Adv. Exploration 2% NSR
Altan Nar Erdene Resource Development Mongolia Adv. Exploration 2% NSR
Bayan Khundii Erdene Resource Development Mongolia Adv. Exploration 2% NSR
Heruga Turquoise Hill Resources Mongolia Adv. Exploration 5.62% Au @ $220/oz,
4.26% Ag @ $5/oz and 0.42% Cu @$0.5/lb
Abitibi/Sarah Lake Commander Resources Canada Exploration 1% NSR
Argosy Great Panther Silver Canada Exploration 0.5% NSR
Ba�n Kivalliq Energy Corporation Canada Exploration 1.5%–1.75% NSR
Bermuda Stillwater Mining Canada Exploration 0.5% NSR
Big Bulk LCT Holdings Canada Exploration 1.5% NSR
Box Fortune Bay Canada Exploration 1.5% NSR
Broulan Reef Goldcorp/Premier Gold Mines Canada Exploration 2% NSR
Butter�y Lake North Arrow Minerals Canada Exploration 0.71% GOR
Caramelia Huakan International Canada Exploration 2% NSR
CT Kreft Resources Canada Exploration 0.75% NSR
East My-Ritt Yamana Gold Canada Exploration 0.5% NSR
Eureka Paci�c Ridge Exploration Canada Exploration 1% NSR
STREAMS AND ROYALTIES: Complete List
PROJECT OPERATOR COUNTRY STATUS TERMS
80
81
82
83
84
85
86
87
88
89
90
91
92
93
94
95
96
97
98
99
100
101
102
103
104
105
106
107
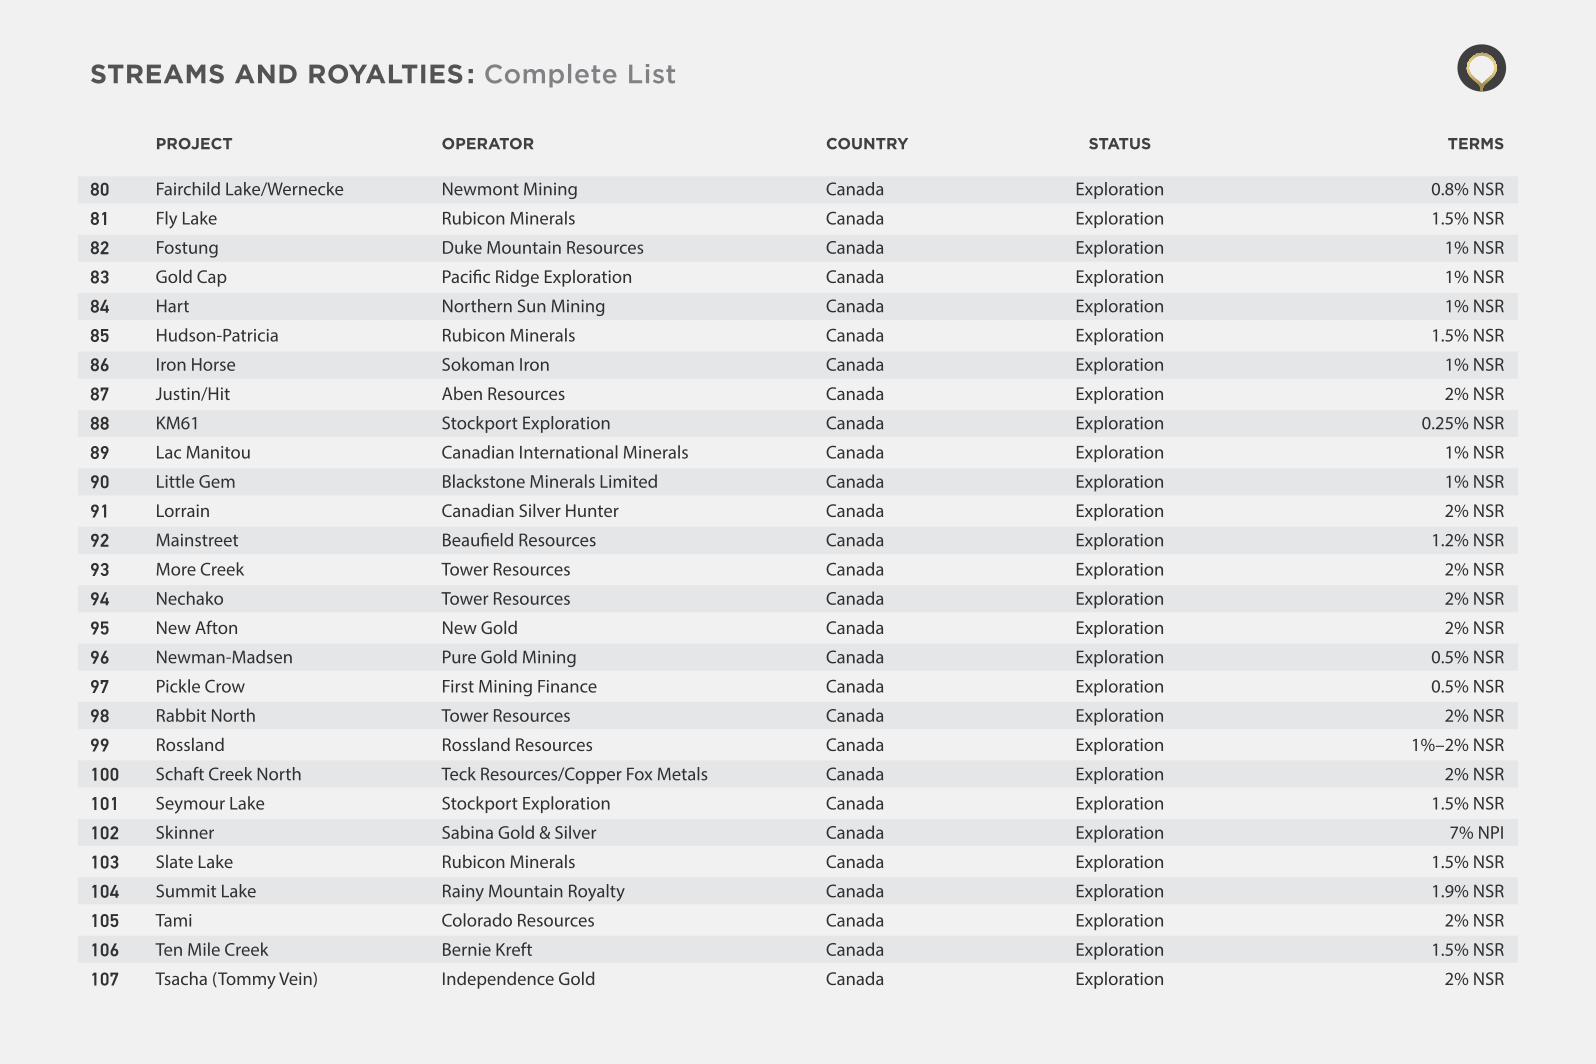
Fairchild Lake/Wernecke Newmont Mining Canada Exploration 0.8% NSR
Fly Lake Rubicon Minerals Canada Exploration 1.5% NSR
Fostung Duke Mountain Resources Canada Exploration 1% NSR
Gold Cap Paci�c Ridge Exploration Canada Exploration 1% NSR
Hart Northern Sun Mining Canada Exploration 1% NSR
Hudson-Patricia Rubicon Minerals Canada Exploration 1.5% NSR
Iron Horse Sokoman Iron Canada Exploration 1% NSR
Justin/Hit Aben Resources Canada Exploration 2% NSR
KM61 Stockport Exploration Canada Exploration 0.25% NSR
Lac Manitou Canadian International Minerals Canada Exploration 1% NSR
Little Gem Blackstone Minerals Limited Canada Exploration 1% NSR
Lorrain Canadian Silver Hunter Canada Exploration 2% NSR
Mainstreet Beau�eld Resources Canada Exploration 1.2% NSR
More Creek Tower Resources Canada Exploration 2% NSR
Nechako Tower Resources Canada Exploration 2% NSR
New Afton New Gold Canada Exploration 2% NSR
Newman-Madsen Pure Gold Mining Canada Exploration 0.5% NSR
Pickle Crow First Mining Finance Canada Exploration 0.5% NSR
Rabbit North Tower Resources Canada Exploration 2% NSR
Rossland Rossland Resources Canada Exploration 1%–2% NSR
Schaft Creek North Teck Resources/Copper Fox Metals Canada Exploration 2% NSR
Seymour Lake Stockport Exploration Canada Exploration 1.5% NSR
Skinner Sabina Gold & Silver Canada Exploration 7% NPI
Slate Lake Rubicon Minerals Canada Exploration 1.5% NSR
Summit Lake Rainy Mountain Royalty Canada Exploration 1.9% NSR
Tami Colorado Resources Canada Exploration 2% NSR
Ten Mile Creek Bernie Kreft Canada Exploration 1.5% NSR
Tsacha (Tommy Vein) Independence Gold Canada Exploration 2% NSR
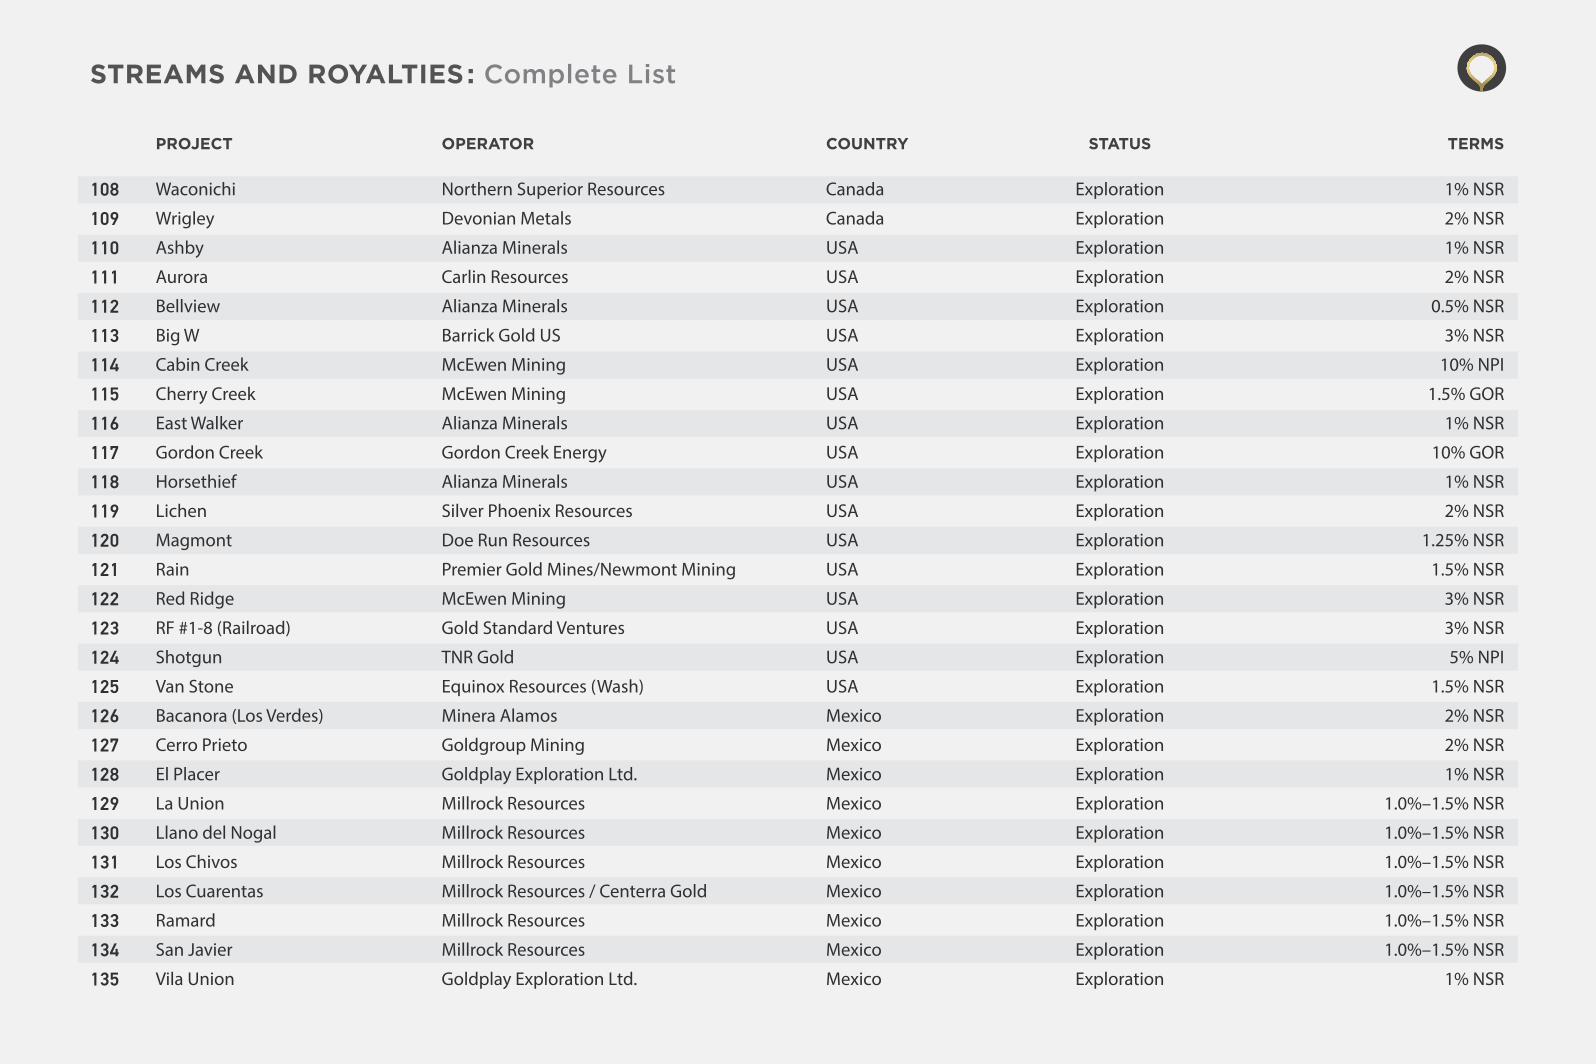
PROJECT OPERATOR COUNTRY STATUS TERMS
STREAMS AND ROYALTIES: Complete List
108
109
110
111
112
113
114
115
116
117
118
119
120
121
122
123
124
125
126
127
128
129
130
131
132
133
134
135
Waconichi Northern Superior Resources Canada Exploration 1% NSR
Wrigley Devonian Metals Canada Exploration 2% NSR
Ashby Alianza Minerals USA Exploration 1% NSR
Aurora Carlin Resources USA Exploration 2% NSR
Bellview Alianza Minerals USA Exploration 0.5% NSR
Big W Barrick Gold US USA Exploration 3% NSR
Cabin Creek McEwen Mining USA Exploration 10% NPI
Cherry Creek McEwen Mining USA Exploration 1.5% GOR
East Walker Alianza Minerals USA Exploration 1% NSR
Gordon Creek Gordon Creek Energy USA Exploration 10% GOR
Horsethief Alianza Minerals USA Exploration 1% NSR
Lichen Silver Phoenix Resources USA Exploration 2% NSR
Magmont Doe Run Resources USA Exploration 1.25% NSR
Rain Premier Gold Mines/Newmont Mining USA Exploration 1.5% NSR
Red Ridge McEwen Mining USA Exploration 3% NSR
RF #1-8 (Railroad) Gold Standard Ventures USA Exploration 3% NSR
Shotgun TNR Gold USA Exploration 5% NPI
Van Stone Equinox Resources (Wash) USA Exploration 1.5% NSR
Bacanora (Los Verdes) Minera Alamos Mexico Exploration 2% NSR
Cerro Prieto Goldgroup Mining Mexico Exploration 2% NSR
El Placer Goldplay Exploration Ltd. Mexico Exploration 1% NSR
La Union Millrock Resources Mexico Exploration 1.0%–1.5% NSR
Llano del Nogal Millrock Resources Mexico Exploration 1.0%–1.5% NSR
Los Chivos Millrock Resources Mexico Exploration 1.0%–1.5% NSR
Los Cuarentas Millrock Resources / Centerra Gold Mexico Exploration 1.0%–1.5% NSR
Ramard Millrock Resources Mexico Exploration 1.0%–1.5% NSR
San Javier Millrock Resources Mexico Exploration 1.0%–1.5% NSR
Vila Union Goldplay Exploration Ltd. Mexico Exploration 1% NSR
STREAMS AND ROYALTIES: Complete List
PROJECT OPERATOR COUNTRY STATUS TERMS
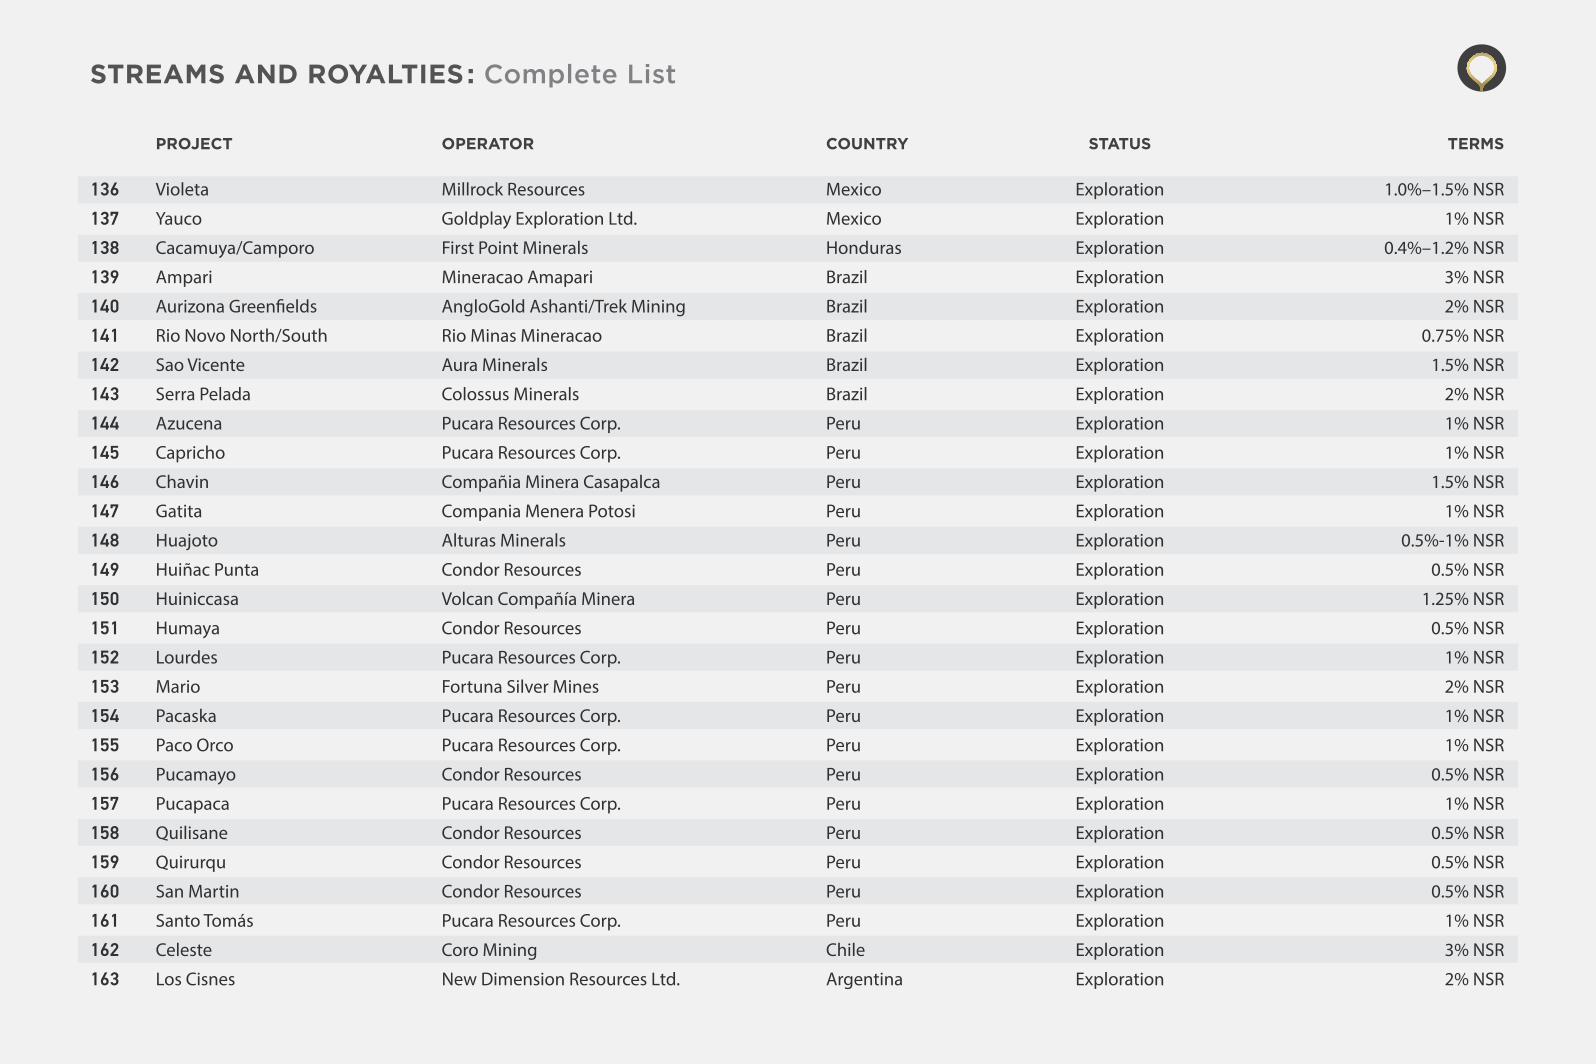
Violeta Millrock Resources Mexico Exploration 1.0%–1.5% NSR
Yauco Goldplay Exploration Ltd. Mexico Exploration 1% NSR
Cacamuya/Camporo First Point Minerals Honduras Exploration 0.4%–1.2% NSR
Ampari Mineracao Amapari Brazil Exploration 3% NSR
Aurizona Green�elds AngloGold Ashanti/Trek Mining Brazil Exploration 2% NSR
Rio Novo North/South Rio Minas Mineracao Brazil Exploration 0.75% NSR
Sao Vicente Aura Minerals Brazil Exploration 1.5% NSR
Serra Pelada Colossus Minerals Brazil Exploration 2% NSR
Azucena Pucara Resources Corp. Peru Exploration 1% NSR
Capricho Pucara Resources Corp. Peru Exploration 1% NSR
Chavin Compañia Minera Casapalca Peru Exploration 1.5% NSR
Gatita Compania Menera Potosi Peru Exploration 1% NSR
Huajoto Alturas Minerals Peru Exploration 0.5%-1% NSR
Huiñac Punta Condor Resources Peru Exploration 0.5% NSR
Huiniccasa Volcan Compañía Minera Peru Exploration 1.25% NSR
Humaya Condor Resources Peru Exploration 0.5% NSR
Lourdes Pucara Resources Corp. Peru Exploration 1% NSR
Mario Fortuna Silver Mines Peru Exploration 2% NSR
Pacaska Pucara Resources Corp. Peru Exploration 1% NSR
Paco Orco Pucara Resources Corp. Peru Exploration 1% NSR
Pucamayo Condor Resources Peru Exploration 0.5% NSR
Pucapaca Pucara Resources Corp. Peru Exploration 1% NSR
Quilisane Condor Resources Peru Exploration 0.5% NSR
Quirurqu Condor Resources Peru Exploration 0.5% NSR
San Martin Condor Resources Peru Exploration 0.5% NSR
Santo Tomás Pucara Resources Corp. Peru Exploration 1% NSR
Celeste Coro Mining Chile Exploration 3% NSR
Los Cisnes New Dimension Resources Ltd. Argentina Exploration 2% NSR
136
137
138
139
140
141
142
143
144
145
146
147
148
149
150
151
152
153
154
155
156
157
158
159
160
161
162
163
STREAMS AND ROYALTIES: Complete List
PROJECT OPERATOR COUNTRY STATUS TERMS
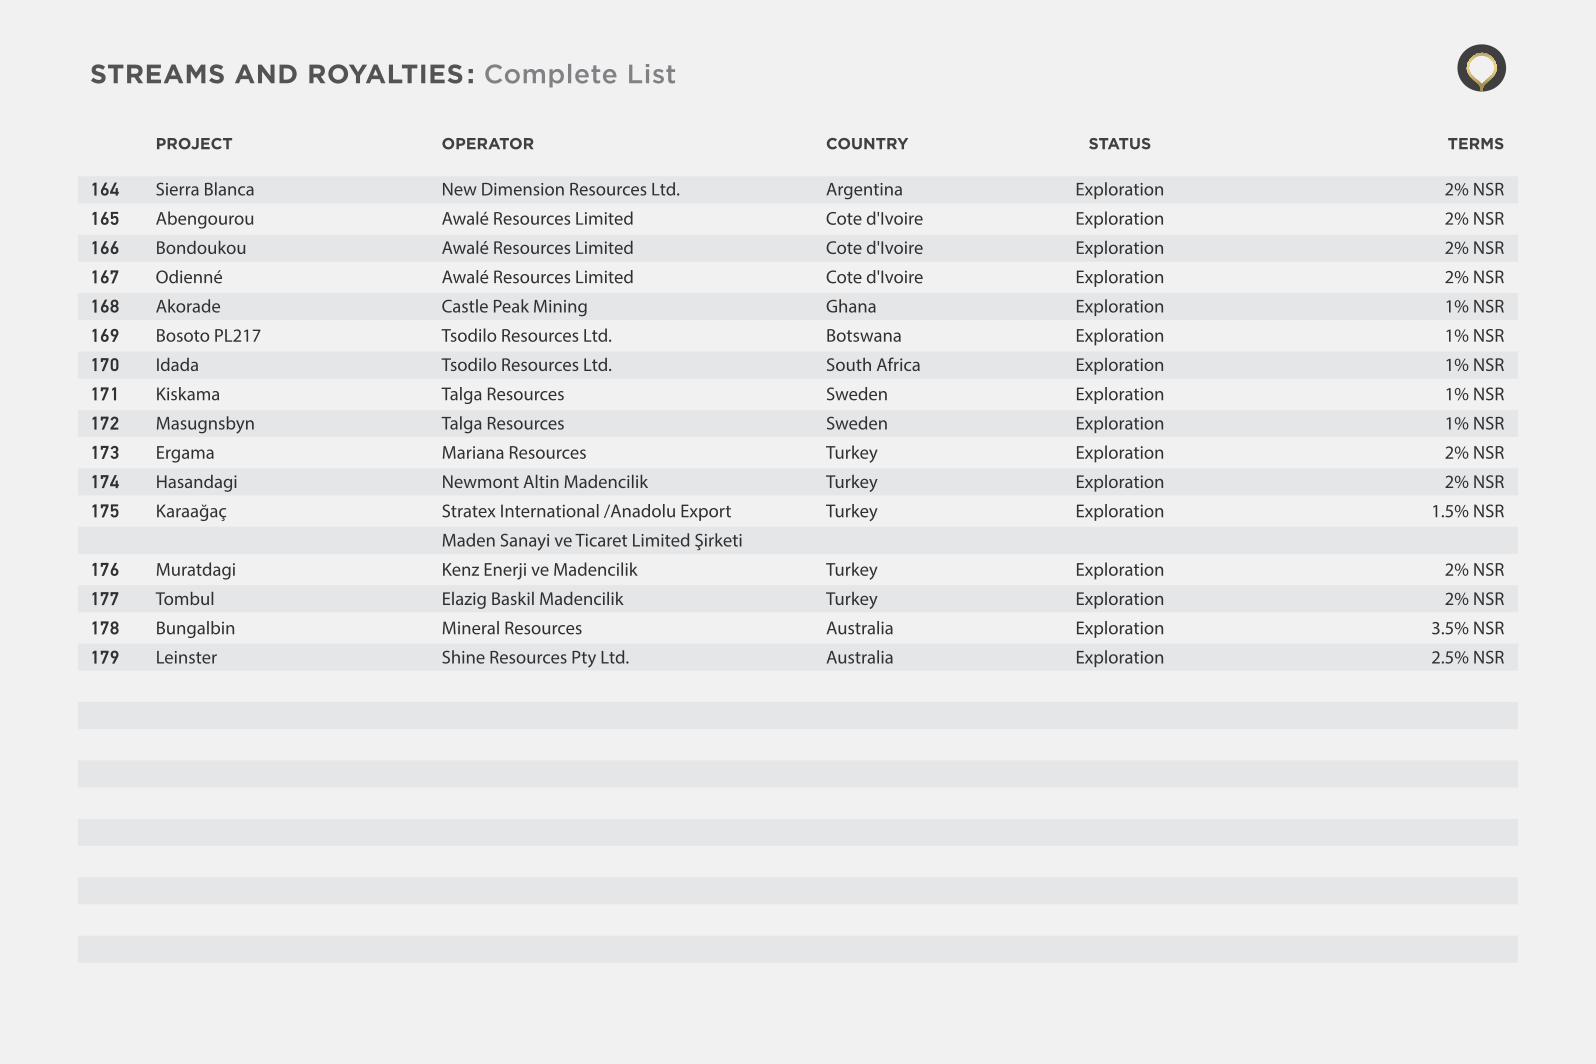
Sierra Blanca New Dimension Resources Ltd. Argentina Exploration 2% NSR
Abengourou Awalé Resources Limited Cote d'Ivoire Exploration 2% NSR
Bondoukou Awalé Resources Limited Cote d'Ivoire Exploration 2% NSR
Odienné Awalé Resources Limited Cote d'Ivoire Exploration 2% NSR
Akorade Castle Peak Mining Ghana Exploration 1% NSR
Bosoto PL217 Tsodilo Resources Ltd. Botswana Exploration 1% NSR
Idada Tsodilo Resources Ltd. South Africa Exploration 1% NSR
Kiskama Talga Resources Sweden Exploration 1% NSR
Masugnsbyn Talga Resources Sweden Exploration 1% NSR
Ergama Mariana Resources Turkey Exploration 2% NSR
Hasandagi Newmont Altin Madencilik Turkey Exploration 2% NSR
Karaağaç Stratex International /Anadolu Export Turkey Exploration 1.5% NSR
Maden Sanayi ve Ticaret Limited Şirketi
Muratdagi Kenz Enerji ve Madencilik Turkey Exploration 2% NSR
Tombul Elazig Baskil Madencilik Turkey Exploration 2% NSR
Bungalbin Mineral Resources Australia Exploration 3.5% NSR
Leinster Shine Resources Pty Ltd. Australia Exploration 2.5% NSR
164
165
166
167
168
169
170
171
172
173
174
175
176
177
178
179
STREAMS AND ROYALTIES: Complete List
PROJECT OPERATOR COUNTRY STATUS TERMS